
Submitted:
27 October 2025
Posted:
29 October 2025
You are already at the latest version
Abstract
The effects of shortened light/dark cycles (8/4 h and 4/2 h) on the growth, productivity, and nutritional value of baby leaf vegetables (borage, fenugreek, pea, and sunflower) and microgreens (arugula, broccoli, mizuna, and radish) were evaluated under controlled environment. Control plants were cultivated under 16/8 h photoperiod. The intermittent lighting influenced the quantitative and qualitative parameters of plant growth and yield (fresh weight, robustness index, dty matter content, nutritional value) , yet plant responses were species specific. It is suggested that plant response to shortened light-dark cycles depends on their tolerance/sensitivity to circadian asynchrony, which occurs when external L/D cycles do not coincide with the endogenous circadian rhythms. In areas with time-of-use electricity rates, scheduling lighting during off-peak hours can significantly reduce production costs. It was shown that shortened light-dark cycles can serve as the basis for cost-effective lighting regimes based on electricity tariffs with peak, standatd and off-peak time bands. Thus, intermittent irradiation regime with customized periods (7/4/9/4 h) has been shown to enhance crop yield and qualty or not affect them under equivalent energy consumption while reducing lighting energy costs by 25-45% compared to conventional 16/8 h photoperiod by maximizing the use of off-peak hours.
Keywords:
abnormal light/dark cycles
; energy cost
; intermittent lighting
; lighting strategy
; plant factory
1. Introduction
Light, along with temperature and moisture, is the most important environmental factor affecting plant growth and development, and plays a particularly significant regulatory role in the cultivation of crops in closed systems using artificial lighting. Farming under supplemental or full artificial light has become essential for efficient production in modern agriculture and is steadily growing in scale [Liu et al., 2025]. In plant factories with artificial lighting (PFALs), the largest consumer of electricity is the artificial lighting system, accounting for 57% of total energy costs, followed by heating and cooling costs at 37% [2,3,4,5]. The high electricity consumption of plant factories poses a new challenge because the increased energy demand may offset the benefits [5]. Therefore, the potential for energy savings remains to be further investigated.
An important new factor in indoor plant cultivation is the independence from the solar circadian cycle, which allows growers to use different lighting regimes [6]. In particular, the structure of these lighting regimes includes changes in photoperiod duration and light intensity, cyclic lighting regimes (increasing the number of light/dark (L/D) cycles over a 24-hour period with the same total light duration and intensity), as well as intermittent and fluctuating lighting (with intervals from 60 s to 60 min) [1,6].
Cyclic lighting regimes employ more than one L/D cycle within 24 hours, with varying durations of light and dark periods measured in hours. Key parameters of intermittent lighting are the cycle duration, the frequency of L/D cycles, and duty ratio (the proportion of light time in a cycle to the whole cycle time). In comparison, traditional natural lighting contains only one L/D cycle in a 24-hour circadian rhythm [1]. Typically, experiments studying different L/D cycles have the same amount of light over a 24-hour period, usually with the same total number of light hours distributed differently throughout the day [6].
The results of studies examining the effects of shortened L/D cycles on plant productivity and quality vary significantly across crops and depending on the parameters of the L/D cycle. A number of studies [7,8,9,10] have shown that maximum yield and quality are achieved by maintaining a single long cycle. For example, lettuce yield was highest for 1 cycle (16/8 h) compared with 2 (9/3 h) and 3 (6/2 h) cycles [8], 1 cycle 8/16 h compared with 4/8 h and 2.67/5.33 h, and 12/12 h L/D cycle compared with 6/6 h and 3/3 h [7,8]. Increasing the number of cycles and decreasing the L/D period from 2 cycles (6/6 h) to 4 cycles (3/3 h) and 3 cycles (4/4 h) decreased biomass accumulation, leaf area, and maximum photosynthetic rate in lettuce [9,10]. The chlorophyll content of lettuce leaves was higher in the 12/12 h treatment compared to 6/6 h and 3/3 h; however, no differences were noted between the 6/6 h and 4/4 h treatments and between 18/6, 9/3, 6/2 h) [8,9,10]. However, in another study, the chlorophyll content of lettuce leaves was higher under 8/4, 3/1.5, and 2/1 h cycles compared to a single 16/8 h cycle [11]. In stevia, fresh product yield decreased when grown under 5.3/2.7 h cycles, although dry product yield remained unchanged compared to the standard 18/6 h cycle [12]. Several studies have noted a negative effect of the shortened 6/6 h regime on tomato and eggplant plants [13,14] and no effect on hot pepper [13]. However, another study reported no effect of short cycles on tomato seedling growth, while cucumber yield decreased as the number of cycles increased from 18/6 h to 9/3 h and 6/2 h [15], although a decrease in chlorophyll content was noted in both species. In contrast, several studies have demonstrated that shortened L/D cycles can provide higher productivity and better quality while maintaining the same energy consumption as traditional lighting [11,16,17,18]. For example, lettuce yield increased under 4/2, 3/1.5, and 2/1 h cycles compared to a 16/8 h photoperiod [11]. Moreover, under 8/4, 6/3 and 4/2 h cycles, the sweetness and crunchiness of lettuce significantly improved. The quality of pea microgreens was improved under shortened 8/4 and 4/4 h cycles [18]. Optimal conditions for efficient growth of leaf lettuce were identified by [19]: a light/dark ratio of 2 and a cycle duration ranging from 15 to 22 h, based on equal total light exposure time.
In most studies of the effects of abnormal LD cycles the crop studied was lettuce, although there are some reports on fruit, ornamental, and model (Arabidopsis thaliana) crops [1,6]. In this work, the objects of study were important commercial crops (borage, fenugreek, sunflower, pea, arugula, broccoli, mizuna, radish) grown as baby leaf or microgreens, representing four families (Boraginaceae, Fabaceae, Asteraceae, and Brassicaceae). All of these crops are used as functional foods for healthy nutrition.
The initial aim of this study was to evaluate the effects of shortened L/D cycles (8/4 h and 4/2 h) on the growth, productivity, and nutritional value of baby leaf vegetables and microgreens. Plant growth, yield, soluble carbohydrate and protein content, and antioxidant compounds were assessed. Based on these results, a second series of experiments examined plant physiological response to cost-effective lighting mode (CELM) 9 h light/4 h dark/ 7 h light /4 h dark designed taking into account tariffs with time discrimination when the price per kWh of electricity is higher during the day (peak and standard) than during the night (off-peak) resulting in 25-45% reduction in electricity costs compared to conventional 16/8 h photoperiod.
2. Results
2.1. Plant Responses to Shortened Light/Dark Cycles 8/4 h and 4/2 h
There were no any signs of leaf photodamage in baby leaf vegetables and microgreens grown under shortened L/D cycles 8/4 and 4/2 h (Figure 1).
Baby leaf vegetables. Overall, biomass accumulation was not slowed by shortened L/D cycles. As reported in Table 1, fresh yield of borago and fenugreek grown under shortened L/D cycles did not differ from that of the control (16/8 h) plants, while LMA values in plants grown under 8/4 h and 4/2 h cycles were slightly higher compared to control plants in borago and lower in fenugreek. Pea shoots fresh weight increased (20%) in plants treated by 8/4 h cycle. There were no significant differences in the dry matter content among treatments in borago, fenugreek and pea shoots.
Shortened L/D cycles did not have a negative impact on baby leaf photosynthetic activity. The chlorophyll fluorescence parameter Fv/Fm reflects the maximum quantum efficiency of photosystem II photochemistry and has been widely used for early stress
detection in plants (Table 1). Its values were unaffected by shortened L/D cycles in all three species. Total chlorophyll (Chl) content in borago leaves increased by 19% and 40% in plants treated by 8/4 h and 4/2 h cycles, respectively. In fenugreek, Chl content increased (23%) in plants treated by 4/2 h cycle. Carotenoid content was not significantly influenced by shortened L/D cycles in borago leaves, by increased under 8/4 (22%) and 4/2 h (18%) cycles in fenugreek leaves.
The contents of anthocyanins, flavonoids, proline and ascorbic acid in baby leaves of all three crops did not differ from those in control (Table A1).
Shortened L/D cycles did not cause an oxidative stress in plants. The content of malondialdehyde (MDA) did not differ from that in control plants (Table 1). MDA being the end product of lipid peroxidation is usually used as a biomarker to measure oxidative stress in various biological samples. The level of hydrogen peroxide (H2O2), a potential stress inducer, was not elevated in plants treated by shortened L/D cycles. We also did not observe any increase in relative electrolyte leakage (REL), an indicator of physical damage to cell membranes.
The plant response, assessed by the activity of antioxidant enzymes, was species-specific. Thus, the activity of superoxide dismutase (SOD) did not change, increasing only in pea shoots (45%) treated by 8/4 h cycle (Table 1). Catalase (CAT) activity increased in fenugreek (32 and 23%) and pea (34 and 17%) under the influence of 8/4 and 4/2 h cycles, but decreased (16 and 26%) in borage. Guaiacol peroxidase (GPX) activity increased in borago (59 and 73%) and pea (38 and 44%) in response to 8/4 h and 4/2 h cycles, but remained unchanged in fenugreek.
Soluble sugar content increased in borage (23 and 11%) and fenugreek (29 and 25%) under the 8/4 h and 4/2 h cycles, while it decreased slightly (6%) in pea shoots (Table 1). Protein content increased (6 and 20%) only in borage leaves treated by the 8/4 and 4/2 h cycles.
Microgreens. The response of arugula, broccoli and mizuna microgreens to shortened L/D cycles was generally similar to that of baby leaf vegetables, and species-specificity was also observed. Fresh yield was increased by 20 and 12% compared to control in arugula microgreens treated by 8/4 h (20%) and 4/2 h (12%) cycles (Table 2). Broccoli and mizuna microgreen fresh yield did not differ from that of control. LMA values were higher in arugula plants treated by both shortened L/D cycles and in broccoli plants treated by 8/4 h cycle. The highest dry matter content was recorded in broccoli microgreens treated by 8/4 h cycle. The robustness index (RI, dry mass per unit of stem volume) was not influenced by shortened L/D cycles.
Total Chl content increased (41%) compared to control in arugula microgreens treated by both L/D cycles, while it was similar to control in broccoli microgreens (Table 2). The 4/2 h cycle decreased (13%) total Chl content in mizuna microgreens. Carotenoid content was higher in arugula microgreens grown under 8/4 h (53%) and 4/2 h (43%) cycles. In broccoli, carotenoid content did not differ from the control, while in mizuna, it was reduced (30%) under the 4/2 h cycle.
Shortened L/D cycles had no effect on anthocyanin and flavonoid content, except for a 24% increase in anthocyanin content in mizuna under the 8/4 h cycle and a 50% decrease in flavonoid content in broccoli under the 4/2 h cycle (Table A2).
An increase in MDA content was noted, respectively, in arugula (24%) treated by the 8/4 h cycle and mizuna (35%) treated by the 4/2 h cycle (Table 2). An increase in hydrogen peroxide content was observed only in mizuna microgreens as a result of exposure to 8/4 h (19%) and 4/2 h (24%) cycles. Regarding antioxidant enzyme activity, SOD activity was reduced in broccoli (49 and 78%) and mizuna (37 and 13%) under the 8/4 h and 4/2 h cycles, while CAT activity increased (35%) in arugula under the 8/4 h cycle and decreased
Proline content was increased compared to control under 4/2 h cycle in broccoli (23%) and mizuna (12%) (Table A2). In all crops in all shortened LDC treatments, except for mizuna under the conditions of a 4/2 h cycle, an increase (14-27%) in the content of soluble sugars was noted (Table 2). Protein content was increased (11%) only by the 8/4 h cycle in mizuna microgreens. In arugula under both shortened L/D cycles and in mizuna under the 4/2 h cycle, the protein content decreased by 12-17%.
2.2. Plant Responses to the Cost-Effective Lighting Mode (CELM)
The plant response to the cost-effective lighting mode (CELM) was tested on economically important crops (baby leaf vegetables and microgreens) from four various families: borage (Boraginaceae), fenugreek (Fabaceae), sunflower (Asteraceae), and radish (Brassicaceae). Green and purple radish varieties were also used.
Table 3 shows that fresh yield and dry matter content of borago, fenugreek and sunflower and green radish microgreens grown under CELM did not differ from control values, while fresh yield of radish Sango was higher (26%) than that in the control. LMA values in radish Sango were higher (22%) compared to the control. Dry matter content was not affected by CELM.
Plants grown under CELM showed no signs of photodamage (Fig. 1b, c). The Fv/Fm values, the content of Chl and carotenoids corresponded to those of the control plants, with the exception of a decrease (23%) in the total Chl content in green radish (Table 3).
CELM had no effect on anthocyanin and flavonoid content in borago, fenugreek, sunflower and green radish, but increased their content respectively by 39 and 21% in radish Sango (Table 3).
No obvious signs of oxidative stress were observed in plants grown under CELM. Thus, the values of REL and hydrogen peroxide content in plants treared by CELM did not differ from those in the control plants. However, in borago and green radish the content of MDA was increased by CELM (Table 3). Similar to the results described above for shortened LDCs, species specificity was observed in the change in antioxidant enzyme activity under CELM conditions. Thus, SOD activity was increased (78%) by CELM only in sunflower. CAT activity was increased in fenugreek (19%), green (67%) and purple (62%) radish, but decreased (10%) in borago. GPX activity was considerably increased (28-125%) in all plants treated by CELM except fenugreek.
In terms of nutritional value, such as soluble sugars and protein content, most plants treated by CELM were similar to the control plants and radish treated by CELM had even higher soluble sugars and protein content. The content of non-pigment antioxidant compounds in the CELM-treated plants was, in some cases, higher than in the control plants. For example, borage showed a 14% increase in proline and radish Sango had 15% higher content of ascorbic acid.
To compare the the electricity cost in two light treatments (16/8 h and CELM) we take into consideration that the electricity consumption in the treatments was equal. It means that electricity cost depends on the rates per kWh and time of use. The ratios of prices were the following: peak/off-peak − 3,5, standard/off-peak – 1.6.
Thus, the daily cost of electricity consumed (E) in case of CELM used is
E1= 7⋅1.6R + 2⋅1.6R + 7R = 21.4R, where R – off-peak rate.
The daily cost of electricisy used in case of 16/8 h photoperiod differ depending on what time is used for light period. If to switch light on at 7 am, the daily cost would be E2=3⋅3.5R + 7⋅1.6R + 4⋅3.5R + 2⋅1.6R= 38.9R
In case the light is switched on at 10 am, the daily cost would be
E3 = 7⋅1.6R + 4⋅3.5R + 2⋅1.6R + 3R = 31.4R
If to use the most cheapest time with the aim of minimizing the cost of electrivity consumed under 16/8 h photoperiod, the light should be on from 3 pm to 7 am to avoid using peak houres. In thiis case the daily cost would be E4 = 2⋅1.6R + 4⋅3.5R + 2⋅1.6R + 8R = 28.4R
Thus, using the CELM based on a time-of-use tariff instead of the traditional 16/8 h photoperiod allows to reduce electricity costs by 25-45% depending on what time slot is used for plant illumination (E1 exceeds E2 by 45%, E3 by 32% and E4 by 25%).
3. Discussion
Results of the experiments conducted on eight crops − borage, fenugreek, sunflower, pea, arugula, broccoli, mizuna, green and purple radish − show that these plants are able to tolerate abnormal shortened L/D cycles during their production cycle when they are grown as baby leaf vegetables or microgreens. The study has demonstrated that a specific intermittent lighting strategy can be applied for these crops in order to achieve higher output and better quality while maintaining the same energy consumption as traditional lighting. In our study pea shoots, arugula and purple radish microgreens grown under shortened L/D cycles showed higher biomass than under continuous 16 h lighting despite equal energy consumtion. Thus, shortened L/D cycles improved efficiency use efficiency in these crops. Other crops treated by shortened L/D cycles had the same fresh yield as control plants. Plants have a circadian clock that synchronizes physiological processes with natural fluctuations in daily light and influences gene expression, stomatal opening, andother physiological processes [20]. It was suggested that intermittent treatments closest to the natural cycle will provide the best growth [10]. Therefore, it was expected that intermittent light exposure may disrupt the transmission of circadian clock signals and therefore have negative effects on plant growth, but at the same time we know that the biological clock of plants can drive intrinsic rhythmic changes, coordinating their physiological processes to synchronize with the external L/D rhythm, thereby achieving adaptation to the dynamic changes in daily environmental factors [21,22]. Contrasting hypothesis [23] states that under the right balance of light and dark periods, dark-induced metabolic changes may improve growth. Previous reports have suggested that the highest yields and quality are generally achieved by maintaining a single long cycle compared to the more standard single L/D cycle [6]. This work has demonstated that intermittent lighting did not reduce biomass accumulation or induce oxidative stress to such an extent that it led to negative consequences for yield. This result is consistent with those obtained in a number of studies demonstrating that shortened L/D cycles can provide higher productivity and better quality of lettuce and basil while maintaining the same level of energy consumption as traditional lighting [1,2,11,16,17].
It is important that in almost all crops intermittent treatments using two cycles 8/4 h, three cycles of 4/2 h or CELM improved yield quality in terms of nutritional value. Thus, the contents of soluble sugars, protein and antioxidants were increased, although species and even varietal specificity was observed and in many cases there was no clear trend. Since plants typically respond more quickly to changes in environmental factors including light regime at the cellular level than at the whole-organism level, abnormal L/D cycles may be more effective in increasing the content of individual metabolites compared to overall biomass yield. Thus, our study demonstrated an increase in energy efficiency, which characterizes the amount of metabolites (soluble sugars, protein, anthocyanins, flavonoids, ascorbic acid, and proline) produced per kWh of consumed electricity.
It was suggested that the beneficial impact of intermittent lighting on plant growth and quality can be partly attributed to its ability to optimize and regulate plant morphology that enhance photosynthetic activity [12]. Intermittent lighting has a significant effect on the effective absorption, transmission, and conversion processes of light energy. The mechanism of intermittent lighting effect on plant growth, quality, and photosynthetic properties has become clearer in recent years and reviewed by Liu et al. [1].
We believe that plant responses to abnormal L/D cycles that differ from 24-h cycle of day and night [23] can be interpreted in terms of plant responses to photoperiod (circadian) stress, or altered photoperiod [24]. The concept of photoperiod stress was introduced recently [25,26,27] based on the observations that sudden changes in the photoperiod, in particular, its prolongation, may cause oxidative stress in short-day-adapted plants. Under abnormal L/D cycles, plants can be illuminated during the scotophilic phase and, conversely, there can be darkness during the photophilic phase. Such anomalous light supply regimes can lead to a mismatch between endogenous (circadian) biorhythms in plants and the external L/D cycle, which can also cause various changes and disturbances in plants and initiate non-specific defense responses [14,28,29]. The strength of the photoperiod stress response depends on the light duration [30]. Longer prolongations of the light phase induce a true stress (distress), while shorter prolongations, on the contrary, may present a beneficial stress (eustress) [31]. The latter is of particular interest from a practical point of view. Thus, plants under mild oxidative stress induced by altered photoperiod accumulate more non-enzymatic antioxidants (carotenoids, anthocyanins, flavonoids, proline) and have higher activity of antioxidant enzymes, which increases the nutritional value of plants that are used as a functional food providing health benefits [32,33,34,35,36,37]. This study demonstrates the relative tolerance of the tested crops to abnormal L/D cycles, i.e., to circadian asynchrony caused by a mismatch between the plant's endogenous rhythms and external L/D cycles. It should be noted that these results are not solely due to the short production cycle (10-12 days), as in sensitive eggplant photodamage in the form of leaf lesions, similar to those seen in Arabidopsis plants suffered from photoperiod stress [38], was observed as early as the third day of exposure to CELM (7/4/9/4 h). We suggest that in relation to photoperiod stress, all plants can apparently be divided into sensitive and tolerant. It is important that such a division differs from the generally accepted classification of plants into three categories according to photoperiodic response of flowering (short-day, long-day and dayneutral plants).
In our experiments examining different L/D cycle trials there was the same amount of light delivered over 24 h with the same total hours of light spread differently throughout the day. Earlier it was suggested that by arranging intermittent lighting cycles during off-peak electricity demand periods, lower electricity prices can be utilized to reduce operating costs [2]. Indeed, the price of electricity changes during the day (24 hours). These hours are grouped into time bands: peak (with the highest price), standard (intermediate price) and off-peak (cheapest price). As a general rule, in tariffs with time discrimination (a time of use tariff) the price per kWh of electricity is higher during the day (peak and standard) than during the night (off-peak). Differences in tariffs between time bands can be as much as 4-fold. Key factors influencing the economic performance of any business are its revenues and expenses. For commercial enterprises, this means increasing crop yields and reducing energy costs. Our study showed that the use of CELM significantly reduced (25-45%) electricity costs when cultivating baby leaf vegetables and microgreens under artificial lighting. Since the price per kWh depends on many factors such as the location, the time of day, and the type of electricity plan chosen the specific value of reducing the cost of electricity must be determined for specific conditions.
Thus, our work confirmed that, in addition to the commonly considered light factor components (intensity, spectral composition, and photoperiod), there is a fourth component − the distribution of DLI throughout the day. The use of intermittent lighting instead of continuous light can influence the quantitative and qualitative parameters of plant growth and yield. Plant response to shortened light-dark cycles depends on their tolerance/sensitivity to circadian asynchrony, which inevitably occurs in this case, since external L/D cycles do not coincide with the plant internal circadian rhythms. In the case of tolerant plants and/or short production cycles, the use of shortened L/D cycles can have beneficial impact on plant growth and nutritional value of leafy vegetables. In our study, crops such as borage, fenugreek, sunflower, pea, radish, arugula, broccoli, and mizuna demonstrated relative tolerance to 8/4 h and 4/2 h cycles. However, high species specificity was noted, and, using radish as an example, cultivar specificity in plant response was also demonstrated. In areas with time-of-use electricity rates, scheduling lighting during off-peak hours can significantly reduce costs. It was shown that shortened light-dark cycles can form the basis for cost-effective lighting regimes based on electricity tariffs with peak, standatd and off-peak time bands.
4. Materials and Methods
4.1. Plant Material and Growth Conditions
Four Brassicaceae microgreens, such as arugula (Eruca vesicaria subsp. sativa), broccoli (Brassica oleracea var. italic), mizuna (Brassica rapa var. nipposinica), and radish (Raphanus sativus L. var. green and cv. Sango) and four baby leaf vegetable plants: Fabacea (fenugreek (Trigonella foenum-graecum L.), and pea (Lathyrus oleraceus Lam., cv. Madras), Boraginaceae (borago (Borago officinalis L.), and Asteraceae (sunflower (Helianthus annus L.) were grown in 16 х 11 cm trays with rockwool mats, watering with half-strength Hoagland nutrient solution (pH 6.2–6.4), under controlled conditions (air temperature of 22±1°C and relative humidity of 60±5%) and LED lamps (LED GL V300, China) with a ratio (%) red:green:blue 50.3:21.1:17.6. Photosyntheticaly active radiation (PAR) was 150 µmol/(m2s).
4.2. Light treatments
In the first series of experiments plants were exposed to the intermittent treatments using two L/D cycles of 8/4 h, or three cycles of 4/2 h. Control plants were cultivated under conventional photoperiod of 16/8 h. Daily light integral (DLI) was equal for all treatments (8,6 mol m-2 day-1), so energy consumtion did not differ.
In the second series of experiments plants were exposed to the cost-effective lighting mode (CELM) that included alternating light and darkness in the order of 7 h light/4 h dark/9 h light/4 h dark. The CELM was designed to avoid using peak hours for plant illumination, when the price of kWh is more expensive. We used a time of use (ToU) tariff in the Republic of Karelia (Russia) where prices vary depending on the time of day (peak – from 7 am to 10 am and from 5 pm to 9 pm; standard – from 10 am to 5 pm and from 9 pm to 11 pm; and off-peak – from 11 pm to 7 am). CELM includes two light periods from 10 am to 5 pm (7 standard hours) and from 9 pm to 6 am (9 off-peak hours). Night periods were from 5 pm to 9 pm (4 off-peak hours) and in the morning from 6 am to 10 am (4 off-peak hours). The control plants were grown under 16/8 h photoperiod (light from 7 am to 11 pm – 9 peak hours and 9 standard hours). For the calculation of daily cost of electricity consumption under 16/8 h cycle the other light periods were also adopted (from 10 am to 2 pm – 4 peak, 9 standard and 3 off-peak hours and and from 3 pm to 7 am – 4 peak, 4 standard and 8 off-peak hours).
4.3. Growth and Yield Measurements
Microgreens and baby leaf vegetable plants were sampled on the 6th (radish), 8th (pea), 10th (sunflower), 11th (arugula, broccoli, mizuna), and 12thday (borago, fenugreek) after sowing for the measurements.
Ten seedlings of each species were randomly selected and measured to determine fresh weight (FW), and dry weight (DW) for each light treatment. To determine FW seedlings were weighed as quickly as possible to limit the losses through evaporation and then samples were dried at 105 ◦C in an oven until a constant dry weight (DW) was observed.
The values of leaf mass per area (LMA) were calculated as a ratio of a dry mass of the lamina discs to their area. Eight discs were cut from cotyledons with a 4-mm in diameter cork borer. The dry weight of the discs was determined after their drying to a constant weight at 105 ◦C. The robustness index was defined as the ratio of shoot dry mass to stem volume.
4.4. Chlorophyll Fluorescence Measurements
The chlorophyll fluorescence parameters of the plants were measured using a Pulse Amplitude Modulation Fluorimeter (MINI-PAM, Heinz Walz, Germany). The values of the potential quantum yield of photochemical activity of PSII (Fv/Fm) were determined after the leaves were dark-adapted for 20 min with leaf clips.
4.5. Measurement of Relative Electrolyte Leakage (REL)
REL from the leaf tissues was determined to estimate the membrane permeability. Ten 4 mm in diameter leaf discs were rinsed with distilled water, blotted with filter paper, and placed into 10 mL test tubes with distilled water. After 2 h shaking at 23◦C, the electric conductivity of the solution (E1) was measured by a conductometer (Ekspert-002, Ekoniks-Ekspert, Russia) at the same temperature. Then, the test tubes were heated until boiling, cooled to room temperature, and the full electrolyte leakage (E2) was evaluated. REL was calculated as a percentage of the full leakage by the formula REL = 100 × E1/E2%.
4.6. Photosynthetic Pigment Content
The content of Chl a and в and carotenoids was measured in 96% ethanol extract with a SF2000 spectrophotometer (OKB Spectr, Russia) and calculated according to the known formulas [39].
4.7. Anthocyanins and Flavonoids Content
Anthocyanins were extracted from leaves, according to Kang et al. (2013). Fresh leaf tissues (0.1 g) were homogenized in 4 mL of 95% ethanol-1.5 N HCl- (85:15, v:v). After overnight extraction at 4°C in darkness, each sample was centrifuged at 10,000× g for5 min. The absorbance of the supernatant was measured at 533 nm (peak of absorption of anthocyanin) and 657 nm (peak of absorption of Chl degradation products). The results were plotted as a difference in absorption at 530 and 657 nm relative to tissue fresh weight (∆A·g−1 FW), and the formula ∆A = A530 − 1/4A657 was used to deduct the absorbance contributed by chlorophyll and its degradation products in the extract [40]. The relative amounts of flavonoids were measured spectrophotometrically [41,42,43]. The supernatant for anthocyanins was diluted 10 times and the absorbance was measured at 300 nm. Flavonoids content in the sample was expressed as absorbance at 530 nm g FW.
4.8. Malodialdehyde (MDA) Content
The content of malondialdehyde (MDA), the end product of lipid peroxidation, was determined with a standard method based on the reaction of these substances with thiobarbituric acid (TBA) that produces a trimethine complex with an absorption maximum at 532 nm [44]. The lipid peroxidation levels were expressed as micromoles of MDA per gram FW.
4.9. Hydrogen Peroxidase Content.
Hydrogen peroxide content was determined according to [45]. Leaf tissues (0.1 g) were homogenized in an ice bath with 2 mL 0.1% (w/v) TCA. The homogenate was centrifuged at 12,000× g for 15 min at 4 ◦C and 0.5 mL of supernatant was added to 0.5 mL potassium phosphate buffer (pH 7.0) and 1 mL 1M KI. The absorbance of the supernatant was measured at 390 nm. The content of H2O2 was calculated with a standard calibration curve and expressed in micromoles per gram FW.
4.10. Proline Content
Free proline content in the leaf tissues was estimated according to [46]. Leaf sample were homogenized with 3% sulfosalicylic acid and the homogenate was centrifuged at 5100× g for 5 min. Then, 2 mL of the supernatant was mixed with acetic acid and 2 mL freshly prepared ninhydrin reagent, boiled for1 h and the absorbance was measured at 520 nm. The concentration of proline was estimated by referring to a standard curve of L-proline and expressed in micromoles per gram FW.
4.11. Antioxidative Enzyme Activity Assays
The activity of antioxidant enzymes catalase (CAT, EC 1.11.1.6), superoxide dismutase (SOD, EC 1.15.1.1), and guaiacol peroxidase (GPХ, EC 1.11.1.7) were determined using spectrophotometer SF-2000 (OKB Spectr, Russia). CAT activity was determined by the enzymatic degradation of H2O2 at 240 nm [47]; SOD activity was determined by the ability to inhibit the photochemical reaction of nitro blue tetrazolium [48]; GPX analysis was based on the oxidation of guaiacol in the presence of H2O2 with optical density measured at 470 nm [49]. The SOD, APX, and GPX activity values are expressed as unit U mg−1 protein. The concentration of protein was determined according to [50], using bovine serum albumin (BSA) (Dia-M, Russia) as a standard.
4.12. Soluble Sugar Content
The soluble sugar content was determined by anthrone method [43]. Approximately 0.3 g fresh tissue was homogenized with 5 ml dionized H2O, conducted for 4 h at room temperature with mixing and centrifuged at 14,000 g for 15 min. Then the extracts (0.6 ml) were incubated with the anthrone reagent (2.4 ml) in a boiling water bath for 10 min and after cooling to room temperature the absorbance was measured at 620 nm. The content of soluble sugars was calculated by comparison with a standard calibration curve and expressed in mg per g DW.
4.13. Ascorbic Acid Content
The ascorbic acid was determined according to [51]. Briefly, 0.1 g of leaf tissues were homogenized in 2 mL of 10% TCA, centrifuged at 6000x g for 5 min and 0,1 mL of supernatant was added to 2 mL10% TCA and 0,3 mL Folin-Ciocalteu’s reagent. The absorbance of supernatant was measured at 760 nm after incubation of the samples for 20 min at room temperature. The ascorbic content was estimated by referring to a standard curve of L-ascorbic acid and expressed in mg per g FW.
4.14. Estimating Lighting Electricity Cost
Electricity cost was calculated using a straightforward formula that connects the amount of electricity consumed with its price. The core electricity cost formula is: Electricity Cost = Total kWh Used × Rate per kWh. Since we used light modes with the same DLI (8.6 mmol day-1) the daily electricity consumtion was equal in all treatments. To calculate the cost we used tariffs with discrimination by time slot that apply the time when electricity is used to calculate the price per kWh in accordance with the time slot when the electricity is consumed. The day is divided into three time bands: peak hours, standard hours and off-peak hours. As an example we used the following schedule. The off-peak time band (with the cheapest price) runs from 11 pm to 7 am (8 hours). The standard time band (the intermediate price) covers 2 bands or periods throughout the day: from 10 am to 5 pm (7 hours) and in the evening from 9 pm to 11 pm (2 hours). The peak hours (the highest price) for electricity in a tariff with time discrimination are from 7 am to 10 am (3 hours) and from 6 pm to 10 pm (4 hours).
The difference between peak, standard and off-peak hours has to do with the hours of the day when there is greater or lesser consumption and the cost of producing the energy during each of those hours. For the calculations in this study, the following ratio of prices for different time tariffs was adopted: night rate – R, peak time rate - 3.5R, standard time rate - 1.6R.
4.15. Data Analysis
The table show mean values and standard errors. Significant differences between the means were revealed at p< 0.05 using one-way ANOVA analysis (the least significant difference test).
Author Contributions
Conceptualization, T.G.S., A.F.T.; methodology, T.G.S. and E.G.S.; formal analysis, investigation, T.G.S., E.G.S., A.A.R., and I.A.L.; writing—original draft preparation, T.G.S.; writing—review and editing, T.G.S., E.G.S., and A.F.T.; funding acquisition, A.F.T. and T.G.S. All authors have read and agreed to the published version of the manuscript.
Funding
Support for this study was provided by RNF 23-16-00160.
Data Availability Statement
The data presented in this study are available on request from the corresponding author.
Acknowledgments
This research was carried out using the equipment of the Core Facility of the Karelian Research Center of the Russian Academy of Science. We want to thank our colleagues E.A. Pulkacheva and A.V. Isakov for their valuable assistance.
Conflicts of Interest
The authors declare no conflicts of interest.
Abbreviations
The following abbreviations are used in this manuscript:
| CAT | Catalase |
| CELM | Cost-effective lighting mode |
| DLI | Daily light integral |
| DW | Dry weight |
| FW | Fresh weight |
| GPX | Guaiacol peroxidase |
| L/D | Light/dark |
| LMA | Leaf mass per area |
| PFAL | Plant factory with artificial lighting |
| REL | Relative electrolyte leakage |
| RI | Robustness index |
| SOD | Superoxide dismutase |
Appendix A
Appendix A.1

Table A1.
The contents of iacolanthocyanins, flavonoids, proline and ascorbic acid in baby leaf vegetables (borago, fenugreek, and pea) grown under shortened light-dark cycles.
Table A1.
The contents of iacolanthocyanins, flavonoids, proline and ascorbic acid in baby leaf vegetables (borago, fenugreek, and pea) grown under shortened light-dark cycles.
| Parameter | Light-dark cycle, h | ||
| 16/8 | 8/4 | 4/2 | |
| Borago | |||
| Anthocyanins, (А530 – 0.25А657) g-1FW | 0.46±0.02 a | 0.46±0.03 a | 0.41±2.72 a |
| Flavonoids, А300 g-1FW | 19.76±0.02 a | 18.77±1.40 a | 20.96±2.10 a |
| Proline, µmol g-1 DW | 114.4±3.3 a | 106.3±3.3 a | 112.2±7.1 a |
| Ascorbic acid, mg g-1FW | 96.9±8.5 a | 97.8±12.4 a | 110.4±15.0 a |
| Fenugreek | |||
| Anthocyanins, (А530 – 0.25А657) g-1FW | 0.55±0.08 a | 0.48±0.02 a | 0.47±0.03 a |
| Flavonoids, А300 g-1FW | 13.23±1.82 a | 12.16±1.76 a | 10.06±8.26 a |
| Proline, µmol g-1 DW | 205.6±10.2 a | 243.5±14.6 a | 207.1±4.0 a |
| Ascorbic acid, mg g-1FW | 92.9±5.0 a | 87.2±10.7 a | 82.6±1.6 a |
| Pea | |||
| Anthocyanins, (А530 – 0.25А657) g-1FW | 0.57±0.10 a | 0.50±0.06 a | 0.55±0.10 a |
| Flavonoids, А300 g-1 | 27.04±3.91 a | 25.40±2.17 a | 21.88±1.65 a |
| Proline, µmol g-1 DW | 918±28 a | 939±48 a | 874±15 a |
Different letters for each plant species indicate significant differences between the mean values at p< 0.05.
Table A2.
The contents of anthocyanins, flavonoids, and proline in microgreens (arugula, broccoli and mizuna) grown under shortened light-dark cycles.
Table A2.
The contents of anthocyanins, flavonoids, and proline in microgreens (arugula, broccoli and mizuna) grown under shortened light-dark cycles.
| Parameter | Light-dark cycle, h | ||
| 16/8 | 8/4 | 4/2 | |
| Arugula | |||
| Anthocyanins, (А530 – 0.25А657) g-1FW | 0.42±0.06 a | 0.52±0.04 a | 0.51±0.04 a |
| Flavonoids, А300 g-1FW | 16.44±0.89 a | 19.69±0.61 a | 17.33±0.77 a |
| Proline, µmol g-1 DW | 523±17 a | 534±29 a | 553±11 a |
| Broccoli | |||
| Anthocyanins, (А530 – 0.25А657) g-1FW | 0.59±0.03 a | 0.63±0.04 a | 0.51±0.03 a |
| Flavonoids, А300 g-1FW | 6.35±0.47 a | 5.07±1.02 a | 3.14±0.12 b |
| Proline, µmol g-1 DW | 620±25 b | 604±27 b | 761±20 a |
| Mizuna | |||
| Anthocyanins, (А530 – 0.25А657) g-1FW | 0.33±0.02 b | 0.41±0.02 a | 0.32±0.05 b |
| Flavonoids, А300 g-1FW | 11.12±2.35 a | 11.10±2.02 a | 5.37±0.49 b |
| Proline, µmol g-1 DW | 597±10 b | 574±16 b | 669±50 a |
Different letters for each plant species indicate significant differences between the mean values at p< 0.05.
References
- Liu, X.; Sun, Q.; Wang, Z.; He, J.; Liu, X.; Xu, Y.; Li, Q. Innovative Application Strategies of Light-Emitting Diodes in Protected Horticulture. Agriculture 2025, 15, 1630. [Google Scholar] [CrossRef]
- Avgoustaki, D.D.; Xydis, G. Energy cost reduction by shifting electricity demand in indoor vertical farms with artificial lighting. Biosyst. Eng. 2021, 211, 219–229. [Google Scholar] [CrossRef]
- Graamans, L.; Tenpierik, M.; van den Dobbelsteen, A.; Stanghellini, C. Plant factories: Reducing energy demand at high internal heat loads through façade design. Appl. Energy 2020, 262, 114544. [Google Scholar] [CrossRef]
- Engler, N.; Krarti, M. Review of Energy Efficiency in Controlled Environment Agriculture. Renewable and Sustainable Energy Reviews 2021, 141, 110786. [Google Scholar] [CrossRef]
- Weidner, T.; Yang, A.; Hamm, M.W. Ebergy Optimisation of Plant Factories and Greenhouses for Different Climate Conditions. Energy Conservation and Management 2021, 243, 114336. [Google Scholar] [CrossRef]
- Warner, R.; Wu, B.; Macpherson, S.; Lefsrud, M. How the distribution of photon delivery impacts crops in indoor plant environments: A review. Sustainability 2023, 15, 4645. [Google Scholar] [CrossRef]
- Ishii, M.; Ito, T.; Maruo, T.; Suzuki, K.; Matsuo, K. Plant growth and physiological characters of lettuce plants grown under artificial light of different irradiating cycles. Environ. Control Biol. 1995, 33, 143–149. [Google Scholar] [CrossRef]
- Kang, J.H.; Sugumaran, K.; Atulba, S.L.S.; Jeong, B.R.; Hwang, S.J. Light intensity and photoperiod influence the growth and development of hydroponically grown leaf lettuce in a closed-type plant factory system. Hort. Environ. Biotechnol. 2013, 54, 501–509. [Google Scholar] [CrossRef]
- Hang, T.; Lu, N.; Takagaki, M.; Mao, H. Leaf area model based on thermal effectiveness and photosynthetically active radiation in lettuce grown in mini-plant factories under different light cycles. Sci. Hortic. 2019, 252, 113–120. [Google Scholar] [CrossRef]
- Zhou, J.; Wang, J.Z.; Hang, T.; Li, P.P. Photosynthetic characteristics and growth performance of lettuce (Lactuca sativa L.) under different light/dark cycles in mini plant factories. Photosynthetica 2020, 58, 740–747. [Google Scholar] [CrossRef]
- Chen, X.; Yang, Q. Effects of intermittent light exposure with red and blue light emitting diodes on growth and carbohydrate accumulation of lettuce. Sci. Hortic. 2018, 234, 220–226. [Google Scholar] [CrossRef]
- Rengasamy, N.; Othman, R.Y.; Che, H.S.; Harikrishna, J.A. Artificial lighting photoperiod manipulation approach to improve productivity and energy use efficacies of plant factory cultivated Stevia rebaudiana. Agronomy 2022, 12, 1787. [Google Scholar] [CrossRef]
- Chi, S.H. Effect of photoperiod shortening on the nutrient uptake and carbon metabolism of tomato and hot pepper seedlings grown hydroponically. J. Bio-Environ. Control. 2003, 12, 121–126. [Google Scholar]
- Shibaeva, T.G.; Mamaev, A.V.; Sherudilo, E.G.; Ikkonen, E.N.; Titov, A.F. Responses of Tomato and Eggplant to Abnormal Light/Dark Cycles and Continuous Lighting. Russ. J. Plant Physiol. 2024. 71, 12. [CrossRef]
- García-Caparrós, P.; Sabio, F.; Barbero, F.J.; Chica, R.M.; Lao, M.T. Physiological responses of tomato and cucumber seedlings under different light–dark cycles. Agronomy 2020, 10, 945. [Google Scholar] [CrossRef]
- Kurata, H.; Mochizuki, A.; Okuda, N.; Seki, M.; Furusaki, S. Intermittent light irradiation with second-or hour-scale periods controls anthocyanin production by strawberry cells. Enzyme. Microb. Technol. 2000, 26, 621–629. [Google Scholar] [CrossRef]
- Sivakumar, G.; Heo, J.W.; Kozai, T.; Paek, K.Y. Effect of continuous or intermittent radiation on sweet potato plantlets in vitro. J. Hortic. Sci. Biotechnol. 2006, 81, 546–548. [Google Scholar] [CrossRef]
- Shibaeva, T.; Rubaeva, А.; Sherudilo, E.; Ikkonen, E.; Titov, A. The effect of shortened light/dark cycles on growth, yield and nutritional value of pea shoots. Lecture Notes in Networks and Systems 2024, 1130. [Google Scholar]
- Urairi, C.; Shimizu, H.; Nakashima, H.; Miyasaka, J.; Ohdoi, K. Optimization of Light-Dark Cycles of Lactuca sativa L. in Plant Factory. Environ. Control Biol. 2017, 55, 85–91. [Google Scholar] [CrossRef]
- Dodd, A.N.; Salathia, N.; Hall, A.; Kevei, E.; Toth, R.; Nagy, F.; Hibberd, J.M.; Millar, A.J.; Webb, A.A. Plant circadian clocks increase photosynthesis, growth, survival, and competitive advantage. Science 2005, 309, 630–633. [Google Scholar] [CrossRef] [PubMed]
- Fukuda, H.; Ukai, K.; Oyama, T. Self-arrangement of cellular circadian rhythms through phase-resetting in plant roots. Phys. Rev. E 2012, 86, 41917. [Google Scholar] [CrossRef] [PubMed]
- Shao, M.; Liu, W.; Zha, L.; Zhou, C.; Zhang, Y.; Li, B. Altering light-dark cycle at pre-harvest stage regulated growth, nutritional quality, and photosynthetic pigment content of hydroponic lettuce. Acta Physiol. Plant. 2021, 43, 9. [Google Scholar] [CrossRef]
- Chen, X.-L.; Li, Y.-L.; Wang, L.-C.; Yang, Q.-C.; Guo, W.-Z. Responses of butter leaf lettuce to mixed red and blue light with extended light/dark cycle period. Sci. Rep. 2022, 12, 6924. [Google Scholar] [CrossRef] [PubMed]
- Shibaeva, T.G.; Titov, A.F. Photoperiod Stress in Plants: A New Look at Plant Response to Abnormal Light-Dark Cycles. Russ. J. Plant Physiol. 2025, 72, 120. [Google Scholar] [CrossRef]
- Frank, M.; Cortleven, A.; Novak, O.; Schmulling, T. Root-derived trans-zeatin cytokinin protects Arabidopsis plants against photoperiod stress. Plant, Cell Environ. 2020, 43, 2637–2649. [Google Scholar] [CrossRef]
- Roeber, V.M.; Bajaj, I.; Rohde, M.; Schmulling, T.; Cortleven, A. Light acts as a stressor and influences abiotic and biotic stress responses in plants. Plant, Cell Environ. 2021, 44, 645–664. [Google Scholar] [CrossRef]
- Roeber, V.M.; Schmulling, T.; Cortleven, A. The Photoperiod: Handling and Causing Stress in Plants, Front. Plant Sci. 2022, 12. [Google Scholar] [CrossRef]
- Shibaeva, T.G.; Sherudilo, E.G.; Ikkonen, E.; Rubaeva, A.A.; Levkin, I.A.; Titov, A.F. Effects of Extended Light/Dark Cycles on Solanaceae Plants. Plants 2024, 13, 244. [Google Scholar] [CrossRef]
- Shibaeva, T.G.; Mamaev, A.V.; Titov, A.F. Possible Physiological Mechanisms of Leaf Photodamage in Plants Grown under Continuous Lighting. Russ. J. Plant Physiol. 2023, 70, 15. [Google Scholar] [CrossRef]
- Abuelsoud, W.; Cortleven, A.; and Schmulling, T. Photoperiod stress induces an oxidative burst-like response and is associated with increased apoplastic peroxidase and decreased catalase activities. J. Plant Physiol. 2020, 253. [Google Scholar] [CrossRef] [PubMed]
- Krasensky-Wrzaczek, J.; Kangasjarvi, J. The role of reactive oxygen species in the integration of temperature and light signals. J. Exp. Bot. 2018, 69, 3347–3358. [Google Scholar] [CrossRef]
- Samuolienė, G.; Brazaitytė, A.; Jankauskienė, J.; Viršilė, A.; Sirtautas, R.; Novičkovas, A.; Sakalauskienė, S.; Sakalauskaitė, J.; Duchovskis, P. LED irradiance level affects growth and nutritional quality of Brassica microgreens. Cent. Eur. J. Biol. 2013, 8, 1241–1249. [Google Scholar] [CrossRef]
- Bian, Z.-H.; Cheng, R.-F.; Yang, Q.-C.; Wang, J.; Lu, Ch. ; Continuous light from red, blue, and green light-emitting diodes reduces nitrate content and enhances phytochemical concentrations and antioxidant capacity in lettuce. J. Am. Soc. Hortic. Sci. 2016, 141, 186–195. [Google Scholar] [CrossRef]
- Liu, W.; Zha, L.; Zhang, Yu. Growth and nutrient element content of hydroponic lettuce are modified by LED continuous lighting of different intensities and spectral qualities. Agronomy 2020, 10. [Google Scholar] [CrossRef]
- Proietti, S.; Moscatello, S.; Riccio, F.; Downey, P.; Battistelli, A. Continuous lighting promotes plant growth, light conversion efficiency, and nutritional quality of Eruca vesicaria (L.) Cav. in controlled environment with minor effects due to light quality. Front. Plant Sci., 2021, 12. [Google Scholar] [CrossRef] [PubMed]
- Shibaeva, T.G.; Sherudilo, E.G.; Rubaeva, A.A.; Titov, A.F. Continuous LED lighting enhances yield and nutritional value of four genotypes of Brassicaceae microgreens. Plants 2022, 11, 1. [Google Scholar] [CrossRef]
- Shibaeva, T.G.; Rubaeva, A.A.; Sherudilo, E.G.; Titov, A.F. Continuous lighting increases yield and nutritional value and decreases nitrate content in Brassicaceae microgreens. Russ. J. Plant Physiol. 2023, 70. [Google Scholar] [CrossRef]
- Nitschke, S.; Cortleven, A.; Iven, T.; Feussner, I.; Havaux, M.; Riefler, M.; Schmulling, T. Circadian stress regimes affect the circadian clock and cause jasmonic acid-dependent cell death in cytokinin-deficient Arabidopsis plants. Plant Cell 2016, 28, 1616. [Google Scholar] [CrossRef] [PubMed]
- Lichtenthaler, H.K. Chlorophylls and carotenoids: Pigment of photosynthetic biomembranes. Methods Enzymol. 1987, 148, 350–382. [Google Scholar]
- Meng, X.; Xing, T.; Wang, X. The role of light in the regulation of anthocyanin accumulation in Gerbera hybrid. Plant Growth Regul. 2004, 44, 243–250. [Google Scholar] [CrossRef]
- Nogues, S.; Backer, N.R. Effect of drought on photosynthesis in Mediterranean plants under UV-B radiation. J. Exp. Bot. 2000, 51, 1309–1317. [Google Scholar]
- Baroowa, B.; Gogoi, N. Biochemical changes in two Vigna spp. during drought and subsequent recovery. Ind. J. Plant Physiol. 2013, 18, 319–325. [Google Scholar] [CrossRef]
- Kolupaev, Y.E.; Fisova, E.N.; Yastreb, T.O.; Ryabchun, N.I.; Kirichenko, V.V. Effect of hydrogen sulfide donor on antioxidant state of wheat plants and their resistance to soil drought. Russ. J. Plant Physiol. 2019, 66, 59–66. [Google Scholar] [CrossRef]
- Heath, R.L.; Packer, L. Photoperioxidation in isolated chloroplasts I. Kinetics and stoichiometry of fatty acid peroxidation. Arch. Biochem. Biophys. 1968, 125, 189–198. [Google Scholar] [CrossRef]
- Velikova, V.; Yordanov, I.; Edreva, A. Oxidative stress and some antioxidant system in acid rain-treated bean plants: protective role of exogenous polyamines. Plant Sci. 2000, 151, 59. [Google Scholar] [CrossRef]
- Bates, L.S.; Waldren, R.P.; Teare, I.D. Rapid determination of free proline for water-stress studies. Plant Soil 1973, 39, 205–207. [Google Scholar] [CrossRef]
- Aebi, H. Catalase in vitro. Merhods Enzymol. 1984, 105, 121–126. [Google Scholar]
- Giannopolitis, C.N.; Ries, S.K. Superoxide dismutases: I. Occurrence in higher plants. Plant Physiol. 1977, 59, 309–314. [Google Scholar] [CrossRef]
- Maehly, A.C.; Chance, B. The assay catalases and peroxidases. In Methods of Biochemical Analysis; Glick, D., Ed.; Interscience Pub., New York, 1954, 1, 357–424. [Google Scholar]
- Bradford, M.M. A rapid and sensitive method for the quantification of microgram quantities of protein utilizing the principle of protein-dye binding. Anal. Biochem. 1976, 72, 248–254. [Google Scholar] [CrossRef] [PubMed]
- Gunjal, M.; Singh, J.; Kaur, J.; Kaur, S.; Nanda, V.; Mehta, C.M.; Bhadariya, V.; Rasane, P. Comparative analysis of morphological, nutritional, and bioactive properties of selected microgreens in alternative growing medium. South African J. Bot. 2024, 165, 188–201. [Google Scholar] [CrossRef]
Figure 1.
(a) Broccoli, mizuna and arugula microgreens and pea shoots (top down) grown under 16/8, 8/4 and 4/2 h light-dark cycles; (b) borage, fenugreek and sunflower and (c) green radish (top) and radish Sango (bottom) microgreens, grown under 16/8 h photoperiod (left) and cost-effective lighting mode (CELM) (right).
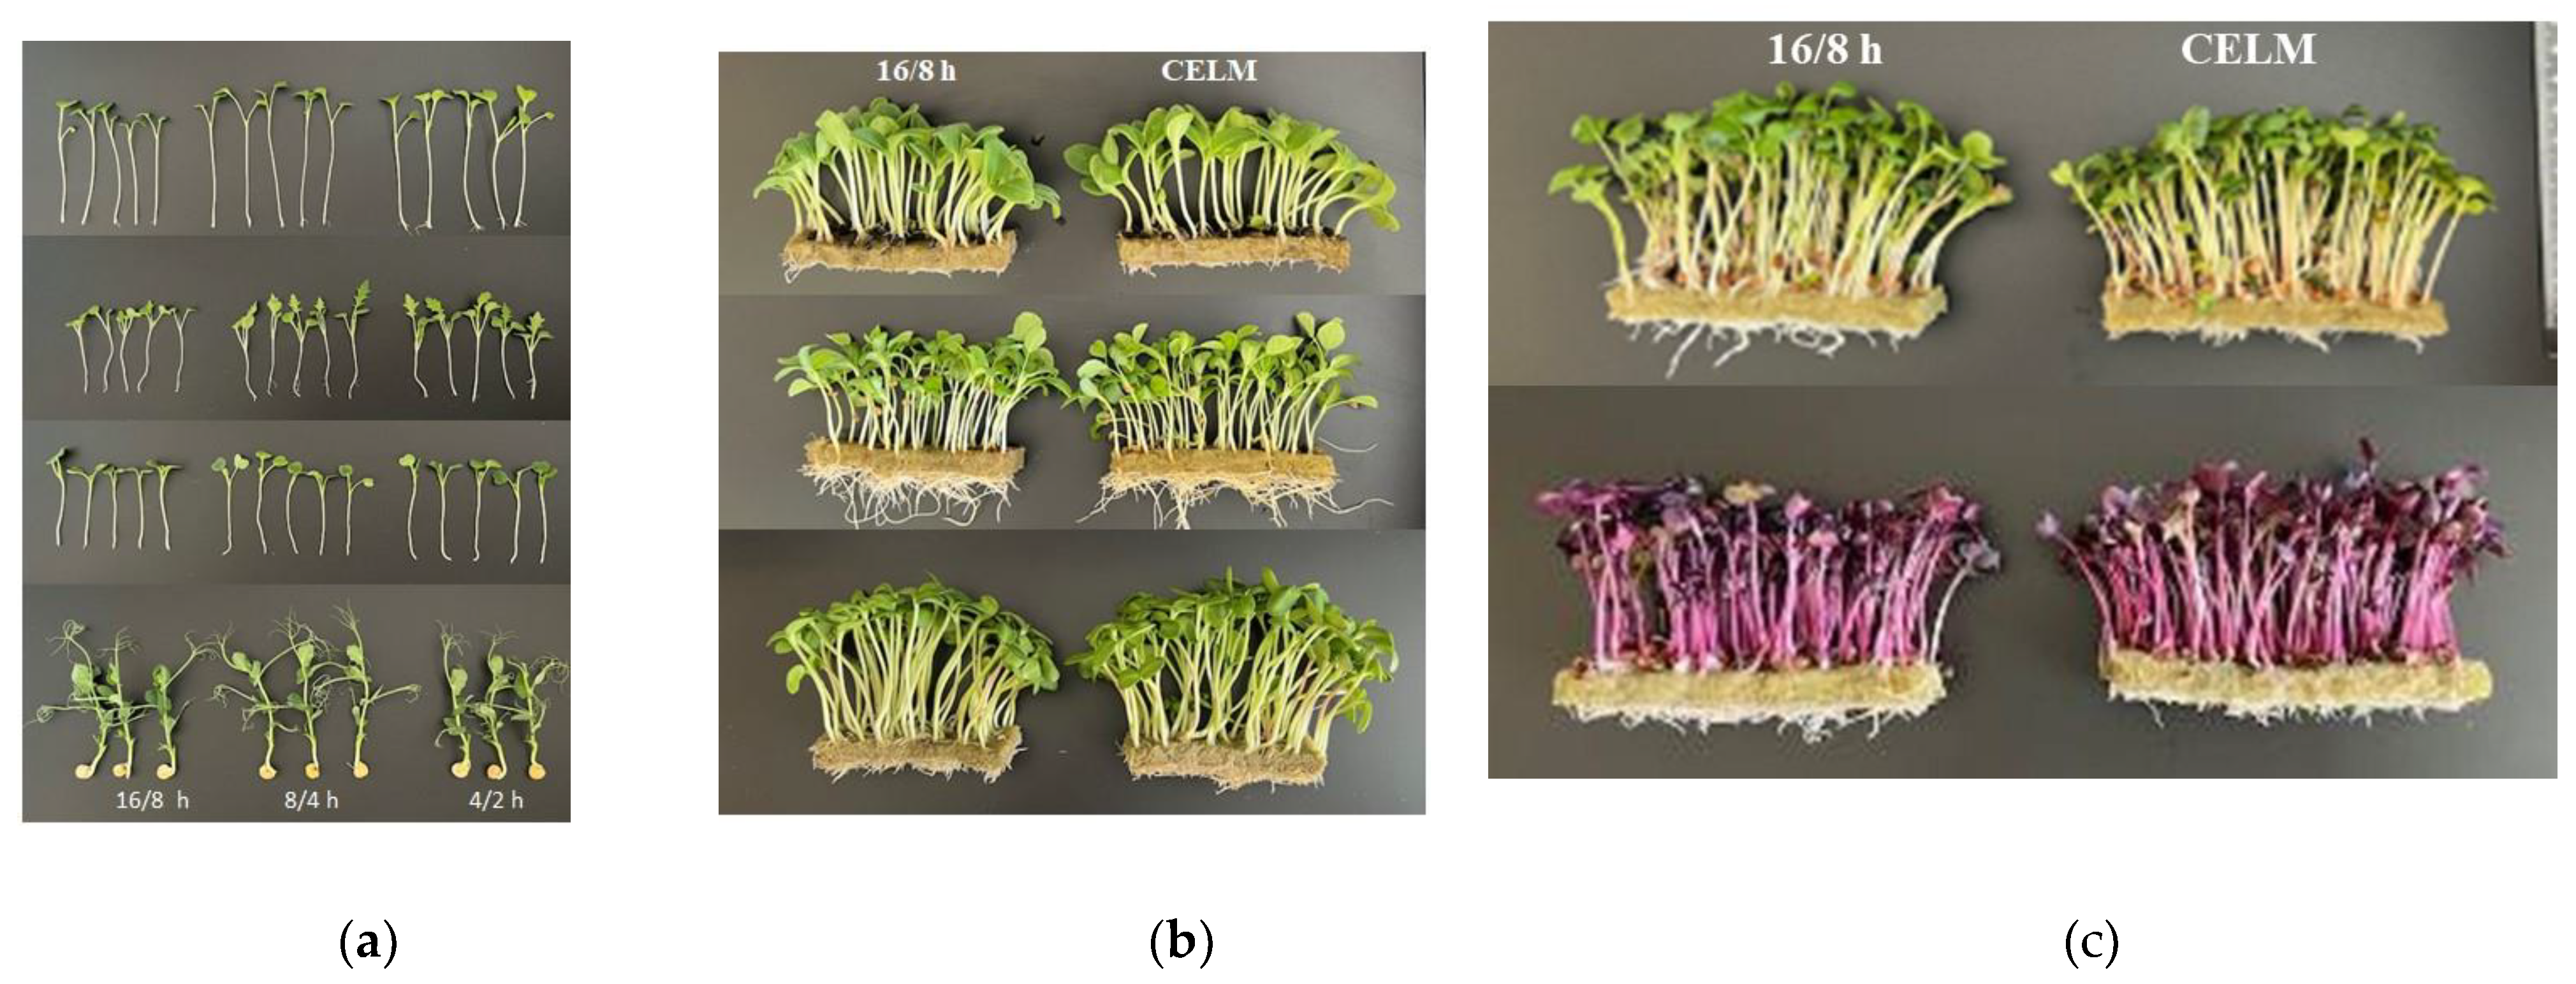
Table 1.
Physiological and biochemical parameters of baby leaf vegetable plants (borago and fenugreek) grown under shortened light-dark cycles.
Table 1.
Physiological and biochemical parameters of baby leaf vegetable plants (borago and fenugreek) grown under shortened light-dark cycles.
| Parameter | Light-dark cycle, h | ||
| 16/8 | 8/4 | 4/2 | |
| Borago | |||
| Yield, g FW dm-2 | 28.2±1.8 a | 28.8±3.2 a | 30.0±1.3 a |
| LMA, mg DW cm-2 | 2.26±0.11 b | 2.62±0.15 a | 2.43±0.04 a |
| Dry matter content, g kg-1 | 63.3±2.6 a | 67.2±2.8 a | 59.4±3.2 a |
| Fv/Fm | 0.831±0.002 a | 0.833±0.003 a | 0.830±0.003 a |
| Chl a+b, mg DW g-1 | 9.02±0.54 c | 10.76±0.70 b | 12.71±1.00 a |
| Carotenoids, mg DW g-1 | 1.26±0.09 a | 1.28±0.17 a | 1.03±0.27 a |
| REL, % | 16.05±0.23 a | 12.76±0.96 c | 14.91±0.37 b |
| MDA, µmol g-1 FW | 14.8±0.6 a | 16.2±1.0 a | 15.6±0.4 a |
| H2O2, µmol g-1 FW | 0.37±0.02 a | 0.40±0.01 a | 0.15±0.01 b |
| SOD, U mg-1 protein | 5.0±0.4 a | 4.2±0.6 a | 4.4±1.6 a |
| CAT, µmol/(mg protein min) | 31.5±1.4 a | 26.5±1.1 b | 23.4±1.9 b |
| GPX, µmol mg-1 protein min-1 | 5.1±0.6 b | 8.1±1.9 a | 8.8±1.8 a |
| Soluble sugars, mg g-1 DW | 250.4±4.9 c | 307.5±2.8 a | 276.9±8.1 b |
| Protein, mg g-1 FW | 168.4±4.1 b | 178.9±10.6 ab | 201.9±11.3 a |
| Fenugreek | |||
| Yield, g FW dm-2 | 24.6±0.8 a | 27.0±1.6 a | 24.9±2.0 a |
| LMA, mg DW cm-2 | 2.61±0.18 a | 2.49±0.10 a | 2.36±0.14 a |
| Dry matter content, g kg-1 | 92.6±0.3 a | 92.2±0.6 a | 92.8±0.2 a |
| Fv/Fm | 0.834±0.002 a | 0.829±0.010 a | 0.833±0.009 a |
| Chl a+b, mg DW g-1 | 10.62±0.94 b | 10.53±0.65 b | 13.01±1.01 a |
| Carotenoids, mg DW g-1 | 1.50±0.08 b | 1.83±0.14 a | 1.77±0.15 a |
| REL, % | 14.32±0.55 a | 14.96±0.50 a | 14.19±0.77 a |
| MDA, µmol g-1 FW | 18.6±0.7 a | 18.1±0.8 a | 17.8±0.9 a |
| H2O2, µmol g-1 FW | 0.87±0.13 a | 0.94±0.06 a | 0.78±0.07 a |
| SOD, U mg-1 protein | 6.7±0.4 a | 5.9±1.0 a | 5.4±1.3 a |
| CAT, µmol/(mg protein min) | 26.0±1.7 b | 34.2±1.8 a | 31.9±2.5 a |
| GPX, µmol mg-1 protein min-1 | 2585±102 a | 2347±143 a | 2101±131 a |
| Soluble sugars, mg g-1 DW | 288.5±36.4 b | 371.7±24.0 a | 361.9±6.6 a |
| Protein, mg g-1 FW | 213.7±10.6 a | 202.4±7.5 a | 241.1±19.2 a |
| Pea shoots | |||
| Shoot FW, g | 0.54±0.02 b | 0.65±0.02 a | 0.58±0.03 b |
| LMA, mg DW cm-2 | 1.68±0.08 a | 1.73±0.07 a | 1.56±0.06 a |
| Dry matter content, g kg-1 | 54.6±0.4 a | 60.5±0.6 a | 57.4±0.4 a |
| Fv/Fm | 0.790±0.002 a | 0.802±0.008 a | 0.799±0.008 a |
| Chl a+b, mg DW g-1 | 14.37±0.67 b | 16.40±1.23 a | 16.83±0.72 a |
| Carotenoids, mg DW g-1 | 1.82±0.10 a | 1.98±0.18 a | 1.99±0.12 a |
| MDA, µmol g-1 FW | 59.7±2.3 b | 61.6±2.6 b | 72.5±6.1 a |
| H2O2, µmol g-1 FW | 0.68±0.05 b | 0.85±0.09 a | 1.03±0.09 a |
| SOD, U mg-1 protein | 2.4±0.2 b | 3.5±0.1 a | 2.1±0.3 b |
| CAT, µmol/(mg protein min) | 21.2±1.9 b | 28.4±1.9 a | 24.8±2.7 a |
| GPX, µmol mg-1 protein min-1 | 498±68 b | 686±48 a | 718±62 a |
| Soluble sugars, mg g-1 DW | 320.9±11.4 a | 300.8±12.1 b | 300.2±14.6 b |
| Protein, mg g-1 FW | 36.0±2.1 a | 32.7±1.9 a | 34.6±1.2 a |
Different letters for each plant species indicate significant differences between the mean values at p< 0.05.
Table 2.
Physiological and biochemical parameters of microgreens (arugula, broccoli and mizuna) grown under shortened light-dark cycles.
Table 2.
Physiological and biochemical parameters of microgreens (arugula, broccoli and mizuna) grown under shortened light-dark cycles.
| Parameter | Light-dark cycle, h | ||
| 16/8 | 8/4 | 4/2 | |
| Arugula | |||
| Shoot FW, mg | 64.7±3.0 b | 77.4±3.0 a | 72.6±4.0 a |
| LMA, mg DW cm-2 | 1.83±0.07 b | 2.11±0.20 a | 2.07±0.05 a |
| Dry matter content, g kg-1 | 61.0±2.3 a | 57.0±2.6 a | 55.3±3.0 a |
| Robustness index | 10.2±0.5 a | 11.3±0.8 a | 10.5±0.6 a |
| Chl a+b, mg DW g-1 | 11.64±0.70 b | 16.43±0.29 a | 16.44±0.79 a |
| Carotenoids, mg DW g-1 | 1.33±0.04 b | 2.04±0.05 a | 1.90±0.10 a |
| MDA, µmol g-1 FW | 11.6±0.7 b | 14.4±1.4 a | 12.1±0.9 ab |
| H2O2, µmol g-1 FW | 0.65±0.03 a | 0.63±0.05 a | 0.60±0.04 a |
| SOD, U mg-1 protein | 2.8±0.2 a | 2.2±0.4 a | 2.4±0.6 a |
| CAT, µmol/(mg protein min) | 12.7±2.2 b | 17.2±1.9 a | 10.1±3.1 b |
| GPX, µmol mg-1 protein min-1 | 21.5±4.1 a | 17.9±3.2 a | 16.6±2.0 a |
| Soluble sugars, mg g-1 DW | 411.6±32.6 b | 521.8±18.9 a | 479.4±37.9 ab |
| Protein, mg g-1 FW | 21.8±1.5 b | 19.2±0.9 ab | 18.1±0.7 a |
| Broccoli | |||
| Shoot FW, g | 115.2±9.0 a | 114.9±7.0 a | 124.1±7.0 a |
| LMA, mg DW cm-2 | 1.87±0.05 b | 2.35±0.15 a | 1.83±0.04 b |
| Dry matter content, g kg-1 | 52.0±2.5 b | 59.0±2.2 a | 54.0±3.0 ab |
| Robustness index | 10.1±0.8 a | 9.7±0.7 a | 9.6±0.6 a |
| Chl a+b, mg DW g-1 | 12.68±0.69 a | 14.49±1.06 a | 12.84±1.25 a |
| Carotenoids, mg DW g-1 | 1.79±0.07 a | 1.68±0.07 a | 1.67±0.18 a |
| MDA, µmol g-1 FW | 19.6±3.3 a | 15.6±0.5 a | 15.1±0.7 a |
| H2O2, µmol g-1 FW | 0.66±0.06 a | 0.57±0.02 a | 0.63±0.14 a |
| SOD, U mg-1 protein | 4.9±0.9 a | 2.5±0.5 ab | 1.1±0.4 b |
| CAT, µmol/(mg protein min) | 22.5±3.5 a | 21.5±2.2 a | 17.7±1.4 b |
| GPX, µmol mg-1 protein min-1 | 108.9±13.4 a | 94.0±3.7 a | 99.3±7.9 a |
| Soluble sugars, mg g-1 DW | 292.3±19.2 b | 342.4±11.9 a | 296.3±22.2 b |
| Protein, mg g-1 FW | 18.8±1.6 а | 16.9±0.4 a | 16.3±1.3 a |
| Mizuna | |||
| Shoot FW, g | 75.0±4.0 a | 70.9±3.0 a | 72.2±4.0 a |
| LMA, mg DW cm-2 | 1.99±0.18 a | 1.91±0.10 a | 1.75±0.04 b |
| Dry matter content, g kg-1 | 53.1±2.4 a | 50.1±2.1 a | 51.0±2.5 a |
| Robustness index | 10.8±0.5 a | 9.8±0.7 a | 10.5±0.7 a |
| Chl a+b, mg DW g-1 | 11.83±0.39 a | 11.39±0.63 a | 10.27±0.48 b |
| Carotenoids, mg DW g-1 | 1.68±0.09 a | 1.47±0.12 a | 1.17±0.16 b |
| MDA, µmol g-1 FW | 18.6±1.1 b | 16.2±1.5 b | 25.1±2.1 a |
| H2O2, µmol g-1 FW | 0.47±0.03 c | 0.56±0.02 b | 1.14±0.06 a |
| SOD, U mg-1 protein | 6.8±0.5 a | 4.3±0.4 b | 5.9±0.2 ab |
| CAT, µmol/(mg protein min) | 26.0±8.3 a | 15.6±4.3 b | 10.6±1.2 b |
| GPX, µmol mg-1 protein min-1 | 148.6±16.0 a | 128.4±7.5 a | 195.6±15.0 a |
| Soluble sugars, mg g-1 DW | 438.1±22.6 b | 500.8±23.4 a | 293.9±18.0 b |
| Protein, mg g-1 FW | 16.7±0.7 b | 18.5±0.8 a | 14.7±0.3 c |
Different letters for each plant species indicate significant differences between the mean values at p< 0.05. (40 and 59%) in mizuna under both shortened L/D cycles. GPX activity remained unchanged.
Table 3.
Physiological and biochemical parameters of plants grown under different light-dark cycles (16/8 h and CELM).
Table 3.
Physiological and biochemical parameters of plants grown under different light-dark cycles (16/8 h and CELM).
| Parameter | Lighting mode | Borago | Fenugreek | Sunflower |
Green radish |
Radish Sango |
| Yield, g FW dm-2 | 16/8 h CELM |
24.9±3.1 a 25.1±5.2 a |
14.6±0.7 a 16.0±0.8 a |
60.5±3.5 a 68.8±6.0 a |
27.2±1.7 a 25.1±3.7 a |
33.5±1.1 b 42.1±2.5 a |
| LMA, mg DW cm-2 | 16/8 h | 2.16±0.10 a | 2.17±0.10 a | 4.69±0.33 a | 4.3±0.3 a | 3.7±0.3 b |
| CELM | 2.38±0.17 a | 2.38±0.16 a | 4.74±0.31 a | 4.5±0.4 a | 4.7±0.3 a | |
| Dry matter content, | 16/8 h | 56.8±3.4 a | 77.2±4.1 a | 72.3±3.1 a | 92.1±2.3 a | 77.6±1.6 a |
| g kg-1 | CELM | 60.4±3.1 a | 78.3±3.6 a | 69.7±3.0 a | 91.6±2.5 a | 73.6±2.2 a |
| Fv/Fm | 16/8 h | 0.831±0.002 a | 0.836±0.001 a | 0.831±0.005 a | - | - |
| CELM | 0.833±0.002 a | 0.830±0.002 a | 0.833±0.006 a | - | - | |
| Chl a+b, mg g-1 DW | 16/8 h | 13.65±0.30 a | 10.16±1.03 a | 6.90±0.45 a | 9.8±0.5 a | 6.1±0.2 a |
| CELM | 12.40±0.49 a | 12.49±1.30 a | 5.79±0.70 a | 7.5±0.2 b | 6.1±0.3 a | |
| Carotenoids, mg g-1 DW |
16/8 h | 2.18±0.19 a | 1.44±0.22 a | 1.01±0.05 a | 1.0±0.1 a | 0.9±0.1 a |
| CELM | 1.98±0.12 a | 1.79±0.11 a | 1.01±0.14 a | 1.2±0.1 a | 0.8±0.1 a | |
| Anthocyanins, (А530 – 0.25А657) g-1FW | 16/8 h | 0.50±0.04 a | 0.68±0.03 a | 0.39±0.04 a | 0.7±0.1 a | 15.3±0.7 b |
| CELM | 0.47±0.03 a | 0.68±0.09 a | 0.35±0.03 a | 0.8±0.1 a | 21.2±1.0 a | |
| Flavonoids, А300 g -1FW |
16/8 h | 14.72±1.10 b | 14.59±1.36 a | 32.72±1.56 a | 23.2±3.2 a | 36.3±3.4 b |
| CELM | 15.76±0.64 a | 13.66±1.14 a | 30.02±3.82 a | 25.8±2.1 a | 44.0±2.3 a | |
| REL, % |
16/8 h CELM |
22.3±2.1 a 19.4±0.6 a |
25.4±5.9 a 25.5±6.1 a |
13.4±0.9 a 15.2±0.5 a |
18.8±0.8 a 17.5±1.2 a |
15.1±0.8 a 12.1±2.9 b |
| MDA, µmol g-1 FW |
16/8 h CELM |
14.5±0.6 b 19.3±1.6 a |
14.2±0.3 a 14.5±0.2 a |
28.5±1.2 a 28.6±1.3 a |
189±15 b 230±19 a |
482±67 a 487±70 a |
| H2O2, µmol g-1 FW |
16/8 h CELM |
0.67±0.08 a 0.68±0.07 a |
0.16±0.02 a 0.17±0 a |
1.41±0.12 a 1.28±0.11 a |
0.67±0.09 a 0.64±0.08 a |
1.38±0.07 a 1.29±0.05 a |
| SOD, U mg-1 protein | 16/8 h CELM |
5.2±0.8 a 4.3±1.9 a |
5.8±0.1 a 6.4±0.7 a |
3.3±0.3 b 5.9±0.2 a |
2.8±0.3 a 2.7±0.3 a |
2.0±0.4 a 1.9±0.1 a |
| CAT, µmol mg-1 protein min) | 16/8 h CELM |
25.1±1.1 a 22.6±0.7 b |
17.4±1.2 b 20.7±0.9 a |
13.3±1.6 a 14.6±0.4 a |
7.2±0.5 b 12.0±0.8 a |
10.1±1.1 b 16.4±2.2 a |
| GPX, µmol mg-1 protein min) | 16/8 h CELM |
17.7±1.6 b 28.7±2.2 a |
2119±203 a 2340±181 a |
53.5±12.5 b 119.8±8.9 a |
69.2±7.7 b 112.7±9.0 a |
37.1±4.6 b 47.6±4.9 a |
| Proline, µmol g-1 DW | 16/8 h CELM |
59.1±1.7 b 67.6±0.6 a |
219.0±24.7 a 247.2±9.0 a |
137.1±1.2 a 131.3±5.0 a |
523.0±34.0 a 549.0±48.0 a |
1374.0±13.0 a 1290.0±41.0 a |
| Soluble sugars, mg g-1 DW |
16/8 h CELM |
295.1±22.5 a 268.0±24.5 a |
254.7±24.8 a 289.9±15.2 a |
140.2±17.5 a 134.8±13.7 a |
114.0±8.0 a 116.0±8.0 a |
102.0±4.0 b 145.0±15.0 a |
| Protein, mg g-1 FW | 16/8 h CELM |
174.1±15.9 a 200.5±15.9 a |
195.3±13.9 a 193.8±2.6 a |
194.3±28.7 a 165.1±8.8 a |
168.7±17.4 b 205.5±11.9 a |
169.9±8.3 b 189.3±9.2 a |
| Ascorbic acid, mg g-1FW |
16/8 h CELM |
82.4±16.3 a 74.7±2.3 a |
135.6±5.3 a 140.4±12.4 a |
83.4±14.2 a 83.5±8.1 a |
275±18 a 303±23 a |
231±12 b 269±24 a |
Different letters for each plant species indicate significant differences between the mean values at p< 0.05.
Disclaimer/Publisher’s Note: The statements, opinions and data contained in all publications are solely those of the individual author(s) and contributor(s) and not of MDPI and/or the editor(s). MDPI and/or the editor(s) disclaim responsibility for any injury to people or property resulting from any ideas, methods, instructions or products referred to in the content. |
© 2025 by the authors. Licensee MDPI, Basel, Switzerland. This article is an open access article distributed under the terms and conditions of the Creative Commons Attribution (CC BY) license (http://creativecommons.org/licenses/by/4.0/).
Copyright: This open access article is published under a Creative Commons CC BY 4.0 license, which permit the free download, distribution, and reuse, provided that the author and preprint are cited in any reuse.


