Preprint
Article

This version is not peer-reviewed.

Enhancement of Growth and Quality of Winter Watermelon Using LED Supplementary Lighting

A peer-reviewed article of this preprint also exists.

Submitted:

31 January 2025

Posted:

03 February 2025

You are already at the latest version

Abstract

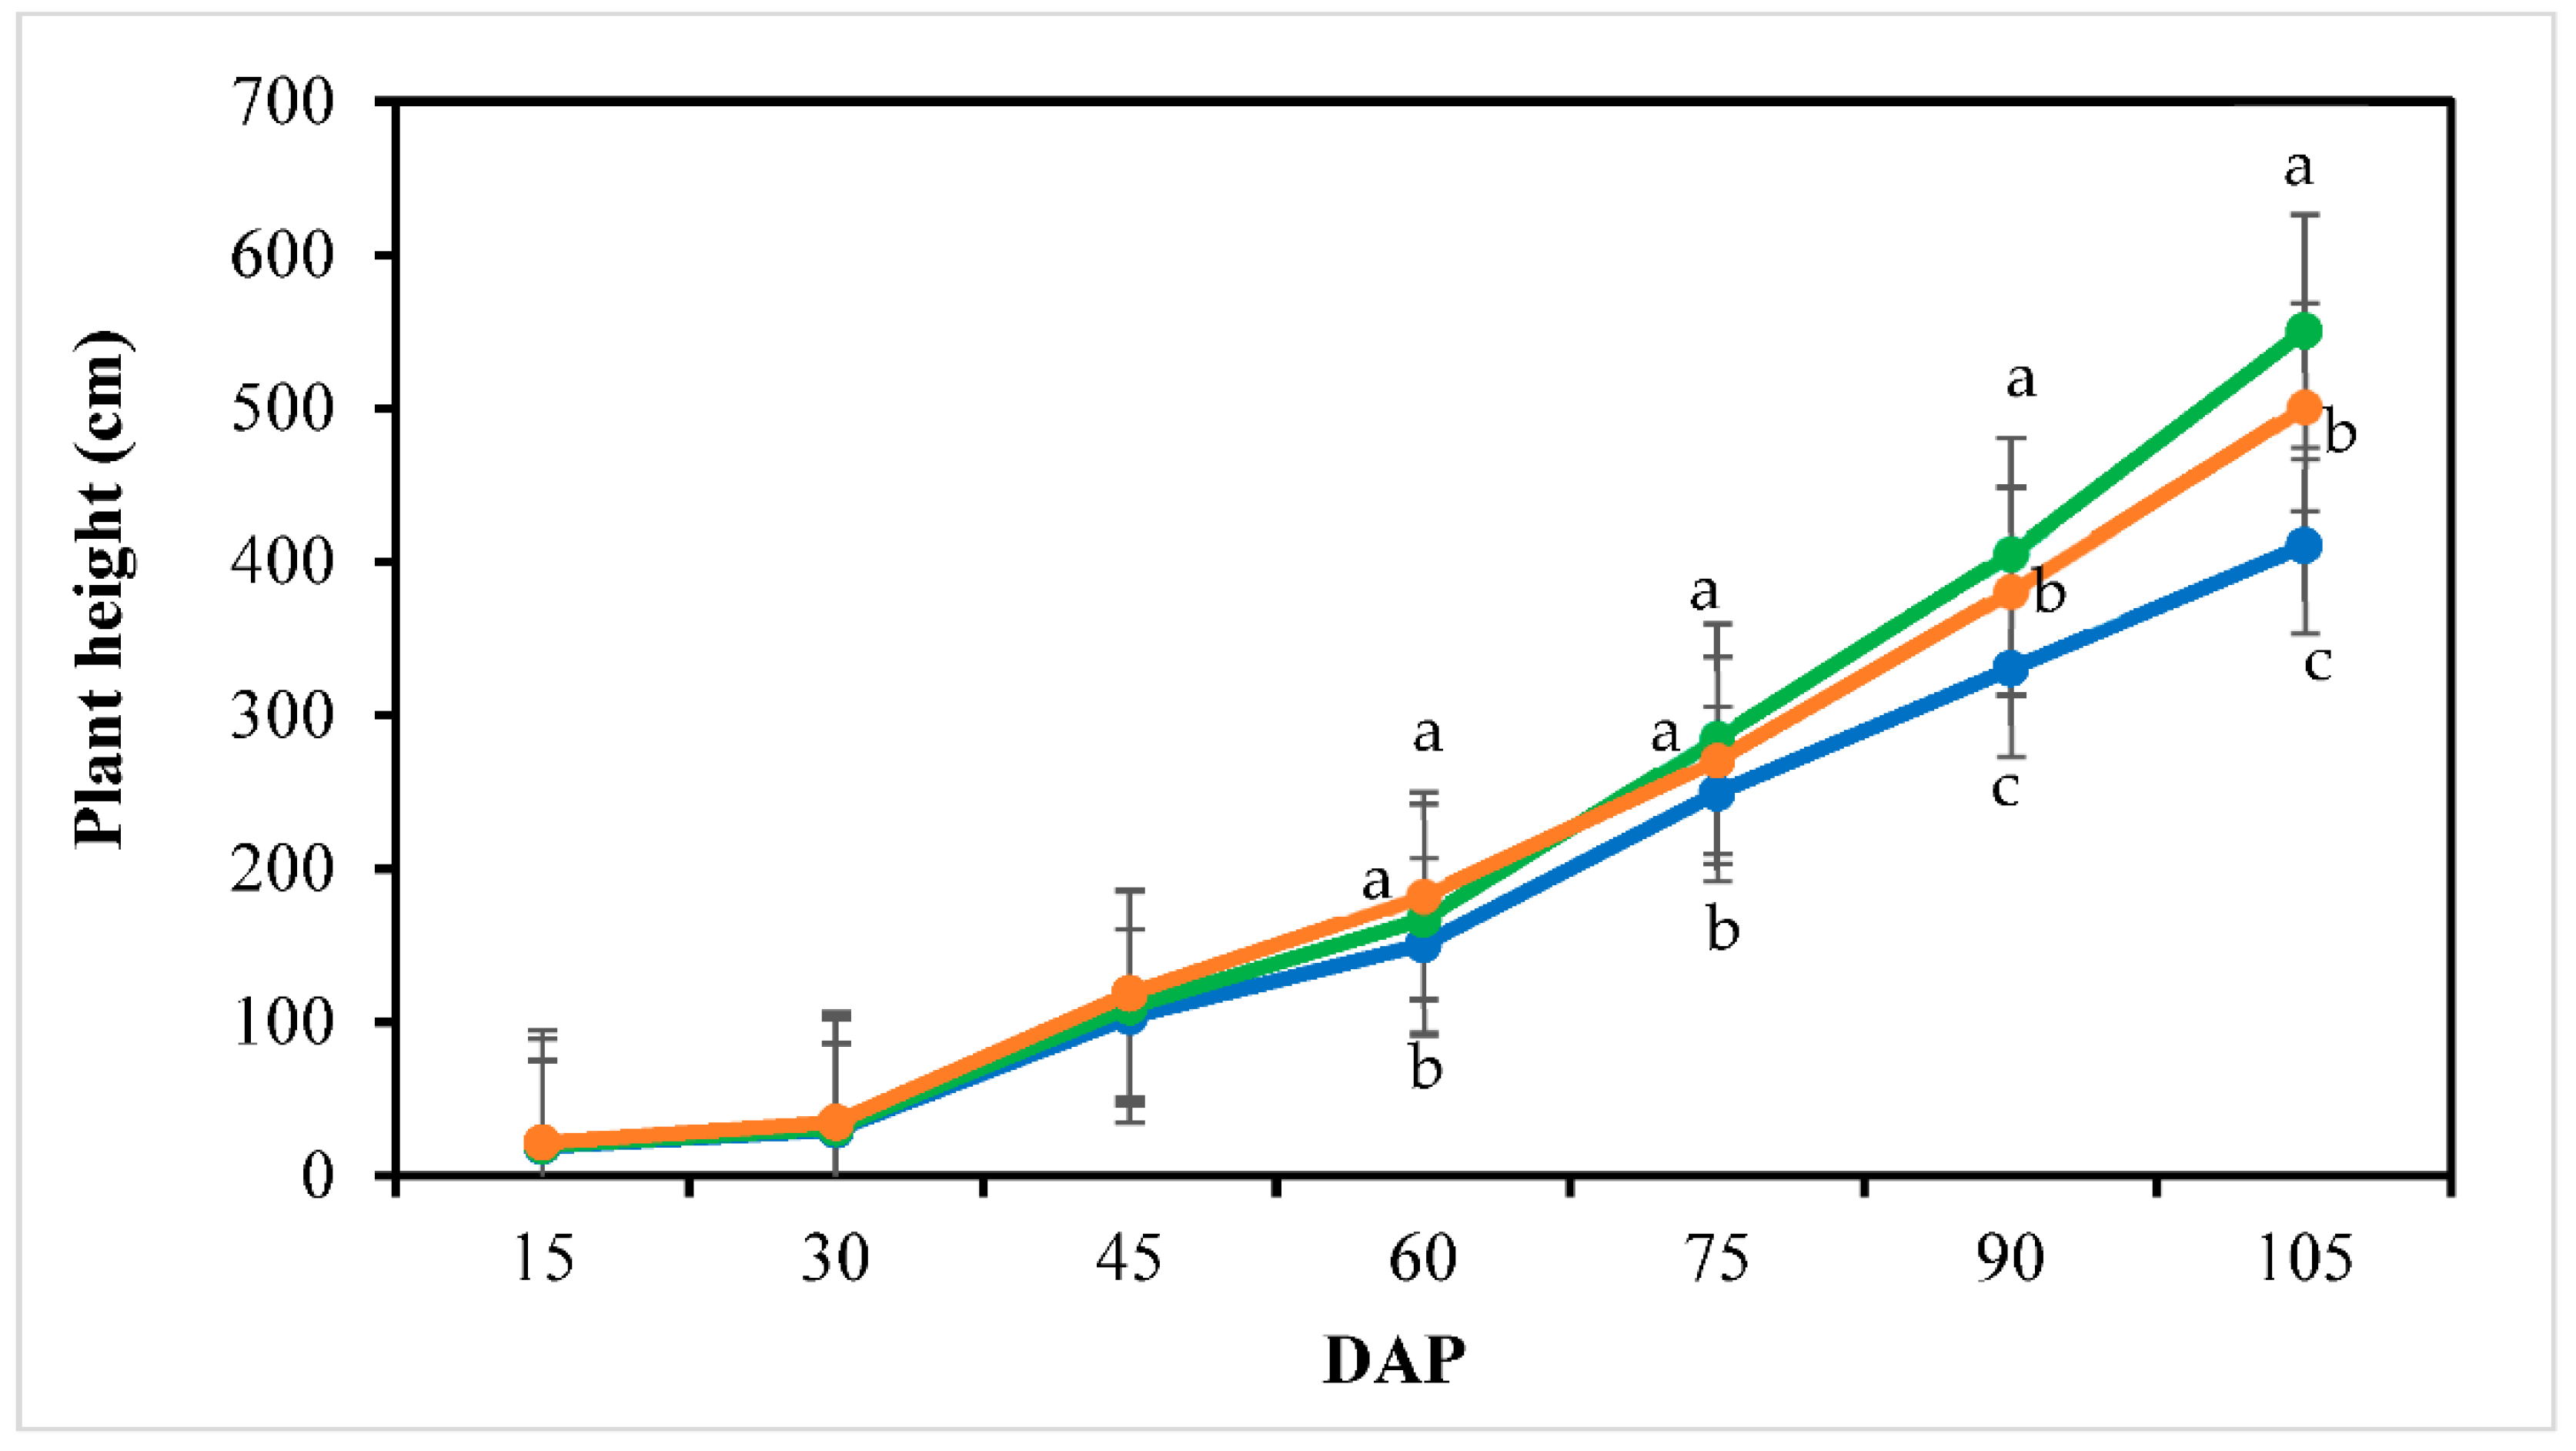
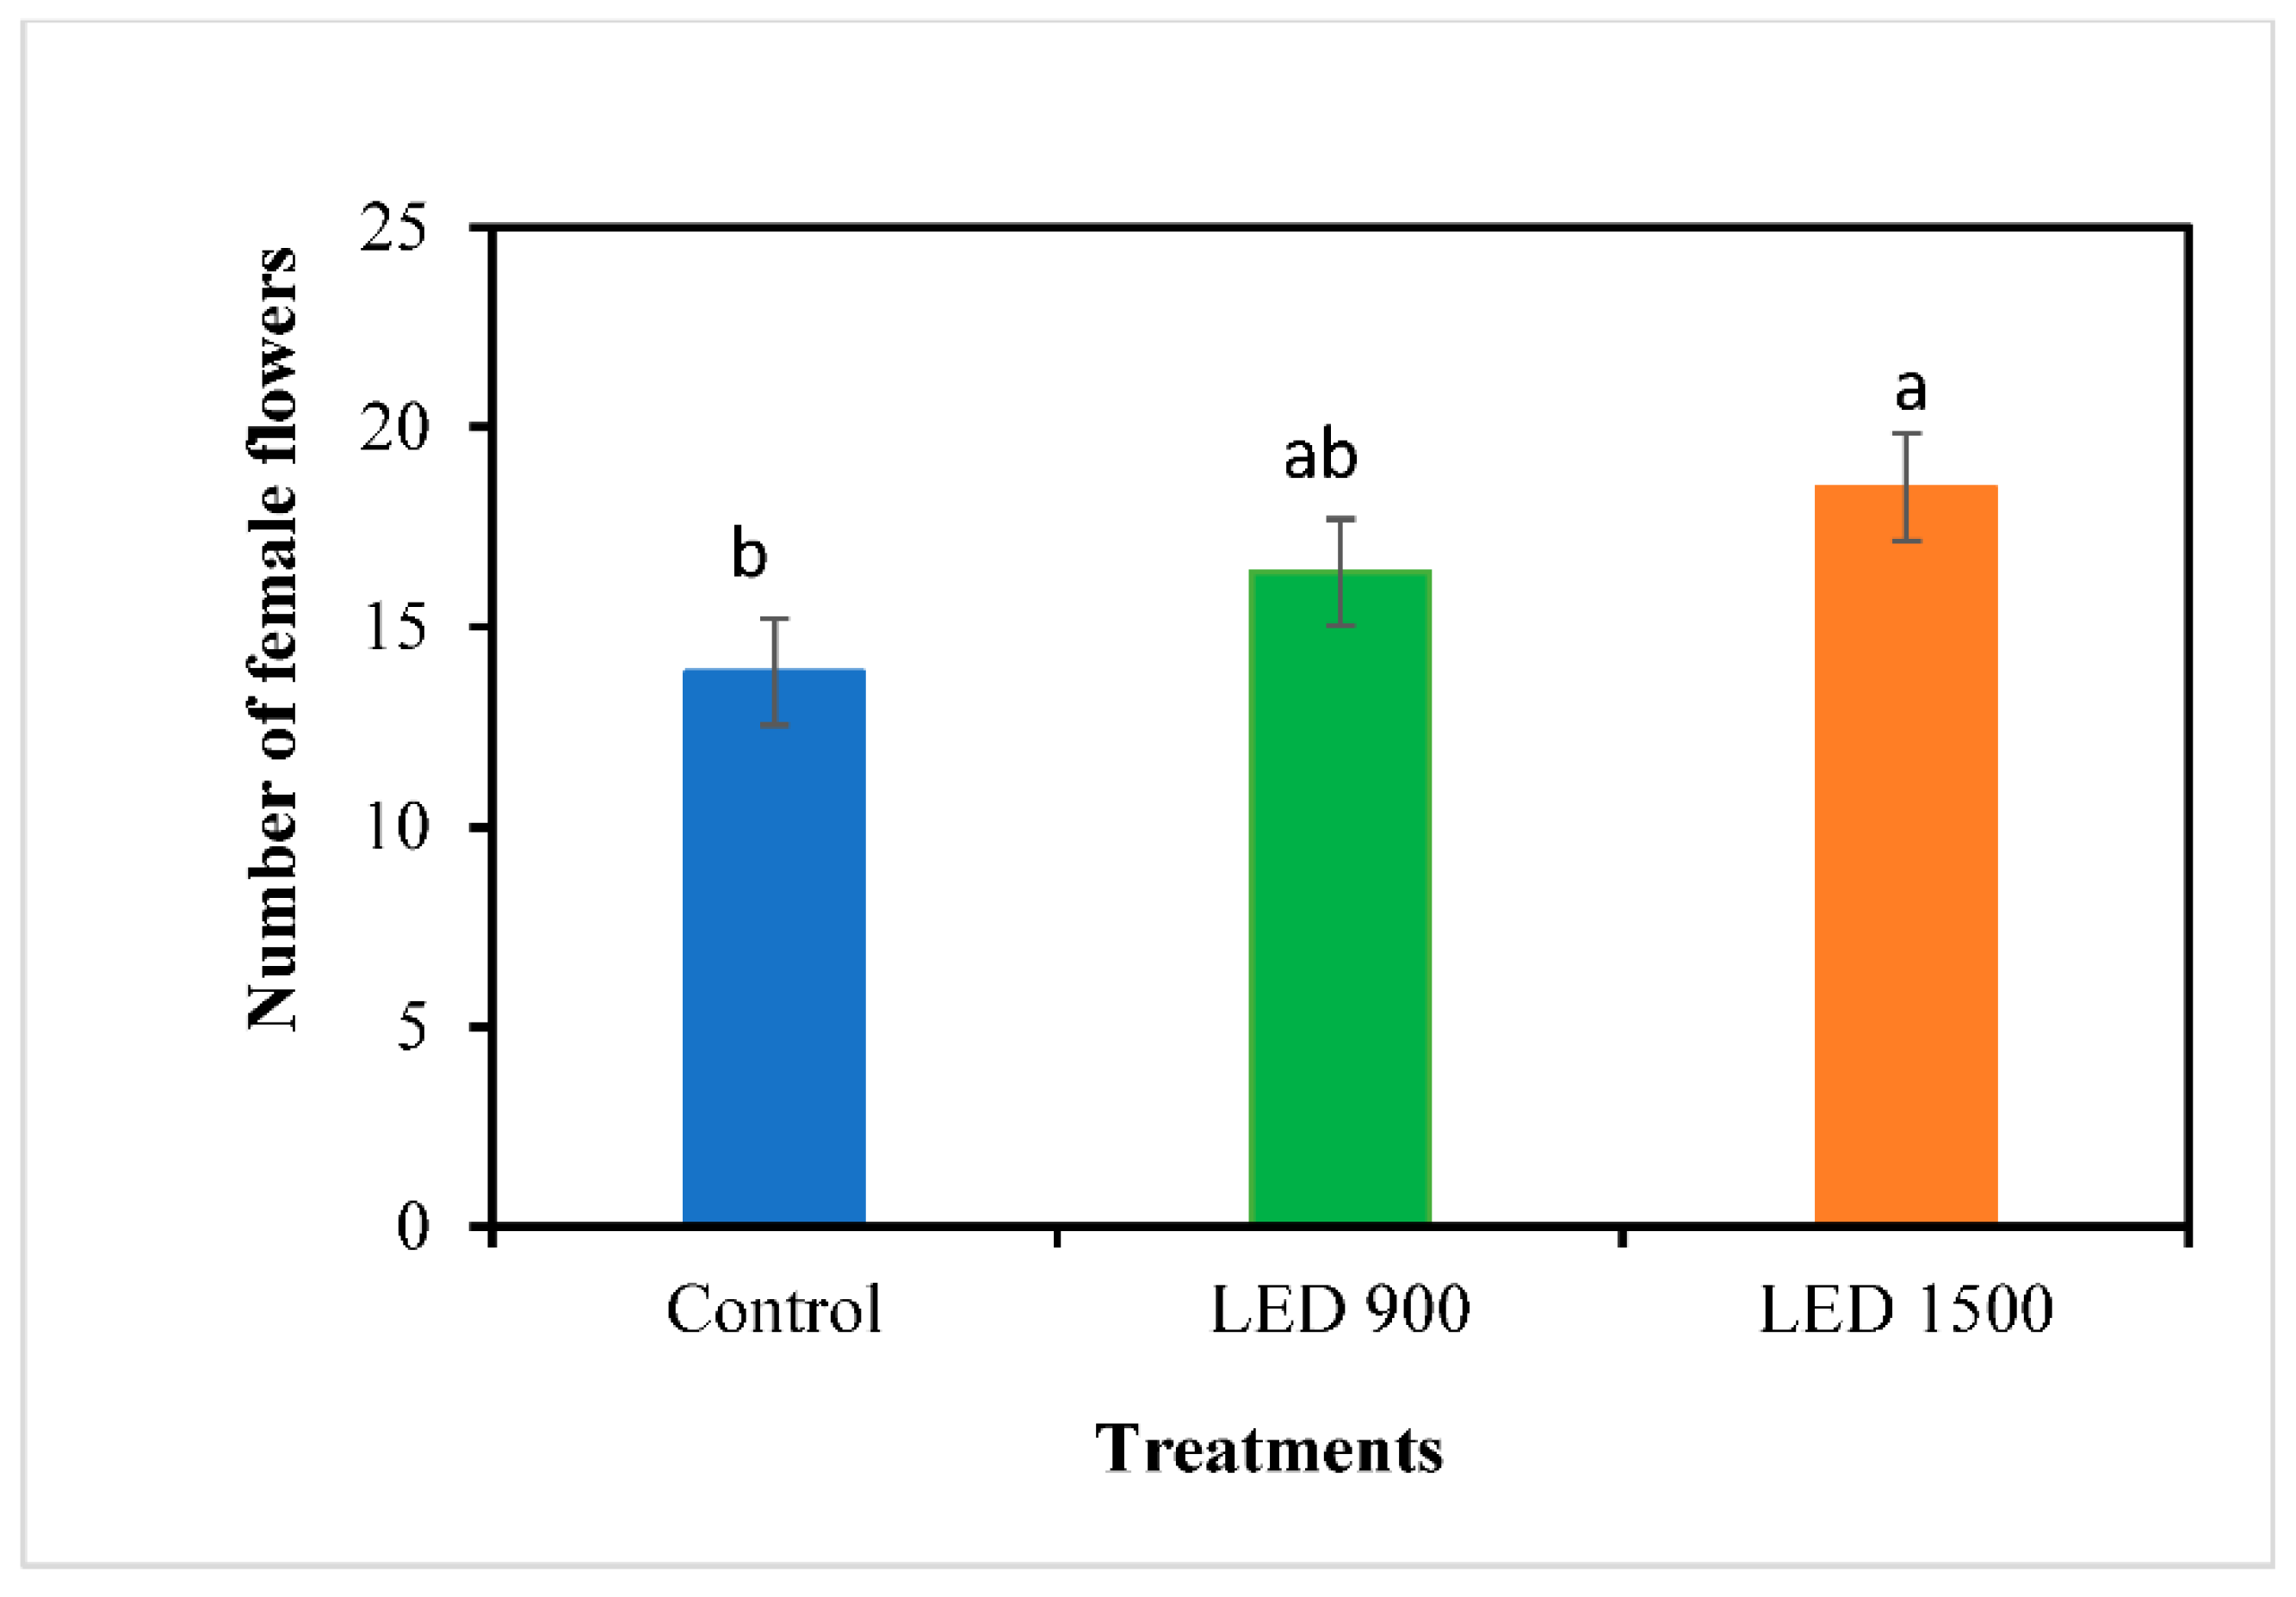
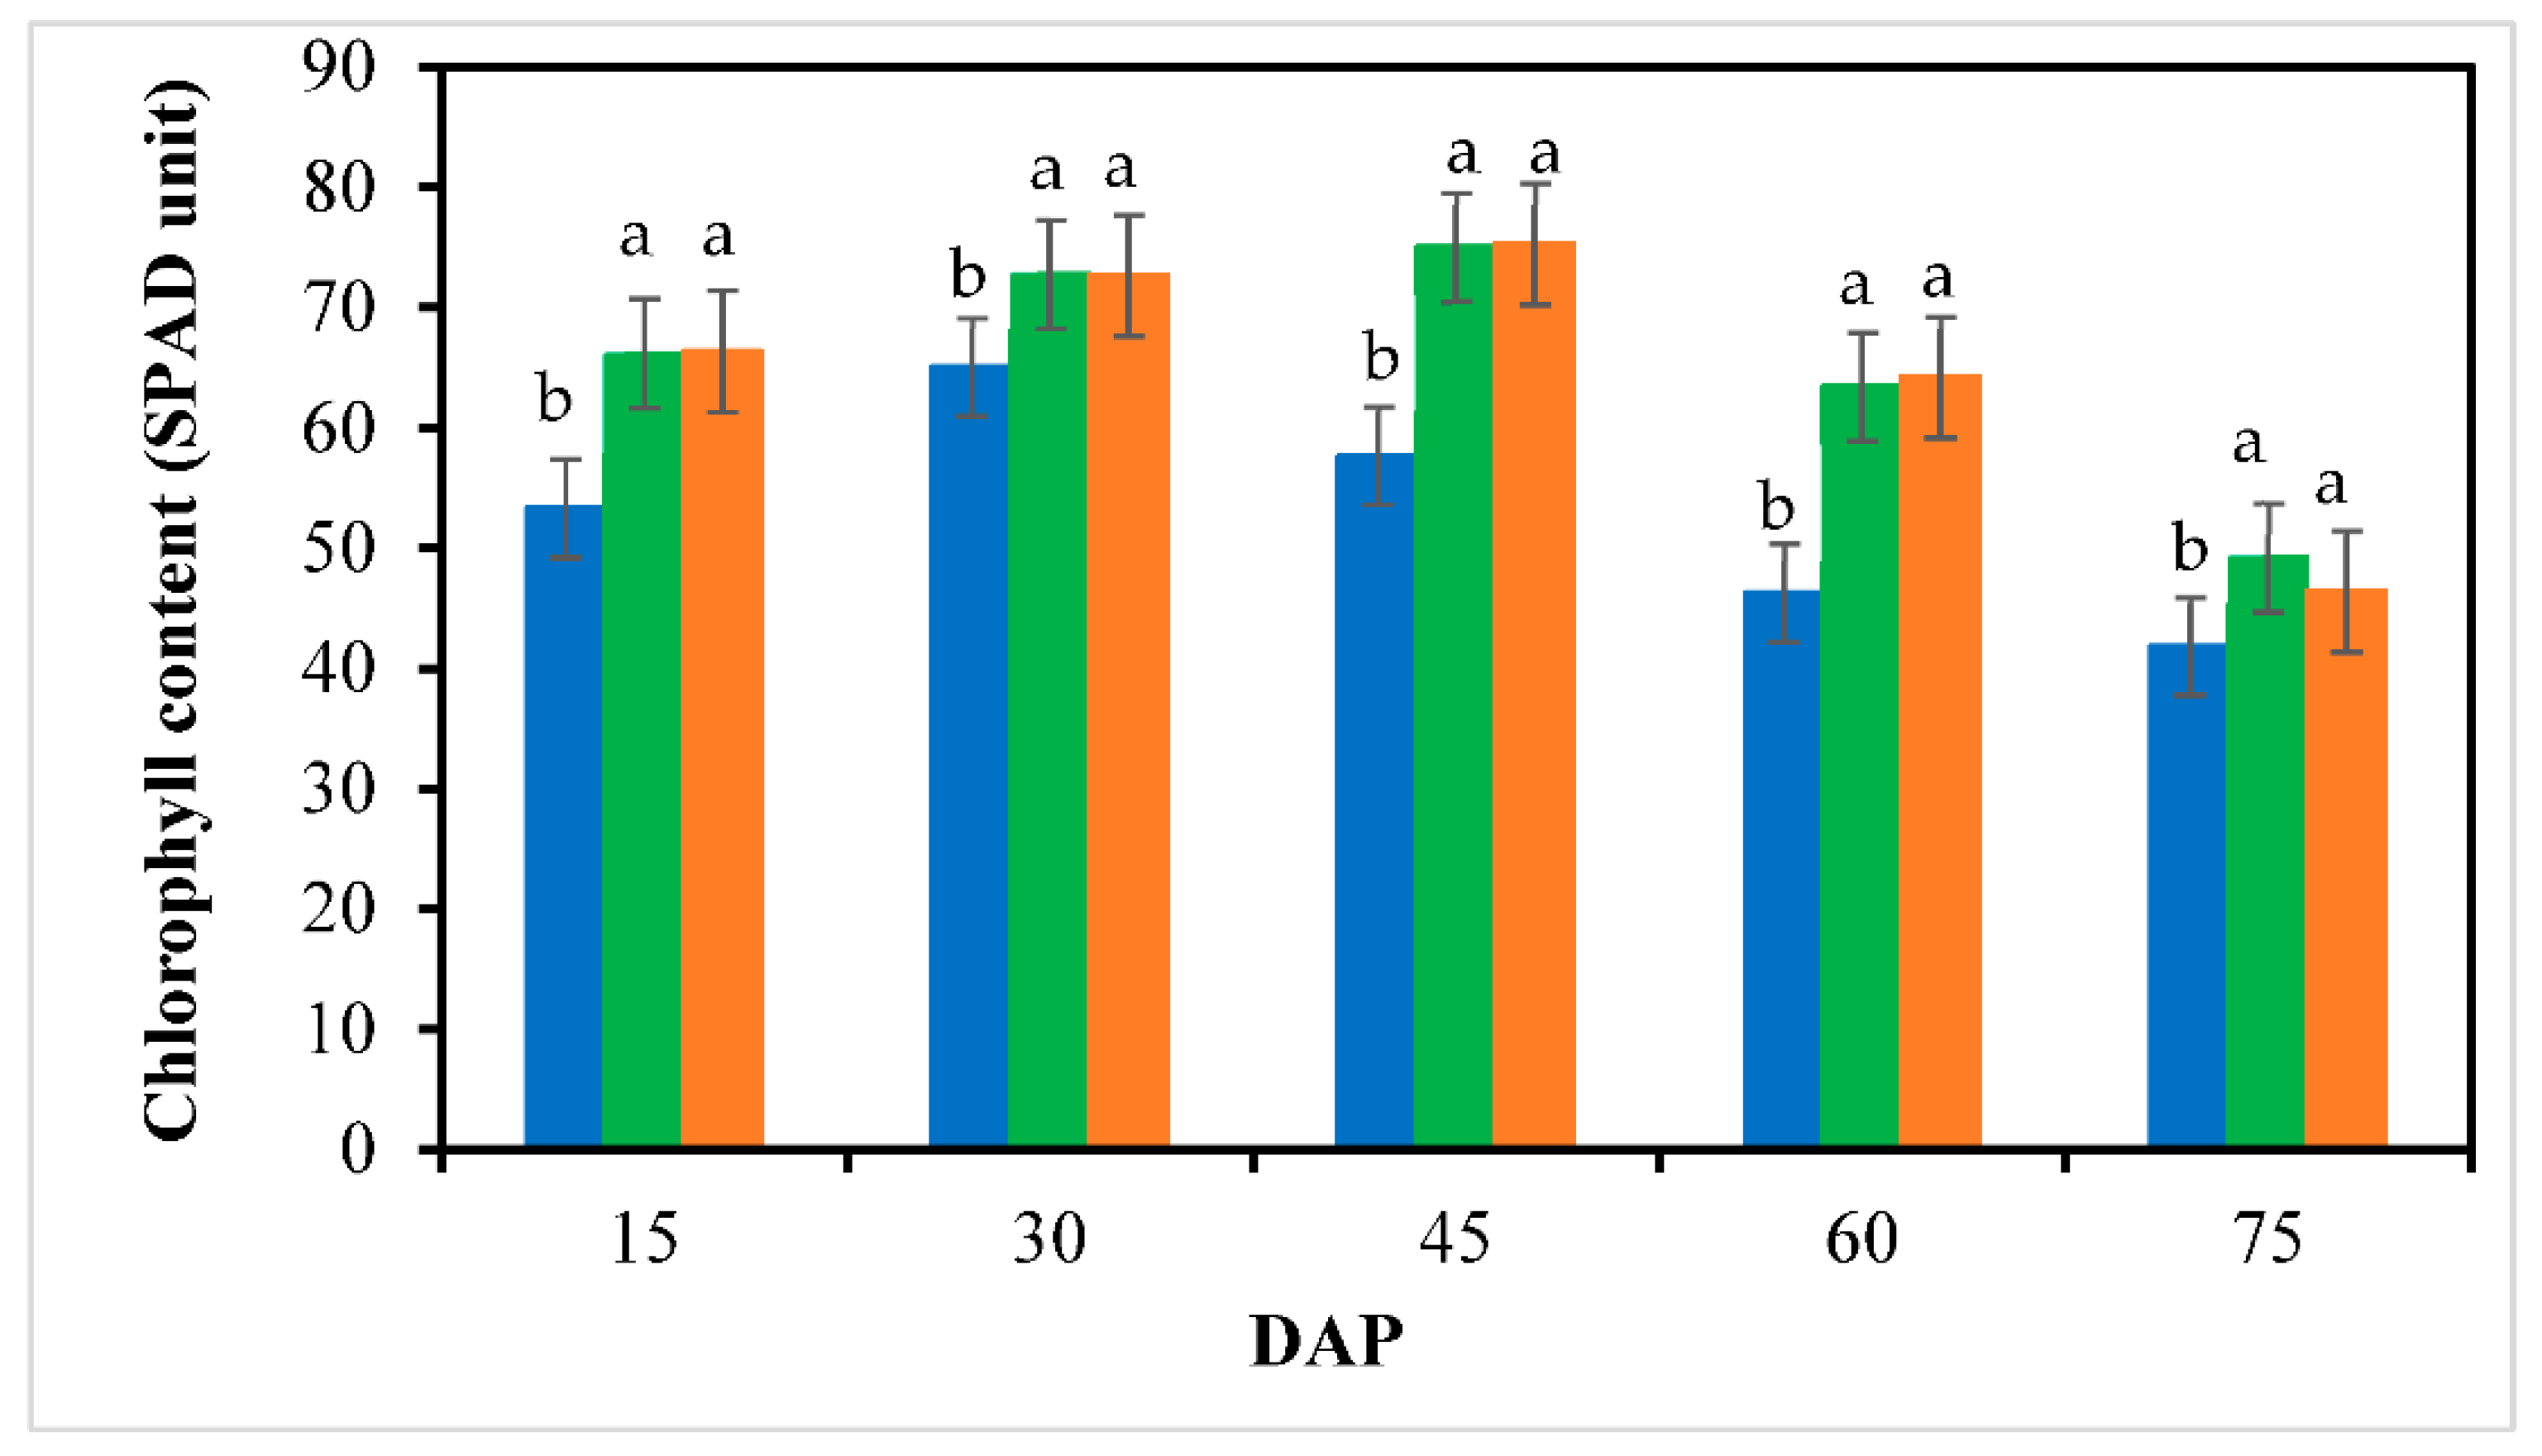
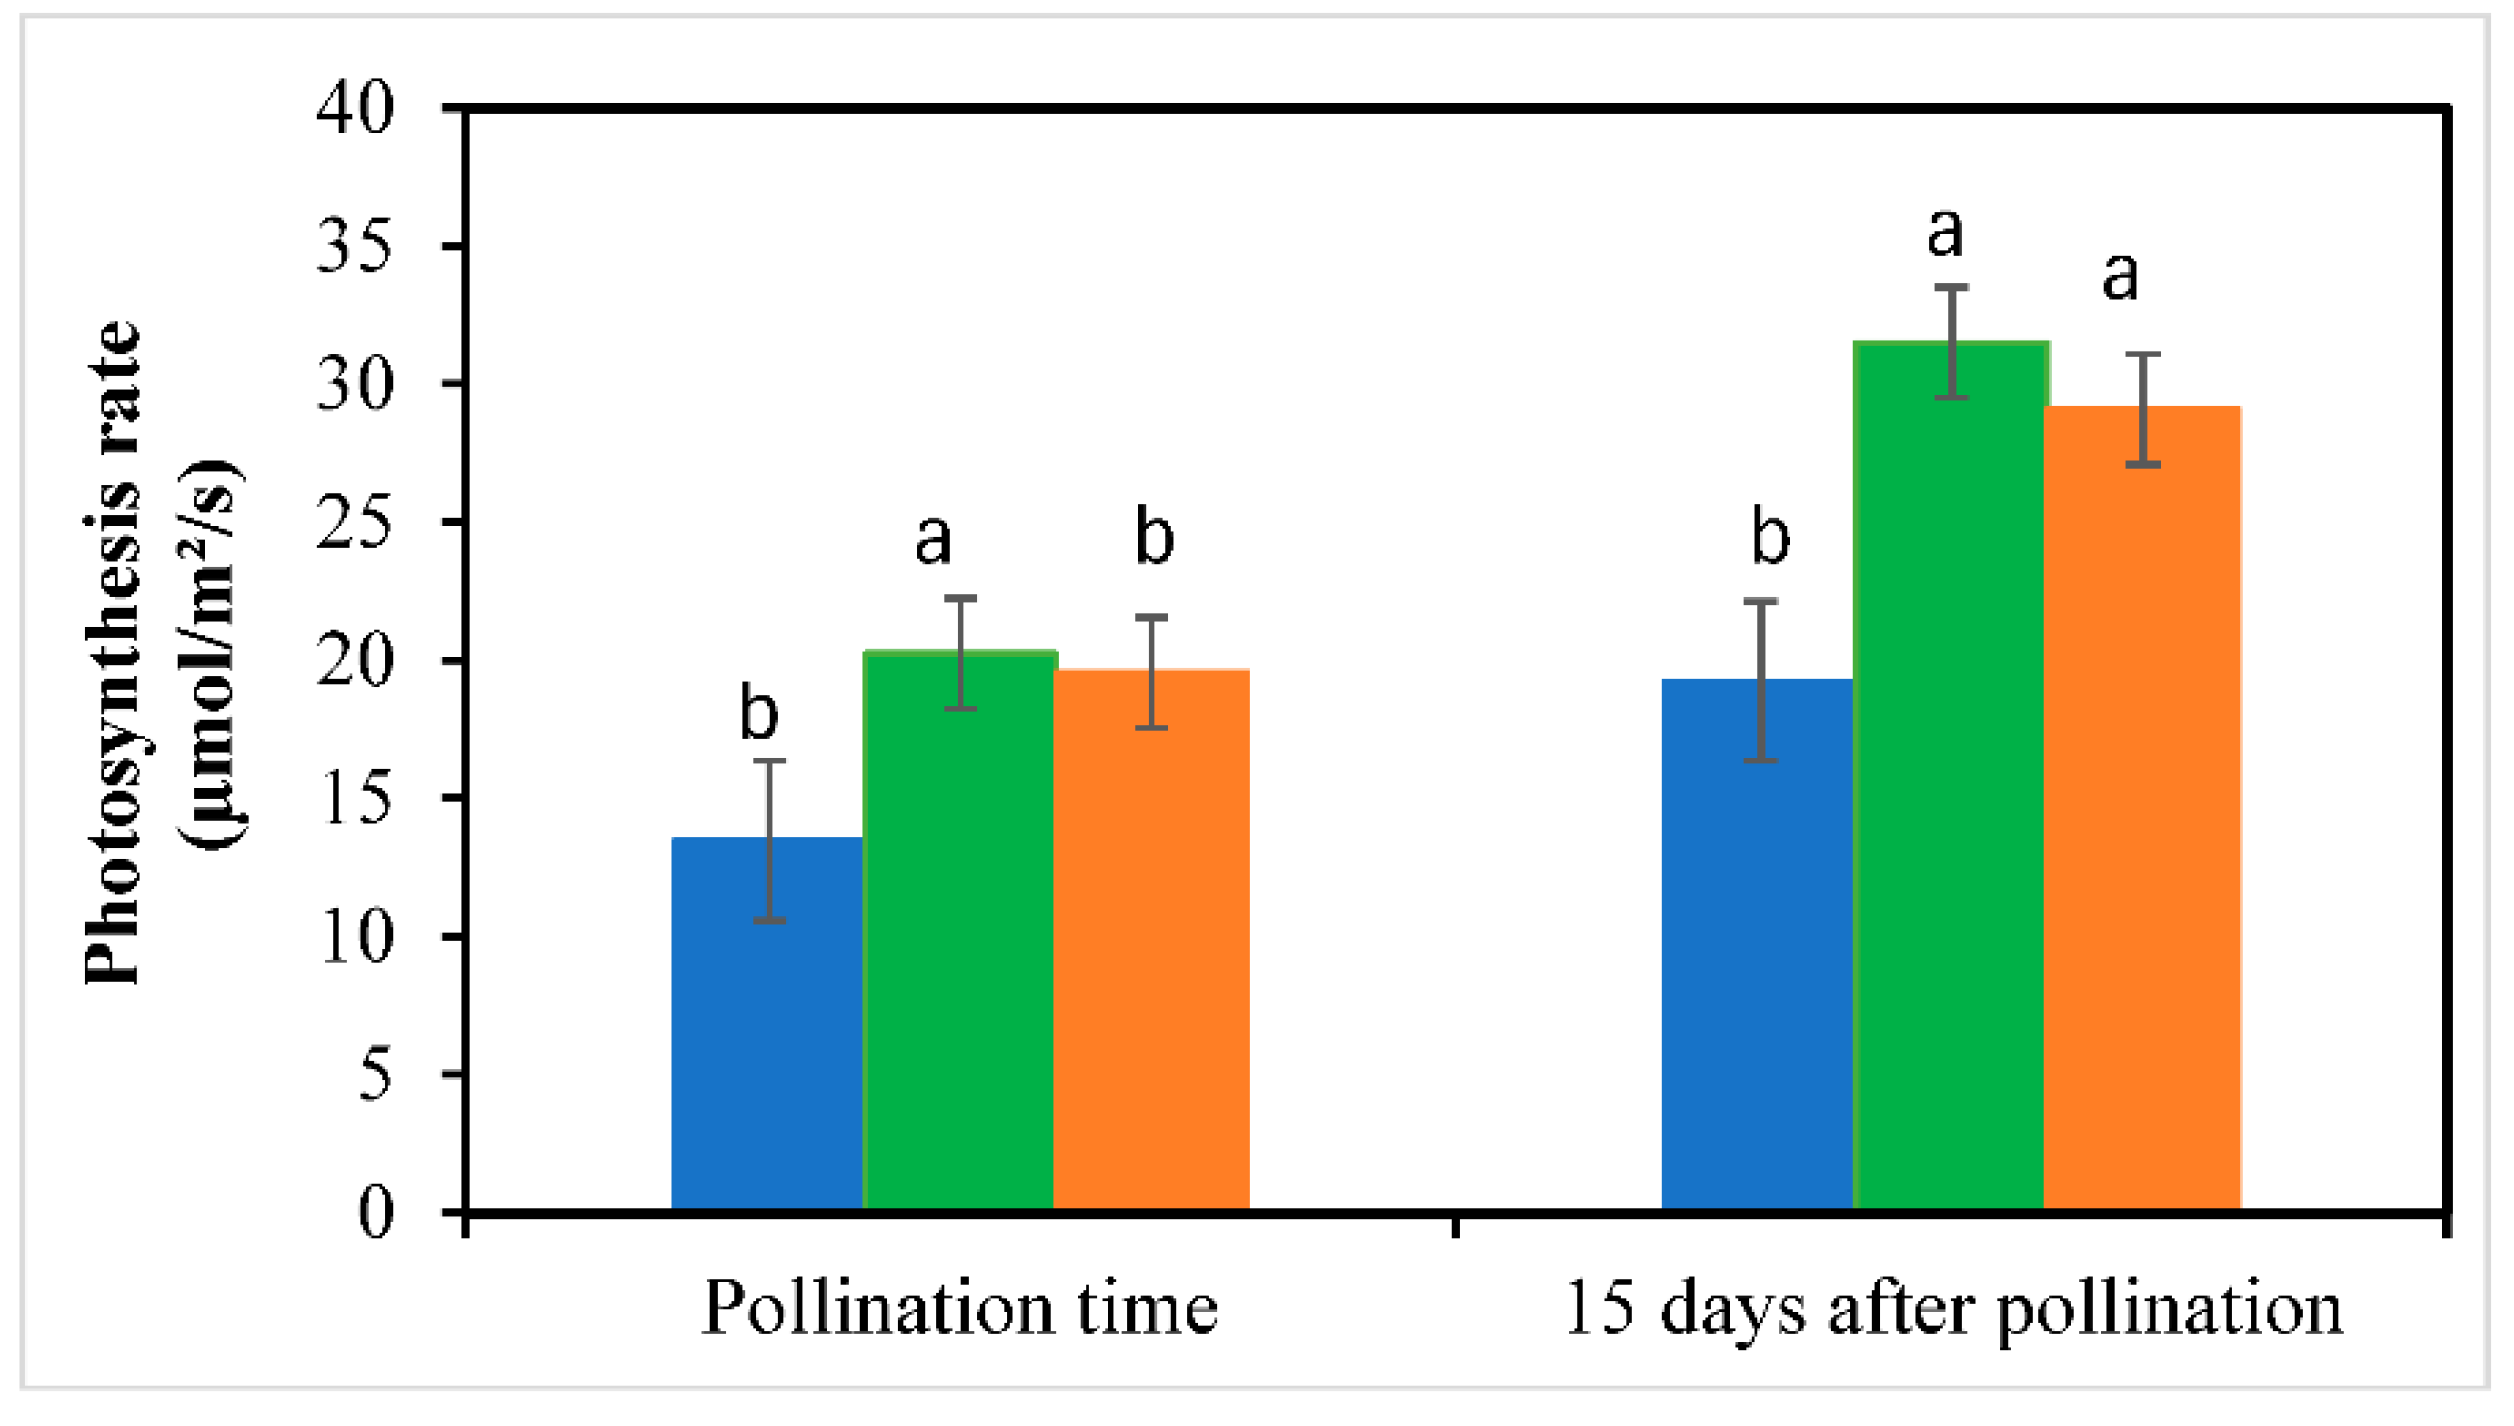
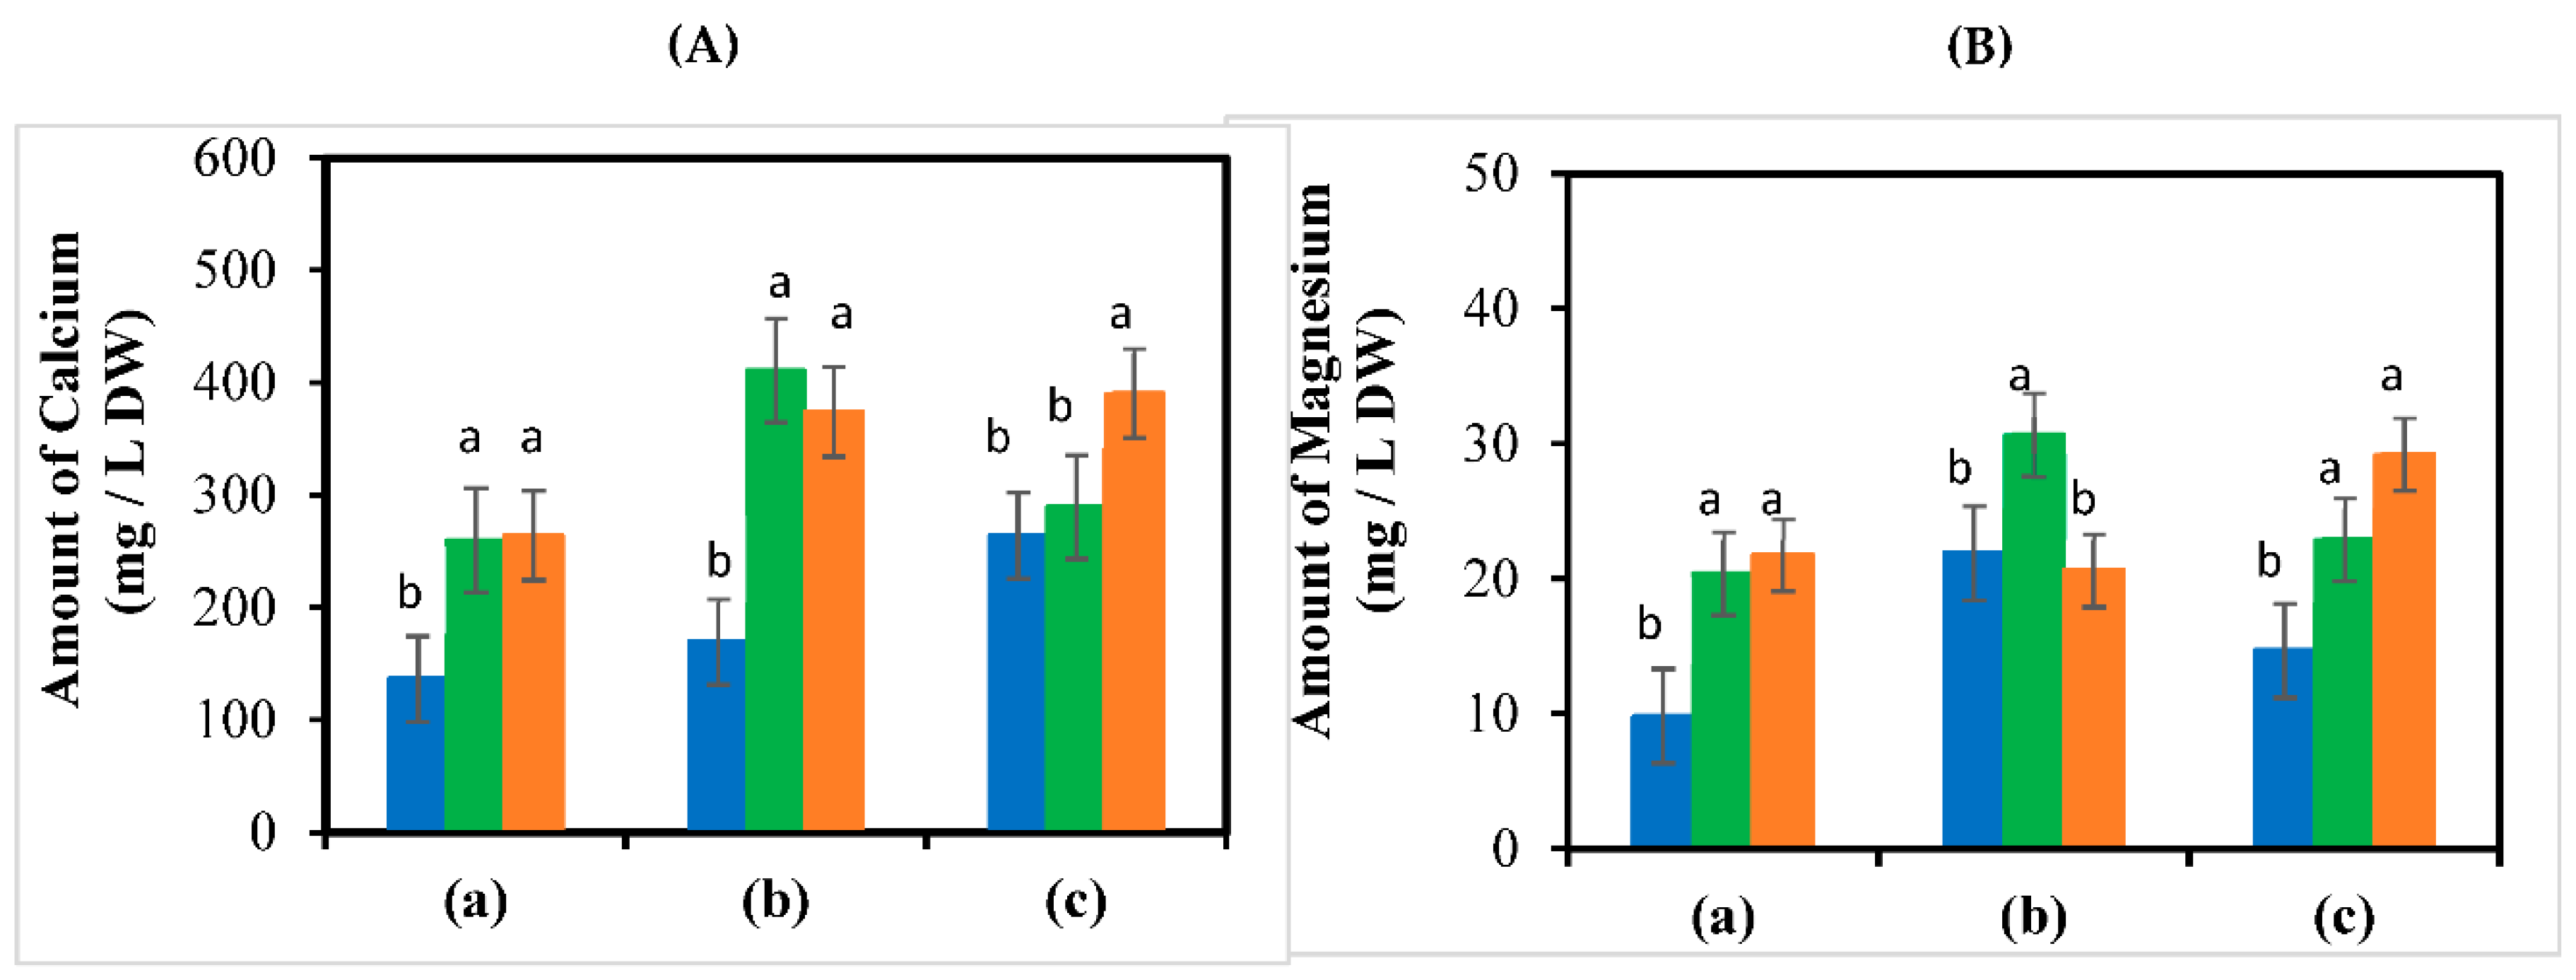
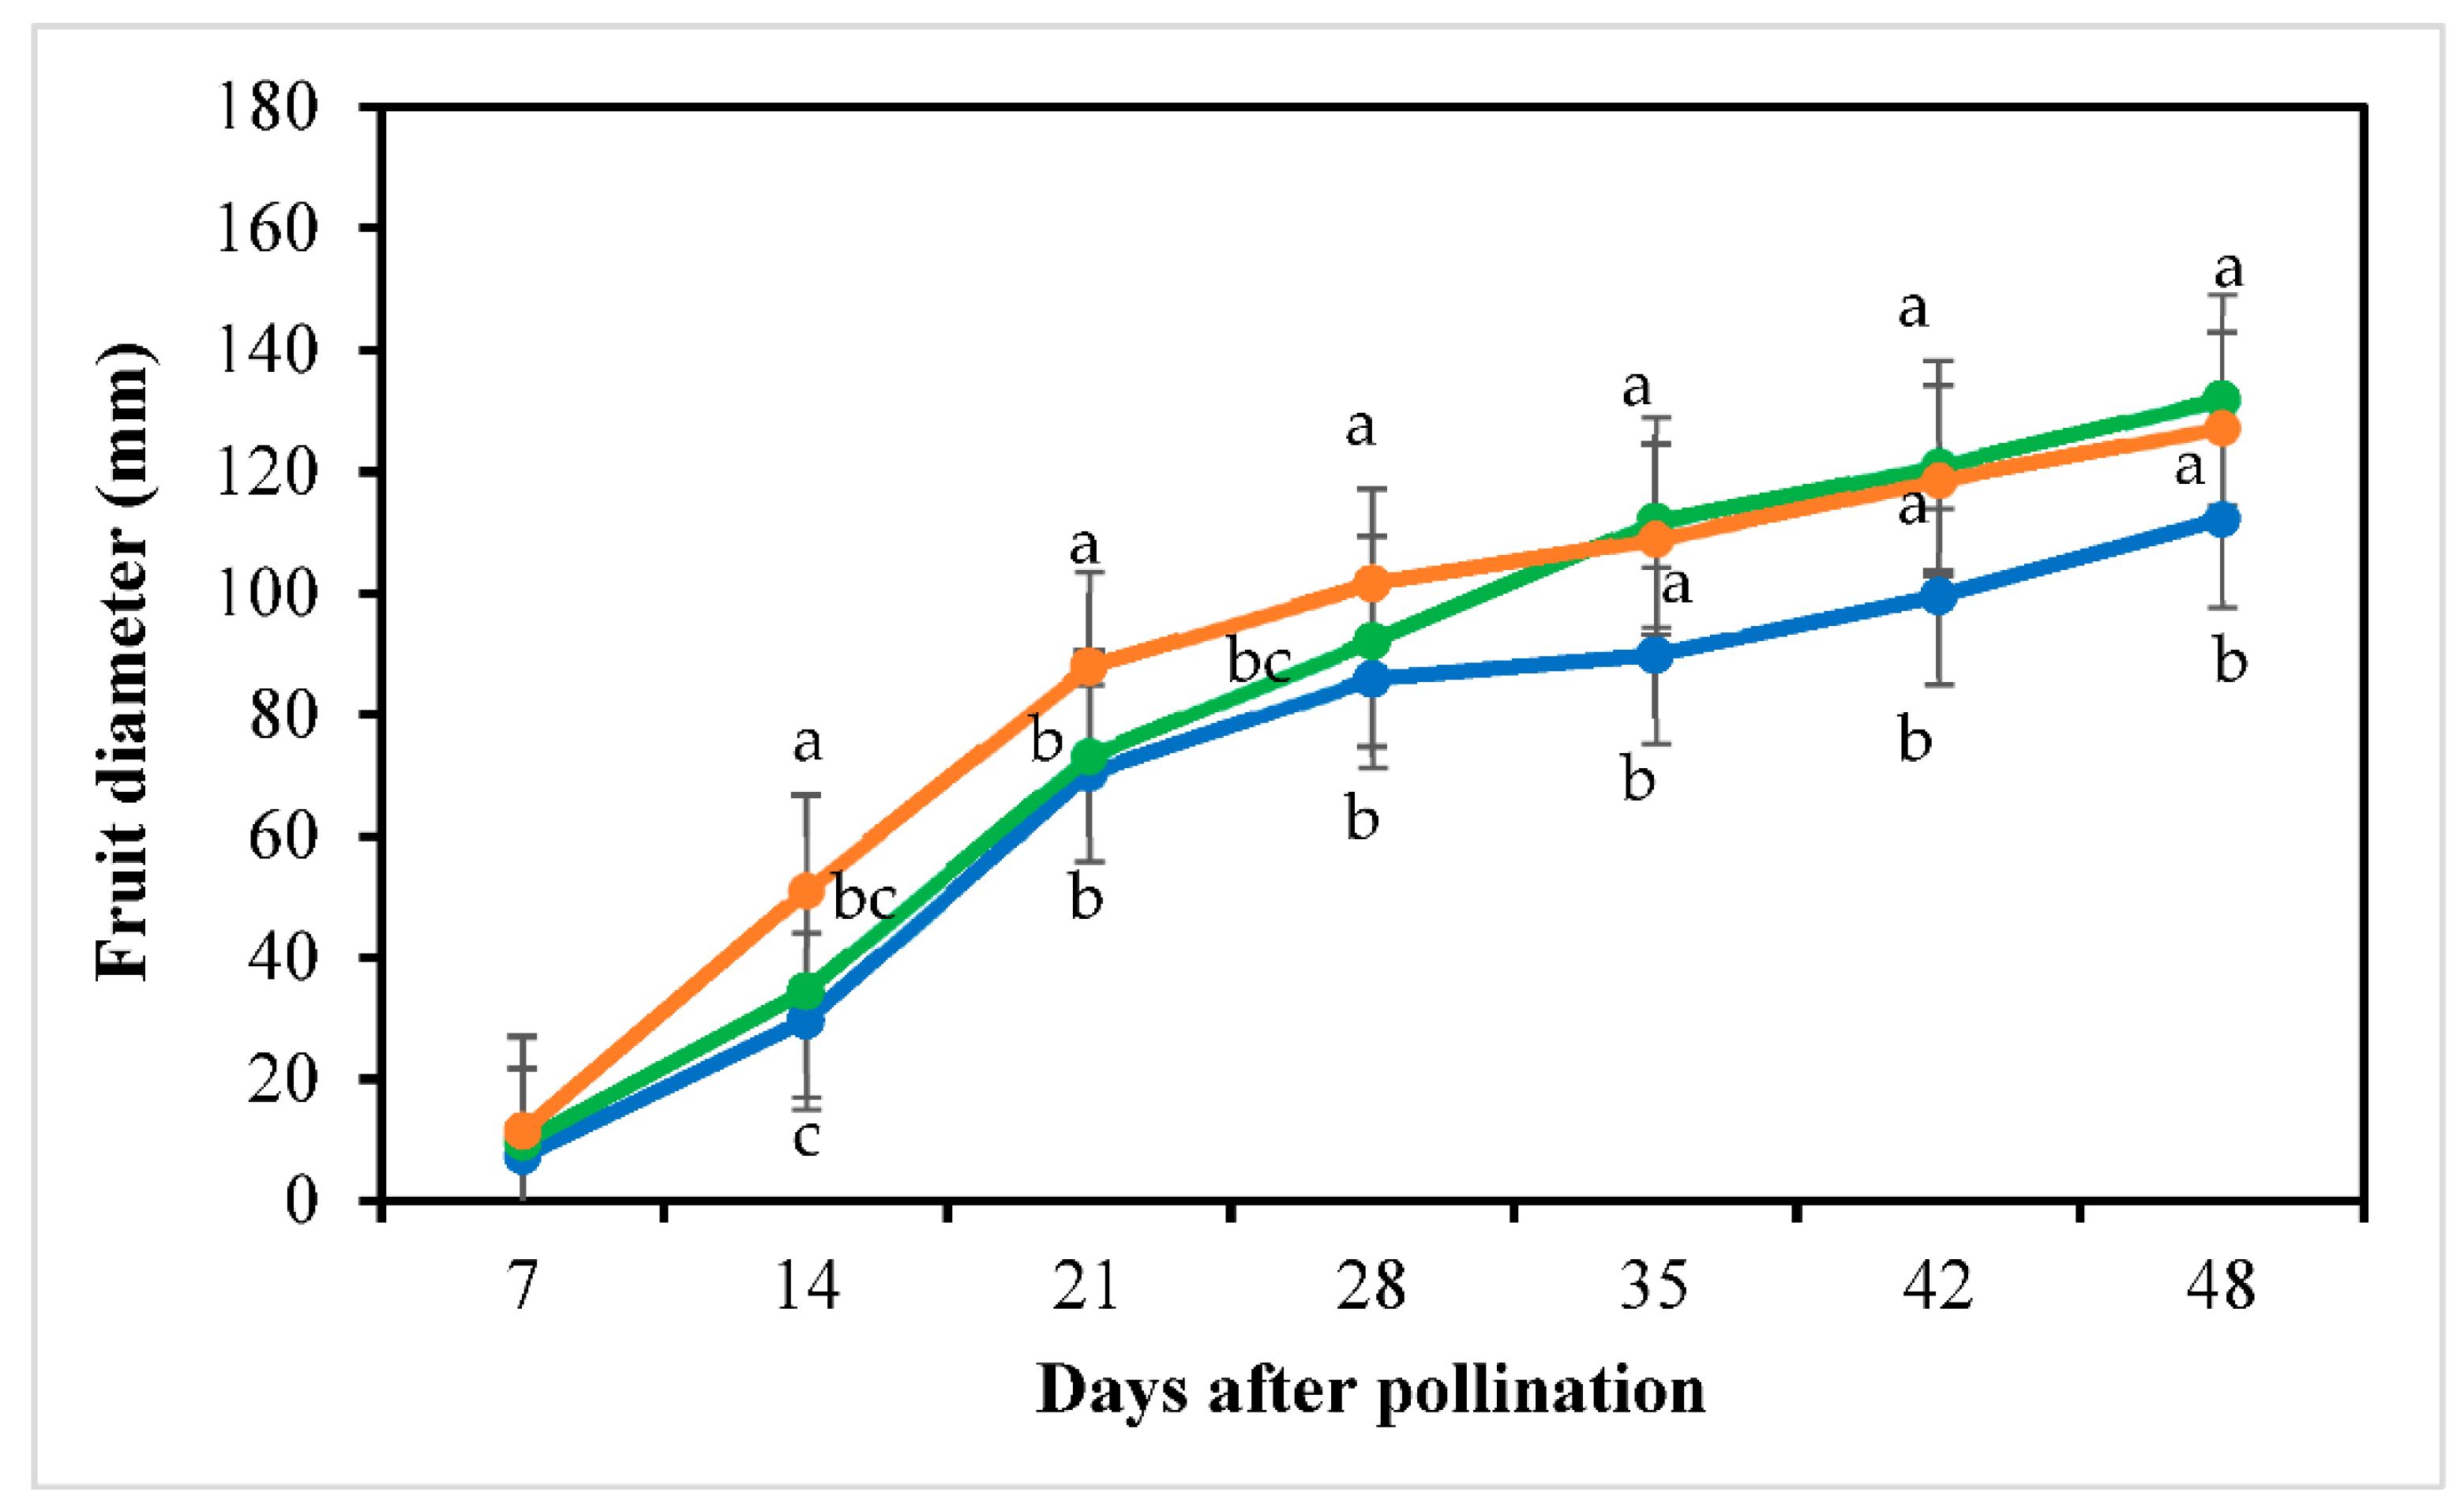
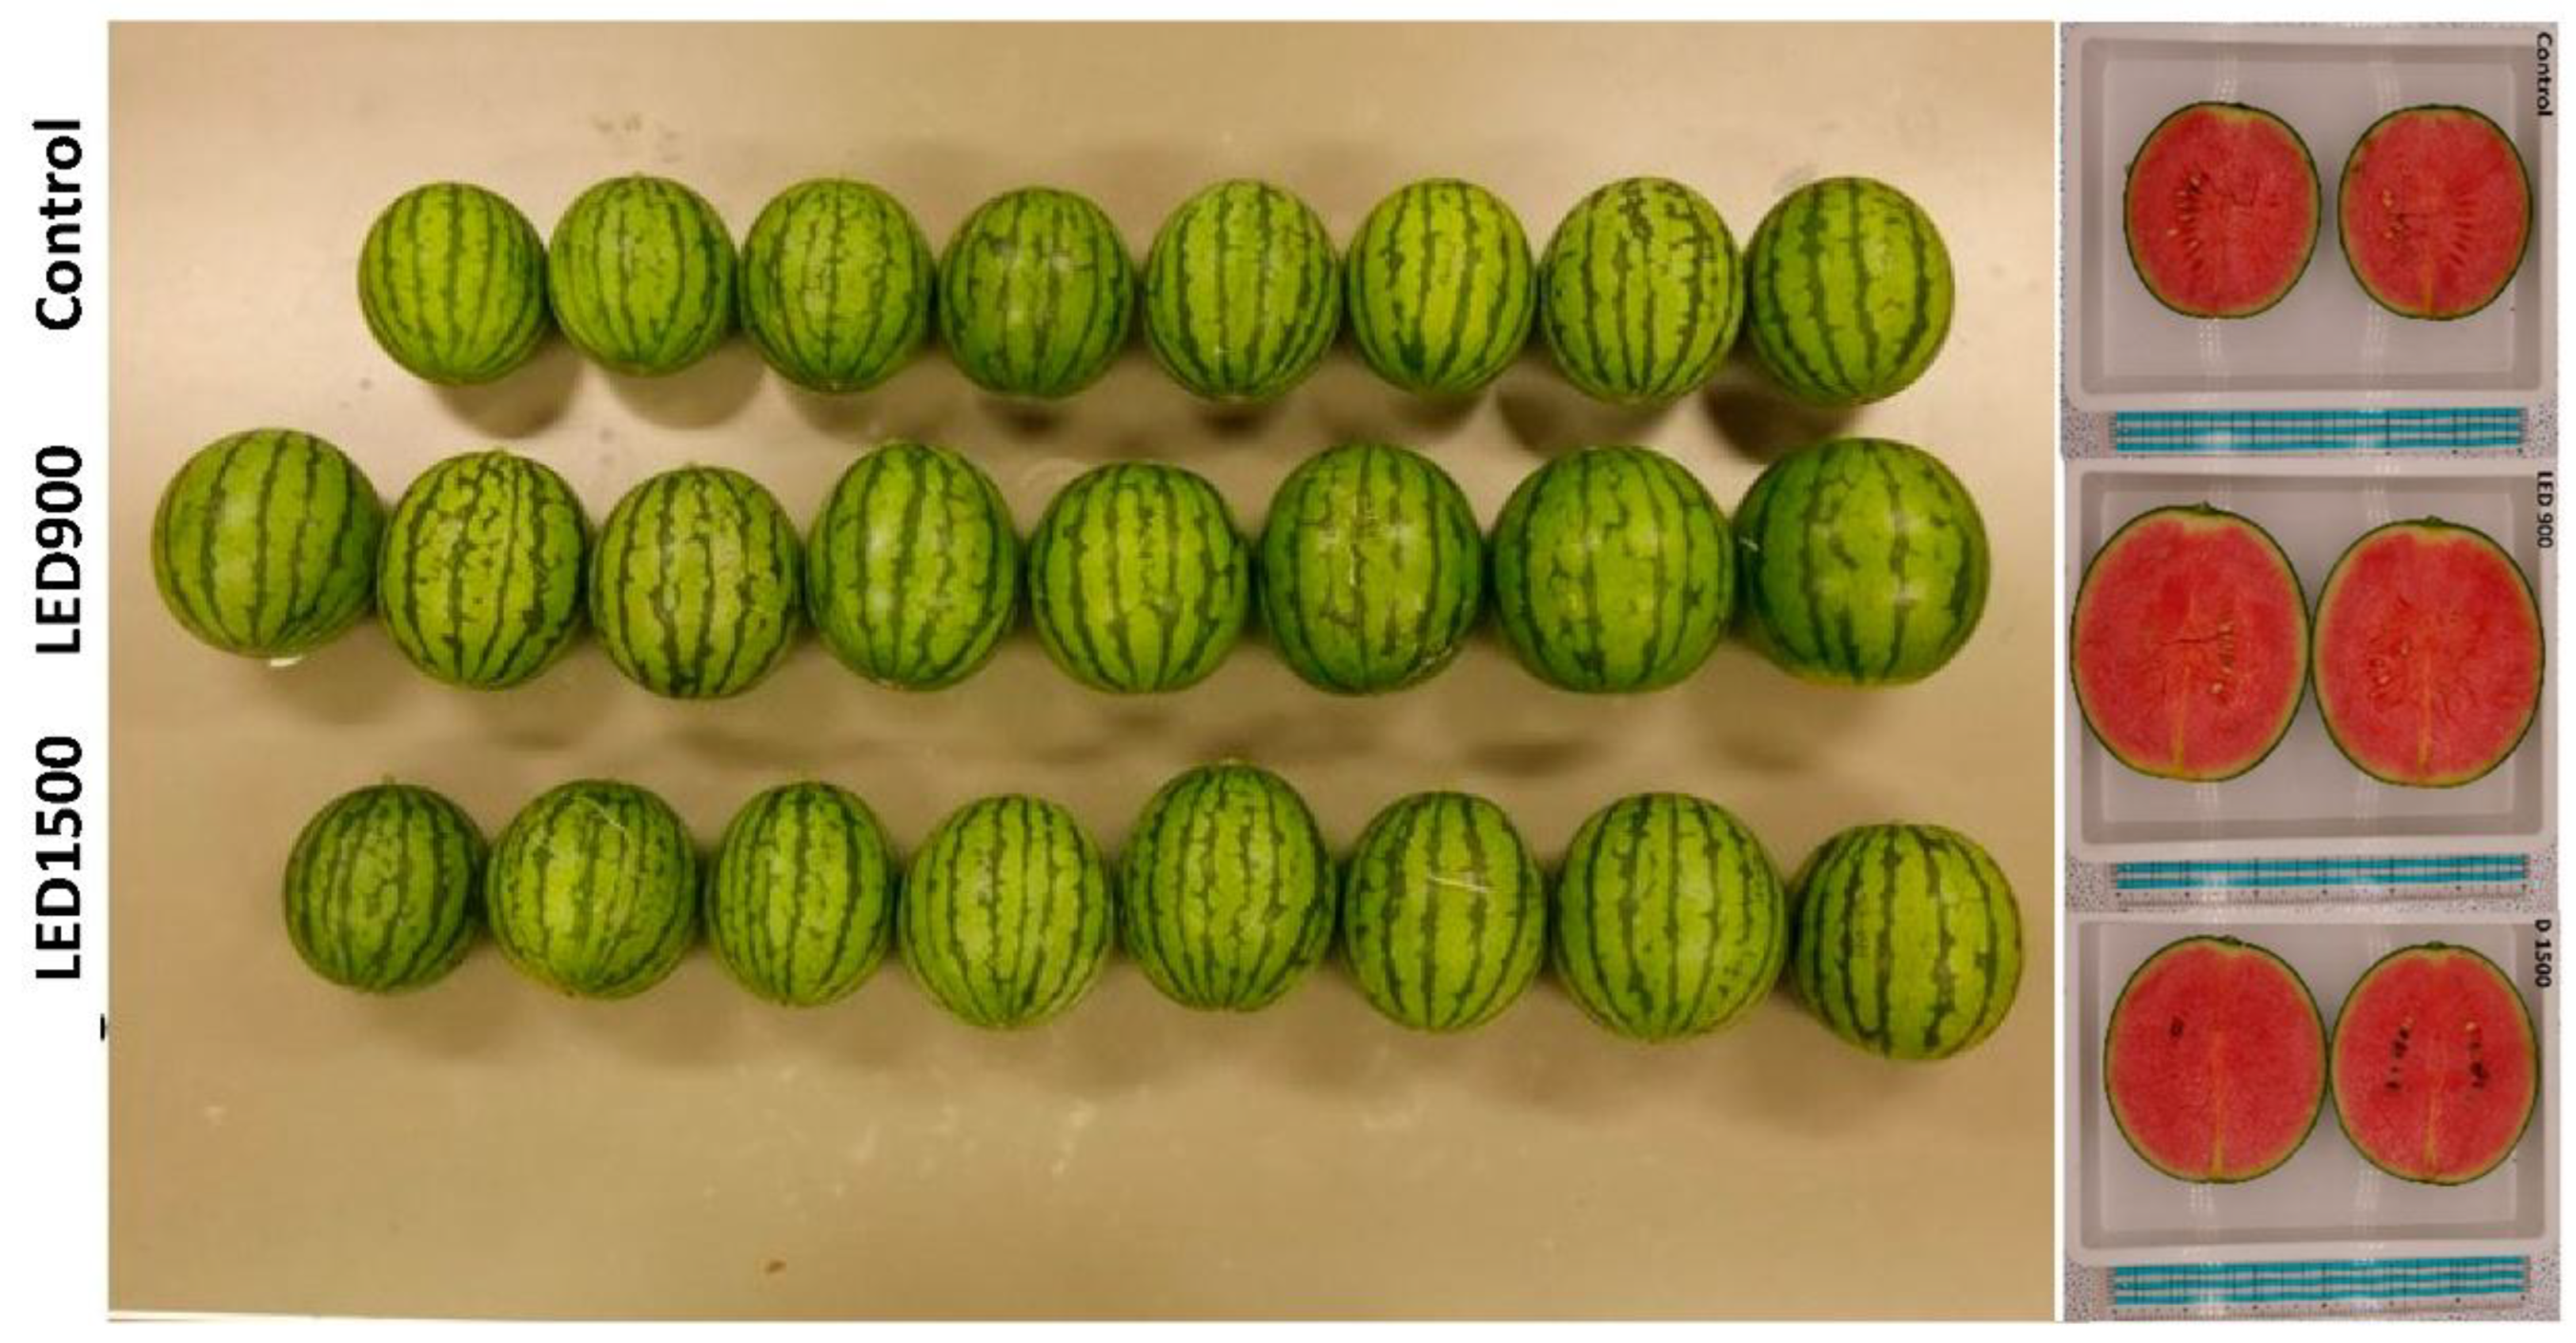
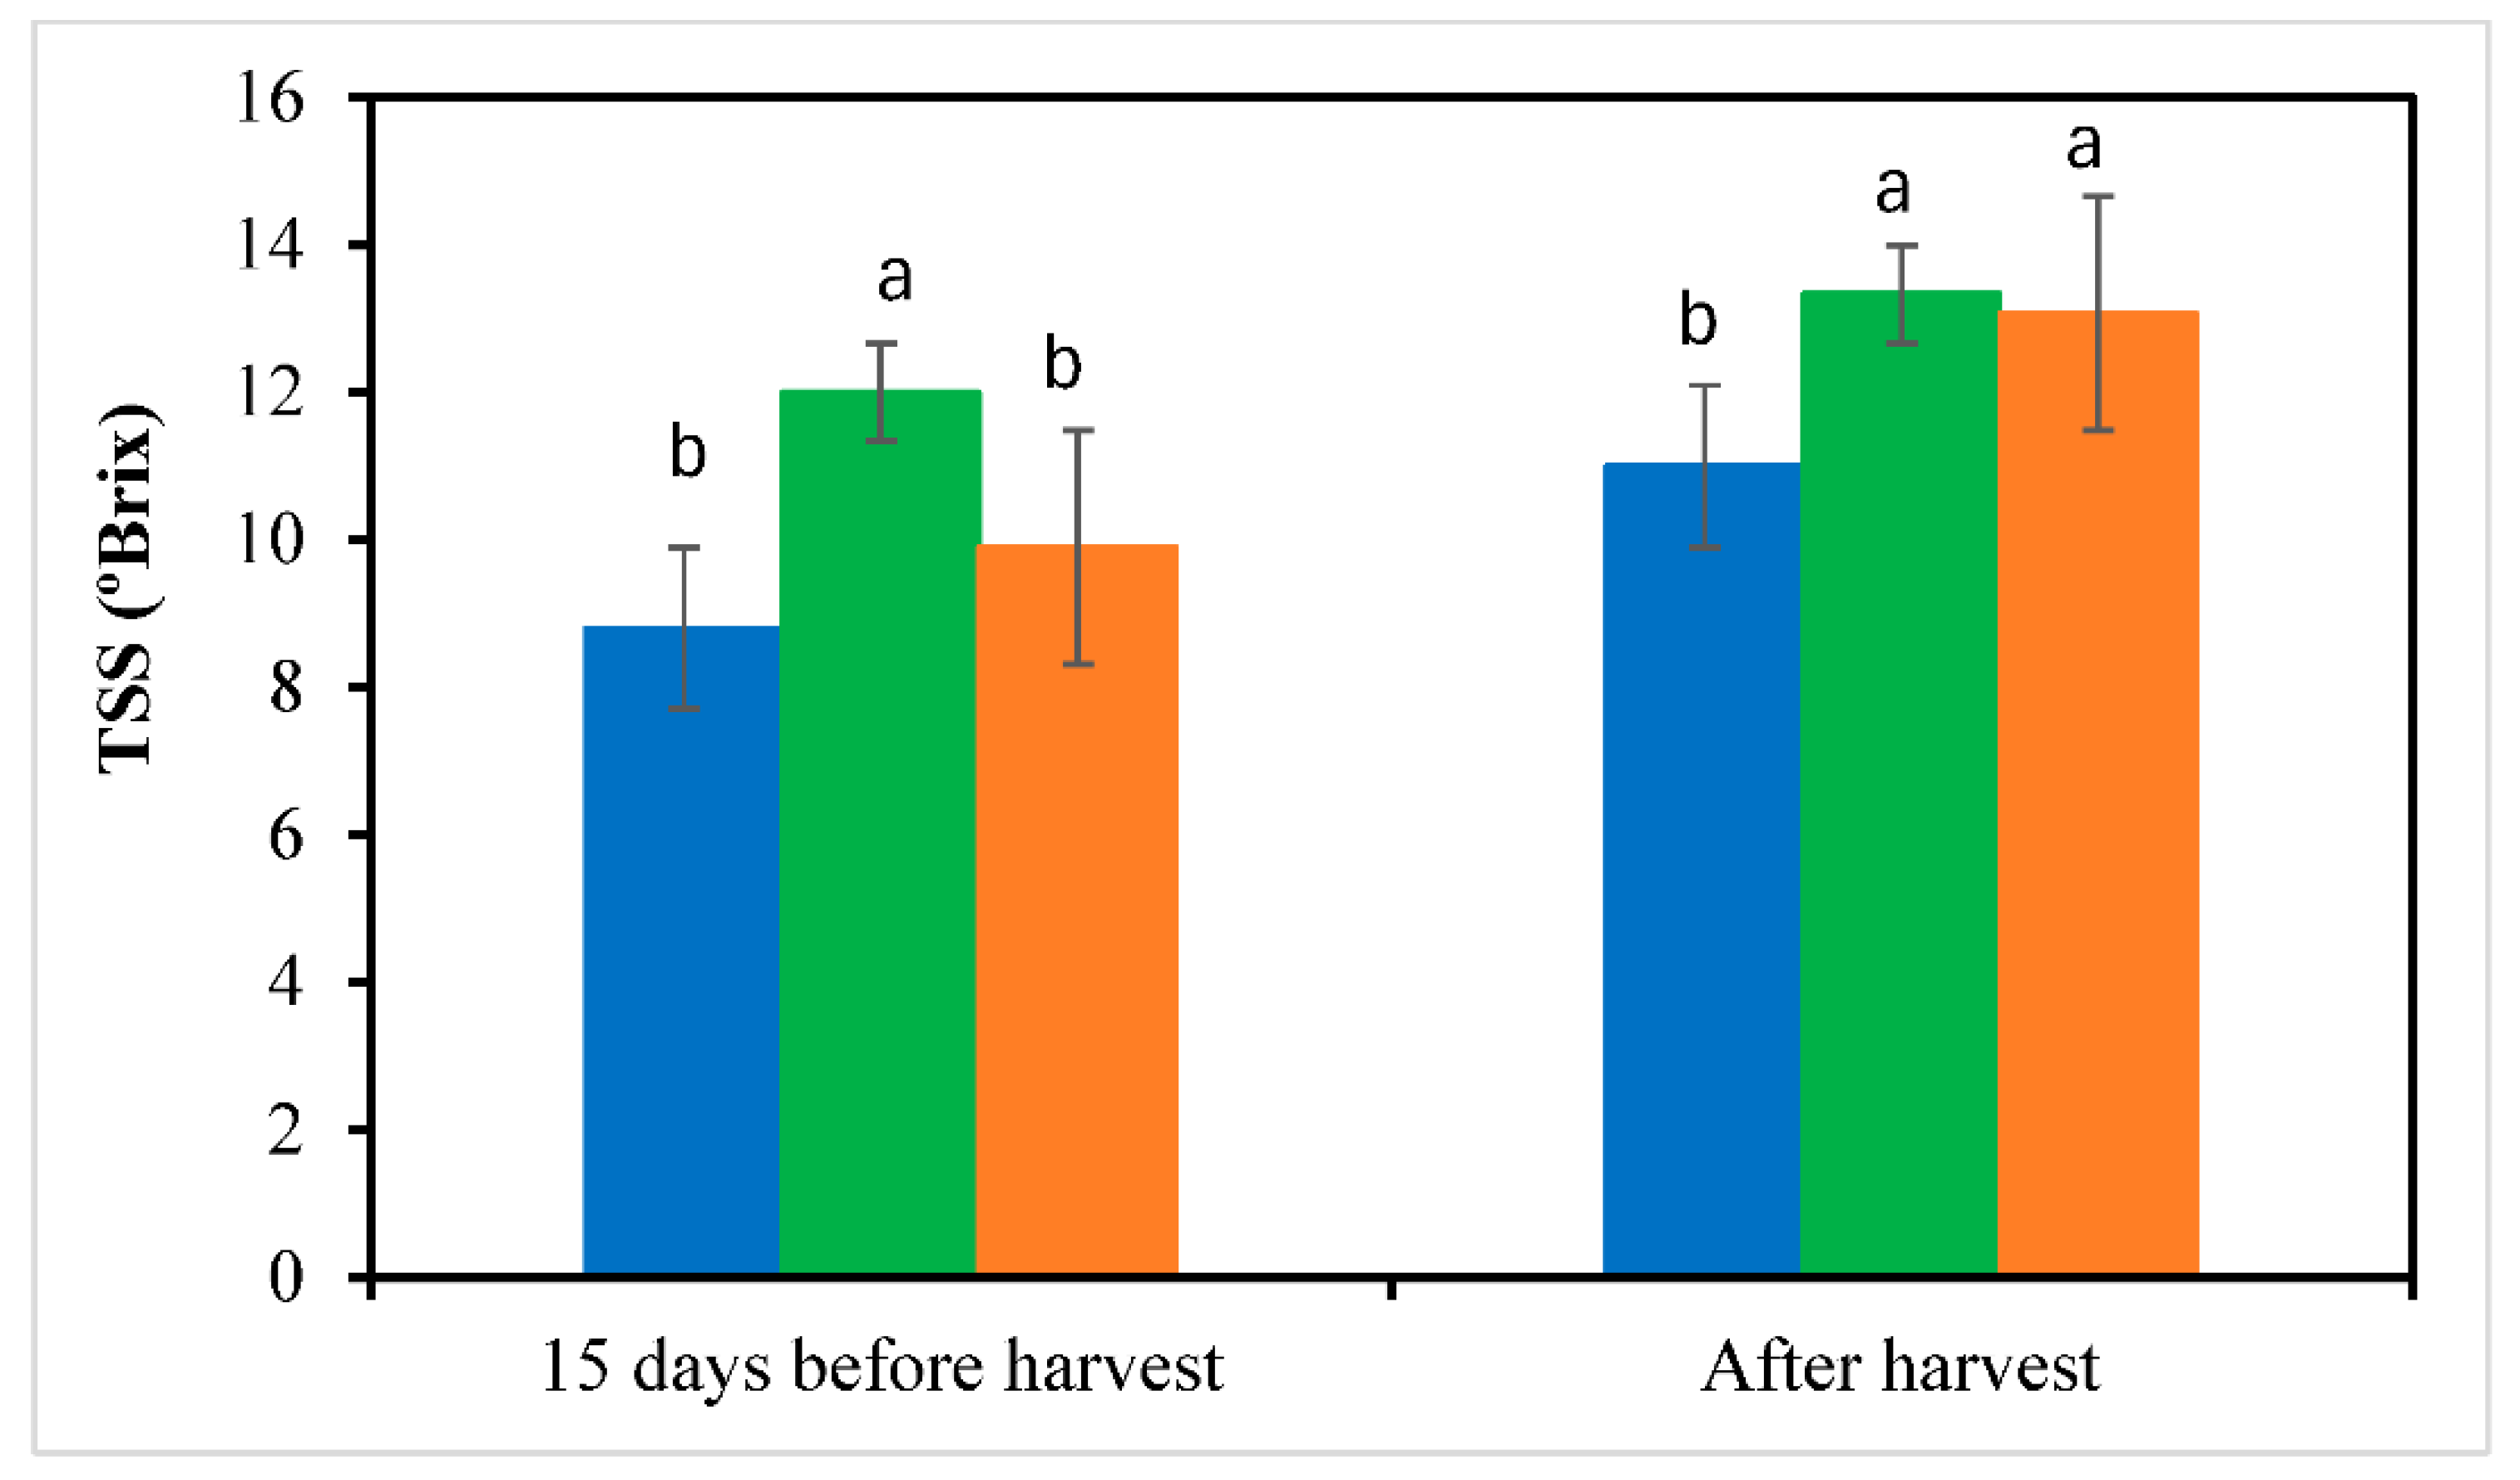
The effect of LED supplementary lighting at various intensities on winter-grown watermelon plants was evaluated to identify the optimal level for enhancing growth, yield, and quality. The plants were exposed to three lighting conditions: natural daylight (control) and LED supplementary lighting at 900 and 1500 µmol/m²/s, from 17:00 to 21:00. Supplemented LED lighting enhanced chlorophyll content, Ca2+ and Mg2+ in the leaves of fruit set region, leading to an increase in photosynthesis rate throughout the growing period and supporting consistent plant growth. The result showed that LED 900 µmol/m²/s significantly boosted the number of female flowers, fruit weight, size, and flesh thickness. Ultimately, the yield per plant increased by 31% under the LED at 900 µmol/m²/s and by 14% under the LED at 1500 µmol/m²/s compared to the control. Furthermore, high sugar and low acid contents were detected in the LED-treated fruits. These results indicate that fruits bore under LED lighting ripened faster than those in the control. In conclusion, supplemental LED lighting markedly contributes to watermelon production during winter, with a 900-µmol/m²/s LED light intensity outperforming 1500 µmol/m²/s in promoting plant growth and boosting the yield and quality.

Keywords: 
;  ;  ;  ;  ;  ;  ;  

1. Introduction

A popular and economically valuable fruit, watermelon (Citrullus lanatus), particularly small-fruited varieties, has gained increasing popularity in Japan in recent years owing to several essential health-related compounds such as lycopene, citrulline, arginine, and glutathione contained in its flesh [1,2]. It belongs to the Cucurbitaceae family and is traditionally grown in temperate and tropical regions [3]. From November to March in Japan, natural light intensity is insufficient for watermelon plants, necessitating the use of supplemental lighting. Therefore, commercial growers face considerable challenges in cultivating watermelons earlier than the optimal season. However, successfully growing watermelons in the winter presents an excellent opportunity for year-round production and achieving high market value.
Winter watermelon, a crop typically grown in warmer seasons, presents unique challenges when cultivated during the off-season in controlled environments. Ensuring optimal light conditions is critical for maximizing growth and fruit quality during the winter months. Light is the primary environmental factor regulating plant growth and development [4,5,6,7] due to its essentiality for photosynthetic and morphogenetic processes [8,9,10]. However, maintaining an optimal light environment inside greenhouses during the winter season is challenging due to insufficient natural daylight. Adjusting lighting inside greenhouses with supplementary lighting is essential for off-season watermelon cultivation. LED supplementary lighting serves as an enhancement tool for crop productivity under limited light conditions [11,12,13]. It promoted plant growth and morphology, chlorophyll content and photosynthesis, fruit yield and quality [14,15,16]. LED supplementary lighting with specific light intensity, wavelength, and duration affects plant growth and the overall yield and quality of crops [17,18,19,20].
Light intensity affects plant morphology and development [21]. During the fruit development stage, plants require high light intensity and extended periods of bright sunshine to maintain high productivity and quality. Supplemental LED lighting has been used as an efficient light source to meet this demand, especially during the winter season, and to produce better-quality tomatoes [22,23,24]. Utilizing LED lights with a balanced spectrum and appropriate wavelengths is crucial for plant growth and development. Controlling light quality or wavelength enables optimized yield and quality in spinach [25], chili [26].
This study aimed to determine the optimal intensity of supplemental lighting for growing higher-quality watermelons during the winter season. To this end, we investigated the effects of LED supplementary lighting at varying light intensities on chlorophyll formation, photosynthesis, growth, yield, and quality of winter watermelon in an artificial light-type greenhouse.

2. Materials and Methods

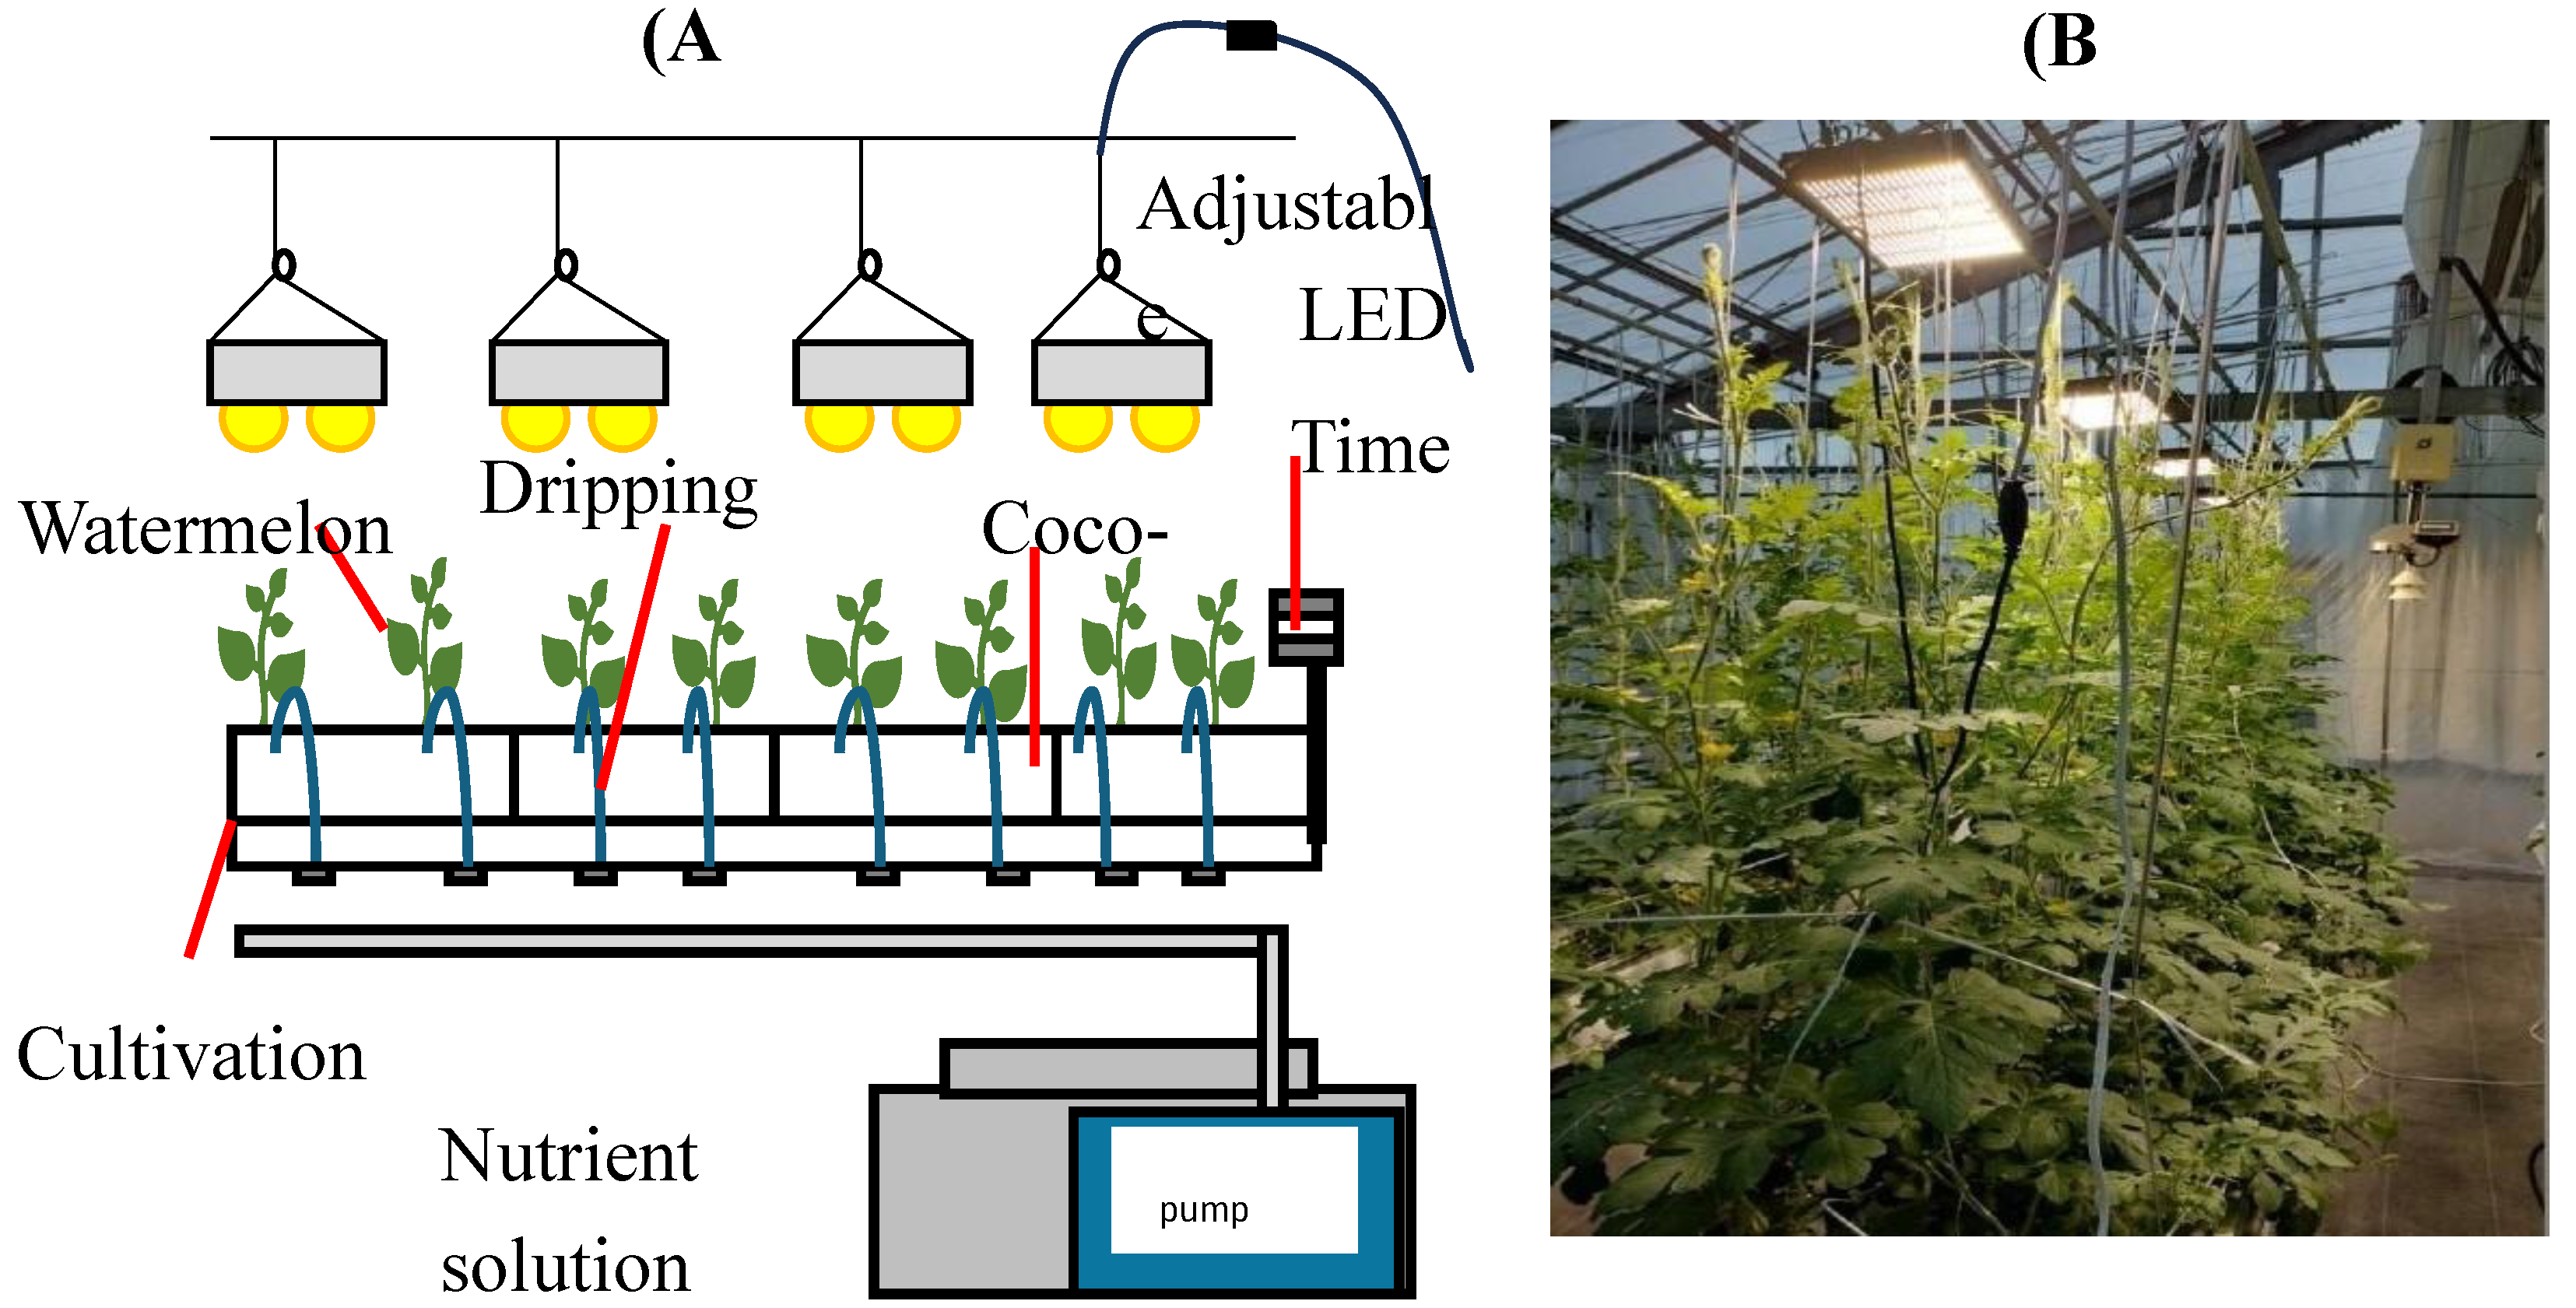
2.1. Plant Materials and Cultivation Conditions

The experiment was conducted in a controlled environment in a greenhouse in Japan from January 1 to May10, 2024, located at 33°16’50.7”N 130°18’09.9”E, at an altitude of 4.7 meters. On January 1, 2024, small-fruited watermelon seeds (cultivar: Hitorijime 7) were sown in a black plastic seedling pot (length 5.5 cm, upper portion 6 cm, and lower portion 4 cm in diameter). After sowing seeds, the seedling pots were kept at 24 °C and provided a 12-hour lighting period with a light intensity of 1500 µmol/m²/s. All seedlings were kept in the same environmental condition before transplanting. 20 days later, the same-size seedlings were transplanted into coco bags (ToyoTane Co. Ltd., Aichi, Japan; 90 cm in length, 18 cm in width, 5 cm in height, and weighing 3.5 kg) within the greenhouse using a vertical farming system (see Figure 1). Each coco-bag contained two plants, and the total number of plants was 24 while each treatments contained 8 plants.
The distance between plants was 40 cm, and the row length was 3.2 m. After transplanting, all the parameters inside greenhouse were also kept in the same condition except light condition. A heat pump was set to ensure that the greenhouse temperature did not drop below 16 °C at night. During the experiment, the total amount of light received was 321.01 mol/m²/s, with the average highest and lowest relative humidity of 45% and 12%, respectively. The climatic parameters for the experimental area were presented in Table 1.
The plants were drip irrigated with a complete nutrient solution based on Japanese standardized recommendations Enshi shoho solution [27] containing: 991.23 ppm NO3 from Ca (NO3)2.4H2O, 23.84 ppm NH4+ and 125.48 ppm P from NH4H2PO4, 312.49 ppm K from KNO3, 160.62 ppm Ca from Ca (NO3)2, 48.53 ppm Mg and 192.64 ppm SO4 from MgSO4. Trace elements nutritional concentrations were as follows: 3.18 ppm Fe from Iron (Fe) EDTA chelate, 0.456 ppm Mn and 0.05 ppm Zn from Manganese (Mn) EDTA chelate and Zinc (Zn) EDTA chelate, respectively, 0.52 ppm B from H3BO3, 0.01 ppm Cu from Cupper (Cu) EDTA chelate, and 0.007 Mo from Na2MoO4.
In the nutrient solution, there was 2.20 mS cm−1 electrical conductivity with a pH of 5.80–6.20 were maintained during the growing season. When the ninth leaf was produced, the top of each plant was cut to promote branching aimed at maintaining four branches per plant. The plants flowered 21–25 days after transplanting and were hand pollinated to set the fruits. Two fruits were maintained on each plant. Three fruits from each treatment were harvested for quality evaluation 30 days after pollination, but the final harvest was done 45 days after pollination on 10 May 2024.

2.2. Experimental Design and Supplementary LED Lighting Treatment

A completely randomized design (CRD) was employed to evaluate the effects of different supplementary lighting on watermelon growth and quality. The plants were exposed to LED supplemental light for 4 hours daily, from 17:00 to 21:00. (supplementary Figure 2). Three treatments were used: no light (control) and supplementary lighting at 900 and 1500 µmol/m²/s, with eight plants in each treatment. Supplemental lighting was applied daily, from transplanting until harvest. Figure 1 shows the method of supplying supplemental lighting and nutrients. Light intensity was measured from the canopy top using a Light Meter (C-LI190R, LICORbio, Nebraska, USA). LED light was supplied by the W-MAX 2000 with dimensions of 310 × 210 × 46 mm (SMARUP brand, Co., Ltd., Japan; product dimensions: 31 L × 21 W × 4.6 H cm). LEDs were moved as plants grew to maintain the same light intensity.

2.3. Methods of Sampling and Measurement

Light volume was measured using an OptoLeaf D-Meter RYO-470M (Taisei Fine Chemical, Asahi, Japan). Temperature and relative humidity were recorded with a wireless thermos recorder, RTR503B (T & D Corporation, Matsumoto, Japan) during the growing season. The chlorophyll content of the 9th leaf from the apical tip was determined using a chlorophyll meter (SPAD-502 Plus Konica Minolta, Inc., Tokyo, Japan) at seven-day intervals. The photosynthesis rate (µmol/m²/s) was measured during the fruit setting stage and 15 days after fruit set using a Quick Photosynthesis Measurement Instrument (MIC-100X, Masa Int., Kyoto, Japan). Measurement was performed from12.00 to 13.00 with 1200 to 1500 PPFD while CO2 concentration was 400 to 450 mmol/m²/s.
Phenotypic data on various growth parameters and fruit characteristics, including plant height, were measured using a metric ruler from 15 days after transplanting until the harvesting stage at 15-day intervals. The number of nodes and total leaf area of a plant were measured two times, 30 days before harvest and harvesting stage. The stem thickness at the fruit set node 30 days before harvest and at the harvesting stage, fruit diameter at seven-day intervals, peel and flesh thickness, and female flower ovary length were measured using a Digi Matic Caliper (Mitutoyo, Kawasaki, Japan). The number of leaves at 30 days before the harvest and harvesting stage and the number of male and female flowers were counted. At harvest, fruit weight, fresh weight of shoot, and dry weight of shoot were measured. Sugar and acid contents were measured using a Brix-Acidity Meter (PAL-BX or ACID F5, Atago, Tokyo, Japan). Juice pH was measured using a Personal PH/ORP meter (PH72, Yokogawa, Tokyo). We collected leaf samples (the leaf of the fruit set node and the upper and lower leaf of the fruit set node) to estimate the Ca2+ and Mg2+ contents. The fresh weight of the leaves was measured, and the leaves were placed in a bag and dried at 70 °C for three days. After drying, the leaves were removed from the bag, and their dry weight was measured. The dried leaves were then ground into a fine powder using a mortar and pestle. Subsequently, 0.5 g of the powdered leaf sample was subjected to nitrate decomposition with 0.1 M nitric acid. After decomposition, an atomic absorption spectrophotometer (SOLAAR M6, Thermo Fisher Scientific, England) was used to measure Ca2+ and Mg2+ concentrations.

2.4. Statistical Analysis

Data was analyzed using the JMP statistical package (SAS Institute, Cary, NC, USA). Significant differences among treatments were determined by analysis of variance (ANOVA). Tukey’s multiple range test was used to evaluate treatment effects and conduct comparisons, while the least significant difference (LSD) test at p ≤ 0.05 was used.

3. Results

3.1. Determining Light Intensity and Environmental Conditions in Greenhouses

A preliminary experiment was conducted to assess the effectiveness of LED supplemental lighting at different light intensities on watermelon growth during the winter season. The experiment involved four treatments: no LED (control), 600, 900, and 1200 µmol/m²/s. Each treatment included six plants. Light was provided daily for four hours, from 17:00 to 21:00. (Fig.S1). This experiment lasted one month, starting from transplanting on November 10, 2023. We collected growth and morphological data, including plant height, shoot weight, root weight, root length, node number, leaf number, stem diameter, and leaf area (Table 2).
Significant differences were observed between the control and supplementary lighting treatments. Specifically, the LED-900 µmol/m²/s treatment resulted in the highest values for all measured parameters, while the control exhibited the lowest values. LED lighting at 1200 µmol/m²/s was similar to LED 900 µmol/m²/s for most parameters, while LED 600 µmol/m²/s was comparable to the control. These results indicate that LED supplemental lighting at approximately 900 µmol/m²/s is a critical factor for growing higher-quality watermelons in winter.
The main experiments were conducted using two LED light intensities: 900 and 1500 µmol/m²/s. (Fig.S2). Based on the preliminary experiment results, 900 µmol/m²/s was initially selected. The decision to include 1500 µmol/m²/s was based on the hypothesis that a higher light intensity may benefit fruit development, as strong light is generally known to support watermelon growth. However, since the preliminary experiment ended before flowering, we included the 1500 µmol/m²/s treatment in the main experiment.
The total light volumes from pollination to 35 days after pollination were 191.8, 232.8, and 251.5 mol/m² for the control, LED-900, and LED-1500 treatments, respectively. The average daily maximum and minimum temperatures inside the greenhouse were 37.8 °C and 16.2 °C, respectively.

3.2. Plant Growth and Morphology

The LED supplementary lighting-treated plants exhibited significantly increased height compared to the control (Figure 2). Within 30 days after planting (DAP), plant height was similar among the LED-treated and control plants. However, at 45 DAP, LED-treated plants grew faster than control plants. Ultimately, plant height was 1.34 timgreater with LED 900 and 1.22 times greater with LED 1500 compared to the control.
Fresh and dry weights increased significantly in LED-treated plants compared to control plants (Table 3).
Other growth characteristics, including the number of leaves, number of nodes, stem diameter at the fruit set node, leaf length, and leaf area, were measured to assess the positive effects of LED exposure on height and other traits (Table 3). From 56 to 86 DAP, leaf and node counts increased respectively to 93 and 93 in the control, 120 and 145 with LED 900 µmol/m²/s, and 110 and 123 with LED 1500 µmol/m²/s. The rates of increase in leaf and node counts were respectively 1.29 and 1.55 times higher with LED 900 µmol/m²/s, and 1.18 and 1.32 times higher with LED 1500 µmol/m²/s compared to the control. At both stages, the stem thickness at the fruit set node was highest with LED 900 µmol/m²/s (6.84 and 10.41 mm) compared to the control (5.19 and 8.32 mm) and LED 1500 µmol/m²/s (6.09 and 9.90 mm). From 56 to 86 DAP, the stem thickness at the fruit set node increased 1.14 and 1.22 times with LED 900 and LED 1500 µmol/m²/s, respectively, compared to the control. The important growth parameter, leaf area, was also highest with LED 900 µmol/m²/s at both 56 and 86 DAPs (236.32 and 190.37 cm² plant⁻¹) compared to the control (187.65 and 128.63 cm² plant⁻¹) and LED 1500 (226.19 and 151.35 cm² plant⁻¹). Overall, LED-treated plants outperformed the control plants in all growth characteristics at both 56 and 86 DAPs. In particular, plants treated with LED 900 µmol/m²/s showed significant differences in all aspects compared to the control plants. In contrast, plants treated with LED 1500 µmol/m²/s did not show significant differences from the control plants in stem diameter and leaf length.
Plants treated with LED light at 900 and 1500 µmol/m²/s produced the highest and second highest numbers of female flowers, with counts of 18 and 16, respectively, compared to 13 in the controls exposed to natural daylight (Figure 3). The average ovary lengths were 14.8 and 15 mm for plants treated with LED 900 and LED 1500 µmol/m²/s, respectively, compared to 6.4 mm for the control. The number of male flowers per plant was 112 in the control and 104 and 107 for plants treated with LED 900 and LED 1500 µmol/m²/s, respectively, with no significant differences observed among the treatments (data not shown).

3.3. Leaf Chlorophyll Content and Photosynthesis

The chlorophyll content of the 9th leaf from the apical tip was recorded at 15-day intervals, showing significant variations between the control and LED supplementary lighting treatments (Figure 4). LED 900 and LED 1500 µmol/m²/s treatments showed no significant differences. At 45 DAP, during the growth stage, the highest chlorophyll content was observed in plants treated with LED 1500 (75.3 SPAD units) and LED 900 (75.0 SPAD units), while the control had the lowest content (57.7 SPAD units). Chlorophyll content gradually decreased during fruit development until the harvest stage.
Measurements of the photosynthesis rate at pollination and 15 days after pollination showed a significant increase in the photosynthesis rate 15 days after pollination compared to the rate at pollination. At both stages, the LED-treated plants exhibited notably higher photosynthesis rates than the control. While the photosynthesis rate increased by 50% and 45% at pollination in plants treated with LED 900 and LED 1500 µmol/m²/s, it increased by 64% and 51% 15 days after pollination in plants treated with LED 900 and LED 1500 µmol/m²/s, respectively, compared to the control (Figure 5).

3.4. Ca2+ and Mg2+ Content in the Leaves of the Fruit Set Region

The fruit set region, including three leaves at the fruit set node, is critical for fruit development, and adequate nutrient supply to this region is necessary for optimal fruit growth and quality [19]. By analyzing Ca2+ and Mg2+ ion levels, we can assess the plant’s nutrient uptake efficiency and overall health, which are critical for optimizing growth conditions and improving the quality and yield of crops like winter watermelon. The LED supplementary lighting treatment showed high accumulation of Ca2+ and Mg2+ ions with significant variations in different leaves emerging from fruit set nodes (Figure 6).
The LED-treated plants had a significantly higher Ca²⁺ content than the controls across all leaves. Specifically, it was 3.3–3.5 times greater than that of the controls in the first lower leaves of the fruit set node. The Mg²⁺ content in LED-treated plants was not lower than in the controls, although the difference in Mg²⁺ content between LED-treated and control plants was less pronounced compared to the variation observed for Ca²⁺.

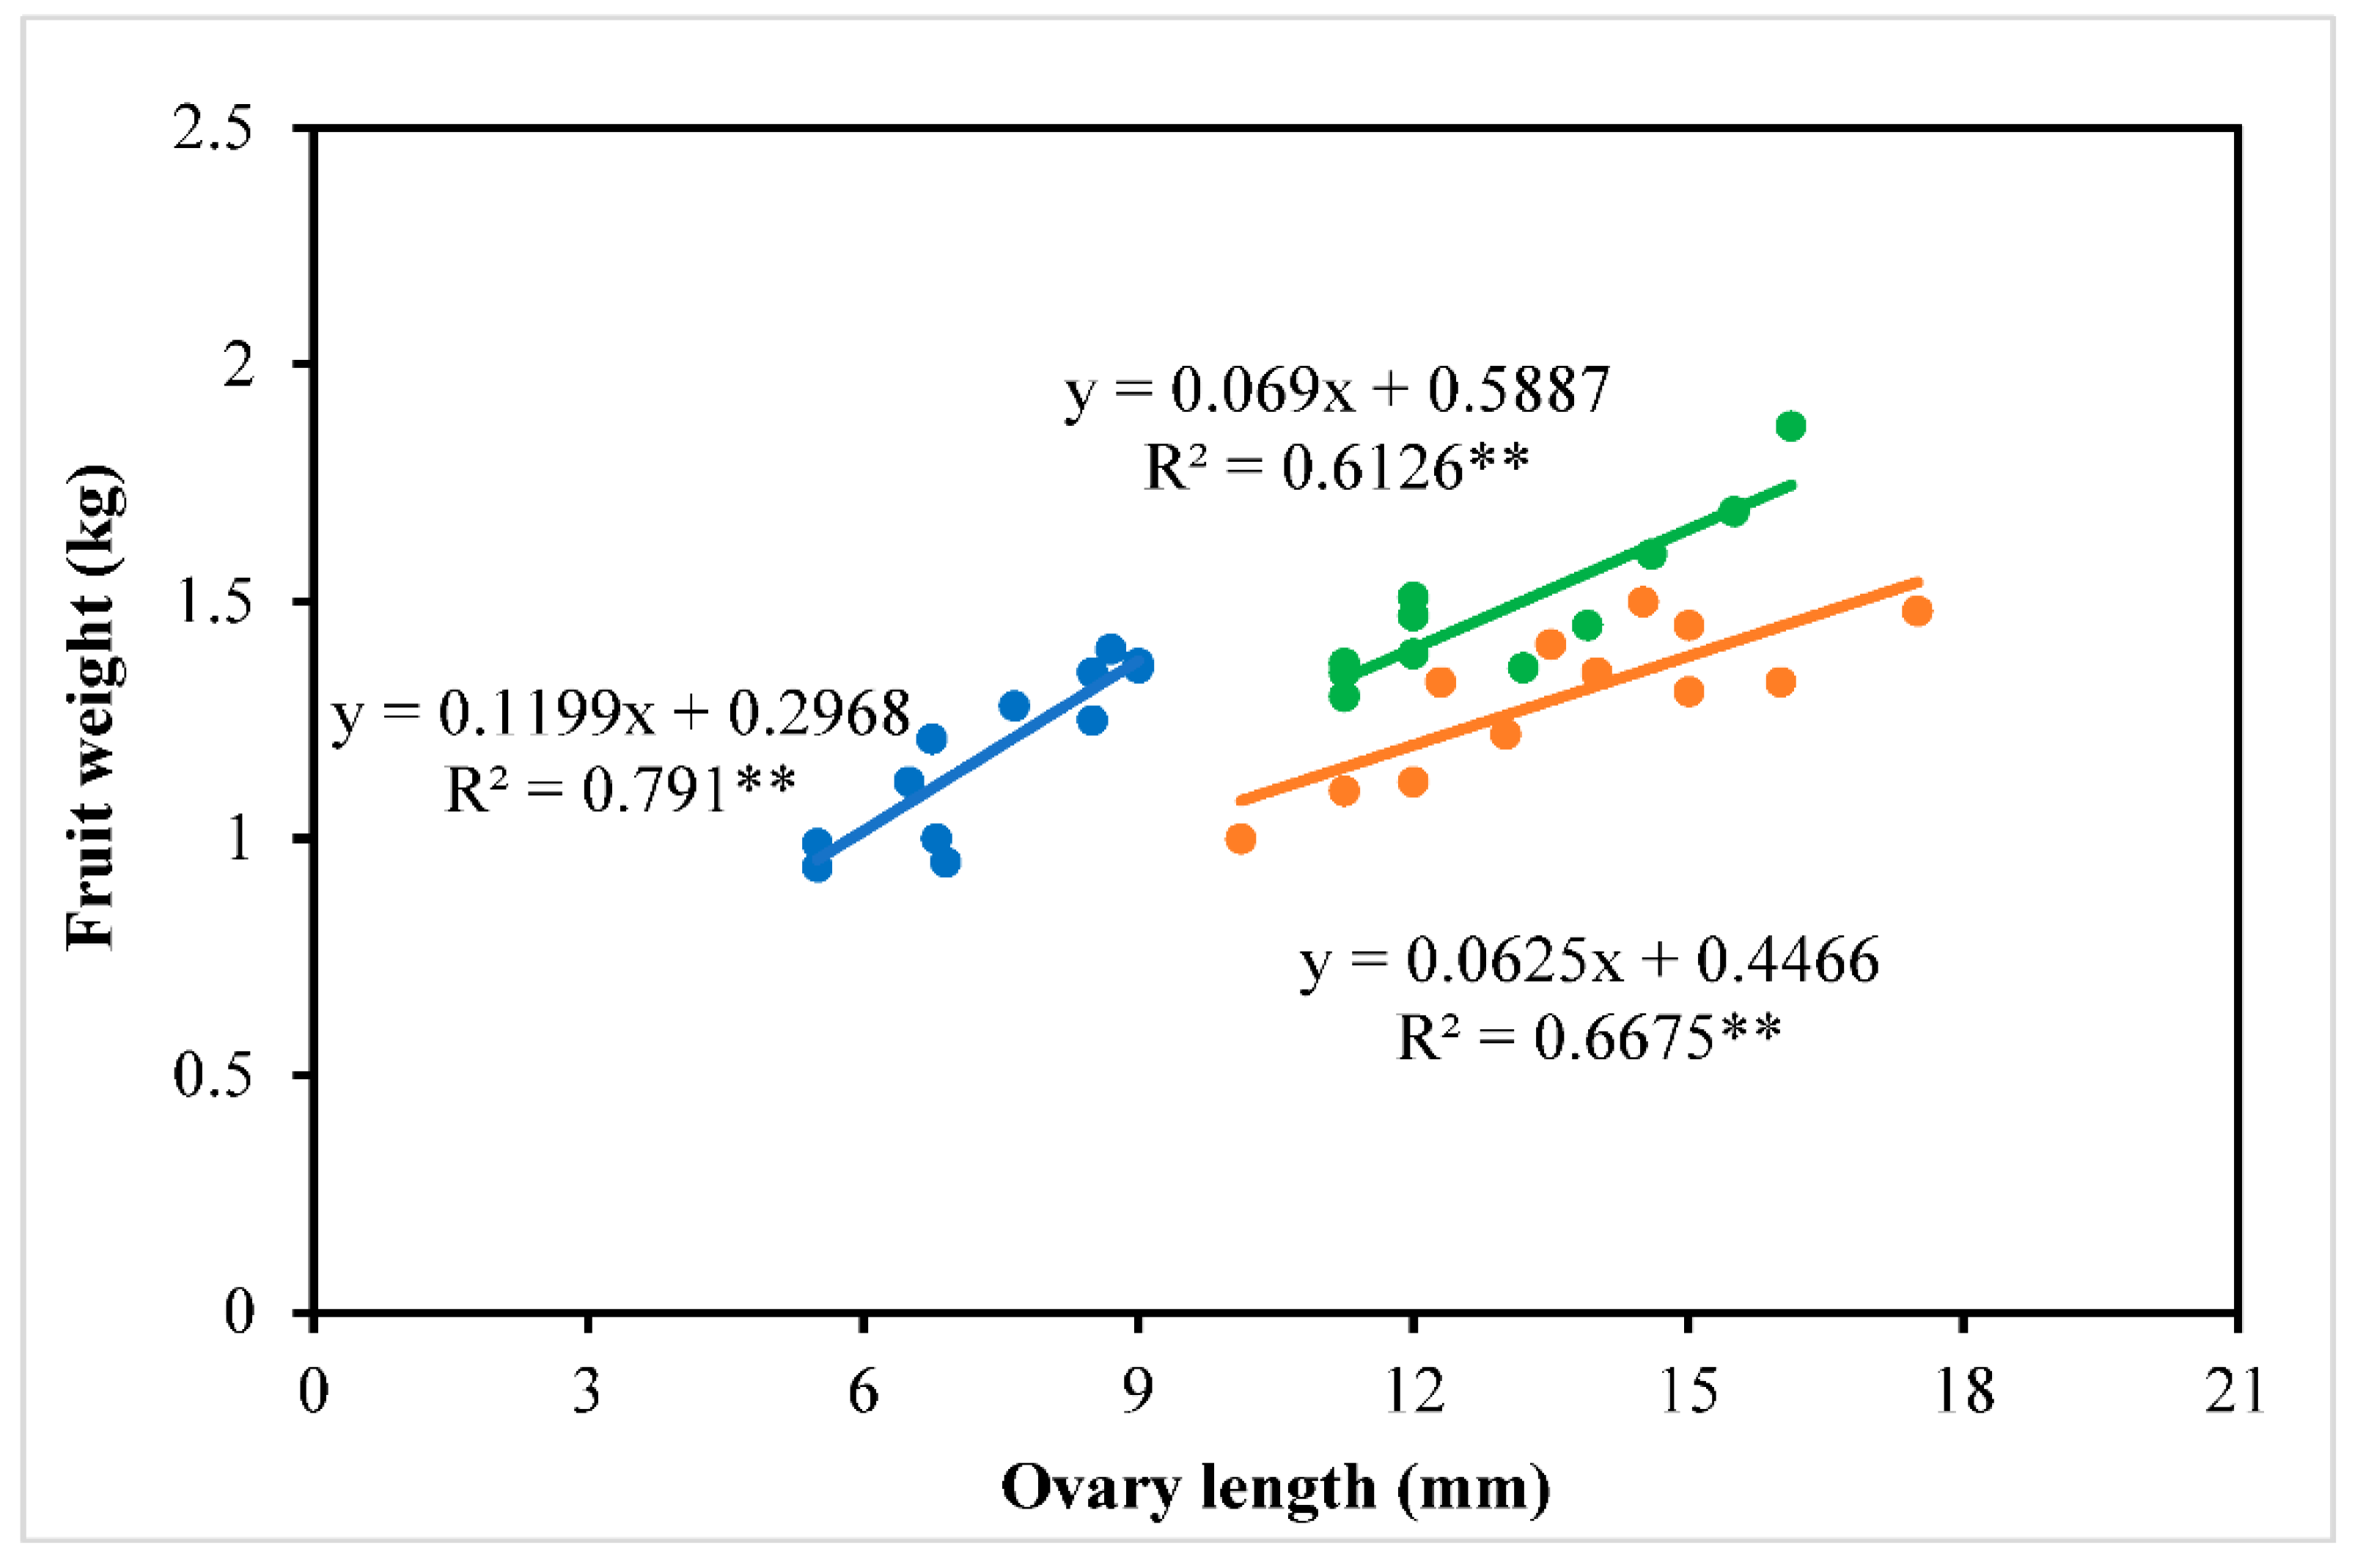
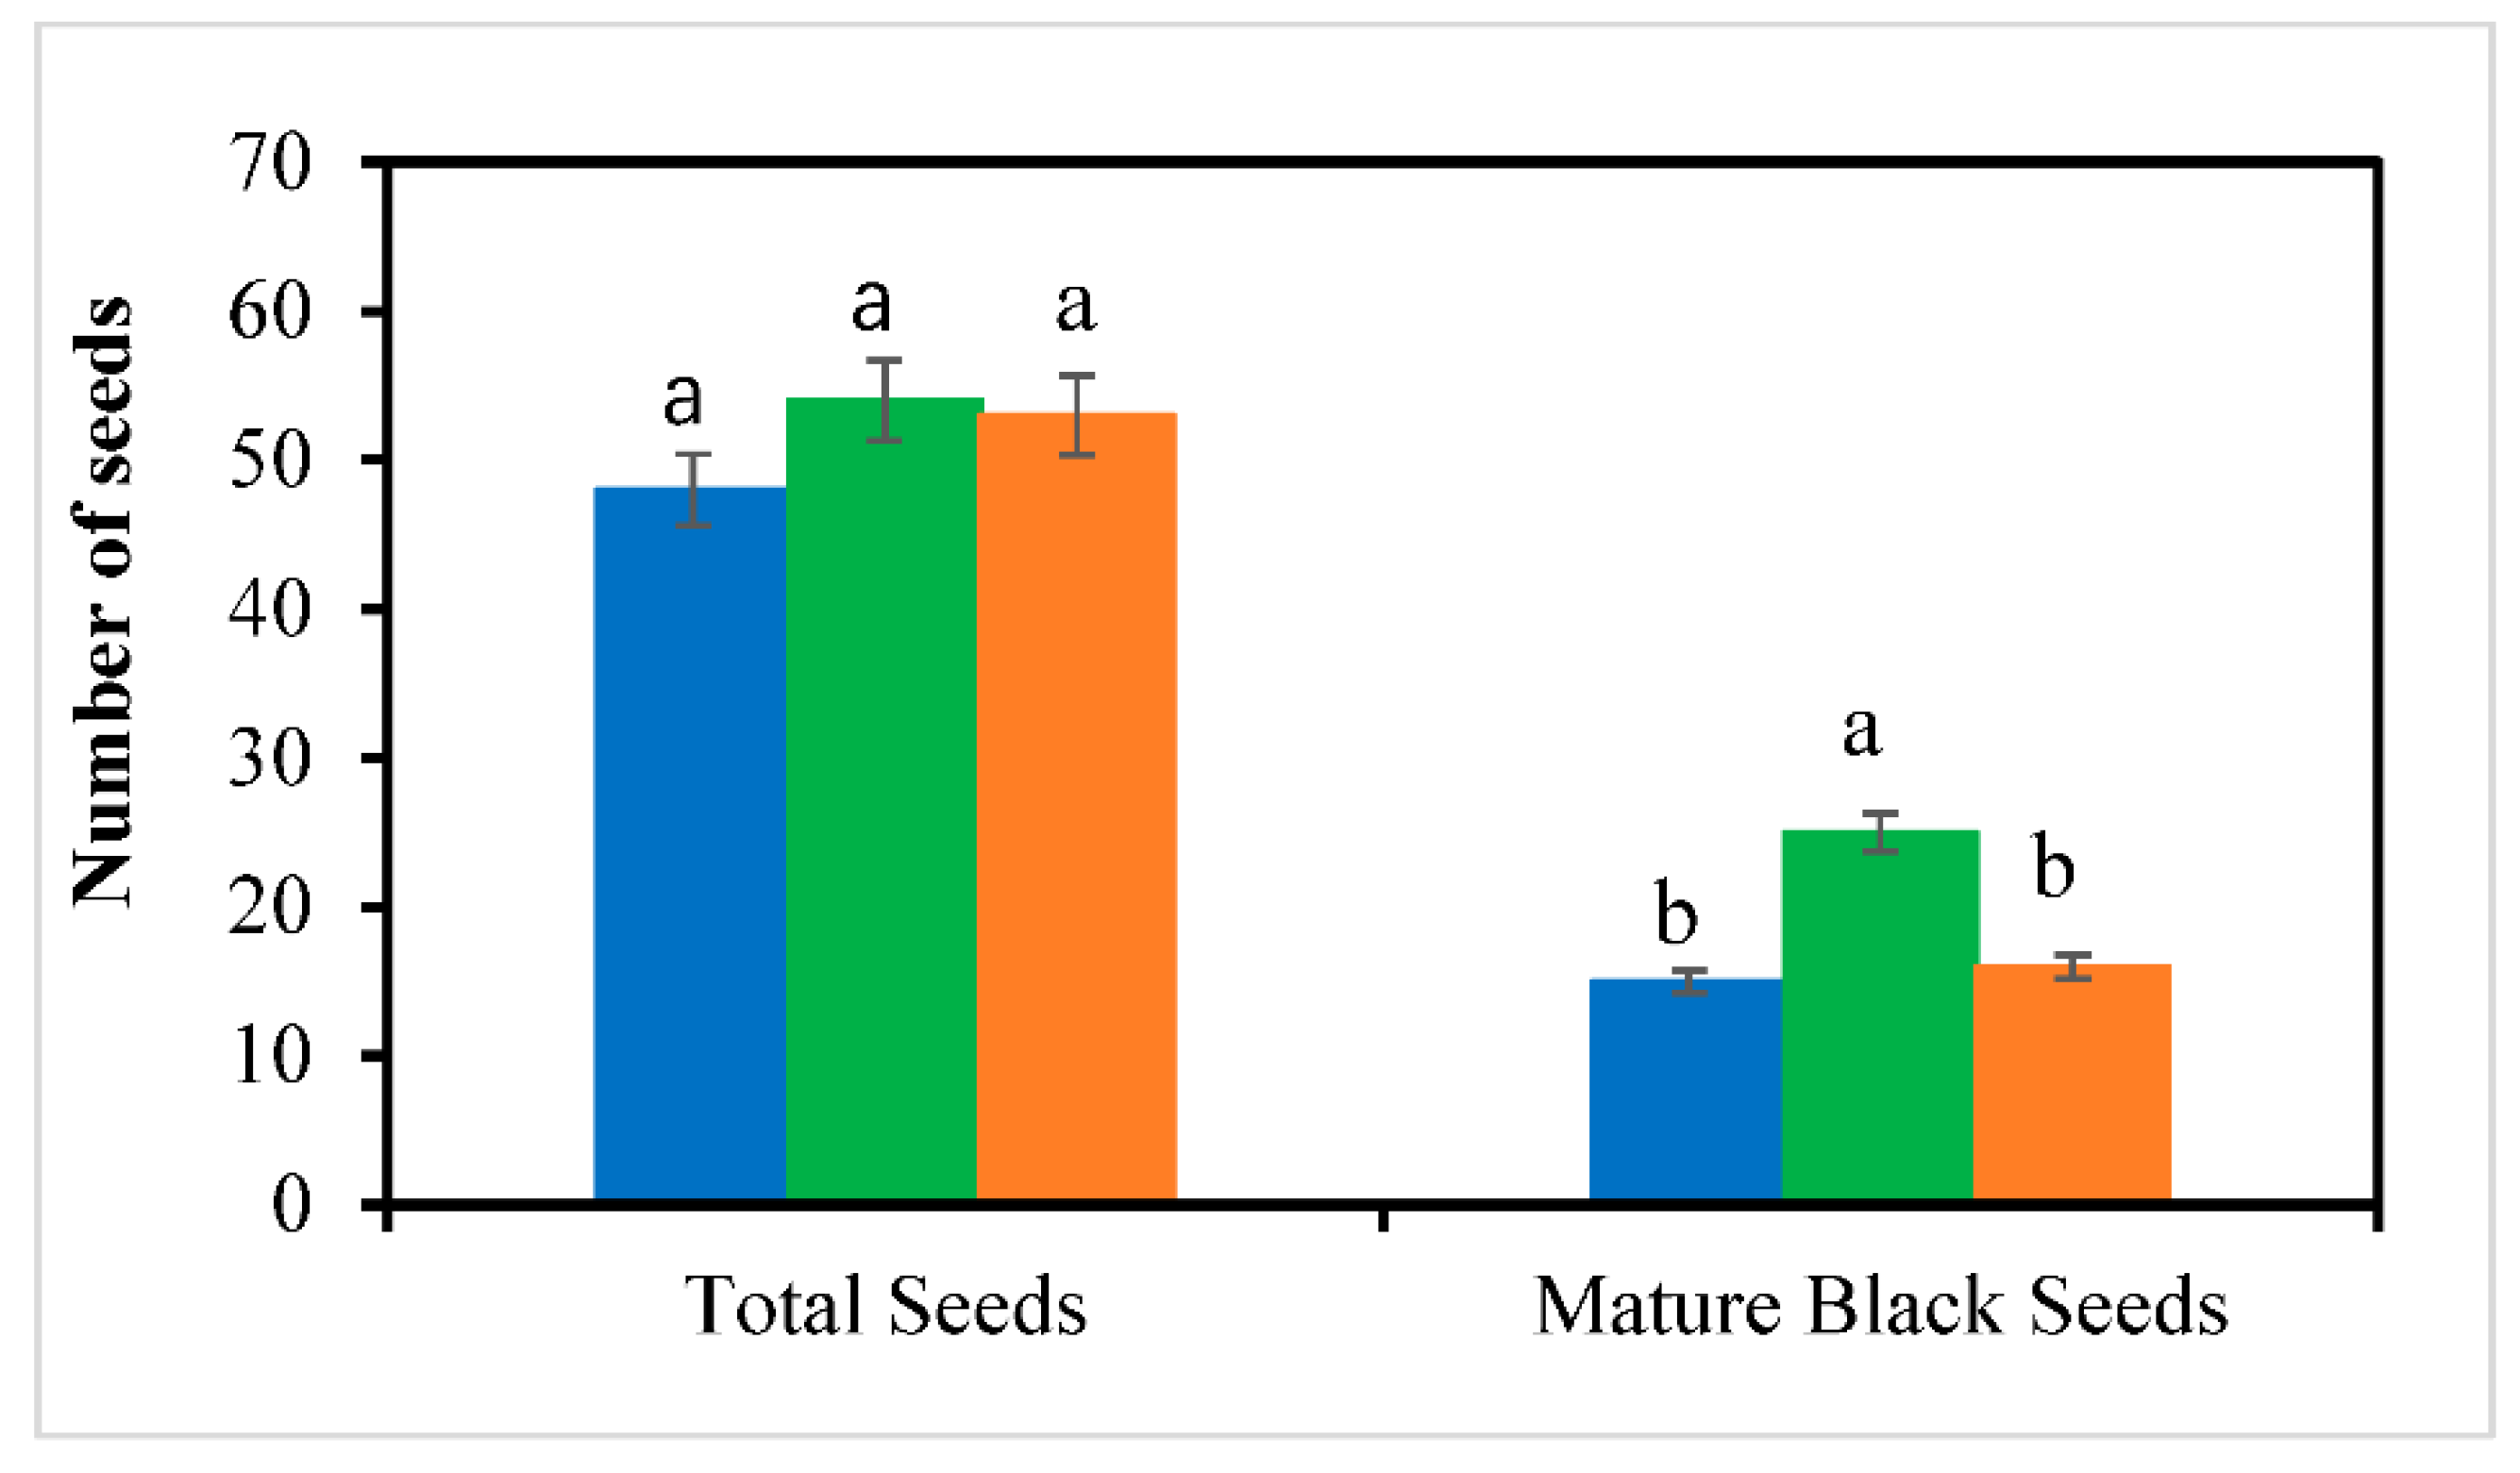
3.5. Fruit Yield and Quality

The primary focus of this study was fruit diameter, which was measured at 7-day intervals from fruit set to harvest (Figure 7). Within the 28 days following pollination, the fruit diameter increased rapidly in LED-1500-treated plants, while LED-900 and control plants showed similar growth. By 35 days after pollination, the fruit diameter in LED-900-treated plants increased rapidly, resulting in significant differences compared to the control. At 48 days post-pollination, which corresponds to harvest time, fruit diameter had increased by 118% in LED-900-treated plants and 113% in LED-1500-treated plants compared to the control. Figure 8 shows the relationship between ovary length and fruit weight from the same ovary after harvest, indicating a positive and significant correlation between both parameters, regardless of the treatment.
After harvesting, we measured individual fruit weight and fruit weight per plant (yield) and found significant differences among the treatments (Table 4). LED-900-treated and LED-1500-treated plants produced 1.32 and 1.14 times more fruit per plant (yield) compared to the control, respectively (Table 4). Figure 9 shows the internal and external appearance of the fruits from the three treatments.
While the total number of seeds did not differ among the treatments, the number of mature black seeds was higher in the LED-900-treated plants compared to the other treatments (Figure 10).
The sugar content (°Brix) in fruits from LED-900-treated plants was significantly higher than in those from other treatments at 15 days before harvest. By harvest time, the sugar content in fruits from LED-1500-treated plants was comparable to that in fruits from LED-900-treated plants (Figure 11) Juice pH did not differ significantly among the treatments.
As the fruit ripened, pH increased, acid content decreased, and peel thickness decreased in all treatments; however, these changes were most pronounced in the LED-900-treated plants (Table 4).

4. Discussion

4.1. LEDs Accelerate Early Growth and Have a Positive Effect Later on

Investigating chlorophyll content and photosynthesis is essential due to the strong correlation between chlorophyll content, photosynthesis efficiency, and plant growth [28,29]. Higher chlorophyll content and efficient photosynthesis typically lead to better growth, higher biomass, and improved yield. LED supplementary lighting can considerably impact both chlorophyll synthesis and photosynthesis rates. The LED-induced increase in light volume triggered higher photosynthetic rates (Figure 5) due to an increase in chlorophyll content (Figure 4) and Mg²⁺ ions (Figure 6), which are essential components of chlorophyll and photosynthesis, and are integral elements for the growth of most horticultural crops [30]. LED supplementary lighting proved effective in maintaining chlorophyll content (Figure 4), corroborating the findings [15,31]. These authors showed that LED treatment maintained higher chlorophyll content and photosynthetic rates throughout the vegetative and fruit development stages in melon. A positive correlation exists among photosynthesis, LED supplementary lighting, plant growth, and overall yield, aligning with findings from studies on various crops [32,33,34,35,36]. The early growth of the plant was accelerated with LED supplementary lighting, and the positive effects continued into the later stages of growth (Figure 2), resulting in an increased female flower count (Figure 3) and larger ovaries. A positive correlation was observed between ovary length and fruit weight, with larger ovaries tending to produce larger fruits (Figure 8). Additionally, fruits from LED-treated plants, particularly those from the LED900 treatment, matured earlier than those from the other treatments. The Brix sugar content showed minimal change between 15 days before harvest and harvest time in the LED-900-treated plants, while it increased more in the other treatments (Figure 11). The peel thickness and acid content of the fruit from LED-900-treated plants were the lowest at the harvest stage (Table 4). Furthermore, the percentage of black seeds was highest in the LED-900-treated plants compared to the other treatments (Figure 10). These results indicate that LED exposure enhances growth speed.

4.2. In Winter, Strong Light Like That in Summer Is not Necessarily Required

Both LED supplementary lighting treatments used in the experiment were effective compared to the control. However, when comparing LED 900 to LED 1500, LED 900 proved to be more effective. In general, plants adjust to external environmental conditions. When watermelon plants encounter winter conditions, they must adapt to low temperatures and weak sunlight. Since plants need an optimal range of light intensity for photosynthesis, higher light intensities can enhance photosynthesis up to a point, with excessive light leading to photoinhibition, where the photosynthetic apparatus is damaged [37,38]. Although the photosynthetic rate was similar for both LED 900 and LED 1500 (Figure 5), this study found that it began to decrease under LED 1500. This suggests that LED-900 is sufficient for watermelon plants to grow under winter conditions. In other words, the light intensity of LED 1500 exceeded the optimum level for photosynthesis and started to negatively affect plant growth. From the perspective of total yield, the total yield per plant was highest in the 900 µmol/m²/s treatment (3.0 kg plant−1, 131%), significantly increasing the yields from the control (2.28 kg plant−1, 100%) and 1500 µmol/m²/s (2.60 kg plant−1, 114%) treatments (Table 4). This indicates that while higher light intensities (1500 µmol/m²/s) may still enhance yield compared to natural light, they are not as efficient as the optimal intensity of 900 µmol/m²/s. The findings align with previous studies reporting the diminishing returns of excessively high light intensities on the yield and quality of melon [39]. Further, the fruits grown with LED900 had more mature seeds than those of the control and LED1500, indicating LED-900 suitability for winter cultivation (Figure 10).

4.3. Fruit Characteristics of Winter-Grown Watermelons

The fruit set region is crucial for fruit development in the winter watermelon, and ensuring adequate nutrient supply to this region is essential for optimal fruit growth and quality [19]. The presence of adequate Ca2+ and Mg2+ in the fruit set region acts as a supportive source to increase fruit size and overall yield [19]. In fact, LED-900-treated plants, which had the highest value of Ca2+ and Mg2+ compared to control and LED 1500-treated plants at the 1st upper leaf of the fruit set node, produced higher fruit size (Figure 6, Figure 7 and Figure 8). This enhancement in nutrient content contributed to improved photosynthesis and overall plant health, as well as increased productivity (Figure 5; Table 3 and Table 4).
Fruits grown under LED lighting, particularly at 900 µmol/m²/s, exhibited higher sugar content and lower acid content than the control (Figure 11; Table 4). The increased sugar content is indicative of enhanced carbohydrate accumulation, likely due to more efficient photosynthesis and energy use at optimal light intensities [28,40]. Improved photosynthetic activity under LED lighting conditions leads to greater sugar production, which is critical for the ripening process. These results demonstrate that LED supplementary lighting markedly affects the winter watermelon ripening process. Furthermore, the reduction in acid content observed in fruits grown under LED lighting (Table 4) suggests that organic acids are metabolized more rapidly during the ripening process [41]. Organic acids, such as citric and malic acids, contribute to the sour taste of unripe fruits and gradually break down as the fruit matures, leading to a sweeter taste. The lower acid content in the LED-treated fruits indicates a more advanced stage of ripening compared to the control fruits, indicating that fruits grown under LED lighting ripen faster than those in the control.

5. Conclusions

The use of LED supplementary lighting effectively compensates for reduced sunlight and total light volume during winter, thereby promoting vegetative growth and fruit development. Specifically, LED lighting at 900 µmol/m²/s is highly effective in enhancing winter watermelon growth, yield, and quality. This makes it a valuable tool for optimizing production in greenhouse environments.

Supplementary Materials

The following supporting information can be downloaded at the website of this paper posted on Preprints.org, Figure S1: title; Table S1: title; Video S1: title.

Author Contributions

FG planned, supervised the study and revised a manuscript. MMH and YS carried out the experiments. MMH analyzed the data, interpreted and prepared the manuscript. All authors have read and approved the manuscript.

Data Availability Statement

The datasets generated and/or analyzed during this study are available upon reasonable request to the corresponding author.

Acknowledgment

The content of this paper will be used as part of the doctoral thesis of MMH. All authors have given their permission to use this content

Conflict of Interest

The authors declare that they have no known competing financial interests or personal relationships that could have appeared to influence the work reported in this paper.

Abbreviations

The following abbreviations are used in this manuscript:
DAP Days after pollination
Ca2+ Calcium ion
Mg2+ Magnesium ion

References

  1. Reddy, U.K., Abburi, L., Abburi, V.L., Saminathan, T., Cantrell, R., Vajja, V.G., Reddy, R., Tomason, Y.R., Levi, A., Wehner, T.C., & Nimmakayala, P. 2015. A genome-wide scan of selective sweeps and association mapping of fruit traits using microsatellite markers in watermelon. J. Hered. 106(2):166–176. [CrossRef]
  2. Hashizume, T. 2019. Breeding and utilization of watermelon. J. Jpn. Soc. Food Sci. 66(8):314–318. [CrossRef]
  3. Levi, A., Jarret, R., Kousik, S., Patrick Wechter, W.P., Nimmakayala, P., & Reddy, U.K. 2017. Genetic resources of watermelon. In Genetics and Genomics of Cucurbitaceae, Plant Genetics and Genomics: Crops and Models (Grumet, R., Katzir, N., Garcia-Mas, J., eds.). Springer: Berlin, pp. 87–110. [CrossRef]
  4. Stamford, J.D., Stevens, J., Mullineaux, P.M., & Lawson, T. 2023. LED lighting: A Grower’s guide to light spectra. Hortscience 58(2):180–196. [CrossRef]
  5. Folta, K.M., & Carvalho, S.D. 2015. Photoreceptors and control of horticultural plant traits. Hortic. Sci. 50(9):1274–1280. [CrossRef]
  6. Fukuda, N., Fujita, M., Ohta, Y., Sase, S., Nishimura, S., & Ezura, H. 2008. Directional blue light irradiation triggers epidermal cell elongation of abaxial side resulting in inhibition of leaf epinasty in geranium under red light condition. Sci. Hortic. 115(2):176–182. [CrossRef]
  7. Olarewaju, O. O., Fajinmi, O. O., Arthur, G. D., Coopoosamy, R. M., & Naidoo, K. (2023). Effect of climate change on the production of Cucurbitaceae species in North African countries. Journal of Agriculture and Food Research, 14, 100742. [CrossRef]
  8. Varaldo, A., Alchera, F., Giuggioli, N. R., & Giacalone, G. (2024). LED UVB postharvest treatments modify nutraceutical quality and physical properties of ‘Cargo’ blueberries. Journal of Agriculture and Food Research, 15, 101040. [CrossRef]
  9. Ouzounis, T., Rosenqvist, E., & Ottosen, C.O. 2015. Spectral effects of artificial light on plant physiology and secondary metabolism: A review. Hortic. Sci. 50(8):1128–1135. [CrossRef]
  10. Soufi, H.R., Roosta, H.R., Fatehi, F., & Ghorbanpour, M. 2023. Spectral composition of LED light differentially affects biomass, photosynthesis, nutrient profile, and foliar nitrate accumulation of lettuce grown under various replacement methods of nutrient solution. Food Sci. Nutr. 11(12):8143–8162. [CrossRef]
  11. Hao, X., Little, C., Zheng, J.M., & Cao, R. 2016. Far-red LEDs improve fruit production in greenhouse tomato grown under high-pressure sodium lighting. Acta Hortic. 1134(1134):95–102.
  12. Park, Y.H., Seo, B.S., Seo, J.B., Shin, G.H., & Yun, B.G. 2016. Effects of supplemental light on quality, yield, and growth rate of tomatoes. Acta Hortic. 1129(1129):105–110.
  13. Choi, H.G., Moon, B.Y., & Kang, N.J. 2015. Effects of LED light on the production of strawberry during cultivation in a plastic greenhouse and in a growth chamber. Sci. Hortic. 189:22–31. [CrossRef]
  14. Pérez-Romero, L.F., Stirling, P.J., & Hancock, R.D. 2024. Light-emitting diodes improve yield, quality and inhibitory effects on digestive enzymes of strawberry. Sci. Hortic. 332:113192. [CrossRef]
  15. Cui, X.H., Guo, X.O., Sun, T.Y., & Qi, H.Y. 2017. Effects of LED supplementary lighting on seedling growth and fruit quality of oriental melon. Plant Physiol. J. 53(4):657–667. [CrossRef]
  16. Demers, D.A., Gosselin, A., & Wien, H.C. 1998. Effects of supplemental light duration on greenhouse sweet pepper plants and fruit yields. J. Am. Soc. Hortic. Sci. 123(2):202–207. [CrossRef]
  17. Zhou, C., Li, Z., Liu, W., Bian, Z., Lu, W., Zhou, B., Wang, S., Li, Q., & Yang, Q. (2023). High-Proportion Blue Light Irradiation at the End-of-Production Stage Promotes the Biosynthesis and Recycling of Ascorbate in Lettuce. International Journal of Molecular Sciences, 24(22), 16524. [CrossRef]
  18. Nadalini, S., Zucchi, P., & Andreotti, C. 2017. Effects of blue and red LED lights on soilless cultivated strawberry growth performances and fruit quality. Eur. J. Hortic. Sci. 82(1):12–20. doi:10.17660/eJHS.2017/82.1.2.
  19. Noh, J., Kim, J.M., Sheikh, S., Lee, S.G., Lim, J.H., Seong, M.H., & Jung, G.T. 2013. Effect of heat treatment around the fruit set region on growth and yield of watermelon [Citrullus lanatus (Thunb.) Matsum. and Nakai]. Physiol. Mol. Biol. Plants 19(4):509–514. [CrossRef]
  20. Lu, W., Edelson, J.V., Duthie, J.A., & Roberts, B.W. 2003. A comparison of yield between high- and low-intensity management for three watermelon cultivars. HortSci. 38(3):351–356.
  21. McNellis, T.W., & Deng, X.W. 1995. Light control of seedling morphogenetic pattern. Plant Cell 7(11):1749–1761. [CrossRef]
  22. Gómez, C., & Mitchell, C.A. 2016. Physiological and productivity responses of high-wire tomato as affected by supplemental light source and distribution within the canopy. J. Am. Soc. Hortic. Sci. 141(2):196–208.
  23. Tewolde, F.T., Shiina, K., Maruo, T., Takagaki, M., Kozai, T., & Yamori, W. 2018. Supplemental LED inter-lighting compensates for a shortage of light for plant growth and yield under the lack of sunshine. PLOS ONE 13(11):e0206592.
  24. Paponov, M., Kechasov, D., Lacek, J., Verheul, M.J., & Paponov, I.A. 2019. Supplemental light-emitting diode inter-lighting increases tomato fruit growth through enhanced photosynthetic light use efficiency and modulated root activity. Front. Plant Sci. 10:1656.
  25. Hanyu, H., & Shoji, K. 2002. Acceleration of growth in spinach by short-ter exposure to red, blue light at the beginning and the end of the daily dark period. Acta Hortic. 580:145–150.
  26. Kalathil, N., Thirunavookarasu, N., Lakshmipathy, K., Chidanand, D. V., Radhakrishnan, M., & Baskaran, N. (2023). Application of light-based, non-thermal techniques to determine physico-chemical characteristics, pungency and aflatoxin levels of dried red chilli pods (Capsicum annuum). Journal of Agriculture and Food Research, 13, 100648. [CrossRef]
  27. Hori, H. 1966. Gravel culture of vegetable and ornamental crops. (Japanese text) Agric. Hortic. p p 210.
  28. Li, Q., & Kubota, C. 2009. Effects of supplemental light quality on growth and phytochemicals of baby leaf lettuce. Environ. Exp. Bot. 67(1):59–64. [CrossRef]
  29. Baker, N.R. 2008. Chlorophyll fluorescence: A probe of photosynthesis in vivo. Annu. Rev. Plant Biol. 59:89–113. [CrossRef]
  30. Ahmed, N., Zhang, B., Bozdar, B., Chachar, S., Rai, M., Li, J., Li, Y., Hayat, F., Chachar, Z., & Tu, P. 2023. The power of magnesium: Unlocking the potential for increased yield, quality, and stress tolerance of horticultural crops. Front. Plant Sci. 14:1285512. [CrossRef]
  31. Wei, H., Wang, M., & Jeong, B.R. 2020. Effect of supplementary lighting duration on growth and activity of antioxidant enzymes in grafted watermelon seedlings. Agronomy 10(3):337. [CrossRef]
  32. Li, Y., Zhou, B., Teng, Z., Zhang, M., Yu, L., Luo, Y., Chen, P., & Sun, J. (2023). Improved metabolomic approach for evaluation of phytochemicals in mustard, kale, and broccoli microgreens under different controlled environment agriculture conditions. Journal of Agriculture and Food Research, 14, 100719. [CrossRef]
  33. Dong, C., Fu, Y., Liu, G., & Liu, H. 2014. Growth, photosynthetic characteristics, antioxidant capacity and biomass yield and quality of wheat (Triticum aestivum L.) exposed to LED light sources with different spectra combinations. J. Agron. Crop Sci. 200(3):219–230. [CrossRef]
  34. Sobczak, A., Kowalczyk, K., Gajc-Wolska, J., Kowalczyk, W., & Niedzińska, M. 2020. Growth, yield and quality of sweet pepper fruits fertilized with polyphosphates in hydroponic cultivation with LED lighting. Agronomy 10(10):1560. [CrossRef]
  35. Piovene, C., Orsini, F., Bosi, S., Sanoubar, R., Bregola, V., Dinelli, G., & Gianquinto, G. 2015. Optimal red:blue ratio in led lighting for nutraceutical indoor horticulture. Sci. Hortic. 193:202–208. [CrossRef]
  36. Choi, H.G., Moon, B.Y., & Kang, N.J. 2016. Correlation between strawberry (Fragaria ananassa Duch.) productivity and photosynthesis-related parameters under various growth conditions. Front. Plant Sci. 7:1607. [CrossRef]
  37. Anderson, C.M., Mattoon, E.M., Zhang, N. et al 2021. High light and temperature reduce photosynthetic efficiency through different mechanisms in the C4 model Setaria viridis. Commun. Biol. 4(1):1092. [CrossRef]
  38. Wimalasekera, R. 2019. Effect of light intensity on photosynthesis. In Photosynthesis, Productivity and Environmental Stress (Ahmad, P., Ahanger, M.S., Alyemeni, M.N., Alam, P., eds.), John Wiley & Sons, New Jersey, pp.65–73. [CrossRef]
  39. Kramchote, S., & Glahan, S. 2020. Effects of LED supplementary lighting and NPK fertilization on fruit quality of melon (Cucumis melo L.) grown in plastic house. J. Hortic. Res. 28(1):111–122. [CrossRef]
  40. Chamchum, W., Glahan, S., Kramchote, S., Maniwara, P., & Suwor, P. 2023. Growth and Yield of Watermelon (Citrullus lanatus) in Plastic House in Response to White LED Supplementary Lighting. Agrivita J. Agr. Sci. 45(2):271–277. [CrossRef]
  41. Sweetman, C., Deluc, L. G., Cramer, G. R., Ford, C. M., & Soole, K. L. (2009). Regulation of malate metabolism in grape berry and other developing fruits. Phytochemistry, 70(11–12), 1329–1344. [CrossRef]
Figure 1. Schematic diagram of the supplementary LED lighting system (A), and its application in the experimental area (B). The LED lights were adjustable in height and connected to a timer set to turn on at 17:00 and off at 21:00 every day, from transplanting until harvest.
Preprints 147893 g001
Figure 2. Plant height (cm) at a 15-day interval. Blue, green, and orange lines represent the control, LED 900, and LED 1500, respectively. Different letters indicate significant differences (p < .05; Turkey’s HSD test). Values are the mean ± SD, n = 6. DAP = Days after planting.
Preprints 147893 g002
Figure 3. Number of female flowers for each treatment. Female flowers were counted from the onset of flowering until harvest. Different letters indicate significant differences (p < .05; Turkey’s HSD test). Values are the mean ± SD, n = 8.
Preprints 147893 g003
Figure 4. Leaf chlorophyll content (SPAD unit) in response to LED supplementary lighting. Blue, green, and orange bars represent the control, LED 900, and LED 1500, respectively. Different letters indicate significant differences (p < .05; Turkey’s HSD test). Values are the mean ± SD, n = 8. DAP = Days after planting.
Preprints 147893 g004
Figure 5. Photosynthetic rate during pollination time and 15 days after pollination. Blue, green, and orange bars represent the control, LED 900, and LED 1500, respectively. Different letters indicate significant differences (p < .05; Turkey’s HSD test). Values are the mean ± SD, n = 8.
Preprints 147893 g005
Figure 6. The mean value of Calcium (A) and Magnesium (B) present in the leaves of the fruit set region during the harvest stage. (a) Leaf of fruit set node, (b) 1st upper leaf of the fruit set node, (c) 1st lower leaf of the fruit set node. Blue, green, and orange bars represent the control, LED 900, and LED 1500, respectively. Different letters indicate significant differences (p < .05; Turkey’s HSD test). Values are the mean ± SD, n = 5. .
Preprints 147893 g006
Figure 7. Fruit diameter at a 7-day interval from fruit setting to harvesting. Blue, green, and orange lines represent the control, LED 900, and LED 1500, respectively. Different letters indicate significant differences (p < .05; Turkey’s HSD test). Values are the mean ± SD, n = 16.
Preprints 147893 g007
Figure 8. Relationship between ovary length and fruit weight. Randomly selected 12 female ovary lengths were measured for each treatment, and fruit weights were measured after harvest. Blue, green, and orange lines and dots represent the control, LED 900, and LED 1500, respectively. ** indicates significance at p < 0.01.
Preprints 147893 g008
Figure 9. External and internal characteristics of watermelon fruits grown in greenhouse with natural daylight only (control), LED 900 and LED 1500 µmol/m²/s.
Preprints 147893 g009
Figure 10. Number of seeds and mature black seeds among the three treatments: natural daylight only (control), LED 900 and LED 1500 µmol/m²/s. blue, green, and orange bars represent the control, LED 900, and LED 1500, respectively. Different letters indicate significant differences (p < .05; Turkey’s HSD test). Values are the mean ± SD, n = 3.
Preprints 147893 g010
Figure 11. Total soluble solid (TSS; ºBrix) at 15 days before harvest and harvest stage among different treatments. Blue, green, and orange bars represent the control, LED 900, and LED 1500, respectively. Different letters indicate significant differences (p < .05; Turkey’s HSD test). Values are the mean ± SD, n = 5. .
Preprints 147893 g011
Table 1. The climatic parameters for the experimental area were calculated as monthly mean values, both inside and outside the greenhouse.
Month T (ºC) RH (%) DLI (mol m⁻²d⁻¹) T (ºC) RH (%) DLI (mol m⁻²d⁻¹)
Control LED 900 LED 1500
January 19.5 52 6.25 9.55 11.25 7.1 54 10.2
February 20.5 65 6.50 10.25 13.5 8.0 63 11.1
March 22.0 60 9.50 15.0 17.2 9.6 59 15.3
April 22.5 69 10.5 16.5 19.5 17.1 72 15.3
May 25.5 69 12.0 17.1 21.2 20.0 72 18.2
Table 2. Preliminary experiment results for control (natural daylight only) and LED treatments at 600, 900, and 1200 µmol/m²/s. LEDs were adjusted from top of the canopy at night.
Supplemen tary LED Lighting Plant Height (cm) Shoot dry Weight (g) Root dry Weigh t (g) Root Length (cm) Number of Nodes No. of Leaves Stem Diam eter (mm) Leaf Area (cm2)
Control 20.0 b 26.8 b 3.89 c 11.0 b 5.0 b 8.1 b 4.1 b 131.2 b
LED 600 22.6 b 31.2 ab 5.15 b 13.6 a 5.7 ab 9.8 ab 4.2 b 135.1 b
LED 900 29.5 a 35.65 a 6.97 a 13.6 a 7.0 a 11.6 a 5.3 a 157.3 a
LED 1200 26.0 ab 32.12 a 5.56 b 12.1 b 6.3 a 11.1 a 5.0 a 143 ab
Different letters indicate significant differences (p < .05; Turkey’s HSD test), n = 8.
Table 3. Different growth characteristics at 56 and 86 DAP, corresponding to 30 days before harvest and at harvest, for the control and LED treatments at 900 and 1500 µmol/m²/s.
Supplementary LED Lighting No of Leaves No. of Nodes Stem Diameter
(mm)
Leaf Length
(cm)
Leaf Area (cm2) Fresh Weight of Plant (g) Dry Weight of Plant (g)
56 DAP
Control 87 c 75 c 5.19 b 21.32 b 187.65 c ________ ________
LED 900 140 a 103 a 6.84 a 24.76 a 236.32 a ________ ________
LED 1500 110 b 93 b 6.09 ab 24.75 a 226.19 b ________ ________
86 DAP
Control 180 c 168 c 8.32 b 16.07 b 128.63 c 754.2 c 80.34 b
LED 900 260 a 248 a 10.41 a 21.56 a 190.37 a 1039.8 a 116.90 a
LED 1500 228 b 216 b 9.90 b 18.09 b 151.35 b 866.4 b 113.51 a
Different letters indicate significant differences (p < .05; Turkey’s HSD test), n = 8.
Table 4. Different fruit characteristics at 15 days before harvest and at harvest for the control, LED treatments at 900 and 1500 µmol/m²/s.
Supplementary LED Lighting Fruit Length (cm) Fruit Weight (kg) Juice pH Acid Content (%) Thickness of Peel (mm)
15 days before harvest
Control 11.018 b 0.73 c 5.34 a 0.55 b 4.56 a
LED 900 13.950 a 1.30 a 5.50 a 0.53 a 4.45 a
LED 1500 12.314 ab 0.94 b 5.48 a 0.54 ab 4.84 a
Harvest stage
Control 13.12 b 1.14 c 5.76 a 0.47 b 3.66 a
LED 900 14.25 a 1.50 a 5.80 a 0.40 a 3.55 a
LED 1500 13.97 a 1.30 b 5.82 a 0.40 a 3.95 a
Different letters indicate significant differences (p < .05; Turkey’s HSD test), n = 5.
Disclaimer/Publisher’s Note: The statements, opinions and data contained in all publications are solely those of the individual author(s) and contributor(s) and not of MDPI and/or the editor(s). MDPI and/or the editor(s) disclaim responsibility for any injury to people or property resulting from any ideas, methods, instructions or products referred to in the content.
Copyright: This open access article is published under a Creative Commons CC BY 4.0 license, which permit the free download, distribution, and reuse, provided that the author and preprint are cited in any reuse.
Prerpints.org logo

Preprints.org is a free preprint server supported by MDPI in Basel, Switzerland.

Subscribe

Disclaimer

Terms of Use

Privacy Policy

Privacy Settings

© 2025 MDPI (Basel, Switzerland) unless otherwise stated