
Submitted:
14 October 2025
Posted:
15 October 2025
You are already at the latest version
Abstract
Breast cancer is a heterogeneous disease that exists in multiple subtypes, some of which still lack targeted and effective therapy. A major challenge is to unravel their underlying molecular mechanisms and bring to light novel therapeutic targets. In this study, we investigated the role of WNT-inducible signaling pathway protein 1 (WISP1) matricellular protein in the acquirement of an invasive phenotype by breast cancer cells. To this aim, we treated non-invasive MCF7 cells with WISP1 and assessed the expression levels of macrophage migration inhibitory factor (MIF) and its cellular receptor CD74. Next, we examined the expression of epithelial-to-mesenchymal transition (EMT) markers as well as molecular effectors of the tumor microenvironment, such as CD44, the main hyaluronan receptor that also acts as a co-receptor for MIF, the hyaluronan oncogenic network, and specific matrix metalloproteinases (MMPs) and their endogenous inhibitors (TIMPs). The results showed that WISP1 potently induces the expression of MIF cytokine and affects the expression of specific extracellular matrix molecules with established roles in the promotion of malignant properties. Notably, Src kinases and MIF are critically involved in these processes. Collectively, the present study demonstrates for first time a WISP1/Src/MIF axis as well as its ability to induce an invasive phenotype in MCF7 cells and highlights novel cellular and molecular processes involved in the epithelial-to-mesenchymal transition and the development of invasive breast cancer. This suggests that specific cues from the tumor microenvironment can activate a migratory/invasive phenotype in a subpopulation of cells residing within the heterogeneous breast tumor.
Keywords:
Breast cancer
; WISP1
; MIF
; MMPs
; hyaluronan
; CD44
; Src kinases
1. Introduction
Breast cancer is characterized by significant heterogeneity, both between patients and within individual tumors, which poses substantial challenges for effective treatment strategies [1,2,3]. Breast tumors are categorized into various molecular subtypes based on hormone receptor status, HER2 expression, and proliferation markers; however, these classifications often fail to capture the full complexity of the disease. Within a single tumor, multiple molecular subtypes can coexist, further complicating treatment approaches [4]. This complexity is exacerbated by subtype plasticity, a phenomenon reflected by certain breast cancer cell lines, such as MCF7, which can switch between molecular profiles—such as from luminal-A to basal-like—depending on their microenvironment [5,6]. The tumor microenvironment (TME) plays a critical role in driving this plasticity. Components of the TME, including signaling molecules, extracellular matrix (ECM) proteins/carbohydrates, and immune cells, significantly influence tumor behavior and subtype expression [7,8,9]. As a result, traditional treatments targeting specific molecular subtypes often prove inadequate, particularly in cases where tumors exhibit the capacity for adaptation and evolution [10,11]. This highlights the urgent need for novel molecular targets and more sophisticated, combinatorial therapeutic strategies that account for the dynamic nature of tumor heterogeneity.
WNT inducible signaling protein 1 (WISP1), also known as CCN4, is a matricellular protein that influences key cellular processes such as differentiation, proliferation, migration, and survival [12]. Although WISP1 does not have a direct structural role within the ECM, its expression during embryonic development and tissue repair suggests its involvement in maintaining tissue homeostasis. Abnormal WISP1 expression is associated with various pathological conditions, including cancer [13,14]. In breast cancer, WISP1 is notably overexpressed in primary tumors and correlates with advanced tumor stages, size, and lymph node metastasis [15,16]. Notably, WISP1 promotes tumor growth and epithelial–mesenchymal transition (EMT), characterized by changes in markers like E-cadherin, N-cadherin, Snail, and β-catenin [17,18]. Additionally, WISP1 represses the tumor suppressor NDRG1 and may act as a paracrine inhibitor of type 1 cell-mediated immunity, promoting type 2 immunity and thereby enhancing tumor progression [15]. Furthermore, WISP1 levels increase following PTEN knockdown, facilitating cell migration and invasion [14]. Consistent with these findings, elevated WISP1 expression has been associated with poor clinical outcomes and WISP1 has been characterized for its oncogenic functions, driving tumor growth, invasion, and metastasis in several cancer types.
Another key player in the TME is Macrophage Migration Inhibitory Factor (MIF), a 12.5 kDa trimeric protein encoded by the MIF gene on human chromosome 22 [19]. Initially identified for its ability to inhibit macrophage migration, MIF is expressed by a wide range of immune and non-immune cells [20]. Elevated levels of MIF are found in several cancers, including breast cancer, where increased MIF concentrations in both tumor tissues and the bloodstream are associated with poor prognosis [21]. MIF is secreted into the extracellular space in response to inflammatory stimuli or stress, where it influences tumor progression via autocrine and paracrine signaling mechanisms. MIF primarily exerts its effects through interaction with the CD74 receptor, which is frequently upregulated in breast cancer and has been particularly associated with aggressive tumor features, including increased lymph-node invasion [22]. This association is more pronounced in more aggresive subtypes of breast cancer, such as triple-negative breast cancer (TNBC) [23]. CD74-mediated signaling is often co-activated by CD44, a major ECM receptor that also serves as a main cancer stem cell marker, leading to the activation of key oncogenic pathways, including the MAPK/ERK and PI3K/Akt pathways, which promote tumor cell proliferation, migration, and survival [24]. Additionally, MIF inhibits p53-dependent apoptosis, and promotes the secretion of factors such as vascular endothelial growth factor (VEGF) [25,26], facilitating angiogenesis and supporting the growth of metastatic lesions [27,28]. The interaction of MIF with the tumor stroma further contributes to an environment that favors tumor progression and metastasis [29]. Interestingly, while extracellular MIF correlates with poor outcomes, cytosolic MIF is linked to improved survival, reflecting a context-dependent function [30].
Understanding the complex roles of WISP1 could provide new avenues for targeted therapies and improve our approach to treating the heterogeneous nature of breast cancer. A current challenge is to explore how targeting WISP1 or its related pathways could help overcome current treatment limitations and address breast tumor plasticity. Given the established connection between WISP1 and MIF [31] and their critical roles in shaping the TME to exacerbate tumor aggressiveness, this study aims to elucidate how this WISP1/MIF axis influences breast tumor plasticity and aggressiveness. Τhe findings aim to offer potential new targets for therapeutic interventions that address the dynamic and adaptive nature of breast cancer.
2. Materials and Methods
2.1. Cell Culture and Reagents
MCF7 (non-invasive, ER+) breast cancer cell line was obtained from the American Type Culture Collection (ATCC). MCF7 cells were routinely cultured in complete medium [Dulbecco’s Modified Eagle’s Medium (DMEM, #LM-D1110/500, Biosera) supplemented with 10% fetal bovine serum (FBS, #FB-1000/500, Biosera) and a cocktail of antimicrobial agents (100 IU/ml penicillin, 100 μg/ml streptomycin)] at 37 °C, 95% humidified air/5% CO2. Every two days, medium was replaced with fresh one. When approximately 80% cell confluency was reached, cells were trypsinized for 3 min with trypsin-EDTA 1× in PBS (#LM-T1706/500, Biosera) and seeded in new Petri dishes. All experiments were conducted in serum-free conditions.
4,5-dimethylthiazol-2-yl)-2,5-diphenyltetrazolium bromide (MTT) was purchased from Sigma-Aldrich (St. Louis, MO, USA); PP2 (Src kinase inhibitor) and ISO-1 (MIF inhibitor) were from Tocris Bioscience (Bio-Techne Ltd, Abingdon Oxon, UK). Recombinant human WISP1, endotoxin-free, and active MIF were purchased from PeproTech (Rocky Hill, NJ, USA) and ImmunoTools (Friesoythe, Germany), respectively.
Primers for PCR were obtained from Biomers.net GmbH (Ulm, Baden-Württemberg, Germany). The RNA extraction kit (Nucleo Spin) was purchased from Macherey-Nagel (Düren, Germany); and the PCR reactions were carried out using the Prime Script RT Reagent Kit from Takara, Nippon (Japan) and the KAPA SYBR FAST qPCR Master Mix kit from KAPA Biosystems (Boston, MA, USA). All other chemicals were of analytical grade and purchased from Sigma-Aldrich (St. Louis, MO, USA). Handling and storage of all reagents was performed according to the manufacturers’ instructions.
2.2. Determination of Secreted Hyaluronan Concentration
MCF7 cells were cultured under serum-free conditions as described above. At the desired time points, culture supernatants were collected, centrifuged at 1,000 × g for 5 min to remove cell debris, and stored at −80 °C until analysis. Secreted hyaluronan levels were quantified using the Hyaluronan ELISA Kit (Quantikine, R&D Systems, #DHYAL0) according to the manufacturer’s instructions. Absorbance was measured at 450 nm using a microplate reader, and HA concentrations were calculated based on a standard curve generated with known concentrations of hyaluronan.
2.3. Enzyme-Linked Immunosorbent Assays (ELISA)
Secreted protein levels were quantified by ELISA according to the manufacturers’ instructions, with all samples run in technical duplicate on the same plate per analyte. The following kits were used: Mouse MIF Sandwich ELISA Kit (KE10027, R&D Systems, Minneapolis, MN, USA, 96T), human MMP-1 ELISA Kit (EHMMP1, R&D Systems, Minneapolis, MN, USA),total MMP-2 ELISA Kit (Quantikine, R&D Systems, Minneapolis, MN, USA, #MMP200), human MMP-9 ELISA Kit (BMS2016-2, Thermo Scientific, Waltham, MA, USA), human MT1-MMP ELISA Kit (EEL068, R&D Systems, Minneapolis, MN, USA), human TIMP-1 ELISA Kit (Quantikine, R&D Systems, Minneapolis, MN, USA, #DTM100), and human TIMP-2 ELISA Kit (Quantikine, R&D Systems, Minneapolis, MN, USA, #DTM200). Standards and samples were prepared with kit-supplied diluents and diluted as needed to fall within each assay’s linear range. Absorbance was read at 450 nm with 540–570 nm reference correction using a microplate reader (Infinite M200, Tecan), and concentrations were calculated from 4-parameter logistic standard curves after background subtraction. Results are reported as pg/mL or ng/mL of conditioned medium and, where indicated, normalized to producing cell number or total cellular protein from matched wells. Biological replicate numbers and statistical tests are provided in the figure legends and Statistics subsection.
2.4. Detection of Phosphorylated Src Family Kinases by Capture ELISA
MCF7 cells were treated with WISP1 (500 ng/mL) for 24 h, washed with PBS, and lysed in ice-cold lysis buffer (700 μL per 90 mm dish). Lysates were clarified by centrifugation at 14,000 × g for 30 min at 4 °C, and supernatants were collected. Ninety-six–well polystyrene plates were coated overnight at 4 °C with antibodies specific for c-Src (mouse monoclonal, Cat. No. 66606-1-Ig, Proteintech, Germany), Lyn (rabbit polyclonal, Cat. No. 18135-1-AP, Proteintech, Germany), or Fyn (rabbit polyclonal, Cat. No. 11097-1-AP, Proteintech, Germany) at 2 μg/mL in PBS (100 μL/well). Plates were washed three times with PBS-T (PBS containing 0.05% Tween-20) and blocked with 1% BSA in PBS-T (200 μL/well) for 1 h at 37 °C. Following three washes with PBS-T, cell lysates (100 μL/well, in duplicate) were added and incubated overnight at 4 °C. Plates were washed five times with PBS-T, and bound phosphorylated proteins were detected using HRP-conjugated anti-phosphotyrosine antibody (mouse monoclonal, Cat. No. APY03-HRP, Cytoskeleton, Inc., 1:2000 in PBS-T containing 0.25 M NaCl, 100 μL/well) for 2 h at 37 °C. After five washes with PBS-T containing 0.25 M NaCl, TMB substrate (100 μL/well) was added, and color development was allowed for 15 min at room temperature in the dark. The reaction was stopped with 2 M H₂SO₄ (100 μL/well), and absorbance was measured at 450 nm using a microplate reader (Infinite M200, Tecan).
2.5. Immunofluorescence Microscopy
MCF7 cells (3 × 10⁴) were seeded on sterile glass coverslips in complete medium and incubated for 24 h, followed by overnight serum starvation. Cells were then stimulated with recombinant WISP1 (500 ng/mL) in the presence or absence of PP2 or ISO-1, or with recombinant MIF (100 ng/mL), for 24 h in serum-free medium. Following stimulation, cells were fixed in 4% paraformaldehyde in PBS for 15 min at room temperature, permeabilized with 0.05% Triton X-100/PBS-Tween 0.01% for 10 minutes, and blocked with 3% bovine serum albumin (BSA)/PBS-Tween 0.01% for 1 h. Cells were incubated overnight at 4 °C with a primary antibody against E-cadherin (Cell Signaling Technology, Danvers, MA, USA; Cat. #3195) diluted in 1% BSA/PBS-Tween 0.01%, followed by an Alexa Fluor 488-conjugated secondary antibody (Invitrogen/Thermo Fisher Scientific, Waltham, MA, USA; Cat. #A-11008) for 1 h at 37 °C in the dark. F-actin was visualized using Phalloidin-iFluor™ 488 Conjugate (AAT Bioquest, Sunnyvale, CA, USA; Cat. #23115, 1:40 dilution). Nuclei were counterstained and coverslips mounted with Vectashield Antifade Mounting Medium with DAPI (Vector Laboratories, Burlingame, CA, USA; Cat. #H-1200). Between each step after fixation, cells were washed three times with PBS-Tween 0.01%. Images were acquired using a fluorescence phase-contrast microscope (Olympus CKX41, QImaging Micro Publisher 3.3RTV) at 40× magnification.
2.6. Western Blotting
For analysis of secreted MIF, equal protein concentrations from conditioned medium were determined using the Bradford assay (Thermo Scientific, Cat. #23236) and enriched by ammonium sulfate precipitation [(NH₄)₂SO₄, 50% saturation]. Precipitates were dissolved in Laemmli sample buffer containing β-mercaptoethanol, boiled for 5 min, and subjected to SDS–PAGE on 15% polyacrylamide gels. Proteins were transferred to PVDF membranes, blocked, and immunoblotted using an anti-MIF antibody (Proteintech, Cat. #20415-1-AP). For analysis of cellular proteins, MCF-7 cells were lysed in RIPA buffer supplemented with protease and phosphatase inhibitor cocktail (1×, Chemicon, Millipore, CA, #20-201) on ice for 30 min with intermittent vortexing. Lysates were centrifuged at 10,000 rpm for 10 min at 4 °C, and supernatants were collected. Protein concentrations were determined using a BCA Protein Assay Kit (Pierce, Thermo Scientific). Equal amounts of protein were separated by SDS–PAGE on 10% polyacrylamide gels and transferred to PVDF membranes (Macherey-Nagel). Membranes were blocked with 5% (w/v) non-fat dry milk in PBS containing 0.05% Tween-20 (PBS-T) for 1 h at room temperature, then incubated overnight at 4 °C with primary antibodies: E-cadherin (Cell Signaling Technology, Cat. #3195), NDRG1 (Novus Biologicals, HRP-conjugated, Cat. #NB160805), and α-tubulin (Invitrogen, Cat. #322500). After three washes with PBS-T, membranes were incubated for 1 h at room temperature with HRP-conjugated secondary antibodies (anti-rabbit IgG, Sigma-Aldrich, Cat. #A0545; or anti-mouse IgG, Sigma-Aldrich, Cat. #A4416) for E-cadherin and α-tubulin. NDRG1 was detected directly using HRP-conjugated streptavidin (R&D Systems, Cat. #DY998) without additional secondary antibody. Immunoreactive protein bands were visualized using enhanced chemiluminescence (Immunobilon® Crescendo Western HRP Substrate, Millipore/Merck, Cat. #WBLUR0100). Band intensity was quantified by densitometry using Scion Image PC software and expressed in arbitrary units (pixels).
2.7. Quantitative Real-Time PCR
Total RNA was extracted from MCF7 cells using a Nucleo Spin RNA kit (Macherey-Nagel, Düren, Germany) according to the manufacturer’s instructions. cDNA synthesis was performed using the Prime Script RT Reagent Kit (Takara, Nippon, Japan) as per the provided protocol. Quantitative real-time PCR (qPCR) analysis was conducted using the KAPA SYBR FAST qPCR Master Mix (2×) kit (KAPA Biosystems, Boston, MA, USA), following the manufacturer’s guidelines. Assays were performed in triplicate on a Rotor-Gene Q detection system (Qiagen) in a total volume of 20 μL, comprising 10 μL KAPA SYBR FAST qPCR Master Mix (2×), 0.5 μL of each primer at a concentration of 8 μM, 1–2 μL of cDNA (0.5–20 ng), and 7 or 8 μL of dH2O. The cycling conditions included 3 min enzyme activation at 95 °C, followed by 40 cycles at 95 °C for 3 s and 50–60 °C for 20 s. GAPDH was used as an internal standard. Relative expression of different gene transcripts was calculated by the ΔΔCt method. The Ct of any gene of interest was normalized to the Ct of the normalizer (GAPDH). Fold changes (arbitrary units) were determined as 2−ΔΔCt. Genes of interest and utilized primers are presented in Table 1.
2.8. Wound Healing Assay
MCF7 cells were cultured in 6-well plates in complete medium until confluent monolayers. Cells were then serum starved for 16 h and the cell monolayer was scratched using a pipette tip. Cells were washed two times with PBS followed by the addition of serum free DMEM containing the desired factors [WISP1 (500 ng/mL), MIF (100 ng/mL), PP2 (1 μΜ), ISO-1 (100 μΜ)] plus cytarabine (Pfizer). For the pre-treatment with PP2 and ISO-1 inhibitors prior to WISP1 treatment, cells were pre-incubated with the inhibitors in serum free medium for 30 min. The cells were then incubated and photographed at various time points (0 h, 6 h, 12 h, 24 h, 48 h) using a colour digital camera (CMOS) mounted on a phase contrast microscope (OLYMPUS CKX41, QImaging Micro Publisher 3.3RTV) through a 10× objective. The images were quantified by measuring the wound area with Image J 1.50b Launcher Symmetry Software.
2.9. MTT Assay
The MTT assay was used to assess the effect of WISP1/MIF axis in the viability and proliferation of MCF7 cells. MCF7 cells were seeded in 96-well plates at a density of 1 × 10^4 cells per well and allowed to adhere for 24 hours. Cells were then treated with various concentrations of test compounds or inhibitors, diluted in serum-free DMEM. After 24, 48, or 72 h of incubation, the medium was removed, and the wells were washed with PBS to remove any residual test substances. Next, 100 μL of MTT solution (0.5 mg/mL in PBS) was added to each well and incubated for 4 hours at 37 °C. The formazan crystals formed in living cells were dissolved by adding 100 μL of DMSO to each well. The absorbance was measured at 570 nm using a microplate reader. The results were expressed as the percentage of viable cells compared to control cells treated with vehicle (DMSO) alone. The experiments were performed in triplicate and repeated at least three times to ensure reproducibility.
2.10. Statistical Analysis
Each experiment was performed at least three times. Data are presented as mean ± standard deviation (SD). Statistical differences were evaluated using two-way analysis of variance (ANOVA) followed by Tukey’s multiple comparisons test. Differences were considered statistically significant at P ≤ 0.05. All analyses and graphs were performed using GraphPad Prism 10.5.0 software.
3. Results
3.1. WISP1 Induces MIF Secretion in MCF7 Breast Cancer Cells Through Src Kinase–Dependent Mechanisms
Our previous work demonstrated a functional link between WISP1 and MIF in normal lung fibroblasts [31]. To investigate whether WISP1 also regulates MIF expression in breast cancer, non-invasive ER⁺ MCF7 cells were treated with increasing concentrations of recombinant human WISP1 (125, 250, 500, and 1000 ng/mL) for 24 h, and secreted MIF levels were quantified by ELISA. WISP1 induced a dose-dependent increase in MIF secretion, with a significant rise observed at 500 ng/mL (P < 0.01) and moderate increases at 125 and 250 ng/mL compared to untreated controls (Figure 1A). No further increase was detected at 1000 ng/mL. We next validated these findings by western blot analysis of MCF7 cell culture supernatants. Indeed, WISP1 treatment markedly increased secreted MIF protein compared to untreated cells (Figure 1B). To determine the underlying molecular mechanisms, MCF7 cells were pre-treated for 30 min with either the Src kinase inhibitor PP2 or the MIF inhibitor ISO-1 prior to WISP1 stimulation (500 ng/mL, 24 h). Both inhibitors significantly attenuated the WISP1-induced MIF expression at both mRNA (Figure 1C) and protein (Figure 1D) levels, indicating that Src kinases and MIF itself are implicated in WISP1-mediated upregulation of MIF in breast cancer cells. Finally, to further confirm the involvement of Src kinases, we assessed the phosphorylation status of key Src kinase family members by western blotting using phospho-specific antibodies. WISP1 stimulation significantly induced the phosphorylation of Lyn (mainly) and Fyn kinases, but not c-Src (Figure 1E), indicating these kinases as upstream mediators of WISP1-induced secretion of MIF in MCF7 cells. Notably, the inhibitory effect of ISO-1 suggests that MIF expression is sustained, at least in part, via a self-reinforcing, ISO-1-inhibitable feedback loop. This finding supports the notion that MIF not only acts downstream of WISP1 but may also contribute to the maintenance of its own expression. These findings are consistent with our previous studies in lung fibroblasts [31], suggesting a conserved regulatory mechanism for WISP1-induced MIF expression across different cell types.
3.2. Implication of Src Kinases and MIF in WISP1-Mediated Changes in CD44/CD74 Receptors Expression
Given the ability of WISP1 to induce MIF expression in MCF7 cells, we next examined whether WISP1 also modulates the expression of MIF cellular receptors, namely CD44 and CD74. MCF7 cells were treated with WISP1 (500 ng/mL) in the presence or absence of the Src kinase inhibitor PP2 or the MIF inhibitor ISO-1. qPCR analysis revealed that WISP1 had no significant effect on the mRNA levels of total CD44 (CD44t: combined CD44s/CD44v) (Figure 2A) but significantly downregulated the CD44s isoform (Figure 2B). CD74 expression remained unchanged upon WISP1 stimulation (Figure 2C). Pre-treatment with PP2 prior to WISP1 exposure led to marked reduction in CD44t (Figure 2A) and CD74 (Figure 2C) expression compared to untreated or WISP1-treated cells, while reversed the WISP1-mediated suppression of CD44s (Figure 2B). In contrast, ISO-1 pre-treatment followed by WISP1 stimulation did not alter the expression of CD44t, CD44s, or CD74 (Figure 2A–C), indicating that MIF induction by WISP1 is not implicated in the transcription regulation of its receptors. Consistently, treatment with recombinant MIF (150 ng/mL) failed to induce changes in CD44t or CD74 mRNA expression (Figure 2D).
3.3. WISP1 Promotes EMT Features in Breast Cancer Cells Through Src and MIF Activities
WISP1 has been implicated in the induction of EMT in several cancers, including oral squamous cell carcinoma, prostate, and breast cancer [18,32,33]. To assess whether WISP1 induces similar effects in non-invasive MCF7 cells, we treated cells with recombinant WISP1 (500 ng/mL) for 24 h. The results showed that WISP1 significantly decreased E-cadherin mRNA (Figure 3A) and protein (Figure 3D) expression levels, accompanied by disrupted E-cadherin junctional localization as shown by immunofluorescence (Figure 3E). On the other hand, WISP1 treatment resulted in significant upregulation of fibronectin and vimentin mRNA levels (Figure 3B,C). Treatment with recombinant human MIF (100 ng/mL) resulted in similar effects, whereas inhibition of Src with PP2 (10 µM) or blockade of MIF activity with ISO-1 (50 µM) partially restored E-cadherin expression, junctional localization, and epithelial morphology (Figure 3E), while reversed the WISP1-induced expressions of fibronectin and vimentin (Figure 3B,C). These results demonstrate that WISP1 promotes EMT-like changes in MCF7 cells, consistent with a partial EMT, as cells acquire mesenchymal features. Of interest, these WISP1-mediated effects are tightly regulated by Src kinase and MIF signaling pathways.
3.4. WISP1/MIF Axis Affects Oncogenic Hyaluronan Network
Dysregulation of hyaluronan (HA) metabolizing enzymes, including HA synthases (HASes) and hyaluronidases (HYALs), contributes to poor prognosis and resistance to chemotherapy in several cancers [9]. To examine the implication of WISP1 in extracellular matrix, in particular HA network, remodeling during tumor progression, MCF7 cells were treated with WISP1 in the absence or presence of Src kinase and MIF inhibitors. The results revealed that WISP1 upregulated HAS2 and HAS3, with no effect on HAS1 (Figure 4A–C). Pre-treatment with ISO-1 abolished WISP1-induced HAS2 and HAS3 expression, whereas HAS2 was also suppressed by PP2 (Figure 4A–C), indicating that WISP1 promotes HA synthesis through MIF (mainly) and Src signaling. In agreement with this, treatment with recombinant human MIF resulted in the upregulation of all HASes (Figure 4A-C). Consistent with the HAS transcriptional changes, WISP1 markedly increased HA secretion (Figure 4D). Notably, MIF alone was also sufficient to elevate HA levels. Pre-treatment with the MIF inhibitor ISO-1 blocked WISP1-induced HA secretion, whereas Src inhibition with PP2 had no effect (Figure 4D). These results demonstrate that WISP1 upregulates HA synthesis and secretion through a MIF-dependent mechanism. To assess the impact of WISP1 on hyaluronan turnover, we examined the expression of key hyaluronidases involved in HA degradation, namely Hyal1, Hyal2, and TMEM2. WISP1 treatment significantly increased the mRNA levels of Hyal1 and TMEM2 (Figure 4E,G), while both WISP1 and MIF downregulated Hyal2 expression (Figure 4F). The WISP1-mediated induction of Hyal1 and TMEM2 was blocked by ISO-1 and PP2 inhibitors, while the reverse effect was observed for Hyal2 (Figure 4E-G) suggesting that WISP1 regulates HA turnover through the actions of Src kinases and MIF.
3.5. WISP1/MIF Axis Modulates MMPs/TIMPs and ECM Remodeling
To further investigate the role of WISP1 in extracellular matrix remodeling, we examined its effects on matrix metalloproteinases (MMPs) and their endogenous tissue inhibitors (TIMPs), which are key regulators of extracellular matrix dynamics and tumor invasion [34,35]. Non-invasive MCF7 cells were treated with WISP1 for 24 hours, and ELISA assays were performed to quantify MMP protein levels. WISP1 significantly increased the secretion of MMP1, MMP2, MMP9, and MT1-MMP (Figure 5A–D). Supporting qPCR data are provided in the Appendix 1, but given the divergence between mRNA and protein regulation, we focused our analysis on protein level outcomes, which more directly reflect functional MMPs in the extracellular matrix. Pharmacological inhibition of Src and MIF with PP2 and ISO-1, respectively, attenuated WISP1-induced MMP1 and MMP2 secretion, whereas for MMP9 and MT1-MMP, PP2 reduced their WISP1-induced increase while ISO-1 enhanced it (Figure 5C–D). Furthermore, treatment with recombinant human MIF resulted in the upregulation of all examined MMPs (Figure 5A–D). Consistent with these findings, WISP1 treatment significantly increased MMP1/TIMP1, MMP2/TIMP2, MMP9/TIMP1, and MT1-MMP/TIMP2 ratios, suggesting a shift towards proteolytic activity (Figure 5E–H). Src kinase inhibition reduced these ratios across MMP1, MMP2, and, to a lesser extent, MMP9, whereas MIF inhibition selectively suppressed MMP1/TIMP1 and MMP2/TIMP2 but amplified the MMP9/TIMP1 and MT1-MMP/TIMP2 ratios (Figure 5E–H).
3.6. WISP1 Promotes Breast Cancer Cell Viability via Src Kinases and MIF
To determine whether WISP1 (and/or MIF) regulate NDRG1 expression and impact tumor cell survival, MCF7 cells were treated with recombinant WISP1, with or without Src kinase (PP2) or MIF (ISO-1) inhibitors, alongside parallel stimulation with recombinant MIF alone. WISP1 (500 ng/mL) significantly decreased NDRG1 mRNA and protein levels compared to untreated cells (Figure 6A, B, respectively). Inhibition of Src or MIF restored NDRG1 expression, while recombinant MIF (150 ng/mL) suppressed NDRG1 (Figure 6A, B), identifying MIF as an independent NDRG1 repressor. In addition, cell viability was assessed using MTT assays. The results revealed that WISP1 enhanced cell viability relative to controls, an effect partially reversed by Src or MIF inhibition (Figure 6C). Accordingly, recombinant MIF increased cell viability (Figure 6C). These results establish WISP1 and MIF as negative regulators of NDRG1 and demonstrate that Src and MIF signaling are required for the observed WISP1-mediated effects on breast cancer cell survival.
3.7. WISP1 Promotes Breast Cancer Cell Migration Through Src Kinases and MIF
Wound healing assays over a 48-hour time period demonstrated that WISP1 (500 ng/mL) significantly induced migration of MCF7 cells, as shown in Figure 7A. Recombinant MIF (150 ng/mL) similarly increased migration at 12 and 24 h (Figure 7A). The presence of PP2 or ISO-1 inhibitors significantly attenuated WISP1-mediated migration, indicating that both Src kinases and MIF are involved in the increased migratory response of non-invasive MCF7 cells induced by WISP1.
To further examine cytoskeletal changes associated with migration, we performed phalloidin staining to visualize filamentous actin. Untreated cells displayed relatively rounded morphology with weaker actin organization (Figure 7B). WISP1 stimulation induced a potent actin remodeling, with elongated cell morphology and enhanced filamentous actin structures at the cell periphery. Co-treatment with PP2 or ISO-1 attenuated these changes, and cells appeared more spread and less polarized compared to WISP1 alone (Figure 7B). Constistently, MIF stimulation induced actin rearrangements and stress fiber formation similar to those observed with WISP1 (Figure 7B).
4. Discussion
One of the major hurdles in treating metastatic breast cancer lies in the molecular pathways that promote cancer cell aggressiveness and therapy resistance. This study underscores the critical role of the WISP1/MIF axis in promoting the malignant properties of MCF7 cells, a widely used model for non-invasive estrogen receptor-positive (ER+) breast cancer, and demonstrates how this signaling axis may complicate therapeutic strategies aimed at controlling metastasis and resistance. WISP1 (CCN4) has been increasingly recognized for its oncogenic role across various cancers [16,36], while higher WISP1 expression correlates with advanced disease characteristics, such as larger tumors, lymph node metastasis, and HER-2/neu overexpression [16,37,38,39]. MCF7 cells express WISP1 that is primarily localized extracellularly aligning with WISP1’s classification as a secretory matricellular protein [33,40,41]. The presence of WISP1 in non-invasive MCF7 breast cancer cells supports our rationale for utilizing this model.
Our findings show that WISP1 induces the expression of MIF, a cytokine known to be linked to pro-tumorigenic and pro-metastatic activities in various cancers [29,42,43,44,45]. The concentration of 500 ng/mL was identified as optimal for maximal MIF induction in MCF7 cells after 24 hours, providing a novel insight into WISP1’s effects in this context. As shown in Figure 1, the induction of MIF by WISP1 is mediated through Lyn and Fyn, but not c-Src, kinase activation. Src kinases have been shown to facilitate the spread of cancer cells to distant organs and have been implicated in resistance to conventional therapies, such as chemotherapy and hormonal treatments, by sustaining survival signaling pathways in breast cancer cells [46]. Furthermore, our study reveals that MIF itself can regulate its own expression through a feedback loop, since pre-treatment of MCF7 cells with ISO-1, a specific inhibitor of MIF activity, resulted in downregulation of the enhanced MIF expression induced by WISP1. This suggests that MIF can promote its own expression in response to WISP1 signaling, further reinforcing the role of the WISP1/MIF axis in driving tumor progression and therapy resistance. The above suggest that dual targeting of Lyn/Fyn tyrosine kinases and MIF may be necessary to fully counteract WISP1-driven metastasis in breast cancer.
Moreover, our findings, establish that WISP1 enhances metastatic plasticity in ER⁺ breast cancer by amplifying MIF signaling and engaging Lyn/Fyn-mediated cytoskeletal remodeling, even in low-CD74 contexts. While invasive breast cancers typically rely on high CD74 to maximize MIF-driven EMT [22], our results raise the possibility that ERα⁺ tumors such as MCF7 cells achieve similar outcomes through WISP1-mediated MIF amplification (Figure 1A). Although WISP1 does not directly elevate CD74 (Figure 2C), increased MIF likely strengthens CD74-MIF interactions via mass action in low-CD74 environments [47]. WISP1 also selectively downregulated CD44s without altering total CD44, suggesting a compensatory upregulation of CD44v isoforms. This isoform switching, probably influenced by ERα status [48,49], may couple MIF/CD74 to cofilin-driven actin reorganization and EMT [50]. Indeed, WISP1 treatment induced a partial EMT phenotype characterized by reduced membrane E-cadherin, increased fibronectin, and elevated vimentin, consistent with migratory yet adaptable tumor cell states [51,52,53]. Critically, WISP1’s EMT program requires both MIF-CD74/CD44v signaling and Lyn/Fyn activation; MIF maintains mesenchymal traits through pathways previously tied to CD44v-mediated metastasis [12,54,55], while Lyn/Fyn kinases—overexpressed in aggressive breast cancers (34–38,72)—orchestrate E-cadherin internalization and actin remodeling. The functional independence of these arms is evidenced by treatment with either ISO-1 (MIF inhibitor) or PP2 (SFK inhibitor) each reversing EMT markers, suggesting synergistic therapeutic potential. This dual mechanism aligns with established Src family kinase roles in FAK/Akt/ERK-driven migration (36,41,42) but uniquely positions WISP1 as an upstream integrator of inflammatory (MIF) and cytoskeletal (SFK) pathways in ERα⁺ contexts, suggesting synergistic therapeutic potential. While our data support a model where WISP1-induced CD44 isoform switching synergizes with MIF amplification and SFK activation to drive cytoskeletal reorganization and invasive protrusions in ER⁺ tumors, critical questions persist. Future studies must delineate [1] how ERα regulates CD44 splicing to favor pro-invasive isoforms and [2] whether CD44v-MIF complexes spatially coordinate with Lyn/Fyn kinases at invasive fronts to amplify protrusive activity. Resolving these mechanisms will clarify how WISP1 licenses metastatic plasticity in ERα⁺ contexts and identify strategies to uncouple inflammatory (MIF/CD74) from cytoskeletal (SFK) signaling—a therapeutic opportunity for limiting adaptive aggression in hormonally regulated tumors.
Beyond its role in EMT, WISP1 emerges as a critical regulator of hyaluronan metabolism, linking intracellular signaling to extracellular matrix remodeling in ERα+ breast cancer. Our data revealed that WISP1 treatment significantly upregulated the expression of hyaluronan synthase genes HAS2 and HAS3, while suppressed HYAL2 and induced HYAL1 and TMEM2 hyaluronidases. These alterations in the hyaluronan metabolizing enzymes led to an increased synthesis of high molecular weight HA (HMW-HA) while allowing the local production of low molecular weight hyaluronan fragments (LMW-HA). Critically, MIF/CD74 signaling sustains this catabolic imbalance, as MIF inhibition restored HYAL2 expression, whereas Src inhibition attenuated HAS2/3 induction. This HA landscape creates a hydrated, loose ECM (48,49) that facilitates invasion—a process amplified by CD44v isoforms, which bind HA to activate pro-metastatic pathways (12,48). Notably, HA fragmentation may further feed forward through CD44v-MIF crosstalk, as LMW-HA enhances CD44 clustering and inflammatory signaling [56,57]. The convergence of WISP1’s transcriptional control over HA metabolism with its regulation of MIF/SFK-driven cytoskeletal remodeling positions it as a central integrator of biochemical and biophysical cues in ER⁺ tumors, while suggesting WISP1-mediated HA remodeling as a potential therapeutic target.
Furthermore, WISP1 acts as a regulator of extracellular matrix remodeling in breast cancer, broadly increasing the protein levels of matrix metalloproteinases, including MMP1, MMP2, MMP9, and MT1-MMP, and shifting the MMP/TIMP balance toward a proteolytic phenotype [34,35]. This aligns with previous studies reporting that WISP1 promotes MMP2 and MMP9 in chondrosarcoma and osteosarcoma cells, thereby facilitating motility and invasion [58]. MMP induction is further reinforced by HA–CD44 interactions, which elevate MT1-MMP and contribute to invasive and metastatic phenotypes [59,60,61]. Studies in PC3 prostate cancer cells show that WISP1-induced β-catenin signaling is linked to HAS2 transcription, suggesting coordinated regulation of hyaluronan metabolism and MMP activity during ECM remodeling [62]. Src kinase inhibition with PP2 attenuated these effects, indicating that Src kinases are critical mediators of WISP1-induced MMP regulation [31,63,64]. Src is a well-established regulator of MMP expression and activity and often cooperates with FAK to drive cancer cell invasion and migration [65,66]. In particular, Src–FAK signaling upregulates MMP2 and MT1-MMP, which degrade type IV collagen in the basement membrane, a key barrier to cancer invasion [67,68]. Thus, WISP1’s activation of Src facilitates ECM degradation and promotes tumor cell migration, consistent with mechanisms observed in other Src-driven invasive cancer models. Notably, blockade of MIF activity reduced WISP1-induced MMP1 and MMP2 protein levels as well as MMP1/TIMP1 and MMP2/TIMP2 ratios, while exogenous MIF enhanced all examined MMPs, suggesting that the WISP1/MIF axis broadly elevates MMPs in non-invasive breast cancer cells, contributing to a pro-invasive phenotype. However, MIF blockade further increased MMP9 and the MMP9/TIMP1 ratio, and it similarly increased MT1-MMP and the MT1-MMP/TIMP2 ratio, implying a more complex, context-dependent role for MIF in regulating MMP9 and MT1-MMP that warrants further investigation.
We also identified NDRG1 as a downstream target repressed by WISP1 and MIF. As a metastasis suppressor that stabilizes E-cadherin and restrains oncogenic pathways (PI3K/Akt, Src, NF-κB) [69,70], its suppression provides a mechanistic link between WISP1 signaling and loss of epithelial integrity. Both Src and MIF inhibition restored NDRG1 expression while attenuating survival, migration, indicating that both pathways act as intermediates in WISP1 signaling. The inverse relationship between NDRG1 expression and cell viability is consistent with reports linking NDRG1 to proliferative and metastatic pahenotypes [71]. Recombinant MIF alone similarly suppressed NDRG1 and enhanced survival, highlighting its dual role as both a mediator of WISP1 activity and an independent tumor-promoting factor. In parallel, WISP1 was found to significantly enhance breast cancer cell migration, accompanied by cytoskeletal remodeling characterized by actin filament reorganization, stess fiber formation and cell elongation, features typically associated with a motile phenotype. MIF induced a comparable response. These changes were attenuated by Src inhibition or MIF blockade, indicating that the same mechanisms mediating NDRG1 repression also regulate actin organization and motility. Given the central role of cytoskeletal dynamics in metastatic dissemination, these results extend the pro-survival functions of WISP1/Src/MIF axis to induce motility programs that enable invasion.
5. Conclusion
This study provides evidence that the WISP1/Src/MIF axis plays a pivotal role in driving the aggressiveness of non-invasive MCF7 breast cancer cells, a widely used cellular model for ER+ breast cancer studies, particularly through regulation of cell survival, migration, and ECM remodeling. By activating Lyn/Fyn–MIF signaling, WISP1 amplifies EMT, ECM remodeling, and survival pathways while repressing metastasis suppressors such as NDRG1. MIF cytokine seems to be a major mediator of WISP1-induced changes in cell shape, scattering, proliferation and invasiveness along with the elimination of E-cadhering from the cell membrane. This suggests that specific cues from the tumor microenvironment can activate a migratory/invasive phenotype in a subpopulation of cells residing within the heterogeneous breast tumor. The present study establish WISP1 as a nexus linking intracellular signaling to microenvironmental remodeling and identify Lyn, MIF/CD74, and HA metabolism as promising therapeutic targets in metastatic breast cancer subtypes. Future studies should evaluate whether targeting WISP1 signaling, alone or in combination with endocrine or chemotherapy, to counteract therapy resistance and improve treatment outcomes in aggressive, hormone therapy-resistant breast cancer.
Author Contributions
Conceptualization, MEC, AA; Investigation, MEC, PK, AA, SSS; Writing—review and editing, MEC, PK, AA, SSS; Project administration, MEC, SSS. All authors have read and agreed to the published version of the manuscript.
Funding
This research received no external funding.
Data Availability Statement
The data presented in this study are available on reasonable request from the corresponding author.
Acknowledgments
The authors wish to thank Mr. Stylianos Astaras and Mrs. Theodora-Dionysia Sarantopoulou (MSc students) for technical assistance.
Conflicts of Interest
The authors declare no conflict of interest.
References
- Fumagalli C, and Barberis M. Breast Cancer Heterogeneity. Diagnostics (Basel) 11: 2021.
- Harbeck N, Penault-Llorca F, Cortes J, Gnant M, Houssami N, Poortmans P, Ruddy K, Tsang J, and Cardoso F. Breast cancer. Nature Reviews Disease Primers 5: 66, 2019.
- Luond F, Tiede S, and Christofori G. Breast cancer as an example of tumour heterogeneity and tumour cell plasticity during malignant progression. Br J Cancer 125: 164-175, 2021. [CrossRef]
- Yeo SK, and Guan JL. Breast Cancer: Multiple Subtypes within a Tumor? Trends Cancer 3: 753-760, 2017. [CrossRef]
- Yin L, Duan J-J, Bian X-W, and Yu S-c. Triple-negative breast cancer molecular subtyping and treatment progress. Breast Cancer Research 22: 61, 2020. [CrossRef]
- Sflomos G, Dormoy V, Metsalu T, Jeitziner R, Battista L, Scabia V, Raffoul W, Delaloye JF, Treboux A, Fiche M, Vilo J, Ayyanan A, and Brisken C. A Preclinical Model for ERalpha-Positive Breast Cancer Points to the Epithelial Microenvironment as Determinant of Luminal Phenotype and Hormone Response. Cancer Cell 29: 407-422, 2016. [CrossRef]
- Li JJ, Tsang JY, and Tse GM. Tumor Microenvironment in Breast Cancer-Updates on Therapeutic Implications and Pathologic Assessment. Cancers (Basel) 13: 2021. [CrossRef]
- Fico F, and Santamaria-Martinez A. The Tumor Microenvironment as a Driving Force of Breast Cancer Stem Cell Plasticity. Cancers (Basel) 12: 2020. [CrossRef]
- Skandalis SS, Tsoukala E, Sarantopoulou TD, and Christopoulou ME. Matrix: a complex amalgam of structures and functions in tumor microenvironment. FEBS Open Bio 2025. [CrossRef]
- Asleh K, Riaz N, and Nielsen TO. Heterogeneity of triple negative breast cancer: Current advances in subtyping and treatment implications. Journal of Experimental & Clinical Cancer Research 41: 265, 2022. [CrossRef]
- Wang Y, and Minden A. Current Molecular Combination Therapies Used for the Treatment of Breast Cancer. Int J Mol Sci 23: 2022. [CrossRef]
- Christopoulou ME, Aletras AJ, Papakonstantinou E, Stolz D, and Skandalis SS. WISP1 and Macrophage Migration Inhibitory Factor in Respiratory Inflammation: Novel Insights and Therapeutic Potentials for Asthma and COPD. Int J Mol Sci 25: 2024. [CrossRef]
- Wu J, Long Z, Cai H, Du C, Liu X, Yu S, and Wang Y. High expression of WISP1 in colon cancer is associated with apoptosis, invasion and poor prognosis. Oncotarget 7: 49834-49847, 2016. [CrossRef]
- Chiang KC, Hsu SY, Lin SJ, Yeh CN, Pang JH, Wang SY, Hsu JT, Yeh TS, Chen LW, Kuo SF, Cheng YC, and Juang HH. PTEN Insufficiency Increases Breast Cancer Cell Metastasis In Vitro and In Vivo in a Xenograft Zebrafish Model. Anticancer Res 36: 3997-4005, 2016.
- Liu Y, Song Y, Ye M, Hu X, Wang ZP, and Zhu X. The emerging role of WISP proteins in tumorigenesis and cancer therapy. J Transl Med 17: 28, 2019. [CrossRef]
- Xie D, Nakachi K, Wang H, Elashoff R, and Koeffler HP. Elevated levels of connective tissue growth factor, WISP-1, and CYR61 in primary breast cancers associated with more advanced features. Cancer Res 61: 8917-8923, 2001.
- Deng W, Fernandez A, McLaughlin SL, and Klinke DJ, 2nd. WNT1-inducible signaling pathway protein 1 (WISP1/CCN4) stimulates melanoma invasion and metastasis by promoting the epithelial-mesenchymal transition. J Biol Chem 294: 5261-5280, 2019. [CrossRef]
- Chang AC, Lien MY, Tsai MH, Hua CH, and Tang CH. WISP-1 Promotes Epithelial-Mesenchymal Transition in Oral Squamous Cell Carcinoma Cells Via the miR-153-3p/Snail Axis. Cancers (Basel) 11: 2019. [CrossRef]
- Richard V, Kindt N, and Saussez S. Macrophage migration inhibitory factor involvement in breast cancer (Review). Int J Oncol 47: 1627-1633, 2015. [CrossRef]
- Richard V, Kindt N, Decaestecker C, Gabius HJ, Laurent G, Noël JC, and Saussez S. Involvement of macrophage migration inhibitory factor and its receptor (CD74) in human breast cancer. Oncol Rep 32: 523-529, 2014. [CrossRef]
- Charan M, Das S, Mishra S, Chatterjee N, Varikuti S, Kaul K, Misri S, Ahirwar DK, Satoskar AR, and Ganju RK. Macrophage migration inhibitory factor inhibition as a novel therapeutic approach against triple-negative breast cancer. Cell Death & Disease 11: 774, 2020. [CrossRef]
- Verjans E, Noetzel E, Bektas N, Schutz AK, Lue H, Lennartz B, Hartmann A, Dahl E, and Bernhagen J. Dual role of macrophage migration inhibitory factor (MIF) in human breast cancer. BMC Cancer 9: 230, 2009. [CrossRef]
- Charan M, Das S, Mishra S, Chatterjee N, Varikuti S, Kaul K, Misri S, Ahirwar DK, Satoskar AR, and Ganju RK. Macrophage migration inhibitory factor inhibition as a novel therapeutic approach against triple-negative breast cancer. Cell Death Dis 11: 774, 2020. [CrossRef]
- Verjans E, Noetzel E, Bektas N, Schütz AK, Lue H, Lennartz B, Hartmann A, Dahl E, and Bernhagen J. Dual role of macrophage migration inhibitory factor (MIF) in human breast cancer. BMC Cancer 9: 230, 2009. [CrossRef]
- Mora Barthelmess R, Stijlemans B, and Van Ginderachter JA. Hallmarks of Cancer Affected by the MIF Cytokine Family. Cancers (Basel) 15: 2023.
- Xu X, Wang B, Ye C, Yao C, Lin Y, Huang X, Zhang Y, and Wang S. Overexpression of macrophage migration inhibitory factor induces angiogenesis in human breast cancer. Cancer Lett 261: 147-157, 2008. [CrossRef]
- Conroy H, Mawhinney L, and Donnelly SC. Inflammation and cancer: macrophage migration inhibitory factor (MIF)--the potential missing link. QJM 103: 831-836, 2010. [CrossRef]
- Mitchell RA. Mechanisms and effectors of MIF-dependent promotion of tumourigenesis. Cell Signal 16: 13-19, 2004. [CrossRef]
- Wang SS, Cen X, Liang XH, and Tang YL. Macrophage migration inhibitory factor: a potential driver and biomarker for head and neck squamous cell carcinoma. Oncotarget 8: 10650-10661, 2017. [CrossRef]
- Valdez CN, Sánchez-Zuno GA, Bucala R, and Tran TT. Macrophage Migration Inhibitory Factor (MIF) and D-Dopachrome Tautomerase (DDT): Pathways to Tumorigenesis and Therapeutic Opportunities. Int J Mol Sci 25: 2024. [CrossRef]
- Christopoulou ME, Skandalis SS, Papakonstantinou E, Stolz D, and Aletras AJ. WISP1 induces the expression of macrophage migration inhibitory factor in human lung fibroblasts through Src kinases and EGFR-activated signaling pathways. Am J Physiol Cell Physiol 326: C850-C865, 2024. [CrossRef]
- Gaudreau PO, Clairefond S, Class CA, Boulay PL, Chrobak P, Allard B, Azzi F, Pommey S, Do KA, Saad F, Trudel D, Young M, and Stagg J. WISP1 is associated to advanced disease, EMT and an inflamed tumor microenvironment in multiple solid tumors. Oncoimmunology 8: e1581545, 2019. [CrossRef]
- Chiang KC, Yeh CN, Chung LC, Feng TH, Sun CC, Chen MF, Jan YY, Yeh TS, Chen SC, and Juang HH. WNT-1 inducible signaling pathway protein-1 enhances growth and tumorigenesis in human breast cancer. Sci Rep 5: 8686, 2015. [CrossRef]
- Niland S, Riscanevo AX, and Eble JA. Matrix Metalloproteinases Shape the Tumor Microenvironment in Cancer Progression. Int J Mol Sci 23: 2021. [CrossRef]
- Christopoulou ME, Papakonstantinou E, and Stolz D. Matrix Metalloproteinases in Chronic Obstructive Pulmonary Disease. Int J Mol Sci 24: 2023. [CrossRef]
- Nivison MP, and Meier KE. The role of CCN4/WISP-1 in the cancerous phenotype. Cancer Manag Res 10: 2893-2903, 2018. [CrossRef]
- Jung EK, Kim SA, Yoon TM, Lee KH, Kim HK, Lee DH, Lee JK, Chung IJ, Joo YE, and Lim SC. WNT1-inducible signaling pathway protein-1 contributes to tumor progression and treatment failure in oral squamous cell carcinoma. Oncol Lett 14: 1719-1724, 2017. [CrossRef]
- Wang QY, Feng YJ, and Ji R. High expression of WISP1 promotes metastasis and predicts poor prognosis in hepatocellular carcinoma. Eur Rev Med Pharmacol Sci 24: 10445-10451, 2020. [CrossRef]
- Fernandez A, Deng W, McLaughlin SL, Pirkey AC, Rellick SL, Razazan A, and Klinke DJ, 2nd. Cell Communication Network factor 4 promotes tumor-induced immunosuppression in melanoma. EMBO Rep 23: e54127, 2022. [CrossRef]
- Davies SR, Watkins G, Mansel RE, and Jiang WG. Differential expression and prognostic implications of the CCN family members WISP-1, WISP-2, and WISP-3 in human breast cancer. Ann Surg Oncol 14: 1909-1918, 2007.
- Tao W, Chu C, Zhou W, Huang Z, Zhai K, Fang X, Huang Q, Zhang A, Wang X, Yu X, Huang H, Wu Q, Sloan AE, Yu JS, Li X, Stark GR, Rich JN, and Bao S. Dual Role of WISP1 in maintaining glioma stem cells and tumor-supportive macrophages in glioblastoma. Nat Commun 11: 3015, 2020. [CrossRef]
- Lv W, Chen N, Lin Y, Ma H, Ruan Y, Li Z, Li X, Pan X, and Tian X. Macrophage migration inhibitory factor promotes breast cancer metastasis via activation of HMGB1/TLR4/NF kappa B axis. Cancer Lett 375: 245-255, 2016. [CrossRef]
- Balogh KN, Templeton DJ, and Cross JV. Macrophage Migration Inhibitory Factor protects cancer cells from immunogenic cell death and impairs anti-tumor immune responses. PLoS One 13: e0197702, 2018. [CrossRef]
- Simpson KD, Templeton DJ, and Cross JV. Macrophage migration inhibitory factor promotes tumor growth and metastasis by inducing myeloid-derived suppressor cells in the tumor microenvironment. J Immunol 189: 5533-5540, 2012. [CrossRef]
- Koh HM, and Kim DC. Prognostic significance of macrophage migration inhibitory factor expression in cancer patients: A systematic review and meta-analysis. Medicine (Baltimore) 99: e21575, 2020.
- Patel A, Sabbineni H, Clarke A, and Somanath PR. Novel roles of Src in cancer cell epithelial-to-mesenchymal transition, vascular permeability, microinvasion and metastasis. Life Sci 157: 52-61, 2016. [CrossRef]
- Liu Z, Chu S, Yao S, Li Y, Fan S, Sun X, Su L, and Liu X. CD74 interacts with CD44 and enhances tumorigenesis and metastasis via RHOA-mediated cofilin phosphorylation in human breast cancer cells. Oncotarget 7: 68303-68313, 2016. [CrossRef]
- Durst B, Sorg RV, Röder G, Betz B, Beckmann MW, Niederacher D, Bender HG, and Dall P. The influence of hormones on CD44 expression in endometrial and breast carcinomas. Oncol Rep 8: 987-993, 2001. [CrossRef]
- Friedrichs K, Franke F, Lisboa BW, Kügler G, Gille I, Terpe HJ, Hölzel F, Maass H, and Günthert U. CD44 isoforms correlate with cellular differentiation but not with prognosis in human breast cancer. Cancer Res 55: 5424-5433, 1995.
- !!! INVALID CITATION !!! (16).
- Thiery JP, Acloque H, Huang RY, and Nieto MA. Epithelial-mesenchymal transitions in development and disease. Cell 139: 871-890, 2009. [CrossRef]
- Basu S, Cheriyamundath S, and Ben-Ze’ev A. Cell-cell adhesion: linking Wnt/beta-catenin signaling with partial EMT and stemness traits in tumorigenesis. F1000Res 7: 2018. [CrossRef]
- Santarosa M, and Maestro R. The Autophagic Route of E-Cadherin and Cell Adhesion Molecules in Cancer Progression. Cancers 13: 6328, 2021. [CrossRef]
- Shi X, Leng L, Wang T, Wang W, Du X, Li J, McDonald C, Chen Z, Murphy JW, Lolis E, Noble P, Knudson W, and Bucala R. CD44 is the signaling component of the macrophage migration inhibitory factor-CD74 receptor complex. Immunity 25: 595-606, 2006. [CrossRef]
- Jankauskas SS, Wong DWL, Bucala R, Djudjaj S, and Boor P. Evolving complexity of MIF signaling. Cell Signal 57: 76-88, 2019. [CrossRef]
- Karousou E, Kamiryo M, Skandalis SS, Ruusala A, Asteriou T, Passi A, Yamashita H, Hellman U, Heldin CH, and Heldin P. The activity of hyaluronan synthase 2 is regulated by dimerization and ubiquitination. J Biol Chem 285: 23647-23654, 2010. [CrossRef]
- Yamamoto H, Tobisawa Y, Inubushi T, Irie F, Ohyama C, and Yamaguchi Y. A mammalian homolog of the zebrafish transmembrane protein 2 (TMEM2) is the long-sought-after cell-surface hyaluronidase. J Biol Chem 292: 7304-7313, 2017. [CrossRef]
- Singh K, and Oladipupo SS. An overview of CCN4 (WISP1) role in human diseases. Journal of Translational Medicine 22: 601, 2024. [CrossRef]
- Tavianatou AG, Piperigkou Z, Barbera C, Beninatto R, Masola V, Caon I, Onisto M, Franchi M, Galesso D, and Karamanos NK. Molecular size-dependent specificity of hyaluronan on functional properties, morphology and matrix composition of mammary cancer cells. Matrix Biol Plus 3: 100008, 2019. [CrossRef]
- Hassn Mesrati M, Syafruddin SE, Mohtar MA, and Syahir A. CD44: A Multifunctional Mediator of Cancer Progression. Biomolecules 11: 2021. [CrossRef]
- Misra S, Heldin P, Hascall VC, Karamanos NK, Skandalis SS, Markwald RR, and Ghatak S. Hyaluronan-CD44 interactions as potential targets for cancer therapy. FEBS J 278: 1429-1443, 2011. [CrossRef]
- Wan X, Liu J, Lu JF, Tzelepi V, Yang J, Starbuck MW, Diao L, Wang J, Efstathiou E, Vazquez ES, Troncoso P, Maity SN, and Navone NM. Activation of beta-catenin signaling in androgen receptor-negative prostate cancer cells. Clin Cancer Res 18: 726-736, 2012. [CrossRef]
- Luo J, Zou H, Guo Y, Tong T, Ye L, Zhu C, Deng L, Wang B, Pan Y, and Li P. SRC kinase-mediated signaling pathways and targeted therapies in breast cancer. Breast Cancer Res 24: 99, 2022. [CrossRef]
- Gautam J, Banskota S, Lee H, Lee Y-J, Jeon YH, Kim J-A, and Jeong B-S. Down-regulation of cathepsin S and matrix metalloproteinase-9 via Src, a non-receptor tyrosine kinase, suppresses triple-negative breast cancer growth and metastasis. Experimental & Molecular Medicine 50: 1-14, 2018. [CrossRef]
- Tai YL, Chen LC, and Shen TL. Emerging roles of focal adhesion kinase in cancer. Biomed Res Int 2015: 690690, 2015. [CrossRef]
- Tan X, Yan Y, Song B, Zhu S, Mei Q, and Wu K. Focal adhesion kinase: from biological functions to therapeutic strategies. Exp Hematol Oncol 12: 83, 2023. [CrossRef]
- Juarez-Cruz JC, Zuniga-Eulogio MD, Olea-Flores M, Castaneda-Saucedo E, Mendoza-Catalan MA, Ortuno-Pineda C, Moreno-Godinez ME, Villegas-Comonfort S, Padilla-Benavides T, and Navarro-Tito N. Leptin induces cell migration and invasion in a FAK-Src-dependent manner in breast cancer cells. Endocr Connect 8: 1539-1552, 2019. [CrossRef]
- Cortes-Reynosa P, Robledo T, Macias-Silva M, Wu SV, and Salazar EP. Src kinase regulates metalloproteinase-9 secretion induced by type IV collagen in MCF-7 human breast cancer cells. Matrix Biol 27: 220-231, 2008. [CrossRef]
- Kovacevic Z, Menezes SV, Sahni S, Kalinowski DS, Bae DH, Lane DJ, and Richardson DR. The Metastasis Suppressor, N-MYC Downstream-regulated Gene-1 (NDRG1), Down-regulates the ErbB Family of Receptors to Inhibit Downstream Oncogenic Signaling Pathways. J Biol Chem 291: 1029-1052, 2016. [CrossRef]
- Menezes SV, Fouani L, Huang MLH, Geleta B, Maleki S, Richardson A, Richardson DR, and Kovacevic Z. The metastasis suppressor, NDRG1, attenuates oncogenic TGF-beta and NF-kappaB signaling to enhance membrane E-cadherin expression in pancreatic cancer cells. Carcinogenesis 40: 805-818, 2019. [CrossRef]
- Kotepui K, Kotepui M, Majima HJ, and Tangpong J. Association between NDRG1 protein expression and aggressive features of breast cancer: a systematic review and meta-analysis. BMC Cancer 23: 1003, 2023. [CrossRef]
Figure 1.
WISP1 induces MIF expression and secretion via Src kinase activation. (A) MCF7 cells were cultured with increasing concentrations of recombinant WISP1 (0, 125, 250, 500, and 1000 ng/mL) for 24 h, and secreted MIF protein levels were measured in cell culture supernatants by ELISA. (B) Western blot analysis of secreted MIF in supernatants from MCF7 cells. Cells were untreated (–WISP1) or treated with WISP1 (+WISP1). Recombinant MIF (rMIF) was used as a positive control. Cell culture supernatants were collected and immunoblotted with an anti-MIF antibody. A band at ~12,5 kDa indicates secreted MIF. (C–D) MCF7 cells were pretreated for 30 minutes with the Src kinase inhibitor PP2 (1 μM) or the MIF inhibitor ISO-1 (100 μM), followed by stimulation with WISP1 (500 ng/mL) for 24 h. (C) MIF mRNA expression was analyzed by quantitative PCR (qPCR). (D) Secreted MIF protein levels in the cell culture supernatants were quantified by ELISA. (E) In situ kinase assay of Lyn, Fyn, and c-Src phosphorylation in cells treated with WISP1 (500 ng/mL) in the presence or absence of MIF inhibitor ISO-1 (100 µM), or recombinant MIF (150 ng/mL). Data are mean ± SD from n = 3 independent experiments. Statistical analysis was performed as described in Methods (one-way or two-way ANOVA with Tukey’s multiple comparisons test, as appropriate). *P < 0.05; **P < 0.01; ***P < 0.001.
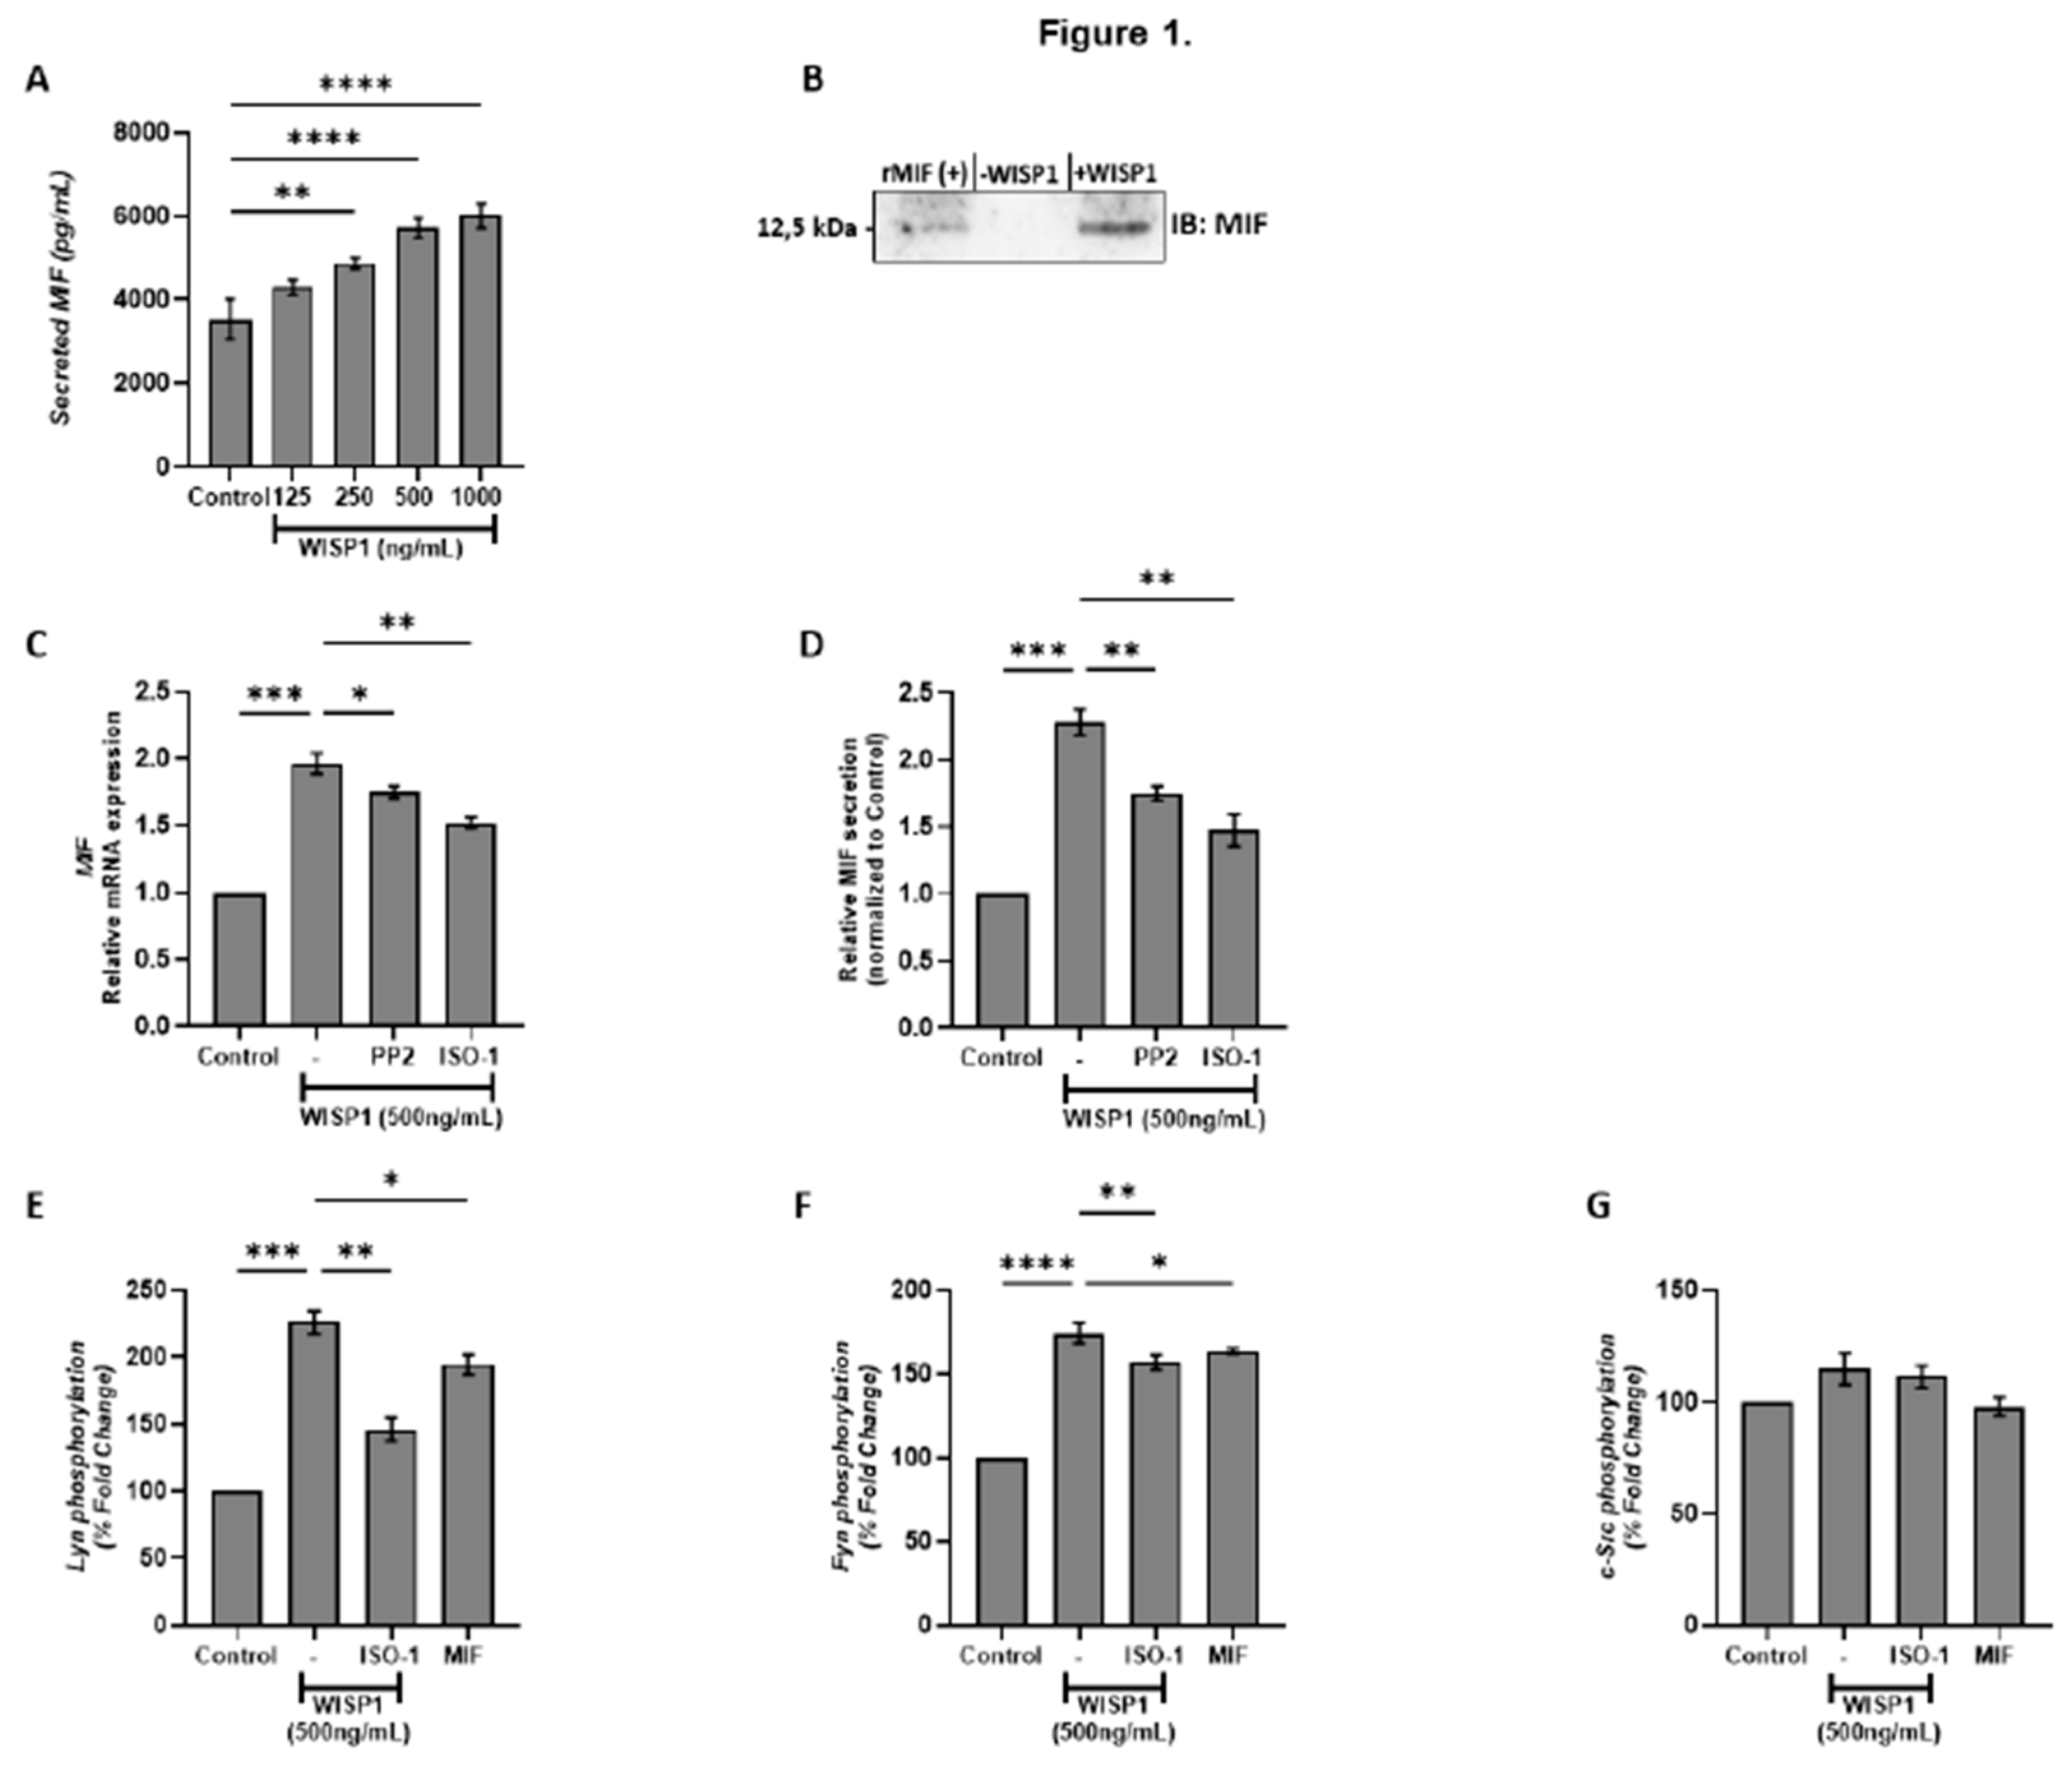
Figure 2.
WISP1 regulates CD74 and CD44 mRNA expression. MCF7 cells were treated for 24 h with WISP1 (500 ng/mL). Where indicated, cells were pre-treated for 1 h with the Src kinase inhibitor PP2 (1 µM) or the MIF inhibitor ISO-1 (100 µM) prior to WISP1 stimulation; a recombinant human MIF (rhMIF, 150 ng/mL) condition was also included. (A–C) Relative mRNA expression of total CD44 (CD44t) (A), standard CD44 (CD44s) (B), and CD74 (C) under WISP1 ± inhibitor conditions, quantified by qPCR, normalized to GAPDH, and expressed relative to untreated control. (D) Relative mRNA expression of CD74 and CD44t in cells treated with rhMIF (150 ng/mL) for 24 h, analyzed as above. Data are mean ± SD from n = 3 independent experiments. Statistical analysis was performed as described in Methods (one-way or two-way ANOVA with Tukey’s multiple comparisons test, as appropriate). *P < 0.05; **P < 0.01; ***P < 0.001.
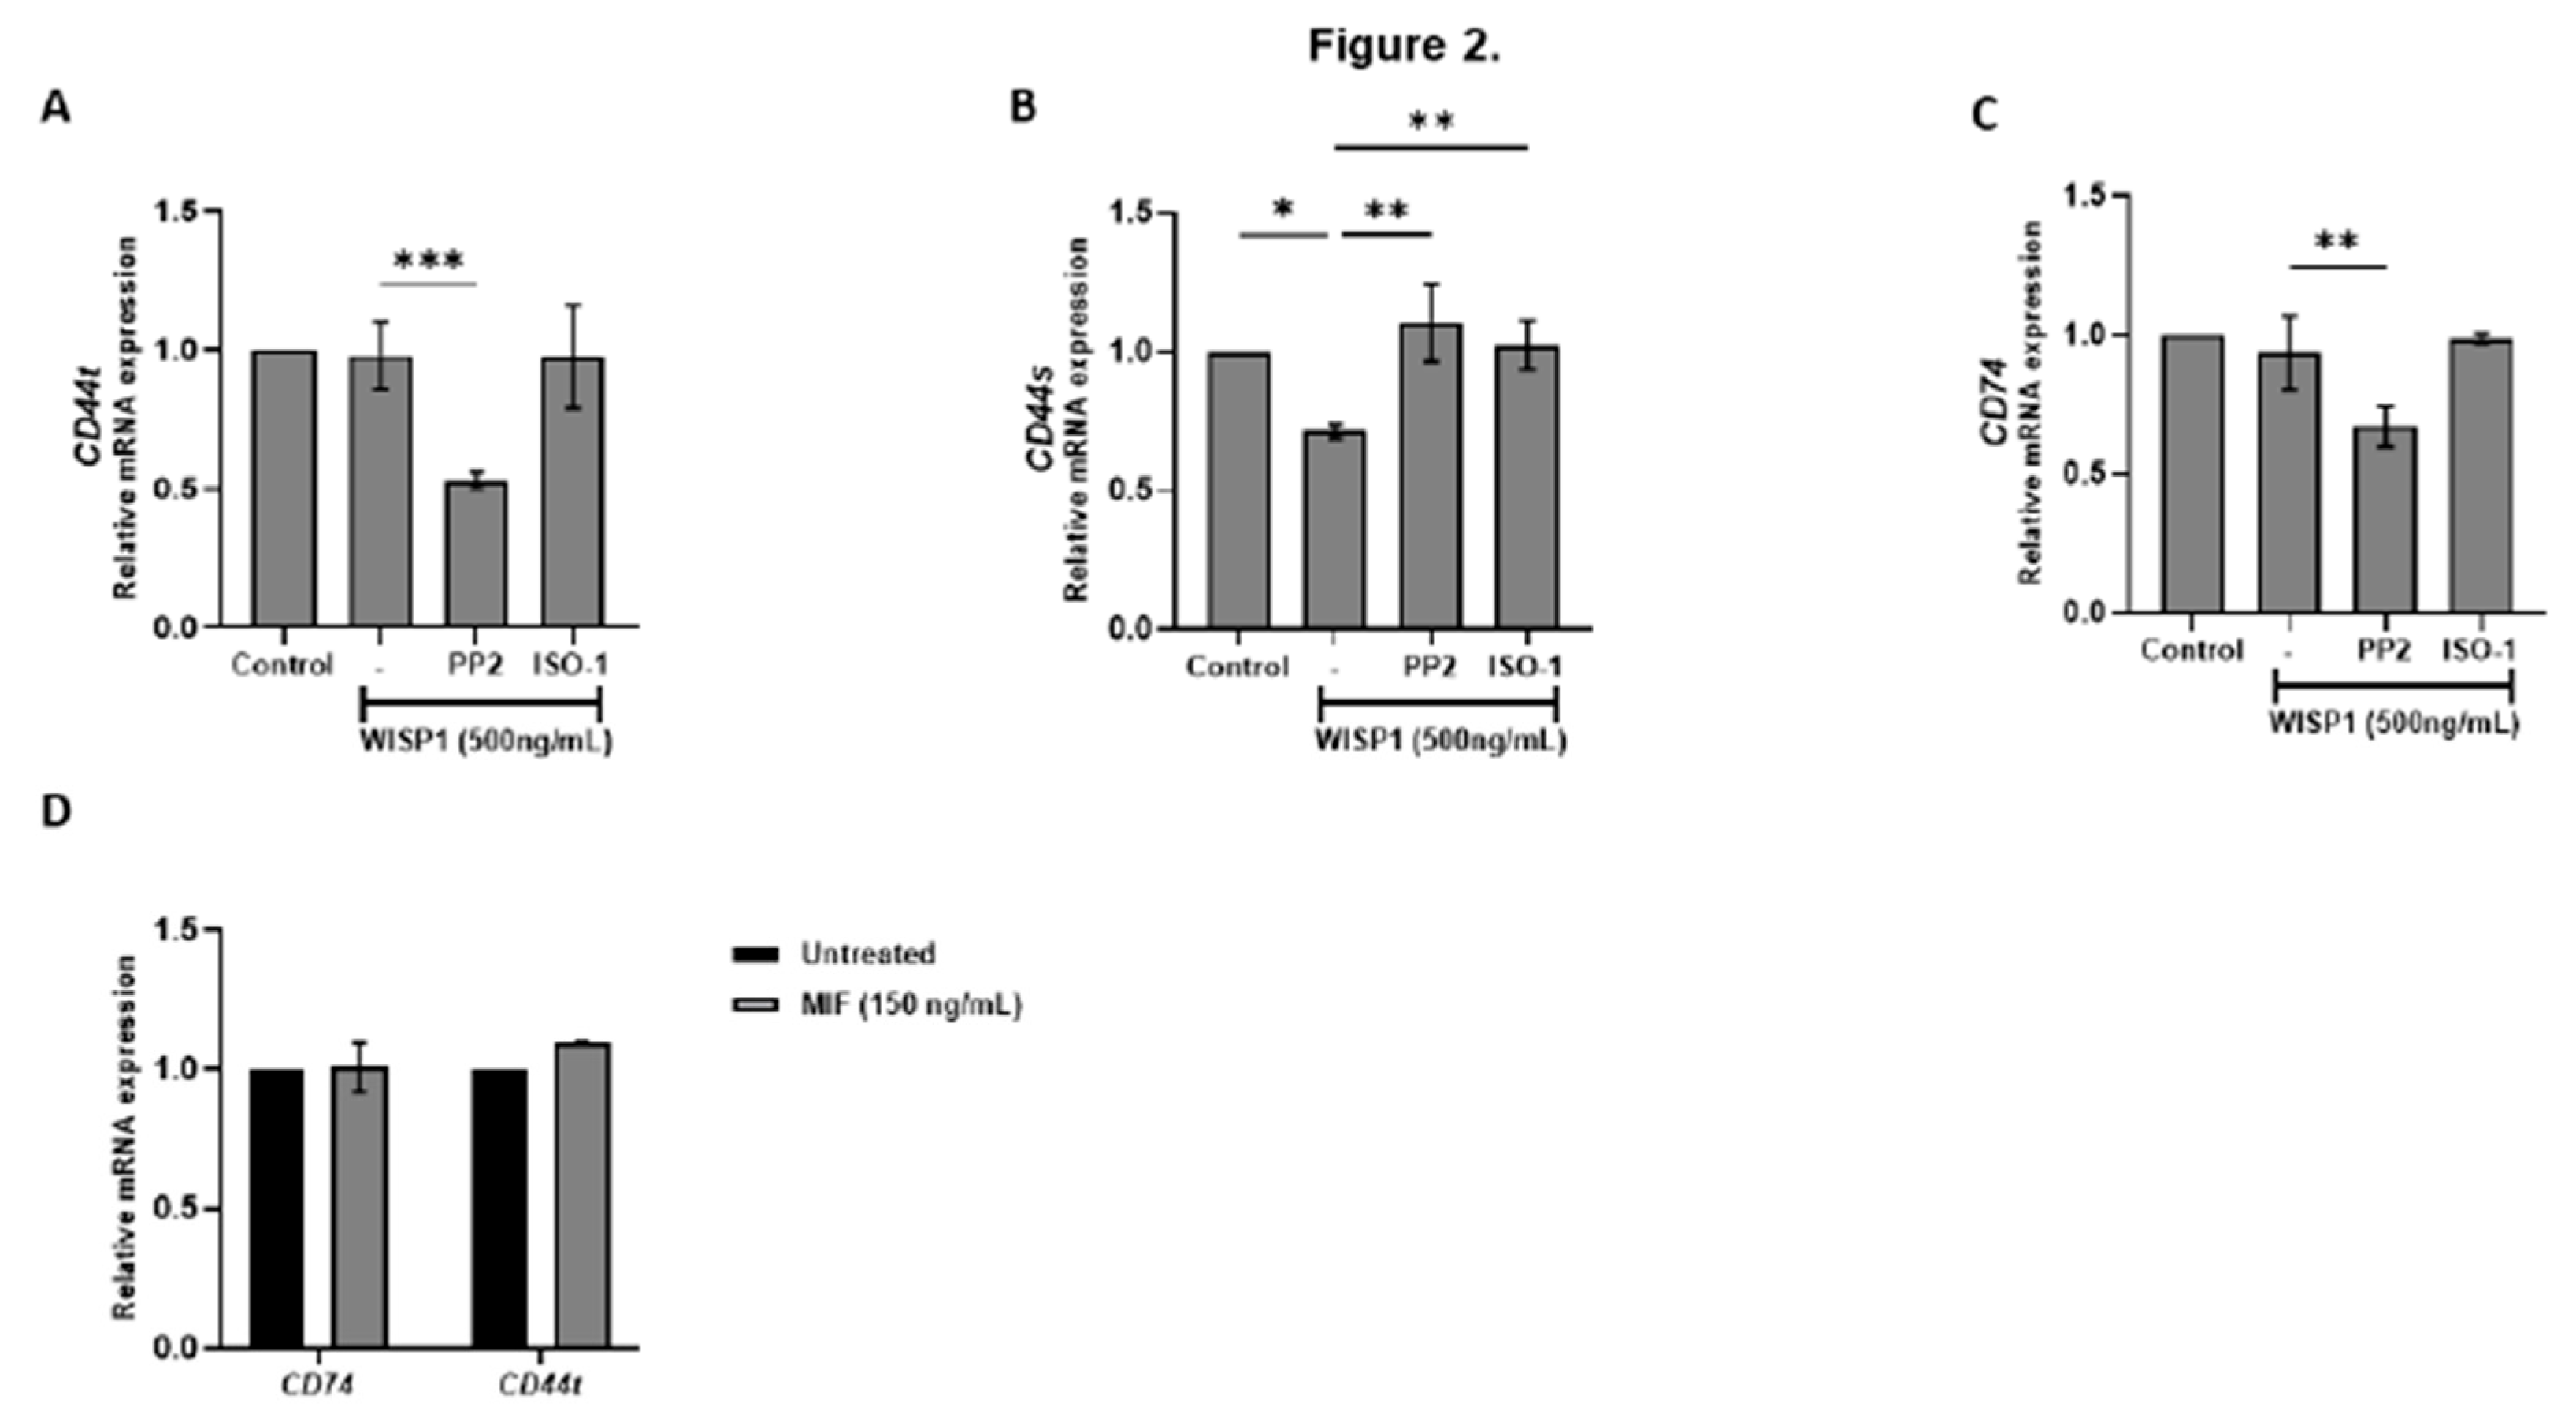
Figure 3.
WISP1 and MIF modulate EMT marker expression via Src kinases. MCF7 cells were treated for 24 h with WISP1 (500 ng/mL). Where indicated, cells were co-treated with the Src kinase inhibitor PP2 (1 µM), MIF inhibitor ISO-1 (100 µM), or recombinant human MIF (150 ng/mL). (A–C) Relative mRNA expression of E-cadherin (A), fibronectin (B), and vimentin (C) quantified by qPCR, normalized to GAPDH, and expressed relative to untreated control. (D) Western blot analysis of E-cadherin in cell lysates from the same treatment conditions; α-tubulin served as a loading control. Densitometric quantification of band intensities is shown below the blots. (E) Representative immunofluorescence images of E-cadherin (green) and nuclei (DAPI, blue) under the indicated treatments; insets show higher-magnification (40X) views highlighting cell–cell junctions. Scale bars, 20 µm. Data are mean ± SD from n = 3 independent experiments. Statistical analysis was performed as described in Methods (one-way or two-way ANOVA with Tukey’s multiple comparisons test, as appropriate). *P < 0.05; **P < 0.01; ***P < 0.001; ****P < 0.0001.
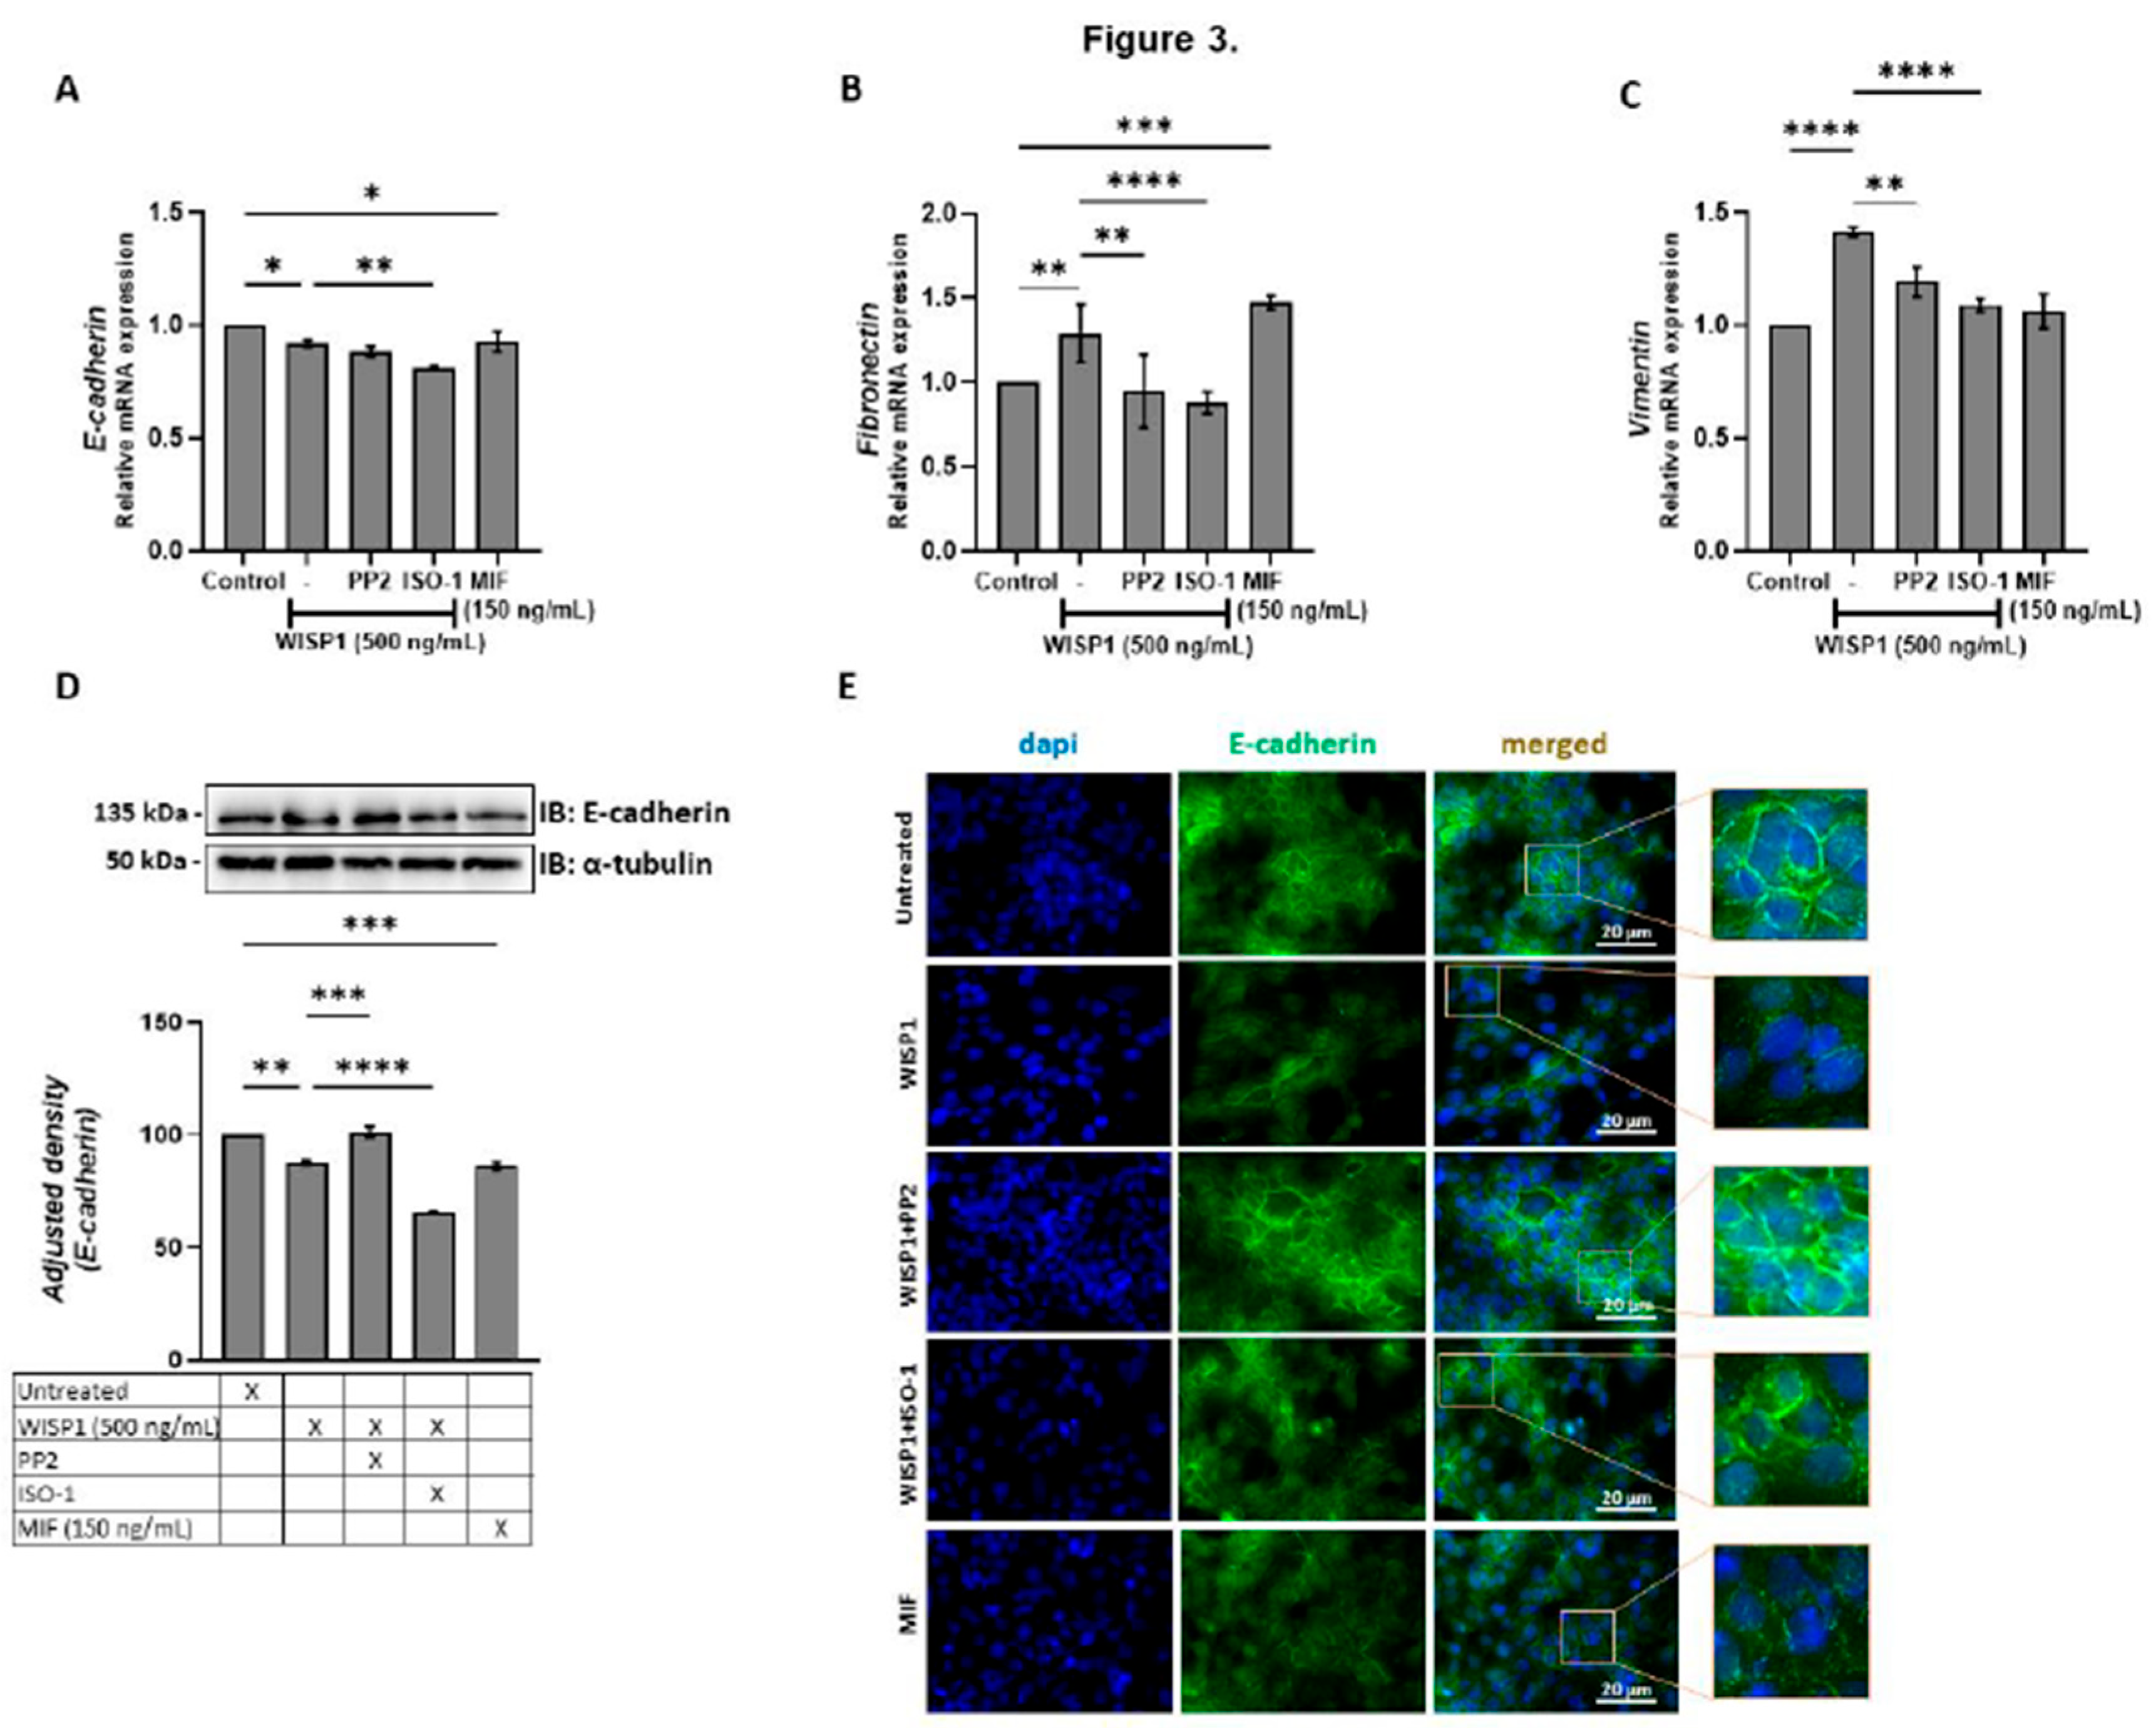
Figure 4.
WISP1 regulates hyaluronan metabolism via Src and MIF signaling. MCF7 cells were treated with WISP1 (500 ng/mL) in the presence or absence of the Src family kinase inhibitor PP2 (1 µM), MIF inhibitor ISO-1 (100 µM), or recombinant human MIF (150 ng/mL). (A-C, E-G) Gene expression analysis of HAS1 (A), HAS2 (B), HAS3 (C), Hyal1 (E), Hyal2 (F), and TMEM2 (G) by qPCR, normalized to GAPDH and expressed relative to untreated control. (D) Secreted hyaluronan (HA) quantified by ELISA from the same treatment conditions; HA is expressed as percent of untreated cells (control) and normalized to cell number. Data are mean ± SD from n = 3 independent experiments. Statistical analysis was performed as described in Methods (one-way or two-way ANOVA with Tukey’s multiple comparisons test, as appropriate). *P < 0.05; **P < 0.01; ***P < 0.001; ****P < 0.0001.
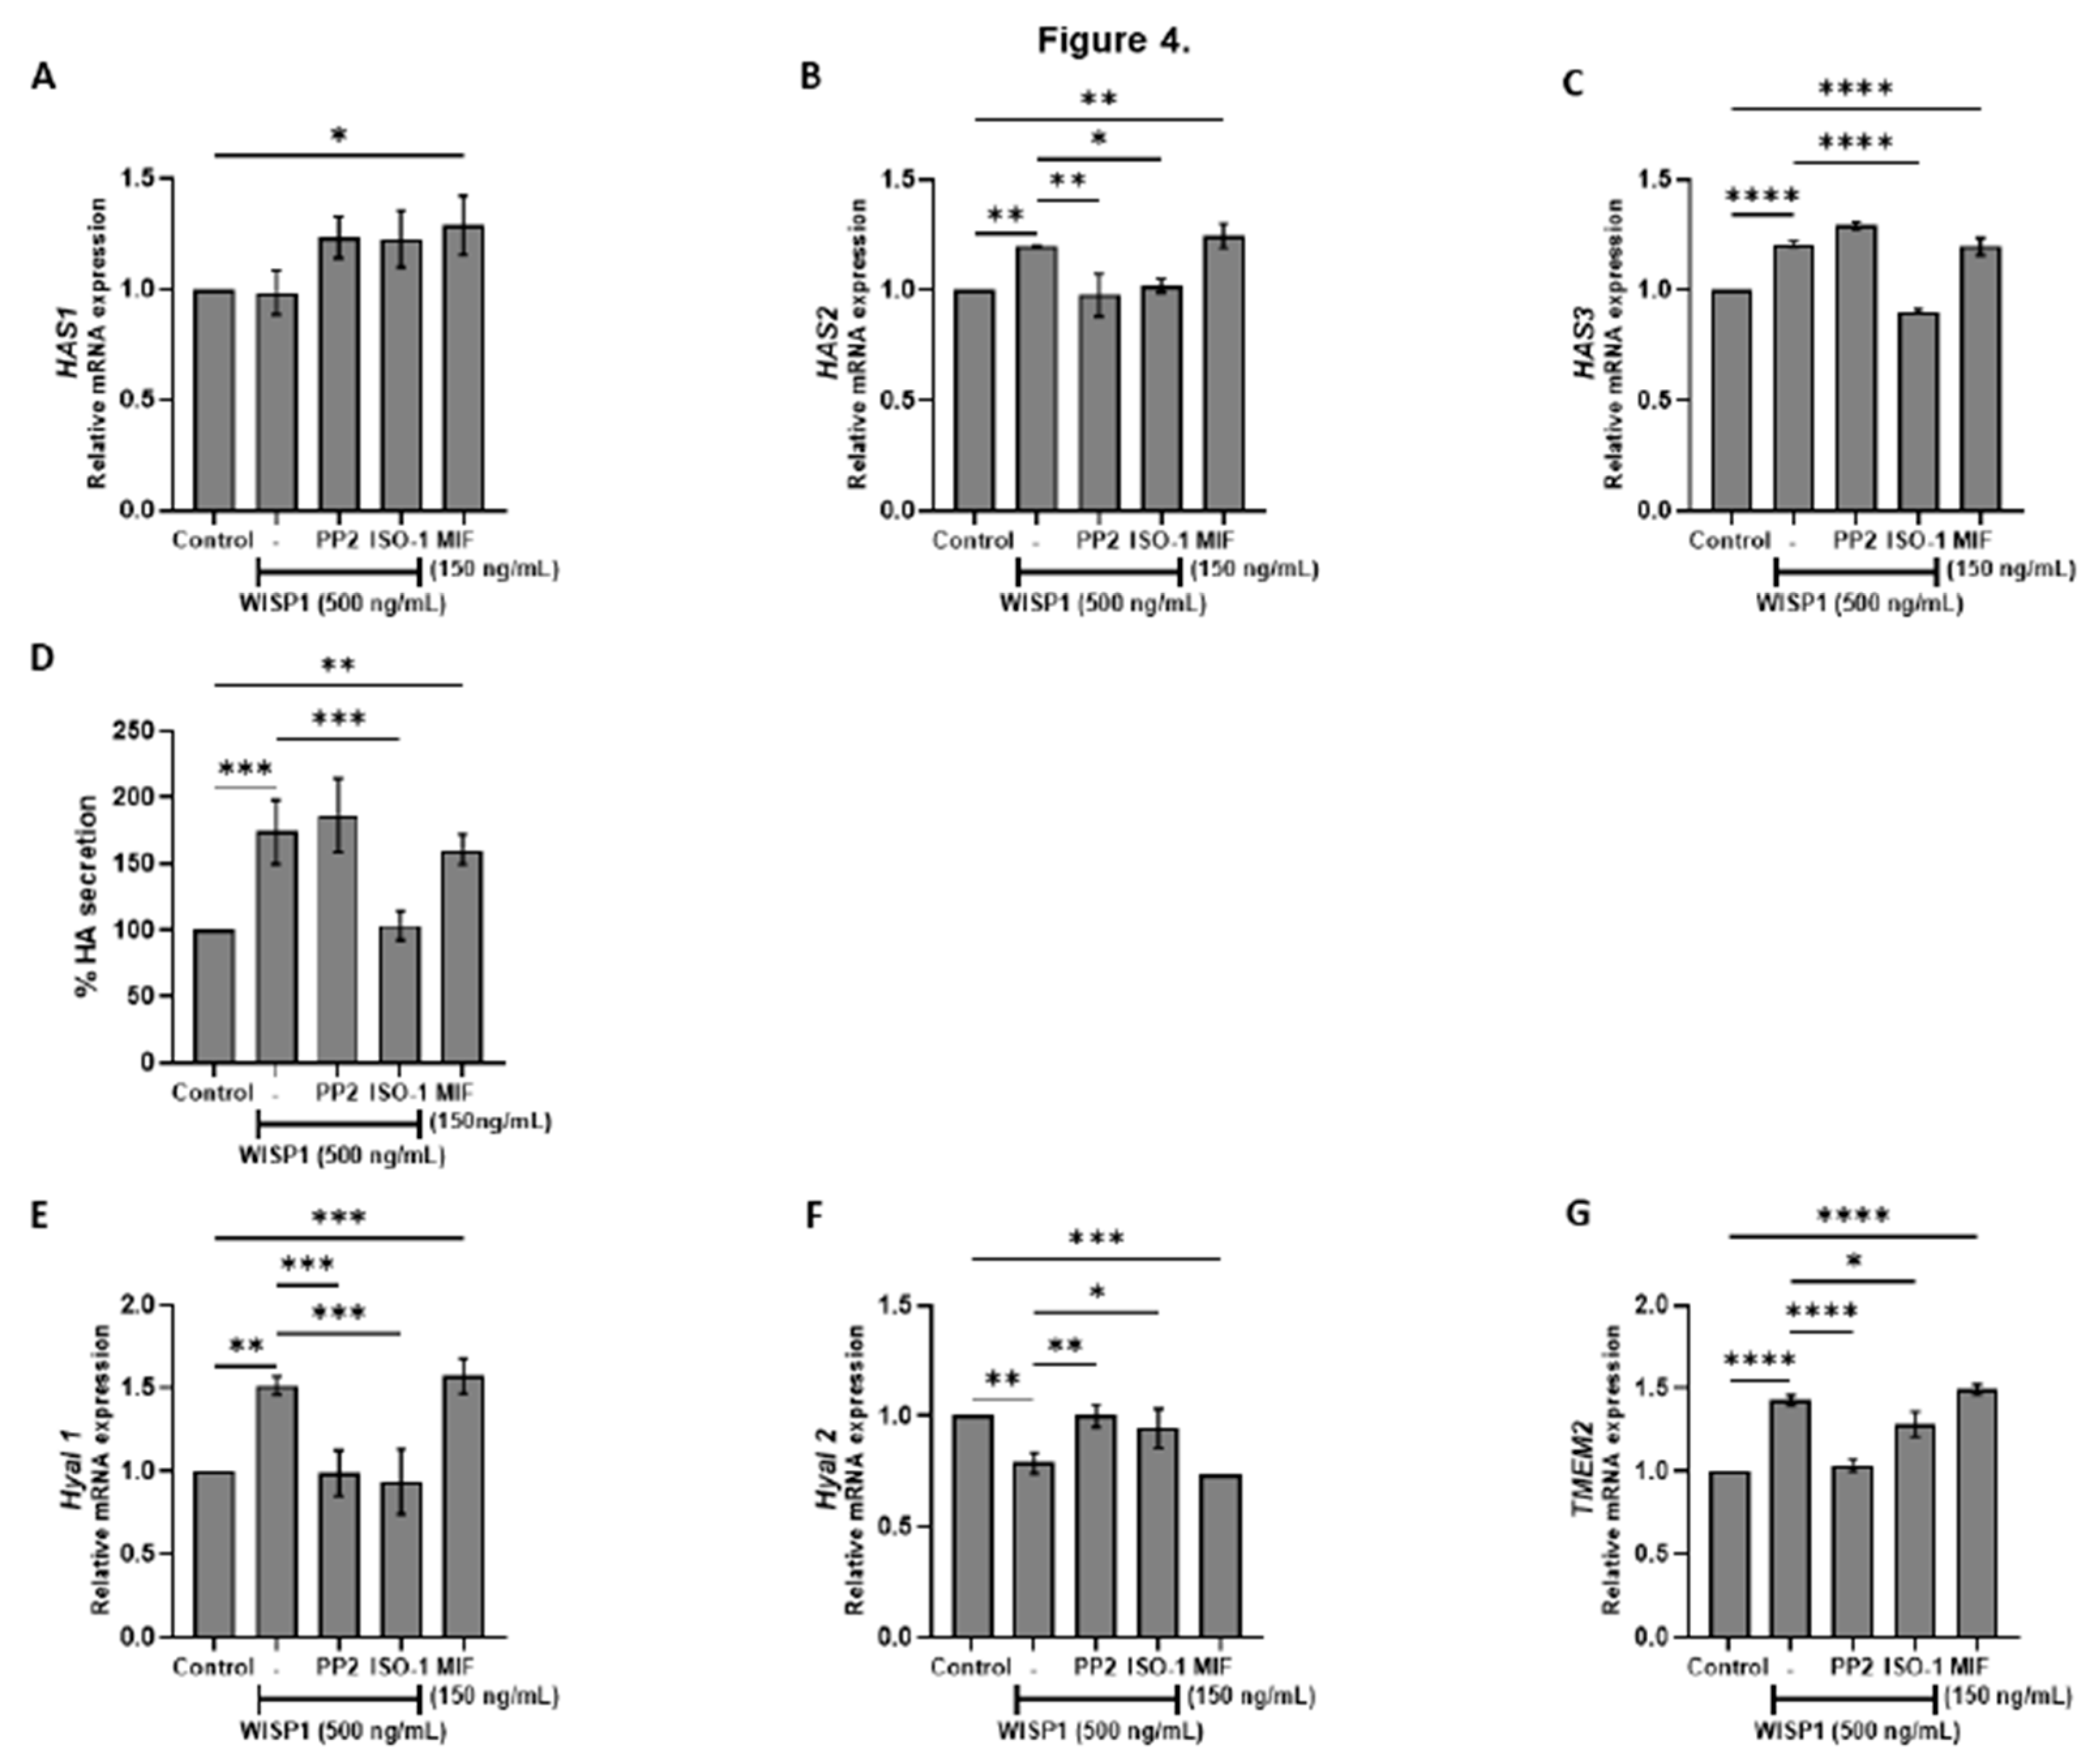
Figure 5.
Effects of WISP1 and MIF on MMP protein levels and MMP/TIMP ratios. MCF7 cells were treated for 24 h with WISP1 (500 ng/mL). Where indicated, cells were co-treated with the Src family kinase inhibitor PP2 (1 µM) or MIF inhibitor ISO-1 (100 µM); a recombinant human MIF (rhMIF, 150 ng/mL) condition was also included. (A–D) ELISA quantification of MMP1 (A), MMP2 (B), MMP9 (C), and MT1-MMP (D) protein levels (ng/mL). (E–H) Ratios of MMP1/TIMP1 (E), MMP2/TIMP2 (F), MMP9/TIMP1 (G), and MT1-MMP/TIMP2 (H), calculated from ELISA values and expressed as percentage relative to untreated control (set to 100%). Data are mean ± SD from n = 3 independent experiments. Statistical analysis was performed as described in Methods (one-way or two-way ANOVA with Tukey’s multiple comparisons test, as appropriate). *P < 0.05; **P < 0.01; ***P < 0.001; ****P < 0.0001.
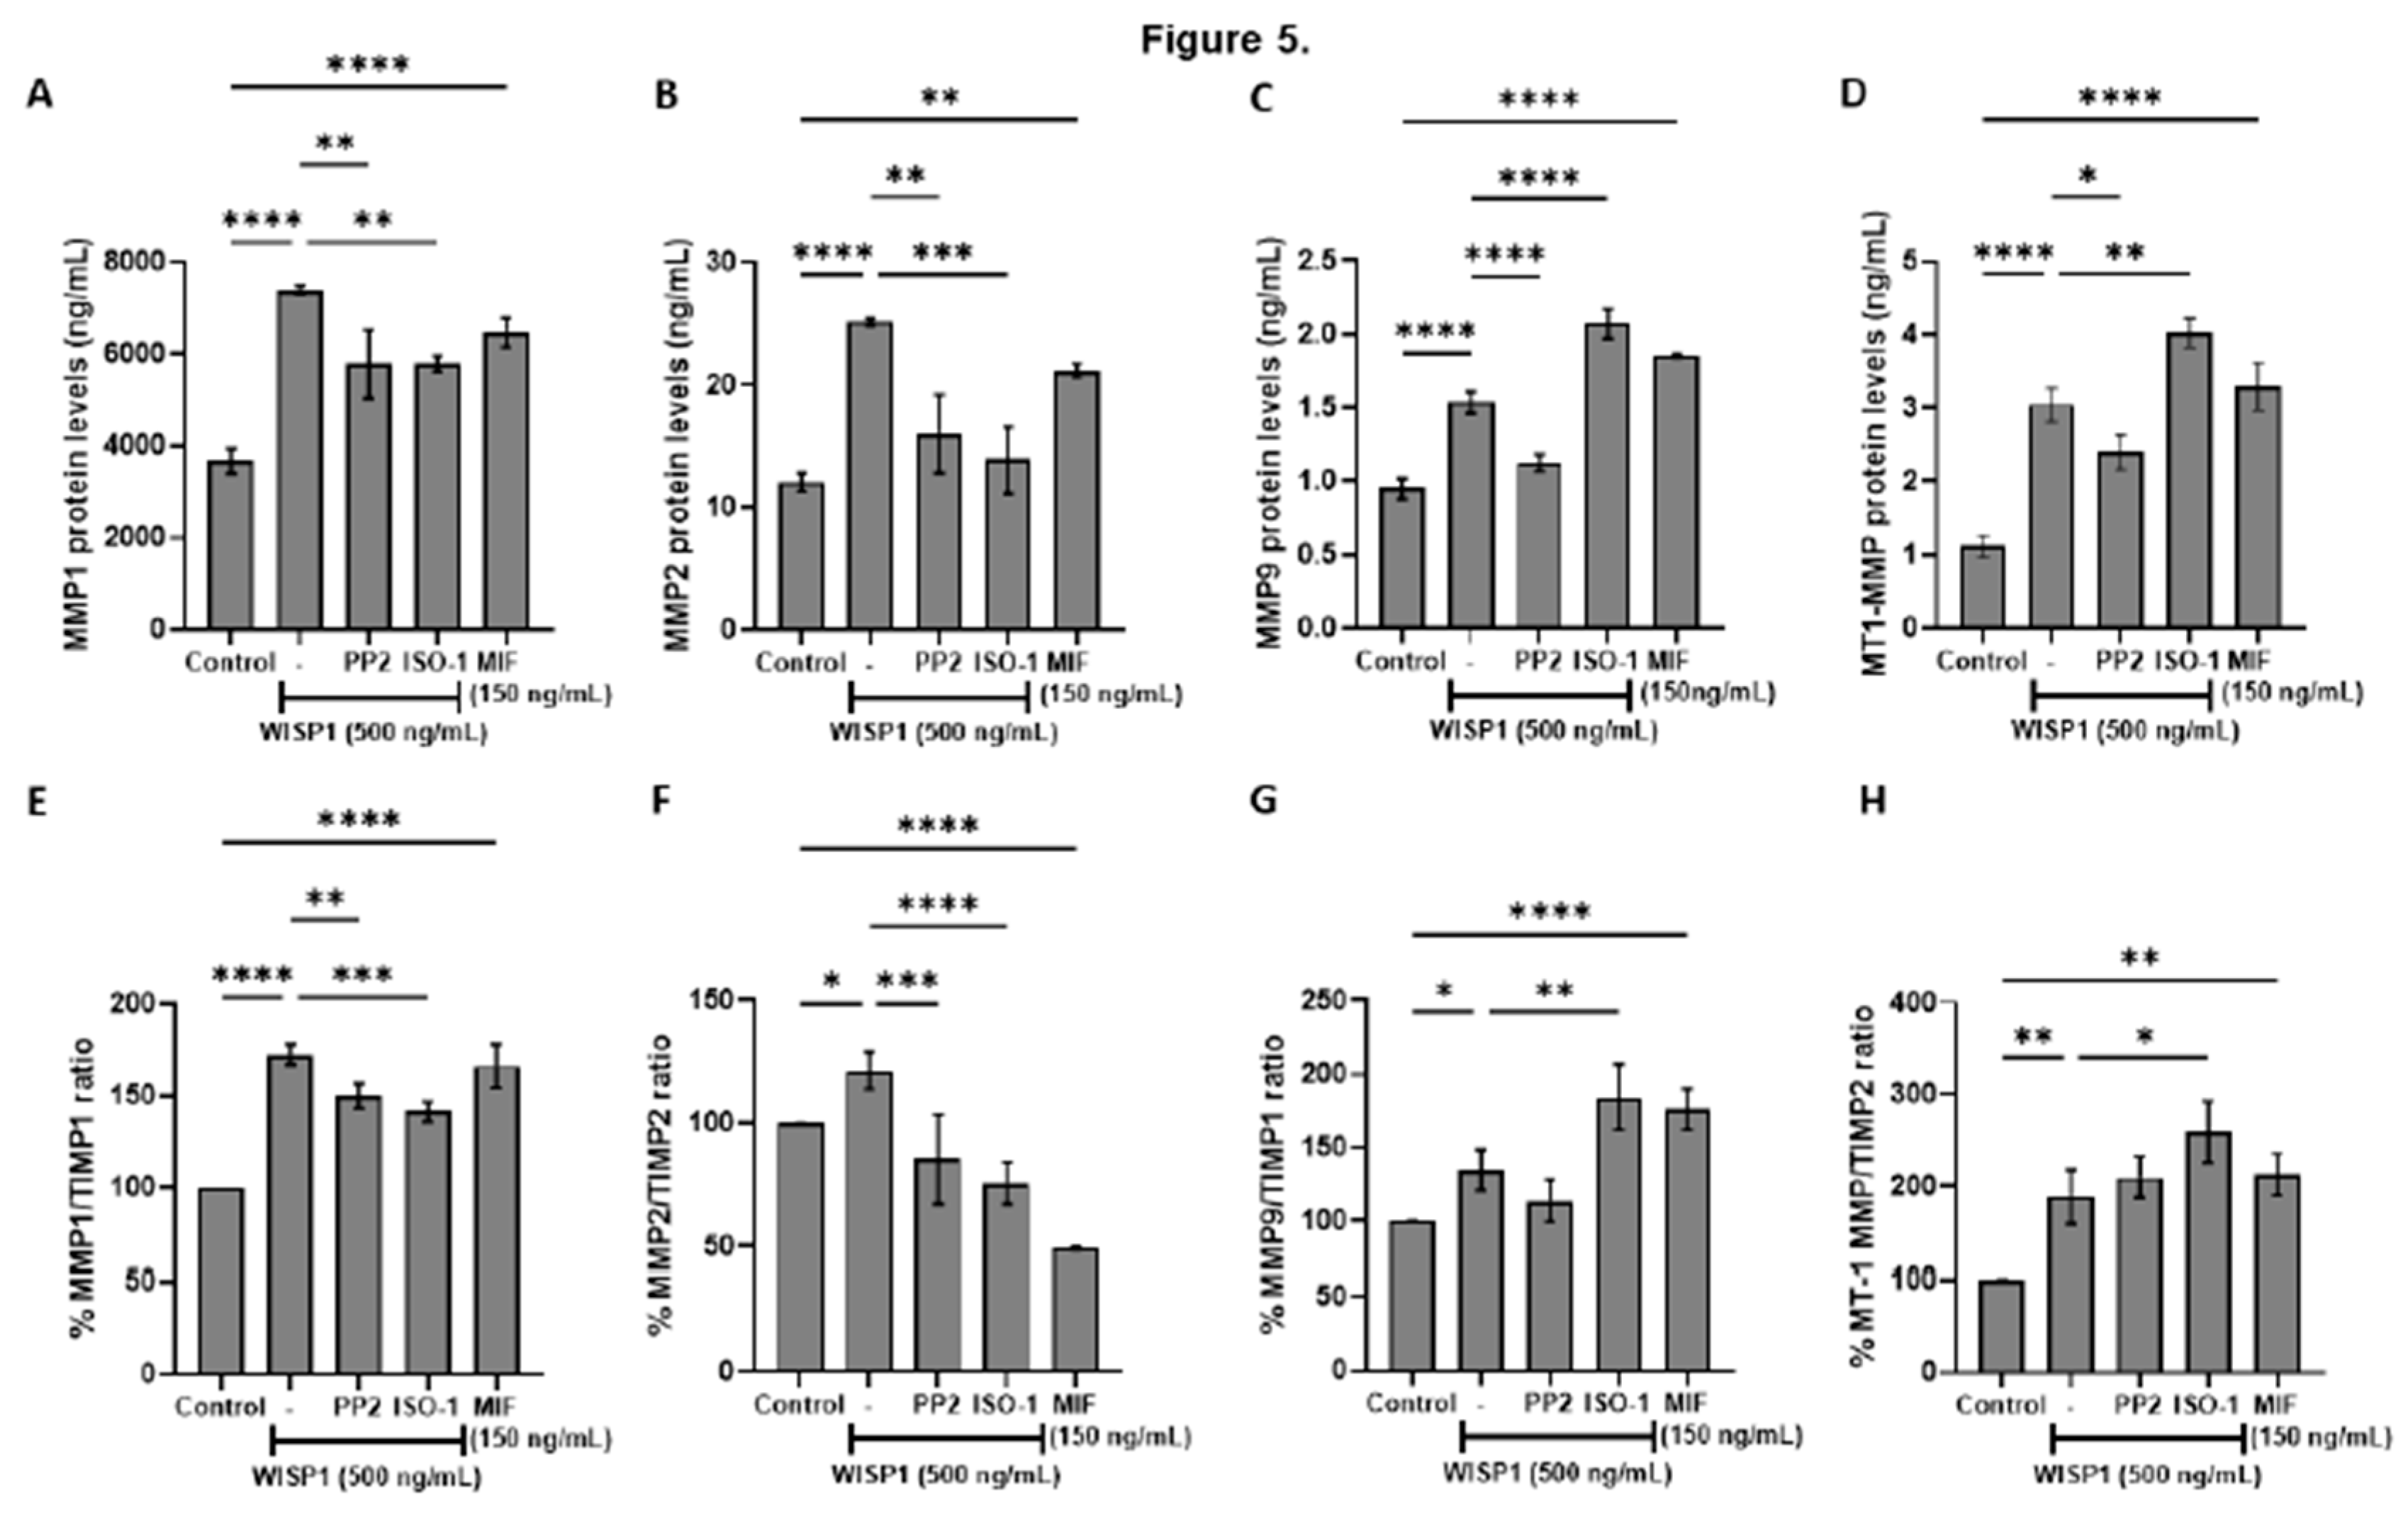
Figure 6.
WISP1 regulates NDRG1 expression and cancer cell viability via Src kinases and MIF. MCF7 cells were treated for 24 h with WISP1 (500 ng/mL) in the presence or absence of the Src kinase inhibitor PP2 (1 µM), MIF inhibitor ISO-1 (100 µM), or recombinant human MIF (150 ng/mL). (A) NDRG1 mRNA levels quantified by qPCR, normalized to GAPDH, and expressed relative to untreated cells (control). (B) Western blot analysis of NDRG1 protein; α-tubulin served as a loading control. Densitometric quantification of band intensities is shown below the blots. (C) Cell viability assessed by MTT assay. Data are mean ± SD from n = 3 independent experiments. Statistical analysis was performed as described in Methods (one-way or two-way ANOVA with Tukey’s multiple comparisons test, as appropriate). *P < 0.05; **P < 0.01; ***P < 0.001; ****P < 0.0001.
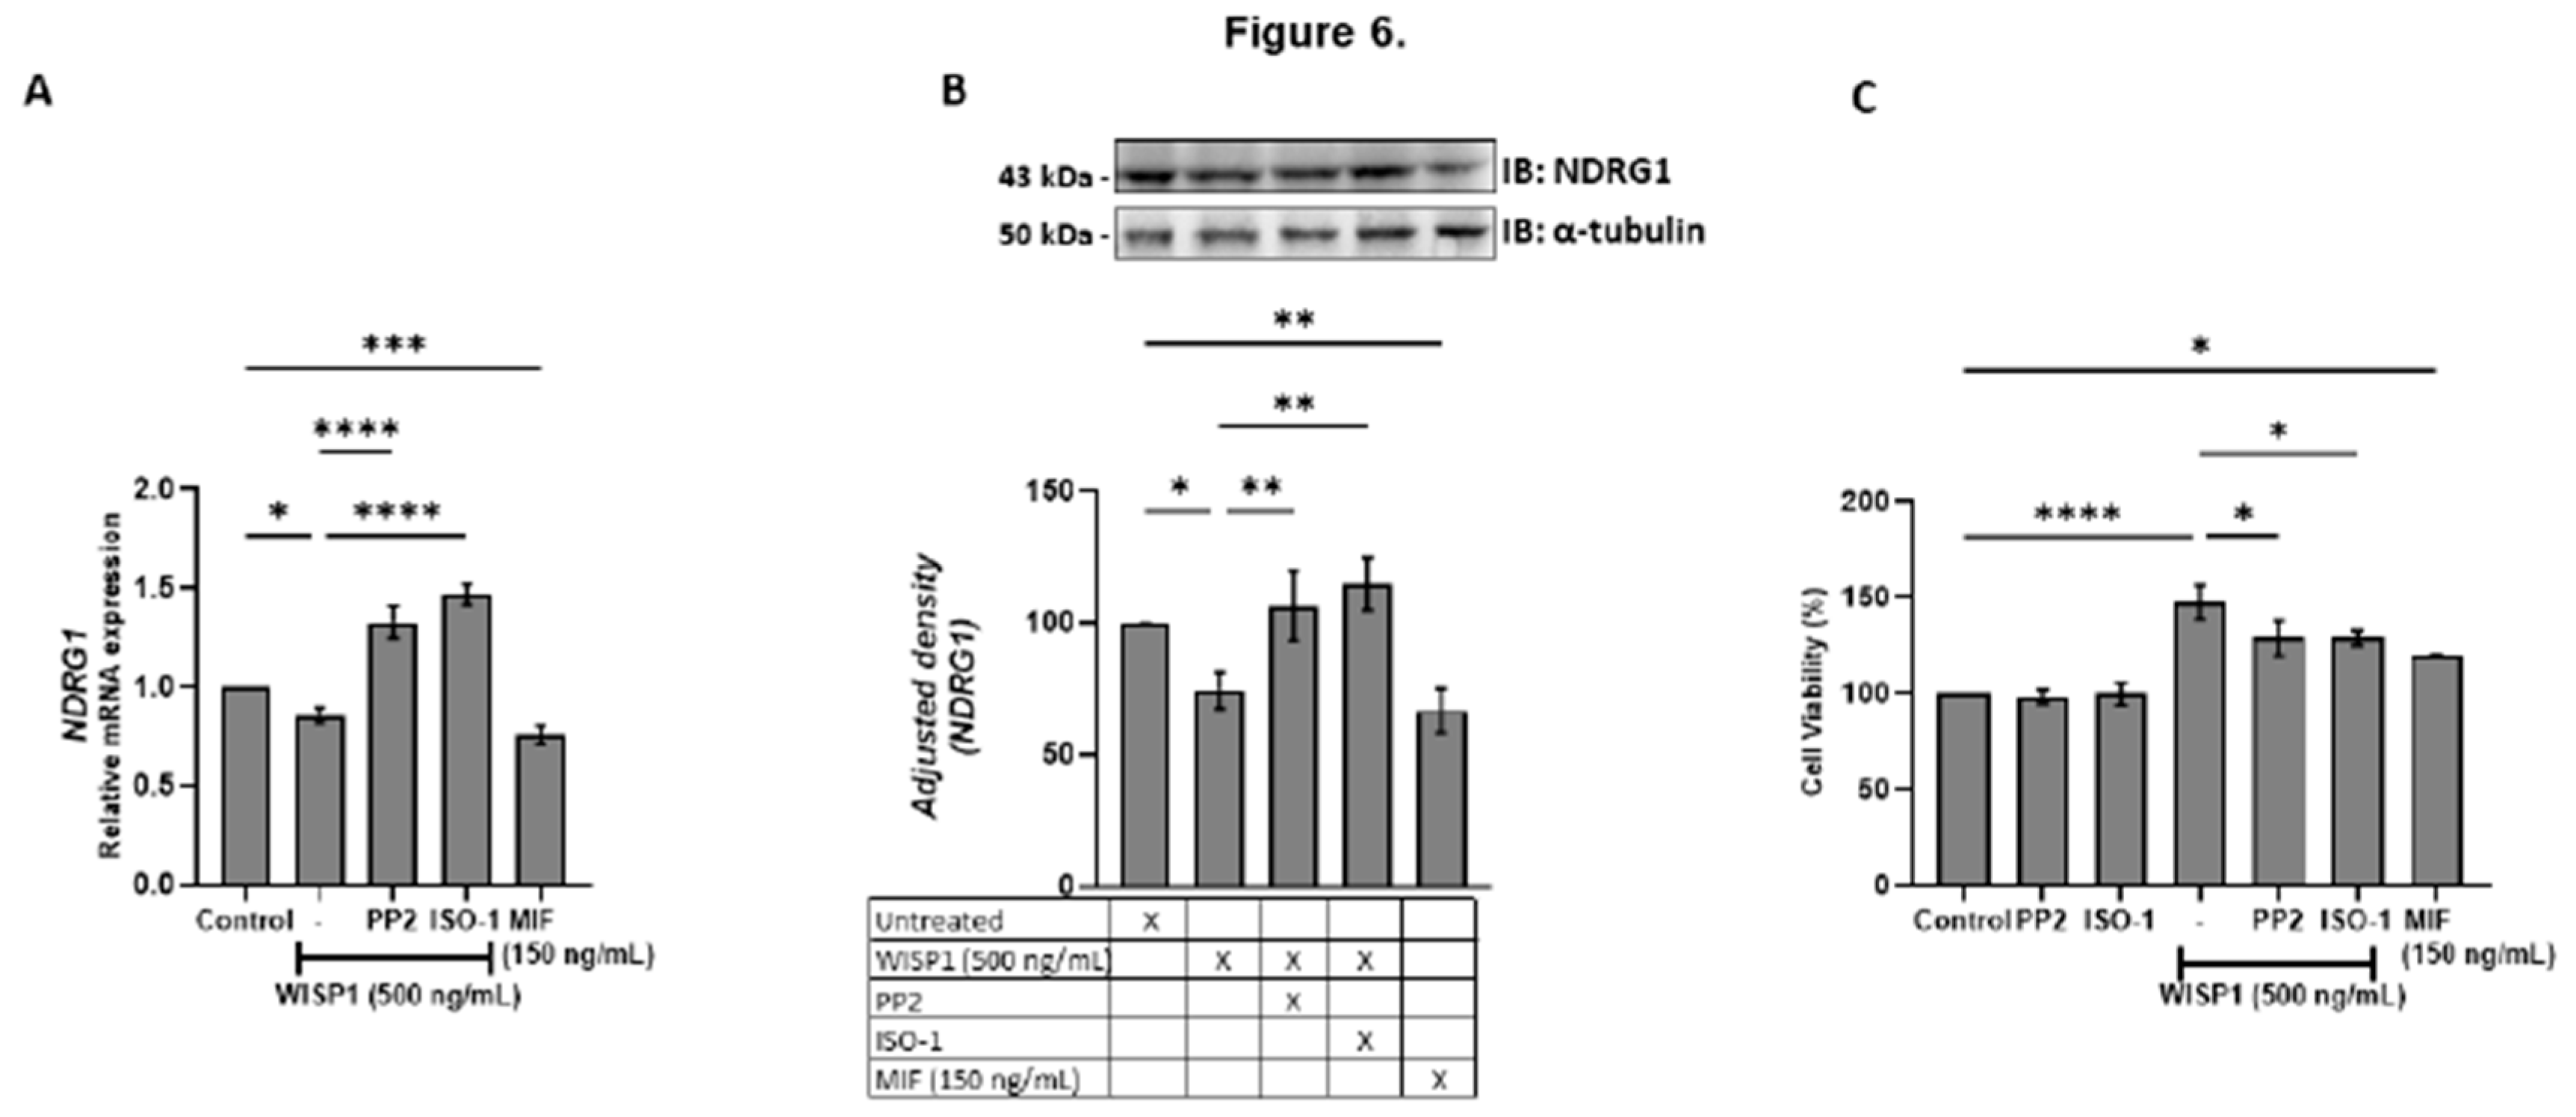
Figure 7.
Effects of WISP1 and MIF on cancer cell motility. MCF7 cells were treated with WISP1 (500 ng/mL), MIF (150 ng/mL), or pre-treated with the Src kinase inhibitor PP2 (1 µM) or MIF inhibitor ISO-1 (100 µM) prior to WISP1 stimulation (A) Migration was assessed by wound-healing assay over 48 h, with images acquired at 0, 6, 12, 24, and 48 h; wound closure is expressed as the percentage of the initial wound area at 0 h. (B) Representative immunofluorescence images of F-actin (phalloidin, green) and nuclei (DAPI, blue) under the indicated treatments; insets show higher-magnification (40X) views highlighting cytoskeletal re-organization. Scale bars, 20 µm. Data are mean ± SD from n = 3 independent experiments. Statistical analysis was performed as described in Methods (one-way or two-way ANOVA with Tukey’s multiple comparisons test, as appropriate). *P < 0.05; **P < 0.01; ***P < 0.001; ****P < 0.0001.
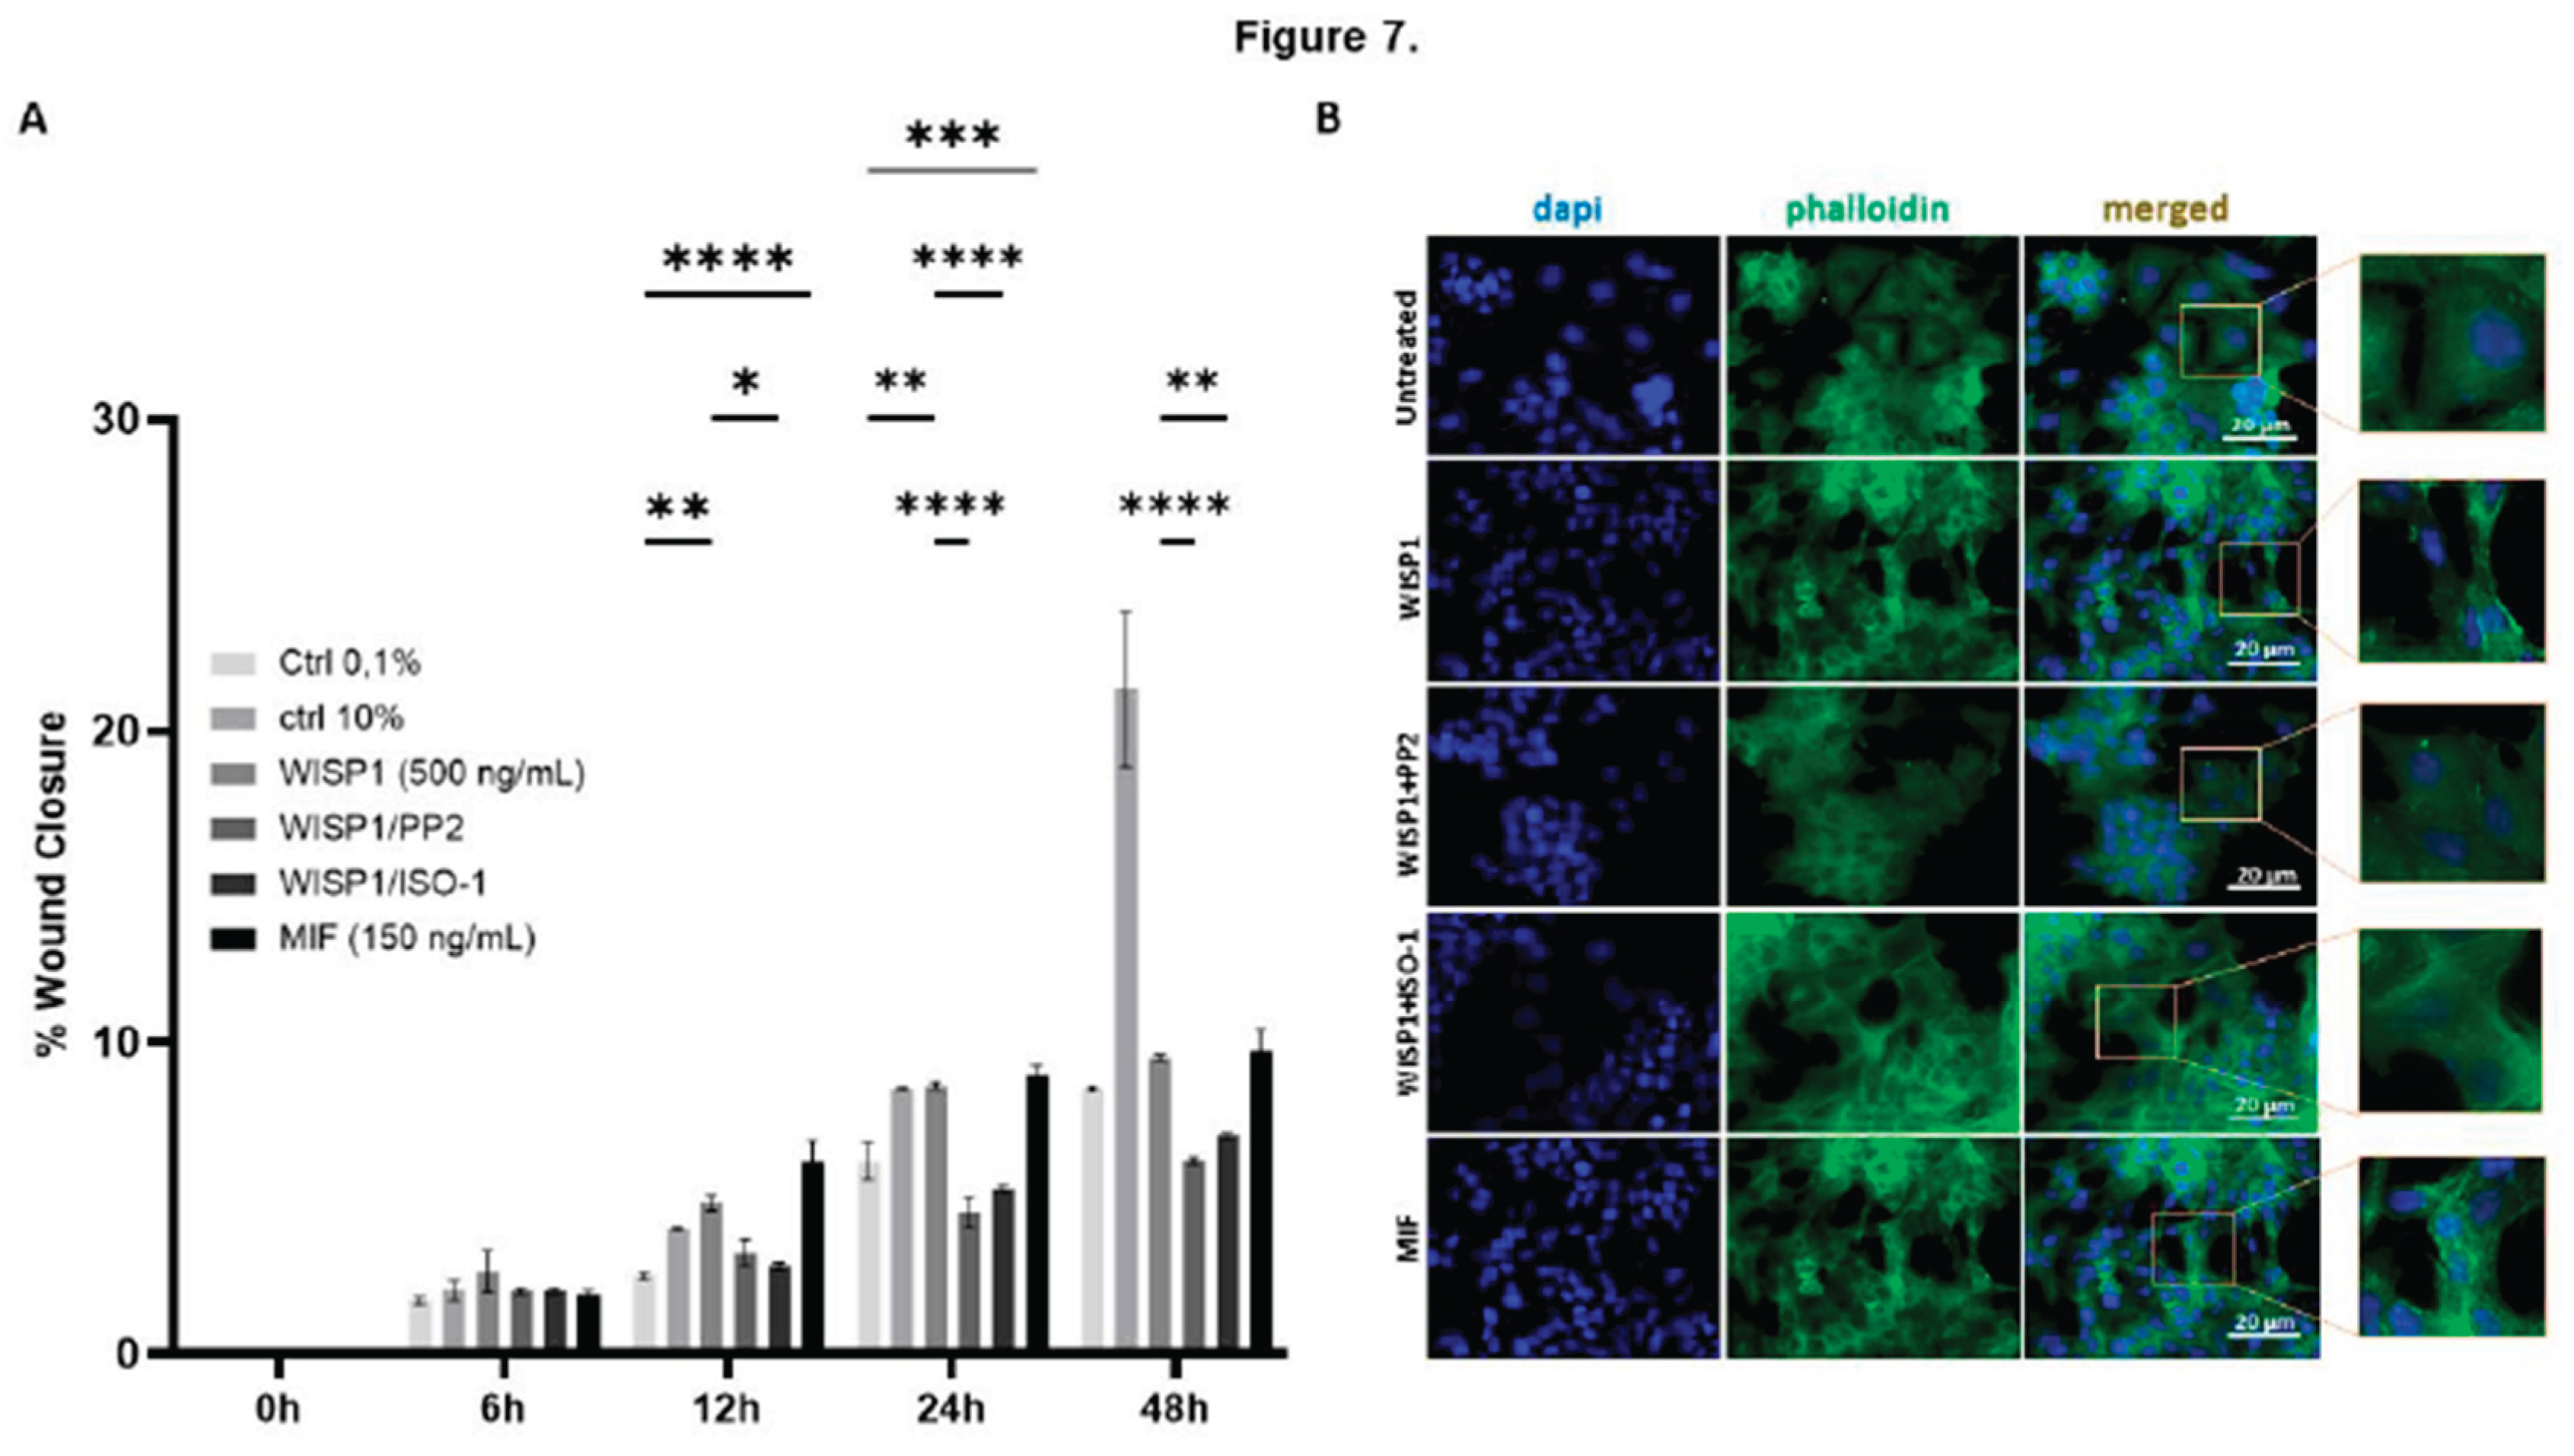

Table 1.
Primer sequences used for qPCR.
| Gene | Primer sequence | Tannealing (oC) |
|---|---|---|
| CD44s | F: 5‘-ATA ATA AAG GAG CAG CAC TTC AGG A-3‘ R: 5‘-ATA ATT TGT GTC TTG GTC TCT GGT AGC-3‘ |
60 |
| CD44t | F: 5′-ATA ATT GCC GCT TTG CAG GTG TAT T-3′ R: 5′-ATA ATG GCA AGG TGC TAT TGA AAG CCT-3′ |
60 |
| CD74 | F: 5′-TGC ATT CAC ATT TGT GCT GTA G-3′ R: 5′-TGT ACA GAG CTC TCC ACG GCT G-3′ |
60 |
| E-Cadherin | F: 5‘-TAC GCC TGG GAC TCC ACC TA-3‘ R: 5‘-CCA GAA ACG GAG GCC TGA T-3‘ |
57 |
| Fibronectin | F: 5‘-CAT CGA GCG GAT CTG GCC C-3‘ R: 5‘-GCA GCT GAC TCC GTT GCC CA-3‘ |
57 |
| GAPDH | F: 5′-AGG CTG TTG TCA TAC TTC TCA T-3′ R: 5′-GGA GTC CAC TGG CGT CTT-3′ |
57 |
| HAS-1 | F: 5’-GGA ATA ACC TCT TGC AGC AGT TTC-3’ R: 5’-GCC GGT CAT CCC CAA AAG-3’ |
61 |
| HAS-2 | F: 5’-TCG CAA CAC GTA ACG CAA T-3’ R: 5’-ACT TCT CTT TTT CCA CCC CAT TT-3’ |
57 |
| HAS-3 | F: 5’-AAC AAG TAC GAC TCA TGG ATT TCC T-3’ R: 5’-GCC CGC TCC ACG TTG A-3’ |
61 |
| Hyal1 | F: 5’-GAT TGC AGT GTC TTC GAT GTG GTA-3’ R: 5’-GGG AGC TAT AGA AAA TTG TCA TGT CA-3’ |
61 |
| Hyal2 | F: 5’-CTA ATG AGG GTT TTG TGA ACC AGA ATA T-3’ R: 5’-GCA GAA TCG AAG CGT GGA TAC-3’ |
61 |
| MIF | F: 5′-CCG GAC AGG GTC TAC ATC AAC TAT TAC-3′ R: 5′-TAG GCG AAG GTG GAG TTG TTC C-3′ |
60 |
| MMP-1 | F: 5′-TGT GAC CTC CAT CCC CAA CT-3′ R: 5′-AAC TCA GGT CAT CTT CTG TCC GT-3′ |
57 |
| MMP-2 | F: 5′-ACT GTT GGT GGG AAC TCA GAA G-3′ R: 5′-CAA GGT CAA TGT CAG GAG AGG-3′ |
57 |
| MMP-9 | F: 5‘-TTC CAG TAC CGA GAG AAA GCC TAT-3‘ R: 5‘-GGT CAC GTA GCC CAC TTG GT-3‘ |
57 |
| MT1-MMP | F: 5′-ACT GTT GGT GGG AAC TCA GAA G-3′ R: 5′-CAA GGT CAA TGT CAG GAG AGG-3′ |
57 |
| TIMP-1 | F: 5‘-CGC TGA CAT CCG GTT CGT-3‘ R: 5‘-TGT GGA AGT ATC CGC AGA CAC T-3‘ |
59 |
| TIMP-2 | F: 5‘-GGG CAC CAG GCC AAG TT-3‘ R: 5‘-CGC ACA GGA GCC ATC ACT-3‘ |
60 |
| TMEM2 | F: 5‘-GGAATAGGACTGACCTTTGCCAG-3‘ R: 5‘-TTCTGACCACCCTGAAAGCCGT-3‘ |
57 |
| Vimentin | F: 5‘-GGC TCG TCA CCT TCG TGA AT-3‘ R: 5‘-GAG AAA TCC TGC TCT CCT CGC-3‘ |
60 |
Disclaimer/Publisher’s Note: The statements, opinions and data contained in all publications are solely those of the individual author(s) and contributor(s) and not of MDPI and/or the editor(s). MDPI and/or the editor(s) disclaim responsibility for any injury to people or property resulting from any ideas, methods, instructions or products referred to in the content. |
© 2025 by the authors. Licensee MDPI, Basel, Switzerland. This article is an open access article distributed under the terms and conditions of the Creative Commons Attribution (CC BY) license (http://creativecommons.org/licenses/by/4.0/).
Copyright: This open access article is published under a Creative Commons CC BY 4.0 license, which permit the free download, distribution, and reuse, provided that the author and preprint are cited in any reuse.


