
Submitted:
14 June 2025
Posted:
17 June 2025
You are already at the latest version
Abstract
The heparan sulfate proteoglycan syndecan-3 (SDC3) has emerged as a critical regulator of cell-matrix interactions. While other syndecan family members con-tribute to the progression of multiple cancers, SDC3's functional contributions to tumor biology remain largely unexplored. This study investigates the potential role of SDC3 in the pathogenesis of breast cancer. By conducting an in-silico analysis of publicly available datasets, including TNM-plot, The Human Protein Atlas, and Kaplan-Meier-Plotter, we observed that SDC3 is upregulated in breast cancer tissue. Notably, high SDC3 expression correlates with improved relapse-free survival in breast cancer patients. In vitro experiments revealed that SDC3 depletion significantly impairs cell viability, cell-cycle pro-gression, cell migration, and 3D-spheroid-formation in MDA-MB-231 and MCF-7 breast cancer cells. Furthermore, SDC3 depletion results in multiple changes in gene expression, including upregulation of matrix metalloproteinases (MMP1, MMP9), downregulation of E-cadherin (CDH1), and altered levels of vascular endothelial growth factor A (VEGFA). At the protein level, changes in the activation of pro-to-oncogene tyrosine-protein kinase Src (SRC) are observed. These findings suggest that breast cancer cell-derived SDC3 plays a pivotal role in breast cancer progres-sion. In contrast, the positive prognostic value of SDC3 in breast tumors may point at a different role for SDC3 within the tumor micoenvironment.
Keywords:
Syndecan-3
; heparan sulfate
; breast cancer
; prognosis
; proteoglycan
; MMP
; cell proliferation
; extracellular matrix
1. Introduction
Breast cancer is the second most common cancer and the fourth leading cause of cancer mortality worldwide [1,2]. Among women, it is the most frequently diagnosed cancer and the leading cause of cancer-related deaths globally [1,2]. The disease encompasses a heterogeneous group of malignant tumors with diverse morphologies, biological behaviors, clinical presentations, and prognoses [3]. It is classified based on standardized pathomorphological criteria, including the histological type of tumor, histological degree of malignancy, stage according to the TNM classification, the expression of estrogen- and progesterone-hormone-receptors, expression of human-epidermal-growth-factor-receptor (HER2), and the cellular proliferation index Ki-67 [4].
Recent research has highlighted the role of the extracellular matrix (ECM) in cancer progression [5]. The ECM is a complex network of macromolecules, that assembles into three-dimensional supramolecular structures with distinct biochemical and biomechanical properties [6,7]. ECM dynamics play key roles in physiological tissue development and homeostasis but may become dysregulated, once its composition is altered [6,7,8].
Proteoglycans are major structural components of the ECM and influence both cellular behavior and matrix properties through direct and indirect interactions with cytokines, growth factors, cell surface receptors, adhesion molecules, enzymes, and glycoproteins [9,10,11]. The most abundant subtype of proteoglycans is heparan sulfate proteoglycans (HSPGs), which are components of the cell surface and of the basement membrane that separates endothelial and epithelial cells from the underlying connective tissue [12]. Cell surface HSPGs serve as ECM receptors, and are classified into two major groups: syndecans, comprising four distinct members (SDC1 to SDC4), and glypicans, encompassing six members (GPC1 to GPC6) [11,13]. In healthy adult tissue, SDC1 is predominantly expressed in epithelia and plasma cells, syndecan-2 (SDC2) in endothelia and fibroblasts, SDC3 in neuronal and musculoskeletal tissue, while syndecan-4 (SDC4) is expressed heterogeneously [13,14]. Syndecans regulate multiple cellular signaling pathways due to their ability to act as coreceptors with signaling receptors, as well as endocytosis receptors [13]. In cancer, as well as in the cancer-surrounding stroma, syndecans can be abnormally expressed [15]. Syndecans play distinct roles in cancer pathogenesis depending on the cancer type and stage, either promoting or inhibiting cancer progression by influencing cell proliferation, migration, adhesion, invasion, and metastasis [15,16]. Several syndecan-targeting therapeutic approaches have been developed in recent years, including monoclonal antibodies, peptide inhibitors, biomolecule mimetics, and heparan sulfate mimetics or inhibitors that interfere with syndecan exosomal packaging [16].
SDC3 has previously been associated with the pathogenesis of ovarian cancer [17], pancreatic cancer [18], and renal cell carcinoma [19]. However, little is known about the potential role of SDC3 in breast cancer pathogenesis. To address our research question, we first performed an in-silico analysis utilizing large public datasets. Subsequently, we conducted in vitro experiments using the human breast cancer cell lines MDA-MB-231 and MCF-7, in which SDC3 downregulation was achieved by a single siRNA-sequence, and a Pool-of 30 sequences against SDC3.
Our findings suggest that SDC3 may influence critical cancer hallmarks associated with breast tumorigenesis and cancer progression. We propose that SDC3 may regulate the activity of the proto-oncogene tyrosine-protein kinase Src (SRC) as well as other genes involved in crucial breast cancer signaling pathways, thereby affecting human breast cancer cell behavior.
2. Materials and Methods
2.1. The Human Protein Atlas, TNM Plot, and Kaplan–Meier Plot Analysis
The gene expression of SDC3 in healthy as well as pathological tissues was assessed using The Human Protein Atlas database (The Human Protein Atlas, https://www.proteinatlas.org, accessed September 10th, 2024), which integrates antibody-based imaging, mass spectrometry-based proteomics, transcriptomics, and systems biology technologies [20].
Additionally, the TNMplot database (TNMplot, https://tnmplot.com, accessed September 10th, 2024) was utilized, which includes public gene expression data by gene arrays from the Gene Expression Omnibus of the National Center for Biotechnology Information (NCBI-GEO), RNA-seq data from The Cancer Genome Atlas (TCGA), Therapeutically Applicable Research to Generate Effective Treatments (TARGET), and The Genotype-Tissue Expression (GTEx) [21]. To investigate the expression of SDC3 in breast cancer, the tools Gene Expression Comparison, Gene Chip Data, the gene symbol SDC3, and breast tissue were selected on the TNMplot website.
The open-access online tool Kaplan-Meier Plotter (Kaplan-Meier Plotter, www.kmplot.com, accessed September 10th, 2024) [22] was used, to conduct a survival analysis of SDC3 expression in breast cancer. Kaplan-Meier Plotter analysis was performed with mRNA gene chip data. The gene symbol SDC3 (Affymetrix ID: 202898_at) and relapse-free-survival (RFS; n=4929) was chosen on the website, the median was selected as the cut-off value, and JetSet best probe option was applied, to ensure the selection of the optimal probe set [22].
2.2. Cell Culture
The human breast cancer cell lines MDA-MB-231, MCF-7, T47D, BT20, BT474, BT549, SK-BR3, HCC1806, MDA-MB-453, and MDA-MB-468 were purchased from ATCC/LGC Promochem (Teddington, United Kingdom). SUM-149 cells were purchased from BIOIVT (West Sussex, UK). MCF-7 cells were cultured in RPMI medium (PAN-Biotech GmbH, Aidenbach, Germany), containing 10% fetal calf serum (FCS) and 1% penicillin/ streptomycin (P/S), at 37°C and 6.5% CO2. SUM-149 cells were cultured in Ham's Nutrient Mixture F12 (cat. N66589) supplemented with 5 % FCS, 1 % P/S, 5µg of insulin (cat. I9278) and 1µg/mL hydrocortisone (cat. H4001) in a humidified incubator with 5 % CO2 at 37 °C. All other cell lines were cultured in DMEM medium (Sigma-Aldrich, St. Louis, USA), containing 10% fetal calf serum (FCS) (PAN-Biotech GmbH, Aidenbach, Germany) and 1% P/S (Sigma-Aldrich, St. Louis, USA), at 37°C and 7.5% CO2.
2.3. siRNA Transfection
MDA-MB-231 and MCF-7 cells were cultured in growth media at a density of 3 × 10⁵ cells/well of a six-well plate for 24 h. Next, single siRNA and siPool transfection was performed, using the Silencer Select Pre-designed siRNA (#s228527) (Ambion Life Technologies, Carlsbad, USA), targeting exon 3 of human SDC3 mRNA (NM_014654.3) at 20 nM final concentration, and the siPool (Lot. #SDC3-003) (siTools GmbH, Planegg-Martinsried, Germany), targeting 30 sequences of SDC3 (NCBI gene ID #9672) at 2.5 nM final concentration to silence SDC3, along with a Silencer Select Negative Control (ID#4390844) (Ambion Life Technologies, Carlsbad, USA), and siPool Negative Control (Lot. #N000-c1-058) (siTools GmbH, Planegg-Martinsried, Germany). The transfection mixture of 1 mL contained 840 μL Opti-MEM media (Cat. #31985070, Thermo Fisher Scientific, Waltham, USA) and Dharmafect (Cat. #T-2001-01, Dharmacon, Lafayette, USA), 80 μL SDC3 siRNA or SDC3 siPool or negative control siRNA or negative control siPool/Opti-MEM, and 80 μL 2.5% Dharmafect/Opti-MEM solution according to the manufacturer’s protocol (Dharmacon). The knockdown efficiency was confirmed by quantitative real-time PCR (qRT-PCR).
2.4. MTT Cell Viability Assay
The MTT metabolic cell viability assay was conducted on a 96-well plate usingMDA-MB-231 and MCF-7 cells 48 hours post-transfection. With a multichannel pipette, 100μl of pre-warmed culture medium without phenol red (DMEM/ RPMI with 10% FCS, 1% penicillin/ streptomycin w/o phenol red; PAN-Biotech GmbH, Aidenbach, Germany) was first added to each well from row B to row H, except for row A. Next, 10,000 cells per well were added to the first two rows, A and B. A dilution series was created by suspending and transferring 100μl of the cell suspension from row B to each of the lower rows, continuing until row G. The dilution series consisted of 10,000 cells/ well in row A, 5,000 cells/ well in row B, 2,500 cells/ well in row C, 1,250 cells/ well in row D, 625 cells/ well in row E, 312 cells/ well in row F, and 156 cells/ well in row G. The last row H contained a cell-free blank sample. Each sample was triplicated to generate mean values. The plate was incubated for 96 hours at 37°C. After incubation, the medium was removed and 20μl of 3-(4,5-Dimethylthiazol-2-yl)-2,5-diphenyl-tetrazolium bromide (MTT) (Cat. # M2128-1G) at a concentration of 5 mg/ml was added. The cells were incubated for 4 hours at 37°C. Subsequently, 100μl of MTT stop buffer containing 10% (w/v) sodium dodecyl sulfate (SDS) (Cat. # 3599286) and 50% (v/v) N,N-Dimethyl formamide), pH 4.7 was added per well to stop the reaction and dissolve the formazan crystals. The final incubation was performed for 24 hours in the dark at room temperature. The photometric analysis was carried out at 570/650 nm with the ELISA-Reader VersaMax (Molecular Devices, San José, USA).
2.5. Cell Cycle Analysis
24 hours post-transfection, MDA-MB-231, and MCF-7 cells were serum-starved for 24 hours. The cells were then harvested by Trypsin/EDTA (PAN-Biotech GmbH, Aidenbach, Germany), and subjected to the cell cycle analysis using DAPI (4', 6'-diamidino-2-phenylindole) (Cat. #D9542, Sigma-Aldrich, St. Louis, USA). The cell pellet was resuspended in 1 mL of DAPI solution (Cytecs, Münster, Germany), after 5 min of incubation at room temperature, the cells were analyzed using the CyFlow space flow cytometer (PARTEC, Münster, Germany), and the Guava easyCyte 3 HT reader (Merck Millipore; Billerica, MA, USA). Excitation of the cells was carried out with a 375nm UV laser, and fluorescence emissions were measured at 455nm in FL4.
2.6. Hanging Drop Assay for 3D Sphere Formation
The hanging drop method was utilized to generate three-dimensional spheroids [23]. MDA-MB-231 and MCF-7 cells were harvested by Trypsin/EDTA 48 hours post-transfection, washed, and resuspended in culture medium. A total of 12 drops, each containing 20 000 cells per condition, were placed on the top lid of a petri dish. The bottom chamber was filled with 10ml PBS (Sigma-Aldrich, St. Louis, USA), the petri dish was sealed, and spheroid formation was stimulated by gravity. The sealed petri dish was incubated at 37°C. Images of the spheroids were taken on day 4 and day 7 of the experiments with an Axiovert (Zeiss, Jena, Germany) bright field light microscope (magnification x5). Quantification of the core spheroid area was carried out with the program ImageJ (Rasband, W.S., ImageJ, U. S. National Institutes of Health, Bethesda, Maryland, USA, https://imagej.net/ij/, 1997-2018).
2.7. Cell Migration Assay
24 hours post-transfection, MDA-MB-231, and MCF-7 cells were harvested by Trypsin/EDTA, washed, resuspended in culture medium, and subjected to the cell migration assay. 30,000 MDA-MB-231 cells and 75,000 MCF-7 cells were seeded per migration chamber (Cat. #353097, Corning Inc., Corning, USA). The migration chambers were placed in the empty wells of a six-well plate and incubated for 24 hours at 37°C. Subsequently, the culture medium inside the chambers was removed, and 500μl of culture medium without FCS was supplemented. Cell migration was induced, by adding 750μl of culture medium containing 5% FCS to each well of the 6-well plate. The plates were incubated for another 24 hours at 37°C. MDA-MB-231 cells were fixed and stained 24 hours after the medium change, while the same procedures were performed on MCF-7 cells 72 hours after the medium change. For staining, the chambers were removed from the six-well plate and placed in methanol (Merck KGaA, Darmstadt, Germany) for five minutes, then washed with PBS for one minute, and subsequently immersed in 1% toluidine blue staining solution (Cat. #89640, Sigma-Aldrich, St. Louis, USA) for six minutes. The chambers were left to dry for 24 hours, protected from light. Images were taken with the Axiovert (Zeiss, Jena, Germany) bright-field microscope (magnification x10), and quantification of the experiments was performed with the program ImageJ (Rasband, W.S., ImageJ, U. S. National Institutes of Health, Bethesda, Maryland, USA, https://imagej.net/ij/, 1997-2018).
2.8. Total RNA Extraction and Quantitative Real-Time PCR
Total RNA extraction from SDC3-silenced MDA-MB-231 and MCF-7 cells was performed 72 h after transfection with the InnuPREP RNA mini kit (Analytik Jena, Jena, Germany) following the manufacturer’s instructions. Likewise, RNA was prepared from a panel of breast cancer cell lines under standard culture conditions to determine basal expression levels of SDC3. Reverse transcription of mRNA (from 1 µg of total RNA) into cDNA was carried out with the High-Capacity cDNA Reverse Transcription Kit (Applied Biosystems, Foster City, USA). Quantitative real-time PCR (qRT-PCR) for the cell lines was performed using the SYBR Green qPCR Primer Assay (Biolegio, Nijmegen, The Netherlands) and Takyon ROX SYBR MasterMix blue dTTP (Eurogentec, Lüttich, Belgien) in a 7300 real-time PCR detection system (Applied Biosystems, Foster City, USA). Primer sequences are shown in Supplementary Table S1. The basal gene expression levels of SDC3 were assessed with the 2−∆∆Ct method after normalization to Actin gene expression as an internal control [24]. In our analysis, the relative gene expression was expressed as fold change and set in relation to the negative control.
2.9. Western Blotting
24 hours post-transfection, MDA-MB-231 and MCF-7 cells were serum-starved for 48 hours and simultaneously treated with 50ng/ml human recombinant TFPI (Lot: 6D30L4530, Sigma-Aldrich, St. Louis, USA). The cells were lysed 72 hours post-transfection and 48 hours after stimulation with 200 µL/well of protein extraction buffer (Cell Signaling Technology, Danvers, USA). The protein samples were separated by SDS-polyacrylamide gel electrophoresis under reducing conditions and subsequently transferred to a nitrocellulose membrane. The membrane was blocked with 5% skim milk in TBST buffer, pH 7.6. The primary antibodies (phospho-SRC, rabbit monoclonal, 1:1000, Cat.#2101, Cell Signaling Technology, Danvers, USA; SRC, rabbit monoclonal, 1:1000, Cat.#2108, Cell Signaling Technology, Danvers, USA; and GAPDH, mouse monoclonal, 1:5000, Santa Cruz Biotechnologies, Dallas, USA) were diluted in 5% BSA in TBST buffer and incubated with the membranes overnight at 4°C. The membranes were first probed with phospho-SRC antibody and reprobed with the additional antibodies after stripping with 0.2 M glycine, pH 2.5, using the procedure indicated above. Following primary antibody incubation, the membranes were washed 3× with TBST and subsequently incubated with the secondary goat anti-rabbit or goat anti-mouse antibodies (1:5000, Merck KGaA, Darmstadt, Germany) in 5% skim milk for 1 hour at room temperature. The membranes were subjected to a chemiluminescence ECL reaction with the SuperSignal West Pico PLUS Chemiluminescent Substrate (Thermo Fisher Scientific, Waltham, USA) and detected with a Fusion SL Chemiluminescence Imaging System (Vilber Lourmat, Eberhardzell, Germany) device.
2.10. In-Silico Protein Interaction Network Analysis
STRING database version 12.0 (STRING, https://string-db.org, accessed September 13th, 2024) was utilized to conduct an in-silico analysis of known and predicted protein-protein interaction networks related to SDC3. These interactions include both physical and functional interactions. Data from the STRING database is sourced from automated text mining of scientific literature, computational interaction predictions from co-expression, conserved genomic contexts, as well as primary databases of interaction experiments [25]. To visualize the interactions of SDC3 with proteins of different signaling pathways, the protein name (Sdc3, cell surface proteoglycan) and organism (homo sapiens) were chosen on the STRING database website. The ten most significantly enriched GO terms (p < 0.05) were selected in the biological processes, molecular function, cellular component, and KEGG pathways categories. All the adjusted statistically significant values of the GO-terms were negative 10-base log-transformed.
2.11. Statistical Analysis
For the statistical analysis, Microsoft Excel (Microsoft Corporation, Redmond, USA) and GraphPad (GraphPad Software Inc., Boston, USA) were used. The unpaired two-tailed Student-t-test or unpaired t-test with Welch´s correction was utilized for two-way comparisons. The level of significance was set as p ≤ 0.05. Results with p ≤ 0.05 were considered statistically significant (*), while p ≤ 0.01 was described as very significant (**), and p ≤ 0.001 as highly significant (***). The graphs depict mean values, with error bars indicating the standard error of the mean (SEM). In each analysis, three independent experimental replicates were included (n = 3).
3. Results
3.1. SDC3 Is Overexpressed in Breast Cancer
The analysis of The Human Protein Atlas database (The Human Protein Atlas, https://www.proteinatlas.org, accessed September 10th, 2024) revealed that SDC3 RNA expression was elevated in breast invasive carcinoma, as well as in other types of tumors, such as glioblastoma, and cutaneous melanoma (Figure 1A). The Human Protein Atlas furthermore included images of immunohistochemically stained breast cancer tissue samples, visualizing SDC3 protein expression. The staining was performed with the antibody #HPA017087 (Sigma-Aldrich, St. Louis, USA), and reported as low, or medium, based on conventional immunohistochemistry profiling of breast tissue, indicating that SDC3 is differentially expressed in breast cancer tissues (Figure 1B, Table 1). SDC3 expression was largely present within the tumor compared to the stroma, and showed a membranous and cytoplasmic staining pattern.
The open-access tool TNM-plot (TNMplot, https://tnmplot.com, accessed September 10th, 2024) was used to compare SDC3 gene expression in normal breast tissue, breast cancer tissue, and metastatic tissue (Figure 2A). TNM-plot analysis of gene chip data of normal tissue (n = 242), breast cancer tissue (n = 7569), and metastatic tissue (n = 82) demonstrated that SDC3 RNA was significantly upregulated in breast cancer tissue (Dunn-test P = 5.45e-17), compared to normal tissue. However, SDC3 RNA expression was not significantly altered in metastatic tissue (Dunn-test P = 1.28e-01), in relation to normal tissue.
3.2. SDC3 Expression Affects the Prognosis and Survival of Breast Cancer Patients
To investigate, whether SDC3 expression influences the relapse-free survival (RFS) of breast cancer patients, a Kaplan-Meier Plotter analysis was conducted, using the KMplot website (KMplot, https://kmplot.com/analysis/, accessed September 10th, 2024). All breast cancer samples included in the analysis were stratified by receptor status, molecular subtypes, lymph node status, grade, and treatment (Figure 2B, Table 2). Our Kaplan-Meier Plotter analysis revealed that high SDC3 RNA expression levels served as a protective factor for the relapse-free survival of breast cancer patients overall. This correlation applied to Her2-negative-, St. Gallen subtype luminal A-, St. Gallen subtype luminal B-, St. Gallen subtype basal-, PAM50 subtype luminal B-, PAM50 subtype basal-, lymph node-negative-, and Grade 2- tumors. High SDC3 expression was furthermore associated with better relapse-free survival in breast cancer patients following neoadjuvant chemotherapy.
3.3. SDC3 RNA Expression Varies in Breast Cancer Cell Lines of Different Classification
qRT-PCR analysis was performed, to measure the gene expression levels of SDC3 in seven different human breast cancer cell lines. The cell lines represent different molecular breast cancer subtypes, including the luminal A (MCF-7), luminal B (BT474), HER2-positive (SKBR3, MDA-MB 453), triple-negative A (basal-like) (MDA-MB 468, HCC1806, BT20), and triple-negative B (normal-like/claudin-low) (MDA-MB-231, BT549, SUM149 subtype [26]. Our qRT-PCR analysis demonstrated that SDC3 gene expression levels varied substantially across the breast cancer cell lines investigated (Figure 3A). For our further functional studies, we selected the widely used MDA-MB-231 as one of the highest, and MCF-7 as one of the lowest SDC3-expressing cell lines [27]. MDA-MB-231 cells model the triple-negative breast cancer subtype, which is characterized by the absence of estrogen- (ER-), progesterone- (PR-), and Her2- (Her2-) receptors [26]. MCF-7 cells are classified as the luminal A breast cancer subtype, as they express estrogen (ER+), and progesterone receptors (PR+), but not Her2-receptors (Her2-) [26].
Figure 2.
SDC3 is highly expressed in tumors and correlates with better survival. (A) SDC3 expression varies across breast cancer progression stages. Gene chip analysis reveals significantly increased SDC3 mRNA levels in primary tumors and metastatic lesions, compared to normal breast tissue. (B) SDC3 expression is associated with the relapse-free survival (RFS) of breast cancer patients. Kaplan-Meier relapse-free survival curves are plotted based on: all breast cancer patients (n =4929), HER2 negative status (n = 4047), St. Gallen luminal A status (n = 2277), Grade 2 (n = 1177), and neoadjuvant chemotherapy (n = 402). Log-rank p values and hazard ratios (HRs; 95% confidence interval in parentheses) are shown.
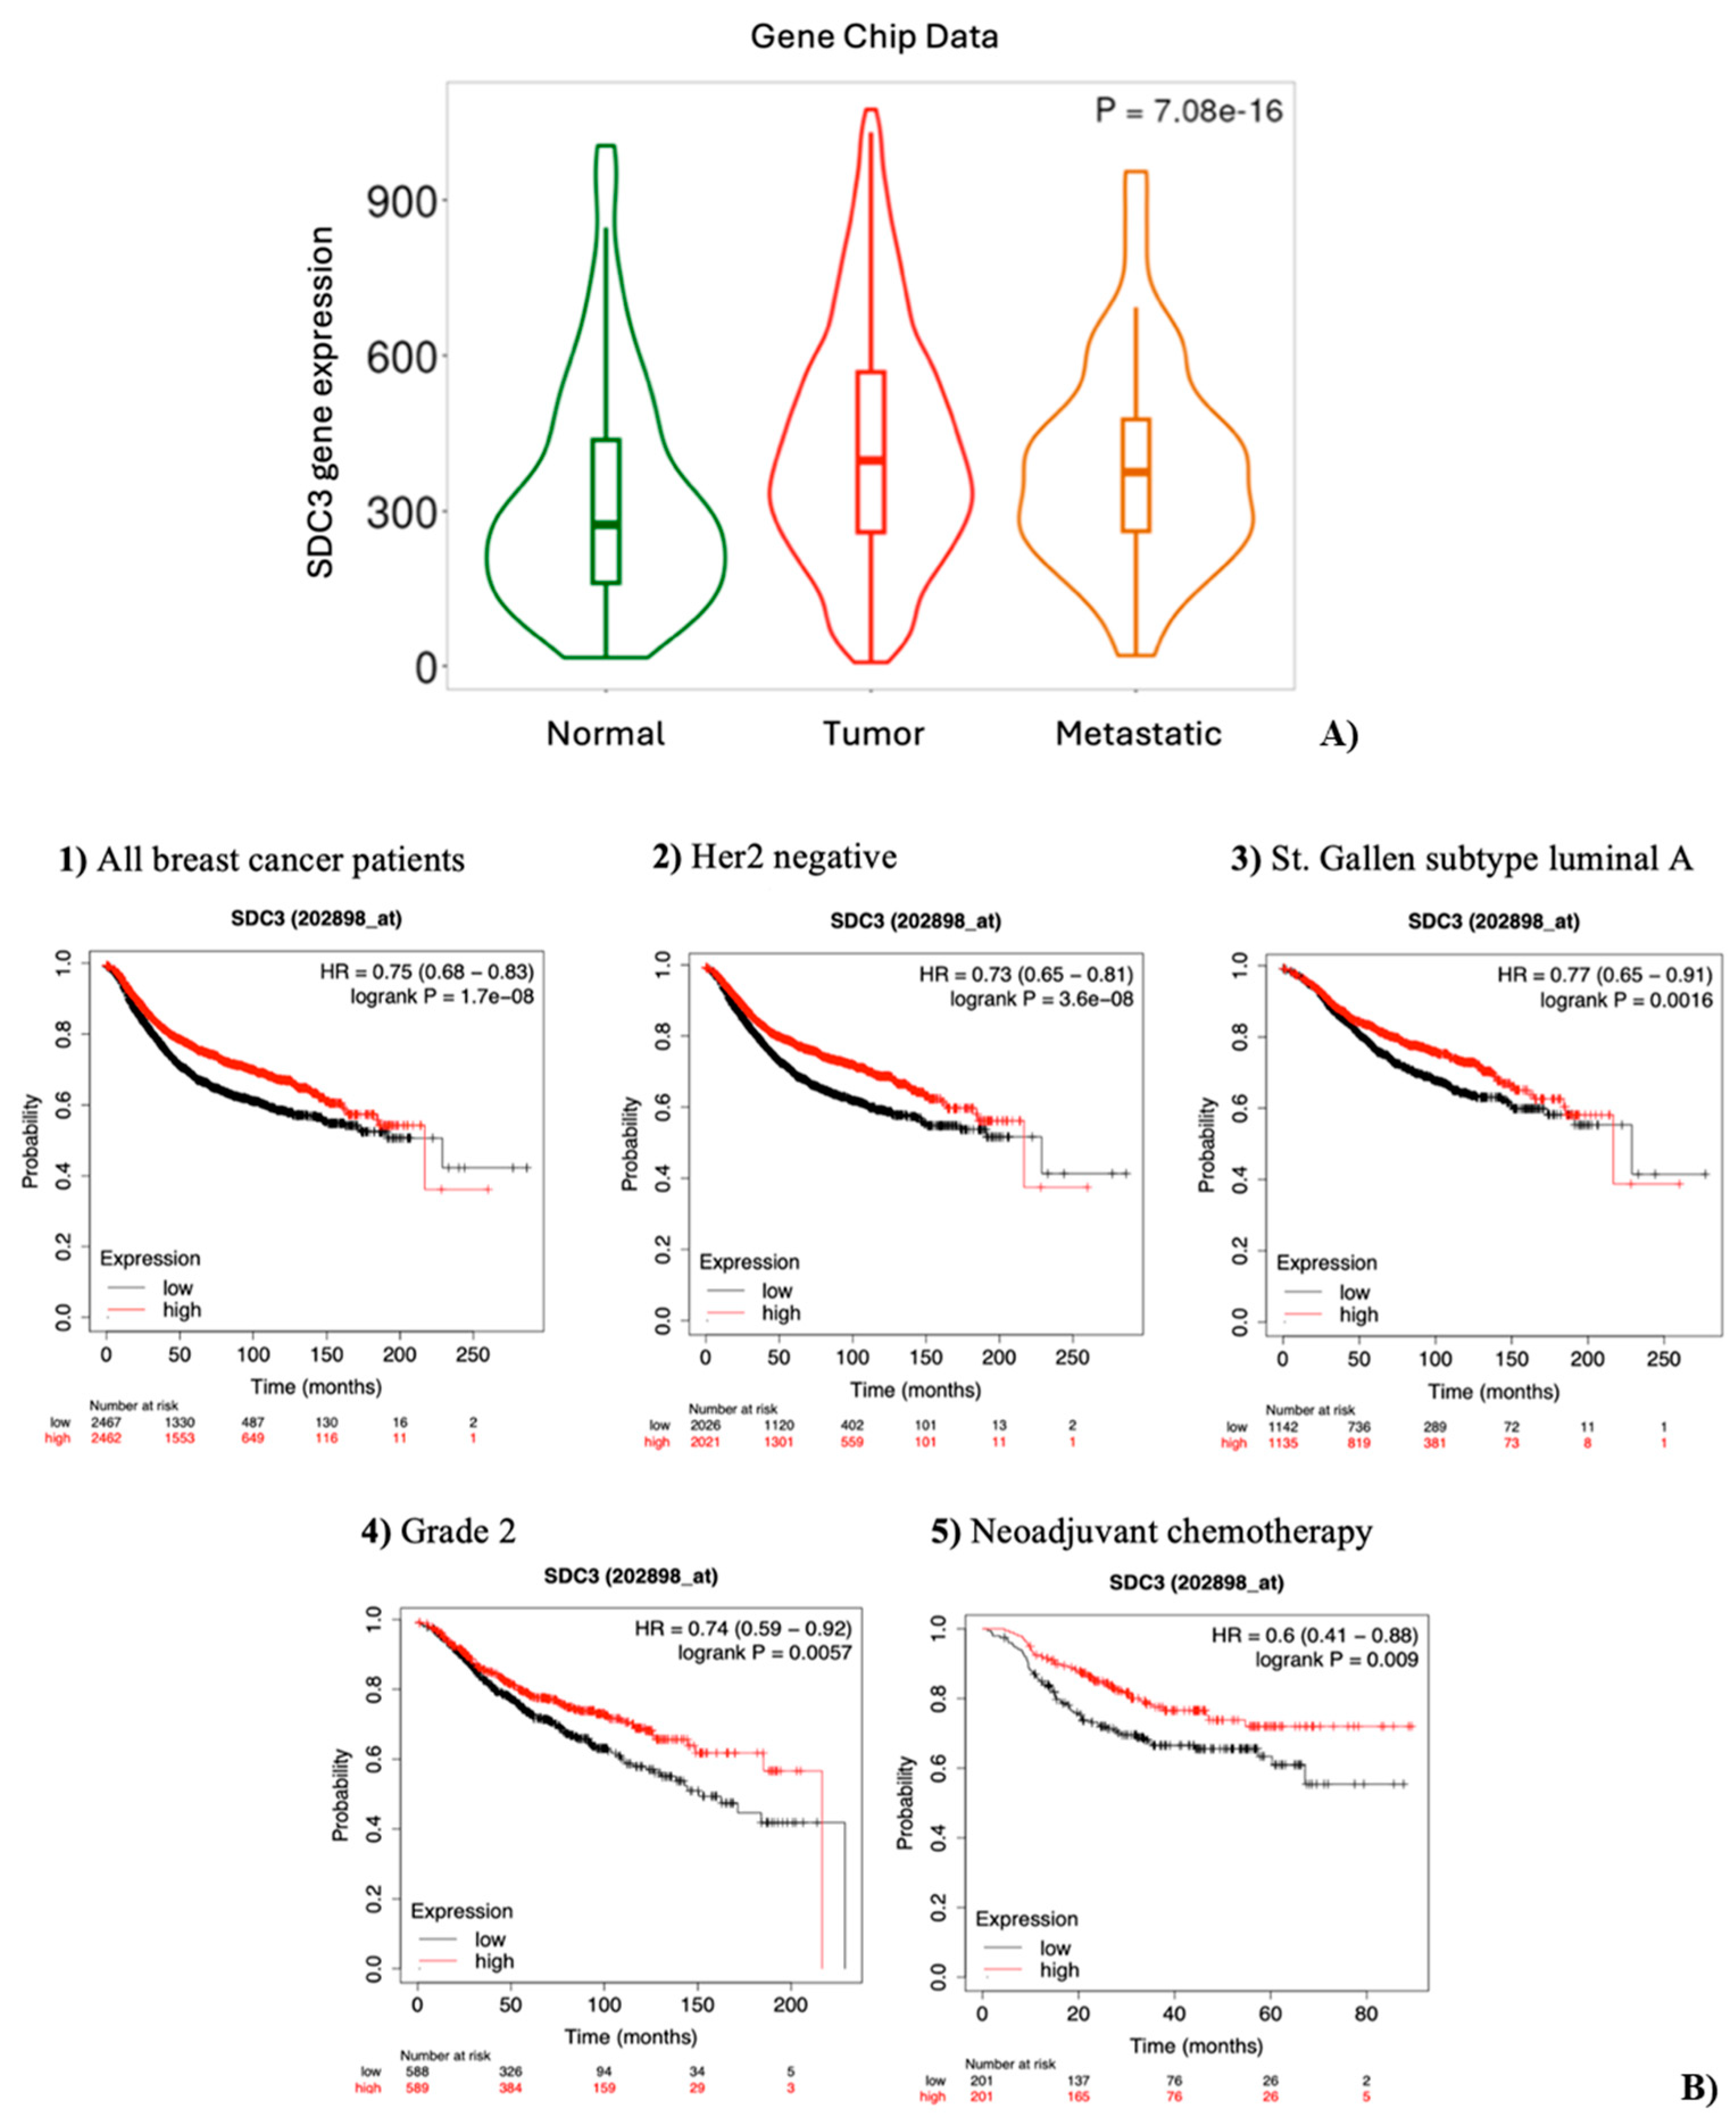

Table 3.
Correlation between SDC3 RNA expression and RFS of breast cancer patients.
| Classification | Status | Cases | Hazard Ratio | P value |
|---|---|---|---|---|
| All breast cancer patients | 4929 | 0.75 (0.68 - 0.83) | Log-rank P = 1.7e-08 | |
| Estrogen receptor (ER) | Positive | 2561 | 0.87 (0.75 – 1.02) | Log-rank P = 0.079 |
| Negative | 796 | 0.81 (0.64 – 1.03) | Log-rank P =0.086 | |
| Progesterone receptor (PR) | Positive | 926 | 0.95 (0.71 – 1.26) | Log-rank P = 0.72 |
| Negative | 925 | 0.91 (0.72 – 1.14) | Log-rank P = 0.41 | |
| Her2 | Positive | 882 | 0.85 (0.68 – 1.06) | Log-rank P = 0.15 |
| Negative | 4047 | 0.73 (0.65 – 0.81) | Log-rank P = 3.6e-08 | |
| ER, PR, Her2 | Negative | 392 | 0.9 (0.63 – 1.29) | Log-rank P = 0.56 |
| St. Gallen subtype | Luminal A | 2277 | 0.77 (0.65 – 0.91) | Log-rank P = 0.0016 |
| Luminal B | 1419 | 0.71 (0.59 – 0.85) | Log-rank P = 0.00015 | |
| Her2 positive | 315 | 0.9 (0.64 – 1.29) | Log-rank P = 0.6 | |
| Basal | 846 | 0.72 (0.58 – 0.9) | Log-rank P = 0.004 | |
| PAM50 subtype | Luminal A | 1809 | 0.88 (0.72 – 1.08) | Log-rank P = 0.23 |
| Luminal B | 1353 | 0.83 (0.7 – 0.99) | Log-rank P = 0.038 | |
| Her2 positive | 695 | 0.86 (0.68 – 1.1) | Log-rank P = 0.23 | |
| Basal | 953 | 0.69 (0.56 – 0.86) | Log-rank P = 7e-04 | |
| Lymph node | Positive | 1656 | 0.97 (0.82 – 1.15) | Log-rank P = 0.75 |
| Negative | 2368 | 0.74 (0.63 – 0.87) | Log-rank P = 0.00027 | |
| Grade | 1 | 397 | 1.12 (0.73 – 2) | Log-rank P = 0.47 |
| 2 | 1177 | 0.74 (0.59 – 0.92) | Log-rank P = 0.0057 | |
| 3 | 1300 | 0.88 (0.73 – 1.06) | Log-rank P = 0.16 | |
| Treatment with chemotherapy | Neoadjuvant | 402 | 0.6 (0.41 – 0.88) | Log-rank P = 0.009 |
| Adjuvant | 458 | 0.93 (0.67 – 1.3) | Log-rank P = 0.68 | |
| Treatment with endocrine therapy | 867 | 0.86 (0.66 – 1.12) | Log-rank P = 0.25 | |
| Treatment with chemotherapy and endocrine therapy | 510 | 1.22 (0.81 – 1.83) | Log-rank P = 0.34 |
3.4. SDC3 Depletion Affects the Metabolic Activity and Cell Cycle of Human MDA-MB-231 and MCF-7 Breast Cancer Cells
Building on our in-silico analysis, which suggested a potential role of SDC3 in breast cancer pathogenesis, we conducted in vitro experiments with SDC3-depleted human MDA-MB-231 and MCF-7 breast cancer cells. We studied the impact of SDC3 downregulation in vitro using the siRNA and siPool knockdown approach, which were quantified by qRT-PCR and analyzed in relation to the cells transfected with the negative control (Figure 3B). In MDA-MB-231 cells, we observed a significant downregulation of approx. 80% of SDC3 expression, with both SDC3 siRNA (p ≤ 0.01) and SDC3 siPool (p ≤ 0.001) knockdown approaches. In MCF-7 cells, we detected a significant downregulation of approx. 50% of SDC3 expression, in both SDC3 siRNA (p ≤ 0.001) and SDC3 siPool (p ≤ 0.001) transfected cells.
We then analyzed the effect of SDC3 depletion on cell viability, utilizing the metabolic MTT assay (Figure 3C). The analysis revealed that the metabolic activity of MDA-MB-231 cells following siRNA-mediated SDC3 knockdown was significantly decreased by approx. 63% (p ≤ 0.01), while it was reduced by approx. 22% (p ≤ 0.05) following SDC3 knockdown with the siPool. A similar effect was observed in MCF-7 cells, where the metabolic activity was significantly decreased by approx. 32% (p ≤ 0.01) upon siRNA-mediated SDC3 knockdown. A non-significant reduction in metabolic activity was observed following SDC3 depletion with the siPool.
To investigate the potential role of SDC3 on the cell cycle, a flow cytometry analysis with transfected MDA-MB-231 and MCF-7 cells was performed (Figure 3D). Significant changes in the G1- and S-phase of the cell cycle were observed in MDA-MB-231 cells transfected with the SDC3 siRNA, as significantly more cells accumulated in the G1-phase (80.7%; p ≤ 0.01), while significantly fewer cells were detected in the S-phase (8.2%; p ≤ 0.01), compared to the negative control (G1-phase: 66.4%; S-phase: 20.0%). The G2/M-phase was not altered in MDA-MB-231 cells following transfection with the SDC3 siRNA. By contrast, MDA-MB-231 cells transfected with the siPool did not exhibit alterations of the cell cycle, and the proportions of cells detected in the G1-, S-, and G2/M phases were similar to those of the negative control. The cell cycle of MCF-7 cells transfected with the SDC3 siRNA and siPool was not significantly altered in our analysis.
3.5. SDC3 Depletion Affects Three-Dimensional Spheroid Growth of Human MDA-MB-231 and MCF-7 Breast Cancer Cells
We analyzed the effect of SDC3 downregulation on the growth of three-dimensional (3D) spheroids in a hanging drop assay, as a readout of stem cell activity [23,28,29]. MDA-MB-231 cells transfected with the negative control formed compact, round spheroids from day 4 until day 7. In comparison, SDC3 siRNA-transfected MDA-MB-231 cells formed less cohesive spheroids that exhibited loose, irregular shapes on day 4. By day 7, the spheroids started to dissolve, single cells drifted away from the edges and spread throughout the culture medium. Quantification of the core spheroid area showed that siRNA-mediated SDC3 depletion resulted in a significant increase (p ≤ 0.05) in sphere size on day 4, while a significant decrease (p ≤ 0.05) was visible on day 7. Interestingly, MDA-MB-231 cells transfected with the siPool formed compact, round spheroids from day 4 until day 7 and did not disintegrate in a similar manner as MDA-MB-231 cells transfected with the SDC3 siRNA. On day 4, the sphere size of the SDC3 siPool-transfected cells was non-significantly altered, however, a significant decrease (p ≤ 0.001) was detected by day 7 (Figure 4A).
MCF-7 cells transfected with the negative control formed spheroids of irregular shapes with several side extensions and holes from day 4 until day 7. This morphology was also observed in MCF-7 cells transfected with the SDC3 siRNA on day 4. However, by day 7, SDC3 siRNA-transfected MCF-7 cells formed spheroids of round, compact shapes. The sphere size of MCF-7 cells transfected with the SDC3 siRNA was non-significantly altered on day 4 and significantly decreased (p ≤ 0.001) on day 7, in comparison to the negative control. A similar trend was observed for MCF-7 cells transfected with the SDC3 siPool. On day 4, the spheroids of siPool-transfected MCF-7 cells exhibited irregular shapes with several side extensions and holes, and by day 7 the spheroids were round and compact. The sphere size of MCF-7 cells transfected with the SDC3 siPool was non-significantly altered on day 4, by day 7 it was significantly decreased (p ≤ 0.05), compared to the negative control (Figure 4B).
3.6. SDC3 Depletion Affects Cell Migration of Human MDA-MB-231 and MCF-7 Breast Cancer Cells
The cell migration assay was conducted with siRNA-transfected MDA-MB-231 and MCF-7 cells. The migration of MDA-MB-231 cells was significantly decreased by 68% (p ≤ 0.01) following SDC3 knockdown, in comparison to the negative control. MCF-7 cells displayed little migratory behavior in general, cell migration was not significantly altered upon SDC3 knockdown, compared to the negative control (Figure 5A).
3.7. SDC3 Depletion Affects the RNA Expression of Target Genes Associated with Relevant Signaling Pathways in Breast Cancer
qRT-PCR was performed with transfected MDA-MB-231 and MCF-7 cells to explore the effects of SDC3 depletion on the expression of several target genes associated with relevant signaling pathways in breast cancer. The gene expression of SDC1 (Sdc1) and SDC4 (Sdc4) was evaluated in SDC3-depleted cells, to determine potential compensatory expression changes. Moreover, the expression of target genes associated with notch-signaling (Notch1, HES1), wnt-signaling (WNT5A, TCF7L1), hedgehog-signaling (Gli1, Gli2, Gli3), epithelial-to-mesenchymal-transition (Twist, Snail1, Snail2, CDH1, Vimentin), matrix-metalloproteinases (MMP1, MMP2, MMP9), angiogenesis (VEGF-A), inflammation (IL-8), basement membranes (COL4A2), and CD44-signaling (CD44) was investigated. These target genes were chosen for our analysis, as previous studies have shown the involvement of other syndecan family members in these pathways [14,16,17,30,31,32,33,34,35].
In MDA-MB-231 cells, the most consistent changes in gene expression were observed for Gli2, Twist, MMP1, MMP2, and MMP9 following SDC3 knockdown with the siRNA and siPool. While Gli2, twist, and MMP9 were downregulated upon SDC3 knockdown, an upregulation was observed for MMP1 and MMP2 (Figure 5B, Supp. A). In MCF-7 cells, siRNA- and siPool-mediated SDC3 knockdown resulted in consistent upregulation of HES1, CDH1, and VEGF-A (Figure 5C, Supp. B). Notably, SDC3 knockdown with the siPool led to an upregulation of SDC4 in MCF7 cells (Supp. B).
3.8. SDC3 Depletion Affects the Activation of SRC of Human MDA-MB-231 and MCF-7 Breast Cancer Cells
To further evaluate potential mechanisms by which SDC3 influences cell viability, cell-cycle phases, stemness-associated factors, and cell migration mainly in MDA-MB-231 and in MCF-7 breast cancer cells, we examined the effect of SDC3 downregulation on the potential activation of Src proto-oncogene tyrosine-protein kinase (pSRC), as well as on the expression of its total form (SRC). Src has previously been associated with SDC3 function in a neurobiological context [68]. Moreover, Src is a key regulator of several oncogenic signaling pathways and has been implicated in promoting tumor angiogenesis, metabolic reprogramming, and metastasis in various cancers [69,70,71,72].
Western blot analysis was performed with MDA-MB-231 and MCF-7 cells, following transfection with the negative control, SDC3 siRNA, and SDC3 siPool, and additional incubation with tissue-factor-pathway-inhibitor (TFPI) (Figure 5D). TFPI has been previously linked to SDC1 in breast cancer [36], and SDC3 in vascular and cancer cells [37].
MDA-MB-231 cells transfected with the SDC3 siRNA exhibited reduced phosphorylation of Src (pSRC), while the expression of the total form (SRC) was not altered in comparison to the negative control. A similar observation was made for MDA-MB-231 cells transfected with the SDC3 siRNA and treated with TFPI. MDA-MB-231 cells transfected with the siPool did not show activation or expression changes of pSRC and SRC, respectively, in comparison to the negative control. However, MDA-MB-231 cells transfected with the SDC3 siPool and treated with TFPI exhibited a slight downregulation of pSRC, but not of SRC. MCF-7 cells transfected with the siRNA showed visible downregulation of both pSRC and SRC. The same effect was observed in MCF-7 cells transfected with the SDC3 siRNA and treated with TFPI. By contrast, the expression of the pSRC only was reduced in MCF-7 cells following transfection with the SDC3 siPool. Similarly, this effect was detected in MCF-7 cells transfected with the SDC3 siPool and treated with TFPI (Figure 5D).
3.9. STRING Functional Enrichment Analysis
To investigate the molecular interactions between SDC3 and key proteins involved in signaling pathways in cancer, we performed an in silico functional interaction analysis using the open-access tool STRING database (STRING, https://string-db.org, accessed September 13th, 2024) [25]. We developed a virtual overview of our research findings, as depicted in Figure 6A. Our analysis revealed direct connections between SDC3, proto-oncogene tyrosine-protein kinase Src (SRC), fibroblast growth factor 2 (FGF2), and matrix metalloproteinase 7 (MMP7). Through SRC and FGF2, SDC3 was shown to interact with vascular endothelial growth factor receptor 1 (FLT1), vascular endothelial growth factor receptor 2 (KDR), vascular endothelial growth factor B (VEGFB), and vascular endothelial growth factor C (VEGFC). Indirect connections between SDC3 and cadherin-1 (CDH1) through SRC, FGF2, and MMP7 were furthermore established. Moreover, multiple interactions between SDC3 and the matrix metalloproteinases-1, -2, -9, and -14 (MMP1, MMP2, MMP9, and MMP14), as well as the metalloproteinase inhibitor-2 (TIMP2) and -4 (TIMP4) were visualized. Figure 6B depicts the gene ontology (GO) of the interconnections between SDC3 and the presented markers in Figure 6A. The biological processes category included mechanisms like cell migration, transmembrane receptor protein tyrosine kinase signaling, vascular endothelial growth receptor signaling, chemotaxis, vascular endothelial growth factor signaling, tube morphogenesis, and angiogenesis (Figure 6B, blue). In terms of molecular function, SDC3 was linked to metalloendopeptidase-, vascular endothelial factor receptor-, chemoattractant-, protein tyrosine kinase-, transmembrane receptor tyrosine kinase-, and serine-type endopeptidase activity. Furthermore, SDC3 was associated with the functions of protein binding, growth factor receptor binding, catalytic activity acting on a protein, and integrin binding (Figure 6B, green). The cellular component analysis demonstrated that SDC3 was related to the extracellular region, -space, and -matrix, as well as to other cellular components, such as cytoplasmic vesicles, sorting endosomes, platelets alpha granule lumen, endomembrane systems and endosomes (Figure 6B, orange). KEGG-pathway analysis revealed interconnections between SDC3 and the Rap1-signaling, focal-adhesion-signaling, Ras-signaling, Relaxin-signaling, MAPK-signaling, EGFR-tyrosine-kinase-inhibitor-resistance, PI3K-Akt-signaling, and adherens-junctions-pathways. Also was associated with pathways-related-to-proteoglycans-in-cancer, -to-bladder-cancer, -to-melanoma, -to-fluid-shear-stress-and-atherosclerosis, and to-gastric-cancer signaling (Figure 6C).
4. Discussion
Breast cancer is the most frequently diagnosed malignant tumor in women worldwide [1,2]. Its incidence is rising across all regions globally, despite significant advancements in early detection and treatment development [4]. Enhancing therapeutic strategies and identifying reliable predictive and prognostic markers therefore remain key priorities in ongoing research [4].
Syndecans are integral cell surface heparan sulfate proteoglycans that influence multiple signaling pathways, regulating cell proliferation, adhesion, motility, angiogenesis, wound repair, and inflammation [14]. In cancer, syndecans can be aberrantly expressed and are implicated in tumorigenesis and metastasis [16]. Among all members of the syndecan family, SDC3 remains the least studied to date, with limited data currently available on its dysregulation in human malignancies [38].
Our in-silico analysis of the TNM-plot-, and The Human Protein Atlas-database revealed that SDC3 mRNA expression was significantly upregulated in breast cancer tissue, in comparison to normal breast tissue. In breast cancer metastasis, no significant alterations in SDC3 expression were detected, which might suggest that the molecule plays distinct roles in the early and late stages of breast tumor development. Interestingly, the analysis of The Human Protein Atlas demonstrated that SDC3 mRNA and protein are mainly localized in the mitochondria and nucleoplasm of human cells. Since a protein´s function is often closely tied to its precise location within tissues, cells, and subcellular structures, we suggest that the spatial distribution of SDC3 may be of relevance to breast tumor biology [20]. Using the Kaplan-Meier-Plotter online tool, we explored the association between SDC3 and the relapse-free survival (RFS) of breast cancer patients. High SDC3 expression was significantly linked to improved RFS (n = 4929), particularly in the HER2-negative, luminal A, luminal B, and basal subtype, as well as in patients receiving neoadjuvant chemotherapy, suggesting a potential stage-specific role for SDC3 in breast cancer metastasis. Supporting this theory, a study on ovarian cancer found that SDC3 RNA expression was higher in primary tumors compared to metastatic sites, further indicating the potential association of the molecule with early-stage cancer progression [17].
SDC3 expression has previously been observed in various cancer cell lines (i.e. bladder cancer, hepatocellular carcinoma, mammary carcinoma, ovarian cancer, pancreatic cancer, prostate carcinoma, renal cell carcinoma, and glioma cell lines) [39], and in cells of the tumor microenvironment (TME), specifically tumor-associated macrophages and endothelial cells [39]. Interestingly, the molecule has been recently identified as a modulator of macrophage function, aiming at supporting a pro-inflammatory and anti-tumor phenotype [40]. SDC3 defective macrophages were found to exhibit distinctive gene expression patterns, resulting in impaired tumor cell phagocytosis and increased tumor cell proliferation [40].
However, the distinct SDC3 expression patterns in each cancer type and its correlation with cancer progression largely remain unexplored. Previous studies on SDC3 in breast cancer have yielded mixed results [40,41]. Wu et al. (2013) found in an immunohistochemical and in situ hybridization study on 159 breast cancer patients that GFRα1 (GDNF family receptor alpha-1) and GFRα3 (GDNF family receptor alpha-3) (which, like SDC3, bind Artemin/ARTN) were better predictors of breast cancer progression than SDC3 [41]. In contrast, Jiang et al. (2021) included SDC3 in a seven-gene glycolysis-related signature (PGK1, CACNA1H, IL13RA1, SDC1, AK3, NUP43, SDC3) that predicted poorer prognosis in high-risk breast cancer patients in an analysis of The Cancer Genome Atlas mRNA profiling datasets [42]. Notably, Kaplan-Meier analysis in their study showed that higher SDC3 expression alone was associated with a better prognosis, in accordance with our study [42]. Therefore, the difference in methodology (immunohistochemistry vs. transcriptomics) and the size of the sample collectives (being substantially higher in the transcriptomic studies) may have accounted for the discrepancies.
Building upon our in-silico findings, we conducted several in vitro experiments using the human breast cancer cell lines MDA-MB-231 and MCF-7. Gene silencing of SDC3 was achieved by two independent siRNA-, and siPool-knockdown approaches. Subsequently, several functional assays were performed to assess the metabolic activity, cell cycle progression, 3D-spheroid formation, and cell migration in both SDC3-depleted and control MDA-MB-231 and MCF-7 cells. Surprisingly, in contrast to the positive prognostic value of high SDC3 expression, SDC3 depletion in breast cancer cells in vitro resulted in a reduction of pathogenetic phenotypes. This may suggest a differential role for cancer cell-autonomous SDC3 and SDC3 in the tumor microenvironment, as the public gene expression datasets are derived from whole tumor containg tumor cells as well as cells of the tumor microenvironment (cancer-associated fibroblasts, infiltrating immune cells, blood vessel derived endothelial and smooth muscle cells). Indeed, SDC3 expressed by marcophages infiltrating tumor tissue may contribute to tumor cell phagocytosis and decreased tumor cell proliferation, thus exhibiting an antitumoral effect [40].
With respect to breast cancer cell-autonomous SDC3, our MTT analysis demonstrated that SDC3-depletion in both MDA-MB-231 and MCF-7 cells resulted in a significant reduction of metabolic activity. This finding is supported by a study on ovarian cancer, which reported that SDC3 knockdown significantly reduced cell viability in SKOV3 ovarian cancer cells [17]. We can only speculate if our MTT assay findings align with the analysis of The Human Protein Atlas, possibly suggesting a link between SDC3, cellular metabolism, and its mitochondrial localization.
Our cell cycle analysis revealed that siRNA-mediated knockdown of SDC3 caused G1-phase accumulation and reduced S-phase entry, particularly in MDA-MB-231 cells. SDC3 depletion by siPool-transfection did not yield similar effects, possibly due to differences in knockdown efficiency or compensatory mechanisms. We did not observe any effects of SDC3 depletion on apoptosis in our experimental model (results not shown). SDC3 has been previously identified as a regulator of the cell cycle in cerebellar granule cell precursors (CGCPs), where it was shown to interact with sonic hedgehog (Shh) signaling to modulate cell cycle exit and differentiation [43]. Additionally, loss of SDC3 was found to impair the cell cycle progression of satellite cells (SCs), the adult skeletal muscle progenitors, resulting in reduced progenitor cell expansion, delayed onset of differentiation, increased cell death, and diminished self-renewal capacity [44].
Breast cancer progression, treatment resistance, and relapse are greatly influenced by the activities of cancer stem cells (CSCs)[45]. CSCs possess multiple self-renewal and differentiation abilities that support tumor heterogeneity Previous studies have shown that heparan sulfate proteoglycans can modulate breast stem cell properties [46,47,48]. Therefore, we evaluated the effect of SDC3 depletion on the growth of three-dimensional (3D) spheroids in a hanging drop assay, a method considered suitable for studying stem cell biology in vitro [28,29]. SDC3 knockdown in both MDA-MB-231 and MCF-7 cells resulted in altered spheroid morphology and a reduction in spheroid size, compared to the negative controls. This may suggest a potential role for SDC3 in enforcing CSC attributes. SDC3 has been previously shown to play a role in regulating physiological stem cell function as well as cell adhesion [44,49,50]. The molecule has been implicated in bone-marrow-derived-mesenchymal stem cell (MSC) biology [49], in stem cell-related notch-signaling during myogenesis [44], and in the differentiation of neural stem cells (NSCs) [50]. In ovarian cancer, a link between SDC3 and the CSC phenotype has already been established [17]. It was demonstrated that SDC3 depletion in SKOV3 and CAOV3 cells led to significant changes in spheroid morphology, along with altered RNA expression of several stemness-related constituents of the notch-, wnt- and hedgehog pathway [17]. Similarly, breast cancer initiation and progression were found to be influenced by a dysregulated notch-, hedgehog-, and wnt- signaling [51]. Our qRT-PCR analysis revealed that Gli2 (associated with hedgehog-signaling) in MDA-MB-231 cells and HES1 (associated with notch-signaling) in MCF-7 cells were significantly altered following SDC depletion. These findings may suggest that SDC3 plays a role in regulating notch- and hedgehog-signaling pathways across different cancer types.
Syndecans are important mediators of cancer cell migration, due to their ability to bind different growth factors, chemokines, morphogens, and extracellular matrix components [14,16,52]. In our in vitro migration assay, siRNA-mediated SDC3 depletion led to reduced cell migration in both MDA-MB-231 and MCF-7 cells. This effect was statistically significant in MDA-MB-231 cells, but non-significant in MCF-7 cells. Since MCF-7 cells form tight cell-cell junctions and are more differentiated than MDA-MB-231 cells [26], this finding may be attributable to inherent differences in the characteristics of these cell lines.
SDC3 was reported to play a role in cell motility in both inflammatory and neurobiological contexts [53,54,55]. The molecule was found to inhibit leukocyte migration in vitro and to reduce disease severity in animal models of rheumatoid arthritis [56]. Furthermore, SDC3 deficiency has been shown to impair neural cell migration and to perturb the laminar structure of the cerebral cortex during brain development [53]. Interestingly, it was observed that SDC3 interacts with the glial cell line-derived-neurotropic factor family ligands (GFL) with the involvement of Src kinase activation, thereby mediating cell spreading and neurite outgrowth [54].
To further investigate the involvement of SDC3 in cell migration, invasion, and epithelial-to-mesenchymal transition (EMT), we examined its role at the molecular level using qRT-PCR analysis. EMT is defined as a cellular program, in which epithelial cells acquire a mesenchymal phenotype that enables cell migration and invasion of secondary sites [57]. Our analysis revealed that SDC3 depletion in both MDA-MB-231 and MCF-7 cells significantly impacted the expression of EMT-markers. SDC3 knockdown resulted in the downregulation of Twist in MDA-MB-231 cells, as well as in increased expression of CDH1 in MCF7 cells. Furthermore, SDC3 depletion significantly upregulated MMP1, and downregulated MMP9 in MDA-MB-231 cells, suggesting a multifunctional role of the molecule in modulating migration and invasion in breast cancer [58,59]. SDC3 has been previously associated with MMP-mediated shedding in neurobiological contexts [60]. Predictive algorithms have suggested roles for MMP2 and MMP9 at multiple cleavage sites of SDC3, however, the exact mechanisms and protease in SDC3 shedding have not yet been confirmed experimentally [61,62].
Moreover, we aimed to explore the effect of SDC3 on angiogenesis at the molecular level. Syndecans have previously been shown to mediate VEGF-associated signaling and regulate angiogenesis [32,63,64]. In our qRT-PCR analysis, we observed that SDC3 knockdown upregulated VEGF-A expression in MCF-7 cells. SDC3 has been reported to suppress endothelial cell migration, indicating a potential anti-angiogenic function of the molecule [65]. On the other hand, thrombin-cleaved SDC3 fragments were found to induce endothelial hyperpermeability, having pro-angiogenic effects [66]. It has been revealed that hypoxia activates the hypoxia-inducible factor 1-alpha (HIF1α)/ vascular endothelial growth factor A (VEGF-A) axis in breast cancer to promote angiogenesis [67]. Moreover, hypoxia-induced angiogenic HIF1α/VEGF-A signaling was related to SDC3 upregulation in hypoxic tumors, which further implicates SDC3 in breast tumor growth and vascular remodeling [39].
To evaluate the underlying mechanisms by which SDC3 influences cell viability, cell-cycle regulation, stemness, and migration in breast cancer, we investigated the effects of SDC3 depletion on the activation of proto-oncogene tyrosine-protein kinase Src (pSRC, SRC). Src has been previously linked to SDC3 function in a neurobiological context [68]. Our results showed a trend of reduction in the activation of Src in MDA-MB-231 and MCF-7 cells, suggesting that SDC3 may regulate Src signaling and thereby potentially influence breast cancer pathogenesis. Src has been shown to be involved in multiple signaling pathways, such as PI3K/AKT and HIF1α, and to impact tumor angiogenesis, metabolism, and metastasis [69,70,71,72]. Of note, Src has also been associated with activating signal transduction pathways leading to the expression of HIF and its downstream genes, providing a molecular mechanism for tumor cells to adapt to a hypoxic environment [70]. HIF regulates several pro-tumorigenic genes, including those involved in angiogenesis (i.e. VEGFA, IL-8), glycolytic cellular metabolism (i.e. LDHA), extracellular matrix remodeling (i.e. MMPs), epithelial-to-mesenchymal transition (i.e. CDH1), metastasis (i.e. TWIST1), and cell motility and adhesion (i.e. integrins) [73].
To summarize our key research findings, we developed a virtual overview of the signaling pathways affected by SDC3 using the STRING database. Our analysis revealed direct connections between SDC3, proto-oncogene tyrosine-protein kinase Src (SRC), fibroblast growth factor 2 (FGF2), and matrix metalloproteinase 7 (MMP7). Further indirect associations were established between SDC3 and vascular endothelial growth factor receptor 1 (FLT1), vascular endothelial growth factor receptor 2 (KDR), vascular endothelial growth factor B (VEGFB), vascular endothelial growth factor C (VEGFC), cadherin-1 (CDH1) as well as matrix metalloproteinases-1, -2, -9 and -14 (MMP1, MMP2, MMP9, and MMP14).
5. Conclusions
We suggest that breast cancer cell-derived SDC3 contributes to several cancer hallmarks associated with breast tumorigenesis and progression. Our molecular analysis may provide a mechanistic explanation for the functional changes observed upon SDC3 depletion. Future research should further elucidate SDC3-related signal transduction pathways in the context of breast cancer and a possible antitumoral effect of SDC3 of the tumor microenvironment, which may contribute to its positive predictive value in transcriptome-based survival analysis. Based on our findings and existing literature, an association between the molecule and the previously described pathways appears likely. Further investigation, using advanced preclinical models, could provide valuable insights into its potential as a therapeutic target or biomarker in breast cancer.
Supplementary Materials
The following supporting information can be downloaded at the website of this paper posted on Preprints.org. Figure S1, Table S1.
Author Contributions
Conceptualization, M.G.; methodology, B.G., B.G.; validation, N.H. and N.A. E-S.; formal analysis, L.H., N.H.; investigation, L.H.; resources, M.G., L.H.; data curation, L.H., N.H., B.G., N.A. E-S.; writing—original draft preparation, L.H.; writing—review and editing, N.H., M.G.; visualization, L.H.; supervision, M.G.; project administration, M.G.; funding acquisition, M.G.; N.H. All authors have read and agreed to the published version of the manuscript.
Funding
Funding was provided by the European Union: Marie Skłodowska-Curie Actions (MSCA) projects #101086322 HEPINIB (to M.G.) and #101130985 CARES (to M.G.), and German Egyptian Research Long-term Scholarship programme (GERLS) Grant 91664677 (to N.H.).
Institutional Review Board Statement
Informed Consent Statement
Not applicable.
Data Availability Statement
The data are contained within the article.
Acknowledgments
We would like to thank Birgit Pers for expert technical assistance. We would like to state that the results published in this work are the subject of the inaugural dissertation to be handed in to the University of Münster by Lena Habenicht.
Conflicts of Interest
The authors declare no competing interests.
References
- Bray, F.; Laversanne, M.; Sung, H.; Ferlay, J.; Siegel, R.L.; Soerjomataram, I.; Jemal, A. Global cancer statistics 2022: GLOBOCAN estimates of incidence and mortality worldwide for 36 cancers in 185 countries. CA: A Cancer Journal for Clinicians 2024, 74, 229–263. [Google Scholar] [CrossRef] [PubMed]
- Łukasiewicz, S.; Czeczelewski, M.; Forma, A.; Baj, J.; Sitarz, R.; Stanisławek, A. Breast Cancer - Epidemiology, Risk Factors, Classification, Prognostic Markers, and Current Treatment Strategies - An Updated Review. Cancers 2021, 13, 1–30. [Google Scholar] [CrossRef] [PubMed]
- Zhang, X. Molecular Classification of Breast Cancer Relevance and Challenges. Archives of Pathology and Laboratory Medicine 2023, 147, 46–51. [Google Scholar] [CrossRef]
- Smolarz, B.; Nowak, A.Z.; Romanowicz, H. Breast Cancer—Epidemiology, Classification, Pathogenesis and Treatment (Review of Literature). Cancers 2022, 14. [Google Scholar] [CrossRef]
- Karamanos, N.K.; Piperigkou, Z.; Passi, A.; Götte, M.; Rousselle, P.; Vlodavsky, I. Extracellular matrix-based cancer targeting. Trends in Molecular Medicine 2021, 27, 1000–1013. [Google Scholar] [CrossRef]
- Theocharis, A.D.; Skandalis, S.S.; Gialeli, C.; Karamanos, N.K. Extracellular matrix structure. Advanced Drug Delivery Reviews 2016, 97, 4–27. [Google Scholar] [CrossRef]
- Pickup, M.W.; Mouw, J.K.; Weaver, V.M. The extracellular matrix modulates the hallmarks of cancer. EMBO reports 2014, 15, 1243–1253. [Google Scholar] [CrossRef]
- Lu, P.; Weaver, V.M.; Werb, Z. The extracellular matrix: A dynamic niche in cancer progression. Journal of Cell Biology 2012, 196, 395–406. [Google Scholar] [CrossRef]
- Schaefer, L.; Schaefer, R.M. Proteoglycans: from structural compounds to signaling molecules. Cell and Tissue Research 2010, 339, 237–246. [Google Scholar] [CrossRef]
- Wei, J.; Hu, M.; Huang, K.; Lin, S.; Du, H. Molecular Sciences Roles of Proteoglycans and Glycosaminoglycans in Cancer Development and Progression. International Journal of Molecular Sciences 2020, 21, 59–83. [Google Scholar] [CrossRef]
- Espinoza-Sánchez, N.A.; Götte, M. Role of cell surface proteoglycans in cancer immunotherapy. Seminars in Cancer Biology 2020, 62, 48–67. [Google Scholar] [CrossRef] [PubMed]
- Mouw, J.K.; Ou, G.; Weaver, V.M. Extracellular matrix assembly: a multiscale deconstruction. Nature Reviews Molecular Cell Biology 2014, 15, 771–785. [Google Scholar] [CrossRef] [PubMed]
- Bernfield, M.; Götte, M.; Park, P.W.; Reizes, O.; Fitzgerald, M.L.; Lincecum, J.; Zako, M. Functions of Cell Surface Heparan Sulfate Proteoglycans. Annual Review of Biochemistry 1999, 68, 729–777. [Google Scholar] [CrossRef] [PubMed]
- Hassan, N.; Greve, B.; Espinoza-Sánchez, N.A.; Götte, M. Cell-surface heparan sulfate proteoglycans as multifunctional integrators of signaling in cancer. Cellular Signalling 2021, 77, 1–21. [Google Scholar] [CrossRef]
- Piperigkou, Z.; Mohr, B.; Karamanos, N.; Götte, M. Shed proteoglycans in tumor stroma. Cell and Tissue Research 2016, 365, 643–655. [Google Scholar] [CrossRef]
- Motta, J.M.; Hassan, H.; Ibrahim, S.A. Revisiting the Syndecans: Master Signaling Regulators with Prognostic and Targetable Therapeutic Values in Breast Carcinoma. Cancers 2023, 15. [Google Scholar] [CrossRef]
- Hillemeyer, L.; Espinoza-Sanchez, N.A.; Greve, B.; Hassan, N.; Chelariu-Raicu, A.; Kiesel, L.; Götte, M. The Cell Surface Heparan Sulfate Proteoglycan Syndecan-3 Promotes Ovarian Cancer Pathogenesis. International Journal of Molecular Sciences 2022, 23. [Google Scholar] [CrossRef]
- Yao, J.; Zhang, L.L.; Huang, X.M.; Li, W.Y.; Gao, S.G. Pleiotrophin and N-syndecan promote perineural invasion and tumor progression in an orthotopic mouse model of pancreatic cancer. World Journal of Gastroenterology 2017, 23, 3907–3914. [Google Scholar] [CrossRef]
- Yamada, Y.; Arai, T.; Kojima, S.; Sugawara, S.; Kato, M.; Okato, A.; … Seki, N. Regulation of antitumor miR-144-5p targets oncogenes: Direct regulation of syndecan-3 and its clinical significance. Cancer Science 2018, 109, 2919–2936. [Google Scholar] [CrossRef]
- Digre, A.; Lindskog, C. The Human Protein Atlas—Spatial localization of the human proteome in health and disease. Protein Science 2021, 30, 218–233. [Google Scholar] [CrossRef]
- Bartha, Á.; Győrffy, B. TNMplot.com: A Web Tool for the Comparison of Gene Expression in Normal, Tumor and Metastatic Tissues. International Journal of Molecular Sciences 2021, 22, 1–22. [Google Scholar] [CrossRef] [PubMed]
- Győrffy, B. Survival analysis across the entire transcriptome identifies biomarkers with the highest prognostic power in breast cancer. Computational and Structural Biotechnology Journal 2021, 19, 4101–4109. [Google Scholar] [CrossRef] [PubMed]
- Stejskalová, A.; Fincke, V.; Nowak, M.; Schmidt, Y.; Borrmann, K.; von Wahlde, M.-K.; … Götte, M. Collagen I triggers directional migration, invasion and matrix remodeling of stroma cells in a 3D spheroid model of endometriosis. Scientific Reports 2021, 11, 4115. [Google Scholar] [CrossRef] [PubMed]
- Rao, X.; Huang, X.; Zhou, Z.; Lin, X. An improvement of the 2ˆ(-delta delta CT) method for quantitative real-time polymerase chain reaction data analysis. Biostat Bioinforma Biomath 2013, (3), 71–85. [Google Scholar]
- Szklarczyk, D.; Kirsch, R.; Koutrouli, M.; Nastou, K.; Mehryary, F.; Hachilif, R.; … von Mering, C. The STRING database in 2023: protein–protein association networks and functional enrichment analyses for any sequenced genome of interest. Nucleic Acids Research 2023, 51, 638–646. [Google Scholar] [CrossRef]
- Dai, X.; Cheng, H.; Bai, Z.; Li, J. Breast Cancer Cell Line Classification and Its Relevance with Breast Tumor Subtyping. Journal of Cancer 2017, 8, 3131–3141. [Google Scholar] [CrossRef]
- Holliday, D.L.; Speirs, V. Choosing the right cell line for breast cancer research. Breast Cancer Research 2011, 13. [Google Scholar] [CrossRef]
- Banerjee, M.; Bhonde, R.R. Application of hanging drop technique for stem cell differentiation and cytotoxicity studies. Cytotechnology 2006, 51, 1–5. [Google Scholar] [CrossRef]
- Kurosawa, H. Methods for inducing embryoid body formation: in vitro differentiation system of embryonic stem cells. Journal of Bioscience and Bioengineering 2007, 103, 389–398. [Google Scholar] [CrossRef]
- Vitale, D.; Kumar Katakam, S.; Greve, B.; Jang, B.; Oh, E.; Alaniz, L.; Götte, M. Proteoglycans and glycosaminoglycans as regulators of cancer stem cell function and therapeutic resistance. The FEBS Journal 2019, 286, 2870–2882. [Google Scholar] [CrossRef]
- Kuehn, J.; Espinoza-Sanchez, N.A.; Teixeira, F.C.O.B.; Pavão, M.S.G.; Kiesel, L.; Győrffy, B. , … Götte, M. Prognostic significance of hedgehog signaling network-related gene expression in breast cancer patients. Journal of Cellular Biochemistry 2021, 122, 577–597. [Google Scholar] [CrossRef] [PubMed]
- Corti, F.; Ristori, E.; Rivera-Molina, F.; Toomre, D.; Zhang, J.; Mihailovic, J.; … Simons, M. Syndecan-2 selectively regulates VEGF-induced vascular permeability. Nature Cardiovascular Research 2022, 1, 518–528. [Google Scholar] [CrossRef] [PubMed]
- Jang, B.; Kim, A.; Hwang, J.; Song, H.-K.; Kim, Y.; Oh, E.-S. Emerging Role of Syndecans in Extracellular Matrix Remodeling in Cancer. Journal of Histochemistry & Cytochemistry 2020, 68, 863–870. [Google Scholar] [CrossRef]
- Gopal, S. Syndecans in Inflammation at a Glance. Frontiers in Immunology 2020, 11. [Google Scholar] [CrossRef]
- Huang, X.; Reye, G.; Momot, K.I.; Blick, T.; Lloyd, T.; Tilley, W.D. , … Hugo, H.J. Heparanase Promotes Syndecan-1 Expression to Mediate Fibrillar Collagen and Mammographic Density in Human Breast Tissue Cultured ex vivo. Frontiers in Cell and Developmental Biology 2020, 8. [CrossRef]
- Hassan, N.; Bückreiß, N.; Efing, J.; Schulz-Fincke, M.; König, P.; Greve, B.; … Götte, M. The Heparan Sulfate Proteoglycan Syndecan-1 Triggers Breast Cancer Cell-Induced Coagulability by Induced Expression of Tissue Factor. Cells 2023, 12, 910. [Google Scholar] [CrossRef]
- Tinholt, M.; Stavik, B.; Louch, W.; Carlson, C.R.; Sletten, M.; Ruf, W. , … Iversen, N. Syndecan-3 and TFPI Colocalize on the Surface of Endothelial-, Smooth Muscle-, and Cancer Cells. PLOS ONE 2015, 10. [CrossRef]
- Czarnowski, D. Syndecans in cancer: A review of function, expression, prognostic value, and therapeutic significance. Cancer Treatment and Research Communications 2021, 27. [Google Scholar] [CrossRef]
- Prieto-Fernández, E.; Egia-Mendikute, L.; Bosch, A.; García del Río, A.; Jimenez-Lasheras, B.; Antoñana-Vildosola, A.; … Palazon, A. Hypoxia Promotes Syndecan-3 Expression in the Tumor Microenvironment. Frontiers in Immunology 2020, 11. [Google Scholar] [CrossRef]
- Lee, S.Y.; Prieto-Fernández, E.; Egia-Mendikute, L.; Antoñana-Vildosola, A.; Velasco-Beltrán, P.; Bosch, A. , … Pérez-Gutiérrez, L. Syndecan-3 positively regulates the pro-inflammatory function of macrophages. Cellular and Molecular Life Sciences 2025, 82, 145. [Google Scholar] [CrossRef]
- Wu, Z.-S.; Pandey, V.; Wu, W.-Y.; Ye, S.; Zhu, T.; Lobie, P.E. Prognostic significance of the expression of GFRα1, GFRα3 and Syndecan-3, proteins binding ARTEMIN, in mammary carcinoma. BMC Cancer 2013, 13. [Google Scholar] [CrossRef]
- Jiang, F.; Wu, C.; Wang, M.; Wei, K.; Wang, J. Identification of novel cell glycolysis related gene signature predicting survival in patients with breast cancer. Scientific Reports 2021, 11. [Google Scholar] [CrossRef]
- Watanabe, H.; Fukuda, A.; Ikeda, N.; Sato, M.; Hashimoto, K.; Miyamoto, Y. Syndecan-3 regulates the time of transition from cell cycle exit to initial differentiation stage in mouse cerebellar granule cell precursors. Brain Research 2023, 1807, 148317. [Google Scholar] [CrossRef] [PubMed]
- Pisconti, A.; Cornelison, D.D. W.; Olguín, H.C.; Antwine, T.L.; Olwin, B.B. Syndecan-3 and Notch cooperate in regulating adult myogenesis. Journal of Cell Biology 2010, 190, 427–441. [Google Scholar] [CrossRef]
- Ordaz-Ramos, A., Tellez-Jimenez, O., & Vazquez-Santillan, K. (2023). Signaling pathways governing the maintenance of breast cancer stem cells and their therapeutic implications. [CrossRef]
- 46. Katakam, S.K.; Pelucchi, P.; Cocola, C.; Reinbold, R.; Vlodavsky, I.; Greve, B.; Götte, M. Syndecan-1-Dependent Regulation of Heparanase Affects Invasiveness, Stem Cell Properties, and Therapeutic Resistance of Caco2 Colon Cancer Cells. Frontiers in Oncology 2020, 10. [Google Scholar] [CrossRef] [PubMed]
- Valla, S.; Hassan, N.; Vitale, D.L.; Madanes, D.; Spinelli, F.M.; Teixeira, F.C.O.B. , … Götte, M. Syndecan-1 depletion has a differential impact on hyaluronic acid metabolism and tumor cell behavior in luminal and triple-negative breast cancer cells. International Journal of Molecular Sciences 2021, 22. [Google Scholar] [CrossRef]
- Teixeira, F.C.O. B.; Vijaya Kumar, A.; Kumar Katakam, S.; Cocola, C.; Pelucchi, P.; Graf, M., … Götte, M. The Heparan Sulfate Sulfotransferases HS2ST1 and HS3ST2 Are Novel Regulators of Breast Cancer Stem-Cell Properties. Frontiers in Cell and Developmental Biology 2020, 8. [CrossRef]
- Jones, F.K.; Stefan, A.; Kay, A.G.; Hyland, M.; Morgan, R.; Forsyth, N.R. , … Kehoe, O. Syndecan-3 regulates MSC adhesion, ERK and AKT signalling in vitro and its deletion enhances MSC efficacy in a model of inflammatory arthritis in vivo. Scientific Reports 2020, 10. [Google Scholar] [CrossRef]
- Inatani, M.; Haruta, M.; Honjo, M.; Oohira, A.; Kido, N.; Takahashi, M.; … Tanihara, H. Upregulated expression of N-syndecan, a transmembrane heparan sulfate proteoglycan, in differentiated neural stem cells. Brain Research 2001, 920(1–2), 217–221. [CrossRef]
- Edwards, A.; Brennan, K. Notch Signalling in Breast Development and Cancer. Frontiers in Cell and Developmental Biology 2021, 9, 1–24. [Google Scholar] [CrossRef]
- Depau, L.; Brunetti, J.; Falciani, C.; Mandarini, E.; Zanchi, M.; Paolocci, M.F., … Bracci, L. Targeting heparan sulfate proteoglycans as an effective strategy for inhibiting cancer cell migration and invasiveness compared to heparin. Frontiers in Cell and Developmental Biology 2025, 12. [CrossRef]
- Hienola, A.; Tumova, S.; Kulesskiy, E.; Rauvala, H. N-syndecan deficiency impairs neural migration in brain. The Journal of Cell Biology 2006, 174, 569–580. [Google Scholar] [CrossRef]
- Bespalov, M.M.; Sidorova, Y.A.; Tumova, S.; Ahonen-Bishopp, A.; Magalhães, A.C.; Kulesskiy, E. , … Saarma, M. Heparan sulfate proteoglycan syndecan-3 is a novel receptor for GDNF, neurturin, and artemin. Journal of Cell Biology 2011, 192, 153–169. [Google Scholar] [CrossRef]
- Eustace, A.D.; McNaughton, E.F.; King, S.; Kehoe, O.; Kungl, A.; Mattey, D., … Middleton, J. Soluble syndecan-3 binds chemokines, reduces leukocyte migration in vitro and ameliorates disease severity in models of rheumatoid arthritis. Arthritis Research & Therapy 2019, 21. [CrossRef]
- Eustace, A.D.; McNaughton, E.F.; King, S.; Kehoe, O.; Kungl, A.; Mattey, D., … Middleton, J. Soluble syndecan-3 binds chemokines, reduces leukocyte migration in vitro and ameliorates disease severity in models of rheumatoid arthritis. Arthritis Research and Therapy 2019, 21. [CrossRef]
- Felipe Lima, J.; Nofech-Mozes, S.; Bayani, J.; Bartlett, J. EMT in Breast Carcinoma - A Review. Journal of Clinical Medicine 2016, 5, 1–14. [Google Scholar] [CrossRef]
- Kessenbrock, K.; Plaks, V.; Werb, Z. Matrix Metalloproteinases: Regulators of the Tumor Microenvironment. Cell 2010, 141, 52–67. [Google Scholar] [CrossRef] [PubMed]
- Dufour, A.; Sampson, N.S.; Zucker, S.; Cao, J. Role of the hemopexin domain of matrix metalloproteinases in cell migration. Journal of Cellular Physiology 2008, 217, 643–651. [Google Scholar] [CrossRef] [PubMed]
- Asundi, V.K.; Erdman, R.; Stahl, R.C.; Carey, D.J. Matrix metalloproteinase-dependent shedding of syndecan-3, a transmembrane heparan sulfate proteoglycan, in Schwann cells. Journal of Neuroscience Research 2003, 73, 593–602. [Google Scholar] [CrossRef] [PubMed]
- Arokiasamy, S.; Balderstone, M.J. M.; De Rossi, G.; Whiteford, J.R. Syndecan-3 in Inflammation and Angiogenesis. Frontiers in Immunology 2020, 10. [Google Scholar] [CrossRef]
- Bertrand, J.; Bollmann, M. Soluble syndecans: biomarkers for diseases and therapeutic options. British Journal of Pharmacology 2019, 176, 67–81. [Google Scholar] [CrossRef]
- Onyeisi, J.O. S.; El-Shorafa, H.M.; Greve, B.; Götte, M. Role of syndecan-4 in angiogenesis and vasculogenic mimicry in triple negative breast cancer cells. Matrix Biology 2025, 136, 127–133. [Google Scholar] [CrossRef]
- Nassar, E.; Hassan, N.; El-Ghonaimy, E.A.; Hassan, H.; Abdullah, M.S.; Rottke, T.V. , … Götte, M. Syndecan-1 Promotes Angiogenesis in Triple-Negative Breast Cancer through the Prognostically Relevant Tissue Factor Pathway and Additional Angiogenic Routes. Cancers 2021, 13. [Google Scholar] [CrossRef]
- De Rossi, G.; Whiteford, J.R. A novel role for syndecan-3 in angiogenesis. F1000Research 2013, 2. [Google Scholar] [CrossRef]
- Jannaway, M.; Yang, X.; Meegan, J.E.; Coleman, D.C.; Yuan, S.Y. Thrombin-cleaved syndecan-3/-4 ectodomain fragments mediate endothelial barrier dysfunction. PLOS ONE 2019, 14. [Google Scholar] [CrossRef]
- Liang, H.; Xiao, J.; Zhou, Z.; Wu, J.; Ge, F.; Li, Z.; … Chen, C. Hypoxia induces miR-153 through the IRE1α-XBP1 pathway to fine tune the HIF1α/VEGFA axis in breast cancer angiogenesis. Oncogene 2018, 37, 1961–1975. [Google Scholar] [CrossRef]
- Kinnunen, T.; Kaksonen, M.; Saarinen, J.; Kalkkinen, N.; Peng, H.B.; Rauvala, H. Cortactin-Src Kinase Signaling Pathway Is Involved in N-syndecan-dependent Neurite Outgrowth. Journal of Biological Chemistry 1998, 273, 10702–10708. [Google Scholar] [CrossRef] [PubMed]
- Luo, J.; Zou, H.; Guo, Y.; Tong, T.; Ye, L.; Zhu, C.; … Li, P. SRC kinase-mediated signaling pathways and targeted therapies in breast cancer. Breast Cancer Research 2022, 24. [Google Scholar] [CrossRef] [PubMed]
- Jiang, B.-H.; Agani, F.; Passaniti, A.; Semenza, G.L. V-SRC Induces Expression of Hypoxia-inducible Factor 1 (HIF-1) and Transcription of Genes Encoding Vascular Endothelial Growth Factor and Enolase 1: Involvement of HIF-1 in Tumor Progression. Cancer Research 1997, 23, 5328–5335. [Google Scholar]
- Johnson, D.; Agochiya, M.; Samejima, K.; Earnshaw, W.; Frame, M.; Wyke, J. Regulation of both apoptosis and cell survival by the v-Src oncoprotein. Cell Death & Differentiation 2000, 7, 685–696. [Google Scholar] [CrossRef]
- Zhang, S.; Yu, D. Targeting Src family kinases in anti-cancer therapies: turning promise into triumph. Trends in Pharmacological Sciences 2012, 33, 122–128. [Google Scholar] [CrossRef]
- Hanna, S.C.; Krishnan, B.; Bailey, S.T.; Moschos, S.J.; Kuan, P.-F.; Shimamura, T. , … Kim, W.Y. HIF1α and HIF2α independently activate SRC to promote melanoma metastases. Journal of Clinical Investigation 2013, 123, 2078–2093. [Google Scholar] [CrossRef]
Figure 1.
(A) Pan-cancer analysis of SDC3 expression across human malignancies. RNA-sequencing data from The Cancer Genome Atlas (TCGA) reveals median SDC3 expression levels across 31 cancer types, normalized as fragments per kilobase of exon per million mapped reads (FPKM). Cancers are color-coded by tissue of origin (e.g., breast = pink; lung = dark green). (B) SDC3 expression in breast cancer histological subtypes. Immunohistochemical staining of SDC3 in human breast tumor specimens presents as membraneous and cytoplasmic staining that is primarily found in tumor cells, and less pronounced in the stroma.
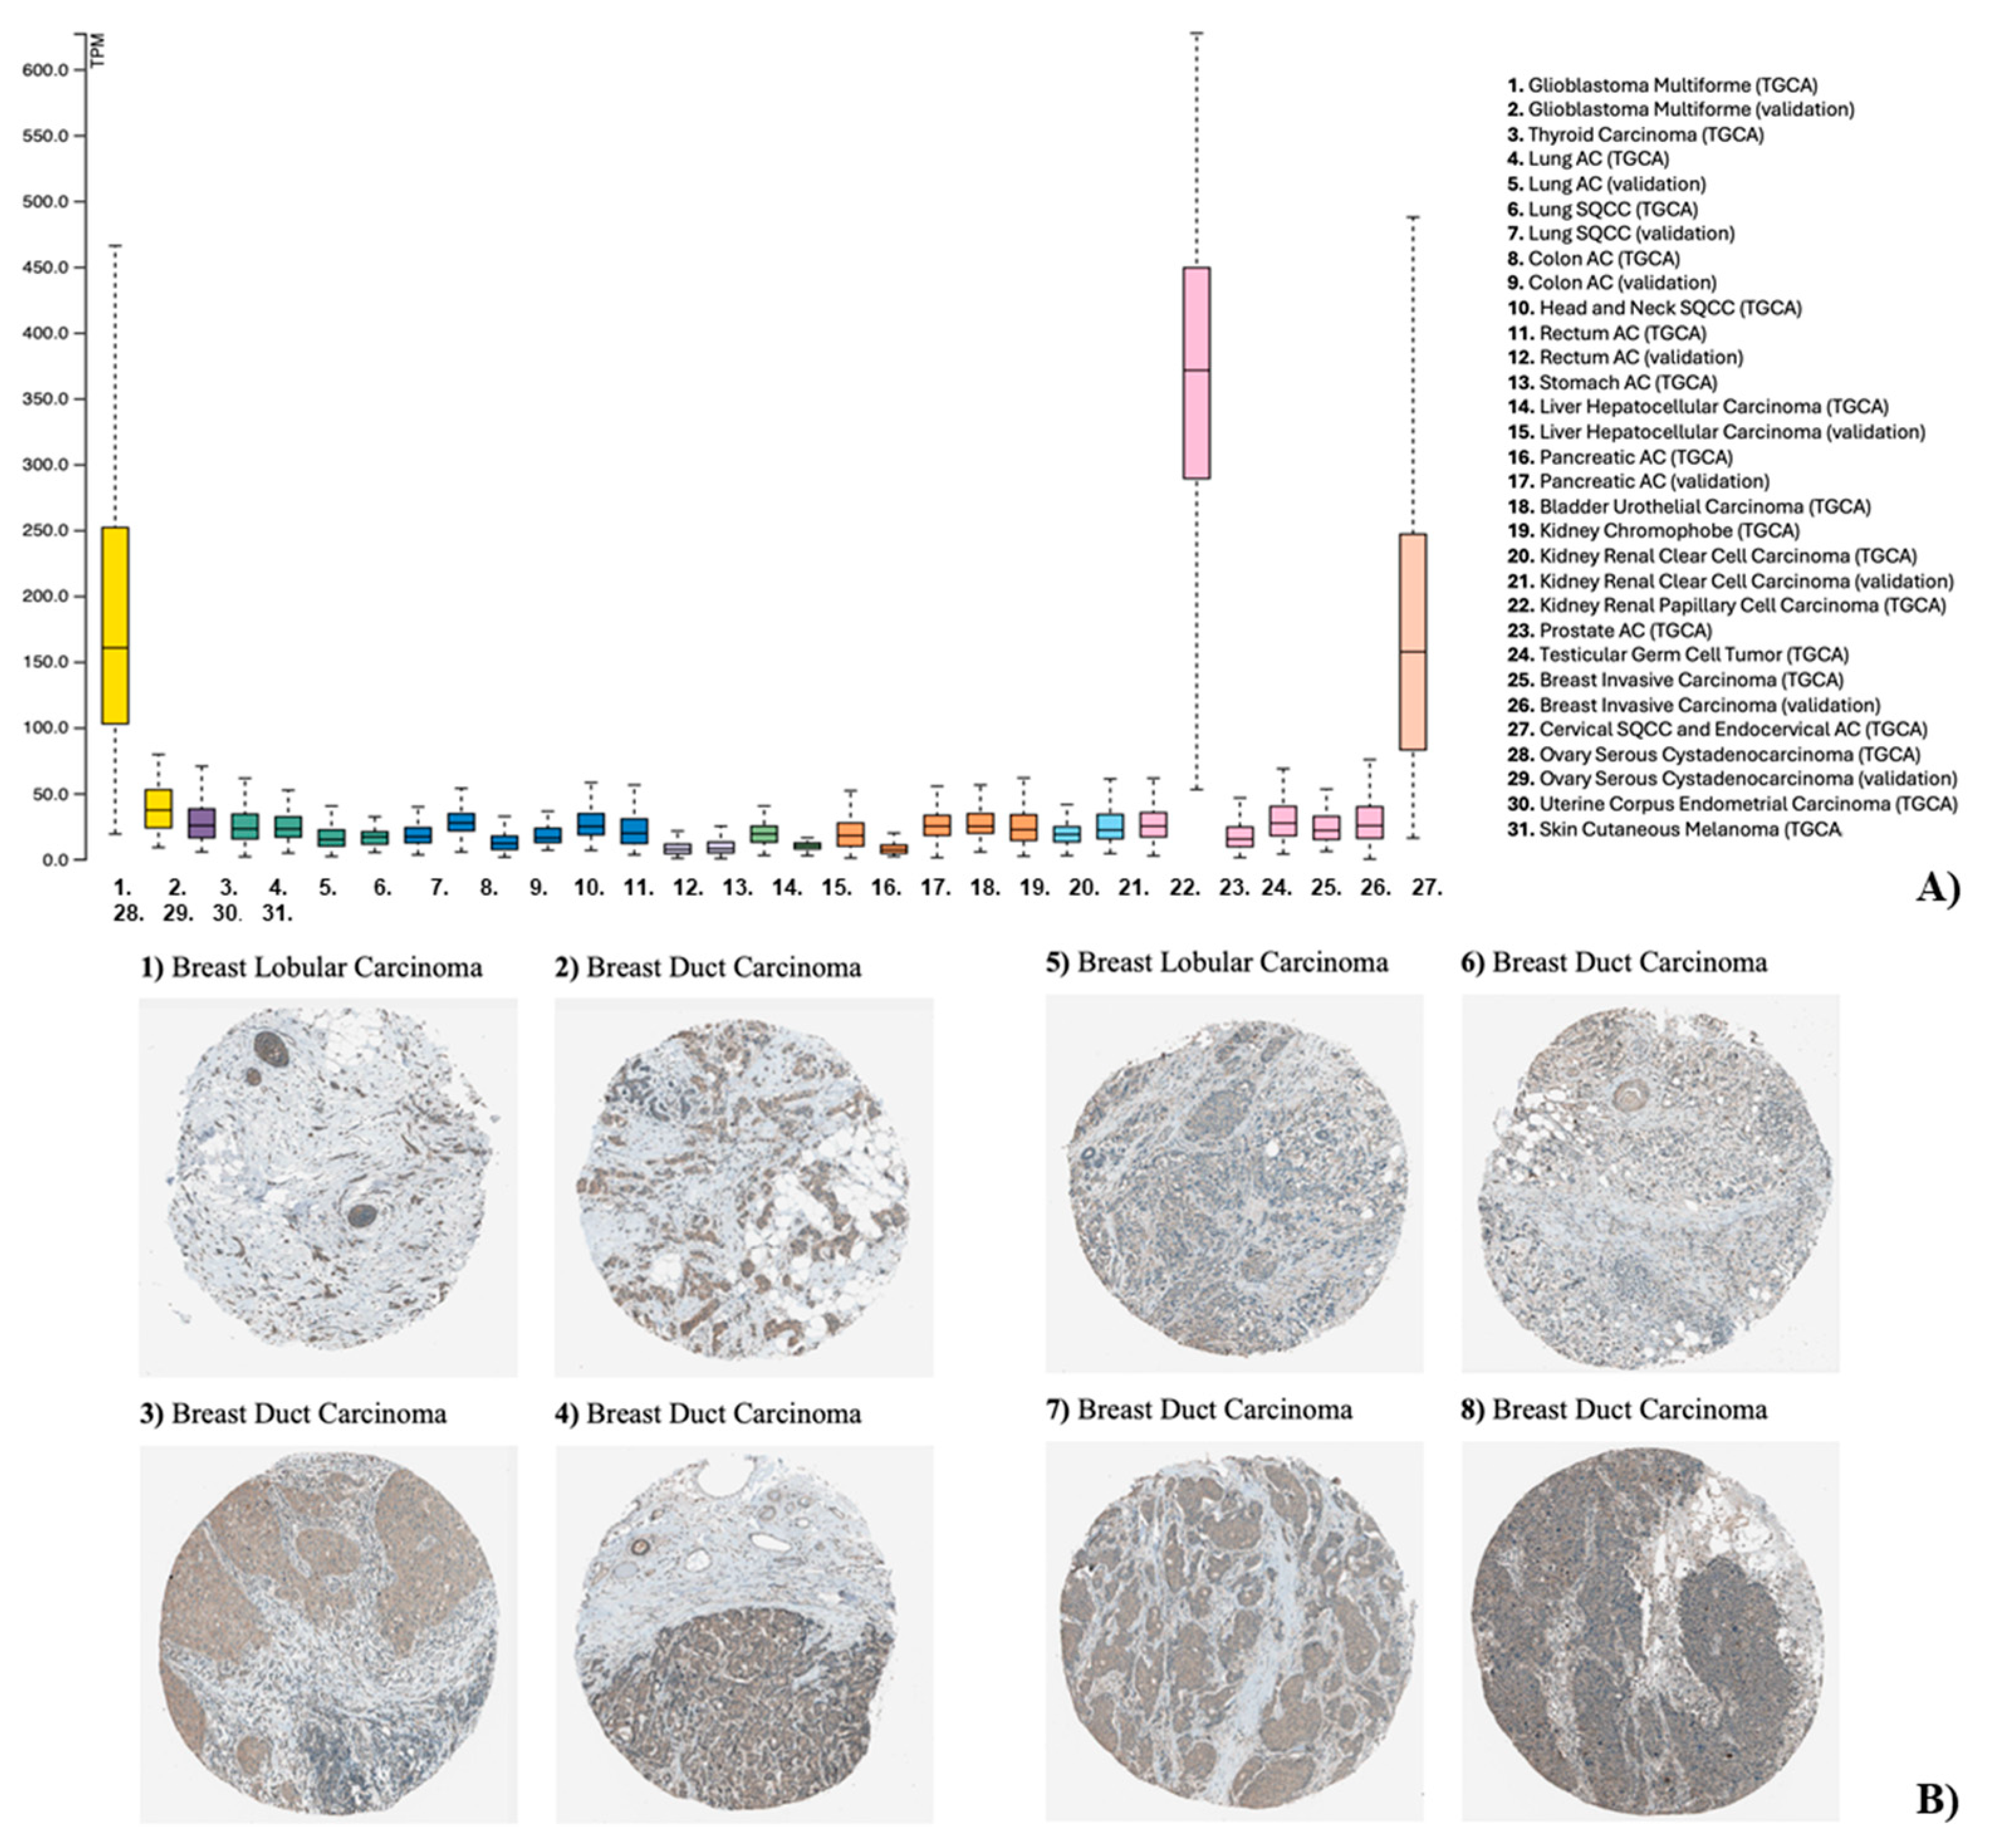
Figure 3.
(A) SDC3 is expressed differentially in several breast cancer cell lines and alters their metabolic activity and cell cycle. Relative gene expression of SDC3 was quantified by qRT-PCR in 10 different breast cancer cell lines, representative of the luminal A (MCF-7), luminal B (BT474), HER2-positive (SKBR3, MDA-MB 453), triple-negative A (MDA-MB 468, HCC1806, BT20), and triple-negative B (MDA-MB-231, BT549, SUM149) subtype. (B) SDC3 is downregulated in MDA-MB-231, and MCF-7 cells following SDC3 siRNA- and siPool-transfection. SDC3 knockdown was confirmed by qRT-PCR. (C) SDC3 depletion affects the metabolic activity of MDA-MB-231 and MCF7 breast cancer cells. Breast cancer cells were subjected to the metabolic MTT assay following transfections with the siRNA and siPool. (D) SDC3-knockdown promotes cell cycle progression in MDA-MB-231 cells. Cell cycle phase composition was measured employing DAPI staining and flow cytometry after SDC3 depletion. p ≤ 0.05 (*), p ≤ 0.01 (**), p ≤ 0.001 (***). The graphs presented depict mean values, with error bars indicating the standard error of the mean (SEM).
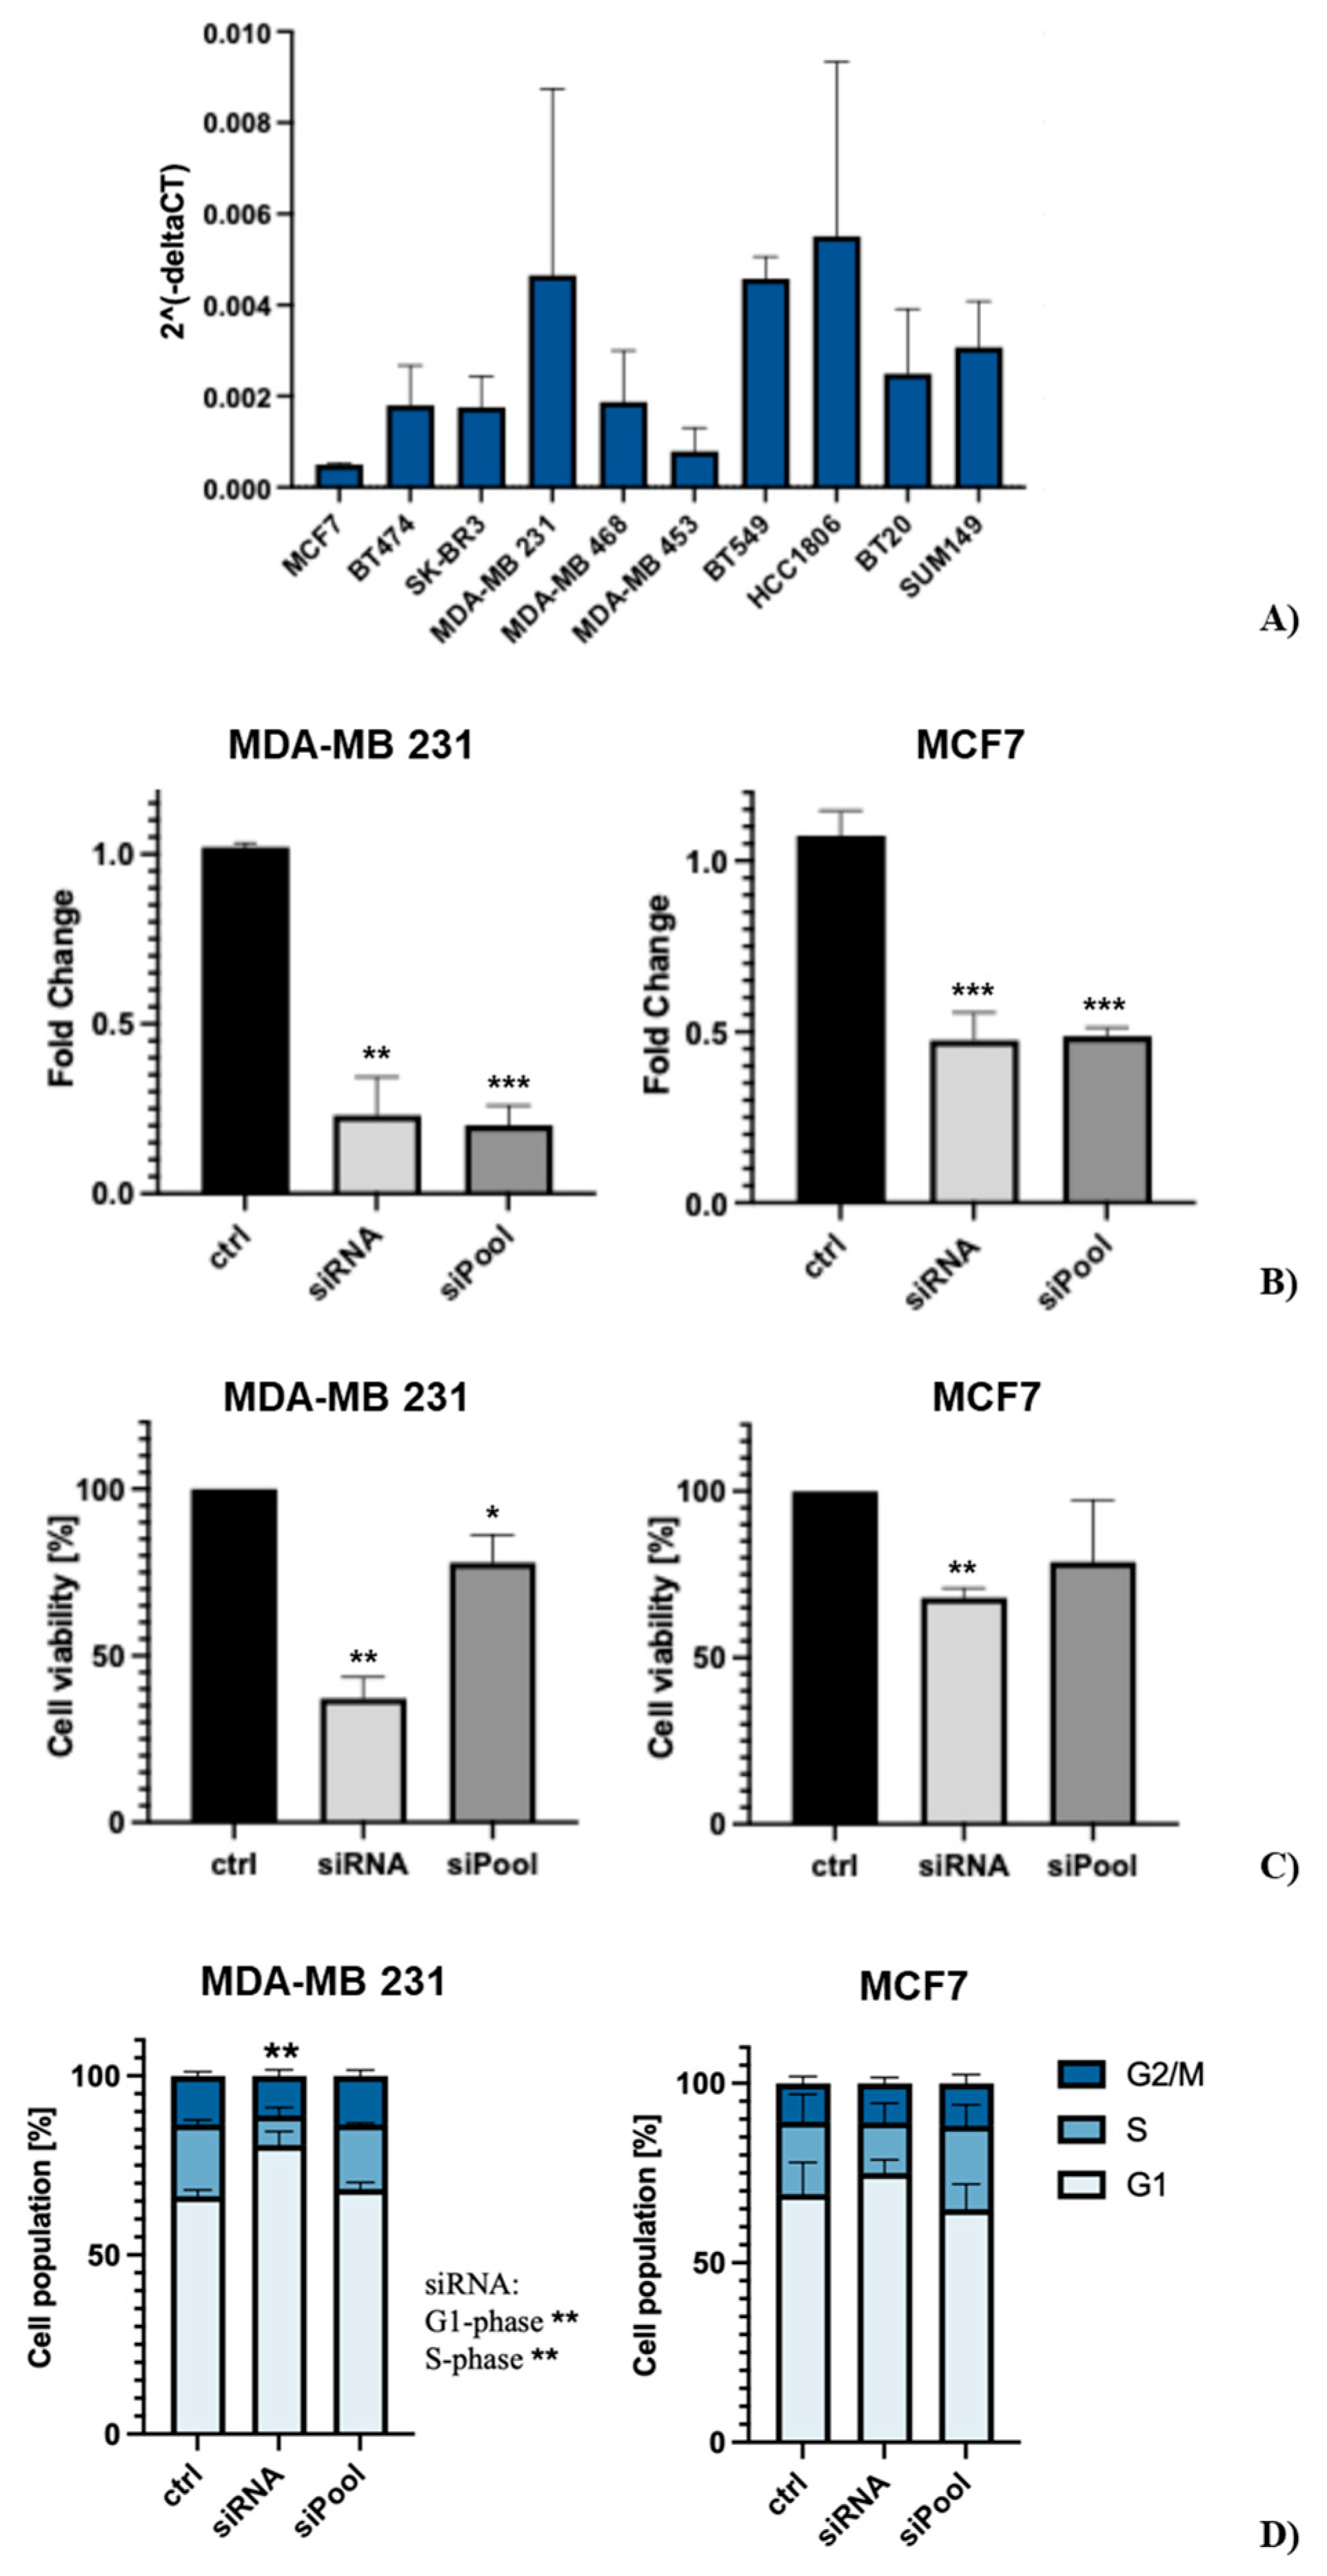
Figure 4.
SDC3 depletion affects the growth of 3D spheroids in MDA-MB 231 and MCF-7 cells. Representative pictures of the hanging drop cultures are presented in the left panels and quantitative analysis in the right panels. (A) MDA-MB-231 cells were transfected with the negative control, SDC3 siRNA, and SDC3 siPool and subjected to the hanging drop assay. (B) MCF7 cells were transfected with the negative control, SDC3 siRNA, and SDC3 siPool and subjected to the hanging drop assay. p ≤ 0.05 (*), p ≤ 0.01 (**), p ≤ 0.001 (***). The graphs presented depict mean values, with error bars indicating the standard error of the mean (SEM).
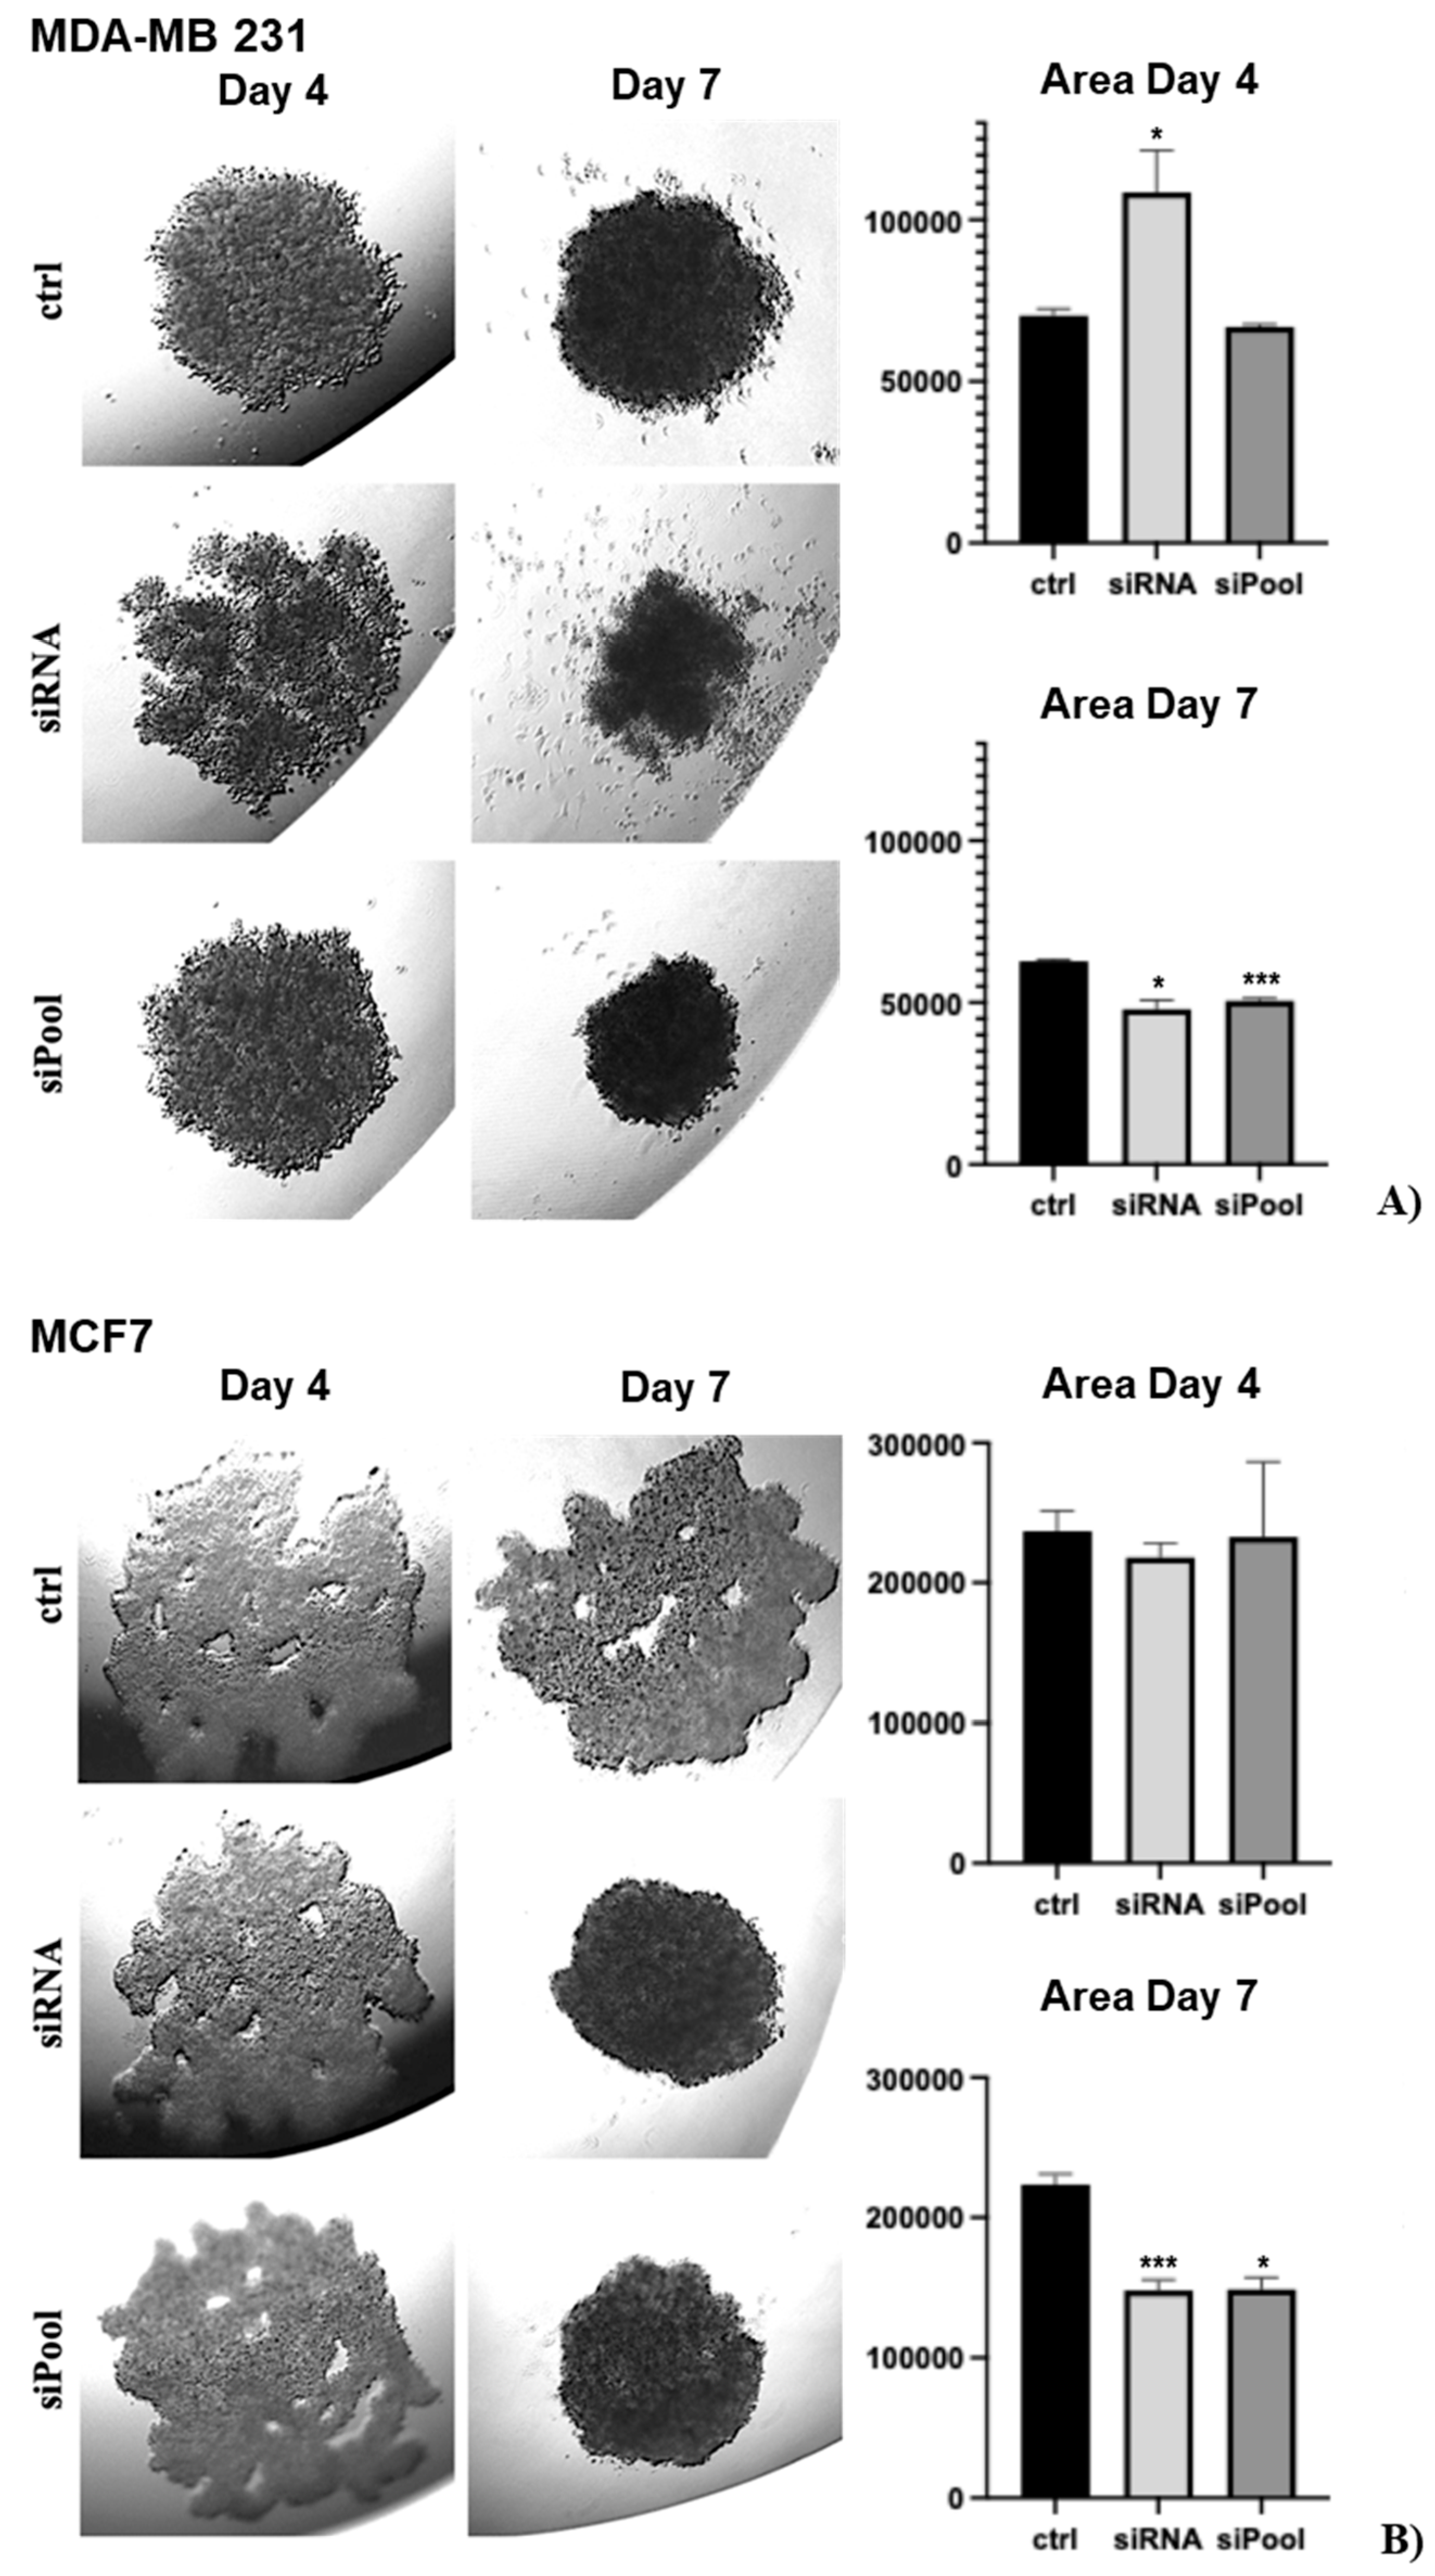
Figure 5.
(A) The migration of MDA-MB-231 cells was significantly decreased following SDC3 knockdown with the siRNA, in comparison to the negative control. MCF-7 cells displayed little changes in migratory behavior upon SDC3 depletion. (B, C) SDC3 regulates the expression of different potential effector genes. SDC3 depletion was achieved by siRNA- and siPool-mediated knockdown of SDC3 in MDA-MB-231 (B), and MCF-7 (C) cells. The expression of target genes associated with notch-signaling (HES1), hedgehog-signaling (Gli2), epithelial-to-mesenchymal-transition signaling (Twist, CDH1), matrix-metalloproteinase signaling (MMP1, MMP2, MMP9), and vascular endothelial growth factor signaling (VEGF-A), was visibly altered (D) The effect of SDC3 depletion on the potential activation of Src proto-oncogene tyrosine-protein kinase (pSRC), as well as expression of its total form (SRC) was examined using western blot analysis. p ≤ 0.05 (*), p ≤ 0.01 (**), p ≤ 0.001 (***). The graphs presented depict mean values, with error bars indicating the standard error of the mean (SEM).
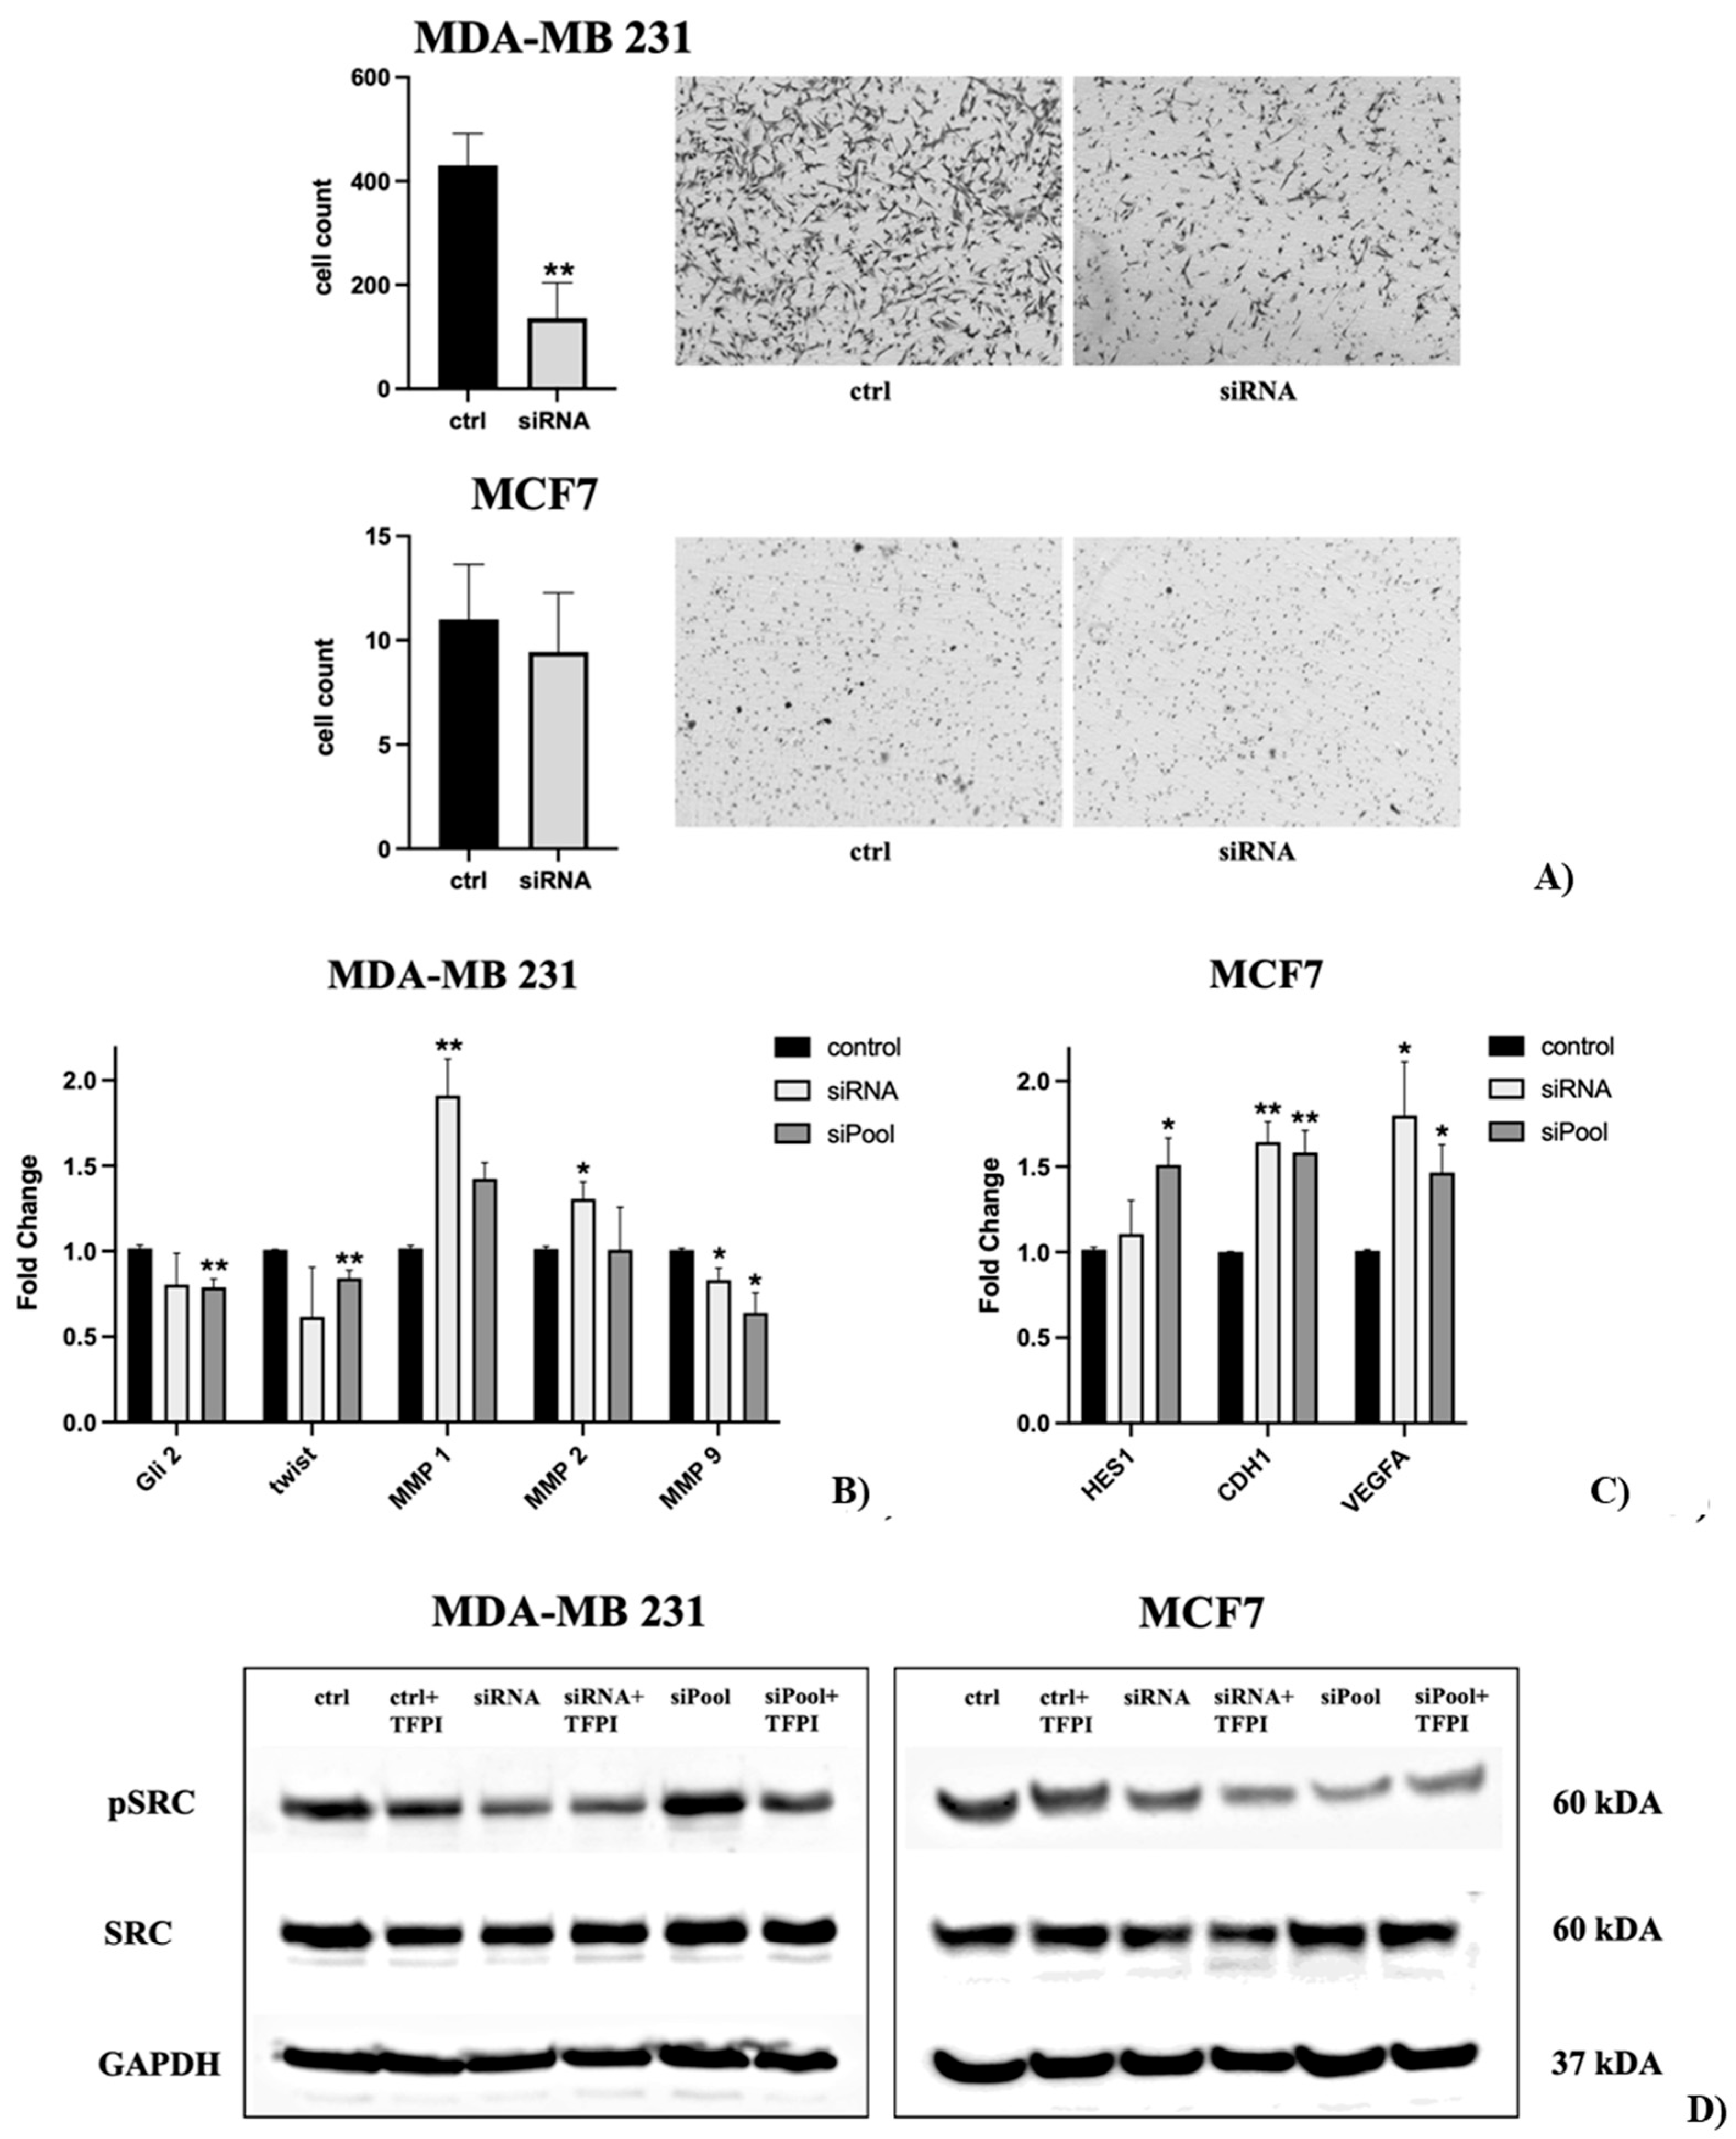
Figure 6.
Functional interaction analysis of SDC3 using STRING database. (A) STRING database output revealed direct connections between SDC3, SRC, FGF2, and MMP7. Further indirect associations were established between SDC3 and FLT1, KDR, VEGFB, VEGFC, CDH1, MMP1, MMP2, MMP9, and MMP14, as well TIMP2 and TIMP4. (B) In the gene ontology (GO) analysis, the ten most significantly enriched GO terms were included in the biological process (blue), molecular function (green), and cellular component (orange) categories. X-axis: -log10 (false discovery value) (C) KEGG-pathway analysis depicts several interconnections between SDC3 and relevant signaling pathways in cancer.
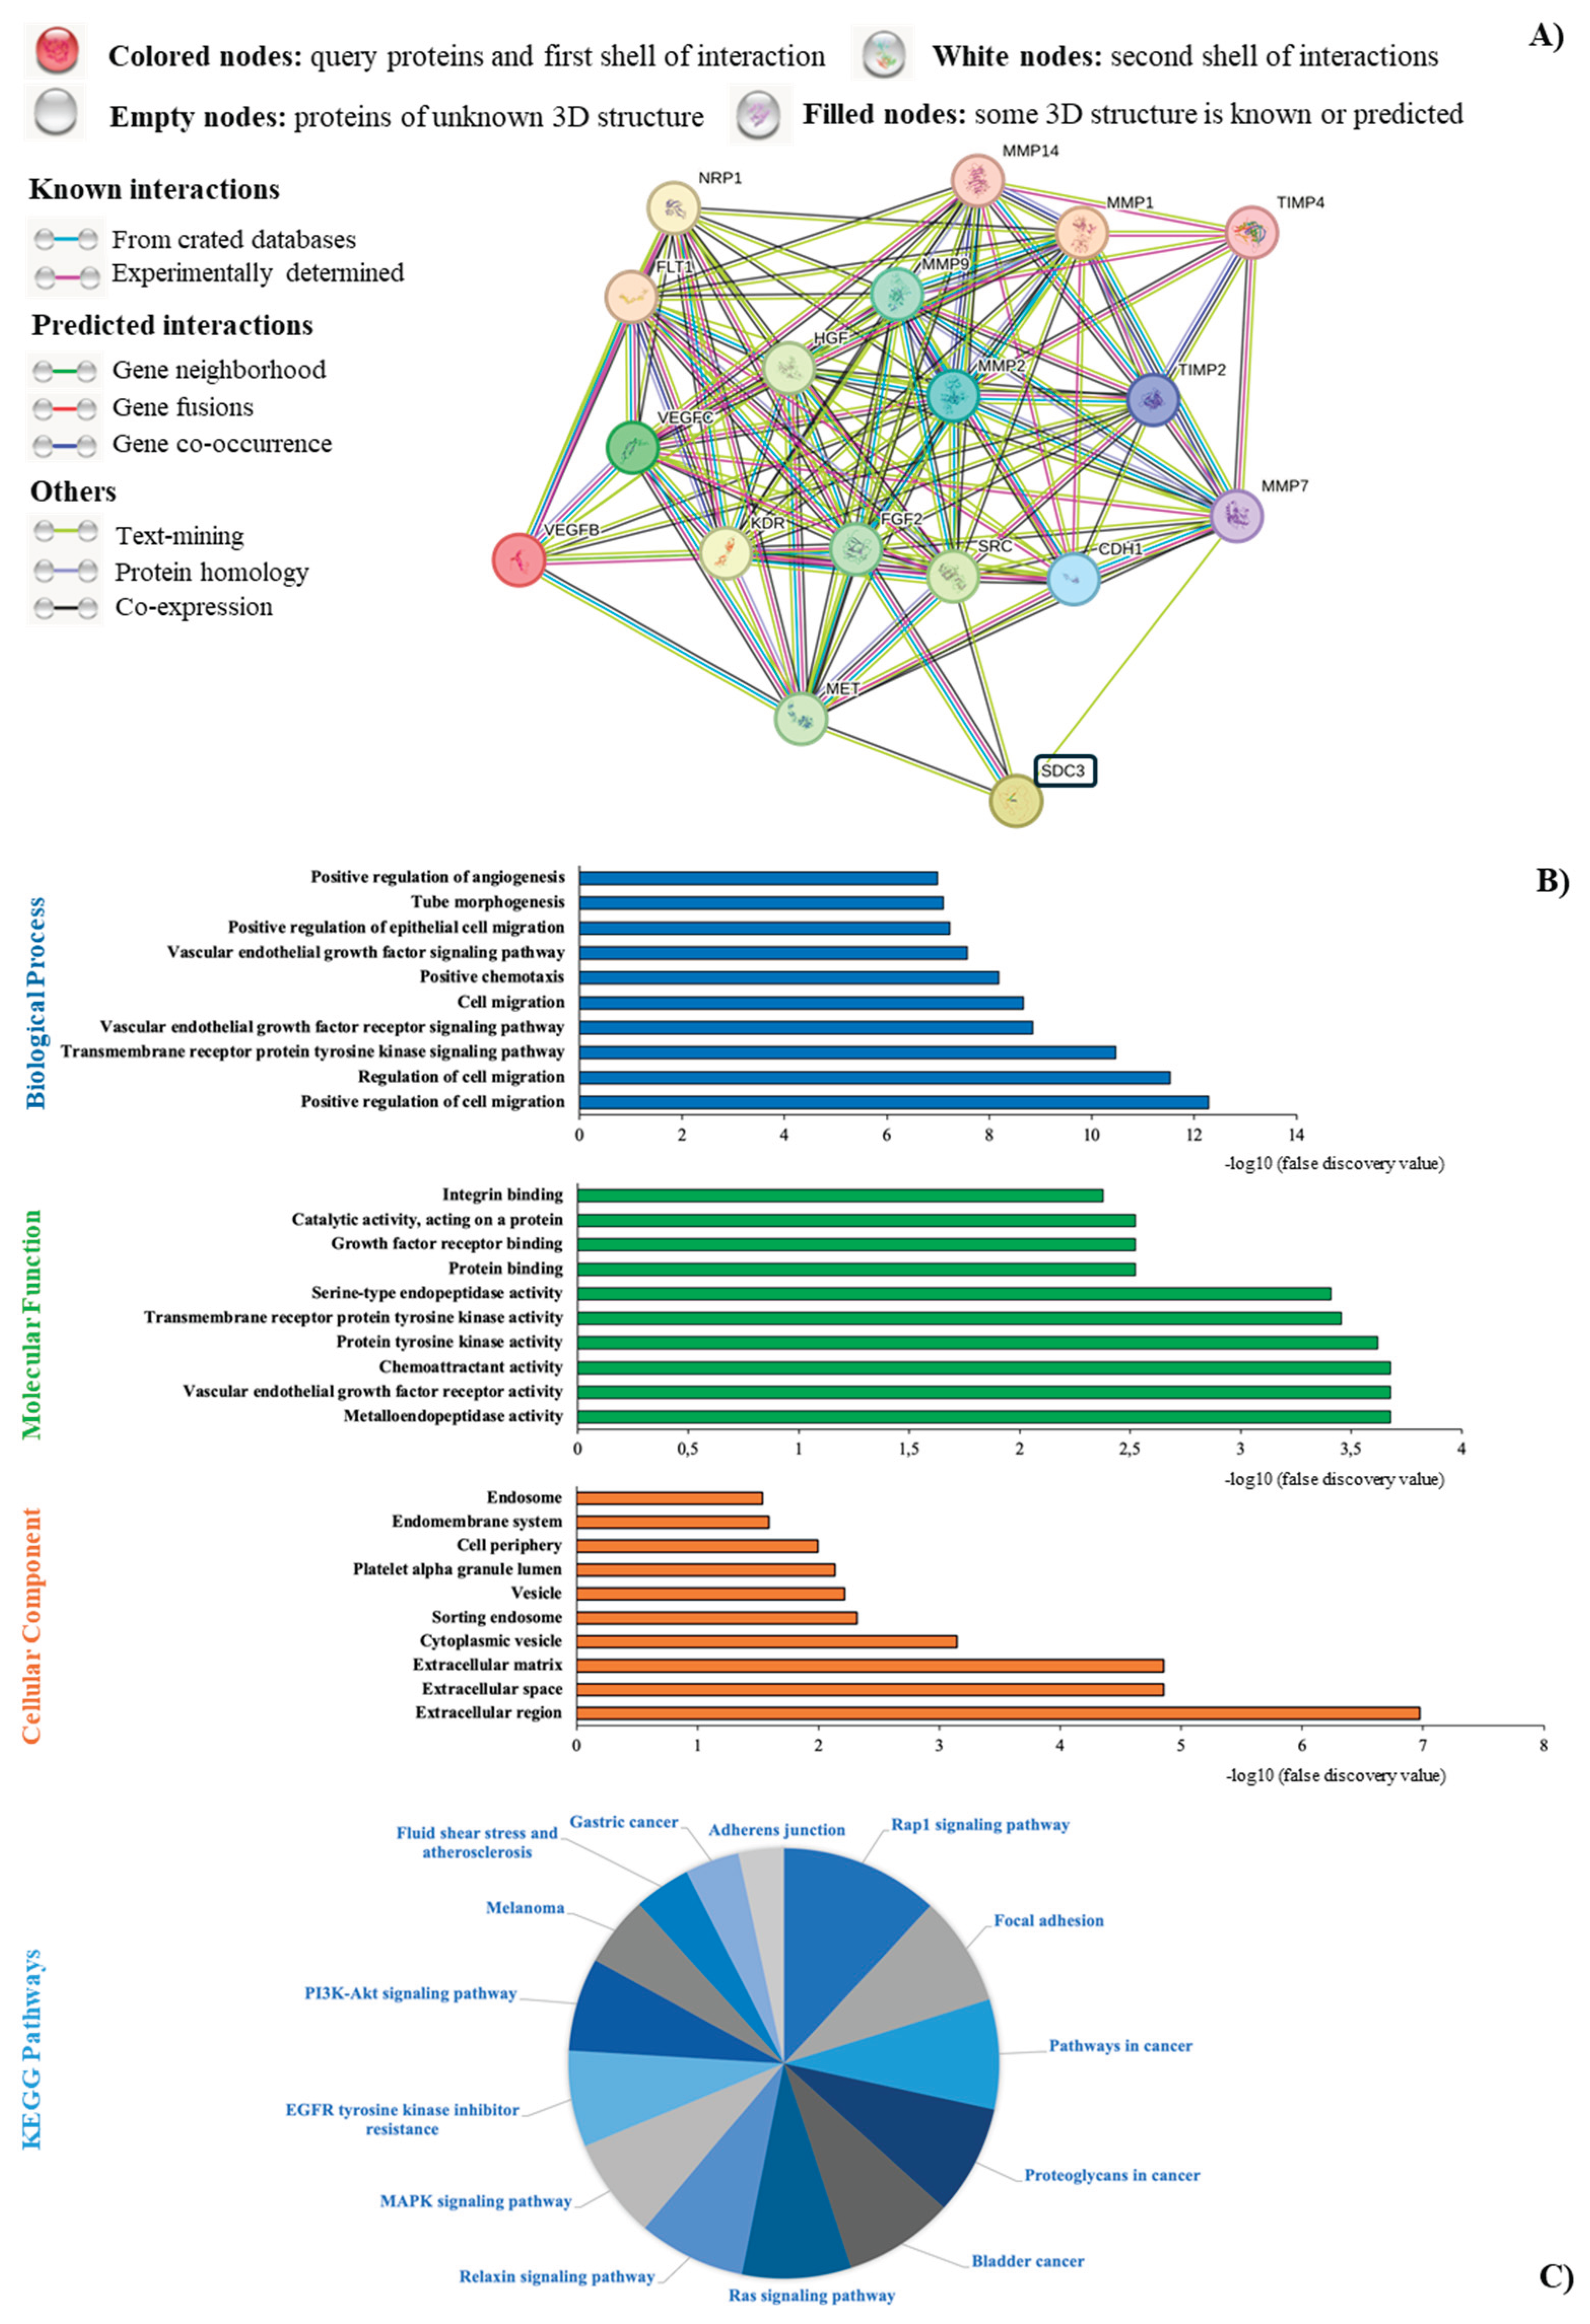
Table 1.
SDC3 protein expression in breast tumor samples 1-8.
| Sample | Patient ID | Staining | Intensity | Quantity | Location |
|---|---|---|---|---|---|
| 1 | #2898 | medium | moderate | >75% | Cytoplasmic, membranous |
| 2 | #3257 | medium | moderate | ||
| 3 | #2392 | medium | moderate | ||
| 4 | #1939 | medium | moderate | ||
| 5 | #2805 | low | weak | ||
| 6 | #1874 | low | weak | ||
| 7 | #2428 | low | weak | ||
| 8 | #2174 | low | weak |
Disclaimer/Publisher’s Note: The statements, opinions and data contained in all publications are solely those of the individual author(s) and contributor(s) and not of MDPI and/or the editor(s). MDPI and/or the editor(s) disclaim responsibility for any injury to people or property resulting from any ideas, methods, instructions or products referred to in the content. |
© 2025 by the authors. Licensee MDPI, Basel, Switzerland. This article is an open access article distributed under the terms and conditions of the Creative Commons Attribution (CC BY) license (http://creativecommons.org/licenses/by/4.0/).
Copyright: This open access article is published under a Creative Commons CC BY 4.0 license, which permit the free download, distribution, and reuse, provided that the author and preprint are cited in any reuse.


