
Submitted:
11 September 2025
Posted:
12 September 2025
You are already at the latest version
Abstract
Climate change mitigation has become a global concern in recent years, and developing a sustainable carbon credit system is arguably one of the most effective strategies to combat this problem. This review focuses on strategies for developing a sustainable carbon credit system for climate change mitigation in Nigeria, with the findings robust enough to be applied in Sub-Saharan Africa. Carbon credit systems adopted in other regions of the world have been reviewed and presented to enable readers to draw inferences for applications in the region of study. Several carbon credit systems, such as the Clean Development Mechanism (CDM) and the Verified Carbon Standard (VCS), have been adopted in other regions and could be applied in Nigeria to reduce greenhouse gas emissions. The current situation of carbon emissions in Nigeria and sub-Saharan Africa has been analysed, including emissions from different fuel sources (liquid, solid, and gaseous fuels) and the percentage of emission per capita. The analysis revealed that Nigeria and ultimately sub-Saharan Africa are among the world's highest emitters of greenhouse gases, with emissions mostly originating from energy generation and transportation. There are still significant knowledge gaps in implementing carbon credit systems in Africa, which have been highlighted in this review. This has shown the need for strong policy and regulatory frameworks to support the implementation of carbon credit systems in the region, thereby promoting sustainability.
Keywords:
carbon credit
; carbon emission
; carbon trading
; sustainable development
; clean development mechanism
1. Introduction
Climate change is a global phenomenon encompassing diverse areas, with its impact increasingly becoming a worldwide issue, and this has engendered world leaders’ action in taking measures towards reducing their carbon footprint (Owusu and Asumadu-Sarkodie 2016). The adoption of carbon credits as a market-based mechanism for incentivising emission reductions is one strategy that has gained global popularity (Spash 2010). One carbon credit typically represents the removal of one tonne of carbon dioxide (CO2) or its equivalent (CO2e) or other greenhouse gases from the atmosphere; it is a type of tradeable permit. These credits are tradeable on carbon markets (voluntary or compliance markets), enabling companies or nations to finance projects that reduce emissions to make up for their own emissions (Kollmuss et al. 2008) (Figure 1). The system serves the purpose of a mitigation strategy against climate change and emission reduction.
Carbon credits offer a way to mitigate the impacts of carbon emissions by supporting projects that reduce or remove greenhouse gases (GHG) from the atmosphere. These projects can be informed by meteorological and climatological data to ensure their effectiveness in mitigating climate change (Agbo et al. 2021b; Agbo and Edet 2022). The Kyoto Protocol established an emissions trading market-based system where countries could purchase and sell emission allowances to meet their targets, as an approach to emissions reduction (Newell et al. 2013). The Clean Development Mechanism (CDM), which enables wealthy countries to finance carbon-reduction initiatives in developing nations and get credit toward their emissions targets, was also included in this agreement. As of 2021, 192 nations had accepted the Kyoto Protocol, which entered into adoption in 2005. All major emitters, including the United States, have not ratified the deal, and others have since withdrawn, including Canada and Russia (King and van den Bergh 2021). The Kyoto Protocol continues to be a key milestone in international efforts to combat climate change, despite its shortcomings and difficulties.
Although the adoption of carbon credits has been beneficial in some countries, there are difficulties in creating and implementing a successful carbon credit system in Africa, particularly in Nigeria and West Africa. This stems from inadequate institutional frameworks, shortage of reliable data, and a lack of sufficient technical knowledge and experience (Uhunamure et al. 2019; Agbo et al. 2021a). Hence, understanding Africa, West Africa, and ultimately Nigeria’s distinctive socio-economic and environmental settings is pertinent in designing a sustainable carbon credit system for mitigating climate change. It entails locating prospective emission reduction initiatives, putting in place proper monitoring and verification systems, creating a transparent and effective carbon trading market, and ultimately looking to more developed countries for guidance.
Establishing a sustainable carbon credit system in Nigeria and across Africa requires a deep understanding of the region’s existing conditions and opportunities. This study aims to provide that insight while identifying areas for growth potential. A critical review of relevant literature will explore global best practices for carbon credit systems, drawing on case studies from other regions to inform strategies for Africa. The research will also assess the current state of carbon trading and pricing across Africa, with a particular focus on West Africa’s progress and the challenges hindering effective implementation.
To support the study’s rationale and conclusions with empirical evidence, global carbon emissions data will be analysed, comparing Nigeria’s emissions with those of Sub-Saharan Africa and the rest of the world. These insights will provide a strong foundation for proposing future directions for the region’s carbon market. Additionally, the study will highlight key knowledge gaps and offer actionable recommendations for policymakers, researchers, and stakeholders in designing and implementing a viable carbon trading system. Ultimately, the goal is to develop a robust framework for Nigeria—and Africa at large—that will effectively mitigate climate change while driving sustainable development.
2. Carbon Credit Systems Adopted by Regions Globally
The carbon credit system (CCS) is not a novel idea; however, its importance in slowing down the resultant effect of carbon pollution on climate change has ensured its wide acceptance across nations of the world. The CCS implemented across countries are somewhat similar (Table 2), but many have their unique characteristics, which are shaped by factors such as the market type, focus, government regulations and intended emission reduction goals. Therefore, evaluating each of these existing systems for their advantages and disadvantages will serve in informing the researcher on an applicable system suitable to Nigeria.
2.1. Kazakhstan Emission Trade Scheme (KazETS)
The Kazakhstan emission trade scheme (KazETS) is similar to the EU-ETS in its allocation; however, the scheme’s measuring, reporting and verification (MRV) system differs from the EU-ETS on two key bases. First, the KazETS focuses on reducing only CO2 and not its equivalent, and the energy producers are sanctioned from passing on any increased compliance costs to consumers (Nurgaliyeva et al. 2018). The KazETS has implemented three phases, however, all phases facility level participation minimum is a constant of 20Mt CO2 per annum. In 2013, Phase 1 of KazETS was launched, covering 178 installations and 77% of total CO2 emissions (Kazenergy 2017). Phase 2 was implemented between January 2014 and December 2015 and covered 50% of total CO2 emissions. Phase 2 permitted only domestic offsets, also emission allowance banking was suspended, and credit borrowing was only permitted within this specific phase. In 2016, the KazETS was suspended for 21 months, during which the government reviewed allocation, procedures, functions and operations. Phase 3 became operational in January 2018 and has improved on its allocation methods. The Phase 3 uses grandfathering from 2013 to 2015 emissions in benchmarking the emission intensity for non-energy sector companies for its first allocation method (Kazenergy 2019). The second allocation method focuses on emission intensity and fuel sources for energy sector companies. The government’s use of such a dual system is targeted at reducing opposition to strict targets applicable to coal-fired plants using almost obsolete technology. Nevertheless, the parameters surrounding this new phase discourage the desire to transition from coal to gas-fired power in the KazETS (Kazenergy 2019).
Howie et al. (2020), itemises the following factors as influential to KazETS performance, namely:
- Kazakhstan energy prices are strictly regulated and the producers are prohibited from transferring any increment in compliance costs to customers.
- The KazETS allowance market is oligopolistic, having very few dominant firms such as the Eurasian Resources Group, Samruk Energy and Arcelor Mittal companies which corporately receive about 50% of the allowances.
- State-owned enterprises (SOE) are responsible for a major segment of the nation’s electricity and direct heat functioning capacity, and these do not care for cost efficiency.
- The adverse currency devaluations in Phase 2.
- The non-transparent pricing in carbon trading is via a designated carbon exchange.
- Misappropriation and unaccountability of allowances, which were neither explained nor included in the allocations reserve (Howie et al. 2020), led to concerns about fairness of allocation methods.
2.2. Korean Emission Trade Scheme (K-ETS)
There are three critical factors which influenced the formation and development of the Korean ETS (K-ETS). First, the fundamental concept of a green Korea. Second, international opinions concerning its highly increased GHG emission levels forcing its government to establish mitigation controls (Hyun and Oh 2015). Third, the expectation of designing the K-ETS to seamlessly interact with the EU-ETS (Biedenkopf and Wettestad 2017). Domestic politics has adversely affected the growth of the K-ETS as its acceptance was based on the pre-contextual idea it could reduce revenue and dull international competitiveness, resulting in a two-year launch postponement (Hyun and Oh 2015).
The current KETS has the following unique features. First, the scheme encompasses both direct and indirect GHG emissions. It utilises an absolute emissions cap on indirect emissions by means of a regulated demand control mechanism (DCM). This DCM adds the carbon cost to the final customer price, which aids in evading government regulations concerning carbon prices (Howie et al. 2020). Second, the KETS gives concessions to energy-intensive trade exposed industries. Third, the KETS allowance market is run by the Korea Exchange (KRX), whilst the Korea Power Exchange (KPX) supervises the recovery expense settlement for functioning power plants. Lastly, the KETS has two separate plans; the decade long Master plan which focuses on the medium to long-term objectives of reducing GHG emission in line with stipulated emission targets in CO2 or its equivalent; and the Allocation Plan which distinctly defines critical elements such as allowances allocation per sector, the credit cap, and regulations on borrowing, banking and offsets (Suk et al. 2018; Howie et al. 2020)
The KETS is in its third phase, which will end in 2025 and has improved since the inception of Phase1 in 2015. There have been some constants throughout the phases such as the EITE sectors receiving 100% free allowances throughout all three phases. Nevertheless, the KETS has experienced some changes such as government restriction on the amount of banking from Phase 2 to Phase 3, aimed at curtailing excessively high allowance prices (Narassimhan et al. 2018). Also, a market stabilisation reserve (MSR) was implemented to control the allowance prices. The MSR executes market stabilisation by releasing reserve allowances in reserve, in a situation where the allowance price growth spike is influential and high enough to pose serious market risks. Additionally, the KETS has two types of tradeable allowances; the Korean Allowance Unit (KAU) being the emission allowance for all complaint entities, and the Korean Credit Unit (KCU) is the allowance converted from offset projects (Suk et al. 2018)
2.3. China’s National Emission Trade Scheme
China formerly operated provincial trading schemes in 2013 in seven locations: Shanghai, Guangdong, Hubei, Tianjin, Beijing, Shenzhen and Chongqing (Nakano and Kennedy 2021). These provincial schemes served as pilot phases for the implementation of the nation’s ETS, which was officially announced in 2017 and launched officially in 2021. The national ETS focuses on reducing target emissions from the power sector (Nakano and Kennedy 2021). China’s national ETS is a rate -based system; therefore, its focus is on CO2 emissions per unit of output unlike the often-utilised mass-based system, which targets the total CO2 emissions. This will require affected companies’ data on volume of emissions on a regular basis (Weng et al. 2020). The China ETS has been structured to first focus on the electricity sector which is responsible for 40% of China’s total annual CO2 emissions. Upon full implementation, plans are underway to incorporate other sectors into China’s national ETS such as aviation, pulp and paper, iron and steel, building materials, non-ferrous metal processing, chemical and petroleum refining (Nakano and Kennedy 2021)
China’s ETS was launched in July 2021, thus analysing the ETS’ success seems premature. However, it is possible to analyse its current framework. Using the data and experience gathered from seven provincial carbon schemes, it is likely that China will be strategic in the development and implementation of its national ETS. The creation of a national ETS is largely based on China’s status as a large GHG emitter, and in 2019 the nation accounted for 27% of total global emissions (Nakano and Kennedy 2021). This makes the relatively new national ETS a proponent in incentivising reduction in emissions intensity. The advantage is that it allows for continuous Chinese economic growth, whilst managing CO2 emissions. However, the problem of such incentivisation on emissions intensity as compared to emission capping, is the non-guarantee in reduction of emission levels needless of improved energy sufficiency (Cui et al. 2014; Nakano and Kennedy 2021). Lastly, no matter the improvements in energy use, the primary goal of an ETS is to ensure substantial reduction in GHG emissions.
2.4. Australia’s Emissions Reduction Fund
Australia has a carbon market comprising of tradeable Australian Carbon Credit Units (ACCUs) which are traded in an over-the-counter market by brokers. There is mounting pressure for the creation of an Australian Carbon Exchange (ACE) by the Clean Energy Regulator (CER) (Law 2021). The ACE is expected to improve market transparency and increase supply of ACCUs to companies desiring to meet their emission reduction quota at the lowest possible rates and is set to begin in 2023 (Law 2021). Regardless of no existing ETS, the Australian Government has implemented policies geared at reducing GHG emission by 26% below 2005 levels in 2030; a show of support to its Paris Agreement commitments. The policy measures in ensuring the fulfilment of emission reduction quotas are the National Hydrogen Strategy, the Emissions Reduction Fund and the Technology Investment Roadmap (Maraseni and Reardon-Smith 2019).
The Australian Carbon market is voluntary and is segmented in two: earning of ACCUs under the emission reduction fund (ERF) voluntary scheme; and a safeguard mechanism. The ERF’s voluntary scheme allows businesses, lower-tier governments and land managers earn ACCUs by voluntary participation in projects certified to reduce carbon emissions (Law 2021). According to Hepburn (2007), a certified project must meet the following conditions: the person managing the project must pass a “fit and proper person test”; the project must have an approved methodology; and it has not been implemented and is not mandatory under law. Thus, no prospects of it being a government project. The project is registered upon meeting key requirements according to CER standards. The ACCUs are earned upon participation in a carbon reduction contract which stipulates set ACCUs at a pegged price for a specified time. The accrued ACCUs can be sold in the secondary market to entities intending to offset their emissions. The ACCUs issuance is tracked by the Australian National Registry of Emission Units (ANREU) and assessed by the CER for approval of entries. ACCU supply reached 16 million in 2020 compared to 14.8 million in 2019 and based on the recent registration of 158 projects the supply is expected to soar in coming years (Law 2021).
2.5. European Union Emission Trade Scheme (EU-ETS)
The EU-ETS is administered by the European Commission which sets a cap on the allowable total GHG emissions specific to industry and emission type. The EU-ETS ensures a reduction in allowable GHG emissions in subsequent years since its inception by reducing the allowable total emissions. The EU-ETS is in 4th phase which commenced January 2021 and is slated to end December 2030 (Zang et al. 2020). Phase4 mandates participation of all companies who produce the following emissions; CO2, Nitrous oxide and Perfluorocarbons. The EU-ETS utilises auctioning in allowance allocation, and this is administered by the EU-ETS Auctioning Regulation and Directive. Each EU member state has a proportion of allowances received. These states auction the allowances to the companies who are mandated to cap their emissions (Meadows et al. 2019). The EU-ETS Directive stipulates that all member states must utilise at least 50% of generated revenues towards climate related projects (Narassimhan et al. 2018). According to Law (2021), EU member states generated 11.7 billion euros in revenues between 2013 and 2015 and about 85% was diverted towards renewable energy and improved energy efficiency projects.
The current Phase 4 prioritises sectors with the highest risk of relocating their production outside of the EU in line with minimising emission levels, however, some free allocation is still in use. In minimising industrial migration, these sectors receive 100% of their allocation for free. Furthermore, less critical sectors will experience an almost total strike-off of free allocations by 2030 (Law 2021). The EU-ETS has 4 types of tradeable units which can be traded in the secondary market:
- EU Allowances: This is the most common and permits the holder to emit one tonne of CO2 or its equivalent amount in GHG emissions.
- ii. EU Aviation Allowances (EUAAs): This permits the holder emission of one tonne of CO2 within a specific timeframe and is specifically for aviation operators.
- Certified Emission Reduction (CERs): This is obtained under the Clean Development Mechanism (CDM) of the Kyoto Protocol, and permits firms in developed nations to invest in emission reduction projects in less developed countries as being more cost effective towards reducing emissions in their own countries
- Emission Reduction Units (ERUs): These are products of the Kyoto’s Protocol Joint Implementation (JI) mechanism where companies meet their emission quota by funding emission reduction projects in similarly industrialised companies. However, both the CERS and ERUs are no longer accepted by the EU-ETS regardless of the newly restructured CDM and JIU mechanisms (Law 2021)
3. Carbon Trading and Pricing in Africa
In Africa, carbon pricing and trading induces energy and climate conservation investments and assists nations in meeting their greenhouse gas (GHG) determined contributions. The carbon trading market presents a platform for stimulating foreign investments and local participation towards carbon reduction (Anser et al. 2021). However, the market mechanisms for climate mitigation practices using the Kyoto Protocol have undergone some changes. Additionally, carbon trading is a powerful stimulant in attracting Development Banks’ financial aid in African countries (Michaelowa et al. 2021b). Observations show that African countries are focused on organising and structuring, their market and pricing to fully implement carbon pricing activities. Regardless, Nigeria, Gabon and Ghana have received pre-emptive payments on carbon trading, which have grown exponentially in the last four years; therefore, indicating a growing interest and participation in Africa’s carbon pricing initiatives (Kene-Okafor 2021; Africa Renewal 2021; Ghana News 2023)
Regardless of this growing interest in the African carbon market, it has attracted fewer investors than it should due to the stagnating nature of electricity generation, which contrasts with the recent low-carbon investment (up 26% in 2023) as shown in Figure 2. Evidence shows that the populace’s access to electricity (power) is limited, with less than 25% of the continental population having access to regular grid generated electricity (Falchetta et al. 2019). This poor generation and distribution of electricity is a significant hindrance to the success of Africa’s Clean Development Mechanism (CDM) reforms, an offshoot of the Kyoto Protocol. Furthermore, the largest sources of electricity across the continent are hydro-powered; therefore, making investing in the CDM unattractive as carbon credits are not awarded explicitly for proposed clean energy sources (Sacherer et al. 2022).
Regardless of the public aim of carbon trading and pricing being the mitigation of climate change, the political nature of the African leaders reveals a determination to maximise profits by predominantly taxing offset emissions, as it is cheaper and faster in the short term, as compared to other long-term climate mitigating options. This creates a market primarily controlled by large private corporations who value such financial payments for carbon abatement as a better option than engaging in more expensive renewable projects (Green 2021). Hopefully, the need for diversifying their sources of energy in power generation, and setting up renewable energy structures has been strengthened by government policies with many West African countries intent on meeting some provisions set in Article 6 of the Paris Agreement. Therefore, resulting in internationally transferred mitigation outcomes (ITMO), by fulfilling their Nationally Determined Contributions (NDC’s) through approved CDM structures (Michaelowa et al. 2021a)
3.1. Carbon Pricing Mechanisms for Mitigation and Sequestration in Africa
The carbon mitigation mechanisms in Africa are primarily, carbon pricing and sequestration. Carbon sequestration can be accomplished by natural procedures like afforestation, wherein trees absorb carbon dioxide through photosynthesis. Also, human-engineered processes like carbon capture and storage (CCS), in which carbon dioxide is transferred from industrial operations and stored underground.
Afforestation may be a temporary carbon sink, as trees will eventually attain maturity and stop absorbing carbon. However, CCS necessitates considerable energy and financial investments, making the application of the processes mentioned above a bit complicated. This section will define and explore the methods and intent of African countries in utilising such carbon pricing mechanisms.
3.1.1. Carbon Sequestration
Many African countries are invested in carbon sequestration activities; as observed in their roles of effective sinks for absorbing excess CO2 from the atmosphere. The investments made towards carbon sequestration are based on the nation’s verified emission reductions which can be purchased for a sum (Berretta 2020). Moreover, these investments serve as benefits from foreign investors in African nations’ carbon sequestration activities. Other benefits beyond the finance include biodiversity protection, tenure reforms and job creation (Goldstein 2016). A review of national planning documents revealed that, carbon sequestration is a policy objective of some African countries, such as, Angola, the Democratic of Congo (DRC), Zambia, Malawi and Madagascar; and they have shown a conscious intent on ‘reducing emissions from deforestation and forest degradation’ (REDD+) (Rumble and Gilder 2022). Other strategies included or related to these plans include afforestation programmes, reforestation, provisions for limiting deforestation, and conservation and sustainable management of forests and the larger ecosystem (Seddon et al. 2021).
In Africa, Forestry and Land use projects produce the most carbon offsets, as the instrument for the carbon offset activities focuses on REDD+ and forest-related projects (Jindal et al. 2008). The offsets are sold in the voluntary market regulated by standard bodies like the Verra VCS, and the Climate Community and Biodiversity Standards (CCBs) (Bose et al. 2021). Reviewing the Verra project base reveals existing projects in DRC, Zimbabwe, Zambia, Uganda, Tanzania, South Africa, Ethiopia, Kenya, Madagascar and Mozambique (Berretta, 2020). A notable project is Kenya’s Wildlife Kasigu Corridor REDD+ project, which is the first REDD+ project in the world to receive the issuance of carbon credits. Also, it is stated to capably reduce CO2 emission by 1 million tonnes annually for the next thirty years (Chomba et al. 2016).
Regardless of the success and increased financial investments in forest-based sequestration in Africa, there have been observable problems with implementing carbon pricing as a mitigation mechanism (Michaelowa et al. 2021b). This is because some African countries have low participation in carbon sequestration activities due to insufficient financial investments from foreign organisations to aid forest conservation (Adenle et al. 2017). This has forced quite a number of African countries to adopt the Krutu of Paramaribo Joint Declaration, on High Forest Low Deforestation (HFLD) Climate Finance Mobilisation in February 2019. These countries highlighted their displeasure over the slow rate and inadequate scale of the REDD+ financing (Berretta 2020). Thus, substantiating the need for higher financing targeted at improved sustainable forest management, and better considerations for HFLD nations.
3.1.2. Carbon Pricing
The effectiveness of carbon pricing in achieving a net-zero carbon balance depends on several factors, including, the carbon price level, the pricing system’s coverage, and the availability of low-carbon alternatives. For example, a low carbon price may not provide sufficient incentives for emissions reduction. At the same time, a pricing system that only covers certain sectors or industries may create unintended consequences such as carbon leakage.
According to Berretta (2020), carbon pricing mechanisms for carbon mitigation in Africa are of three types. First, the direct carbon pricing instruments and these are observed in South Africa’s 2019 carbon tax law. Second, indirect mechanisms such as imposed taxes on inefficient energy technologies; these are present in Uganda, Kenya and Zambia. Third, taxes imposed on fossil fuels are observed in countries such as Mauritius and Zimbabwe. South Africa’s Carbon Tax Act intends to provide and streamline the carbon market pricing signals, which would positively stimulate the nation’s economic growth towards sustainability (Alton et al. 2014). The carbon tax is based on the sum of GHG emissions, industrial processes and fugitive emissions calculated by South Africa’s Department of Environment, Forestry and Fisheries (Van Heerden et al. 2016). This tax is augmented by numerous incentives and disincentives which are applied through national legislation; such as intensified depreciation allowance for renewable energy and biofuels investment, efficient energy tax deductions, income tax exemptions for carbon credits sale, carbon emission tax on new vehicles and environmental tax on incandescent bulbs (Berretta 2020)
Uganda has imposed carbon pricing on specific sectors that seem adamant in their use of inefficient technologies. For instance, Uganda has amended its Traffic and Road Safety Act 1998 by stipulating a ban on the importation of old cars (Osuret et al. 2021). This amendment ensures that vehicles aged nine years and above will have a 50% environmental tax imposed on them. In contrast, cars between five and eight years will have a 35% environmental tax (Forster and Nakyambadde 2020). In Kenya, the Finance Act 2019 has been amended to increase tax on petrol vehicles and vehicles with more than 1.5 litres engine capacity, as these have an excise tax of 25% (Berretta 2020). Additionally, diesel vehicles have an excise duty of 35% for vehicles’ engine capacity exceeding 2.5 litres and 20% for smaller cars. However, the excise duty on electric vehicles has been reduced to 10% to encourage cleaner and less GHG-emitting technologies (Opiyo and Njenga 2023).
In Zambia, the vehicle taxes are set as a one-off flat tax on vehicles beyond five years. It is implemented as a Motor Vehicle Surtax and is added to the import duty. Also, the annual charge on emissions for all vehicles depending on engine displacement is called the Carbon Emissions Surcharge (Kabinga and SJ 2017; Berretta 2020). Furthermore, the Zambia Government implemented a zero-rated excise duty for electric vehicles and halved their custom duty. Similarly, Mauritius’ Maurice Ile Durable (MID) levy was formed to impose taxes on fossil fuels. It is meant to aid the implementation of clean energy projects by subsidising the installation of compact fluorescent lamps and solar water heaters (Price 2020). Regardless of the MID’s constraint on CO2 emissions, it does not cover the carbon content of fuels, nor does it evaluate the externalities of other carbon emissions and therefore does not tax all possible sources of CO2 emissions (To et al. 2018). This has called for a reformation of the legislation to structure and enable a fully-fledged carbon tax on all carbon fuels emitting CO2, as this will allow a stable and accurate price signal. In Zimbabwe, the government imposed a carbon tax on fuel in 2021. However, the revenue is not recycled for climate change or GHG reduction initiatives (Berretta 2020).
Carbon sequestration and pricing can play essential roles in achieving a net-zero carbon balance. However, their effectiveness depends on various factors, including the scale and duration of the sequestration process, the frictions that may hinder implementation, and the design and implementation of the pricing system. Addressing these factors requires a comprehensive and integrated approach to emissions reduction, involving various stakeholders, from policymakers to industry leaders to individual consumers.
4. West Africa Carbon Mitigation Assessment
An evaluation of the carbon mitigation actions by West African countries reveals that though the nations have emission tax in play, the governments have initiated and developed CDM projects; albeit, sponsored by higher-income nations. These sponsorships may be grants, loans, concessional equity finance or carbon market finance (Espelage et al. 2022). Amongst the West African nations, Nigeria has the highest number of CDM projects (15) and the most significant number of energy-efficiency CDM projects (10). Since their earliest crediting carbon projects of 2005, the West African countries have thrived substantially with increased numbers of registered and validated CDM projects. However, some validated CDM projects have undergone termination with Nigeria being the highest at 7. In spite of this, Nigeria still has the highest energy-related efficiency projects, with up to 10 in the pipeline (African Development bank 2021).
4.1. Challenges Affecting CDM Efficiency and Implementation in West Africa
The carbon credit system implementation in Africa has encountered many challenges, some are generic such as social and economic variables which have impeded the progress in developing national carbon markets. Some social problems such as corruption and high public distrust of politicians, when in high levels adversely impact the nation resulting in weaker climate policies and higher GHG emission (Lamb and Minx 2020). Whereas, the economic problems stem from the nation’s energy profile, as this is a fundamental variable in designing and implementing a nation’s carbon credit and pricing system (Kirikkaleli and Adebayo 2021). However, these problems are of unique variations and are distinct to each nation.
The observations in Table 1 strongly suggests that a nation’s existing energy resource for electricity generation is a primary factor, that influences the nature of the intended CDM project. For instance, Liberia predominantly depends on renewable energy and utilises the Landfill gas project as its only registered CDM project. Aside the inherent resources, the lack of infrastructure presents a hindrance to CDM implementation. For example, Niger possesses high solar potential and hydro capabilities from the River Niger but predominantly survives on biomass energy. This has caused wide spread deforestation of the forest cover in Niger and has forced the government to implement a Reforestation CDM project as a matter of top priority.
As earlier stated, the political climate can influence CDM implementation. A possible factor influencing Liberia’s low population access to electricity is its stilted recovery following the end of its Second Civil War in 2003 (Shaw 2019). This has increased the public debt and widened trade deficit, with the nation strongly needing financial investment. Data from the African Development Bank (ADB) shows that $490 million would be required to finance the country’s climate mitigation and adaptation activities and actions between 2021 and 2030 (Africa Development Bank 2019a).
Another crucial factor influencing the nature of the CDM initiated in a country is the nation’s challenges resulting from climate change. This is unique to each nation and essentially influences the needed financial backing for implementing carbon mitigation measures. For example, climate change affected Togo’s agricultural sector contracting the sector’s contribution to GDP from 37.3% in 2008 to 24.7% in 2021 (Africa Development Bank 2019b). Whereas in Ghana, the rising temperatures, erratic rainfall, and rising sea level have forced climate induced migration and affected Ghana’s hydropower output (Teye 2022).
5. Analyzing the Current Situation of Carbon Emission
An essential issue in the global effort to mitigate climate change is carbon emission reduction. Understanding the existing state of carbon emission is crucial for establishing sustainable carbon credit systems (Bernstein et al. 2010; Liu et al. 2015). In this section, the current state of carbon emissions in Nigeria, Sub-Saharan Africa, and the world at large will be analysed after data was obtained from https://ourworldindata.org/. In facilitating a comprehensive understanding, it is necessary to evaluate the total carbon emissions and their categorized sources such as liquid, solid, and gaseous fuels, as well as the carbon emissions per capita. The findings are intended to substantiate the need for a concerted approach towards Nigeria’s carbon pricing system and possibly other carbon markets in West Africa and Africa.
Additionally, pertinent issues related to carbon emissions and their effects on the diverse areas concerning carbon markets and sustainable development will be assessed. These include the connection between carbon emissions and climate change, the necessity of lowering carbon emissions, and the advantages of a long-term carbon credit scheme. Using visualised data, this research intends to provide a thorough overview of the current state of carbon emissions and how it will affect the development of Nigeria and Africa’s carbon markets. Policymakers, academics, and industry stakeholders will find the conclusions from the analyses’ findings useful in furthering their understanding of the region’s carbon market potential.
5.1. Percentage Emission
Figure 3a-c shows the percentage emission for the three fuel sources of carbon emission (liquid, solid and gaseous fuels) for Nigeria, Sub-Saharan Africa and the World, respectively. The purpose of considering these fuel sources is due to the significant impact they have on the carbon cycle balance and the fact that atmospheric emitted carbon has been proven to tilt above net-zero (García-Freites et al. 2021; Satola et al. 2022). It is noteworthy that other sources can contribute to carbon release like agriculture, landfills, waste incineration, sequestration, etc. Nevertheless, these activities are necessary in ensuring atmospheric carbon balance (Zeng and Hausmann 2022).
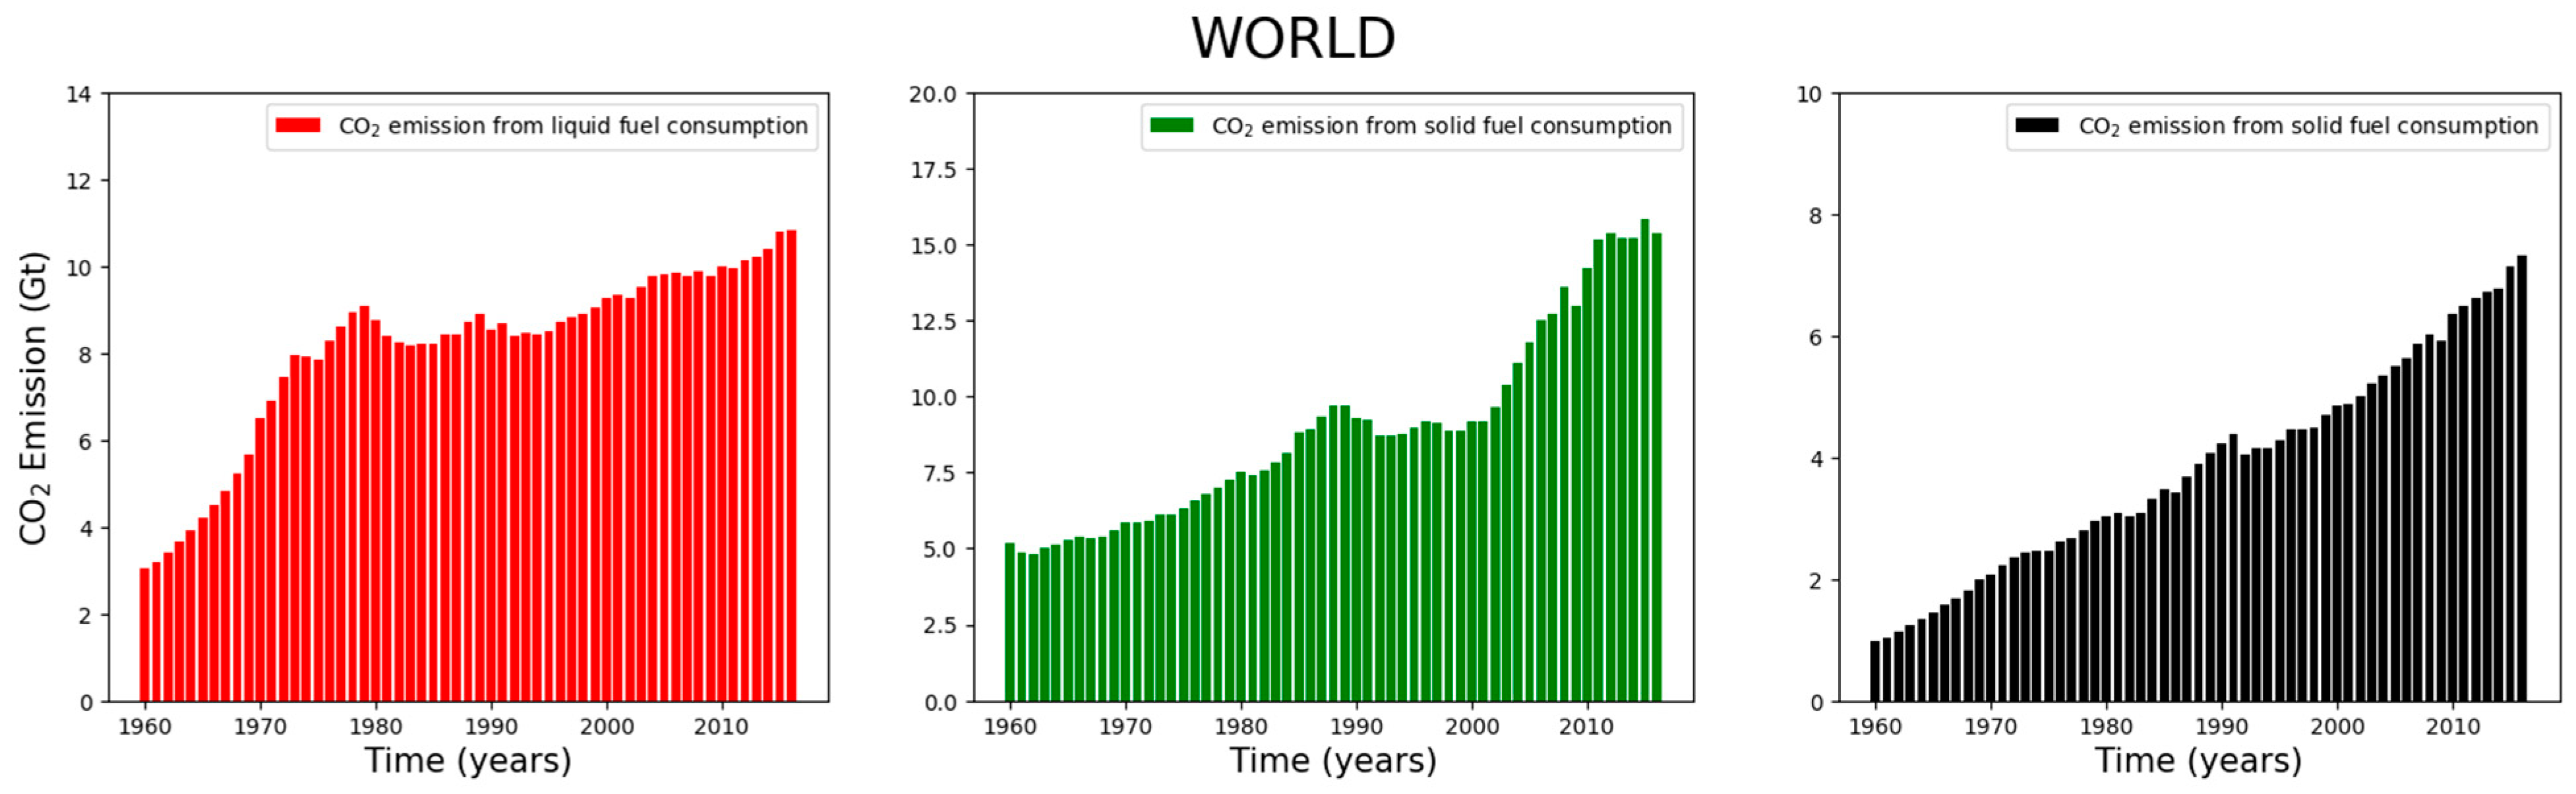
The percentage of emission from liquid fuel combustion (Figure 3a) has remained relatively high from 1960 to the most recent years. The use of gaseous fuels in Nigeria began around the late 1970s, predominantly due to oil boom and the third industrial revolution (Pirani 2018). In Sub-Saharan Africa (Figure 3b), the reverse is the case as the trend percentage of carbon emission from solid fuels is slightly higher than that of liquid fuels (Gasparatos et al. 2012). This may be attributed to the fact that most Sub-Saharan African countries are grossly under-developed, as many domestic homes are still burning solid fuels (wood, coal, etc.) (Rajaeifar et al. 2017). The consistent combustion of solid fuels like wood not only adds carbon to the atmosphere, but also alienates an essential source of reducing CO2 from the atmosphere; forest cover, that greatly offsets the carbon cycle balance (Armstrong et al. 2018). From the world’s perspective (Figure 3c), shows that emissions have remained relatively even for all fuel sources.
5.2. Total Emission
Approaches targeted at lowering carbon emissions from liquid fuels in Nigeria can serve as the foundation for creating a sound carbon credit system, as Nigeria’s fuel consumption is predominantly liquid. The proposed system can incentivize industries for participating, and this will aid policy creation that will encourage the use of low-carbon transportation options, increase the efficiency of energy use by encouraging and building energy efficient products, and promote the use of renewable energy sources. If businesses and individuals are successful in lowering their emissions below their permitted emissions permits, they may be able to sell their extra allowances to other parties that are unable to reach their emissions targets.
Figure 4 shows that emissions from liquid fuel consumption reached about 70Mt in 2016, increasing over the past 6 decades. Similarly, emissions from solid fuel consumption increased to reach a peak of almost 35Mt in 2016. This is proof along with Figure 5 (for Sub-Saharan Africa), that carbon emission is increasing rapidly, especially from liquid and solid fuels. This underscores the importance of considering the broader economic advantages of a well-thought-out carbon credit system. Lowering carbon emissions provides Nigeria with the opportunity of increasing its energy security, lessening its reliance on fossil fuels. Also, it will engender committed action towards creating new jobs and economic opportunities in the renewable energy industry by lowering its carbon emissions.
However, successfully developing a carbon credit system in Nigeria, requires a significant concentration of political will, technological proficiency, and stakeholder involvement (Olujobi et al. 2021). It must be integrated and aligned with existing legislature, policies and initiatives that support sustainable growth and lower emissions (Edomah et al. 2021). Nevertheless, Nigeria’s efforts to lessen the effects of climate change and transition to a low-carbon, sustainable future holds the potential to holistically benefit the country, if the intended carbon system is well-designed and properly managed.
Figure 4.
Carbon emission trend in million metric tons (Mt) for Nigeria’s liquid, solid and gaseous fuels.
Figure 4.
Carbon emission trend in million metric tons (Mt) for Nigeria’s liquid, solid and gaseous fuels.
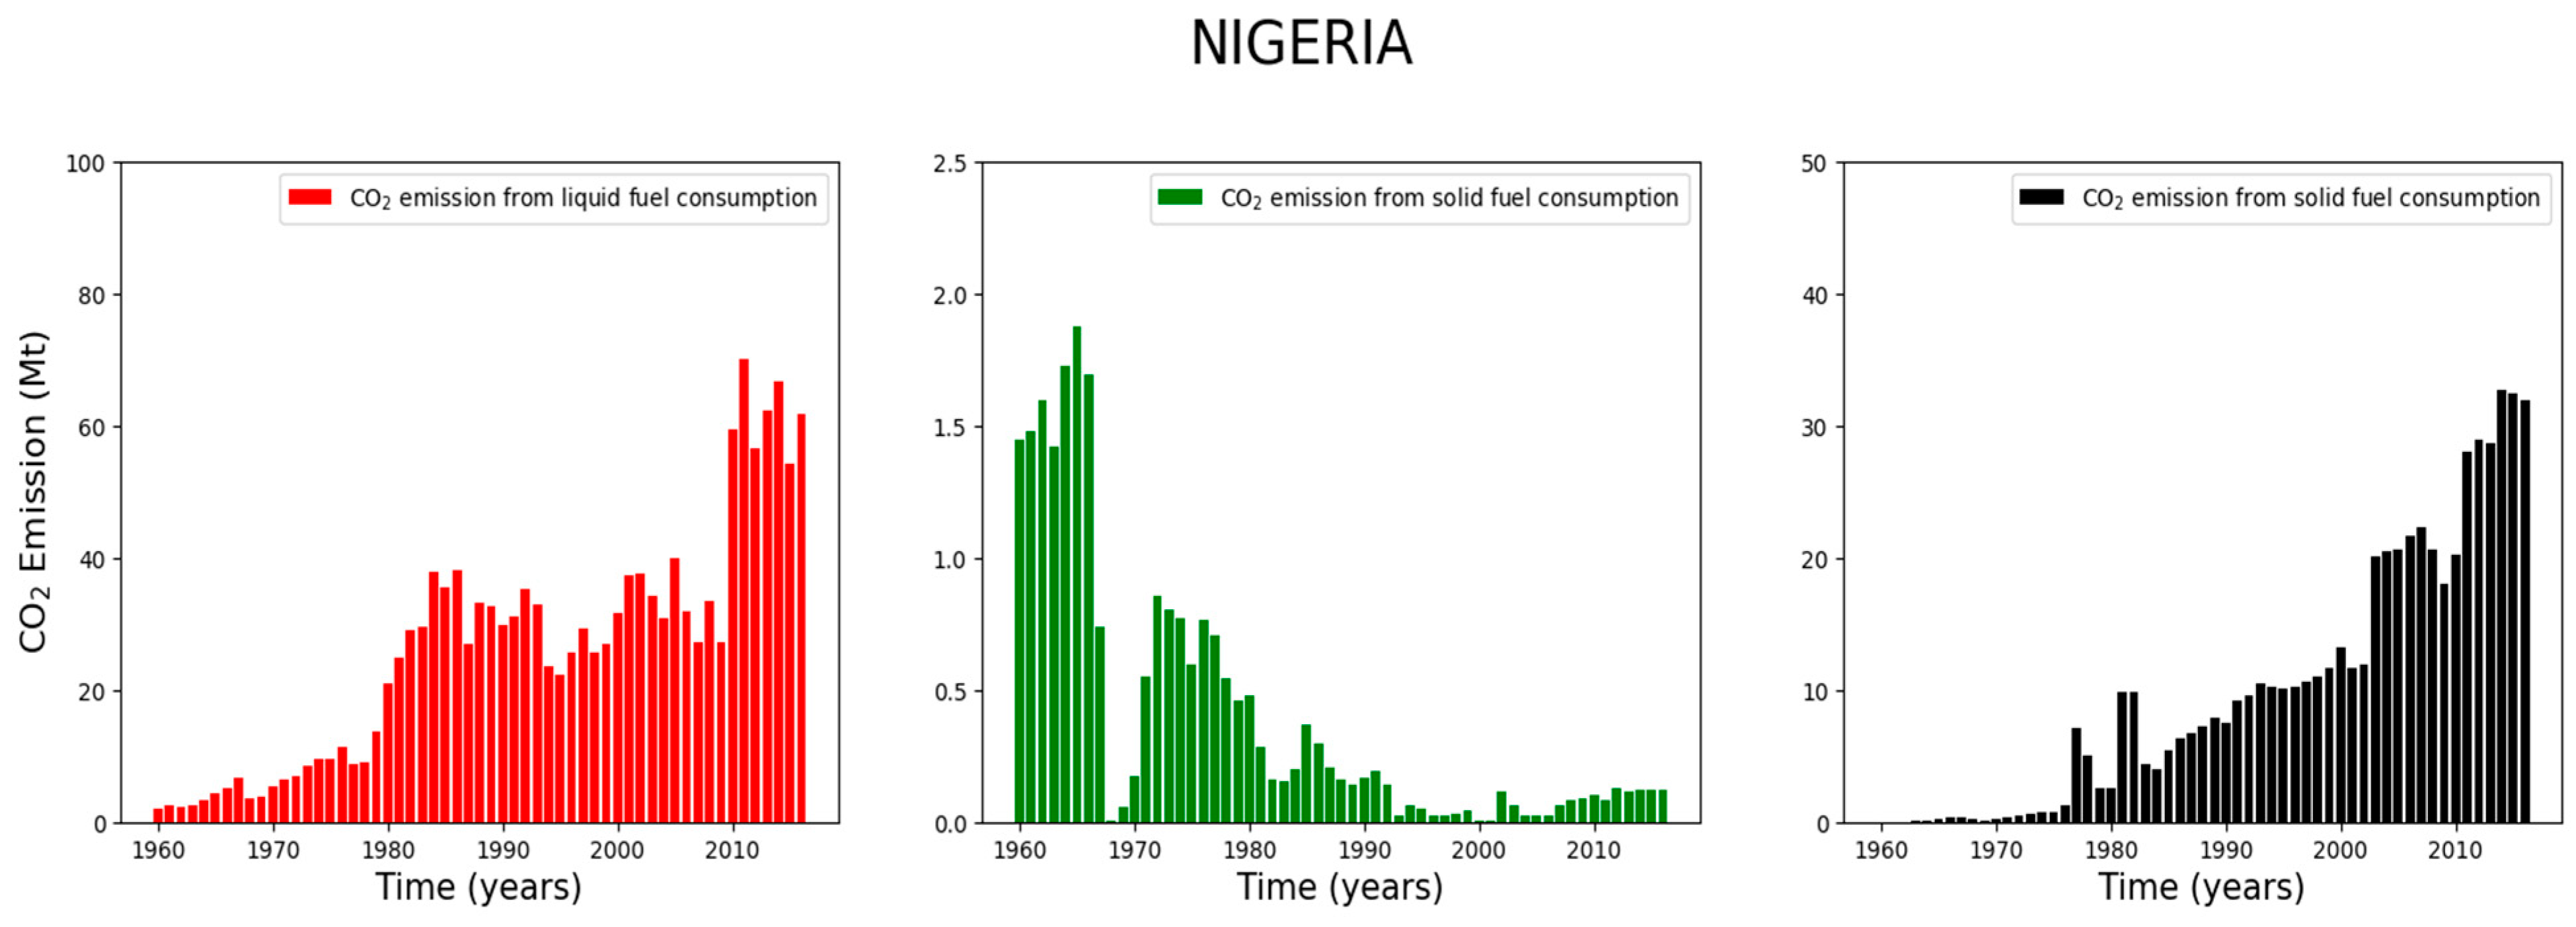
Figure 5.
Carbon emission trend in a million metric tons (Mt) for liquid, solid and gaseous fuels for Sub-Saharan Africa.
Figure 5.
Carbon emission trend in a million metric tons (Mt) for liquid, solid and gaseous fuels for Sub-Saharan Africa.
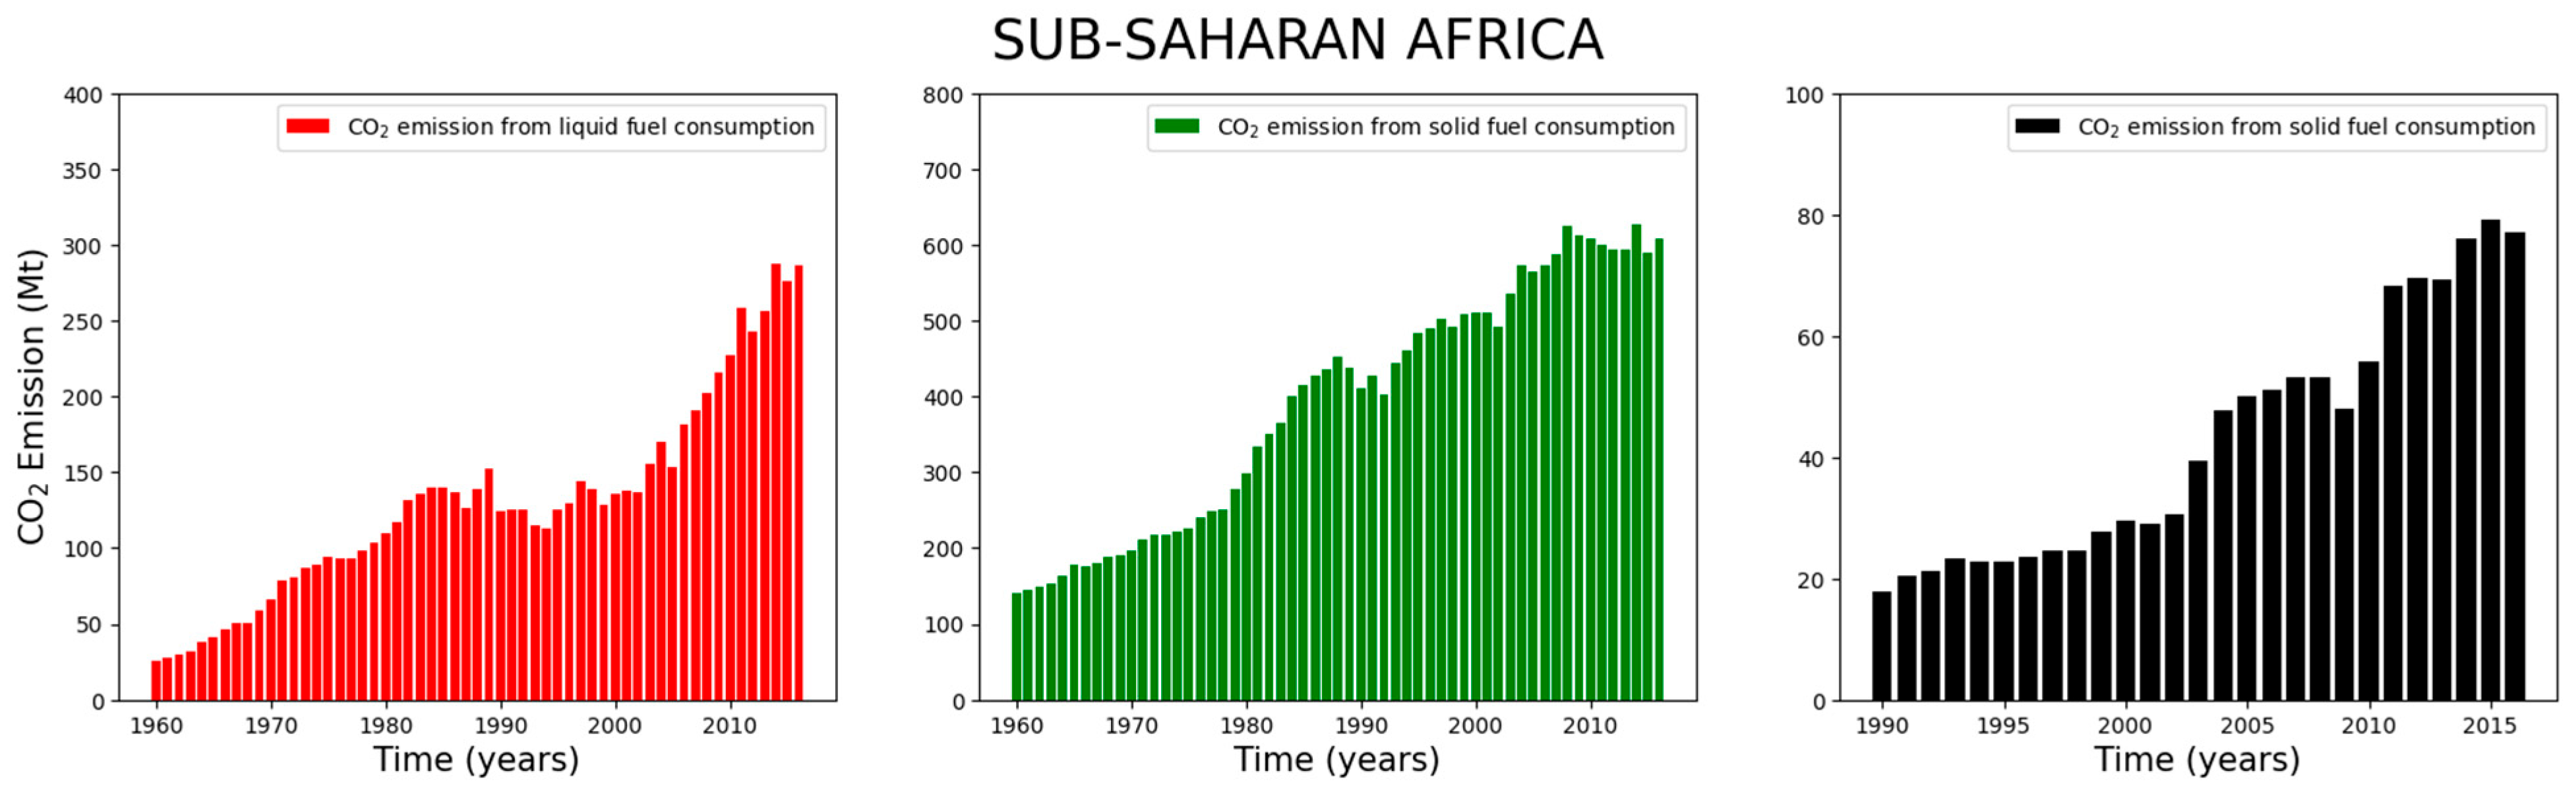
Figure 6.
Carbon emission trend in billion metric tons (Gt) for liquid, solid and gaseous fuels for the world.
Figure 6.
Carbon emission trend in billion metric tons (Gt) for liquid, solid and gaseous fuels for the world.
5.3. Per-Capita Emission
Figure 7 shows that although the total carbon emission in Nigeria is increasing, the emission in metric tons per capita (t/cap) is reducing. This could imply that the population density is increasing at a faster rate than carbon emissions, or that the country is becoming more efficient in its use of energy and resources. Studies like (Chanchangi et al. 2022; Eweka et al. 2022) show that the latter is not the case (at least not on a large scale), leaving the former valid and applicable to Nigeria. From the standpoint of a carbon credit system, Nigeria’s reducing emissions per capita may appear to be an encouraging development. However, this trend may represent broader socioeconomic issues, such as limited access to critical technology that promote quality of life, These could be inaccessibility to adequate public transportation networks, sophisticated farming equipment, and dependable energy infrastructure. In such circumstances, low emissions are not just the result of deliberate mitigation efforts, but also of underdevelopment.
However, these gaps provide a chance to encourage cleaner energy processes. As Nigeria navigates its energy transition, it can strategically use its low per capita emissions to qualify for more carbon credits. To achieve long-term development, the focus must extend beyond the sale of carbon credits. Significant investments are required to develop and implement clean and renewable energy alternatives. Otherwise, overreliance on carbon credits without developing sectoral clean energy programs could stymie national development and deny important industries access to the energy they need to prosper.
In conclusion, Nigeria can benefit from the opportunities provided by the trading of carbon credits by putting in place policies and initiatives that further cut emissions. This might entail either using the credits to pay for more emission reductions within Nigeria or selling them to other nations or businesses that need to compensate for their emissions. While Nigeria’s declining per capita emissions may seem encouraging, this trend alone does not necessarily indicate progress toward sustainability or readiness for a carbon credit system. Further analysis is needed to determine whether the decline is driven by deliberate emission reduction efforts or other factors, such as economic constraints or rapid population growth
Figure 7.
Total carbon emission trend in a million metric tons (Mt) and carbon emission in metric tons per capita (t/cap) for Nigeria.
Figure 7.
Total carbon emission trend in a million metric tons (Mt) and carbon emission in metric tons per capita (t/cap) for Nigeria.
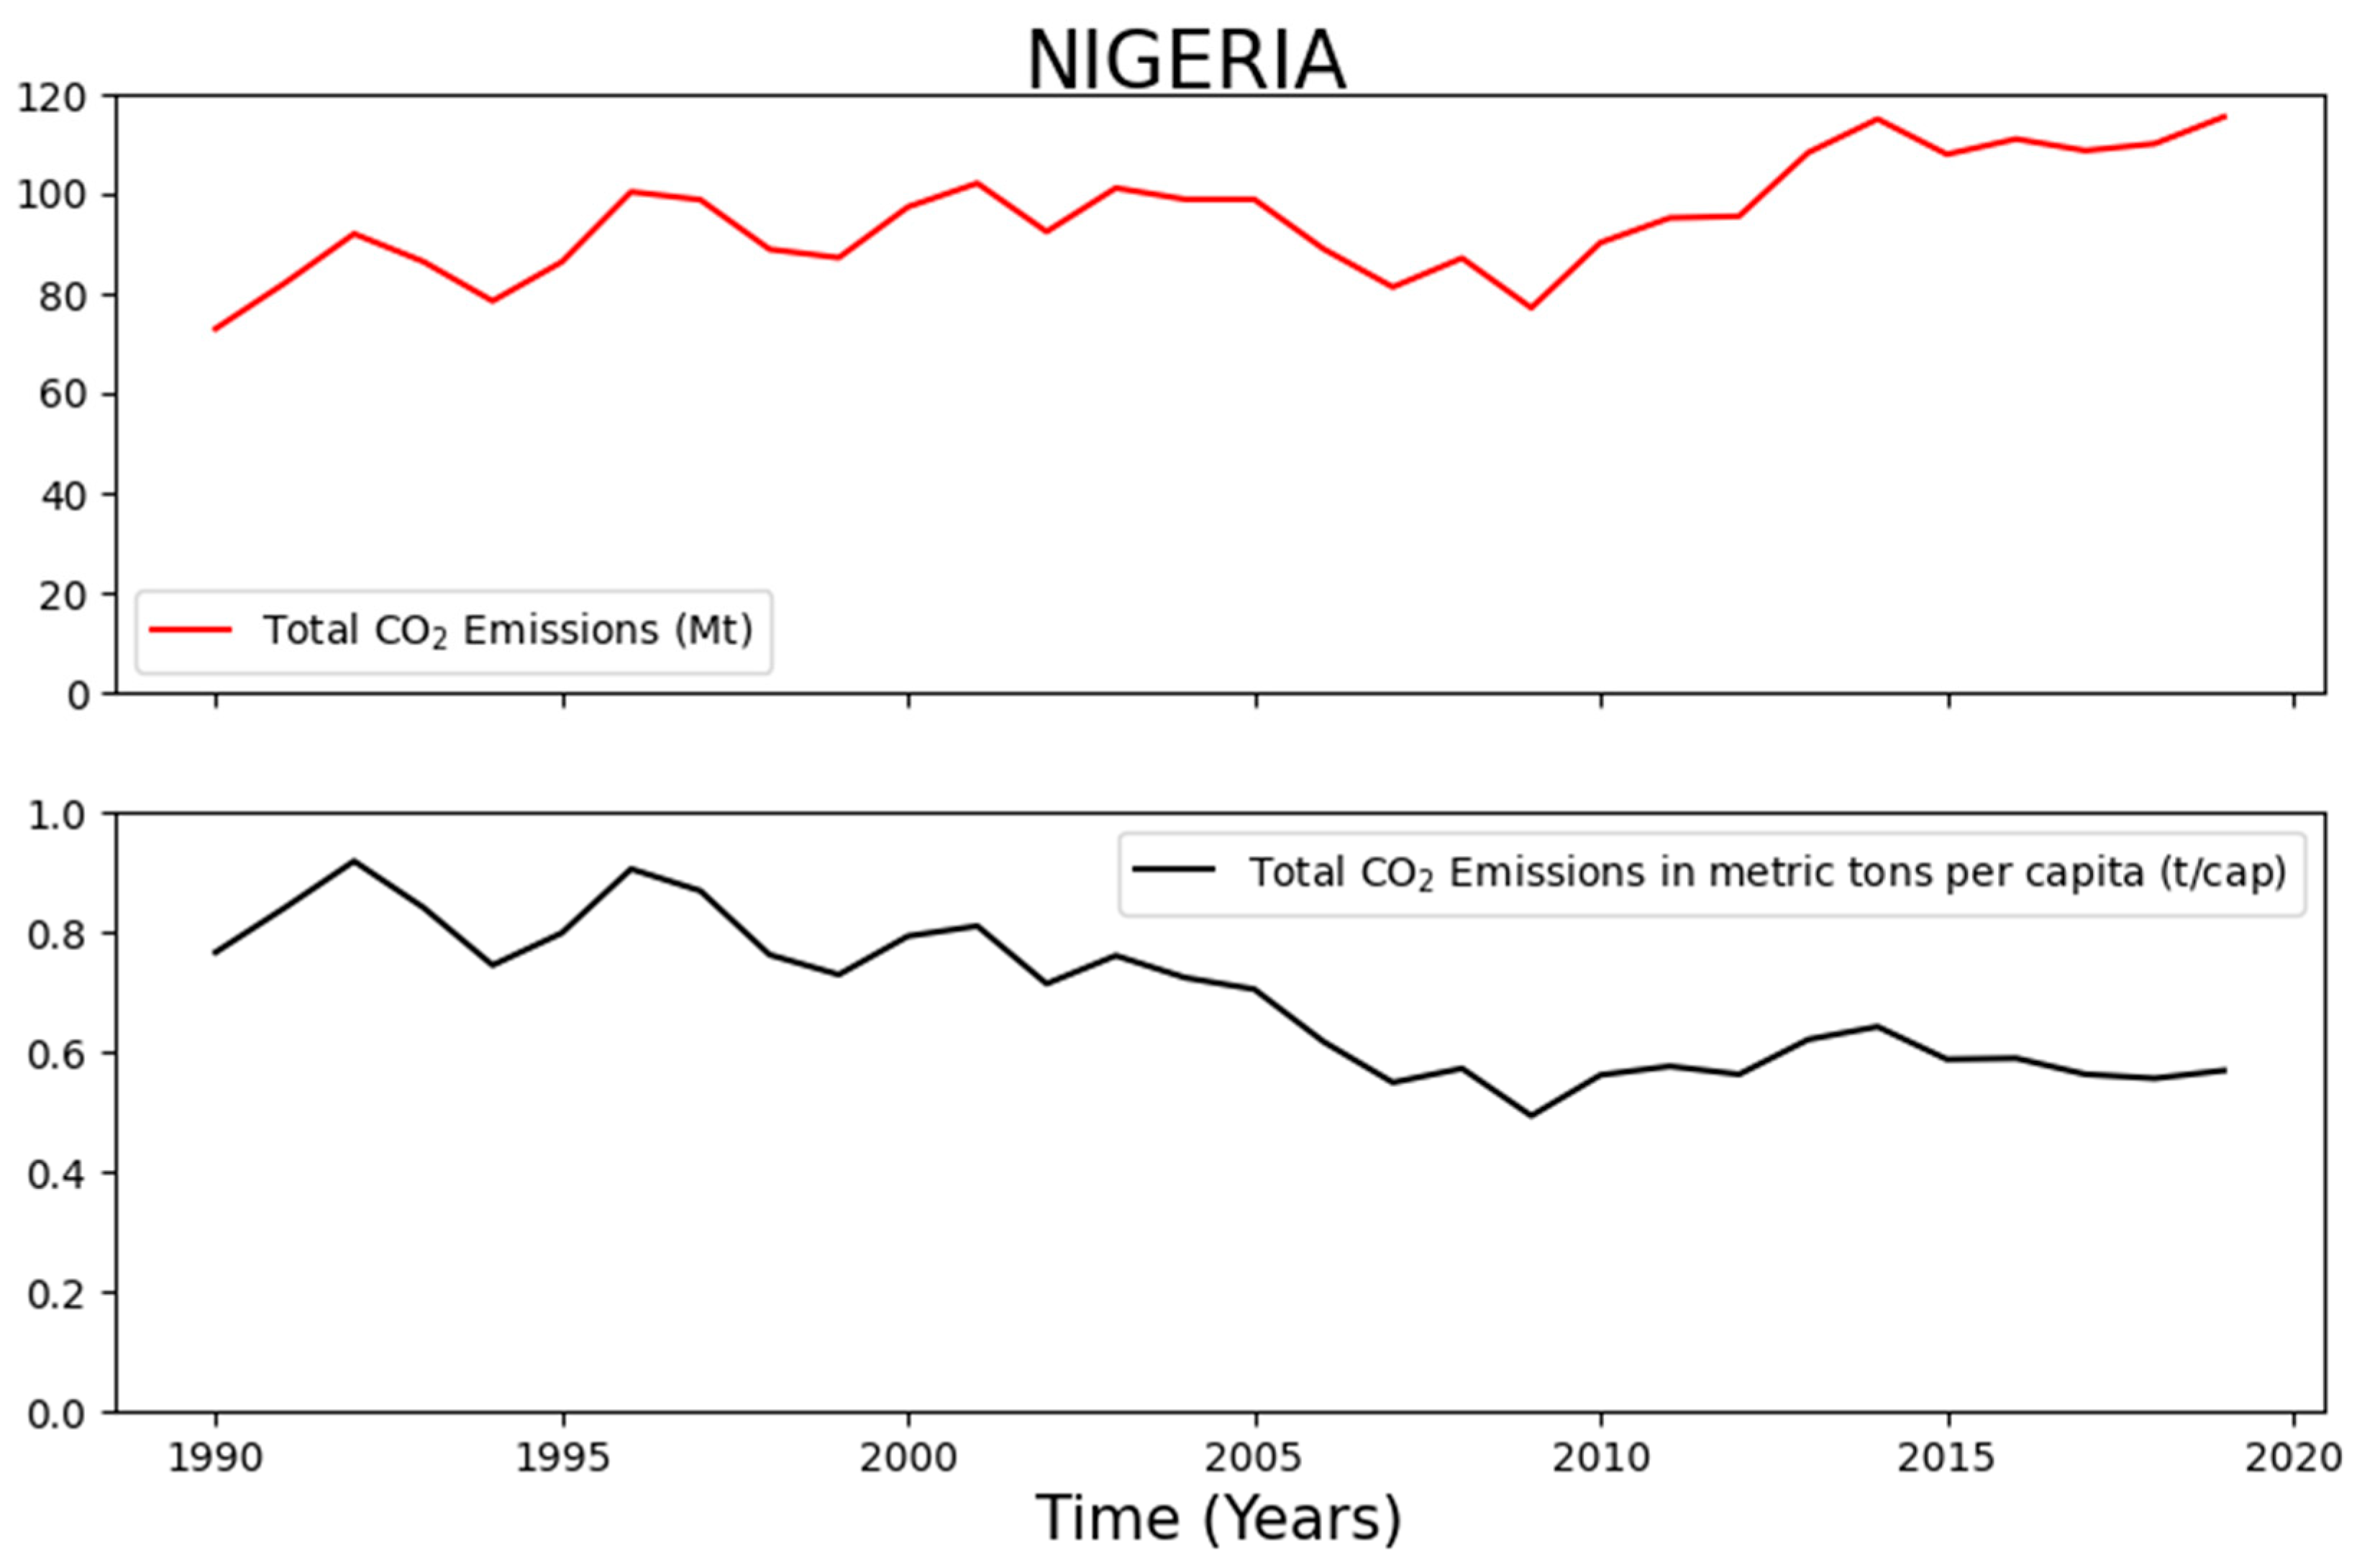
Figure 8.
Total carbon emission trend in a million metric tons (Mt) and carbon emission in metric tons per capita (t/cap) for Sub-Saharan Africa.
Figure 8.
Total carbon emission trend in a million metric tons (Mt) and carbon emission in metric tons per capita (t/cap) for Sub-Saharan Africa.
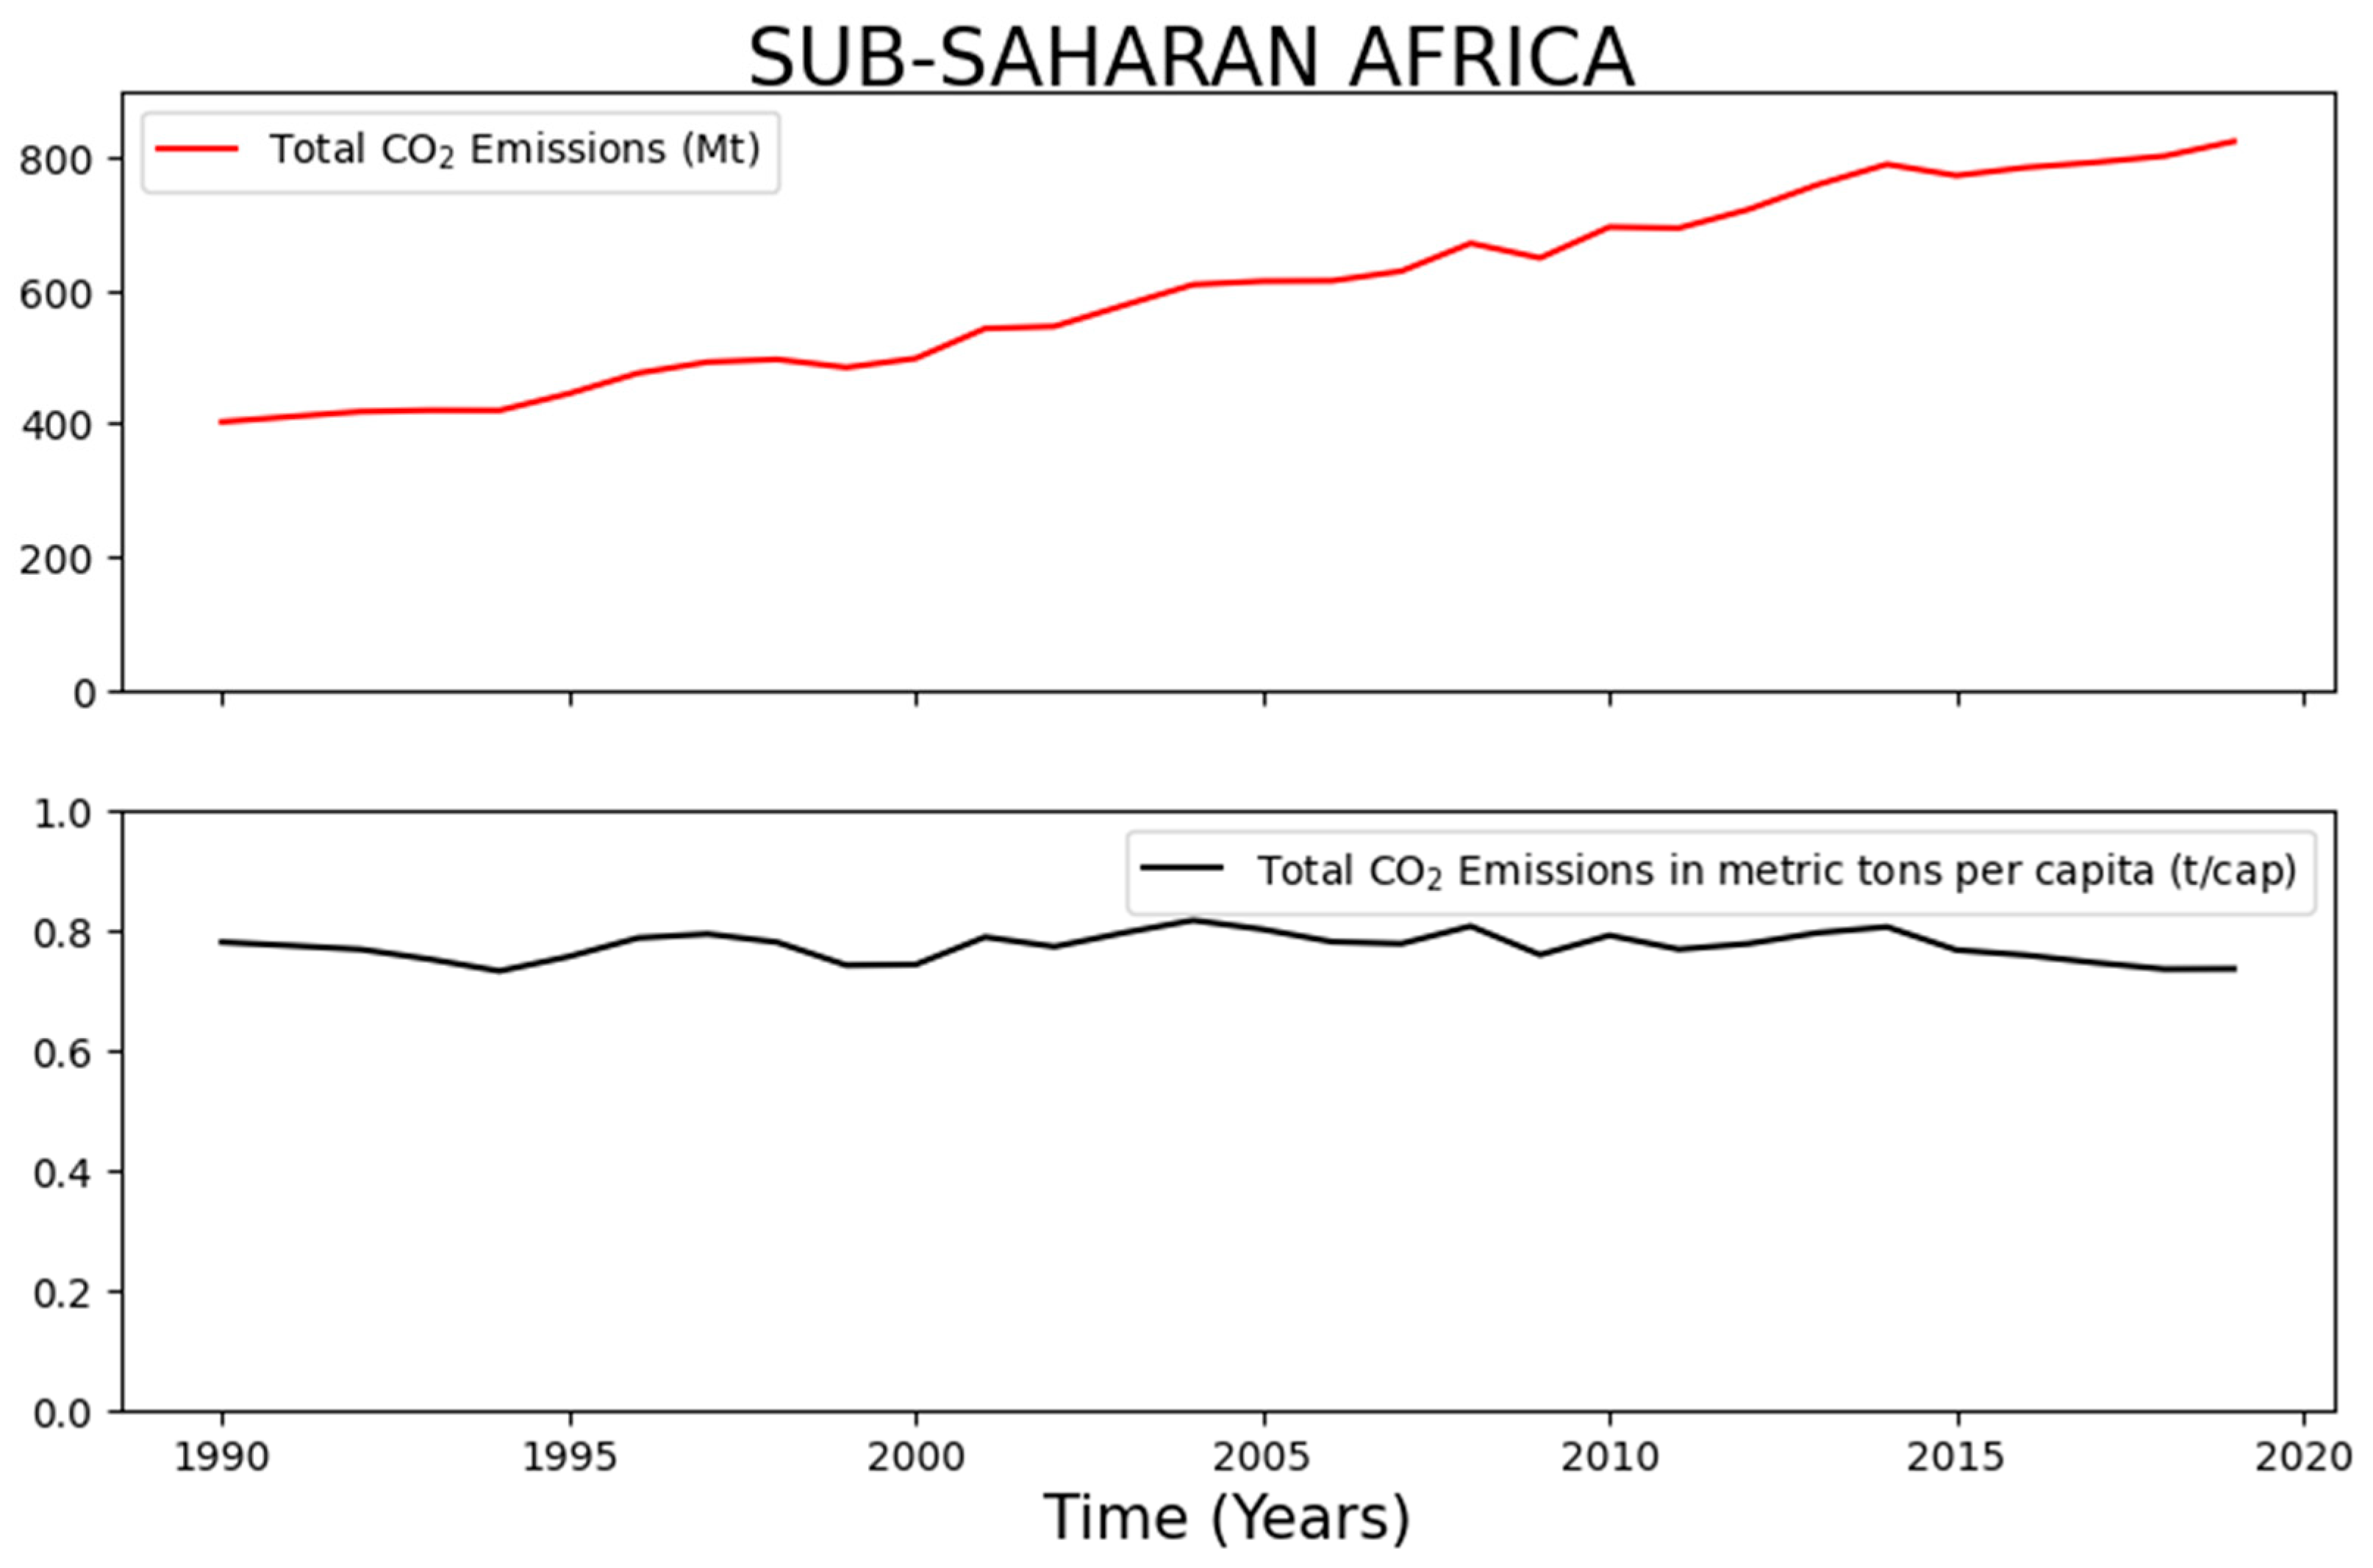
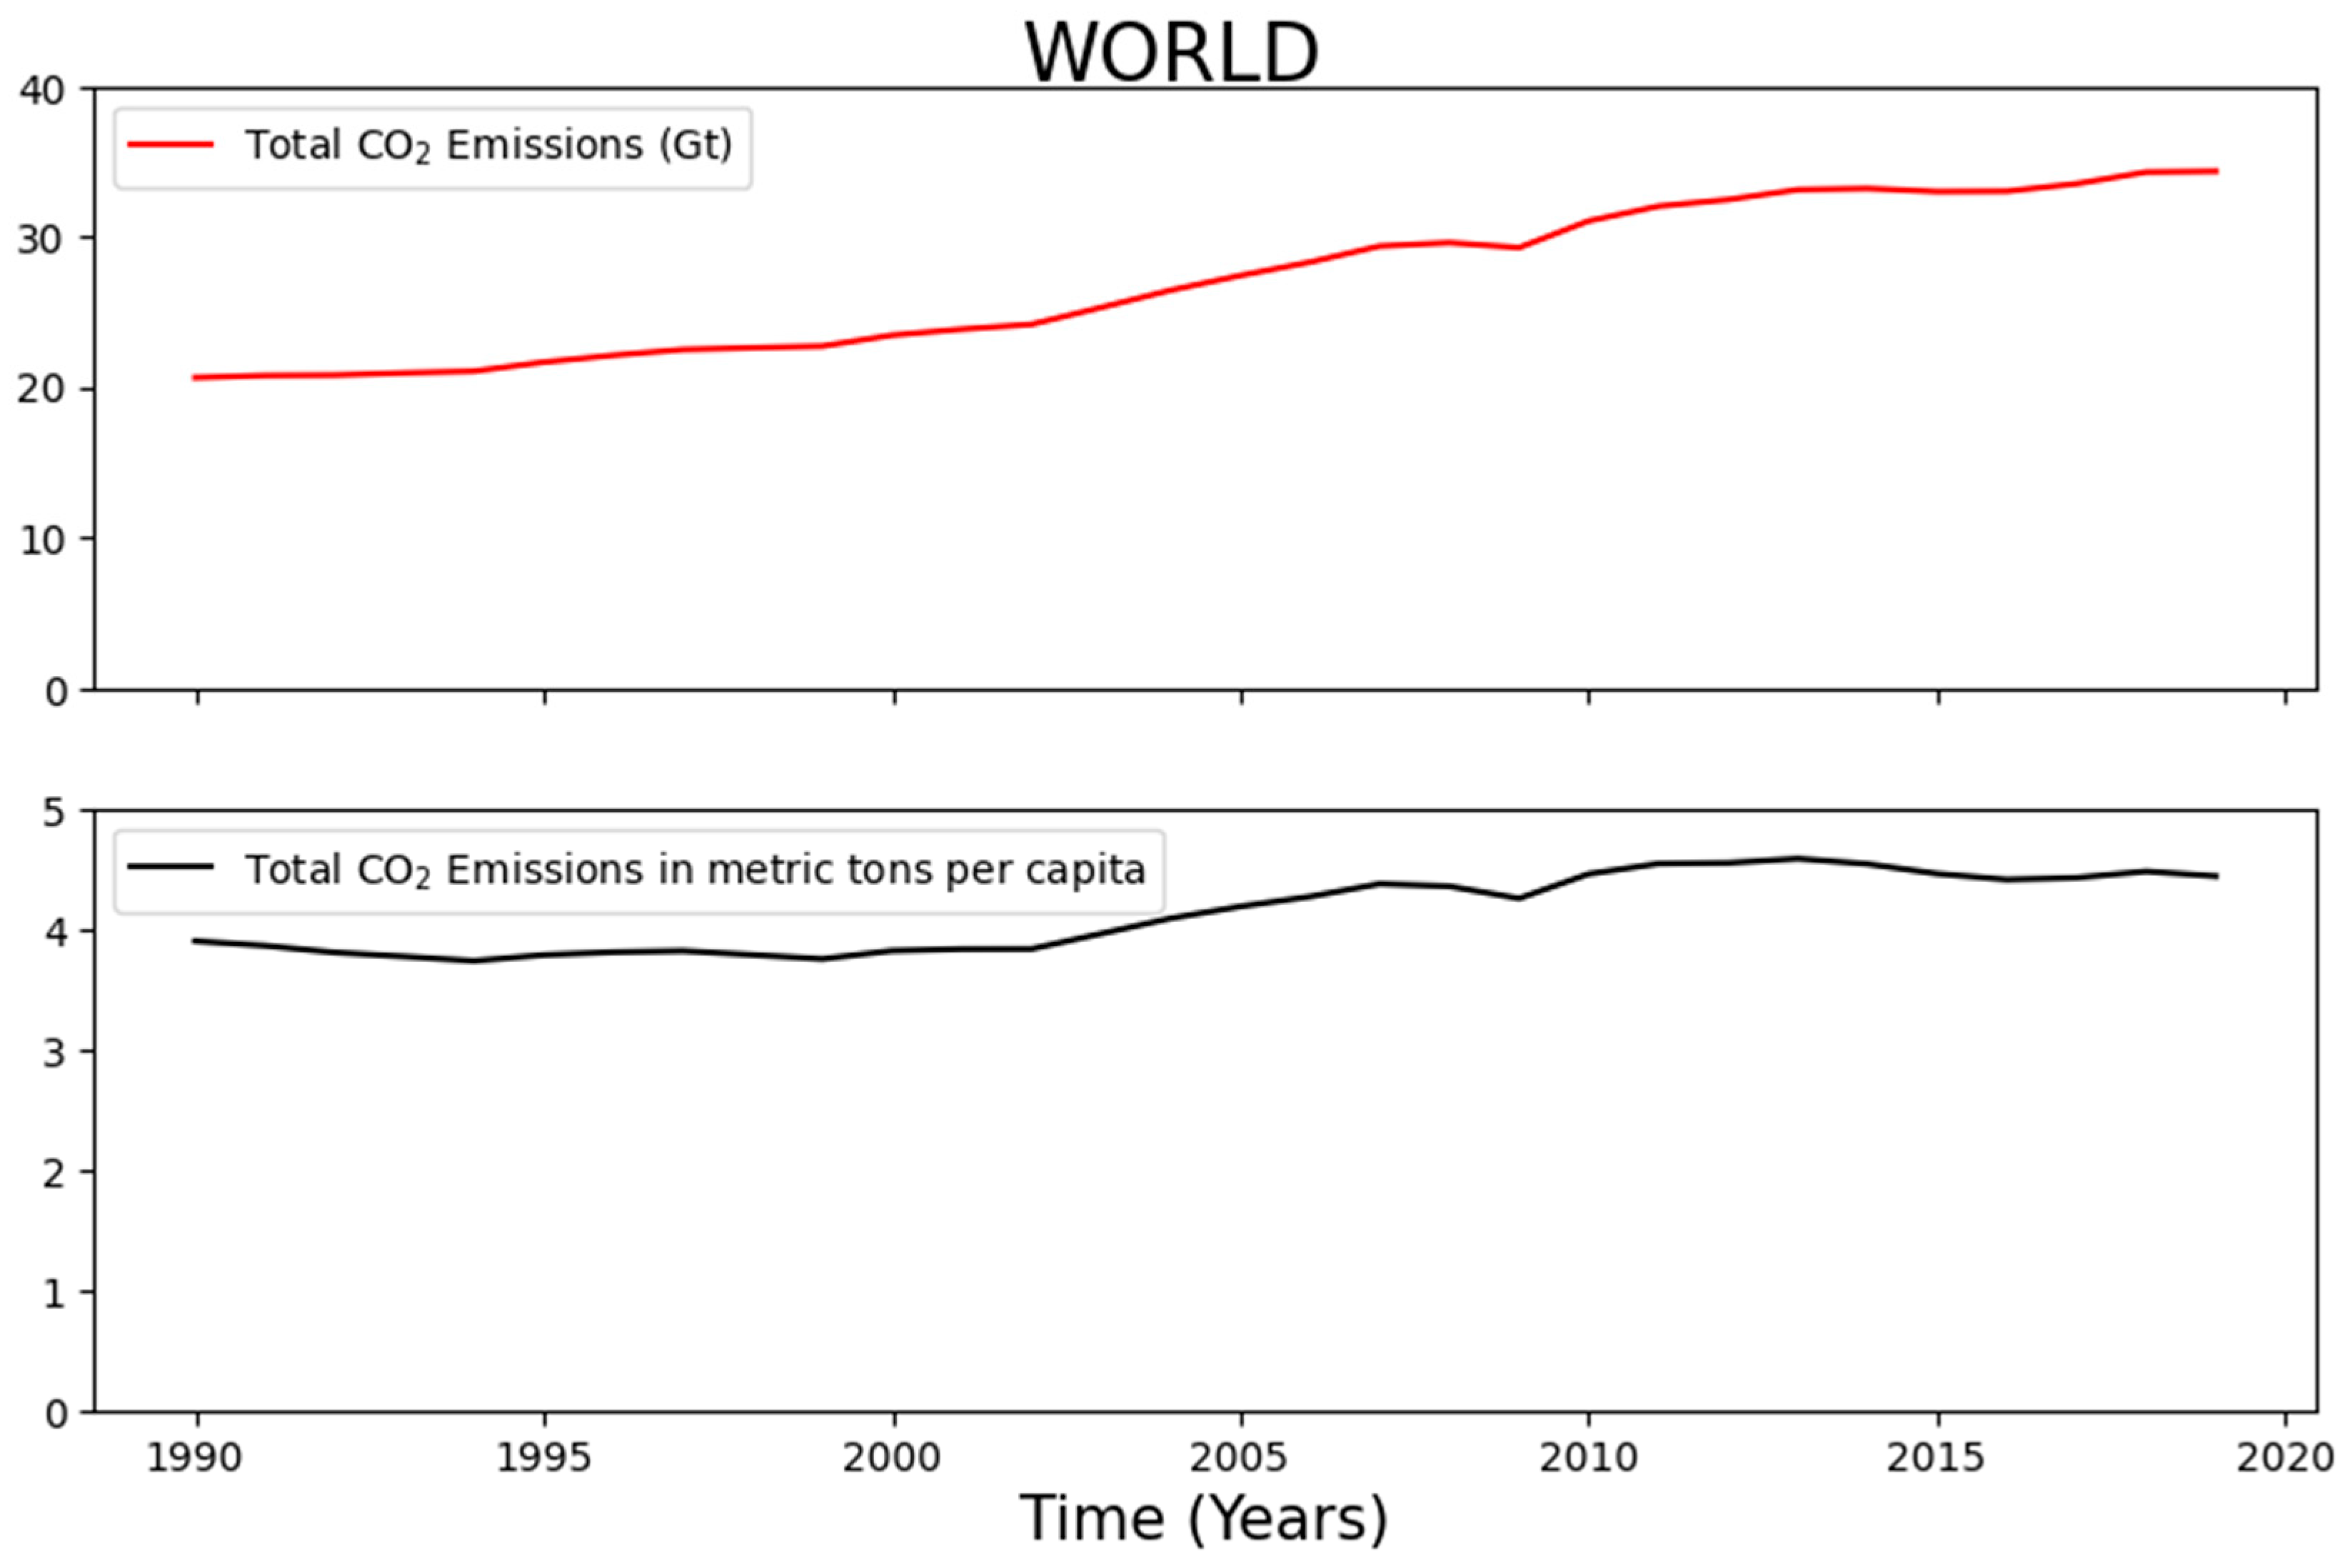
Figure 9.
Total carbon emission trend in billion metric tons (Gt) and carbon emission in metric tons per capita (t/cap) for the world.
Figure 9.
Total carbon emission trend in billion metric tons (Gt) and carbon emission in metric tons per capita (t/cap) for the world.
6. Future Direction for the Development of Nigeria’s Carbon Credit System for Climate Change Mitigation
The section intends to pin-point applicable processes and components in the aforementioned carbon credit systems, that are of applicable use to the Nigerian environment. The nation will not be evaluated ideally, but rather on the observable characteristics peculiar and unique to the context of this section.
6.1. Possibilities on Nigeria’s Carbon Emission Trading
From 2007 to 2017, Nigeria’s CO2 related emissions increased by 3.1% and 0.3% in total and per capita (annually), respectively. Of the CO2 emissions, biofuels were responsible for 86.2% of total emissions for energy use in 2017, a reduction of 3.4% from 2007. Whereas, gasoline (the most used fossil fuel in Nigeria) accounted for 6.3 % of total emissions in 2017 as compared to 4.1% in 2007 (OECD 2018). Also, hydropower which was responsible for 0.3% of primary energy use in 2017, underwent a drastic reduction compared to the 2007 measure of 0.5%. Nigeria possesses no carbon emission trading system, and has no specific taxes on energy use. In 2018, the net energy tax revenues in Nigeria were negative and comprised 0.8% of the nation’s GDP, adversely affecting the nation’s domestic resource mobilisation via its energy use (OECD 2018). Such poor revenue can be attributed to the low fuel and electricity excise taxes revenue in Nigeria GDP which is lower than OECD averages; and the high electricity subsidies which are higher than OECD averages (OECD 2018)
In 2018, 38.2% of Nigeria’s GHG emissions were sourced from land use charge and the forestry sector followed by energy, waste, agriculture and industrial processes accounting for 32.6%, 14.0%, 13.0% and 2.1 % respectively of Nigeria’s yearly GHG emission (OECD 2018). This reflects the enormous potential in structuring the country’s carbon market and resultant carbon price reform. A review of several nation’s successful carbon credit reforms reveals a uniqueness to each country, wherein some countries have exploited the Kyoto Protocol in instituting a compliance market, others have implemented a voluntary market, with some operating regional schemes or implementing simple carbon taxes. These policies though similar in some measure, possess their own unique traits due to the distinct circumstances of political and economic factors peculiar to each region. These policies have contributed to the significant strides made towards effecting a reduction in GHG emission, some more than others.
It is advised that the nation operates an emission trading scheme focused on land use and forestry, metal mining and production; and include a sub-regional scheme across the South-South geo-political zone, covering oil exploration companies. The carbon credit scheme will cover oil exploration companies predominantly situated in the Niger Delta region including Shell Nigeria, Chevron and ExxonMobil, etc. Focusing on other sectors of the economy such as Agriculture and Transportation via an implemented trading scheme will prove difficult as Nigeria relies heavily on PMS and its other derivatives for energy (Ighosewe et al. 2021). In creating the carbon market policy which will cater to Nigeria’s specific needs, the following steps are required:
- Contemplation on the carbon market type: The government should implement an Emission Trading Scheme as a market-based policy with the Ministries of Environment, Technology, Finance, Energy and Power; drafting a bill geared at reducing GHG emissions from oil exploration, mining and metal production, by tagging prices to such pollutions. The companies in such industries will be mandated by law to purchase units in offsetting any emission above their capped level. There should be a stipulated measurement equating the purchased Nigerian credit units to some specified measure of CO2 or any similar greenhouse gas. The unit’s equivalent can be reformed depending on impact level, as these will be allocated by the Government in the manner of their choosing. These units are then traded in the nations carbon market (Zhou and Li 2019; ANZ Research 2021)
- ii. Setting an Emission Budget: The Government should agree on an emissions budget spanning half a decade in tonnes of CO2 equivalents. With further progression, it is possible to involve the agricultural sector under the scheme. However, for its implemental stage it is important that stability and fluidity be achieved. Nevertheless, in the future the Agricultural sector can be involved via a separate account system of trading as the major GHG emission is primarily CH4 (methane), which has a shorter dissipation time than CO2 (Van den Berg et al. 2020)
- Structuring Market Participation: Market participation should be made compulsory for certain industries, because whilst some generate credits for trade, others will require these credits to offset their emission. Industries that must participate in this trade are the metal mining and production, oil exploration, and waste disposal as they emit GHG and will need credits to offset their emissions. Focus on land use and forestry in Nigeria generates credits as vegetation stores and captures carbon through sequestration (Sankar, 2020). However, sequestration rate is dependent on growth speed of vegetation, and evidence shows that some plants have higher sequestration rates than others (Anikwe 2010).
-
Allocation methods: Nigeria can implement any of the following allocating methods:
- Earnings: Companies with proven sequestered CO2 will receive credit units. These will most likely be earned by landowners (peatlands) and tree planters.
- Free Allocation: There can be free allocation to some industries where the products cost will definitely increase in order for the companies to offset their carbon emission especially industrial production and agriculture. Increased expenditure arising from carbon offsets is very likely to increase the cost of their products. Moreover, competition with international organisations producing the same products will be the primary obstacle in adding such expenditure to product cost for buyers. Concerning the land use, it is possible that free units can be obtained by fishing and wood resource intensive industries.
- Buying: The companies and industries emitting GHGs and included in the ETS, are mandated to purchase units from the market or in the secondary government (Jiang et al. 2009; ANZ Research 2021)
6.2. Structuring the Nigerian Trading Markets
The credits units may be purchased directly from the Federal Government through auctions every four months or from a secondary market. Every third-quarter of the year will have a specified total sale which will deliberately be lower than the average needed units but not too low, to permit trading in the secondary market. To regulate the market, the Federal Government will need to structure and streamline its own carbon credits policy. The policy can be streamlined to be similar to the EU-ETS’ auctioning policy of the allowances being auctioned at its European Energy Exchange (EEX). The creation of such an exchange allows for strengthening of the naira and government control towards companies purchasing the credits.
Moreover, New Zealand government has an undisclosed reserve price, which ensures market stability at a floor price of $20 and the ceiling price of $50 (Leining and Kerr 2016; ANZ Research 2021). In the scenario, where the price is breached, there is a resultant effect releasing more units via a cost containment reserve policy. A crucial problem to the trading factor will be the foreign exchange pricing as the Naira is suffering a devaluation to the equivalent of over N1800 to $1 (CBN 2024). Nevertheless, it is important that Nigeria’s internal carbon trading be done in Naira, not necessarily in a dollar equivalent sense, but in a manner that is strengthening to the naira currency which will require the involvement of the Ministry of Finance and the Nation’s Central Bank.
The secondary markets serve the purpose of over-the-counter units trading. Developing a secondary market in Nigeria will be challenging as it will require contractual agreements between buyers and sellers, that necessitates real time pricing information for the units. These trade prices will fluctuate as they are definitely subject to the demand and supply factors, other possible factors of influence could be the removal of Federal Government subsidy, electricity tariffs and usage, sequestration rates in existing vegetation (Sankar 2020).
6.3. Feasibility of a Carbon Trading System in Nigeria
A critical view of Nigeria’s infrastructure and economy, reveals that the creation of a carbon system will be met with resistance either on the political front, or in the bill and policy compliance area. In the likelihood such a bill is passed with the majority of Senate votes, ensuring compliance of companies will require a close monitoring by a new regulatory commission possibly requiring the integration of several ministries in creating a robust quality assurance and monitoring framework. Their objective is ensuring that all policies are strictly adhered to and the penalties meted out are stringent enough to discourage any deviation. In a country such as Nigeria, the mind-set concerning full adherence to policies is poor.
A full comprehension on the aspect of additionality is crucial to the success of any nations carbon credit system. Additionality is a feature in GHG reduction where the GHG emission would not be existent without a market for credit offsets. This criterion is critical to the acceptance of any trading scheme under the CDM and necessary to its long-term function and success (Müller 2022). Therefore, concerning projects beyond governments pre-set goals, it can be difficult to accurately prove the additionality of a conservation project. The aforementioned needs of a regulatory committee are to handle the possibility of many companies falsely claiming offset credits. The most obvious consequence are emissions being falsely offset in a sector and created in another (Sankar 2020).
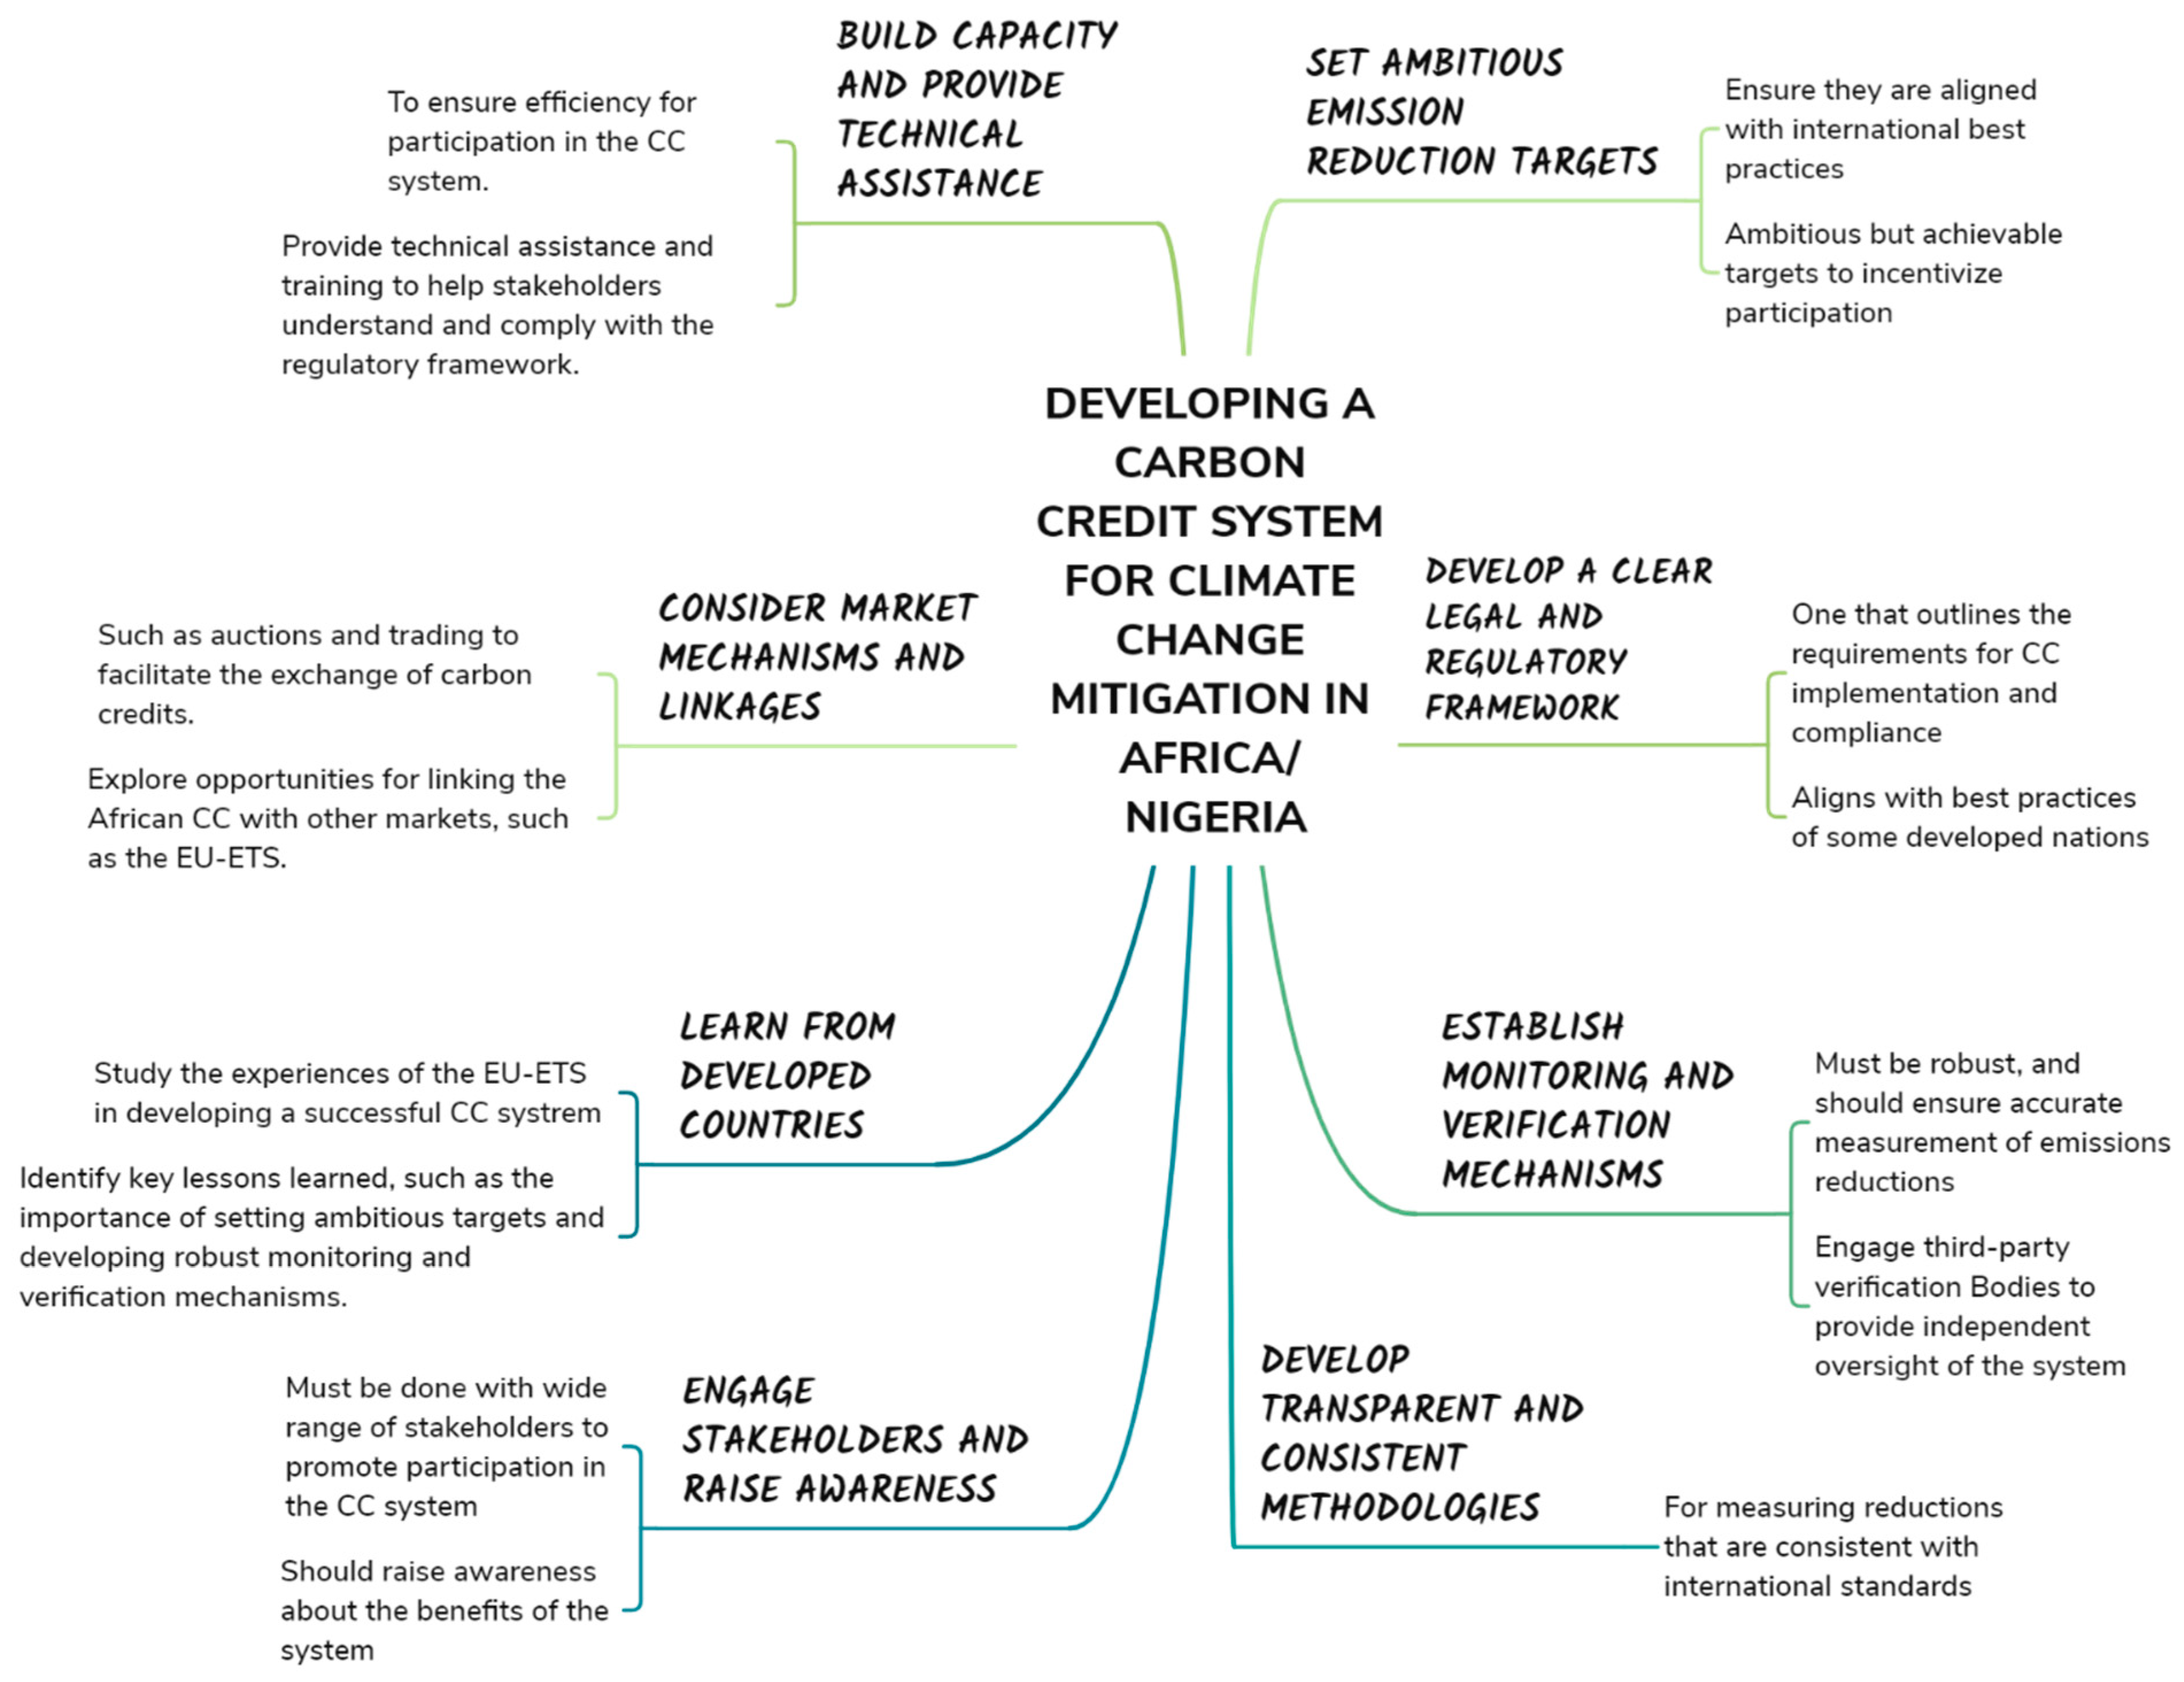
Moreover, factoring the privatisation of the power generation and distribution sectors of the economy and the imminent privatisation of the oil refinery as seen in the construction and completion of the Dangote oil refinery. Corruption could make the government claim a conservation project as additional when in truth it is not. This is possible in Nigeria where private companies are responsible for generation and distribution, whilst the government is responsible for transmission. Thus, emphasising an appropriate alignment of incentives and due diligence to policies, is necessary in avoiding the likelihood of emission increase; as the emphasis of carbon trading is primarily on reducing GHG emissions, making money should be a secondary aim. Therefore, for full efficacy, the Nigerian Federal Government will need to improve its renewable energy scheme implementation, support and development. Figure 9 utilises a mind map illustration to outline the possible approaches for each required aspect of facilitating Nigeria’s carbon credit system.
Figure 9.
Strategies to developing a sustainable CC system in Nigeria.
7. Knowledge Gaps in the Study and Prospects for Future Research and Development
The development of a sustainable carbon credit system in Nigeria and Africa confronts considerable hurdles, owing to a lack of study and data. A significant knowledge gap exists in the absence of complete data on carbon emissions from sectors such as energy, transportation, agriculture, and manufacturing. This limits accurate emission estimates and the identification of large polluting sources, making it difficult to develop efficient carbon credit systems that promote reductions in high-emission sectors (Bayer and Aklin 2020), Addressing this requires additional study to estimate emissions across all industries.
Another literature gap is a lack of understanding of the economic, social, and political issues that influence the use of carbon credit systems. Carbon credit systems are very new in Africa, and more research is needed to determine how they might be integrated into current structures and regulations. This includes looking into how economic incentives, cultural attitudes, and political factors influence the success of these systems. Furthermore, the influence of carbon credits on poverty reduction, employment, and income inequality is unknown. Some research suggests that these systems could boost economic growth, while others warn that they may aggravate inequality (Haites 2018)(Wang et al. 2019); (Zhang and Zhang 2020). To guarantee that carbon credit schemes provide equitable benefits, researchers must investigate these potential trade-offs.
There is also inadequate evidence on the efficiency of various carbon credit schemes, such as cap-and-trade and offset programs, in African contexts. While these models have been effective elsewhere, their success in Africa is unknown (Jindal et al. 2008). Furthermore, threats including carbon leakage, corruption, and fraud jeopardize the integrity of these systems. Research is required to develop strong monitoring and verification techniques that might reduce such hazards while maintaining transparency.
Another area for investigation is the influence of international bodies such as the United Nations Framework Convention on Climate Change (UNFCCC) in promoting carbon credit development in Africa. Assessing how these organizations may give financial and technical assistance while also promoting regional and global markets is critical for long-term success. Furthermore, public acceptance of carbon pricing methods, which is sometimes hampered by energy price rises and tax revisions, must be investigated to assure policy success, especially in low-income countries (Mayer et al. 2021).
Finally, the consequences of the Krutu of Paramaribo Joint Declaration on HFLD Climate Finance Mobilization require additional investigation. The declaration, adopted in 2018 by 27 nations to encourage sustainable management of high-forest, low-deforestation (HFLD) areas, questions the adequacy of current REDD+ investments (Pirker et al. 2019). Understanding how this declaration affects carbon credit development in Africa is crucial for advancing climate finance and achieving sustainable development goals (SDG).
8. Recommendations
Based on the gaps in knowledge identified and the prospects for research, the following recommendations are proposed:
- Governments in the region should prioritize collecting and disseminating data on carbon emissions and mitigation activities. This will enable researchers to understand the emissions sources better and design targeted mitigation strategies.
- Governments in the region should sponsor research on the economic, social, and political factors that influence the adoption and implementation of carbon credit systems. This research should focus on identifying the most effective policy and institutional frameworks for promoting the uptake of carbon credit systems.
- Researchers should conduct more in-depth studies on the potential impacts of carbon credit systems on poverty reduction, employment, and income inequality in local communities. This will enable the development of carbon credit systems designed to maximize their benefits for local communities and minimize any negative impacts.
- Comparative research on the effectiveness of different types of carbon credit schemes should be conducted to identify the most effective strategies in other contexts.
- Research should be conducted on the potential risks and challenges associated with implementing carbon credit systems in Africa, and strategies should be developed to mitigate these risks.
- Finally, international organizations such as the UNFCCC should continue to support the development of sustainable carbon credit systems in Africa through funding and capacity-building initiatives.
9. Conclusion
While climate change remains a major global and African topic, adopting and developing a sustainable carbon credit system has been a major challenge in Africa, particularly Nigeria. These challenge stems from inadequate leadership, poor implementation strategies, lacking education and research in the region. The study buttresses the current carbon trading system in some African countries. It went further to analyse data which showed that carbon emission remains a significant concern in both Nigeria and the sub-Sharan African region. A global review of the carbon trading systems of significant countries with better systems were given in detail. Developing a sustainable carbon credit system for climate change mitigation in Nigeria, West Africa and Africa is a critical research and action area requiring urgent attention.
Through the course of this review, several knowledge gaps have been identified, including; the lack of data on carbon emissions in different industries and sectors; limited understanding of the economic, social, and political factors that influence the adoption and implementation of carbon credit systems; inadequate knowledge of the potential impacts of carbon credit systems on poverty reduction, employment, and income inequality; insufficient research on the effectiveness of different types of carbon credit schemes; and limited understanding of the potential risks and challenges associated with their implementation. Based on the research findings, the review has outlined recommendations that will enable policymakers and researchers to focus on developing a comprehensive and integrated approach towards mitigating climate change and achieving sustainable development goals (SDG) in the region.
In conclusion, developing a sustainable carbon credit system for climate change mitigation in Nigeria and Africa at large, is critical in achieving the Paris Agreement’s goals, promoting sustainable development, and reducing poverty and inequality in the region. This review intends to stimulate further research and action on this critical topic, and seeks to urge policymakers, researchers, and civil society organizations in taking cooperative action towards developing innovative and practical solutions to this pressing global challenge.
Author Contributions
Statement: I.I. Okey and E.P Agbo: Conceptualization, Data Curation and analysis, Methodology, Software; Visualization, Writing - original draft. G.C Offorson: Writing – original draft, writing – reviewing and editing. J. O. Bassey and M. A. Okono: Project administration, Writing – review and editing. N.O Offiong: Supervision, Resources, Writing – review and editing. All authors read and approved the final version of the manuscript.
Funding
This research did not receive any specific grant from funding agencies in the public, commercial, or not-for-profit sectors.
Data Availability
Data can be search for and obtained from https://ourworldindata.org/
Competing Interest
The authors declare no competing interests to disclose.
Code Availability
Codes for visualization will be made available on request
Declaration of Competing Interests
The authors declare that they have no known competing financial interests or personal relationships that could have appeared to influence the work reported in this paper.
References
- Adenle, A.A.; Manning, D.T.; Arbiol, J. Mitigating Climate Change in Africa: Barriers to Financing Low-Carbon Development. World Dev. 2017, 100, 123–132. [Google Scholar] [CrossRef]
- Africa Development Bank (2019a) Liberia Economic Outlook. In: African Development Bank - Building today, a better Africa tomorrow. https://www.afdb.org/en/countries/west-africa/liberia/liberia-economic-outlook. 2023.
- Africa Development Bank (2019b) Togo Economic Outlook. In: African Development Bank - Building today, a better Africa tomorrow. https://www.afdb.org/en/countries-west-africa-togo/togo-economic-outlook. 2023.
- Africa Renewal (2021) Gabon becomes the first African country to receive payment for reducing CO2 emissions. In: Africa Renewal. https://www.un.org/africarenewal/magazine/july-2021/gabon-becomes-first-african-country-receive-payment-reducing-co2-emissions. 2023.
- African Development bank (2021) West African Countries’ ITMO Readiness Scoping Assessment. In: African Development Bank - Building today, a better Africa tomorrow. https://www.afdb.org/en/documents/west-african-countries-itmo-readiness-scoping-assessment. 2023.
- Agbo, E.P.; Edet, C.O. Meteorological analysis of the relationship between climatic parameters: understanding the dynamics of the troposphere. Theor. Appl. Clim. 2022, 150, 1677–1698. [Google Scholar] [CrossRef]
- Agbo, E.; Edet, C.; Magu, T.; Njok, A.; Ekpo, C.; Louis, H. Solar energy: A panacea for the electricity generation crisis in Nigeria. Heliyon 2021, 7, e07016. [Google Scholar] [CrossRef] [PubMed]
- Agbo, E.P.; Ekpo, C.M.; Edet, C.O. Analysis of the effects of meteorological parameters on radio refractivity, equivalent potential temperature and field strength via Mann-Kendall test. Theor. Appl. Clim. 2021, 143, 1437–1456. [Google Scholar] [CrossRef]
- Alton, T.; Arndt, C.; Davies, R.; Hartley, F.; Makrelov, K.; Thurlow, J.; Ubogu, D. Introducing carbon taxes in South Africa. Appl. Energy 2014, 116, 344–354. [Google Scholar] [CrossRef]
- Anikwe, M.A. Carbon storage in soils of Southeastern Nigeria under different management practices. Carbon Balance Manag. 2010, 5, 5–5. [Google Scholar] [CrossRef]
- Anser, M.K.; Khan, M.A.; Nassani, A.A.; Aldakhil, A.M.; Voo, X.H.; Zaman, K. Relationship of environment with technological innovation, carbon pricing, renewable energy, and global food production. Econ. Innov. New Technol. 2020, 30, 807–842. [Google Scholar] [CrossRef]
- ANZ Research (2021) NZ Insight: The NZ carbon market.
- Armstrong AK, Krasny ME, Schuldt JP (2018) Communicating climate change: A guide for educators.
- Bayer, P.; Aklin, M. The European Union Emissions Trading System reduced CO 2 emissions despite low prices. Proc. Natl. Acad. Sci. 2020, 117, 8804–8812. [Google Scholar] [CrossRef]
- Bernstein, S.; Betsill, M.; Hoffmann, M.; Paterson, M. A Tale of Two Copenhagens: Carbon Markets and Climate Governance. Millenn. J. Int. Stud. 2010, 39, 161–173. [Google Scholar] [CrossRef]
- Berretta A (2020) Carbon Pricing in Sub-Saharan Africa. In: Regional Programme Energy Security and Climate Change in Sub-Saharan Africa. https://www.kas.de/en/web/climate-energy-africa/single-title/-/content/carbon-pricing-in-sub-saharan-africa-1. 2023.
- Biedenkopf K, Wettestad J (2017) South Korea: East Asian pioneer learning from the EU. In: The Evolution of Carbon Markets.
- Bose A, Cohen J, Fattouh B, et al (2021) Voluntary markets for carbon offsets: Evolution and lessons for the LNG market. E: OIES Paper.
- CBN (2024) Central Bank of Nigeria: Money and Credit Statistics. In: Central Bank of Nigeria. https://www.cbn.gov.ng/rates/inflrates.asp. 2024.
- Chanchangi, Y.N.; Adu, F.; Ghosh, A.; Sundaram, S.; Mallick, T.K. Nigeria's energy review: Focusing on solar energy potential and penetration. Environ. Dev. Sustain. 2022, 25, 5755–5796. [Google Scholar] [CrossRef]
- Chomba, S.; Kariuki, J.; Lund, J.F.; Sinclair, F. Roots of inequity: How the implementation of REDD+ reinforces past injustices. Land Use Policy 2016, 50, 202–213. [Google Scholar] [CrossRef]
- Cui, L.-B.; Fan, Y.; Zhu, L.; Bi, Q.-H. How will the emissions trading scheme save cost for achieving China’s 2020 carbon intensity reduction target? Appl. Energy 2014, 136, 1043–1052. [Google Scholar] [CrossRef]
- Edomah, N.; Ndulue, G.; Lemaire, X. A review of stakeholders and interventions in Nigeria's electricity sector. Heliyon 2021, 7, e07956. [Google Scholar] [CrossRef]
- Espelage A, Ahonen H-M, Michaelowa A (2022) The role of carbon market mechanisms in climate finance. In: Handbook of International Climate Finance. Edward Elgar Publishing, pp 352–378.
- Eweka, E.E.; Lopez-Arroyo, E.; Medupin, C.O.; Oladipo, A.; Campos, L.C. Energy Landscape and Renewable Energy Resources in Nigeria: A Review. Energies 2022, 15, 5514. [Google Scholar] [CrossRef]
- Falchetta, G.; Pachauri, S.; Parkinson, S.; Byers, E. A high-resolution gridded dataset to assess electrification in sub-Saharan Africa. Sci. Data 2019, 6, 110. [Google Scholar] [CrossRef]
- E: F, Nakyambadde D (2020) Vehicle Import Restrictions to Curb Emissions, 2020.
- García-Freites, S.; Gough, C.; Röder, M. The greenhouse gas removal potential of bioenergy with carbon capture and storage (BECCS) to support the UK's net-zero emission target. Biomass- Bioenergy 2021, 151. [Google Scholar] [CrossRef]
- Gasparatos A, Lee LY, Von Maltitz GP, et al (2012) Biofuels in Africa: impacts on ecosystem services, biodiversity and human well-being.
- Ghana News (2023) Ghana Receives Carbon Emissions Reduction Payments. In: Ghanamma.com. https://www.ghanamma.com/2023/01/26/ghana-receives-carbon-emissions-reduction-payments/. 2023.
- Goldstein A (2016) Not So Niche: Co-benefits at the intersection of forest carbon and sustainable development.
- Green, J.F. Beyond Carbon Pricing: Tax Reform is Climate Policy. Glob. Policy 2021, 12, 372–379. [Google Scholar] [CrossRef]
- Haites, E. Carbon taxes and greenhouse gas emissions trading systems: what have we learned? Clim. Policy 2018, 18, 955–966. [Google Scholar] [CrossRef]
- Hepburn, C. Carbon Trading: A Review of the Kyoto Mechanisms. Annu. Rev. Environ. Resour. 2007, 32, 375–393. [Google Scholar] [CrossRef]
- Howie, P.; Gupta, S.; Park, H.; Akmetov, D. Evaluating policy success of emissions trading schemes in emerging economies: comparing the experiences of Korea and Kazakhstan. Clim. Policy 2020, 20, 577–592. [Google Scholar] [CrossRef]
- Hyun J, Oh H (2015) Korea’s Emission Trading System: An Attempt of Non-Annex I Party Countries to Reduce GHG Emissions Voluntarily. 2: Retrieved from, 3 February 2019.
- A: (2016) KAZAKHSTAN, 2016.
- Ighosewe, E.F.; Akan, D.C.; Agbogun, O.E. Crude Oil Price Dwindling and the Nigerian Economy: A Resource-Dependence Approach. Mod. Econ. 2021, 12, 1160–1184. [Google Scholar] [CrossRef]
- 2022.
- Jiang, N.; Sharp, B.; Sheng, M. New Zealand's emissions trading scheme. New Zealand Econ. Pap. 2009, 43, 69–79. [Google Scholar] [CrossRef]
- Jindal, R.; Swallow, B.; Kerr, J. Forestry-based carbon sequestration projects in Africa: Potential benefits and challenges. Nat. Resour. Forum 2008, 32, 116–130. [Google Scholar] [CrossRef]
- T: M, SJ AY (2017) Zambia V, 2017.
- 2017.
- 2019.
- Kene-Okafor T (2021) Nigerian digital bank Carbon hit $240M in payments processed last year, up 89% from 2019. https://techcrunch.com/2021/02/01/nigerian-digital-bank-carbon-hit-240m-in-payments-processed-last-year-up-89-from-2019/. 2023.
- King, L.C.; Bergh, J.C.J.M.v.D. Potential carbon leakage under the Paris Agreement. Clim. Chang. 2021, 165, 1–19. [Google Scholar] [CrossRef]
- Kirikkaleli, D.; Adebayo, T.S. Do renewable energy consumption and financial development matter for environmental sustainability? New global evidence. Sustain. Dev. 2020, 29, 583–594. [Google Scholar] [CrossRef]
- Kobayashi N (2016) Carbon Credit Current Trend and REDD+ Projects. Tropical Peatland Ecosystems 585–598.
- Kollmuss A, Zink H, Polycarp C (2008) Making sense of the voluntary carbon market: A comparison of carbon offset standards.
- Lamb, W.F.; Minx, J.C. The political economy of national climate policy: Architectures of constraint and a typology of countries. Energy Res. Soc. Sci. 2020, 64. [Google Scholar] [CrossRef]
- Law G (2021) Carbon markets in Australia and overseas. In: Gilbert Tobin. https://www.gtlaw.com.au/insights/carbon-markets-australia-overseas-2021. 2023.
- Leining, C. ; Motu Economic and Public Policy Research; Kerr, S.
- Liu, L.; Chen, C.; Zhao, Y.; Zhao, E. China׳s carbon-emissions trading: Overview, challenges and future. Renew. Sustain. Energy Rev. 2015, 49, 254–266. [Google Scholar] [CrossRef]
- MacGrath M (2021) Fighting climate change: what are carbon credits. In: Davy. https://www.davy.ie/market-and-insights/insights/marketwatch/2021/july-2021/what-are-carbon-credits.html. 2023.
- Maraseni, T.; Reardon-Smith, K. Meeting National Emissions Reduction Obligations: A Case Study of Australia. Energies 2019, 12. [Google Scholar] [CrossRef]
- Mayer, J.; Dugan, A.; Bachner, G.; Steininger, K.W. Is carbon pricing regressive? Insights from a recursive-dynamic CGE analysis with heterogeneous households for Austria. Energy Econ. 2021, 104. [Google Scholar] [CrossRef]
- Meadows D, Vis P, Zapfel P (2019) The EU emissions trading system.
- 2021.
- Michaelowa, A.; Michaelowa, K.; Shishlov, I.; Brescia, D. Catalysing private and public action for climate change mitigation: the World Bank’s role in international carbon markets. Clim. Policy 2020, 21, 120–132. [Google Scholar] [CrossRef]
- A: C (2022) Rethinking voluntary carbon credit markets and the EU ETS, 2022.
- B: J, Kennedy S (2021) China’s New National Carbon Trading Market, 2021.
- Narassimhan, E.; Gallagher, K.S.; Koester, S.; Alejo, J.R. Carbon pricing in practice: a review of existing emissions trading systems. Clim. Policy 2018, 18, 967–991. [Google Scholar] [CrossRef]
- Newell, R.G.; A Pizer, W.; Raimi, D. Carbon Markets 15 Years after Kyoto: Lessons Learned, New Challenges. J. Econ. Perspect. 2013, 27, 123–146. [Google Scholar] [CrossRef]
- Nurgaliyeva, K.O.; Amirova, A.U.; Nurtazinova, A.S. The Green Economy in Market-Oriented Countries: The Case of Kazakhstan. J. Environ. Manag. Tour. 2019, 9, 1019–1029. [Google Scholar] [CrossRef]
- O: (2018) Taxing Energy use for Sustainable Development in Nigeria, 2018.
- Ufua, D.E.; Olokundun, M.; Olujobi, O.M. Conversion of organic wastes to electricity in Nigeria: legal perspective on the challenges and prospects. Int. J. Environ. Sci. Technol. 2021, 19, 939–950. [Google Scholar] [CrossRef]
- Njenga, P.; Opiyo, R. Transitioning to Electric Mobility: Low Hanging Fruits in the Two and Three-Wheeler Public Transport Market in Kenya. Eur. Bus. Law Rev. 2023, 34, 35–46. [Google Scholar] [CrossRef]
- Osuret, J.; Namatovu, S.; Biribawa, C.; Balugaba, B.E.; Zziwa, E.B.; Muni, K.; Ningwa, A.; Oporia, F.; Mutto, M.; Kyamanywa, P.; et al. State of pedestrian road safety in Uganda: a qualitative study of existing interventions. Afr. Heal. Sci. 2021, 21, 1498–1506. [Google Scholar] [CrossRef]
- Owusu PA, Asumadu-Sarkodie S (2016) A review of renewable energy sources, sustainability issues and climate change mitigation. 1: Cogent Engineering 3, 1167.
- Pirani S (2018) Burning up: A global history of fossil fuel consumption.
- Pirker, J.; Mosnier, A.; Nana, T.; Dees, M.; Momo, A.; Muys, B.; Kraxner, F.; Siwe, R. Determining a Carbon Reference Level for a High-Forest-Low-Deforestation Country. Forests 2019, 10, 1095. [Google Scholar] [CrossRef]
- Price R (2020) Lessons learned from carbon pricing in developing countries.
- Rajaeifar, M.A.; Ghanavati, H.; Dashti, B.B.; Heijungs, R.; Aghbashlo, M.; Tabatabaei, M. Electricity generation and GHG emission reduction potentials through different municipal solid waste management technologies: A comparative review. Renew. Sustain. Energy Rev. 2017, 79, 414–439. [Google Scholar] [CrossRef]
- Rumble O, Gilder A (2022) Climate change mitigation law and policy in Africa. In: Research Handbook on Climate Change Mitigation Law. Edward Elgar Publishing, pp 240–261.
- Sacherer A-K, Hoch S, Dalfiume S, Kassaye R (2022) Financing forest conservation and restoration through climate policy instruments: lessons from the CDM and REDD+. In: Handbook of International Climate Finance. Edward Elgar Publishing, pp 293–317.
- Sankar G (2020) Supply and Demand Evolution in the Voluntary Carbon Credit Market.
- Satola, D.; Wiberg, A.H.; Singh, M.; Babu, S.; James, B.; Dixit, M.; Sharston, R.; Grynberg, Y.; Gustavsen, A. Comparative review of international approaches to net-zero buildings: Knowledge-sharing initiative to develop design strategies for greenhouse gas emissions reduction. Energy Sustain. Dev. 2022, 71, 291–306. [Google Scholar] [CrossRef]
- Seddon, N.; Smith, A.; Smith, P.; Key, I.; Chausson, A.; Girardin, C.; House, J.; Srivastava, S.; Turner, B. Getting the message right on nature-based solutions to climate change. Glob. Chang. Biol. 2021, 27, 1518–1546. [Google Scholar] [CrossRef]
- Shaw L (2019) Turning the Lights On in Liberia Through Off-Grid Innovation. 9: Africa Policy Journal 14.
- Spash, C.L. The Brave New World of Carbon Trading. New Politi- Econ. 2010, 15, 169–195. [Google Scholar] [CrossRef]
- Suk, S.; Lee, S.; Jeong, Y.S. The Korean emissions trading scheme: business perspectives on the early years of operations. Clim. Policy 2017, 18, 715–728. [Google Scholar] [CrossRef]
- Sustainable Economy Nigeria (2023) Low-carbon investments to rise by $60bn in 2023 as inflation weakens. In: Sustainable Economy Nigeria. https://sustainableeconomyng.com/low-carbon-investments-to-rise-by-60bn-in-2023-as-inflation-weakens/. 2023.
- Teye JK (2022) Migration in West Africa: IMISCOE Regional Reader.
- To, L.S.; Seebaluck, V.; Leach, M. Future energy transitions for bagasse cogeneration: Lessons from multi-level and policy innovations in Mauritius. Energy Res. Soc. Sci. 2018, 35, 68–77. [Google Scholar] [CrossRef]
- Uhunamure, S.; Nethengwe, N.; Tinarwo, D. Correlating the factors influencing household decisions on adoption and utilisation of biogas technology in South Africa. Renew. Sustain. Energy Rev. 2019, 107, 264–273. [Google Scholar] [CrossRef]
- Upston-Hooper, K.; Swartz, J. Emissions Trading in Kazakhstan: Challenges and Issues of Developing an Emissions Trading Scheme. Carbon Clim. Law Rev. 2013, 7, 71–73. [Google Scholar] [CrossRef]
- Van den Berg NJ, van Soest HL, Hof AF, et al (2020) Implications of various effort-sharing approaches for national carbon budgets and emission pathways. 1: Climatic Change 162, 1805.
- Van Heerden, J.; Blignaut, J.; Bohlmann, H.; Cartwright, A.; Diederichs, N.; Mander, M. The economic and environmental effects of a carbon tax in South Africa: A dynamic CGE modelling approach. South Afr. J. Econ. Manag. Sci. 2016, 19, 714–732. [Google Scholar] [CrossRef]
- Wang, H.; Chen, Z.; Wu, X.; Nie, X. Can a carbon trading system promote the transformation of a low-carbon economy under the framework of the porter hypothesis? —Empirical analysis based on the PSM-DID method. Energy Policy 2019, 129, 930–938. [Google Scholar] [CrossRef]
- Weng, Y.; Touzeau, A.; Sodemann, H. Correcting the impact of the isotope composition on the mixing ratio dependency of water vapour isotope measurements with cavity ring-down spectrometers. Atmospheric Meas. Tech. 2020, 13, 3167–3190. [Google Scholar] [CrossRef]
- Zang, J.; Wan, L.; Li, Z.; Wang, C.; Wang, S. Does emission trading scheme have spillover effect on industrial structure upgrading? Evidence from the EU based on a PSM-DID approach. Environ. Sci. Pollut. Res. 2020, 27, 12345–12357. [Google Scholar] [CrossRef]
- Zeng, N.; Hausmann, H. Wood Vault: remove atmospheric CO2 with trees, store wood for carbon sequestration for now and as biomass, bioenergy and carbon reserve for the future. Carbon Balance Manag. 2022, 17, 1–29. [Google Scholar] [CrossRef]
- Zhang, G.; Zhang, N. The effect of China's pilot carbon emissions trading schemes on poverty alleviation: A quasi-natural experiment approach. J. Environ. Manag. 2020, 271, 110973. [Google Scholar] [CrossRef] [PubMed]
- Zhou, K.; Li, Y. Carbon finance and carbon market in China: Progress and challenges. J. Clean. Prod. 2019, 214, 536–549. [Google Scholar] [CrossRef]
Figure 1.
How Carbon Trading Works (MacGrath 2021).
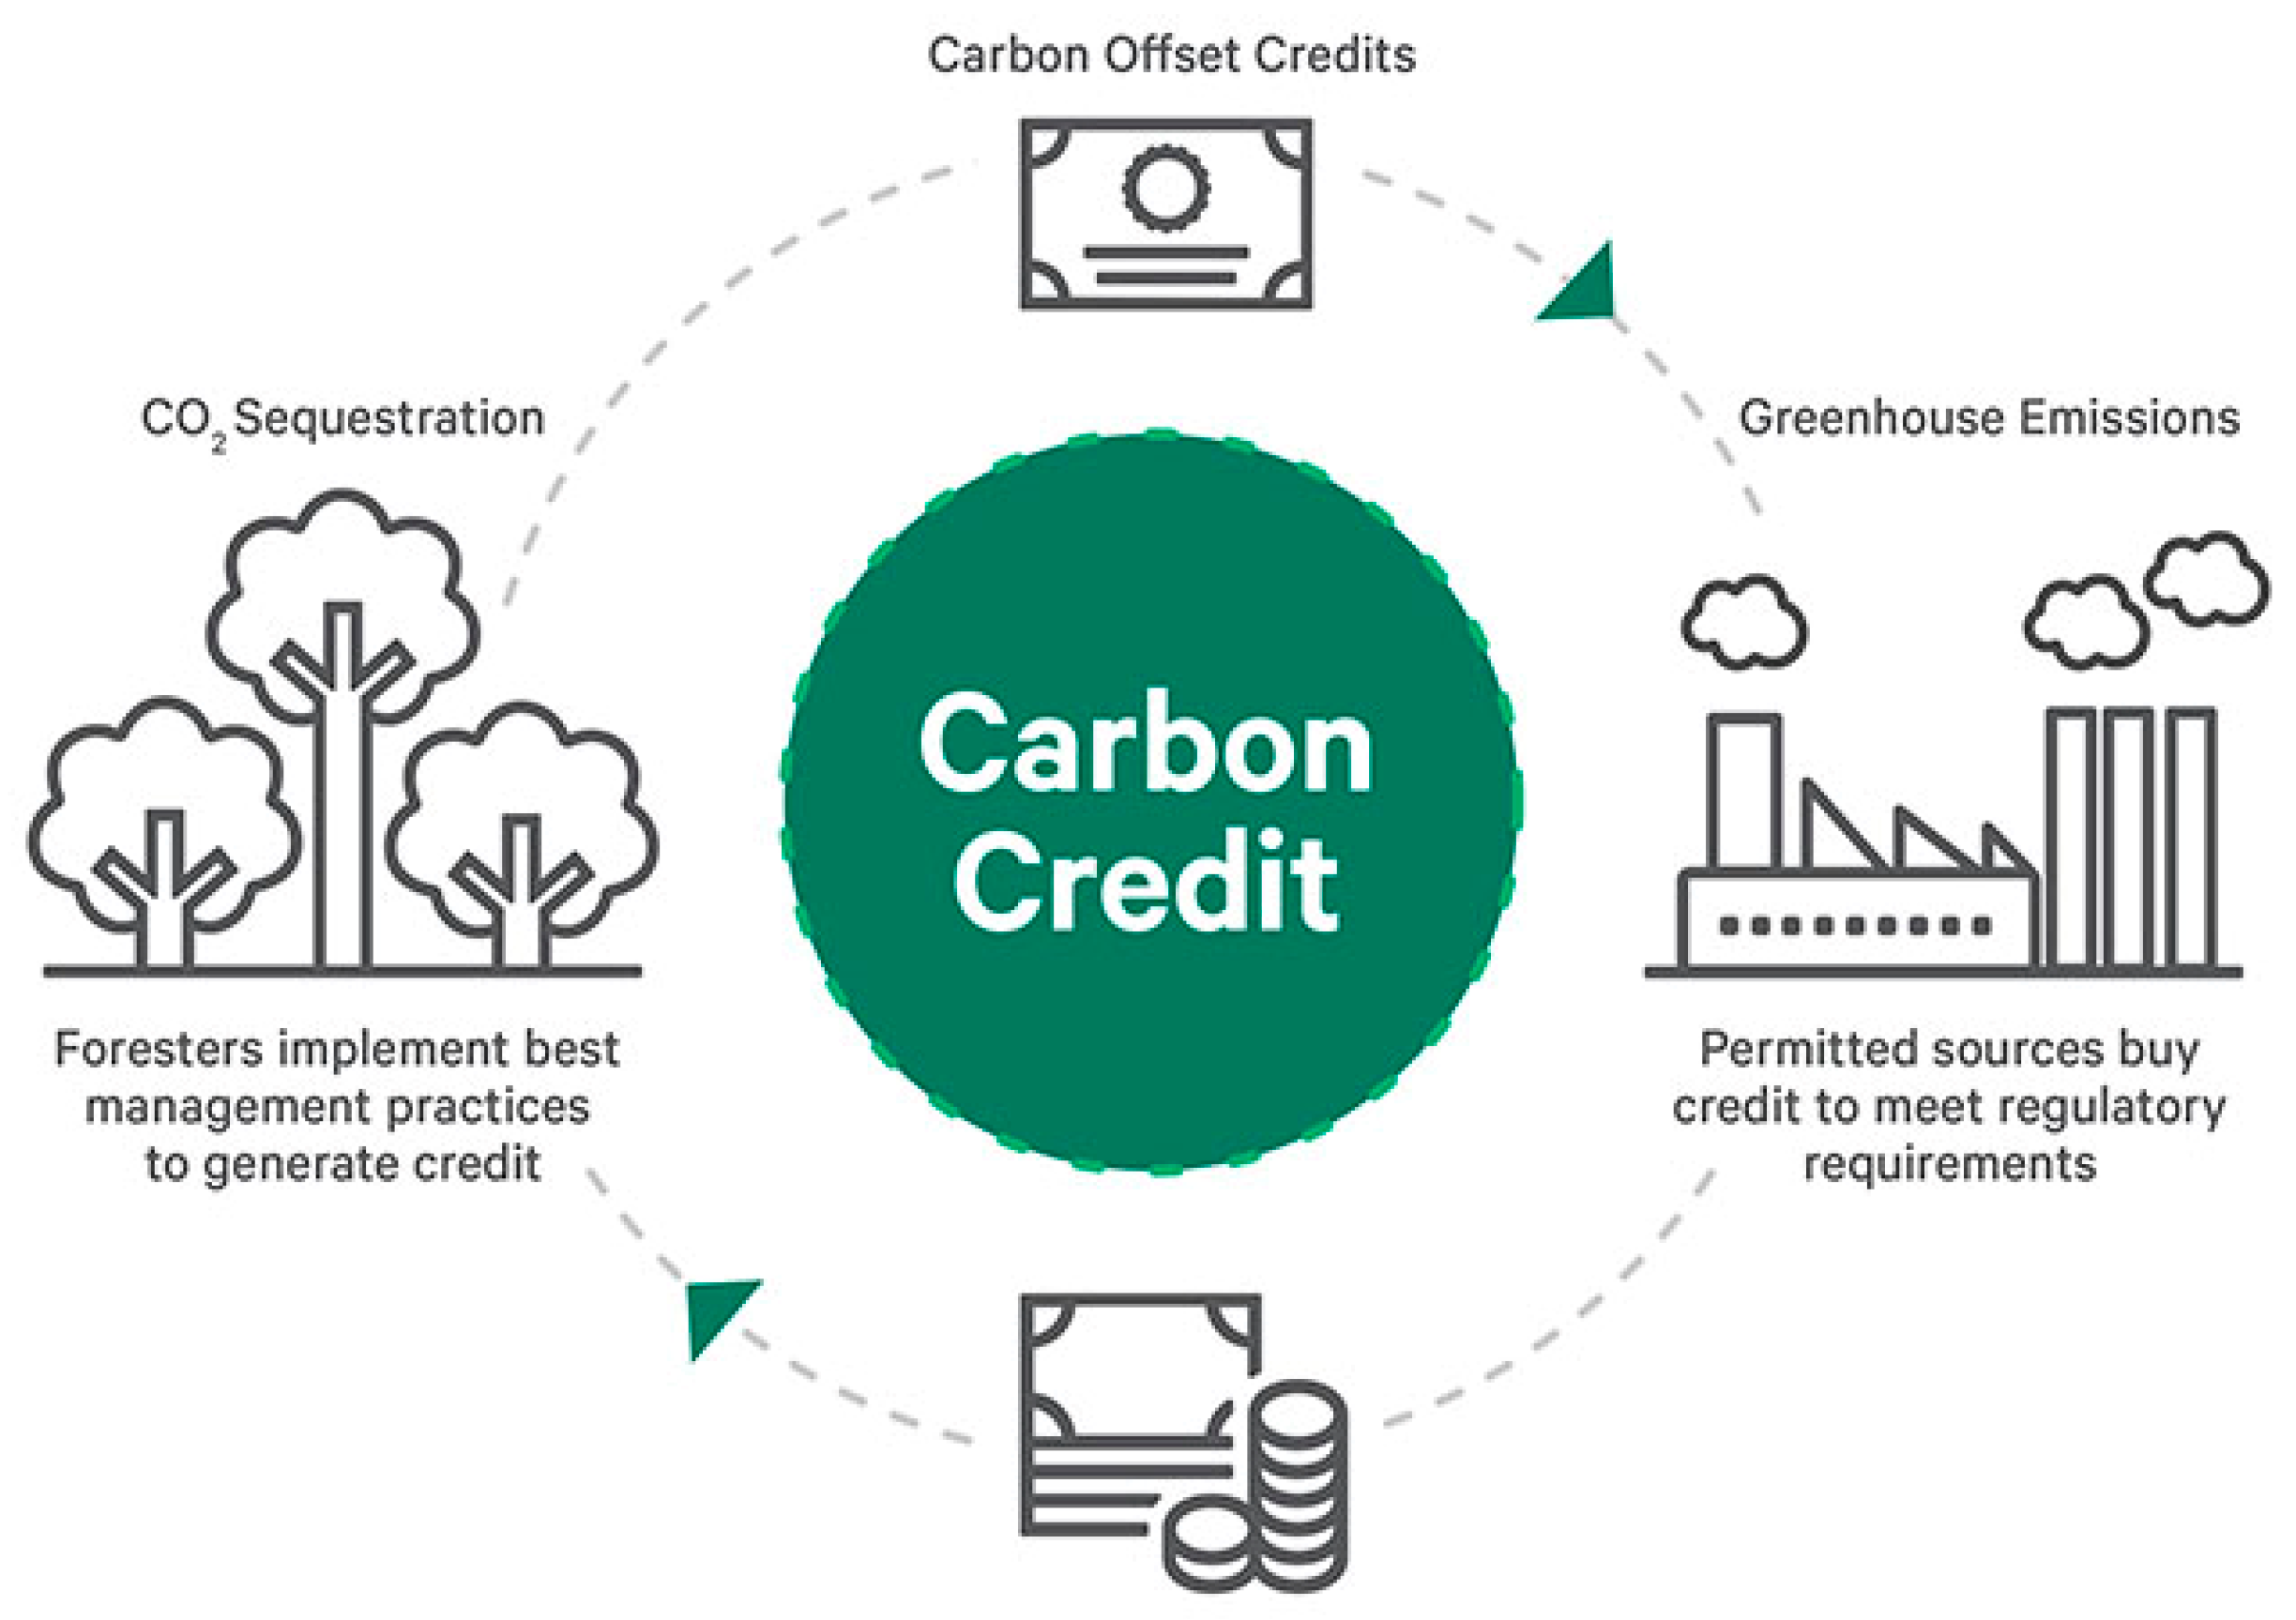
Figure 2.
Low-carbon investments by Region for 2022 and 2023 (Sustainable Economy Nigeria 2023).
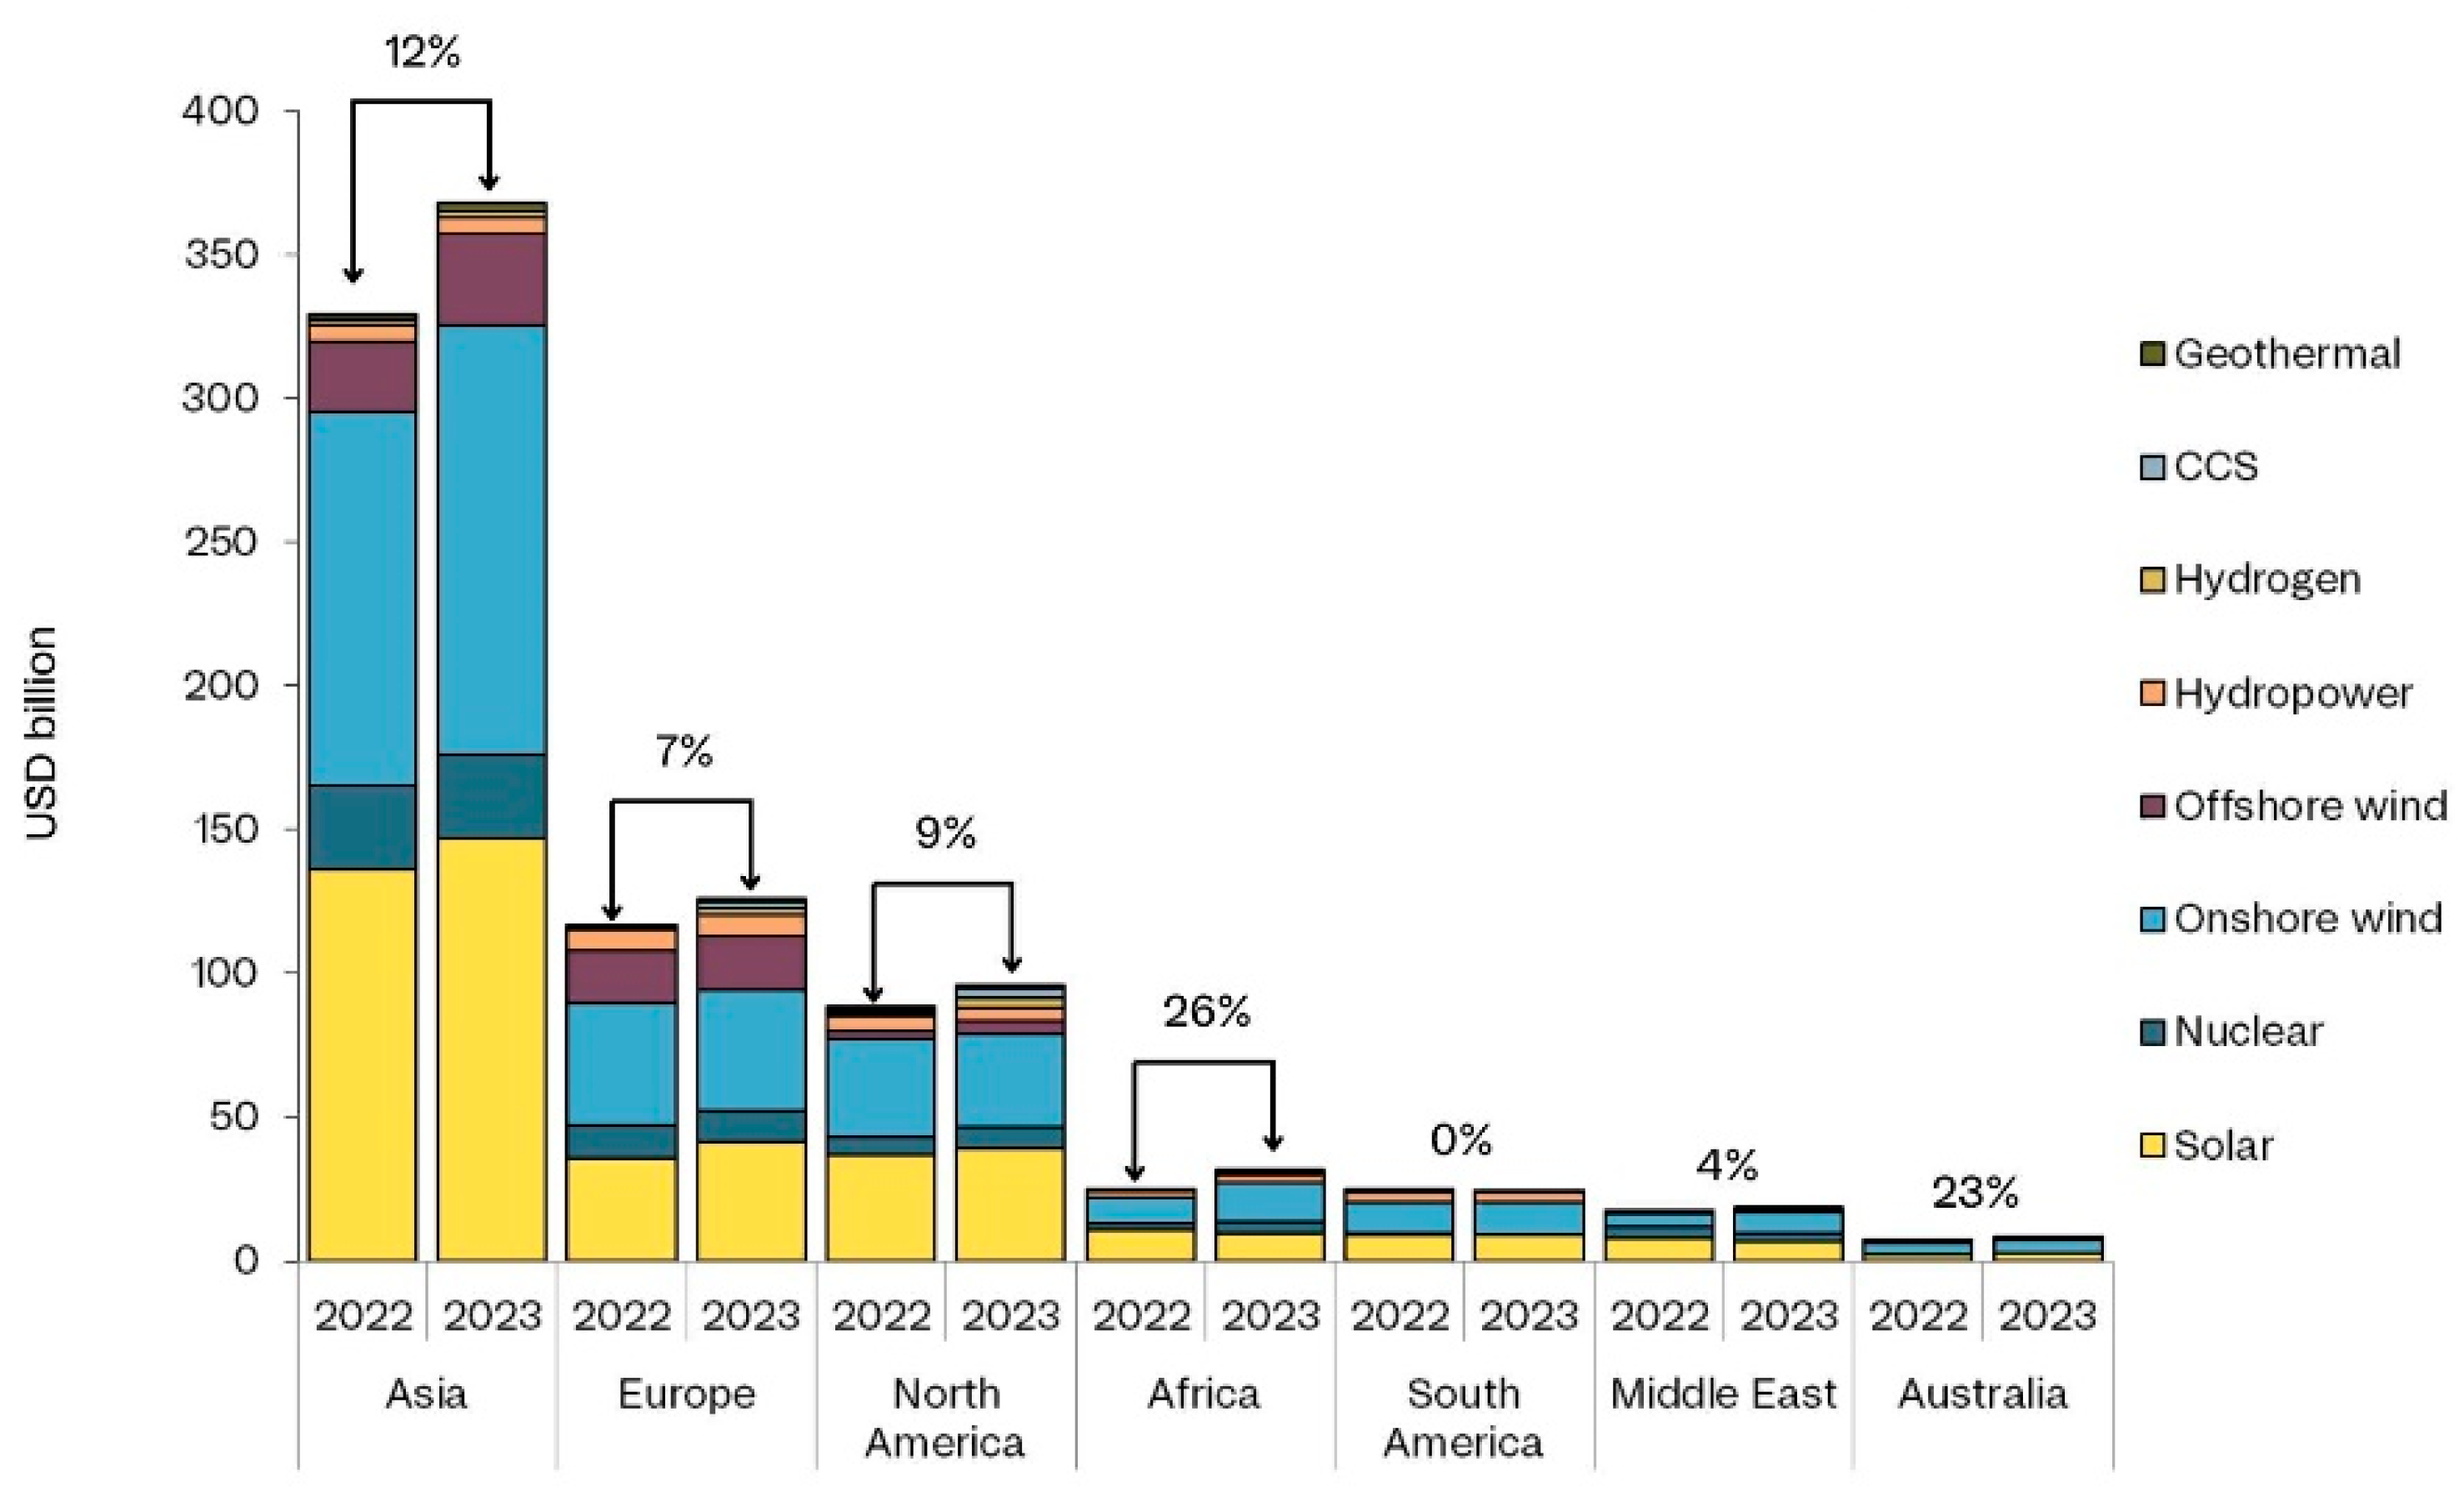
Figure 3.
Percentage emission from fuel source consumption (liquid, solid and gaseous fuels) for (a) Nigeria, (b) Sub-Saharan Africa and (c) the World at large .
Figure 3.
Percentage emission from fuel source consumption (liquid, solid and gaseous fuels) for (a) Nigeria, (b) Sub-Saharan Africa and (c) the World at large .


Table 2.
Carbon credit systems adopted in major regions around the world, showing their market type, focus/aims and an outline of their level of effectiveness.
Table 2.
Carbon credit systems adopted in major regions around the world, showing their market type, focus/aims and an outline of their level of effectiveness.
| REGION | CARBON CREDIT SYSTEMS | MARKET TYPE | FOCUS | COMMENTS | SOURCE |
| Japan | Japan Joint Credit System, (established 2013) | Compliance Market | Caters to both domestic and foreign use. Improved use of low leading carbon technologies and quantitative evaluation of GHG emission reductions. | As of 2022, the scheme had 399 projects registered and 395 credit certifications. Possesses superb implementation rules and conditions. |
(Kobayashi 2016; Japancredit 2022) |
| Kazakhstan | Kazakhstan Emissions Trading Scheme | Compliance Market | Focuses on numerous sectors like energy, mining, chemicals, cement and power production. | Solely concerned with CO2 emissions. | (Upston-Hooper and Swartz 2013; IETA 2016; Howie et al. 2020) |
| European Union (EU) | EU Emission Trading System (EU-ETS) | Compliance Market | Improves carbon sinks by increasing the benchmarks in Land use, Land use change and Forestry (LULUCF) regulation | Largest cap and trade system in the world holding 90% of all carbon traded value in 2021. Responsible for about 40% of the GHG emissions within the EU. Currently in its 4th trading phase and numbering at 25 worldwide (ICAP, 2022) |
(Müller 2022) |
| EU- Effort Sharing Regulation (EU-ESR) | Compliance Market | Focuses on sectors not inclusive in the EU-ETS such as Transport, Building, Agriculture and non-ETS industry and waste. | Responsible for 60% of EU’s GHG emissions. Utilises a flexibility mechanism. Which aids in compensating for shortages or surpluses under the LULUCF regulation. |
(Müller 2022) | |
| Australia | No ETS, however there is a functioning Carbon market. | Voluntary market | Emission reduction by at least 26% by 2030 from prior 2005 levels. | The need for a national ETS is critical for substantial reduction in GHG emission. | (Law 2021; ANZ Research 2021) |
| North America | No national ETS. However, regional and operational schemes are present. Regional Greenhouse Gas Initiative (established 2009). In only 9 states: Vermont, Rhode Island, Maryland, Massachusetts, Connecticut, Delaware, New Hampshire, New Jersey and New York. |
Regional Compliance market for fossil fuel power plants capable of generating more than 25 megawatts. | Focuses on CO2 emissions from electricity generation by at least 50% from 2005 emission levels. Intends to reduce emission level by 30% by 2030 compared to 2020 emission levels. |
No substantial reduction in GHG emissions, likely due to covert allocation. | (Law 2021) |
| California Carbon Trading | California cap and trade system. Compliance market. | Reduction of GHG emissions by 40% in 2040 compared to 1990 levels. | Hoarding of units because of surplus auctions in pilot phase. | (Law 2021) | |
| China | National ETS (established 2021) | Compliance Market. | Focuses on electricity producers and manufacturers. Plans to include industries such as chemicals, aviation, steel etc. Utilises a rate-based system, targeting reductions in CO2 emissions per unit of output. |
Relative low price for emission and Low penalties for non-compliance may adversely affect the scheme’s effectiveness | (Nakano and Kennedy 2021) |
| South Korea | ETS; specifically termed K-ETS | Compliance market, cap and trade system | Focuses on both direct and indirect GHG emissions. | Currently in its 3rd phase and shows good promise in circumventing observed barriers to market liquidity such as high transaction costs, market domination by very few corporate organisations and improper government regulation. | (Suk et al. 2018; Howie et al. 2020) |
Table 1.
A Concise Assessment of the Number and Nature of CDM Projects in West Africa as of 2021 (Source: African Development bank, 2021).
Table 1.
A Concise Assessment of the Number and Nature of CDM Projects in West Africa as of 2021 (Source: African Development bank, 2021).
| COUNTRY | PROJECT TYPE (TOTAL) | PROJECT STATUS |
TOTAL AMOUNT OF POTENTIAL EMISSION REDUCTION in ktCO2e/yr [TOTAL EMISSION TARGET (% EMISSION REDUCTION BELOW BUSINESS AS USUAL (BAU) BY 2023] |
OBSERVATION |
| BURKINA FASO | 3 Solar and 1 Electrical Energy (EE) Household (4) | 3 Registered, 1 Validation Public | 96,981 [18.2%] | The CDM projects are focused on solar energy expansion and reducing household appliances’ generation of carbon content as its mitigation focus. The nation shows great strides in developing a robust GHG inventory in mitigating carbon emission across its various economic sectors. This has enabled Burkina Faso meet 64% of their total emission target. |
| COTE D’ IVOIRE | 3 Landfill gas, 2 Biomass, 1 EE Supply Side, 2 EE households, 1 Hydro and 2 Solar (11) | 8 Registered, 1 Validation Public and 2 Validation Terminated | 3,170,130 [28%] | The CDM projects are actively combatting emissions by creating an expansive array of renewable energy structures. This has enabled the nation meet 100% of their emission mitigation target. |
| CAPE VERDE | 2 Wind (2) | 1 Registered and 1 Validation Replaced | 162,433 [-] | Cape Verde has some CDM project experience, but it is solely focused on wind. The nation’s NDC intent needs further expansion into other areas of electricity generation. |
| GHANA | 2 Methane, 2 Fugitive, 3 Landfill gas, 3 EE Supply side, 1 Reforestation and 1 Fossil fuel switch (12) | 8 Registered, 4 Validation terminated | 7,384,674 [45%] | The nation’s implemented CDM projects reveal clear and accurately measured values for carbon mitigation. This is seen in its policy action and implementation of CDM projects for specific gas emissions and electricity generation. Additionally, the government is structuring a performance-based payment scheme for promoting energy efficiency. This has enabled Ghana meet 67% of their total emission mitigation target. |
| LIBERIA | 1 Landfill gas (1) | 1 Registered | 93,635 [15%] | Liberia has a single CDM project focused on Landfill gas and has met 100% of their NDC. The single CDM project on Landfill is because Liberia electrical energy are mainly derived from renewables. Furthermore, national policies enforce the use of these energy efficiency based projects. However, Liberia has a less than 20% electricity access rate for the entire population. This is a result of the prolonged war which ended in 2003 and has slowed economic and infrastructural revitalisation |
| MALI | 3 Solar, 1 Reforestation (4) | 2 Registered, 1 Validation Terminated and 1 Validation Replaced | 202,326 [27%] | Mali has considerable experience in CDM projects. However, the nation is yet to utilise its solar and hydro potential. Though the national policy reflects the government’s intent to promote energy efficiency, the action plan towards such development has been slow. Regardless, the nation has met 100% of their emission target. |
| NIGER | 1 Reforestation (1) | 1 Registered | 24,957 [34.6%] | The nation has a single CDM project on reforestation. This is because the nation’s energy sector is majorly wood and biomass remnant with over 86% of households using wood and charcoal as the predominant cooking fuel. The extreme use of forest resources has resulted in increased deforestation of the nation’s forest resources. Furthermore, the nation’s underdeveloped infrastructure has made CDM project implementation impossible. Niger has one of the lowest mitigation targets and have been able to meet 90% of the total. |
| NIGERIA | 7 Fugitive, 5 EE households, 3 Landfill gas, 2 Fossil Fuel Switch, 1 Hydro, 1 Biomass Energy, 3 EE Supply side, 1 Transport, 1 EE own generation and 1 EE Industry (25) | 15 Registered, 1 Rejected, 6 Validation terminated, 3 Validation public, | 11,917,678 [45%] | Nigeria has extensive CDM experience with projects dating far back as 2005. The nation is adopting monitoring, recording and verification (MRV) systems to improve real time tracking of the NDC action plan. The government is focused on stabilising the nation’s carbon market through the development of a national registry for tracking emission reduction across sectors. Nigeria has met 69% of their total emission targets. |
| SIERRA LEONE | 1 Biomass Energy (1) | 1 Registered | 55,945 [25 - 35%] | Sierra Leone’s CDM project is focused on building biomass capacity as the nation has maximised its hydro potential regarding electricity generation. |
| TOGO | 2 EE household (2) | 1 Registered and 1 Validation Terminated | 61,220 [31.14%] | Togo’s CDM projects are focused on reducing carbon emission by regulating the use of certain house hold appliances and distributing zero or low emitting appliances. Togo has met 64% of their total mitigation target. |
| SENEGAL | 2 Biomass Energy, 2 Afforestation, 1 Reforestation, 1 Wind, 1 EE household, 2 Landfill gas and 7 Solar (16) | 9 Registered, 3 Pending Publication, 2 Validation Terminated and 2 Validation Public. | 1,093,899 [21%] | Senegal has 16 CDM projects, majority of which are focused on utilising the nation’s high solar potential. The CDM projects are widely distributed over critical wide areas of power consumption and emission generation. Senegal has met 76% of their emission target. |
Disclaimer/Publisher’s Note: The statements, opinions and data contained in all publications are solely those of the individual author(s) and contributor(s) and not of MDPI and/or the editor(s). MDPI and/or the editor(s) disclaim responsibility for any injury to people or property resulting from any ideas, methods, instructions or products referred to in the content. |
© 2025 by the authors. Licensee MDPI, Basel, Switzerland. This article is an open access article distributed under the terms and conditions of the Creative Commons Attribution (CC BY) license (https://creativecommons.org/licenses/by/4.0/).
Copyright: This open access article is published under a Creative Commons CC BY 4.0 license, which permit the free download, distribution, and reuse, provided that the author and preprint are cited in any reuse.


