
Submitted:
08 August 2025
Posted:
13 August 2025
You are already at the latest version
Abstract
This work investigated six heavy metals (Pb, Hg, Cd, Mn, Fe and As) in sediment samples of the Anambra River collected from five sampling points at 1km from each other. The Anambra River cuts across several towns and flows into River Niger in Anambra State Nigeria. A total of forty sediment samples were used for the study. The samples were collected from November 2017 to Feb 2018 (dry season sampling) then from May 2018 to August 2018 (wet season sampling). Metal ion concentration in the sediments was determined using Atomic Absorption Spectrophotometer (AAS). Experimental results showed the concentration of metals in the order of Fe > Mn > As > Cd > Hg > Pb (Dry season) and Fe > Mn > As >Hg > Pb >Cd (wet season). In both seasons iron, manganese and arsenic recorded higher values than other metals. Results from Contamination Factor (CF) calculation showed that all the metals analyzed (except for arsenic) exert low contamination effect on the sediment samples in both seasons. Arsenic exerts considerable contamination in dry season. This study provided information on heavy metal concentration in sediment, magnitude of contamination, likely ecological risk to man and other living organisms within the Anambra River catchment area.
Keywords:
heavy metals
; contamination
; sampling
; ecological risk
; Anambra river
Introduction
Anambra River, originally called Omambala River is in Anambra State Nigeria. The river has a length of 210 km and passes through Anambra East, Anambra West, Anyamelum, and Oyi local government areas and emptied itself at River Niger in Onitsha Anambra State. Inhabitants around the Anambra River catchment area are mainly fishermen and peasant farmers. Fertilizers, herbicides, and pesticides are normally used in agricultural activities along the riverbanks. Again, the presence of the Otuocha market within the site of study leads to the release of degradable and non-degradable solid waste from the market directly into the river. These anthropogenic activities- sewage disposal, solid waste disposal, and agricultural activities using fertilizers, herbicides, pesticides, coal ash from local ovens used by fish sellers for grilling fishes around the riverbank are washed out as run-off into the river and this results in an increase in the pollution level of the river. Poor sanitary conditions within the communities result in the indiscriminate dumping of municipal solid waste into the river. Two climatic seasons are prevalent in Anambra State – the rainy season which starts from March to October and the dry season (November to March). The rainy season is characterized by heavy downpours, heavy flooding, soil leaching, ground infiltration, and water percolation. There are generally lower temperatures and relatively high humidity during the rainy season. The dry season is characterized by higher temperatures, low humidity, extensive aridity, and a lot of particulate generation. Rural dwellers within the Anambra River catchment area depend majorly on Anambra River and its tributaries for water, for domestic purposes such as drinking, cooking, bathing, laundry and processing of farm produce like cassava, melon, bitter leaves, etc. With the recent increase in the use of chemicals such as fertilizers, herbicides and pesticides in agriculture, surface water bodies such as streams, lakes, and rivers are prone to pollution due to the influx of agricultural run-off and dumping of domestic wastes into water bodies The sitting of Otuocha market at the bank of Anambra River and the unrestricted use of the river as the washing zone for automobiles pre-disposes the river to a high level of anthropogenic pollution. Automobiles are known to commonly emit some poisonous gases and elements such as lead (Pb) since it has been established that Nigerian gasoline contains a significant amount of Pb that can adversely affect the environment when released [1,2].The danger inherent in heavy metal pollution of surface water, the bioaccumulation and biomagnification of toxic metals on aquatic organisms in the water, and the possible transfer to human life through the food chain, there is a need for a periodic check on the quality of this river on which many residents in Otuocha and its environs depend. Emeka et al [3] assessed the concentration of some heavy metals in water samples from Anambra River using atomic absorption spectrophotometric method, and discovered that the concentrations of Cd, Pb, Ni, Mn and Hg were reasonably higher than WHO, SON and EU permissible limits for portable water. The pollution index of the above- mentioned metals were also found to be higher than the threshold value of 1.0, which indicates high level of pollution as found in the study.
Ayogu et al. [4] evaluated the contamination level of heavy metals in Anambra drainage basin’s sediment by collecting twelve samples from the basin upstream and downstream in wet and dry seasons and discovered that some of the samples exceeded the threshold pollution index value of 1, thus signifying high pollution levels. Hoang et al. [5] studied the contamination of Houijing river in Taiwan, by collecting samples from surface water and sediments from five sites suspected to be likely to be contaminated by industrial activities for a period of five years and discovered that two sites which were close to industrial discharge point were the most contaminated. Malvandi [6] evaluated the degree of pollution of Zarrin-Gol River through the determination of the concentration of some heavy metals and metalloids in samples collected from the river and discovered that arsenic and selenium levels were quite high and could be regarded as pollutants to the river. Patel et al. [7] assessed the level of contamination of river water and sediments along the basin of Svamanmukhi river and found substantial pollution of the river with iron and manganese, and the river basin with chromium, lead, copper and zinc, contamination values of which exceeded the Indian averages, but were far below the world averages. Zhang et al. [8] assessed the level of pollution of Zijang river sediment by determining the concentration of some heavy metals found therein. By applying geoaccumulation and ecological risk index, they discovered contaminations by cobalt, zinc, copper, cadmium, manganese, antimony and lead, which came agricultural and mining activities within the area of study. Islam et al. [9] also used geo-accumulation index and contamination factor to assess the level of pollution of Femi River and discovered that silver, cobalt and mercury levels were either moderate or high, while arsenic, chromium and lead were at zero or low levels of pollution. Wu et al. [10] evaluated the pollution levels of heavy metals in the sediment samples of selected urban rivers and found levels of accumulation of cadmium, chromium and mercury which pose high toxicity levels to benthic organisms and ecological risks, as well. Siddique et al. [11] analysed sediment samples from lower Meghna River for heavy metal contamination, using atomic absorption spectrophotometry, and geo-accumulation and pollution load index, and found out that there was no contamination of heavy metals within the studied area.
Materials and Methods
Sampling: Samples of the river sediments were collected at five different locations (1kilometre apart, marked A-E) along the river. Forty-sediment samples were used for the study. The samples were collected from November 2017 to February 2018 (dry season sampling), then May 2018 to August 2018 (rain season sampling). Sampling was done during the morning hours when all the pollutants are expected to be evenly distributed across different compartments and media of the river. Three samples of sediments were collected at each of the sampling sites. A representative sediment sample for each sampling site was obtained by mixing the three samples collected at each point. The representative sample was then dried and stored in a labeled plastic bag until it is required for laboratory analysis.
AAS Analysis of the Sediment Samples
Results and Discussion
The analysis of sediment samples collected from the Anambra River within the area of study (Otuocha) showed the presence of Fe, Mn, Cd, Pb, Hg, and As in different concentrations. Table 1 and Table 2 showed the overall mean concentration of the individual metals along the sampled points for both seasons. From Table 1 it is seen that the mean concentrations of all the metals tested for in sediment samples were in the order of Fe > Mn >As > Cd > Hg > Pb while Table 2 showed the metal concentration in the order of: Fe> Mn > As > Hg > Pb > Cd. In both seasons, Fe concentration is found to be the highest while Cd concentration is the least.

Table 1.
Mean concentration of heavy metals (mg/l) in sediment along with the sampled points in Dry season (Nov -Feb).
Table 1.
Mean concentration of heavy metals (mg/l) in sediment along with the sampled points in Dry season (Nov -Feb).
| A | B | C | D | E | Mean & std | |
|---|---|---|---|---|---|---|
| Pb | `0.447 | 0.280 | 0.320 | 0.255 | 0.218 | 0.304 ± 0.13 |
| Hg | 0.597 | 0.754 | 0.225 | 0.263 | 0.375 | 0.387 ± 0.15 |
| Cd | 0.818 | 0.195 | 0.564 | 0.704 | 0.014 | 0.459 ± 0.34 |
| Mn | 5.764 | 5.493 | 4.277 | 3.437 | 3.504 | 4.495 ± 1.09 |
| Fe | 19.887 | 18.464 | 21.377 | 18.815 | 18.220 | 19.353 ± 1.30 |
| As | 3.389 | 2.66 | 3.311 | 2.584 | 3.760 | 3.141 ± 0.51 |
Table 2.
Mean concentration of heavy metals (mg/l) in sediments along with the sampled points in Wet season (May -Aug).
Table 2.
Mean concentration of heavy metals (mg/l) in sediments along with the sampled points in Wet season (May -Aug).
| A | B | C | D | E | Mean & std deviation | |
|---|---|---|---|---|---|---|
| Pb | 0.206 | 0.127 | 0.119 | 0.203 | 0.010 | 0.133 ± 0.08 |
| Hg | 0.370 | 0.189 | 0.400 | 0.603 | 0.00 | 0.303 ± 0.03 |
| Cd | 0.065 | 0.043 | 0.045 | 0.108 | 0.041 | 0.060 ± 0.03 |
| Mn | 3.378 | 3.968 | 3.427 | 3.268 | 2.433 | 3.295 ± 0.55 |
| Fe | 43.139 | 44.913 | 43.913 | 44.632 | 44.556 | 44.297 ± 2.5 |
| As | 0.260 | 0.260 | 0.300 | 0.200 | 0.190 | 0.240 ± 0.05 |
Comparison of heavy metal levels in the sediment of Anambra River with other studies and guidelines.
Table 3.
Comparison of heavy metal levels (mg/kg, dry weight) in the sediment of the present study with other studies and guidelines.
Table 3.
Comparison of heavy metal levels (mg/kg, dry weight) in the sediment of the present study with other studies and guidelines.
| Metals | Present Study | aAladja river Sediment |
bEvbiob sediment |
PEC | USEPA |
|---|---|---|---|---|---|
| Pb | 0.304 | 0.25 | 0.10 | 12.8 | 30.2 |
| Hg | 0.387 | - | - | - | - |
| Cd | 0.459 | 0.96 | 0.05 | 5.0 | 0.68 |
| Mn | 4.495 | 2.05 | 6.27 | - | 15.9 |
| Fe | 19.353 | 6.48 | 49.65 | 20.03 | - |
| As | 3.141 | - | - | - | - |
The similarity in the distribution pattern is seen in the high concentrations of iron (Fe) and manganese (Mn) in the sediments from the three rivers. While the Fe concentration in sediments from the Anambra River (the present study) and that of Aladja river sediment are below the PEC permissible value, Fe concentration in sediments from Evbiob River is higher than the PEC limit. Manganese and lead concentrations in sediments from the three rivers are below the permissible limits of PEC and USEPA.
Pollution Index Models
Various models have been developed to assess heavy metal contamination in sediment which include the Contamination Factor (CF), Pollution Load Index (PLI), and Geoaccumulation Index (Igeo). Some of these models provide useful information, reducing large data for easy understanding by policymakers [15].
To assess the heavy metal pollution levels and extent of contamination in sediment, the data obtained for the heavy metal concentrations were used to calculate the above-listed pollution indices.
Contamination Factor (Cf)
Contamination factor (Cf) is the ratio obtained by dividing the concentration of each metal in the water or sediment by the upper permissible value or its background value.
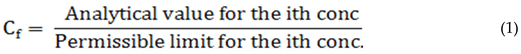
Cf values were interpreted as Cf < 1 = low contamination; 1< Cf < 3 moderate contamination; 3< Cf < 6 = considerable contamination and Cf > 6 = very high contamination.
The contamination factor values of heavy metals in the sediments of Anambra River in dry season follows the order As > Cd > Hg & Mn > Pb > Fe while that of wet season follows the order As > Cd > Mn > Hg > Pb > Fe (see Table 4 and Table 5). In the dry season, all the metals exert a low contamination effect except for Arsenic. The river sediment is considerably contaminated by Arsenic in the dry season. In the wet season, all the metals exert a low contamination effect on the sediment. The contamination effect of toxic metals on the sediments of the river could be attributed to the indiscriminate dumping of solid waste and liquid effluents from domestic and industrial sources into the river.
Table 4.
Contamination Factor of Sediment Samples in the dry season.
| A | B | C | D | E | Mean | |
|---|---|---|---|---|---|---|
| Pb | 0.005 | 0.003 | 0.004 | 0.003 | 0.003 | 0.004 |
| Hg | 0.006 | 0.008 | 0.002 | 0.003 | 0.004 | 0.005 |
| Cd | 1.02 | 0.243 | 0.705 | 0.885 | 0.002 | 0.571 |
| Mn | 0.007 | 0.006 | 0.005 | 0.004 | 0.004 | 0.005 |
| Fe | 0.0005 | 0.0005 | 0.0006 | 0.0005 | 0.0005 | 0.0005 |
| As | 3.40 | 2.66 | 3.31 | 2.58 | 3.76 | 3.14 |
Table 5.
Contamination Factor of Sediment Samples in the wet season.
| A | B | C | D | E | Mean | |
|---|---|---|---|---|---|---|
| Pb | 0.002 | 0.002 | 0.004 | 0.002 | 0.001 | 0.002 |
| Hg | 0.004 | 0.002 | 0.004 | 0.006 | 0 | 0.003 |
| Cd | 0.08 | 0.050 | 0.056 | 0.135 | 0.051 | 0.074 |
| Mn | 0.004 | 0.005 | 0.004 | 0.004 | 0.003 | 0.004 |
| Fe | 0.001 | 0.001 | 0.001 | 0.001 | 0.001 | 0.001 |
| As | 0.260 | 0.260 | 0.300 | 0.200 | 0.190 | 0.240 |
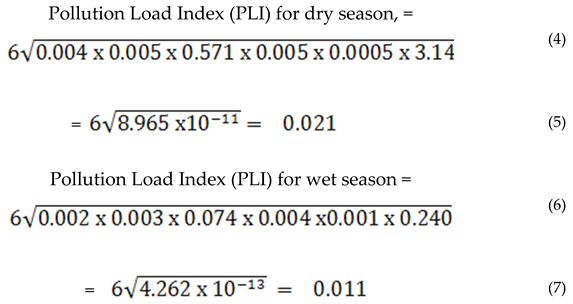
Pollution Load Index (PLI)
The Pollution Load Index (PLI) demonstrates the general contamination level by considering the overall toxicity of all observed heavy metals. The PLI is the nth root of the aggregation of contamination factors in the research area. PLI provides a temporal and spatial overall indication of pollution in the environment which can be of assistance in environmental governance [16]. The Pollution Load Index (PLI), as proposed by Tomilson et al, [17] was used to assess the quality of river sediment.
To identify the metal contamination as a total scale in sediment, Tomilson et al, [17] recommended an equation for calculating the Pollution Load Index (PLI) as;
where n is the number of metals.
PLI = (CF1 x CF2 x CF3 x……CFn) 1/n
PLI > 1 indicates pollution and demonstrates the dynamic deterioration of the quality, whereas PLI< 1 low contamination. PLI value of zero indicates the starting point of becoming infected.
The PLI provides a comparative means for assessing water quality at the respective locations. For Anambra River, the PLI values for both seasons are less than one, indicating low contamination of the river sediments.
Geoaccumulation Index (I-geo)
The Geoaccumulation Index (I-geo) is used to assess the extent of metal pollution in soil samples. The I-geo was estimated using the following equation:
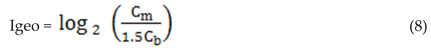
where Cm is the concentration of the metal in the sample, Cb is the background value of the metal, 1.5 is the background matrix correction factor due to lithogenic effects; hence, this index is used to analyze natural fluctuations in the content of a given substance in the environment and very small anthropogenic influences. The background value taken is considered from the world average value in shale (mg/kg) of the metals determined in the study.
The values are Fe = 47200, Zn = 95, Pb = 20, Co = 19, Cu = 45, Cr = 90, Ni = 68, Mn = 850, As = 13, Hg = 37.5 and Cd = 0.3.
I-geo < 0 – uncontaminated, 0 < I-geo < 1 – moderately contaminated, 1 < I-geo < 2 – moderately to heavily contaminated, I-geo < 3 – heavily contaminated, 3 < I-geo < 4 – heavily to extremely contaminated, 4 < I-geo < 5 – extremely contaminated.
Table 5.
Geoaccumulation Index (I-geo) of Sediment samples from Anambra River (Dry season).
| A | B | C | D | E | Mean | |
|---|---|---|---|---|---|---|
| Pb | 0.004 | 0.003 | 0.003 | 0.003 | 0.002 | 0.003 |
| Hg | 0.016 | 0.020 | 0.006 | 0.007 | 0.010 | 0.012 |
| Cd | 0.547 | 0.130 | 0.377 | 0.471 | 0.009 | 0.307 |
| Mn | 1.3 x10⁻³ | 1.3 x10⁻³ | 1.0 x10⁻³ | 8.1 x10⁻⁴ | 8.2 x10⁻⁴ | 0.001 |
| Fe | 8.454 x10⁻⁵ | 7.850 x10⁻⁵ | 9.088 x10⁻⁵ | 8.00 x10⁻⁵ | 7.746 x10⁻⁵ | 8.230 x10⁻⁵ |
| As | 0.05 | 0.041 | 0.051 | 0.040 | 0.058 | 0.048 |
Table 6.
Geoaccumulation Index (I-geo) of Sediment samples from Anambra River (Wet season).
| A | B | C | D | E | Mean | |
|---|---|---|---|---|---|---|
| Pb | 0.002 | 0.001 | 0.001 | 0.002 | 0.0001 | 0.001 |
| Hg | 0.010 | 0.005 | 0.010 | 0.016 | 0 | 0.008 |
| Cd | 0.043 | 0.029 | 0.030 | 0.072 | 0.027 | 0.040 |
| Mn | 7.97.97 x10-4 | 9.37 x10⁻⁴ | 8.09 x10⁻⁴ | 7.71x10⁻⁴ | 5.74 x10⁻⁴ | 7.77 x 10⁻⁴ |
| Fe | 1.83 x10⁻⁴ | 1.91 x10⁻⁴ | 1.87 x10⁻⁴ | 1.89x10⁻⁴ | 1.89 x10⁻⁴ | 1.88x10⁻⁴ |
| As | 0.004 | 0.004 | 0.005 | 0.003 | 0.003 | 0.004 |
The Geoaccumulation Index values obtained in this study (for both seasons) were all below one which indicates low contamination of the water sediment. Ranking in order of decreasing contributions in dry season showed Cd > As > Hg > Pb > Mn > Fe while that of wet season is Cd > Hg > As > Pb > Mn > Fe.
Discussion
From the analytical results, it was observed that in both seasons, Fe has the highest concentration followed by Mn. Similar observation was recorded for iron in Qua Ibeo river estuary, Aladja River, and Ogba River [18]. The high loads of iron and manganese in the sediment could be attributed to lithological or crustal origin as well as man's anthropogenic activities. According to Oyakilome [14], Iron and Manganese have been known to be commonly high in Nigerian soils; moreover, the pattern of distribution of these metals might suggest that the level of heavy metals in the sediments is both natural and anthropogenic influences In agreement, Oyakilome [14] noted that in rural areas, the metal content of soil/sediment can be assigned mainly to rock weathering and of course, erosion and wastes that are generated due to human activities, and are discharged on land around the rural environment. Such wastes are transported by run-off water into surrounding water bodies when it rains. Manganese is one of the most abundant metals in the earth's crust, usually occurring with iron [13].
The relatively high level of Arsenic can be from man's anthropogenic activities as Arsenic and its compounds, especially the trioxide, are used in the production of pesticides, treated wood products, herbicides, and insecticides. Pesticides, herbicides, and insecticides are commonly used by farmers, so the possibility of residual amounts of these agrochemicals being discharged into the river during a rainstorm cannot be ruled out. In both seasons the concentration of lead in the river sediments is low relative to the concentration of other metals. This is contrary to the findings of Igweilo and Onyenmechi [19] who posited that soil lead levels in and around the Anam River are high and may pose adverse health problems. The presence of lead can be attributed to man’s anthropogenic activities.
Conclusions
Discharge of untreated solid wastes and agricultural run-off into the Anambra River could have contributed to the pollution of the river as shown by the result of this analysis. Iron and Manganese recorded higher concentrations in the sediments samples analyzed. Calculated pollution assessment indices; Contamination Factor and Pollution Load Index of heavy metals showed that the river requires special treatment before it can be used for domestic activities.
Author Contributions
Israel J.A.: Conceptualization and methodology. Okore G.J.: Project administration, review, editing, supervision. Madichie J.C.: Methodology, writing original draft, investigation. Akanbi M.N.: Review, editing, data curation. Amanze K.O.: Review, editing. Okeke P.I.: Review, editing, plagiarism test. Eze Gabriel: Writing original draft.
References
- Adefemi, O. S, Olaofe, O and Asaolu, S.S (2004). The concentration of heavy metals in water sediment and fish parts (Illisha Africana) from Ureje dam, Ado- Ekiti, Ekiti State. Nigeria Journal of Biological and Physical Science 2004, 3, 111–114. [Google Scholar]
- Ahmed, M. M, Doumeng, P, Syakti, A.D, Asia L and Chiron, S (2017). Levels and sources of heavy metals and PAHs in the sediment of Djibouti-city (Republic of Dibout). Marine Pollution Bulletin 2017, 120, 340–346. [Google Scholar] [CrossRef] [PubMed]
- Emeka, C. Nkoli M., Henrietta I.K. & Osiri A.J. (2020). Heavy metals contamination of Anambra River. Communication in physical sciences 2020, 6(1), 714–721. [Google Scholar]
- Ayogu, C. , Maduka, R., Ayogu, N., & Monona, O. (2019). An evaluation of potential toxic metals in sediments of a tropical watershed in southern Benue Trough, Nigeria. Environmental Earth Sciences 2019, 78(1), 480. [Google Scholar] [CrossRef]
- Hoang, H. , Lin, C., Tran, H., Chiang, C., Bui, X., Cheruiyot, N., Shern, C., & Lee, C. (2020). Heavy metal contamination trends in surface water and sediments of a river in a highly industrialized region. Environmental Technology and Innovation 2020, 20(1), 101–043. [Google Scholar] [CrossRef]
- Malvandi, H. (2017). Preliminary evaluation of heavy metal contamination in the Zarrin-Gol River sediments, Iran. Marine pollution bulletin 2017, 117, 547–553. [Google Scholar] [CrossRef] [PubMed]
- Patel, P. , Raju, J., Reddy, B., Suresh, U., Sankar, D., & Reddy, T. (2018). Heavy metal contamination in river water and sediments of the Swarnamukhi River Basin, India: risk assessment and environmental implications. Environmental Geochemistry and Health 2018, 40, 609–623. [Google Scholar] [CrossRef] [PubMed]
- Zhang, Z. , Lu, Y., Li, H., Tu, Y., Liu, B., & Yang, Z. (2018). Assessment of heavy metal contamination, distribution and source identification in the sediments from the Zijiang River, China. The Science of the total environment 2018, 645(1), 235–243. [Google Scholar] [CrossRef] [PubMed]
- Islam, M. , Hossain, M., Matin, A., & Sarker, M. (2018). Assessment of heavy metal pollution, distribution and source apportionment in the sediment from Feni River estuary, Bangladesh. Chemosphere 2018, 202(1), 25–32. [Google Scholar] [CrossRef] [PubMed]
- Wu, X. , Yang, K., Lu, J., Li, B., Li, Y., Zhang, Y., & Ye, L. (2024). Contamination and ecological risk of heavy metals in sediments of urban rivers in a typical economic development zone, southern China. Journal of environmental sciences 2024, 153(1), 264–274. [Google Scholar] [CrossRef]
- Siddique, M. , Rahman, M., Rahman, S., Hassan, M., Fardous, Z., Chowdhury, M., & Hossain, M. (2021). Assessment of heavy metal contamination in the surficial sediments from the lower Meghna River estuary, Noakhali coast, Bangladesh. International Journal of Sediment Research 2021, 36(3), 384–391. [Google Scholar] [CrossRef]
- Lacatusu, R. (2000). Appraising levels of soil contamination and pollution with heavy metals. European Soil Bureau 2000, 4, 393–402. [Google Scholar]
- Aiyesanmi, A. F (2008). Baseline Heavy Metal concentration in River Sediments within Okitipupa Southwest belt of Nigeria bituminous sand field. Journal of Chemical Society 2008, 33, 29–41. [Google Scholar]
- Oyakhilome, G. I (2019). Assessment of quality, Toxic metal accumulation, and risks in water, sediment, and biota from Owan and Evbiobe rivers, Edo State Nigeria. Ph.D. A thesis submitted to Nnamdi Azikiwe University Awka, Nigeria.
- Verla, E.N; Verl, A.W; Enyoh, C. E (2017). Pollution assessment models of surface soils in Port Harcourt city, Rivers State, Nigeria. www.worldnewsnaturalsciences.com.
- Withanachchi, S 2018: Water Quality in surface water: A preliminary Assessment of heavy metal concentration of the Mashsvera River Georgia. Int. J. Environ. Res. Public Health. 15(14), 621: http//doi.org/10.3390/ijerph 15040621.
- Tomilson, D. C, Wilson, J.G, Harris C.R & Jeffrey, D.W (1980). Problems in assessment of heavy metal levels in estuaries and formation of pollution index. https://bit.ly/339TRJY.
- Ebong, G.A; Offiong, O. Offiong, O.E and Ekpo, B.O (2014). Seasonal variations in trace metal levels, speciation and physicochemical determinants of metal availability in dumpsites soils within Akwa Ibom State Nigeria. Journal of Chemistry and Ecology 2014, 30(5), 403–417. [Google Scholar] [CrossRef]
- Igwilo, I.O; Onyenmechi, J.A. Toxicological Study of the Anam River in Otuocha, Anambra State, Nigeria. J. Chem Soc of Nigeria, 2006, 31, 205–208. [Google Scholar] [CrossRef] [PubMed]
Disclaimer/Publisher’s Note: The statements, opinions and data contained in all publications are solely those of the individual author(s) and contributor(s) and not of MDPI and/or the editor(s). MDPI and/or the editor(s) disclaim responsibility for any injury to people or property resulting from any ideas, methods, instructions or products referred to in the content. |
© 2025 by the authors. Licensee MDPI, Basel, Switzerland. This article is an open access article distributed under the terms and conditions of the Creative Commons Attribution (CC BY) license (http://creativecommons.org/licenses/by/4.0/).
Copyright: This open access article is published under a Creative Commons CC BY 4.0 license, which permit the free download, distribution, and reuse, provided that the author and preprint are cited in any reuse.


