
Submitted:
11 August 2025
Posted:
13 August 2025
You are already at the latest version
Abstract
This study evaluated soil–atmosphere greenhouse gas (GHG) fluxes—including carbon dioxide (CO₂), methane (CH₄), and nitrous oxide (N₂O)—in cacao agroecosystems on São Tomé Island, Central Africa. The sampling design comprised two system types (biodiverse and conventional), two crop development stages (growing and productive), and two climatic zones (wet and dry). Gas fluxes were measured using the static chamber method and analyzed in relation to climatic, topographic, and edaphic variables. CO₂ fluxes were the dominant contributor to total emissions, accounting for approximately 97.4% of the global warming potential (GWP), while CH₄ and N₂O together contributed less than 3%. The highest CO₂ emissions occurred in conventional systems during the growing stage in the wet zone (125.5 mg C m⁻² h⁻¹). CH₄ generally acted as a sink, particularly in conventional systems in the dry zone (−12.58 μg C m⁻² h⁻¹), although net emissions were detected in biodiverse systems in the wet zone (5.08 μg C m⁻² h⁻¹). The highest N₂O fluxes were observed in conventional growing systems (32.28 ± 5.76 μg N m⁻² h⁻¹). GHG dynamics were mainly regulated by climatic factors—such as air temperature, relative humidity, and precipitation—and by key edaphic properties, including soil pH, soil organic carbon, soil temperature, and clay content. Projected GWP values ranged from 9.1 to 40.9 Mg CO₂-eq ha⁻¹ year⁻¹, with the highest values recorded in conventional systems in the growing stage. Overall, our findings underscore the potential of biodiversity-based agroforestry as a climate-smart practice to mitigate net GHG emissions in tropical cacao landscapes.
Keywords:
cacao agroforestry
; greenhouse gas fluxes
; soil–atmosphere exchange
; global warming potential
; agroecological management
; São Tomé
1. Introduction
Cocoa (Theobroma cacao L.) is one of the most important tropical crops, predominantly cultivated in West and Central African countries, which together accounted for approximately 71.3% of global production—around 3.12 million tons of cocoa—during the 2023–2024 period [1]. However, the carbon footprint of cocoa production remains considerable, with average emissions estimated at 1.47 kg CO₂e per kilogram of cocoa produced. Deforestation is identified as the main driver of these emissions, while tree biomass and the adoption of good management practices can improve the carbon balance, aligning profitability with low climate impact [2,3]. Although cocoa is typically grown in agroforestry systems known for their agro-environmental benefits, drivers such as land-use change, unsustainable conventional practices, and climate change can adversely impact the net balance of greenhouse gas (GHG) emissions, including carbon dioxide (CO2), methane (CH4), and nitrous oxide (N2O) [2,4,5,6].
According to the 2019 annual report on GHG emissions monitoring and verification [7], São Tomé's estimated emissions of the main GHGs in 2018 reached 204.98 Gg CO₂-eq (excluding FOLU), representing a 31% increase compared to the last inventory conducted in 2012, while carbon sequestration increased by 23%. Emissions from the agriculture/livestock/forestry and other land use (AFOLU) sector were estimated at 24.41 Gg CO₂-eq. Among its GHG reduction targets, São Tomé projected a goal of reducing total GHG emissions by 109 KtCO₂-eq, nearly doubling the initial target submitted in 2015. This target corresponds to an approximate 27% cut in national GHG emissions compared to the business-as-usual scenario by 2030, as outlined in its Nationally Determined Contributions (NDCs) [8].
The accumulation of GHGs in the atmosphere is driving a sustained increase in global temperatures [9,10]. This phenomenon is widely recognized as a major driver of climate change, leading to alterations in precipitation patterns, sea-level rise, and other critical ecological processes [11,12,13]. Agriculture is a major contributor to global GHG emissions, mainly due to land-use change, deforestation, fertilizer application, enteric fermentation, and manure management [14,15].
CO2 emissions from agriculture are primarily associated with fossil fuel combustion, soil degradation, and forest conversion for cropland expansion [11,16]. In addition, soils naturally release CO2 through microbial and root respiration. These processes are highly sensitive to soil temperature, moisture, nutrient availability, and organic matter quality [17,18,19]. These emissions can also be modulated by soil texture, vegetation cover, and topographic position [20,21,22,23].
Methane (CH4), the second most important biogenic GHG, is mainly produced under anaerobic conditions through enteric fermentation and organic matter decomposition in poorly aerated soils [11]. However, upland soils can act as CH4 sinks through methanotrophic activity, especially in well-aerated environments such as tropical uplands [24,25]. In contrast, periodically saturated or waterlogged soils, such as those in lowland agroforestry systems, can become net sources of CH4 [26]. Recent studies have highlighted how CH4 fluxes vary according to land cover, soil physical conditions, and vegetation structure [12,27,28].
Although present in lower concentrations, nitrous oxide (N2O) has a global warming potential 298 times greater than CO2 [9] and is strongly linked to microbial nitrification and denitrification processes [29]. In tropical agricultural systems, N2O emissions are often exacerbated by excessive nitrogen fertilizer inputs and poor nutrient use efficiency [11].
Recent research in tropical forests has shown that both the magnitude and direction of GHG fluxes can shift depending on topographic position, water saturation, and vegetation characteristics [23,26]. Similarly, in tropical agroecosystems, factors such as fertilizer application, tree density, canopy cover, and crop age have been shown to differentially influence CO₂, CH₄, and N₂O fluxes [12,13].
In this context, management practices grounded in agroecological principles—such as species diversification (agrobiodiversity), the use of leguminous cover crops, organic fertilization, and shade management—can help mitigate and stabilize net GHG emissions over the long term. These practices enhance carbon sequestration, improve soil biogeochemical processes, reduce nitrogen losses, and regulate the soil–atmosphere water balance [12,13,26,30]. Particularly in cocoa agroforestry systems, practices such as the integration of perennial and food-producing trees, organic fertilization, permanent soil cover, residue management, balanced canopy (shade) regulation, and appropriate irrigation and drainage systems are considered sustainable strategies that can help reduce CO₂, CH₄, and N₂O emissions, depending on the specific environmental conditions of each region [2,3,4,31,32].
In this context, in island countries such as São Tomé and Príncipe, where cocoa cultivation is primarily carried out by smallholder farmers under diverse environmental conditions and typically conventional management, the dynamics of GHG fluxes remain complex and poorly understood. Therefore, understanding how these fluxes vary in response to biophysical and management conditions is essential to developing climate-smart practices to address climate change in cocoa agroecosystems [4].
In this research, we tested the following hypotheses: (1) more biodiverse cacao systems produce lower GHG fluxes (CO₂, CH₄, and N₂O) compared to conventional systems, with differential responses depending on the type of gas; (2) GHG fluxes are influenced by the crop development stage, generally showing higher emissions during the growing stage compared to the productive stage; and (3) GHG fluxes are driven by different climatic and edaphic interactions, with gas-specific responses. In contrast, topographic factors are expected to have minimal or no direct influence on the regulation of these fluxes under the same management conditions. The objective of this study was to assess changes in CO₂, CH₄, and N₂O fluxes in cacao agroecosystems under contrasting management and crop development conditions in two climatic zones of São Tomé Island (Central Africa). Our findings contribute to identifying emission patterns and drivers across cacao agroecosystems, providing insights to guide the development of climate-smart practices and support policy guidelines aimed at achieving the NDC targets in São Tomé Island.
2. Materials and Methods
2.1. Study Sites
This study was conducted on São Tomé Island, part of the Democratic Republic of São Tomé and Príncipe, located in the Gulf of Guinea off the western equatorial coast of Central Africa (Figure 1). The island is of volcanic origin and forms part of the Cameroon Volcanic Line [33]. São Tomé presents a rugged topography with altitudinal gradients ranging from sea level to its highest peak, Pico de São Tomé, at 2,024 m above sea level. The island falls within the São Tomé, Príncipe, and Annobón moist lowland forest ecoregion and is home to a mosaic of forest and agricultural land uses [34]. A large portion of the remaining old-growth forest is protected under the Ôbo Natural Park, which spans approximately 235 km2 and covers 27% of the island’s surface [35]. Outside this protected area, the landscape includes secondary forests, shaded cocoa plantations, oil palm plantations, mixed subsistence agriculture, and urban settlements, each with varying degrees of human intervention. Secondary forests are typically the result of natural regrowth after plantation abandonment, while shaded plantations combine cocoa crops with a canopy of native and exotic trees [36].
São Tomé has a humid tropical climate characterized by two distinct rainy seasons, from March to May and from October to November, and two dry periods, from June to September and from December to February [37]. Average annual temperatures range from approximately 27°C at sea level to 21°C in the highlands, with relative humidity remaining high throughout the year. Precipitation is highly variable across the island, ranging from about 900 mm in the northeastern lowlands to nearly 6,000 mm in the southern mountainous region [38,39]. The soils are derived mainly from basaltic and phonolitic volcanic rocks and are classified as deep, fertile Andosols and Nitisols, with good drainage and high organic matter content [40]. Field measurements were carried out in two climatically contrasting regions based on a regional precipitation map of São Tomé Island [39]: a dry zone (northern region, Lobata District; 0°23′–0°25′ N, 6°35′–6°37′ E; 750–1,370 mm year-1) and a wet zone (southeastern region, Cantagalo District; 0°13′–0°15′ N, 6°39′–6°41′ E; 1,380–2,000 mm year-1) covering a gradient of elevation (50–343 m a.s.l.) and slope (4.4°–20.6°).
2.2. Sampling Design
The campaign was carried out between April and May, 2025, coinciding with the transition from the short rainy season to the onset of the dry period on São Tomé Island. We selected eight cacao agroecosystem types defined by the combination of three factors: climatic zone (wet or dry), system type (biodiverse or conventional), and cacao development stage (growing or productive) (Figure 1). At each combination, three replicate sampling plots (20 m × 30 m) were established, resulting in a total of 24 plots. Plots were purposively selected (spaced at least 10 m apart), based on pre-existing agroecological conditions, and aimed at internal homogeneity in slope, soil type, canopy structure, and management history.
Cacao crops ages ranged from 2 to 4 years in growing plots and from 14 to 22 years in productive ones. Overall, dominant vegetation included T. cacao, Musa acuminata, Manihot esculenta, and various fruit and timber species such as Cedrela odorata, Psidium guajava, and Persea americana. Cacao trees in growing plantations exhibited diameter at 30 cm height (DH₃₀) values between 1.3 and 3.2 cm and heights from 1.4 to 2.0 m, while productive plantations showed diameter at breast height (DBH) values from 13.9 to 15.1 cm and heights from 4.2 to 4.5 m. Soil organic carbon (SOC) stocks ranged from 55.7 to 75.9 Mg ha-1 and aboveground biomass carbon (AGBc) from 11.8 to 28.7 Mg C ha-1, reflecting the variability in vegetation structure and organic matter across sites.
Regarding cacao agroecosystem management, biodiverse systems were characterized by the integration of more sustainable practices, including the diversification of shade trees, fruit trees, and staple food crops (>7 species), canopy management to regulate shading, the use of leguminous ground covers, and the application of organic soil amendments. In contrast, conventional systems exhibited less sustainable practices, with low species diversity (3–5 species), reduced shading levels, limited ground cover, and no implementation of organic soil management practices..
This diversity of biophysical and structural conditions provided a robust framework to evaluate the influence of climate, management, and phenology on soil GHG fluxes in tropical cacao agroecosystems (Table 1; Supplementary Figure S1).
2.3. Flux Measurements
In each sampling plot, a 5-m-radius circular subplot was established, within which three static polypropylene chambers (20 cm diameter × 20 cm height) were installed in an equilateral triangle configuration with 1 m spacing between them, adapted from Daniel et al. [26]. Chamber bases were inserted 5 cm into the soil at least 24 hours prior to gas sampling to minimize disturbance. Gas samples were collected between 9:00 a.m. and 3:00 p.m. to reduce diurnal variability in fluxes [23,41]. Four gas samples were taken from each chamber at 0, 15, 30, and 45 minutes after closure, using 12 mL pre-evacuated glass vials (Labco Ltd., UK). A 15 mL syringe was used to extract gas from the chamber headspace through a rubber septum. Chamber temperature was recorded at each interval using a digital needle thermometer (Full-Scale Traceable® Thermometer, Traceable®, USA), and soil temperature (ST) (°C) and soil water content (SWC) (%) were measured with a portable sensor (TEROS 11, Decagon Devices, USA) placed at the center of the chamber triangle. One blank vial per plot was included for ambient background control.
Samples were carefully packaged and sent to the laboratory, where CO₂, CH₄, and N₂O concentrations were analyzed using a gas chromatograph (GC-2014, Shimadzu, Japan) equipped with a flame ionization detector (FID) for CO₂ and CH₄ (with methanizer) and an electron capture detector (ECD) for N₂O. Analytical conditions were: column temperature 80 °C; FID and ECD temperatures 250 °C and 325 °C, respectively; methanizer temperature 380 °C; injection volume 2 mL (automatic loop); and nitrogen carrier gas flow of 30.83 mL/min. The limits of detection (LOD) and quantification (LOQ) were 0.0211 and 0.0704 ppm for CH₄, 37 and 125 ppm for CO₂, and 0.004 and 0.012 ppm for N₂O, respectively.
Soil GHG fluxes were calculated in R using the gasfluxes package v.0.7 [42]. The minimum detectable flux (MDF) for each gas was estimated following the procedure described by Parkin et al. [43]. For each time series of gas concentrations, four models were applied: linear regression (LR), robust linear regression (RLR), Hutchinson–Mosier (HMR), and non-steady-state diffusion estimator (NDFE) [26,44,45]. These approaches allowed assessing the sensitivity of flux estimations under varying statistical assumptions and concentration patterns. Overall, 91.67% of CO₂ fluxes were estimated using RLR and 8.33% using LR. For CH₄, 95.83% were calculated with RLR and 4.17% with LR. In the case of N₂O, 90.28% of fluxes were estimated using RLR and 9.72% with LR. Gas concentrations (ppm) were converted to mass using the ideal gas law and normalized by the surface area of each chamber. Fluxes below the detection limit were excluded from analysis: 5.56% for CO₂, 12.5% for CH₄, and 15.28% for N₂O [43].
The global warming potential (GWP) at factorial combination was estimated by projecting the soil CO2, CH4, and N2O fluxes measured during the sampling campaign to annual values. GWP was expressed in t CO2-eq ha-1 year-1 using the global warming potential conversion factors of 27.2 for CH4 and 273 for N2O, as reported by the IPCC [46].
2.4. Environmental Variables Measurements
After the final GHG measurements, nine soil subsamples (one per chamber across three plots) were collected from the chamber bases at a depth of 0–20 cm. These were then homogenized to obtain three composite samples per factorial combination, following the approach of Pang et al. [47]. Soil samples were processed in the laboratory for subsequent physicochemical analyses. Soil texture (sand, clay, and silt) (%) was determined using the Bouyoucos hydrometer method. Bulk density (BD, g cm⁻³) was measured with an Eijkelkamp hand auger. Soil pH and electrical conductivity (EC, dS m⁻¹) were assessed using the saturation paste and the conductometric method [48]. Cation exchange capacity (CEC, meq 100 g⁻¹) was determined by titration with 1 M NaOH, and base saturation (BS, %) was calculated as the sum of exchangeable base cations (Ca²⁺, Mg²⁺, K⁺, and Na⁺), divided by CEC [48]. Soil organic carbon (SOC, Mg ha⁻¹) was estimated from the oxidizable organic carbon (COOx) content, obtained using the potassium dichromate colorimetric method (NTC 5403, Walkley–Black), and converted following the methods of Nelson and Somers [49] and Batjes [50]. Available phosphorus (P, mg kg⁻¹) was determined using the Bray II method, and total nitrogen (N, %) content via the Kjeldahl method [48].
Climatic and topographic variables were processed per plot using R v.4.4.3 [51] and RStudio v.2025.05.04 [52]. Elevation (m a.s.l.) was derived from AWS Terrain Tiles via the elevatr package [53]. A digital elevation model (DEM, ~30 m resolution) of São Tomé was downloaded using elevatr, from which slope (degrees) was derived with the terrain() function from the terra package [54], and values were extracted per plot using sf and terra. Daily weather data were then extracted from the NASA POWER platform using the get_power() function from the nasapower package [55], based on plot coordinates and sampling dates. Variables included air temperature at 2 m (Temp, °C), relative humidity at 2 m (RH, %), precipitation (Prec, mm day-1), 5-day cumulative precipitation (Prec_5d, mm), and solar radiation (RS, MJ m⁻² day⁻¹). Finally, reference evapotranspiration (ET0, mm day-1), was calculated using a simplified version of the Hargreaves equation [56].
2.5. Statistical Analysis
Linear mixed-effects models (LMMs) were fitted to assess the fixed effects of zone climatic, system type, development stage and their interactions on GHG fluxes using the lme function from the nlme package [57] from R 4.4.3 [51], implemented through the InfoStat v.2020 interface [58]. Plot was included as a random effect (1|Plot). Normality and homoscedasticity were evaluated thorough exploratory analysis of the model residuals. CO2 flux data were log-transformed, whereas CH4 and N2O fluxes were transformed using the formula log(flux − min(flux) + 1) in order to meet the assumption of normality [23]. To address heteroscedasticity across system types, a variance structure (varIdent) was applied [57]. Post hoc comparisons of means across fixed effects were performed using Fisher’s LSD test (α=0.05).
To explore the strength of association between gas fluxes and environmental factors (i.e., soil properties and aboveground conditions), pairwise Spearman correlation matrices were computed using the rcorr function from the Hmisc R package [59]. Based on significant correlations, dependency relationships between gas fluxes and environmental variables were further examined through simple linear regression using the lm function from the stats package [60] in R. Model evaluation included the coefficients of determination (R2) and residual diagnostics to assess the quality of fit. Resulting models were visualized using the ggplot2 R package [61].
Finally, structural equation models (SEMs) were used to examine the direct and indirect effects of environmental variables on each gas flux. The best SEMs were selected based on the Chi-square test (χ²), degrees of freedom (df), Comparative Fit Index (CFI), and Standardized Root Mean Square Residual (SRMR). SEMs were performed using the sem function from the lavaan package [62], and visualized with the grViz function from the DiagrammeR package [63] in R. All statistical analyses in R were conducted using the RStudio v.2025.05.0 interface [52].
3. Results
3.1. Soil CO2, CH4, and N2O Fluxes
Significant effects on soil CO₂ fluxes were observed for the highest-order interaction among climatic zone, system type, and cacao development stage (p < 0.05) (Figure 2A,B; Supplementary Table S1), as well as for the interaction between system type and development stage (Supplementary Figure S2). Overall, the highest CO₂ fluxes were recorded in conventional growing systems located in the wet zone (125.5 mg C m⁻² h⁻¹), whereas the lowest emissions were observed in biodiverse productive systems within the same zone (28.3 mg C m⁻² h⁻¹) (Figure 2A,B; Supplementary Table S2). Averaging across climatic zones, CO₂ fluxes were significantly higher in conventional systems at the growing stage (100.77 ± 8.07 mg C m⁻² h⁻¹) than in biodiverse systems at the productive stage (37.09 ± 8.07 mg C m⁻² h⁻¹) (Supplementary Figure S2A). A similar pattern was observed between the two system types during the productive stage, with higher CO₂ fluxes in conventional systems (53.90 ± 4.00 mg C m⁻² h⁻¹) compared to biodiverse systems (37.09 ± 8.07 mg C m⁻² h⁻¹) (p < 0.05). During the growing stage, CO₂ fluxes were also significantly higher in conventional systems compared to biodiverse systems.
For CH₄, no significant effects on soil CH₄ fluxes were observed for the highest-order interaction (Figure 2C,D; Supplementary Table S1). However, a significant interaction between system type and development stage was evidenced (p < 0.01) (Supplementary Figure S2B). Biodiverse–growing systems exhibited the highest mean CH₄ emissions (5.08 ± 1.50 μg C m⁻² h⁻¹), whereas conventional–growing systems showed the strongest CH₄ uptake (−12.58 ± 2.35 μg C m⁻² h⁻¹) (Supplementary Figure S2B; Supplementary Table S2). During the productive stage, no significant differences were observed between the two system types (p > 0.05).
Regarding N₂O fluxes, the highest-order interaction showed no significant effect (Figure 2E,F; Supplementary Table S1). Only the interactions between system type and development stage, as well as between climatic zone and development stage, showed significant effects on mean N₂O fluxes (both, p < 0.05) (Supplementary Figures S2C and S3). The highest N₂O fluxes were recorded in conventional growing systems (32.28 ± 5.76 μg N m⁻² h⁻¹), whereas biodiverse growing systems exhibited the lowest mean values (−12.59 ± 4.63 μg N m⁻² h⁻¹) (Supplementary Figure S2C). This pattern was further supported by the interaction between climatic zone and development stage, with the highest N₂O emissions observed during the growing stage in the dry zone (22.00 ± 5.22 μg N m⁻² h⁻¹), compared to the productive stage in the same zone (−6.25 ± 5.22 μg N m⁻² h⁻¹) (Supplementary Figure S3). During the growing stage, no significant differences were observed between the two zones (p > 0.05).
Figure 3 summarizes the differences and sums of means for each GHG across main effects. CO₂ flux showed the greatest contrast among the difference values with higher emissions at the growing stage (+37.3 mg C m⁻² h⁻¹) and in the dry zone (+11.3), and lower in biodiverse systems (-26.4) (Figure 3A). CH₄ emissions were slightly higher in biodiverse systems (+8.5) but lower in the dry zone and growing stage (−4.8 and −4.7, respectively). For N₂O, fluxes were higher in the growing stage (+13.4), dry zone (+9.5), and lower in biodiverse systems (−26.9).
Regarding the sum of fluxes (Figure 3B), CO₂ showed a greater contribution of positive fluxes from the growing stage (64.5%) compared to the productive stage. Likewise, conventional systems contributed more (60.3%) than biodiverse systems, and the dry zone contributed more (54.4%) than the wet zone. For CH₄, the largest contributions of negative fluxes corresponded to the growing stage (79.2%), conventional systems (66.2%), and the dry zone (78.5%). In the case of N₂O, although more balanced, positive fluxes remained dominant in the growing stage (73.5%), conventional systems (61.6%), and the dry zone (83.2%).
3.2. Soil Temperature and Water Content
During the field campaign, significant differences in ST were observed for the highest-order interaction (Figure 4A,B; Supplementary Table S1). Overall, the highest ST values were recorded in biodiverse systems at the productive stage in the wet zone (31.09 °C), whereas the lowest values were observed in biodiverse systems at the same stage in the dry zone (26.60 °C).
For SWC, no significant differences were observed for any of the studied effects or their interactions (Figure 4C,D; Supplementary Table S1). However, some trends were observed, with higher mean values in conventional productive systems in the wet zone (35.94%) and lower values in biodiverse growing systems from the same zone (22.29%) (Figure 4C,D)
3.3. Environmental Drivers of Soil GHG Fluxes
The analysis of climatic, topographic, and soil variables revealed contrasting patterns among climatic zones, system types, and developmental stages (Supplementary Table S3). Climatically, Prec_5d and Prec were consistently higher in the wet zone than in the dry zone for both stages, with particularly high values in conventional systems during the growing stage (Prec_5d: 23.14 ± 5.89 mm; Prec: 7.19 ± 2.14 mm). ET₀ and SR were greater in the dry zone, especially during the growing stage (ET₀: 402.06 ± 0.01 mm; SR: 22.28 ± 0.01 MJ m⁻² d⁻¹). RH reached higher values in the wet zone (>87%), whereas Temp showed minimal variation (27.2–27.5 °C). Slope showed notable variation between zones and systems. In the growing stage, conventional systems in the wet zone recorded the steepest slopes (20.59 ± 0.01°), whereas the lowest slopes were observed in the dry zone (4.44–6.36°). In the productive stage, slopes were moderate (10.95–12.06°). Elevation presented a marked contrast: systems in the dry zone were located at low altitudes (50–214 m a.s.l.), while those in the wet zone reached higher elevations, up to 343 m a.s.l. in conventional systems during the growing stage. Among soil properties, Clay was higher in the wet zone (up to 21%), whereas Sand predominated in the dry zone (>60% in some cases). Biodiverse systems in the dry zone had higher SOC values (up to 75.87 ± 0.75 Mg C ha⁻¹) and N than conventional systems. BD was greater in conventional systems (up to 1.19 g cm⁻³). Soil pH ranged from 5.35 to 5.77, with slightly higher values in the dry zone. CEC was higher in biodiverse systems in the wet zone (12.10 ± 1.01 meq 100 g⁻¹).
Spearman’s correlation analysis revealed multiple significant relationships between CO₂, CH₄, and N₂O fluxes and various climatic and soil variables (Figure 5).
CO₂ flux showed significant positive correlations with Prec, Temp, Prec_5d, and ST, and significant negative correlations with RH, SR, and Clay. Simple linear regression analysis of CO₂ flux against each of these variables indicated that only the relationship with Clay was not significant (Supplementary Figure S4). CH₄ flux exhibited significant negative correlations with Prec_5d, Prec, and Temp, and positive correlations with RH, SR, ET₀, pH, and SWC. However, the dependencies of CH₄ flux on SR and ET₀ were not significant (Supplementary Figure S5). N₂O flux was positively correlated with Prec, BD, N, SOC, CEC, EC, and BS, with no significant negative correlations detected with environmental variables. The dependencies of N₂O flux on CEC and BS were not significant (Supplementary Figure S6).
The SEM results explained 63% of the variance in CO₂ flux, 32% in SOC, and 14% in ST (Figure 6A). The overall model fit was very good (χ² = 4.72, df = 6, p > 0.05; CFI = 1.000; SRMR = 0.080), indicating that the specified structure was consistent with the observed data. ST had a positive and significant effect on CO₂ flux (β = 0.59, p < 0.001). SR showed a significant negative effect on CO₂ flux (β = –0.47, p < 0.01). BD had a positive and significant impact on SOC (β = 0.52, p < 0.05).
The SEM explained 58% of the variance in CH₄ flux, 24% in ST, and 22% in soil pH (Figure 6B). The model fit was good (χ² = 8.15, df = 7, p > 0.05; CFI = 0.954; SRMR = 0.040). Regarding direct effects, CH₄ flux was positively influenced by soil pH (β = 0.38, p < 0.05). In contrast, Prec had a significant negative effect on CH₄ flux (β = –0.47, p < 0.05), as did Temp (β = –0.39, p < 0.05). Temp indirectly affected CH₄ flux by increasing soil pH (β = 0.49, p < 0.05). Additionally, RH had a positive effect on soil pH (β = 0.64, p < 0.05) but a negative effect on ST (β = –1.63, p < 0.05). Conversely, ST was significantly increased by SR (β = 1.02, p < 0.05) and decreased by RH (β = –1.63, p < 0.05).
The SEM for N₂O flux showed a very good fit (χ² = 1.736, df = 2, p > 0.05; CFI = 1.00; SRMR = 0.033) (Figure 6C). The model explained 69% of the variance in N₂O flux, 37% in EC, and 17% in ST. SOC was the strongest and most significant predictor of N₂O flux (β = 0.67, p < 0.001). ST also had a significant positive effect (β = 0.30, p < 0.05). A negative effect of pH on N₂O emissions was observed (β = –0.36, p < 0.01). P had a significant positive effect on EC (β = 0.58, p < 0.001). Higher Temp values were positively associated with increased ST (β = 0.44, p < 0.05).
3.4. Global Warming Potential (GWP)
The global warming potential (GWP) of soil GHG fluxes varied markedly across system types and development stages (Table 2). In both climatic zones, higher GWP values were observed in conventional systems compared to biodiverse systems. Notably, in the wet zone, GWP reached 40.90 Mg CO2 eq ha-1 year-1 in conventional systems during the growing stage, over three times higher than in the biodiverse counterpart (12.98 Mg CO2 eq ha-1 year-1). Conversely, the lowest GWP values were observed in biodiverse systems during the productive stage in the wet zone (9.05 Mg CO2 eq ha-1 year-1). In the dry zone, differences were less pronounced, though conventional systems still tended to emit more than biodiverse systems at the same development stage. Overall, the relative contribution of CH4 and N2O fluxes to total GWP was low, accounting for approximately 2.58%, with CO2 being the dominant component of soil-derived climate impact.
4. Discussion
4.1. CO₂ Fluxes are Higher in Conventional Systems and During the Growing Stage
Our results show that CO₂ fluxes in cacao agroecosystems are strongly influenced by the interaction between climatic zone, system type, and development stage (Figure 2 and Figure 3). The highest soil CO2 emissions were observed in conventional systems during the growing stage in the wet zone, reaching 125.5 mg C m-2 h-1, whereas the lowest values were evidenced in biodiverse systems during the productive stage within the same zone (28.3 mg C m⁻² h⁻¹). The highest CO₂ flux recorded in the conventional system was more than three times higher than that observed in the same system type during the productive stage (37.09 mg C m⁻² h⁻¹), highlighting the influence of management intensity and phenological stage on soil respiration. These findings align with the seasonal trends reported by Pang et al. [12], where soil CO2 emissions in temperate forests were consistently higher during the growing season due to increased root activity and microbial metabolism, both strongly driven by temperature and substrate availability [64]. These results align with previous studies reporting that the more intensive management practices typical of conventional systems, combined with lower canopy complexity, increase soil CO₂ emissions by raising soil temperature and altering soil moisture dynamics [6,65,66].
The correlation and pathway patterns observed in our study suggest that CO₂ fluxes are strongly regulated by both climatic and edaphic factors, particularly precipitation, relative humidity, solar radiation, air temperature, clay content, and soil temperature (Figure 5 and Figure 6). This increase in CO₂ fluxes is due to greater soil respiration under warm and humid conditions that favor microbial and root activity [67,68]. The negative correlation with clay content could be associated with reduced aeration and CO₂ diffusion in finer-textured soils [69]. Similar to the observations of Pang et al. [12], our results suggest that finer textures and higher soil moisture levels may constrain gas diffusivity and alter the balance between aerobic and anaerobic processes. The negative relationship observed between solar radiation and soil CO₂ flux is explained by the greater presence of shade trees in cacao agroforestry systems, which substantially reduce the incident radiation on the soil. This attenuation of radiation creates more favorable microclimatic conditions—such as higher soil moisture and thermal stability—that stimulate soil respiration and, consequently, increase CO₂ flux [70]. In our study, neither elevation nor slope had a significant association with CO₂ fluxes. These results align with Daniel et al. [26], where the topographic gradient did not affect CO₂ emissions, but contrast with Pang et al. [12], who argue that site elevation can be used as a predictor of regional CO₂ emissions.
4.2. Net CH₄ Emissions in Biodiverse Systems and Greater Uptake in Conventional Systems
CH4 fluxes in cacao agroecosystems were strongly influenced by the interaction between system type and development stage (Figure 2 and Figure 3). Biodiverse growing systems exhibited net CH₄ emissions (5.08 µg C m⁻² h⁻¹), whereas conventional growing systems acted as stronger sinks (−12.58 µg C m⁻² h⁻¹). These results indicate that CH₄ flux direction may shift depending on vegetation structure, soil moisture, and organic inputs, as elevated rainfall and litter-derived labile carbon can enhance methanogenesis under temporarily saturated conditions [47,71]. Although biodiverse cacao systems in the growth stage exhibited net CH₄ emissions, their greater capacity to store carbon in biomass and soil (Table 1) offsets the impact of these fluxes on the system’s net carbon balance. Systems with higher tree diversity and canopy cover not only reduce incident radiation and stabilize soil temperature and moisture but also enhance long-term carbon stocks [72,73]. A recent study reported that diversified agroforestry systems have a significantly lower carbon footprint (932.1 ± 251.6 kg CO₂e ha⁻¹) compared to traditional monoculture systems (1914.4 kg CO₂e ha⁻¹) [72].
In terms of environmental drivers of CH₄ fluxes (Figure 5 and Figure 6), soil pH had a positive effect, indicating that less acidic conditions favor methane production, as most methanogens have an optimal pH range close to neutrality [74]. Conversely, precipitation and air temperature showed negative effects, suggesting that warmer and wetter conditions may reduce methane emissions by limiting anaerobic conditions in the soil. In well-aerated soils, increases in surface moisture associated with recent rainfall can stimulate methanotrophic oxidation, thereby lowering net emissions. This is consistent with the positive correlation observed between CH₄ flux and soil water content (Figure 5). These patterns reflect the dual nature of CH₄ as both a product of anaerobic processes and a substrate for aerobic oxidation [75,76].
Air temperature also indirectly influenced CH₄ fluxes by increasing soil pH, possibly through effects on base availability or organic matter decomposition dynamics [76]. Relative humidity had a positive effect on soil pH but a negative effect on soil temperature, reinforcing its role as a microclimatic regulator and suggesting an indirect positive influence on CH₄ emissions. In our study, none of the topographic variables significantly affected methane fluxes. This contrasts with Pang et al. [12], who reported higher methane emissions at sites with greater elevation, attributed to increased rainfall.
Overall, our findings support the view that CH₄ dynamics in tropical cacao agroecosystems arise from complex interactions between climatic factors (air temperature, relative humidity, and precipitation) and edaphic properties (particularly soil pH), modulated by management practices such as tree diversity.
4.3. Higher N₂O Emissions in Conventional Systems and During Growing Stages
For N₂O fluxes, the significant interactions observed between system type and development stage, as well as between climatic zone and stage, highlight the complexity of the controlling factors (Figure 2 and Figure 3). Growth-stage conventional systems recorded the highest fluxes (32.28 µg N m⁻² h⁻¹), whereas biodiverse systems functioned as net sinks (−12.59 µg N m⁻² h⁻¹). In the dry zone, emissions were markedly higher during the growth stage compared to the productive stage. Higher emissions in conventional systems may be associated with more intense nitrification–denitrification cycles resulting from soil disturbance and shorter fallow periods. In particular, moisture events following dry spells trigger substantial emission peaks, suggesting that the absence of vegetative cover and conventional management practices contribute significantly to nitrous oxide emissions [77,78]. Similarly, a recent study conducted in cacao plantations in West Africa found that shaded agroforestry systems (i.e., combining cocoa with shade or other fruit or trees and food crops) exhibit lower N₂O fluxes compared to conventional open-sun systems, owing to their greater tree cover, complex microbiotic interactions, and improved soil quality [3].
Regarding environmental drivers, soil organic carbon had the strongest and most significant direct positive effect on N₂O flux (Figure 5 and Figure 6). This finding is consistent with previous studies showing that soils with high organic matter content promote heterotrophic microbial activity and denitrification, a key process in nitrous oxide production [79]. Conversely, Pang et al. [12], reported lower N₂O emissions in sites with high dissolved organic carbon (DOC) and ammonium availability, where microbial communities may facilitate the complete reduction of N₂O under moist, low-oxygen conditions.
Soil temperature also had a direct positive effect, whereas air temperature exerted an indirect positive effect on N₂O fluxes, indicating that higher temperatures enhance microclimatic energy flows and, consequently, respiration rates and microbial processes such as nitrification and denitrification [80,81]. Soil pH had a direct negative effect on N₂O emissions, suggesting that acidity constrains the final reduction of N₂O to N₂ during denitrification, thereby favoring N₂O accumulation and release [82].
In our study, elevation and slope showed no significant impacts on N₂O fluxes, suggesting that topographic effects may occur but are context-dependent [83]. However, Pang et al. [12], observed increased soil N₂O fluxes at higher elevations, driven by greater precipitation and more pronounced freeze–thaw cycles during winter.
4.4. Global Warming Potential (GWP) and the Role of Climate-Smart Practices
The global warming potential (GWP) of soil GHG fluxes varied markedly across zone climatic, system type and cacao development stage, with the highest values observed in conventional growing systems in the wet zone, reaching 40.90 Mg CO2 eq ha-1 year-1. In contrast, the lowest GWP was recorded in biodiverse systems at the productive stage in the wet zone (9.05 Mg CO2 eq ha-1 year-1), indicating that both climate and management factors interact to influence the net climate impact of cacao agroecosystems.
On average, CO2 contributed 97.42% of total GWP, with CH4 and N2O together accounting for only 2.58%. This dominance of CO2 aligns with the findings of Pang et al. [12], who also reported that soil respiration is the primary driver of GWP in forested systems, especially under conditions of high organic matter turnover and biological activity. The limited contribution of CH4 and N2O reinforces the idea that, although these gases have much higher warming potentials per unit mass, their relatively low flux rates in upland tropical soils result in marginal climate impacts when compared to CO2.
The strong differences observed between conventional and biodiverse systems, especially in the wet zone, are likely associated with management-induced changes in soil structure, organic matter inputs, and microbial activity. As previously shown in tropical and subtropical systems, management practices that enhance litter cover, reduce disturbance, and promote root diversity can stabilize soil respiration and reduce net GHG emissions [12,26]. Moreover, increased shading and surface cover in biodiverse plots may moderate soil temperature and moisture fluctuations, further buffering CO2 release [3,68].
The cacao developmental stage had a notable influence on GWP values, with growing-phase crops consistently exhibiting higher emissions than productive-phase counterparts. This trend likely reflects the physiological and microbial dynamics associated with early vegetative growth, including intensified root respiration, greater microbial decomposition of recently incorporated organic matter, and favorable moisture conditions [76]. Similar observations have been reported in tropical agroforestry systems, where initial stages of plant establishment often coincide with peaks in biological activity and CO2 efflux [12,23]. In cacao systems, these conditions are further amplified by management practices such as organic fertilization, pruning, or replanting, which may temporarily stimulate soil respiration rates [80]. Moreover, less-developed canopies in growing plots allow greater radiation penetration and soil warming, potentially enhancing microbial metabolism and CO2 release [3,65]. These findings emphasize the importance of considering phenological stage when assessing the climate impact of agroecosystems, as GHG emissions may vary substantially throughout the crop cycle. Incorporating stage-specific dynamics into monitoring and mitigation frameworks could therefore improve the accuracy of emission estimates and inform the timing of targeted interventions in tropical cacao landscapes.
5. Conclusions
This study revealed that the highest CO₂ fluxes occurred in conventional cacao systems during the growing stage under locally wetter conditions (wet zone), whereas biodiverse systems consistently exhibited lower emissions. CH₄ fluxes generally acted as a sink, particularly in conventional systems located in the dry zone. However, net CH₄ emissions were recorded in biodiverse systems in the wet zone, suggesting that local management practices and site-specific conditions can reverse the natural sink function of soils. N₂O fluxes were generally low or negative and showed high variability across cacao agroecosystems, with the highest emissions observed in conventional growing systems in the dry zone.
Our results demonstrates that GHG dynamics in tropical cacao agroecosystems are primarily governed by intricate interactions between climatic factors—such as air temperature, relative humidity, and precipitation—and key edaphic properties, including soil pH, soil organic carbon, soil temperature, and clay content, while local topographic variables (elevation and slope) showed no significant influence.
In this study, CO₂ fluxes were the dominant driver of the GWP, accounting for approximately 97.6% of total emissions expressed as t CO₂-eq ha⁻¹ year⁻¹. The highest annual GWP was recorded in conventional cacao systems during the growing stage in wet environments (40.90 t CO₂-eq ha⁻¹ year⁻¹), whereas the lowest occurred in biodiverse productive systems under the same local conditions (9.05 t CO₂-eq ha⁻¹ year⁻¹). Although CH₄ and N₂O contributed less than 3% to the total GWP, their individual dynamics remain relevant due to their high global warming potential per unit mass.
Overall, our findings highlight the substantial climate mitigation potential of biodiverse cacao agroecosystems (i.e., biodiversity-based agroforestry), particularly when integrated with other agroecological management practices (e.g. canopy regulation, organic fertilization, and the use of legume cover crops). The promotion of such climate-smart practices could significantly reduce net GHG emissions from tropical cacao plantations, especially in wet environments and during early crop developmental stages. Future research should focus on year-round monitoring of these emissions and the integration of soil microbiological assessments to improve the accuracy of GHG balance estimates and guide the development of effective mitigation strategies in tropical cacao agroforestry systems.
Supplementary Materials
The following supporting information can be downloaded at the website of this paper posted on Preprints.org, Figure S1: Representative photographs of the eight factorial combinations in cacao agroecosystems on São Tomé Island (Central Africa), organized by climatic zone, system type, and development stage; Figure S2: Soil greenhouse gas (GHG) fluxes in cacao agroecosystems under the interaction of system type and developmental stage; Figure S3: Soil nitrous oxide (N2O) fluxes in cacao agroecosystems under the interaction of agroecological zone and developmental stage; Figure S4: Linear regressions between environmental variables and soil CO2 fluxes in cacao agroecosystems; Figure S5: Linear regressions between environmental variables and soil CH4 fluxes in cacao agroecosystems; Figure S6: Linear regressions between environmental variables and soil N2O fluxes in cacao agroecosystems; Table S1. Analysis of variance of fixed effects (zone climatic, system type, and development stage) and their interactions on soil–atmosphere greenhouse gas fluxes and environmental variables. Table S2: Estimated annual soil GHG fluxes (mean ± SE) for CO2, CH4, and N2O by zone climatic, system type, and development stage, based on sampling campaign measurements. Table S3. Mean ± standard error of climatic, topographic and edaphic variables across cacao agroecosystems by zone (dry vs wet), management type (biodiverse vs conventional), and development stage (growing vs productive).
Author Contributions
Conceptualization, A.S., C.H.R.-L., and F.B.O.; methodology, A.S., and C.H.R.-L.; software, A.S.; validation, A.S.; formal analysis, A.S.; investigation, A.S. and F.B.O.; resources, A.S. and F.B.O.; data curation, Y.D.S.-C., and A.S.; writing—original draft preparation, A.S., and Y.D.S.-C.; writing—review and editing, A.S., Y.D.S.-C., C.H.R.-L., and F.B.O.; visualization, A.S. and Y.D.S.-C.; supervision, A.S. and C.H.R.-L.; project administration, F.B.O.; funding acquisition, C.H.R.-L and F.B.O. All authors have read and agreed to the published version of the manuscript.
Funding
This research was part of the project: “Bioagrodiversidad del cacao para la conservación ambiental y la resiliencia climática - investigación de buenas prácticas entre Colombia, Portugal y Santo Tomé y Príncipe", funded under the service contract between Associação Marquês de Valle Flôr (AMVF) and Instituto Amazónico de Investigaciones Científicas SINCHI”.
Institutional Review Board Statement
Not applicable.
Data Availability Statement
Data are available from the authors upon request.
Acknowledgments
The authors would like to thank all the farmers and field assistants for their support during the fieldwork. Special thanks go to Sidney do Rosário Costa, researcher at CIAT, for his dedicated assistance with data collection, and to Ailton Mandinga, coordinator of the PAFAE project, for his valuable logistical assistance in São Tomé Island, Central Africa.
Conflicts of Interest
The authors declare no conflicts of interest. The funders had no role in the design of the study; in the collection, analyses, or interpretation of the data; in the writing of the manuscript, or in the decision to publish the results.
References
- International Cocoa Organization - ICCO Quarterly Bulletin of Cocoa Statistics (Vol. LI, No. International Cocoa Organization - ICCO Quarterly Bulletin of Cocoa Statistics (Vol. LI, No. 2). Revised Estimates of World Cocoa Production, Grindings and Stocks for the 2023/24 Cocoa Year. 2025. [Google Scholar]
- Vervuurt, W.; Slingerland, M.A.; Pronk, A.A.; Van Bussel, L.G.J. Modelling greenhouse gas emissions of cacao production in the Republic of Côte d’Ivoire. Agrofor. Syst. 2022, 96, 417–434. [Google Scholar] [CrossRef]
- Hawkins, J.W.; Gallagher, E.J.; van der Haar, S.; Sevor, M.K.; Weng, X.; Rufino, M.C.; Schoneveld, G.C. Low-emissions and profitable cocoa through moderate-shade agroforestry: Insights from Ghana. Agric. Ecosyst. Environ. 2024, 367. [Google Scholar] [CrossRef]
- Anokye, J.; Abunyewa, A.A.; Jørgensen, U.; Kaba, J.S.; Twum-Ampofo, K.; Dawoe, E.; Barnes, V.R.; Plauborg, F.; Pedersen, S.M.; Berg, T.R.; et al. Mitigation of greenhouse gas emissions through shade systems and climate-smart soil fertility interventions in cocoa landscapes in the Semi-deciduous ecological zone of Ghana. Soil Adv. 2024, 1. [Google Scholar] [CrossRef]
- Iddris, N.A.-A.; Corre, M.D.; Yemefack, M.; van Straaten, O.; Veldkamp, E. Stem and soil nitrous oxide fluxes from rainforest and cacao agroforest on highly weathered soils in the Congo Basin. Biogeosciences 2020, 17, 5377–5397. [Google Scholar] [CrossRef]
- Costa, E.N.D. da; Landim de Souza, M.F.; Lima Marrocos, P.C.; Lobão, D.; Lopes da Silva, D.M. Soil Organic Matter and CO2 Fluxes in Small Tropical Watersheds under Forest and Cacao Agroforestry. PLoS One 2018, 13, e0200550. [Google Scholar] [CrossRef]
- 2019.
- 2021.
- IPCC Climate Change 2013: The Physical Science Basis. Contribution of Working Group I to the Fifth Assessment Report of the Intergovernmental Panel on Climate Change; Stocker, T.F., Qin, D., Plattner, G.-K., Tignor, M., Allen, S.K., Boschung, J., Nauels, A., Xia, Y., Bex, V., Midgley, P.M., Eds.; Cambridge University Press, Cambridge: United Kingdom and New York, NY, USA, 2013. [Google Scholar]
- Tian, H.; Lu, C.; Ciais, P.; Michalak, A.M.; Canadell, J.G.; Saikawa, E.; Huntzinger, D.N.; Gurney, K.R.; Sitch, S.; Zhang, B.; et al. The terrestrial biosphere as a net source of greenhouse gases to the atmosphere. Nature 2016, 531, 225–228. [Google Scholar] [CrossRef]
- Filonchyk, M.; Peterson, M.P.; Zhang, L.; Hurynovich, V.; He, Y. Greenhouse gases emissions and global climate change: Examining the influence of CO2, CH4, and N2O. Sci. Total. Environ. 2024, 935, 173359. [Google Scholar] [CrossRef]
- Pang, J.; Peng, C.; Wang, X.; Zhang, H.; Zhang, S. Soil-atmosphere exchange of carbon dioxide, methane and nitrous oxide in temperate forests along an elevation gradient in the Qinling Mountains, China. Plant Soil 2023, 488, 325–342. [Google Scholar] [CrossRef]
- Bārdule, A.; Butlers, A.; Spalva, G.; Ivanovs, J.; Meļņiks, R.N.; Līcīte, I.; Lazdiņš, A. The Surface-to-Atmosphere GHG Fluxes in Rewetted and Permanently Flooded Former Peat Extraction Areas Compared to Pristine Peatland in Hemiboreal Latvia. Water 2023, 15, 1954. [Google Scholar] [CrossRef]
- Kamyab, H.; SaberiKamarposhti, M.; Hashim, H.; Yusuf, M. Carbon dynamics in agricultural greenhouse gas emissions and removals: a comprehensive review. Carbon Lett. 2023, 34, 265–289. [Google Scholar] [CrossRef]
- Mapanda, F.; Mupini, J.; Wuta, M.; Nyamangara, J.; Rees, R.M. A cross-ecosystem assessment of the effects of land cover and land use on soil emission of selected greenhouse gases and related soil properties in Zimbabwe. Eur. J. Soil Sci. 2010, 61, 721–733. [Google Scholar] [CrossRef]
- Ntamwira, J.; Ocimati, W.; Blomme, G.; Lubobo, A.K.; Pyame, D.M.L.; Djailo, B.D. Innovative agroecological practices can restore degraded farmlands and revive crop yields. Front. Sustain. Food Syst. 2023, 7. [Google Scholar] [CrossRef]
- Auffret, M.D.; Karhu, K.; Khachane, A.; Dungait, J.A.J.; Fraser, F.; Hopkins, D.W.; Wookey, P.A.; Singh, B.K.; Freitag, T.E.; Hartley, I.P.; et al. The Role of Microbial Community Composition in Controlling Soil Respiration Responses to Temperature. PLOS ONE 2016, 11, e0165448. [Google Scholar] [CrossRef] [PubMed]
- Fang, H.-J.; Yu, G.-R.; Cheng, S.-L.; Mo, J.-M.; Yan, J.-H.; Li, S. 13C abundance, water-soluble and microbial biomass carbon as potential indicators of soil organic carbon dynamics in subtropical forests at different successional stages and subject to different nitrogen loads. Plant Soil 2009, 320, 243–254. [Google Scholar] [CrossRef]
- Whitaker, J.; Ostle, N.; Nottingham, A.T.; Ccahuana, A.; Salinas, N.; Bardgett, R.D.; Meir, P.; McNamara, N.P.; Austin, A. Microbial community composition explains soil respiration responses to changing carbon inputs along anAndes-to-Amazon elevation gradient. J. Ecol. 2014, 102, 1058–1071. [Google Scholar] [CrossRef]
- Bréchet, L.; Ponton, S.; Roy, J.; Freycon, V.; Coûteaux, M.-M.; Bonal, D.; Epron, D. Do tree species characteristics influence soil respiration in tropical forests? A test based on 16 tree species planted in monospecific plots. Plant Soil 2009, 319, 235–246. [Google Scholar] [CrossRef]
- Epron, D.; Bosc, A.; Bonal, D.; Freycon, V. Spatial variation of soil respiration across a topographic gradient in a tropical rain forest in French Guiana. J. Trop. Ecol. 2006, 22, 565–574. [Google Scholar] [CrossRef]
- Luizão, R.C.C.; Luizão, F.J.; Paiva, R.Q.; Monteiro, T.F.; Sousa, L.S.; Kruijt, B. Variation of carbon and nitrogen cycling processes along a topographic gradient in a central Amazonian forest. Glob. Chang. Biol. 2004, 10, 592–600. [Google Scholar] [CrossRef]
- Courtois, E.A.; Stahl, C.; Berge, J.V.D.; Bréchet, L.; Van Langenhove, L.; Richter, A.; Urbina, I.; Soong, J.L.; Peñuelas, J.; Janssens, I.A. Spatial Variation of Soil CO2, CH4 and N2O Fluxes Across Topographical Positions in Tropical Forests of the Guiana Shield. Ecosystems 2018, 21, 1445–1458. [Google Scholar] [CrossRef]
- Dutaur, L.; Verchot, L.V. A global inventory of the soil CH4 sink. Glob. Biogeochem. Cycles 2007, 21. [Google Scholar] [CrossRef]
- Saunois, M.; Stavert, A.R.; Poulter, B.; Bousquet, P.; Canadell, J.G.; Jackson, R.B.; Raymond, P.A.; Dlugokencky, E.J.; Houweling, S.; Patra, P.K.; et al. The Global Methane Budget 2000–2017. Earth Syst. Sci. Data 2020, 12, 1561–1623. [Google Scholar] [CrossRef]
- Daniel, W.; Stahl, C.; Burban, B.; Goret, J.-Y.; Cazal, J.; Richter, A.; Janssens, I.A.; Bréchet, L.M. Tree stem and soil methane and nitrous oxide fluxes, but not carbon dioxide fluxes, switch sign along a topographic gradient in a tropical forest. Plant Soil 2023, 488, 533–549. [Google Scholar] [CrossRef]
- Wang, Y.; Chen, H.; Zhu, Q.; Peng, C.; Wu, N.; Yang, G.; Zhu, D.; Tian, J.; Tian, L.; Kang, X.; et al. Soil methane uptake by grasslands and forests in China. Soil Biol. Biochem. 2014, 74, 70–81. [Google Scholar] [CrossRef]
- Bowden, R.D.; Rullo, G.; Stevens, G.R.; Steudler, P.A. Soil Fluxes of Carbon Dioxide, Nitrous Oxide, and Methane at a Productive Temperate Deciduous Forest. J. Environ. Qual. 2000, 29, 268–276. [Google Scholar] [CrossRef]
- Davidson, E.A.; de Carvalho, C.J.R.; Figueira, A.M.; Ishida, F.Y.; Ometto, J.P.H.B.; Nardoto, G.B.; Sabá, R.T.; Hayashi, S.N.; Leal, E.C.; Vieira, I.C.G.; et al. Recuperation of nitrogen cycling in Amazonian forests following agricultural abandonment. Nature 2007, 447, 995–998. [Google Scholar] [CrossRef] [PubMed]
- Ntamwira, J.; Ocimati, W.; Blomme, G.; Lubobo, A.K.; Pyame, D.M.L.; Djailo, B.D. Innovative agroecological practices can restore degraded farmlands and revive crop yields. Front. Sustain. Food Syst. 2023, 7. [Google Scholar] [CrossRef]
- Kaba, J.S.; Agyei, E.K.; Avilineni, M.K.C.; Yamoah, F.A.; Issahaku, I.; Ntiamoah, P.; Acquah, E.; Mas-Ud, M. Agroforestry as an old approach to a new challenge of combating climate change: a critical analysis of the cocoa sector. Discov. Agric. 2024, 2, 1–10. [Google Scholar] [CrossRef]
- Becker, A.; Wegner, J.D.; Dawoe, E.; Schindler, K.; Thompson, W.J.; Bunn, C.; Garrett, R.D.; Castro-Llanos, F.; Hart, S.P.; Blaser-Hart, W.J. The unrealized potential of agroforestry for an emissions-intensive agricultural commodity. Nat. Sustain. 2025, 1–10. [Google Scholar] [CrossRef]
- Belay, I.G.; Tanaka, R.; Kitagawa, H.; Kobayashi, K.; Nakamura, E. Origin of ocean island basalts in the West African passive margin without mantle plume involvement. Nat. Commun. 2019, 10, 1–12. [Google Scholar] [CrossRef]
- Burgess, N.; Hales, J.D.; Underwood, E.; Dinerstein, E.; Olson, D.; Itoua, I.; Schipper, J.; Ricketts, T.; Newman, K. Terrestrial Ecoregions of Africa and Madagascar: A Conservation Assessment; Island Press: Washington, DC, 2004. [Google Scholar]
- Dauby, G.; Stévart, T.; Barberá, P.; Benitez, L.; do Céu Madureira, M.; Soares, F.C.; Viennois, G.; de Lima, R.F. Classification, Distribution, and Biodiversity of Terrestrial Ecosystems in the Gulf of Guinea Oceanic Islands. In Biodiversity of the Gulf of Guinea Oceanic Islands. In Biodiversity of the Gulf of Guinea Oceanic Islands; Springer International Publishing: Cham, 2022; pp. 37–69. [Google Scholar]
- Soares, F.C.; Panisi, M.; Sampaio, H.; Soares, E.; Santana, A.; Buchanan, G.M.; Leal, A.I.; Palmeirim, J.M.; de Lima, R.F. Land-use intensification promotes non-native species in a tropical island bird assemblage. Anim. Conserv. 2020, 23, 573–584. [Google Scholar] [CrossRef]
- Chou, S.C.; Lyra, A.d.A.; Gomes, J.L.; Rodriguez, D.A.; Martins, M.A.; Resende, N.C.; Tavares, P.d.S.; Dereczynski, C.P.; Pilotto, I.L.; Martins, A.M.; et al. Downscaling projections of climate change in Sao Tome and Principe Islands, Africa. Clim. Dyn. 2020, 54, 4021–4042. [Google Scholar] [CrossRef]
- Ministry of Infrastructure Natural Resources and Environment São Tomé and Príncipe National Biodiversity Strategy And Action Plan 2015-2020 (NBSAP II). National Commission for Monitoring and Evaluation 2015.
- Lima, D.; de Oliveira, R.P. Caracterização Dos Recursos Hídricos, Dos Serviços de Água de São Tomé e Principe, Dos Cenários de Alteração Climática e Dos Seus Impactos 2017.
- Contreras, B.V.; Keese, A. The Art of Running Away: Escapes and Flight Movements During the Great Depression in São Tomé e Príncipe, 1930–1936. Int. Rev. Soc. Hist. 2021, 66, 357–388. [Google Scholar] [CrossRef]
- Pavelka, M.; Acosta, M.; Kiese, R.; Altimir, N.; Brümmer, C.; Crill, P.; Darenova, E.; Fuß, R.; Gielen, B.; Graf, A.; et al. Standardisation of chamber technique for CO2, N2O and CH4 fluxes measurements from terrestrial ecosystems. Int. Agrophysics 2018, 32, 569–587. [Google Scholar] [CrossRef]
- Parkin, T.B.; Venterea, R.T.; Hargreaves, S.K. Calculating the Detection Limits of Chamber-Based Soil Greenhouse Gas Flux Measurements. J Environ Qual 2012, 41, 705–715. [Google Scholar] [CrossRef]
- Parkin, T.B.; Venterea, R.T.; Hargreaves, S.K. Calculating the Detection Limits of Chamber-based Soil Greenhouse Gas Flux Measurements. J. Environ. Qual. 2012, 41, 705–715. [Google Scholar] [CrossRef]
- Pedersen, A.R.; Petersen, S.O.; Schelde, K. A comprehensive approach to soil-atmosphere trace-gas flux estimation with static chambers. Eur. J. Soil Sci. 2010, 61, 888–902. [Google Scholar] [CrossRef]
- Hüppi, R.; Felber, R.; Krauss, M.; Six, J.; Leifeld, J.; Fuß, R.; Sainju, U.M. Restricting the nonlinearity parameter in soil greenhouse gas flux calculation for more reliable flux estimates. PLOS ONE 2018, 13, e0200876. [Google Scholar] [CrossRef]
- IPCC Climate Change 2021: The Physical Science Basis. Contribution of Working Group I to the Sixth Assessment Report of the Intergovernmental Panel on Climate Change. 2021.
- Pang, J.; Peng, C.; Wang, X.; Zhang, H.; Zhang, S. Soil-atmosphere exchange of carbon dioxide, methane and nitrous oxide in temperate forests along an elevation gradient in the Qinling Mountains, China. Plant Soil 2023, 488, 325–342. [Google Scholar] [CrossRef]
- Soil Survey Staff Kellogg Soil Survey Laboratory Methods Manual. Soil Survey Investigations Report No. 42, Version 6.0. U. 2022.
- Nelson, D.W.; Sommers, L.E. Total Carbon, Organic Carbon, and Organic Matter. In Methods of Soil Analysis;SSSA Book Series; 1996; pp. 961–1010 ISBN 9780891188667.
- Batjes, N. Total carbon and nitrogen in the soils of the world. Eur. J. Soil Sci. 1996, 47, 151–163. [Google Scholar] [CrossRef]
- R Core Team R: A Language and Environment for Statistical Computing 2025.
- RStudio RStudio Version 2025. 05.0 2025.
- Hollister, J.; Shah, T.; Nowosad, J.; Robitaille, A.L.; Beck, M.W.; Johnson, M. Elevatr: Access Elevation Data from Various APIs. CRAN: Contributed Packages 2023.
- Hijmans, R.J. Terra: Spatial Data Analysis. CRAN: Contributed Packages 2025.
- Sparks, A. nasapower: A NASA POWER Global Meteorology, Surface Solar Energy and Climatology Data Client for R. J. Open Source Softw. 2018, 3. [Google Scholar] [CrossRef]
- Hargreaves, G.H.; Samani, Z.A. Reference Crop Evapotranspiration from Temperature. Appl. Eng. Agric. 1985, 1, 96–99. [Google Scholar] [CrossRef]
- Pinheiro, J.; Bates, D.; DebRoy, S.; Sarkar, D. Nlme: Linear and Nonlinear Mixed Effects Models. R Package Version 3.1-131. 2018. [Google Scholar]
- Di Rienzo, J.A.; Casanoves, F.; Balzarini, M.G.; Gonzalez, L.; Tablada, M.; Robledo, C.W. InfoStat Versión 2020 2020.
- Harrell Jr, F.E. Hmisc: Harrell Miscellaneous. Version: 5.1-3. CRAN: Contributed Packages 2024.
- Worldwide, R.C.T. and contributors Package The R Stats Package Version 4. 3.3. 2024.
- Wickham, H.; Chang, W.; Henry, L.; Pedersen, T.; Takahashi, K.; Wilke, C.; Woo, K.; Yutani, H. [aut]; Dunnington, D. Package ‘Ggplot2’: Create Elegant Data Visualisations Using the Grammar of Graphics Version 3.3.3. 2020.
- Rosseel, Y. lavaan: AnRPackage for Structural Equation Modeling. J. Stat. Softw. 2012, 48, 1–36. [Google Scholar] [CrossRef]
- Iannone, R.; Roy, O. DiagrammeR: Graph/Network Visualization. Version: 1.0.11. CRAN: Contributed Packages.
- Luo, Y.; Zhou, X. Soil Respiration and the Environment; Elsevier, 2006; ISBN 9780120887828.
- Kouadio, K.A.L.; Kouakou, A.T.M.; Zanh, G.G.; Jagoret, P.; Bastin, J.-F.; Barima, Y.S.S. Floristic structure, potential carbon stocks, and dynamics in cocoa-based agroforestry systems in Côte d’Ivoire (West Africa). Agrofor. Syst. 2024, 99, 1–25. [Google Scholar] [CrossRef]
- Wolf, S.; Paul-Limoges, E. Drought and heat reduce forest carbon uptake. Nat. Commun. 2023, 14, 1–4. [Google Scholar] [CrossRef]
- Neto, E.S.; Carmo, J.B.; Keller, M.; Martins, S.C.; Alves, L.F.; Vieira, S.A.; Piccolo, M.C.; Camargo, P.; Couto, H.T.Z.; Joly, C.A.; et al. Soil-atmosphere exchange of nitrous oxide, methane and carbon dioxide in a gradient of elevation in the coastal Brazilian Atlantic forest. Biogeosciences 2011, 8, 733–742. [Google Scholar] [CrossRef]
- Li, T.; Lu, L.; Kang, Z.; Li, H.; Li, H. Warming enhances soil microbial respiration through divergent mechanisms in a tropical forest and a temperate forest. Geoderma 2025, 459. [Google Scholar] [CrossRef]
- Gui, W.; You, Y.; Yang, F.; Zhang, M. Soil Bulk Density and Matric Potential Regulate Soil CO2 Emissions by Altering Pore Characteristics and Water Content. Land 2023, 12, 1646. [Google Scholar] [CrossRef]
- Kohl, T.; Niether, W.; Abdulai, I. Impact of common shade tree species on microclimate and cocoa growth in agroforestry systems in Ghana. Agrofor. Syst. 2024, 98, 1579–1590. [Google Scholar] [CrossRef]
- Feng, H.; Guo, J.; Malghani, S.; Han, M.; Cao, P.; Sun, J.; Xu, X.; Xu, X.; Wang, W. Effects of Soil Moisture and Temperature on Microbial Regulation of Methane Fluxes in a Poplar Plantation. Forests 2021, 12, 407. [Google Scholar] [CrossRef]
- Miharza, T.; Wijayanto, N.; Roshetko, J.M.; Siregar, I.Z. Carbon stocks and footprints of smallholder cacao systems in Polewali Mandar, West Sulawesi. Front. Environ. Sci. 2023, 11, 680984. [Google Scholar] [CrossRef]
- Dawoe, E.; Asante, W.; Acheampong, E.; Bosu, P. Shade tree diversity and aboveground carbon stocks in Theobroma cacao agroforestry systems: implications for REDD+ implementation in a West African cacao landscape. Carbon Balance Manag. 2016, 11, 1–13. [Google Scholar] [CrossRef]
- Qiu, S.; Zhang, X.; Xia, W.; Li, Z.; Wang, L.; Chen, Z.; Ge, S. Effect of extreme pH conditions on methanogenesis: Methanogen metabolism and community structure. Sci. Total. Environ. 2023, 877, 162702. [Google Scholar] [CrossRef]
- Conrad, R. Microbial Ecology of Methanogens and Methanotrophs. Adv. Agron. 2007, 96, 1–63. [Google Scholar] [CrossRef]
- Le Mer, J.; Roger, P. Production, oxidation, emission and consumption of methane by soils: A review. Eur. J. Soil Biol. 2001, 37, 25–50. [Google Scholar] [CrossRef]
- Ju, O.; Kang, N.; Soh, H.; Park, J.-S.; Choi, E.; Jeong, H. Nitrous Oxide Emissions during Cultivation and Fallow Periods from Rice Paddy Soil under Urea Fertilization. Atmosphere 2024, 15, 143. [Google Scholar] [CrossRef]
- Wang, L.; Hao, D.-C.; Fan, S.; Xie, H.; Bao, X.; Jia, Z.; Wang, L. N2O Emission and Nitrification/Denitrification Bacterial Communities in Upland Black Soil under Combined Effects of Early and Immediate Moisture. Agriculture 2022, 12, 330. [Google Scholar] [CrossRef]
- Butterbach-Bahl, K.; Baggs, E.M.; Dannenmann, M.; Kiese, R.; Zechmeister-Boltenstern, S. Nitrous oxide emissions from soils: How well do we understand the processes and their controls? Philos. Trans. R. Soc. B Biol. Sci. 2013, 368, 20130122. [Google Scholar] [CrossRef] [PubMed]
- Chen, Q.; Chang, L.; Khan, K.S.; Chai, S.; Chai, Y.; Han, F. The Impact of the Soil Environment and Surface Mulching on N2O Emissions from Farmland. Sustainability 2025, 17, 2502. [Google Scholar] [CrossRef]
- Wang, C.; Amon, B.; Schulz, K.; Mehdi, B. Factors That Influence Nitrous Oxide Emissions from Agricultural Soils as Well as Their Representation in Simulation Models: A Review. Agronomy 2021, 11, 770. [Google Scholar] [CrossRef]
- Žurovec, O.; Wall, D.P.; Brennan, F.P.; Krol, D.J.; Forrestal, P.J.; Richards, K.G. Increasing Soil PH Reduces Fertiliser Derived N2O Emissions in Intensively Managed Temperate Grassland. Agric Ecosyst Environ 2021, 311, 107319. [Google Scholar] [CrossRef]
- Turner, P.A.; Griffis, T.J.; Lee, X.; Baker, J.M.; Venterea, R.T.; Wood, J.D. Indirect Nitrous Oxide Emissions from Streams within the US Corn Belt Scale with Stream Order. Proceedings of the National Academy of Sciences 2015, 112, 9839–9843. [Google Scholar] [CrossRef]
Figure 1.
Location of São Tomé Island in the Gulf of Guinea, Central Africa, and distribution of the study plots in the northern (Lobata) and southeastern (Cantagalo) regions. Zone: D = dry zone (northern São Tomé), W = wet zone (southeastern São Tomé); system type: B = biodiverse cacao system, C = conventional cacao system; cacao development stage: G = growing stage, P = productive stage.
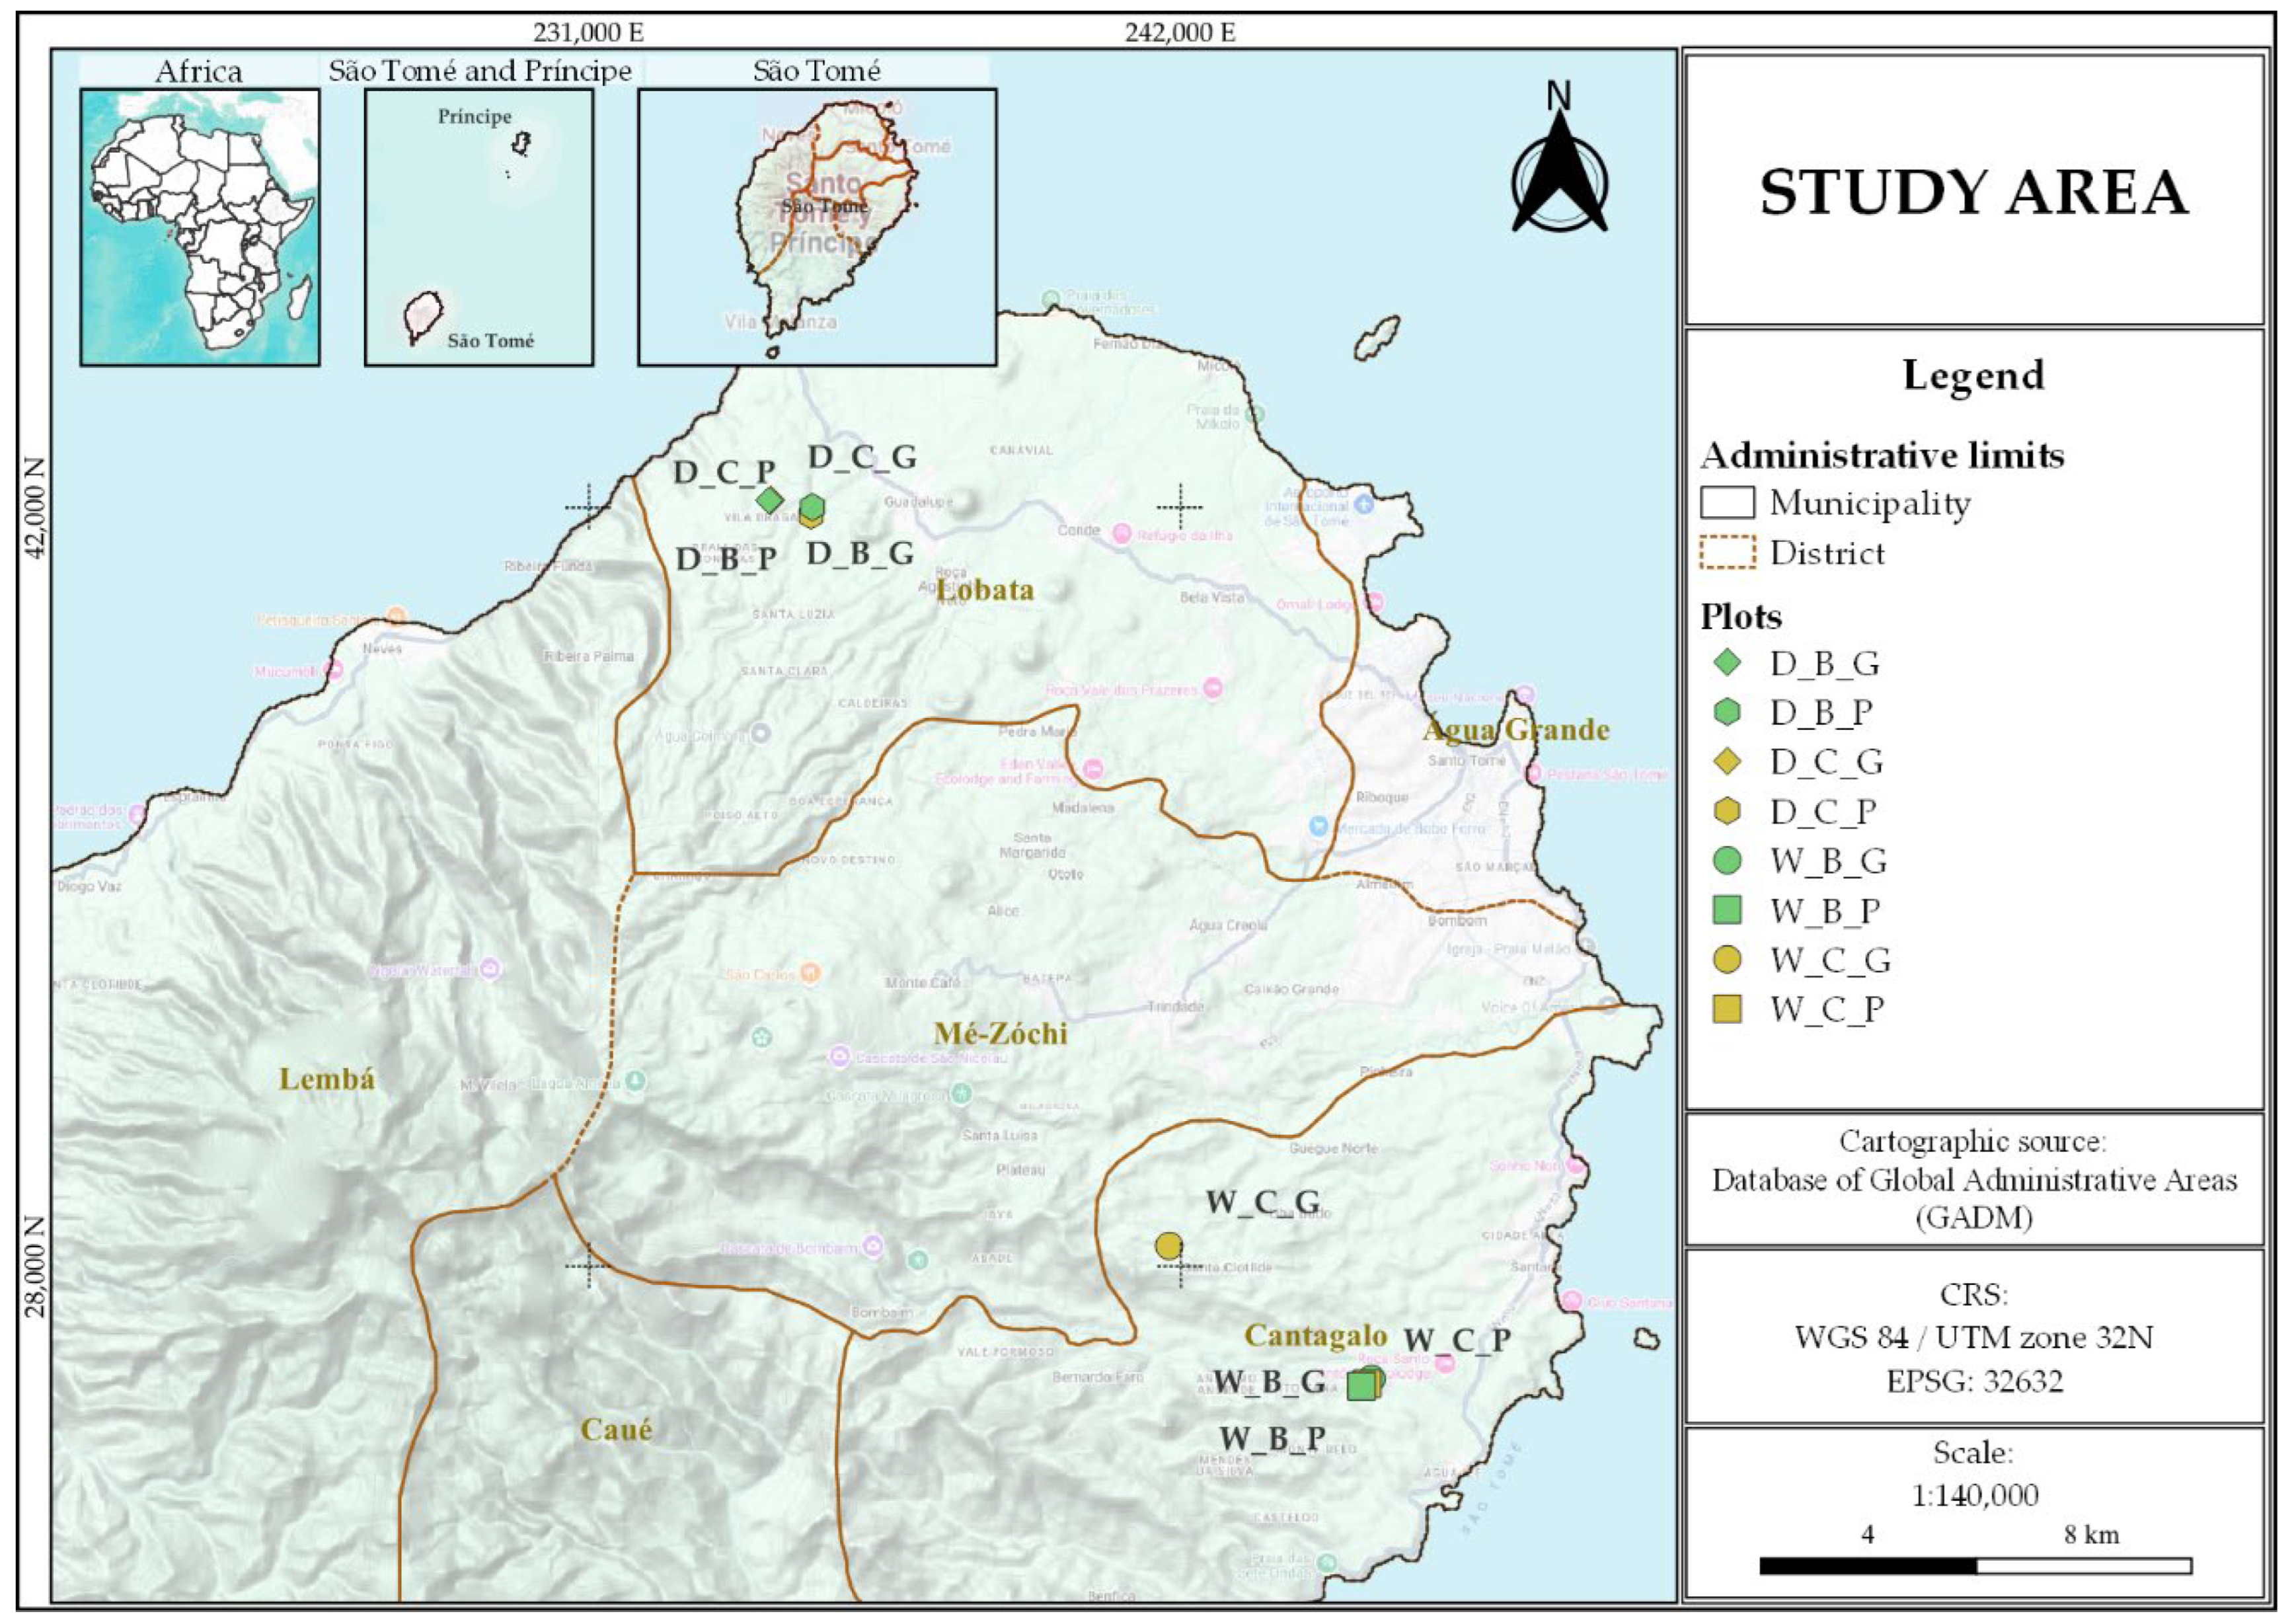
Figure 2.
Soil GHG fluxes in cacao agroecosystems under different combinations of climatic zone, system type, and developmental stage. Boxplots show CO₂ fluxes (mg C m⁻² h⁻¹) in (A) and (B), CH₄ fluxes (μg C m⁻² h⁻¹) in (C) and (D), and N₂O fluxes (μg N m⁻² h⁻¹) in (E) and (F), according to the factorial combinations defined by climatic zone (Wet, Dry), system type (Conventional, Biodiverse), and development stage (Growing, Productive). Boxes represent interquartile ranges, horizontal lines indicate medians, whiskers denote minimum and maximum values, and dots correspond to outliers. Different letters indicate statistically significant differences among factorial combinations based on Fisher’s LSD test (p < 0.05). Values represent means ± standard error (n = 3).
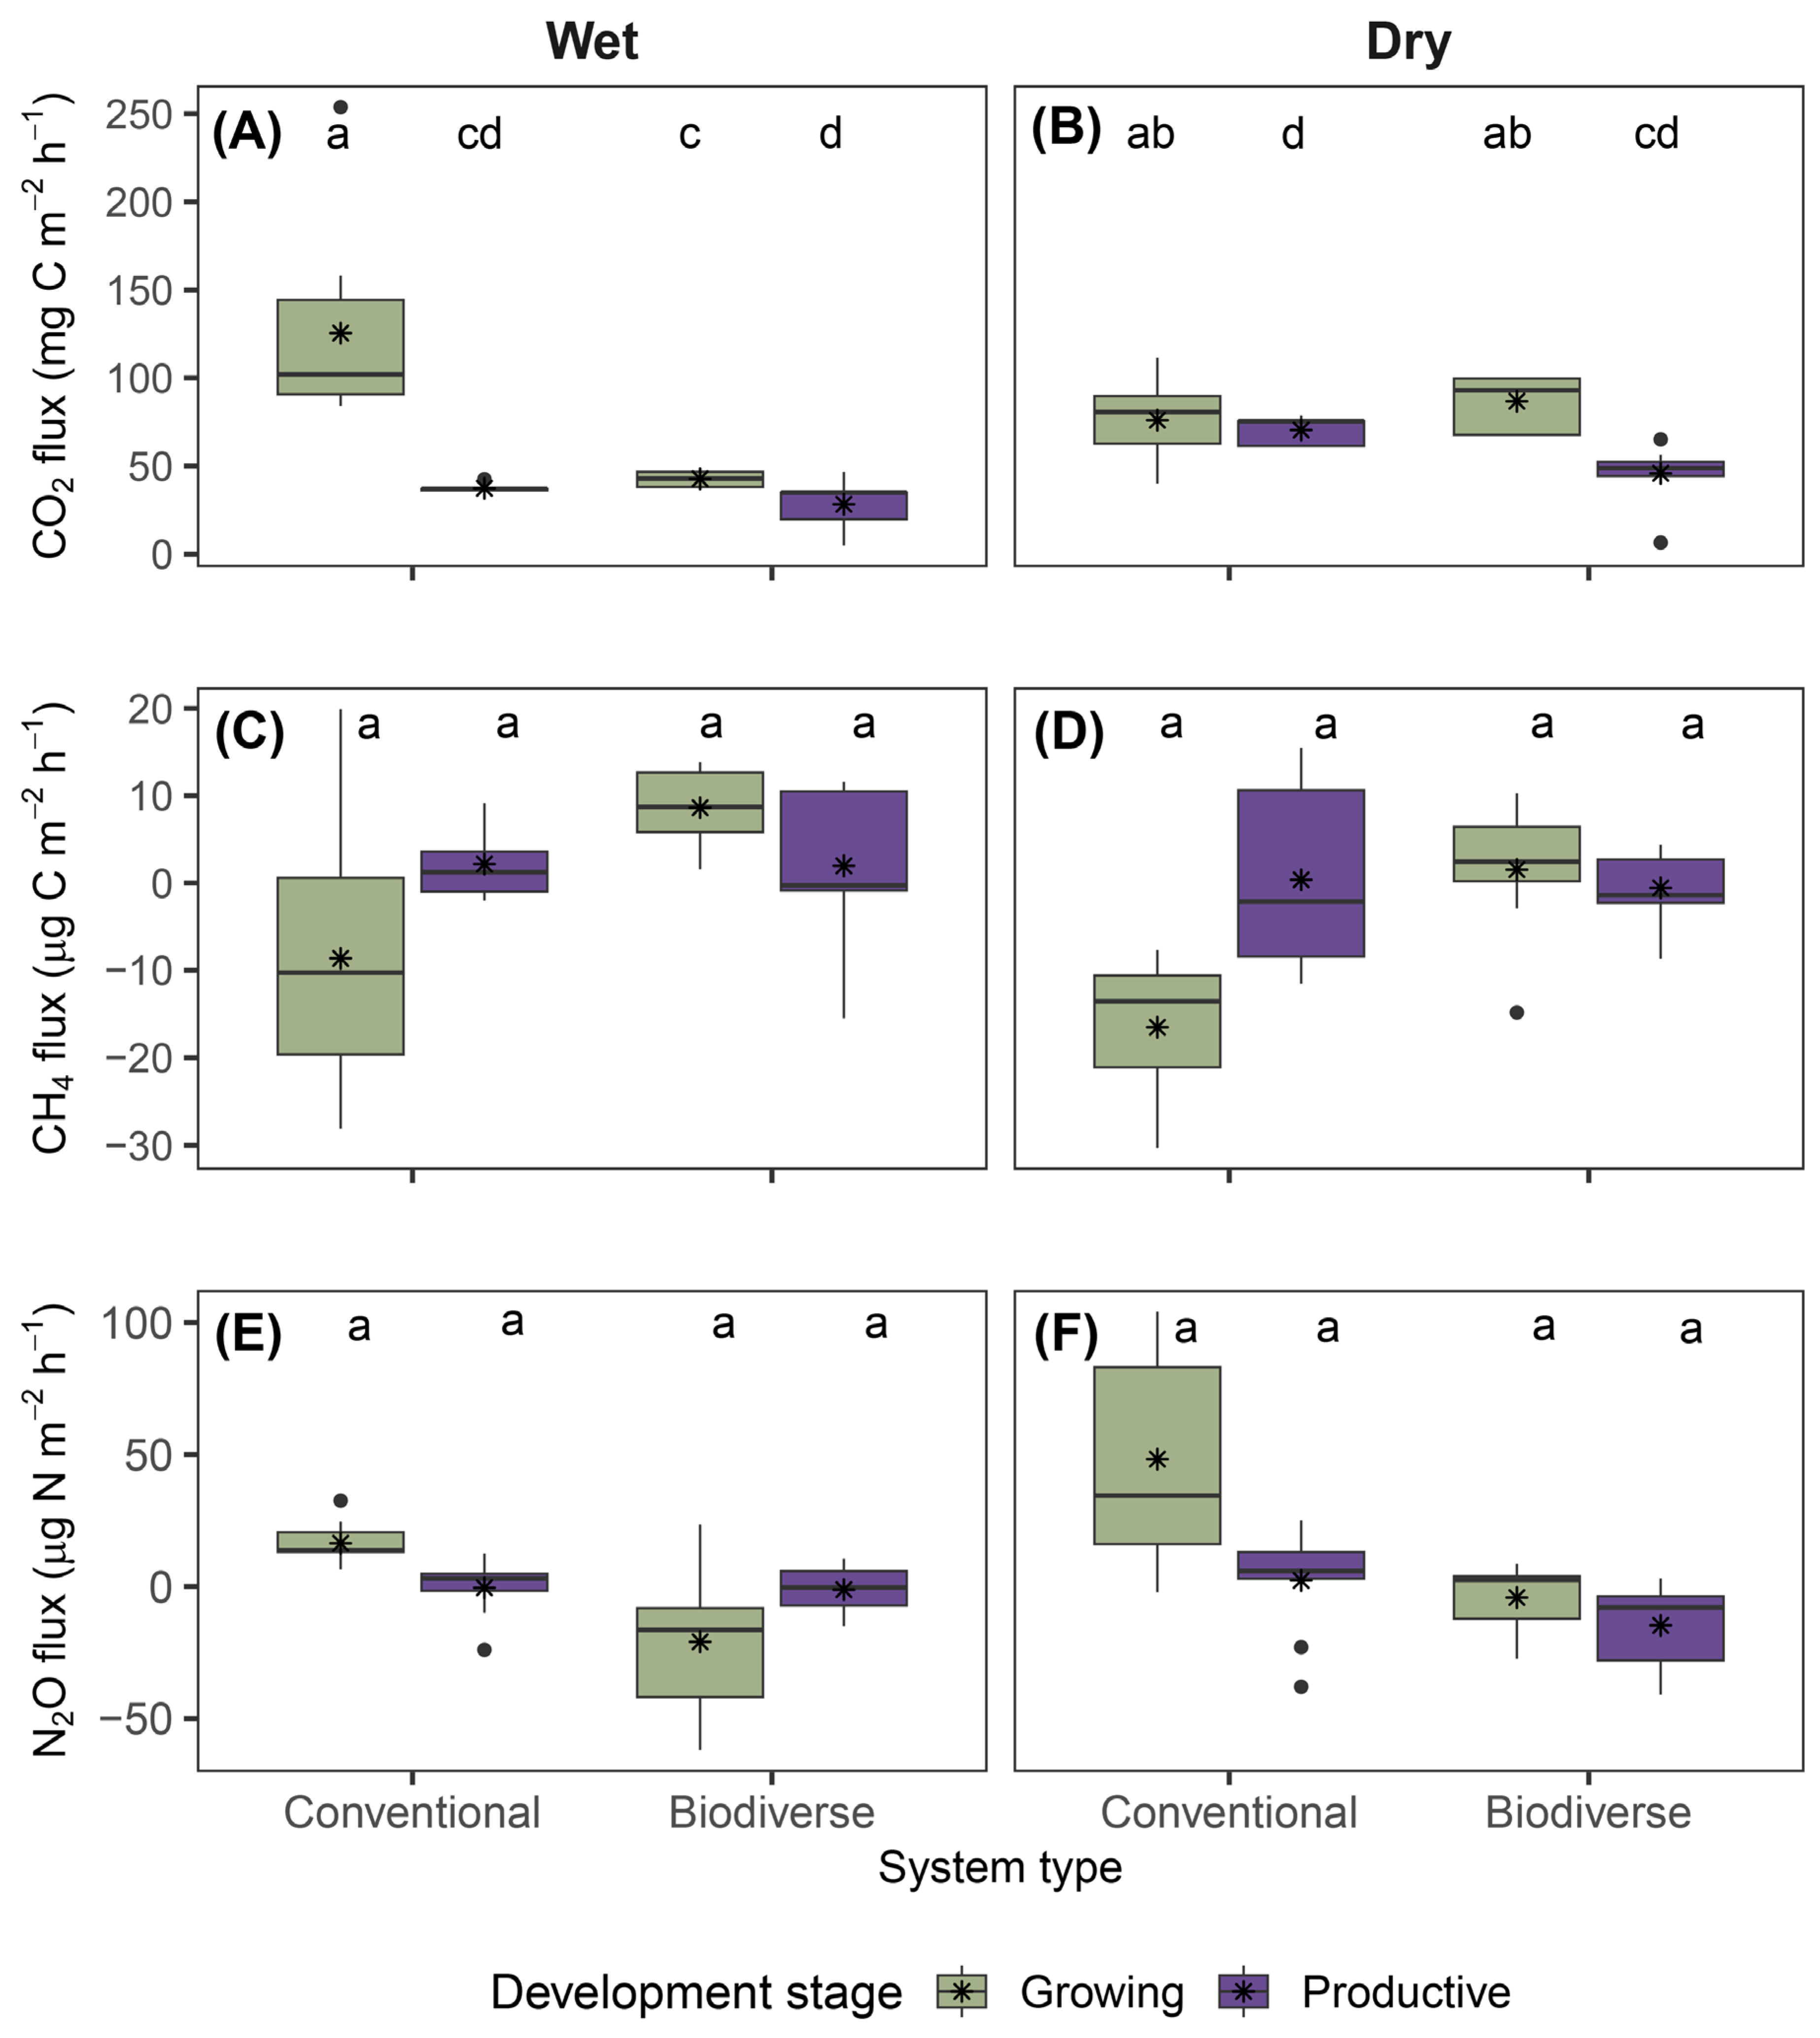
Figure 3.
(A) Differences in average GHG fluxes between the two levels of each factor: development stage (Growing vs. Productive), system type (Biodiverse vs. Conventional), and climatic zone (Dry vs. Wet). Values represent the difference for each gas: CO₂ in mg C m⁻² h⁻¹, and CH₄ and N₂O in μg C/N m⁻² h⁻¹. (B) Sum of average fluxes per gas by factor, disaggregated by level. Colors indicate the relative contribution of each level to the total. GHG fluxes varied according to the development stage, system type, and climatic zone.
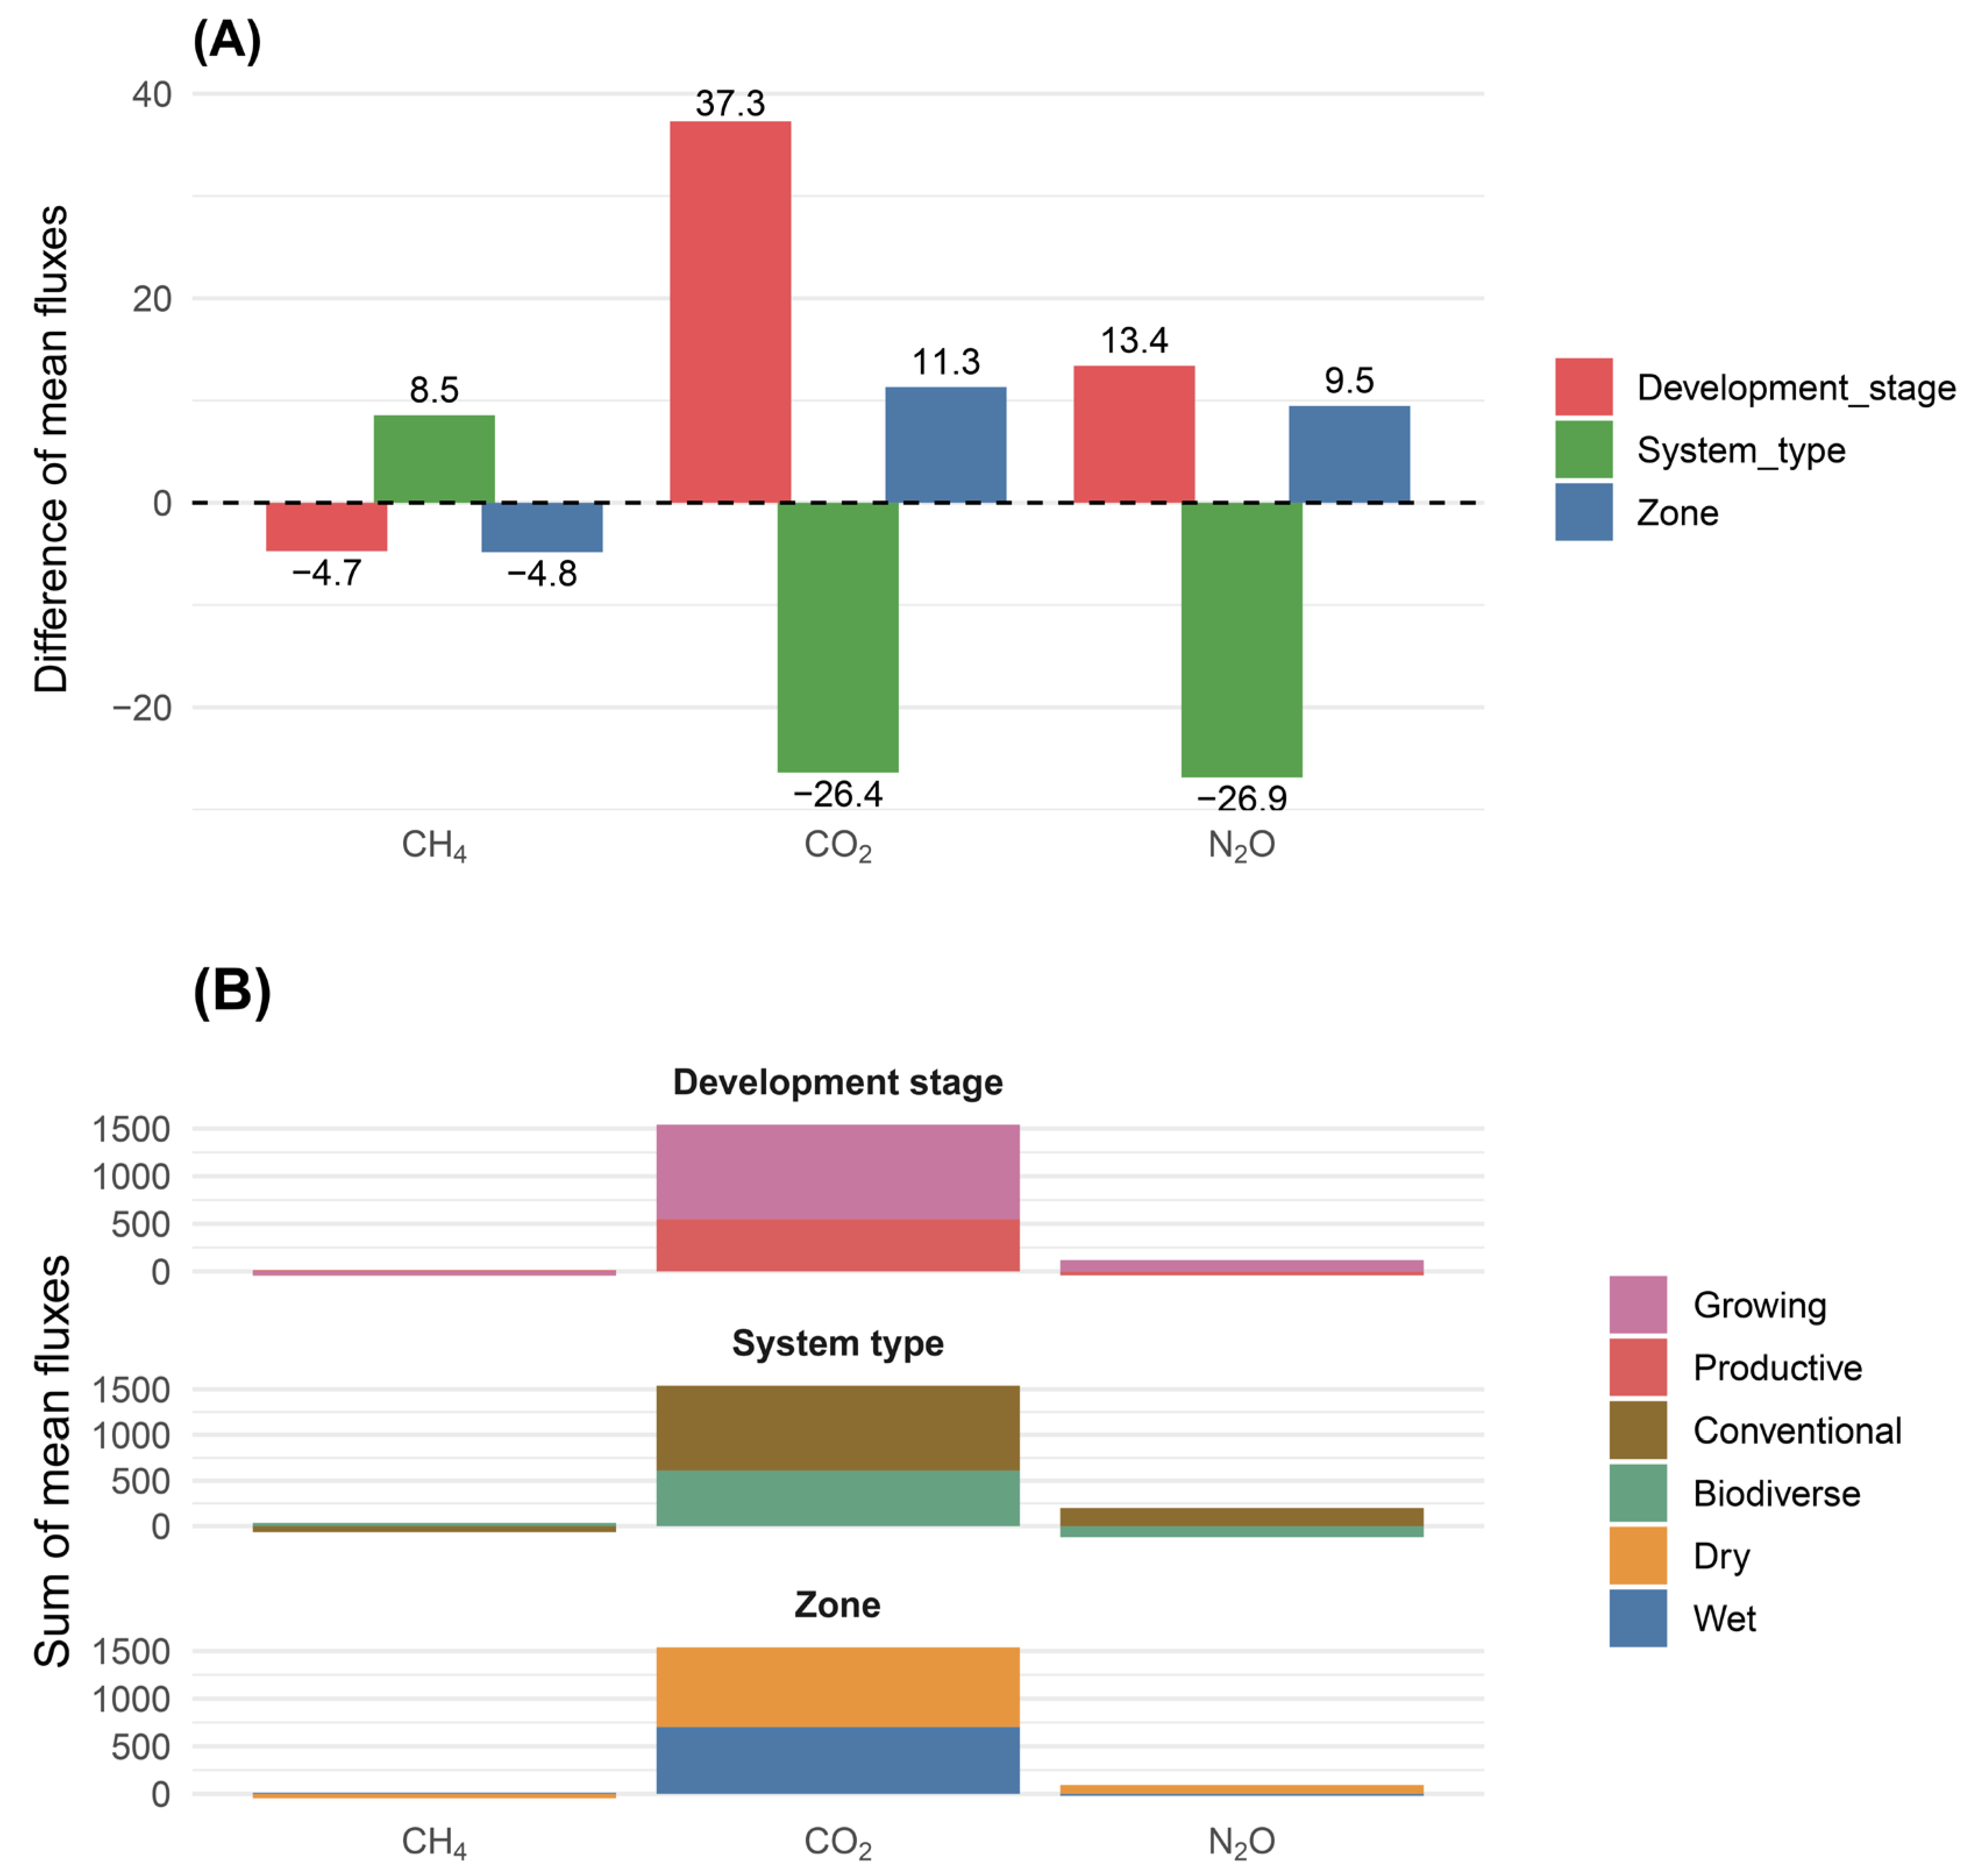
Figure 4.
Variation in soil temperature (ST, °C) and soil water content (SWC, %) in cacao agroecosystems under different combinations of climatic zone, system type, and developmental stage. Boxplots show the distribution of mean ST (°C) values in (A) and (B), and SWC (%) values in (C) and (D), according to the factorial combinations defined by climatic zone (Wet, Dry), system type (Conventional, Biodiverse), and development stage (Growing, Productive). Asterisks represent mean values. Differences among factorial combinations were evaluated using Fisher’s LSD test (p < 0.05). Values represent means ± standard error (n = 3).
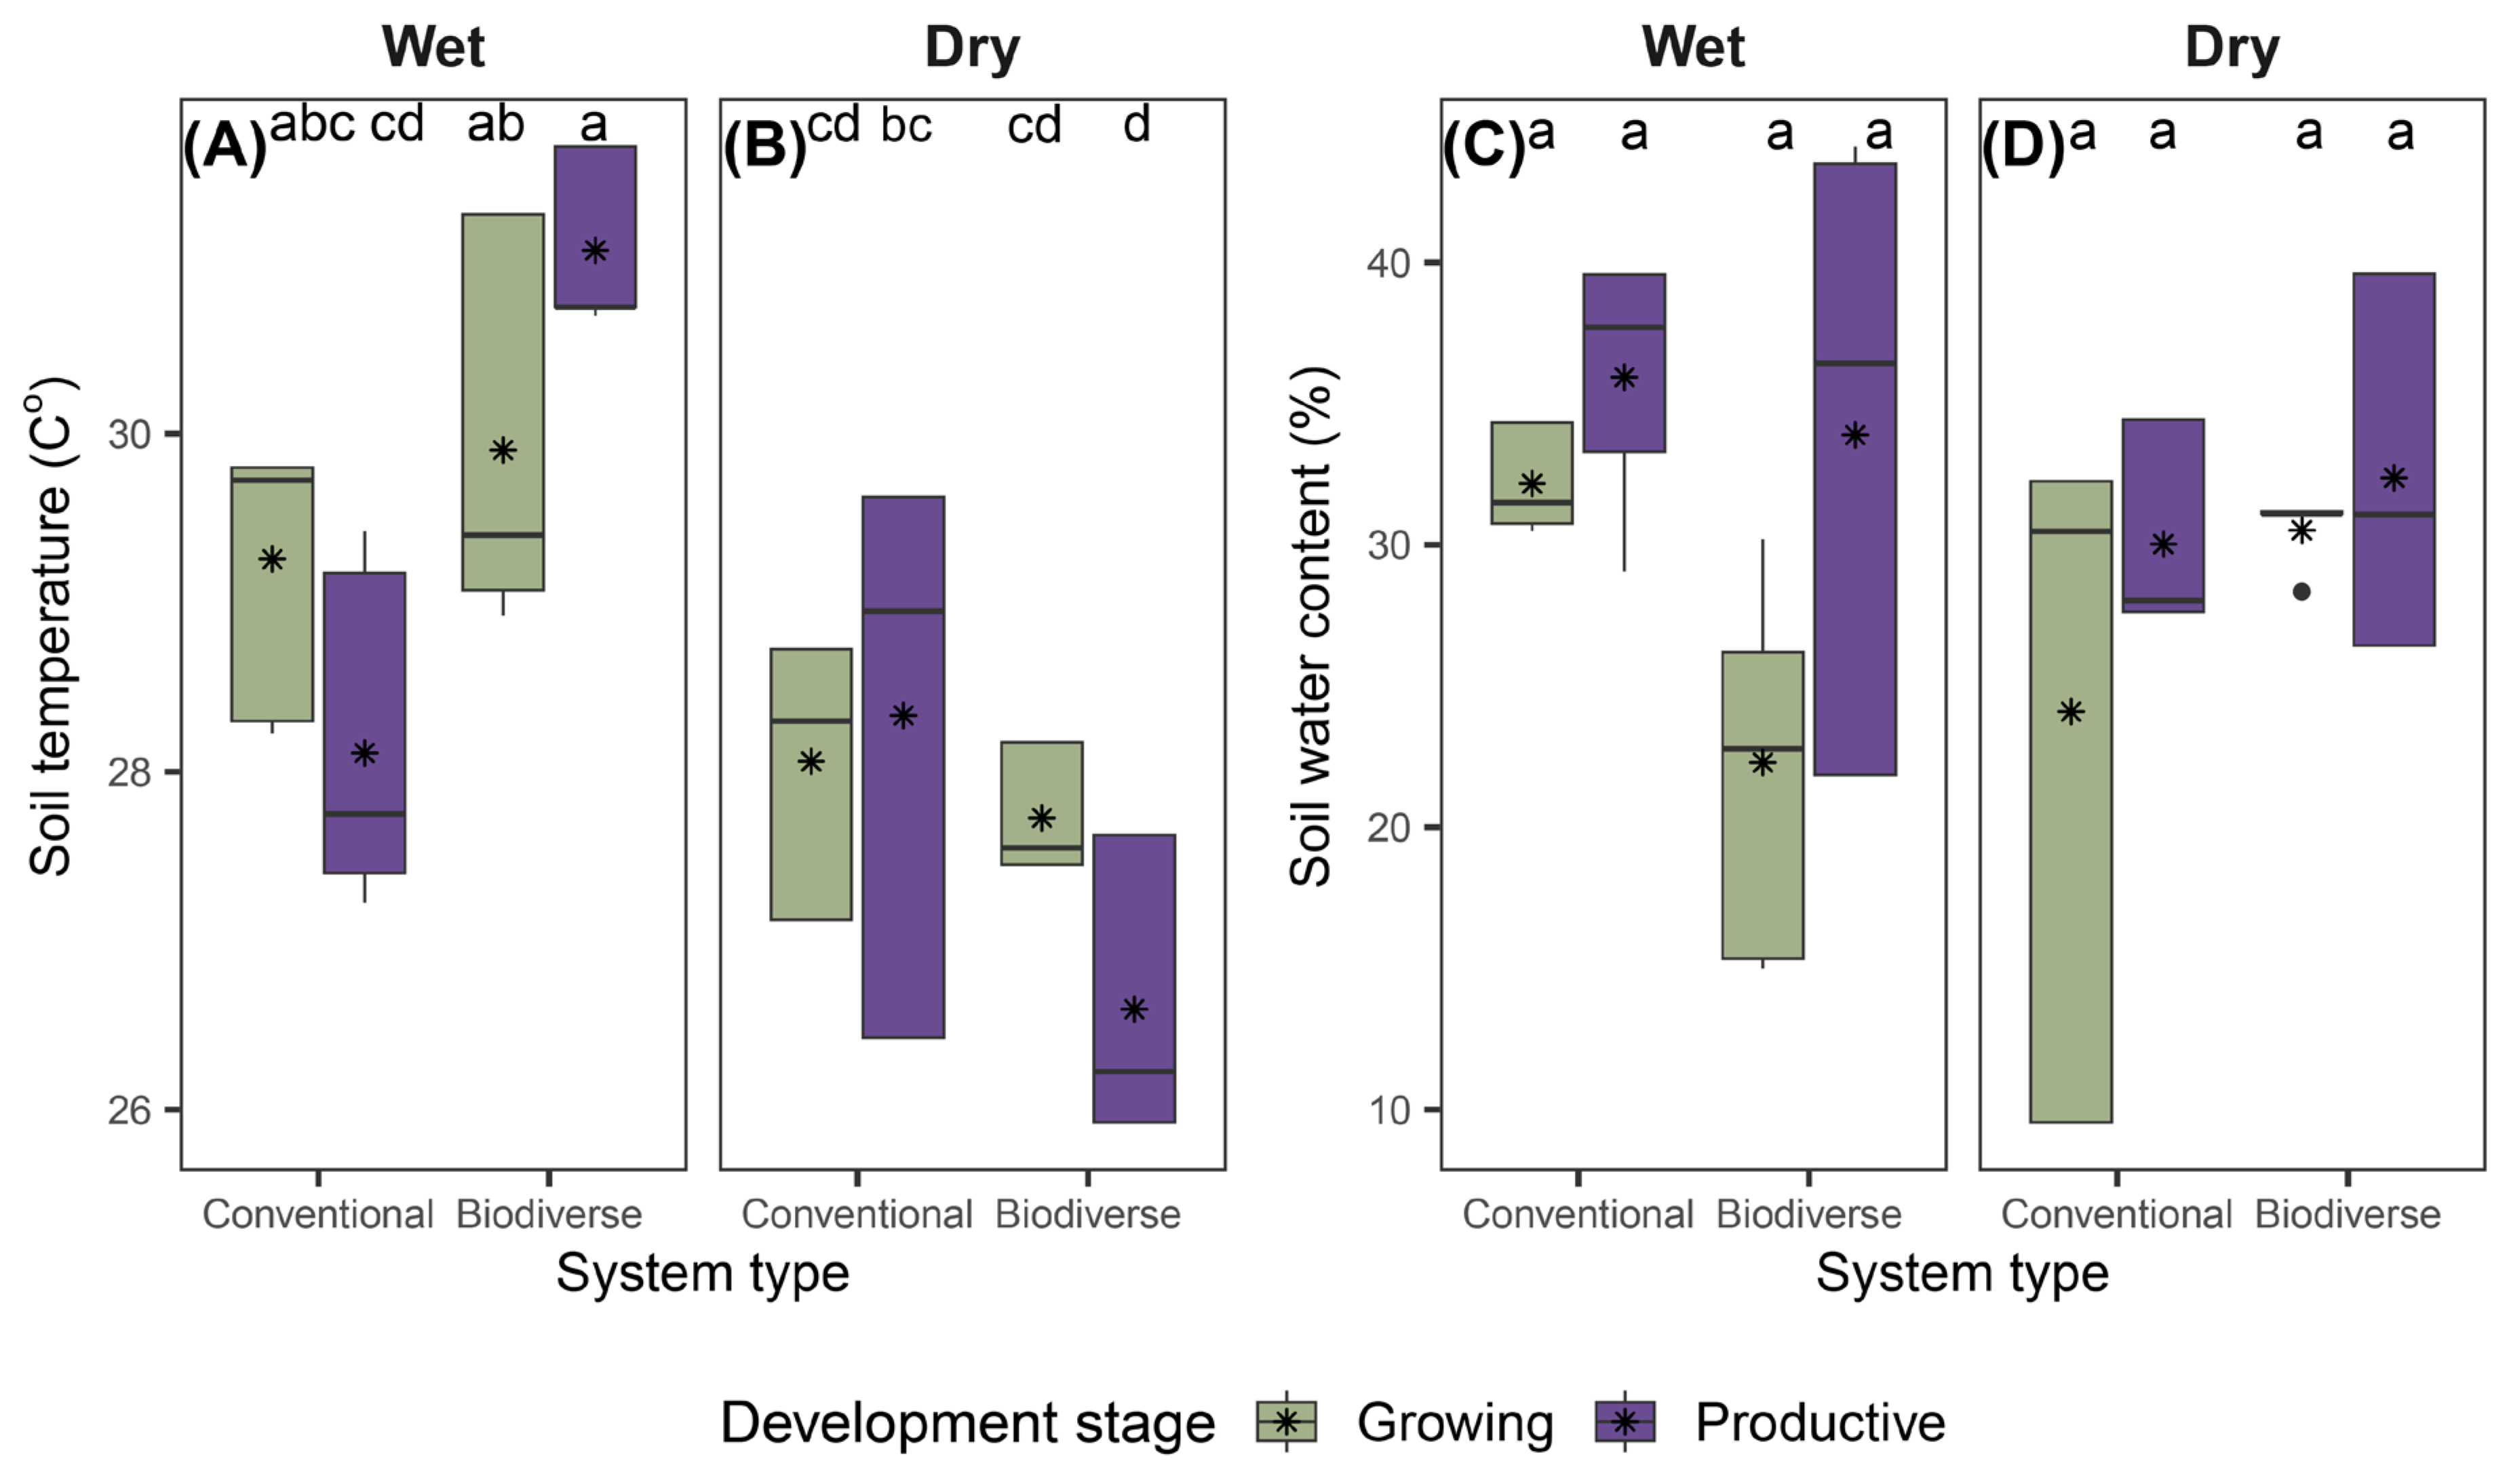
Figure 5.
Spearman correlation matrix between soil GHG fluxes (CO2, CH4, and N2O) and environmental variables (n = 24). Cell values represent correlation coefficients, where p < 0.05 (*), p < 0.01 (**), and p < 0.001 (***). Colors indicate the strength and direction of the correlation: blue for positive and red for negative values. Variable abbreviations: CO2 flux in mg C m-2 h-1; CH4 flux in µg C m-2 h-1; N2O flux in µg N m-2 h-1; ST: soil temperature (°C); SWC: soil water content (%); BS: base saturation (%); pH: soil pH; EC: electrical conductivity (dS m-1); CEC: cation exchange capacity (meq 100 g-1); SOC: soil organic carbon (Mg ha-1); N: total nitrogen (%); BD: bulk density (g cm-3); Clay: clay content (%); Sand: sand content (%); Silt: silt content (%); P: available phosphorus (mg kg-1); Elevation: elevation above sea level (m); Slope: terrain slope (°); Temp: air temperature at 2 m (°C); RH: relative humidity at 2 m (%); Prec: precipitation (mm day-1); SR: solar radiation (MJ m-2 day-1); ET0: reference evapotranspiration (mm day-1); Prec_5d: 5-day cumulative precipitation (mm).
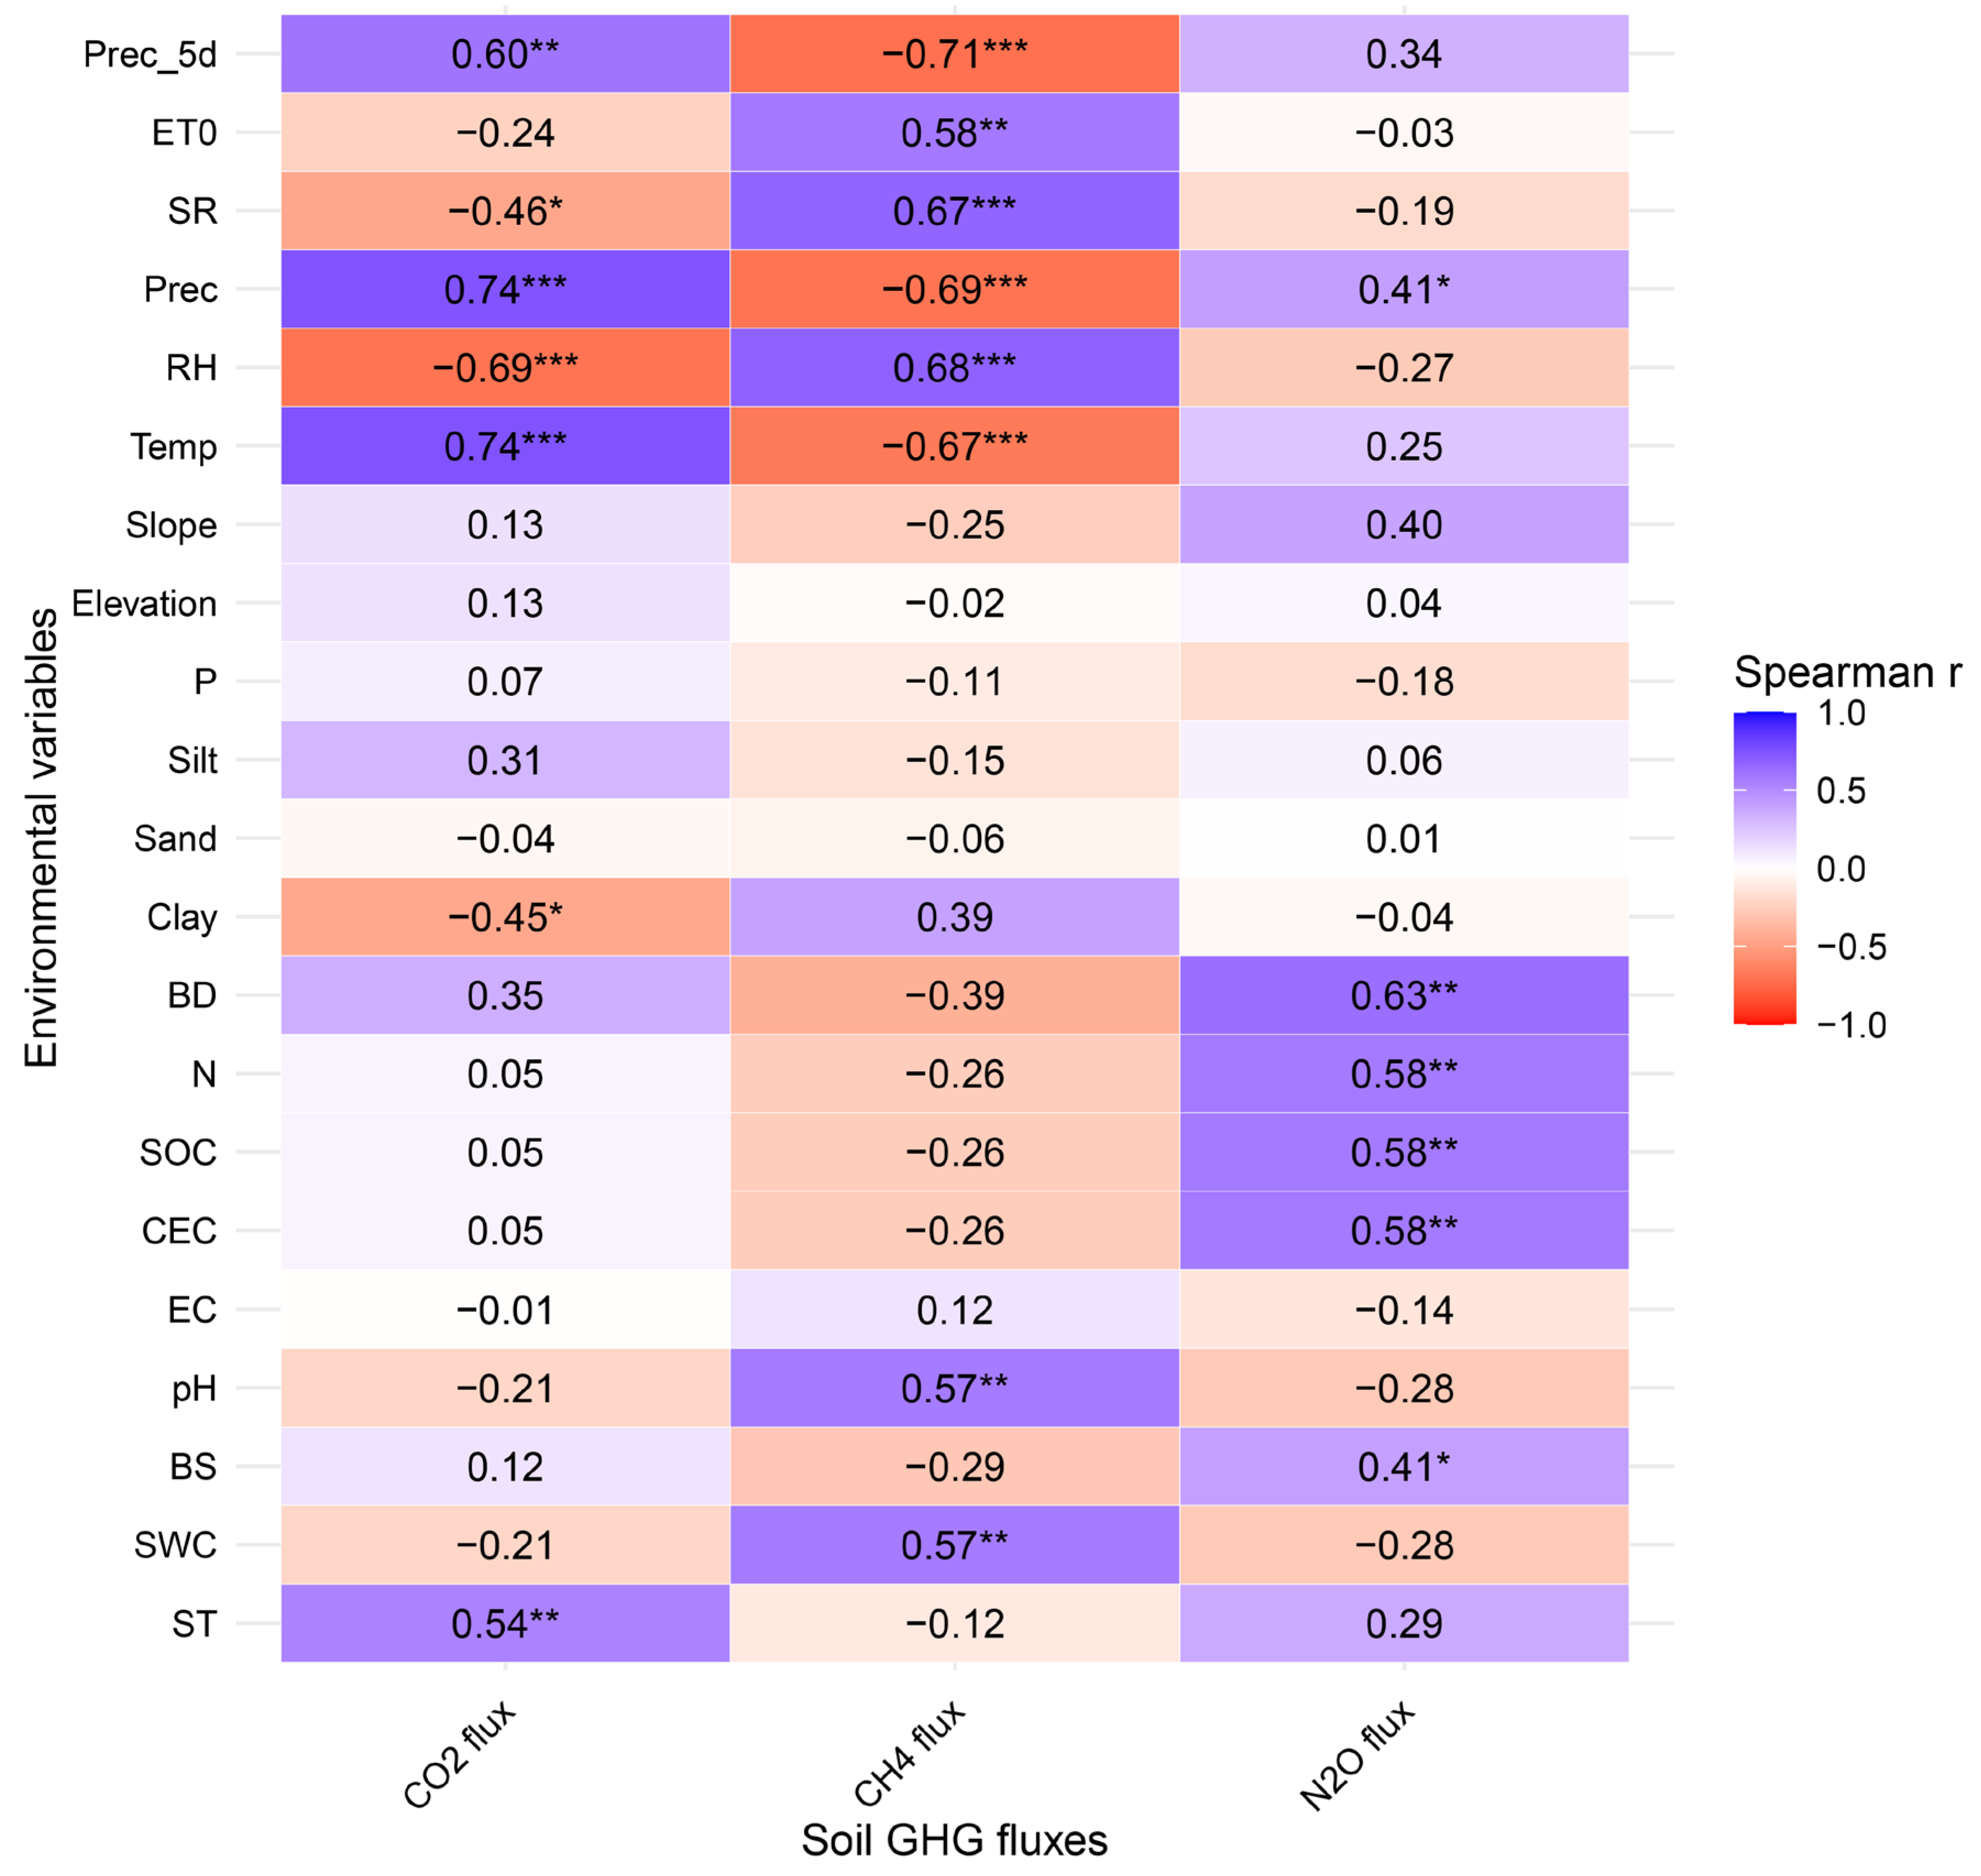
Figure 6.
Structural equation models (SEMs) depicting the relationships between environmental variables and soil GHG fluxes. (A) CO₂ model including ST, SOC, SR, Temp, and BD. (B) CH₄ model including pH, EC, SR, Prec, ST, Temp, and RH. (C) N₂O model including ST, EC, pH, Temp, P, and SOC. Arrows represent direct and indirect pathways, with thickness proportional to the strength of the relationships. Green arrows indicate positive effects, and purple arrows indicate negative effects. Statistical significance levels are denoted as follows: *, p < 0.05; **, p < 0.01; ***, p < 0.001.
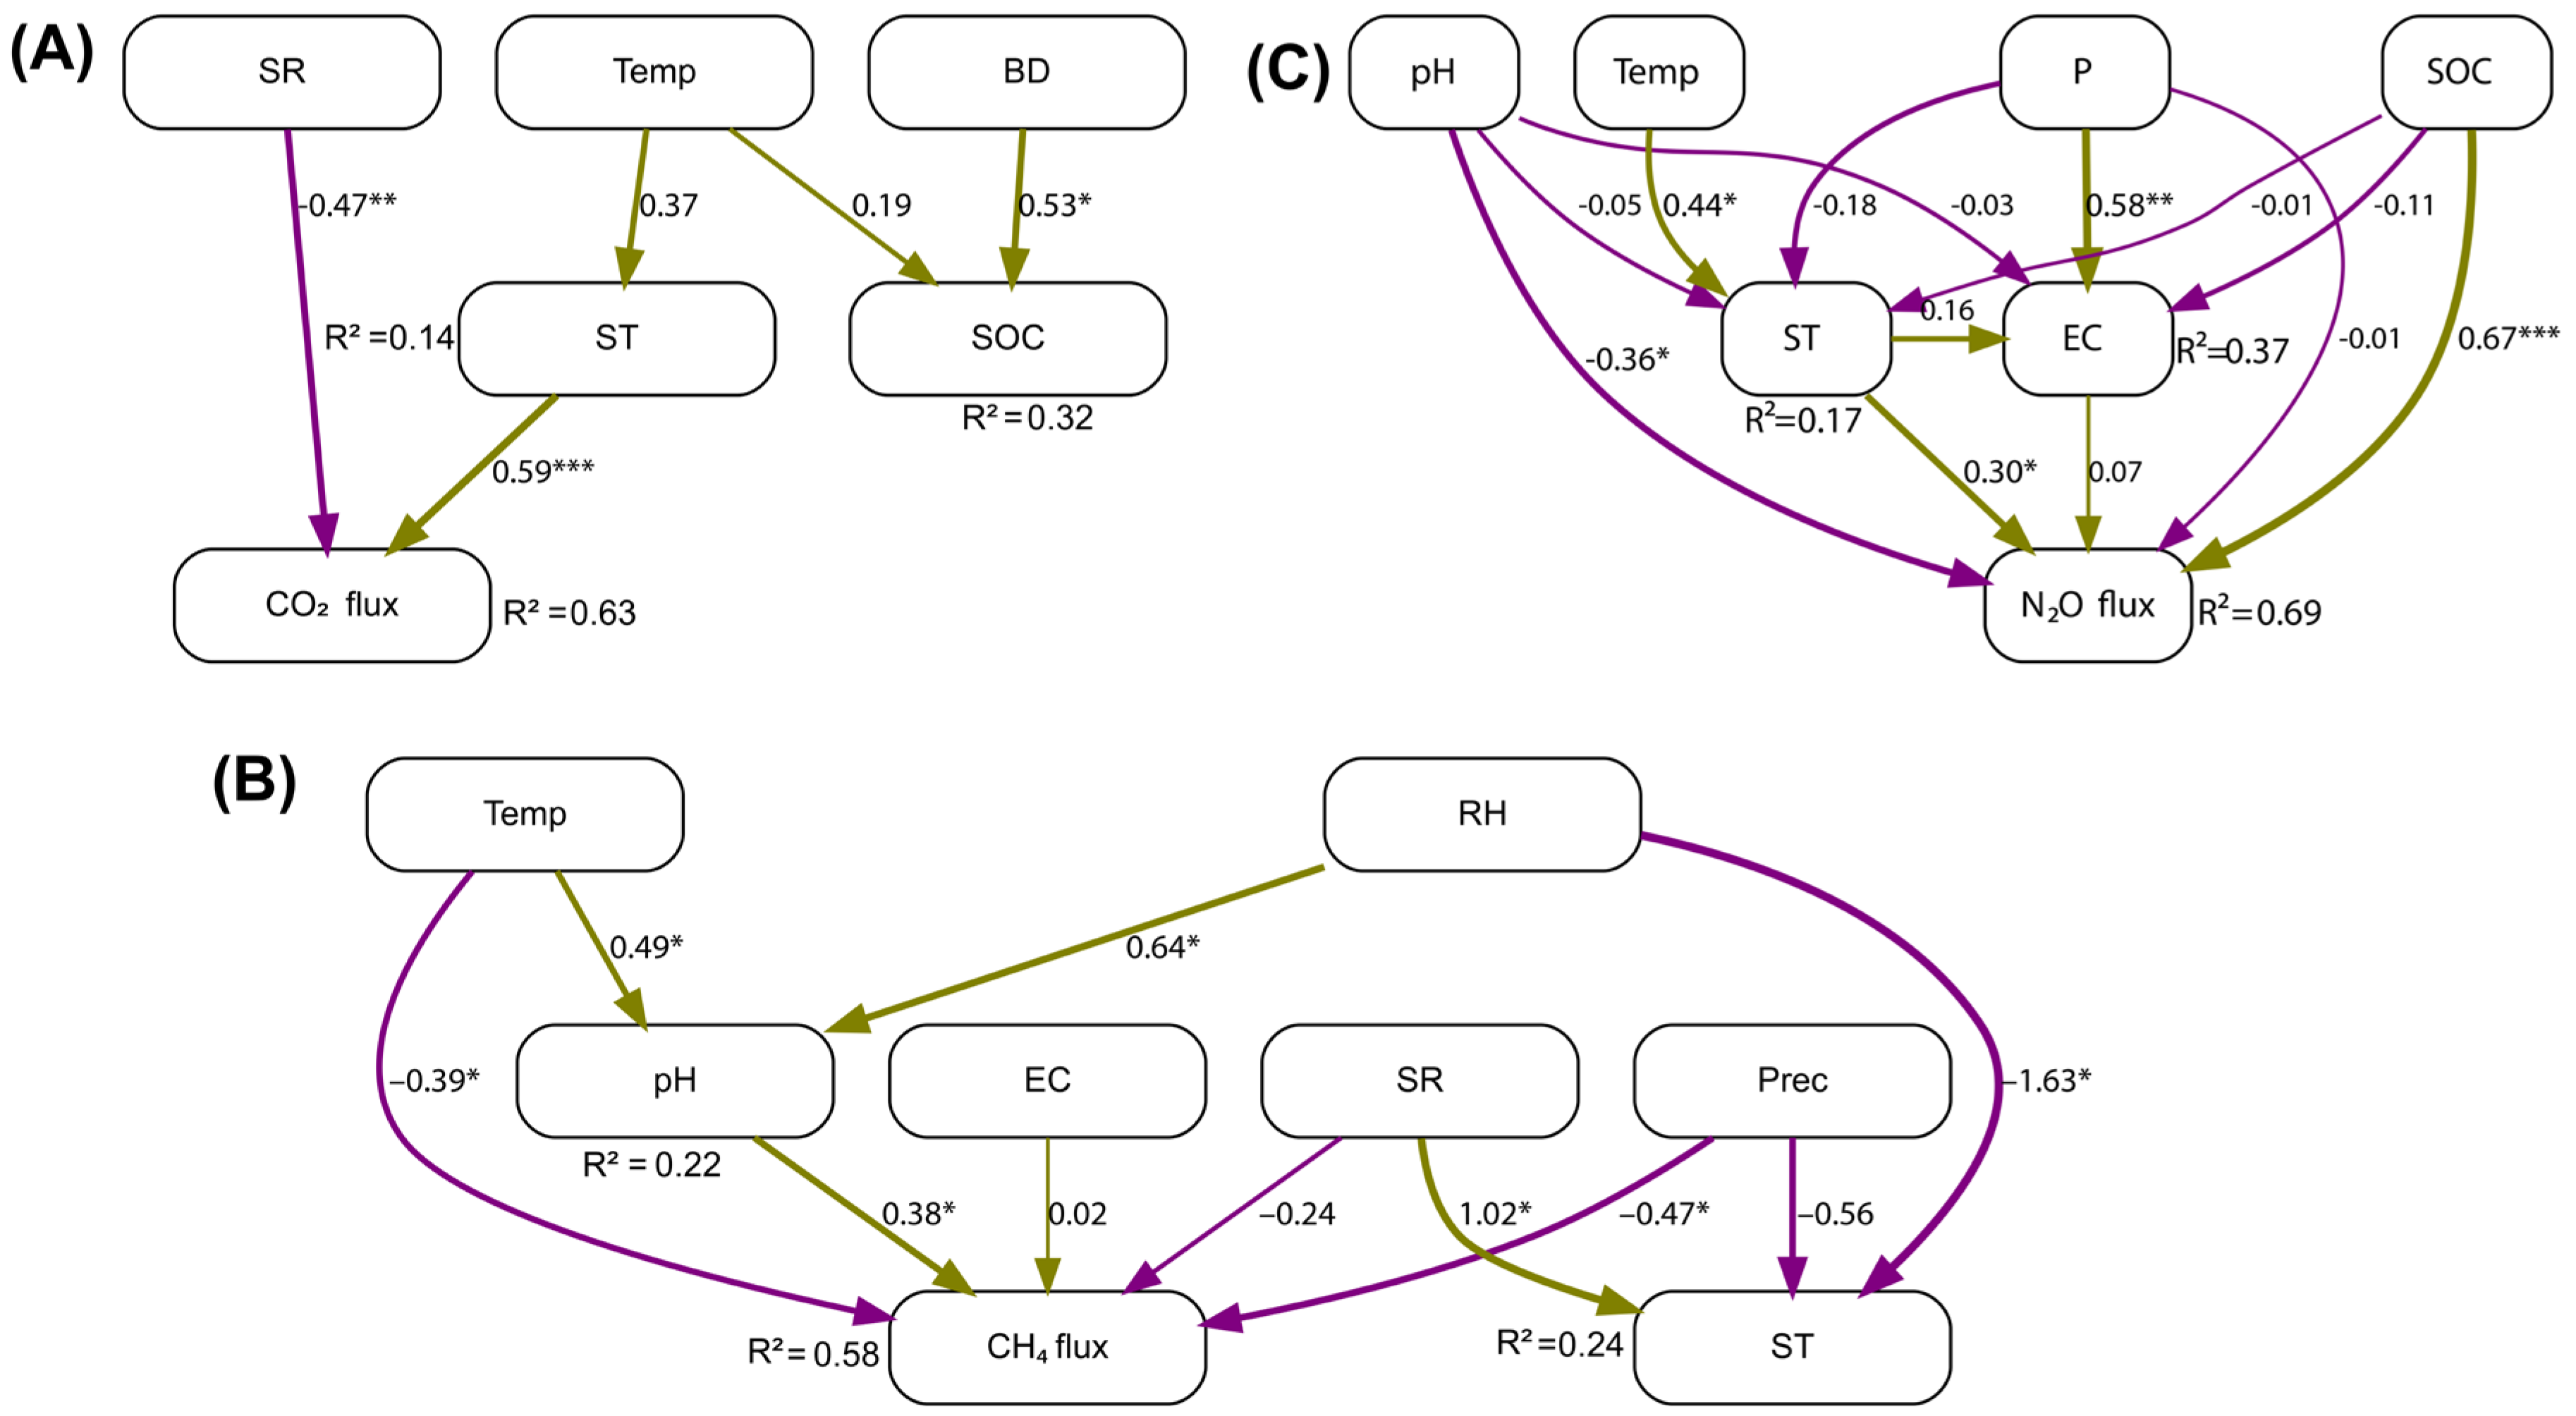

Table 1.
Description of biophysical and structural characteristics across cacao (T. cacao) agroforestry systems by climatic zone (dry vs. wet), system type (biodiverse vs. conventional), and development stage (growing vs. productive).
Table 1.
Description of biophysical and structural characteristics across cacao (T. cacao) agroforestry systems by climatic zone (dry vs. wet), system type (biodiverse vs. conventional), and development stage (growing vs. productive).
| Attribute | Development stage | Dry | Wet | ||
|---|---|---|---|---|---|
| Biodiverse | Conventional | Biodiverse | Conventional | ||
| Location | Growing | 0°22'51.00"N, 6°36'48.00"E | 0°22'51.25"N, 6°36'49.21"E | 0°14'3.45"N, 6°42'50.04"E | 0°15'23.26"N, 6°40'48.49"E |
| Productive | 0°22'47.00"N, 6°37'14.00"E | 0°22'42.02"N, 6°37'13.13"E | 0°13'59.00"N, 6°42'44.00"E | 0°14'0.50"N, 6°42'47.30"E | |
| Elevation (m a.s.l.) | Growing | 50.00 | 50.00 | 114.00 | 343.00 |
| Productive | 214.00 | 214.00 | 114.00 | 114.00 | |
| Slope (°) | Growing | 4.44 | 6.36 | 5.55 | 20.59 |
| Productive | 11.07 | 12.06 | 10.95 | 12.05 | |
| Age (year) | Growing | 2.00 | 3.00 | 3.50 | 4.00 |
| Productive | 15.00 | 17.00 | 14.00 | 22.00 | |
| Dominant species | Growing | T. cacao, Ananas comosus, Manihot esculenta, Cocos nucifera, Xanthosoma sagittifolium, Musa acuminata | T. cacao, Musa acuminata, Artocarpus heterophyllus, Erythrina sp. | T. cacao, Xanthosoma sagittifolium, Manihot esculenta, Musa acuminata, Arecaceae spp., Artocarpus altilis, Cedrela odorata | T. cacao, Xanthosoma sagittifolium, Musa acuminata, Artocarpus heterophyllus |
| Productive | T. cacao, Citrus sinensis, Erythrina sp., Musa acuminata, Psidium guajava, Dacryodes edulis | T. cacao, Manihot esculenta, Xanthosoma sagittifolium, Cedrela odorata | T. cacao, Manihot esculenta, Xanthosoma sagittifolium, Spondias mombin, Annona muricata, Persea americana | T. cacao, Xanthosoma sagittifolium, Musa acuminata | |
| DH30/ DBH (cm) Cocoa |
Growing | 1.32 | 1.75 | 2.96 | 3.20 |
| Productive | 14.55 | 13.87 | 14.88 | 15.12 | |
| Height (m) Cocoa | Growing | 2.01 | 1.44 | 1.56 | 1.57 |
| Productive | 4.38 | 4.24 | 4.53 | 4.48 | |
| SOC (Mg ha-1) | Growing | 73.52 | 55.71 | 67.41 | 62.88 |
| Productive | 75.87 | 70.87 | 75.04 | 58.76 | |
| AGBc (Mg C ha-1) | Growing | 13.61 | 12.20 | 14.50 | 11.80 |
| Productive | 23.00 | 19.19 | 28.74 | 24.92 | |
Location: Coordinates reported correspond to the centroid of the three replicate plots within each factorial combination. Elevation: elevation above sea level (m); Slope: terrain slope (°); Age: plantation age (years); Dominant species: most abundant arboreal and understory species in each plot; DH30: stem diameter of cacao tree at 30 cm above the ground (cm); DBH: diameter at breast height of cacao tree; Height: height of cacao tree (m); SOC: soil organic carbon (Mg ha-1); AGBc: aboveground biomass carbon (Mg C ha-1).
Table 2.
Global warming potential (GWP, in Mg CO2 eq ha-1 year-1) of total soil GHG fluxes (CO2, CH4, N2O) across different combinations of climatic zone, system type and development stage.
Table 2.
Global warming potential (GWP, in Mg CO2 eq ha-1 year-1) of total soil GHG fluxes (CO2, CH4, N2O) across different combinations of climatic zone, system type and development stage.
| Zone | System type | Development stage | GWP (Mg CO2 eq ha-1 year-1) |
|---|---|---|---|
| Dry | Biodiverse | Growing | 27.74 |
| Dry | Biodiverse | Productive | 14.19 |
| Dry | Conventional | Growing | 26.19 |
| Dry | Conventional | Productive | 22.71 |
| Wet | Biodiverse | Growing | 12.98 |
| Wet | Biodiverse | Productive | 9.05 |
| Wet | Conventional | Growing | 40.90 |
| Wet | Conventional | Productive | 11.99 |
GWP: Global warming potential.
Disclaimer/Publisher’s Note: The statements, opinions and data contained in all publications are solely those of the individual author(s) and contributor(s) and not of MDPI and/or the editor(s). MDPI and/or the editor(s) disclaim responsibility for any injury to people or property resulting from any ideas, methods, instructions or products referred to in the content. |
© 2025 by the authors. Licensee MDPI, Basel, Switzerland. This article is an open access article distributed under the terms and conditions of the Creative Commons Attribution (CC BY) license (http://creativecommons.org/licenses/by/4.0/).
Copyright: This open access article is published under a Creative Commons CC BY 4.0 license, which permit the free download, distribution, and reuse, provided that the author and preprint are cited in any reuse.


