
Submitted:
22 July 2025
Posted:
23 July 2025
You are already at the latest version
Abstract
The Online Droplet Inspection plays a vital role in close-loop control for OLED inkjet printing. However, generating realistic synthetic droplet images for reliable restoration and precise measurement of droplet parameters remains challenging due to the complex, multi-factor degradation inherent to microscale droplet imaging. To address this, we propose a physics-informed degradation model, Diffraction-Gaussian-Motion-Noise (DGMN), that integrates Fraunhofer diffraction, defocus blur, motion blur, and adaptive noise to replicate real-world degradation in droplet images. To optimize the multi-parameter configuration of DGMN, we introduce MISABO (Multi-strategy Improved Subtraction-Average-Based Optimizer), which incorporates Sobol sequence initialization for search diversity, lens opposition-based learning (LensOBL) for enhanced accuracy, and dimension learning-based hunting (DLH) for balanced global-local optimization. Benchmark function evaluations demonstrate that MISABO achieves superior convergence speed and accuracy. When applied to generate synthetic droplet images based on real droplet images captured from a self-developed OLED inkjet printer, the proposed MISABO-optimized DGMN framework significantly improves realism, enhancing synthesis quality by 37.7% over traditional manually configured model. This work lays a solid foundation for generating high-quality synthetic data to support droplet image restoration and downstream inkjet printing process.
Keywords:
inkjet printing
; physically-informed image degradation
; synthetic droplet image generation
; subtraction-average-based optimizer
; metaheuristic
; optimization
1. Introduction
Organic light-emitting diodes (OLEDs) have emerged as a leading innovation in modern display technology, offering benefits including wide viewing angles, high contrast, and rapid response time, as well as mechanical advantages such as flexibility and rollability [1]. Inkjet printing [2] stands out as a high-potential technology for OLED manufacturing due to its cost-effectiveness, high resolution, adaptability to diverse materials, and strong potential for producing large-area panels [3,4]. However, a major barrier to large-scale production is the high defect rate, often caused by nozzle failures and variations in droplet volume, which lead to Mura defects in printed panels [5]. To achieve zero-defect manufacturing [6] in OLED inkjet printing, significant efforts have been dedicated in print planning [7], droplet volume measurement [8], forming control [9], droplet volume control by waveform [10], deposited droplet volume measurement [11] and other related aspects. Among these, precise measurement of in-flight droplets is crucial for improving yield rates and minimizing defects.
Specifically, as shown in Figure 1, a closed-loop control is employed to achieve zero-defect inkjet printing. First, the nozzles on the printhead modules eject droplets according to the planned printing pattern and the corresponding driving waveform. The embedded Online Droplet Inspection System (ODIS) then inspects the in-flight droplets to assess injection status, droplet volume, velocity, and ejection angle across all nozzles involved in the inkjet process. The measured volume of each nozzle enables precise regulation of the inkjet driving waveform. In addition, ODIS identifies and disables abnormal nozzles based on measured droplet parameters and provides feedback for print planning. Together, these functions establish a vision-based closed-loop decision-making system for the zero-defect inkjet printing process [12,13].
Visual inspection and measurement approaches are widely deployed in the display fabrication industry due to its visibility, precision, and reliability [8]. The commonly droplets regulated for OLED inkjet printing are typically 1–10 pL in volume with diameters ranging from 12–26 µm and velocities of 3–8 m/s [10], as illustrated in fig:2. However, online droplet imaging under industrial conditions faces multiple challenges due to limited space for optics, restricted light source power, and strict temperature control. High-magnification systems with narrow depth of field (DOF) inherently introduce defocus blur [14], while low light power requires longer exposure, leading to motion blur. Increased magnification also amplifies diffraction effects, reducing resolution and introducing diffraction blur [15]. Figure 2(c) and (d) show that the blurred edges of the droplets exceed 30 pixels in width, indicating a complex degradation process affecting droplet detail. Therefore, advanced deep learning-based image restoration techniques, such as denoising [16], deblurring [15] and super-resolution [17], are essential for reconstructing droplet details, thereby enabling accurate image segmentation and precise measurement of droplet parameters. However, training such models requires a large volume of high-quality images, which are expensive and time-consuming to acquire. To address this limitation, generating realistic synthetic images for data augmentation and incorporating public datasets for training are crucial to improve restoration performance.
Although public datasets such as DIV2K [18], Set14 [19], and ImageNet [20] are widely used in image restoration research, they typically simulate degradation through limited, deterministic methods like bicubic down-sampling, blurring, or noise addition, introducing only mild distortions [21,22]. However, these solutions fail to replicate the complex and severe degradation observed in microscale in-flight droplet images, which are influenced by multiple interacting distortion factors under unique imaging conditions. Moreover, the absence of sharp reference images in real experimental settings limits the direct application of supervised learning methods. Consequently, models trained solely on public datasets often perform poorly on real droplet images. To overcome this, it is essential to improve the realism of synthetic paired degraded images, ensuring them closely resemble actual droplet degradation. This would enable more effective use of public datasets for training restoration models. Nevertheless, accurately modelling such complex, multi-parameter degradation remains a significant optimization challenge.
Metaheuristic methods are well-suited for high-dimensional optimization problems like image degradation modelling, offering high-quality solutions and stable convergence in complex search spaces. Various metaheuristic methods have been developed to enhance global search in engineering [23,24,25,26], but they often face issues like local optima, slow or unstable convergence, and limited agent diversity [27]. Premature convergence [28] and poor exploration–exploitation balance [29] further hinder their effectiveness in complex synthetic image generation, leaving room for further research.
This study proposes the physically-informed Diffraction-Gaussian-Motion-Noise (DGMN) model for realistic droplet image degradation, integrating Fraunhofer diffraction, Gaussian mixtures, motion blur, and adaptive noise, specifically tailored to in-flight droplet imaging. To optimize DGMN, we introduce MISABO, an improved optimizer combining Sobol initialization, lens opposition-based learning (LensOBL), and dimension learning-based hunting (DLH) for enhanced global search and stable convergence. Validated on benchmark functions, MISABO effectively tunes DGMN parameters for realistic synthetic droplet image generation.
The main contributions of this research are summarized as below.
1) A novel physically-informed DGMN model is constructed by integrating the diffraction, defocus, motion, and adaptive noise degradation components, providing an accurate representation of real-world complex degradation in droplet imaging.
2) A new composite approach, named MISABO, is introduced based on the basic SABO algorithm, incorporating multiple improvement strategies. Sobol sequence initialization provides broader coverage of search space, the LensOBL strategy enhances the fitting accuracy, and the DLH strategy balances the global and local search capabilities.
3) The proposed MISABO-optimized DGMN framework is applied to generate synthetic droplet images based on actual droplet images from an OLED inkjet printer developed by us, achieving more realistic images and improved convergence performance compared to competitive methods, with a 37.79% synthetic accuracy improvement from previous solution.
This article is organized as follows. Section II presented existing works relating the image degradation models and meta-heuristic methods. In Section III, the DGMN model is introduced, and each component of the proposed MISABO is elaborated in detail. Section IV presents the results on benchmark functions and real droplet images captured from a self-developed OLED inkjet printer, along with comparative analyses. Section V provides the overall conclusion of the paper.
2. Related Works
2.1. Degradation Methods for Synthetic Image Generation
Image degradation models are widely deployed in various computer vision tasks, playing a vital role in achieving high-quality outcomes. In most existing image super-resolution cases, degradation is typically performed using bicubic downsampling [21,22]. While a single bicubic blur kernel oversimplifies real-world corruption, creating a gap between synthesized and actual images. To address this, more complicated settings which introduced multiple predefined blur kernels or Point Spread Function (PSF) and randomized noises into the degradation model, thereby enhancing its generalization ability [30,31,32,33]. But these methods still cannot deliver acceptable performance due to their unfitting into real-world scenarios with deterministic presetting. Recent frameworks estimate degradation implicitly by learning representations between low- and high-quality image pairs. Pengliang et al. [34] used iterative back-projection (IBP) to minimize reconstruction error between normal-light sharp and low-light images. Generative Adversarial Network (GAN)-based methods also show great potential to generate realistic images. Manuel et al. [35] designed a DownSampleGAN (DSGAN) to generate LR images matching HR image characteristics without paired data. But it still requires high-quality HR images with the same noise distribution, which is not applicable in our case. Changhee et al. [36] generate multi-sequence brain magnetic resonance images from noise using two separate GANs. However, their approach does not align our objective of generating paired images for high-quality training.
2.2. Metaheuristic Algorithms for Optimization
Nowadays, various metaheuristic algorithms are developed for dealing with complex engineering problems [37,38,39] with inspiration from biological populations and physical phenomena, etc. Such as the genetic algorithm [40], Particle Swarm Optimization (PSO) [41,42]. Grey Wolf Optimization (GWO) [43], and firefly algorithm [44]. Particularly in the field of computer vision, meta-heuristic algorithms have been developed to deal with different image processing challenges. Mohamed et al. proposed a new hybrid approach that combines the thresholding technique with the whale optimization algorithm and slime mold algorithm (SMA) to segment the X-ray images [26]. El-Kenawy et al. suggested squirrel optimization algorithm to classify different cases in the X-ray images [45]. Bourouis et al. employed the GWO to tune a Wavelet Neural Network (WNN) for breast ultrasound images classification task. The GWO tuned WNN yields higher classification accuracy compared to other prevailing methods [46]. In MH-COVIDNet, PSO and GWO algorithm are deployed to select the useful features extracted from COVID-19 image dataset by deep learning models. The obtained features are then classified using SVM [47] for early diagnosis of the disease [48]. Based on the No Free Lunch (NFL) Theorem, no particular optimization algorithm excels universally, performing well on some problems but worse on others [49]. The NFL theorem motivates us to propose better solutions for the degraded droplet image generation. Differently from the methods mentioned above proposed for processing of an obtained image, to the best our knowledge, this is the first Metaheuristic-based realistic in-flight droplet image synthetic method aimed at degradation characteristics alignment and effective training.
3. Methodology
In this section, the proposed physically-informed DGMN model and MISABO algorithm are introduced. First, the mathematical modelling of the realistic droplet image degradation is presented. Next, the standard SABO approach is given as basis. Following this, the flowchart and each improvement strategy of the MISABO algorithm is explained in detail.
3.1. Physically-Informed DGMN Model of Droplet Image
A Basic Droplet Degradation Framework (BDDF) with manually configured parameters has been introduced in our previous work [15]. However, motion blur, a significant degradation component, was neglected, particularly in the context of high-speed in-flight within the field of view. To further accurately represent real-world droplet features, this study refines the current droplet degradation framework by incorporating motion blur, represented through the application of a customized kernel to the image.
Compared to the conventional assumption of fixed additive Gaussian noise in [15], our study models the noise level as a function of pixel intensity more accurately reflects real-world imaging conditions. This approach captures signal-dependent noise characteristics such as increased noise in brighter regions due to photon shot or Poisson noise, and reduced noise in darker areas, thus more realistically simulating sensor-related phenomena like non-uniform photoresponse, readout noise, and illumination-dependent degradation. Here, a straightforward linear intensity-dependent noise model is employed with a fixed maximum standard deviation =0.031 and minimum of =0.009, as the imaging illumination conditions remain highly stable. The intensity-dependent noise model is defined as follows:
As illustrated in Figure 3, the ideal droplet image is sequentially downgraded by diffraction, defocus blur, motion blur, and adaptive noise, resulting in the degraded droplet image . The entire DGMN model of droplet image can be represented as follows:
In (2), * denotes convolution operator, is the motion kernel, is the mth Gaussian kernel among mixed Gaussian kernels, and is the corresponding weight, represents the diffraction kernel, and is the intensity-dependent noise.
Specifically, the motion kernel is constructed as following steps: First, initialize a zero matrix of size . Then, calculate the direction vector by (3) with defined motion direction angle .
Second, compute the corresponding position for the motion as follows:
Where the , is the offset from the center of the kernel with , , range from 0 to .
After that, for each element , set:
Last, normalize the motion kernel to maintain the brightness of the image during downgrade.
3.2. SABO Algorithm
The Subtraction-Average-Based Optimizer (SABO) is a novel metaheuristic algorithm that utilizes the subtraction average to update the positions of search agents, enabling less control parameters and efficient exploration [50]. However, SABO still has several limitations, including uneven initial agent distribution that hinders global exploration, and random parameters that can cause instability. These issues may lead to premature convergence and increase the risk of getting trapped in local optima, particularly in complex or multimodal optimization tasks.
3.3. The Proposed MISABO Algorithm
To tackle the above issue, MISABO is proposed in this research by incorporating multiple improvement strategies. Specifically, the core structure of our approach involves the following steps: Sobol sequence initialization, LensOBL, and the DLH search strategy.
3.3.1. Sobol Sequence Initialization
To enhance global search, our study uses Sobol sequences, also known as quasi-Monte Carlo, for uncertainty and sensitivity analysis. These low-discrepancy samples improve sampling efficiency within the search space, offering better performance, particularly in high-dimensional optimization problems [51]. Sobol sequence initialization yields more evenly and broadly distributed points than the points from random number initialization, enhancing coverage across the search space.
3.3.2. Lens Opposition Based Learning
In the population iteration phase of the SABO, it is susceptible to getting trapped in local optima, leading to iteration stagnation. To address this, this paper introduces the LensOBL strategy, which helps individuals escape local optima and improves the fitting accuracy [52]. fig:4 illustrates the concept of LensOBL strategy in a one-dimensional space.
In Figure 4, AB represents the lens, and an object Q is positioned on the left side of the lens, whose height is . Through the lens, the Q has an opposite image Q* with height , whose projection on the X-axis is located at . The positional relationship between Q and Q* is described by (6) as follows:
Let , the opposite point will be:
When , (7) can be simplified as following (8), which is the formula of basic Opposition-Based Learning (OBL) strategy [53]:
Based on the above, OBL is a special case of LensOBL, which adaptively adjusts parameter k to generate dynamic reverse solutions. This flexibility enhances the exploitation capability of search agents compared to the fixed reverse solution in standard OBL. In our study, we define the parameter k as being self-adaptively increased based on the number of iterations as follows:
Where t is the current iteration, and T is the total iteration count.
If the new candidate calculated from LensOBL offers a better fitness value, is replaced by it. Otherwise, holds.
3.3.3. DLH Search Strategy
DLH is an optimization strategy that enhances search efficiency by focusing on specific dimensions and constructing local regions where agents share information about optimal or nearby solutions, thus avoiding local optima [29]. First, the neighborhood of agent is defined as:
Where is the Euclidean distance between and .
Then, multi-dimensional neighborhood learning is carried out as:
Where the denotes the dth dimension of , is the dth dimension of the random agent from the corresponding neighborhood , and is the dth dimension of the random agent from the population X.
At last, update the search agents as follows:
3.3.4. MISABO Algorithm Flow
The pseudocode of MISABO algorithm is presented in Algorithm 1, where t is the current iteration count, T is the maximum iteration, N is the population size, D is the population dimension.
| Algorithm 1:MISABO Algorithm |
|
4. Experiments and Results
This section verifies the performance of the proposed method through various benchmark evaluations, experiments, and ablation studies, followed by comparisons with other competitive metaheuristic methods, including the original SABO as baseline, SCA [54], and SFO [55]. All the experiments are conducted on an ADVANTECH industrial PC with Intel Xeon E5 CPU and 32GB RAM.
4.1. Performance of MISABO on Benchmark Functions
A set of typical benchmark functions is employed, including unimodal functions ( - ) and multimodal functions ( - ) as shown in Table 1, to evaluate the performance of the proposed MISABO. Unimodal functions test convergence speed and accuracy, while multimodal functions assess global search ability. Each method was independently run 50 times across all benchmark functions, with a population size of 50 and 500 iterations. The applied performance metrics include mean (average performance), standard deviation (stability), and best/worst values (accuracy).
Table 2 shows that MISABO outperforms other competitive algorithms, reaching theoretical optima on - and , and significantly improving accuracy over SABO on and . Although not optimal on and , it achieves the closest results. MISABO also shows strong convergence stability, with lower standard deviations than SFO, and SCA. Compared to SABO, it improves stability on - and enhances by three orders of magnitude, validating the effectiveness of the multi-strategy design.
To analyze the accuracy and convergence speed of MISABO, this study presents the convergence curves across all benchmark functions in Figure 5, showing that the MISABO consistently achieves the steepest convergence curves and highest accuracy across functions to . It outperforms other methods in both unimodal and multimodal functions, reaching optimal or near-optimal solutions faster. Even when not ideal, MISABO maintains superior performance, making it the most effective algorithm among all evaluated.
4.2. Performance of Synthetic Droplet Image Generation
4.2.1. Experimental Setup
To evaluate the proposed method for high-quality droplet image generation, the proposed MISABO-optimized DGMN framework is deployed on our NEJ-PTG6H OLED inkjet printer, jointly developed by Huazhong University of Science & Technology and Wuhan National Innovation Technology Optoelectronics Equipment Co., Ltd (Figure 6). The printer features multiple Konica KM1800i print heads with YZ degrees of freedom (DOFs), each containing 1776 nozzles, and an X-DOF platform for panel placement. Through coordinated motion and control, the system prints functional OLED layers, such as TFE and color filters.
An ODIS, equipped with X DOF, includes a HIKROBOT industrial camera (MV-CH120-10GM, resolution), a Navitar zoom lens, and a high-power LED. The camera uses a 1 s exposure time with constant backlighting to capture high-speed shadowgraph images of droplets in flight, as shown in Figure 7. Utilizing known nozzle coordinates and DOF cooperation, all nozzles are inspected to measure droplet volume and speed, and to identify abnormal nozzles for print planning and nozzle waveform regulation. Based on this setup, each print head is moved to the ODIS system for inspection. Nozzles eject droplets at 14kHz, and multiple droplets are captured for measurement. After the current nozzle set is inspected, the remaining nozzles are scanned sequentially along the XY DOF to complete the droplet image collection.
4.2.2. Evaluation Metrics
In our study, the Deep Image Structure and Texture Similarity (DISTS) [56] Metric is adopted to assess the synthetic image quality for degradation pattern alignment. Unlike traditional pixel-level metrics, DISTS evaluates perceptual similarity by comparing structural and textural information in the deep feature space between two images, yielding values in , which are converted such that lower scores indicate better alignment in our study.
4.2.3. Experimental Results
Experiments were conducted on 10 real droplet images (), labeled X1 to X9 in Figure 7. MISABO and other algorithms optimized the DGMN model using paired synthetic and real droplet images. All search agents were normalized to () before optimization and denormalized for DISTS evaluation. Each algorithm ran independently on all images with 15 agents over 50 iterations. Table 3 details the DGMN control parameters and their levels.
Figure 8 illustrates the convergence performance of the proposed MISABO algorithm in comparison with other optimization methods applied to the DGMN model for synthetic droplet image generation. As shown, MISABO consistently outperforms its competitors in final DISTS values across all image cases and presents better convergence speed in most images. For instance, in images X1 and X7, MISABO minimizes the distribution error within approximately 20 iterations. In images X3, X4, and X8, it achieves the lowest DISTS among all methods in just 5 iterations. For images X5 and X6, MISABO demonstrates effective multi-step convergence, producing the best degradation simulations after 40 iterations. In image X9, MISABO yields a significantly lower final DISTS after 50 iterations compared to other algorithms. The optimization results across all image cases, summarized in Table 4, further confirms that MISABO delivers superior performance in synthetic droplet image generation.
4.3. Ablation study
In this subsection, we validate the impact of the integrated strategies on the synthetic droplet image generation. For the degradation model ablation study, BDDF [15] serves as the baseline (M1). M2 augments M1 with motion blur, while M3 replaces M1’s fixed Gaussian noise with intensity-dependent noise. M4, the proposed DGMN model, combines both improvements from M2 and M3. For the optimization method ablation, the SABO [50] is used as the baseline. V1 integrates Sobol initialization into SABO, V2 builds on V1 by incorporating LensOBL, and V3 (MISABO) further adds DLH to V2.
4.3.1. Effectiveness of the Proposed DGMN Model
We verified the effectiveness of the DGMN formulation with parameters optimized by our proposed MISABO in Table 5. It shows that adding motion blur (M2) to M1 results in a reduction in DISTS. Replacing the fixed Gaussian noise with intensity-dependent noise (M3) also yields a DISTS decrease, demonstrating the value of adaptive noise for improved degradation alignment. The combined model, M4 (DGMN), achieves the lowest DISTS with a total reduction of , confirming the synergistic benefit of integrating both strategies. In summary, our method (DGMN-MISABO) achieves the most accurate degradation alignment, outperforming the BDDF with manually configured parameters and BDDF optimized by MISABO by and , respectively.
fig:9 presents synthetic images generated by the BDDF and DGMN models using the best-performing parameter sets obtained either manually or via MISABO, with corresponding DISTS scores shown at the bottom right of each image. The close visual similarity between the DGMN-MISABO results and real droplet images demonstrates the effectiveness of the proposed framework.
4.3.2. Effectiveness of Integrated Strategies in MISABO
Table 6 shows performance improvements after each strategy integrated for optimization when applied to our proposed DGMN. Comparing V1 (SABO) and V2, Sobol initialization leads to a DISTS reduction based on M3. Adding LensOBL (V2 to V3) brings an additional DISTS decrement, showing its effectiveness in avoiding local optima. Further integrating DLH (V3 to V4) results in a DISTS decrease of , highlighting its role in balancing global and local searches for better degradation alignment and providing more realistic synthetic images.
5. Conclusion
This paper presents a physically-informed DGMN model for generating realistically degraded droplet images by integrating diffraction, defocus, motion, and adaptive noise, tailored to the ODIS’s imaging conditions. To optimize DGMN parameters, we develop MISABO, which incorporates Sobol initialization, LensOBL, and DLH to enhance diversity, avoid local optima, and balance search strategies. Benchmark results demonstrate MISABO’s superior convergence and accuracy. Experiments show that MISABO-optimized DGMN framework improves synthetic accuracy by 37.79% over manually configured BDDF. Ablation studies confirm the effectiveness of each integrated strategy. This study focuses on realistic droplet image generation, and future work will involve constructing a synthetic dataset using MISABO-optimized DGMN to train image restoration models, ultimately improving the accuracy of ODIS and inkjet printing performance.
Author Contributions
Conceptualization, Jiacheng Cai; methodology, Jiacheng Cai, and Jingcheng Ruan; software, Jiacheng Cai, and Jinliang Wu; validation, Jiacheng Cai; formal analysis, Jiacheng Cai; investigation, Wei Tang; resources, Jiankui Chen, Wei Tang, and Zhouping Yin; data curation, Jiacheng Cai and Wei Tang; writing—original draft preparation, Jiacheng Cai; writing—review and editing, Jiacheng Cai; visualization, Jiacheng Cai; supervision, Jiankui Chen and Zhouping Yin; project administration, Jiankui Chen and Zhouping Yin; funding acquisition, Jiankui Chen, Wei Tang, and Zhouping Yin. All authors have read and agreed to the published version of the manuscript.
Funding
This research is supported by the CUI CAN Program of Guangdong Province (grant no. CC/XM-202402ZJ0102), and the National Natural Science Foundation of China (51975236, 52205594).
Institutional Review Board Statement
Not applicable.
Informed Consent Statement
Not applicable.
Data Availability Statement
Data are contained within the article.
Conflicts of Interest
The authors declare no conflicts of interest.
References
- Gather, M.C.; Reineke, S. Recent advances in light outcoupling from white organic light-emitting diodes. Journal of Photonics for Energy 2015, 5, 057607–057607. [Google Scholar] [CrossRef]
- Kim, K.; Kim, G.; Lee, B.R.; Ji, S.; Kim, S.Y.; An, B.W.; Song, M.H.; Park, J.U. High-resolution electrohydrodynamic jet printing of small-molecule organic light-emitting diodes. Nanoscale 2015, 7, 13410–13415. [Google Scholar] [CrossRef] [PubMed]
- Zheng, X.; Liu, Y.; Zhu, Y.; Ma, F.; Feng, C.; Yu, Y.; Hu, H.; Li, F. Efficient inkjet-printed blue OLED with boosted charge transport using host doping for application in pixelated display. Optical Materials 2020, 101, 109755. [Google Scholar] [CrossRef]
- Hu, Z.; Yin, Y.; Ali, M.U.; Peng, W.; Zhang, S.; Li, D.; Zou, T.; Li, Y.; Jiao, S.; Chen, S.j. Inkjet printed uniform quantum dots as color conversion layers for full-color OLED displays. Nanoscale 2020, 12, 2103–2110. [Google Scholar] [CrossRef]
- Yang, H.; Song, K.; Mao, F.; Yin, Z. Autolabeling-enhanced active learning for cost-efficient surface defect visual classification. IEEE Transactions on Instrumentation and Measurement 2020, 70, 1–15. [Google Scholar] [CrossRef]
- Psarommatis, F.; Sousa, J.; Mendonça, J.P.; Kiritsis, D. Zero-defect manufacturing the approach for higher manufacturing sustainability in the era of industry 4.0: a position paper. International Journal of Production Research 2022, 60, 73–91. [Google Scholar] [CrossRef]
- Xiong, J.; Chen, J.; Chen, W.; Yue, X.; Zhao, Z.; Yin, Z. Intelligent path planning algorithm system for printed display manufacturing using graph convolutional neural network and reinforcement learning. Journal of Manufacturing Systems 2025, 79, 73–85. [Google Scholar] [CrossRef]
- Liu, Q.; Chen, J.; Yang, H.; Yin, Z. Accurate stereo-vision-based flying droplet volume measurement method. IEEE Transactions on Instrumentation and Measurement 2021, 71, 1–16. [Google Scholar] [CrossRef]
- Hong, Z.; Jian-kui, C.; Xiao, Y.; Jing-kai, X.; Jia-con, X.; Guo-xiong, G. Forming control method of inkjet printing OLED emitting layer pixel pit film. Chinese Journal of Liquid Crystal & Displays 2022, 37. [Google Scholar]
- Yue, X.; Chen, J.; Li, Y.; Li, X.; Zhu, H.; Yin, Z. Intelligent control system for droplet volume in inkjet printing based on stochastic state transition soft actor–critic DRL algorithm. Journal of Manufacturing Systems 2023, 68, 455–464. [Google Scholar] [CrossRef]
- Zhang, Z.; Yang, H.; Chen, J.; Yin, Z. Multi-scale conditional diffusion model for deposited droplet volume measurement in inkjet printing manufacturing. Journal of Manufacturing Systems 2023, 71, 595–608. [Google Scholar] [CrossRef]
- Yue, X.; Chen, J.; Yang, H.; Li, X.; Xiong, J.; Yin, Z. Multinozzle Droplet Volume Distribution Control in Inkjet Printing Based on Multiagent Soft Actor–Critic Network. IEEE/ASME Transactions on Mechatronics 2024.
- Qiao, H.; Chen, J.; Huang, X. A Survey of Brain-Inspired Intelligent Robots: Integration of Vision, Decision, Motion Control, and Musculoskeletal Systems. IEEE Transactions on Cybernetics 2022, 52, 11267–11280. [Google Scholar] [CrossRef]
- Choi, B.S.; Kim, S.H.; Lee, J.; Seong, D.; Lee, J.; Lee, J.; Chang, S.; Park, J.; Lee, S.J.; Shin, J.K. Effects of aperture diameter on image blur of CMOS image sensor with pixel apertures. IEEE Transactions on Instrumentation and Measurement 2019, 68, 1382–1388. [Google Scholar] [CrossRef]
- Liu, Q.; Chen, J.; Yang, H.; Yin, Z. Prior Guided Multi-Scale Dynamic Deblurring Network for Diffraction Image Restoration in Droplet Measurement. IEEE Transactions on Instrumentation and Measurement 2023.
- Lin, X.; Ren, C.; Liu, X.; Huang, J.; Lei, Y. Unsupervised image denoising in real-world scenarios via self-collaboration parallel generative adversarial branches. In Proceedings of the Proceedings of the IEEE/CVF International Conference on Computer Vision, 2023, pp.
- Liu, Q.; Yang, H.; Chen, J.; Yin, Z. Multiframe super-resolution with dual pyramid multiattention network for droplet measurement. IEEE Transactions on Instrumentation and Measurement 2023, 72, 1–14. [Google Scholar] [CrossRef]
- Agustsson, E.; Timofte, R. Ntire 2017 challenge on single image super-resolution: Dataset and study. In Proceedings of the Proceedings of the IEEE conference on computer vision and pattern recognition workshops, 2017, pp. 126–135.
- Zeyde, R.; Elad, M.; Protter, M. On single image scale-up using sparse-representations. In Proceedings of the Curves and Surfaces: 7th International Conference, Avignon, France, 2010, Revised Selected Papers 7. Springer, 2010, June 24-30; pp. 711–730.
- Hendrycks, D.; Dietterich, T. Benchmarking neural network robustness to common corruptions and perturbations. arXiv preprint arXiv:1903.12261 2019.
- Li, S.; Zhang, G.; Luo, Z.; Liu, J. DFAN: Dual Feature Aggregation Network for Lightweight Image Super-Resolution. Wireless Communications and Mobile Computing 2022, 2022, 8116846. [Google Scholar] [CrossRef]
- Luo, Z.; Huang, Y.; Li, S.; Wang, L.; Tan, T. Efficient super resolution by recursive aggregation. In Proceedings of the 2020 25th International Conference on Pattern Recognition (ICPR). IEEE; 2021; pp. 8592–8599. [Google Scholar]
- Yuen, M.C.; Ng, S.C.; Leung, M.F.; Che, H. A metaheuristic-based framework for index tracking with practical constraints. Complex & Intelligent Systems 2022, 8, 4571–4586. [Google Scholar]
- Rezk, H.; Fathy, A.; Aly, M.; Ibrahim, M.N. Energy Management Control Strategy for Renewable Energy System Based on Spotted Hyena Optimizer. Computers, Materials & Continua 2021, 67. [Google Scholar] [CrossRef]
- Abderazek, H.; Yildiz, A.R.; Mirjalili, S. Comparison of recent optimization algorithms for design optimization of a cam-follower mechanism. Knowledge-Based Systems 2020, 191, 105237. [Google Scholar] [CrossRef]
- Abdel-Basset, M.; Chang, V.; Mohamed, R. HSMA_WOA: A hybrid novel Slime mould algorithm with whale optimization algorithm for tackling the image segmentation problem of chest X-ray images. Applied soft computing 2020, 95, 106642. [Google Scholar] [CrossRef]
- Nadimi-Shahraki, M.H.; Taghian, S.; Mirjalili, S.; Zamani, H.; Bahreininejad, A. GGWO: Gaze cues learning-based grey wolf optimizer and its applications for solving engineering problems. Journal of Computational Science 2022, 61, 101636. [Google Scholar] [CrossRef]
- Hu, J.; Chen, H.; Heidari, A.A.; Wang, M.; Zhang, X.; Chen, Y.; Pan, Z. Orthogonal learning covariance matrix for defects of grey wolf optimizer: Insights, balance, diversity, and feature selection. Knowledge-Based Systems 2021, 213, 106684. [Google Scholar] [CrossRef]
- Nadimi-Shahraki, M.H.; Taghian, S.; Mirjalili, S. An improved grey wolf optimizer for solving engineering problems. Expert Systems with Applications 2021, 166, 113917. [Google Scholar] [CrossRef]
- Bell-Kligler, S.; Shocher, A.; Irani, M. Blind super-resolution kernel estimation using an internal-gan. Advances in Neural Information Processing Systems 2019, 32. [Google Scholar]
- Zhang, K.; Zuo, W.; Zhang, L. Learning a single convolutional super-resolution network for multiple degradations. In Proceedings of the Proceedings of the IEEE conference on computer vision and pattern recognition, 2018, pp.
- Gu, J.; Lu, H.; Zuo, W.; Dong, C. Blind super-resolution with iterative kernel correction. In Proceedings of the Proceedings of the IEEE/CVF conference on computer vision and pattern recognition, 2019, pp.
- Huang, Y.; Li, S.; Wang, L.; Tan, T. Unfolding the alternating optimization for blind super resolution. Advances in Neural Information Processing Systems 2020, 33, 5632–5643. [Google Scholar]
- Li, P.; Liang, J.; Zhang, M. A degradation model for simultaneous brightness and sharpness enhancement of low-light image. Signal Processing 2021, 189, 108298. [Google Scholar] [CrossRef]
- Fritsche, M.; Gu, S.; Timofte, R. Frequency separation for real-world super-resolution. In Proceedings of the 2019 IEEE/CVF International Conference on Computer Vision Workshop (ICCVW). IEEE; 2019; pp. 3599–3608. [Google Scholar]
- Han, C.; Hayashi, H.; Rundo, L.; Araki, R.; Shimoda, W.; Muramatsu, S.; Furukawa, Y.; Mauri, G.; Nakayama, H. GAN-based synthetic brain MR image generation. In Proceedings of the 2018 IEEE 15th international symposium on biomedical imaging (ISBI 2018). IEEE; 2018; pp. 734–738. [Google Scholar]
- Dehghani, M.; Montazeri, Z.; Malik, O. Optimal sizing and placement of capacitor banks and distributed generation in distribution systems using spring search algorithm. International Journal of Emerging Electric Power Systems 2020, 21, 20190217. [Google Scholar] [CrossRef]
- Dehbozorgi, S.; Ehsanifar, A.; Montazeri, Z.; Dehghani, M.; Seifi, A. Line loss reduction and voltage profile improvement in radial distribution networks using battery energy storage system. In Proceedings of the 2017 IEEE 4th International Conference on Knowledge-Based Engineering and Innovation (KBEI). IEEE; 2017; pp. 0215–0219. [Google Scholar]
- Bouaraki, M.; Recioui, A. Optimal placement of power factor correction capacitors in power systems using Teaching Learning Based Optimization. Algerian Journal of Signals and Systems 2017, 2, 102–109. [Google Scholar] [CrossRef]
- Mirjalili, S.; Mirjalili, S. Genetic algorithm. Evolutionary algorithms and neural networks: theory and applications 2019, pp. 43–55.
- Wang, D.; Tan, D.; Liu, L. Particle swarm optimization algorithm: an overview. Soft computing 2018, 22, 387–408. [Google Scholar] [CrossRef]
- Kennedy, J.; Eberhart, R. Particle swarm optimization. In Proceedings of the Proceedings of ICNN’95-international conference on neural networks. ieee, 1995, Vol. 4, pp. 1942–1948.
- Mirjalili, S.; Mirjalili, S.M.; Lewis, A. Grey wolf optimizer. Advances in engineering software 2014, 69, 46–61. [Google Scholar] [CrossRef]
- Fister, I.; Fister Jr, I.; Yang, X.S.; Brest, J. A comprehensive review of firefly algorithms. Swarm and evolutionary computation 2013, 13, 34–46. [Google Scholar] [CrossRef]
- El-Kenawy, E.S.M.; Mirjalili, S.; Ibrahim, A.; Alrahmawy, M.; El-Said, M.; Zaki, R.M.; Eid, M.M. Advanced meta-heuristics, convolutional neural networks, and feature selectors for efficient COVID-19 X-ray chest image classification. Ieee Access 2021, 9, 36019–36037. [Google Scholar] [CrossRef]
- Bourouis, S.; Band, S.S.; Mosavi, A.; Agrawal, S.; Hamdi, M. Meta-heuristic algorithm-tuned neural network for breast cancer diagnosis using ultrasound images. Frontiers in Oncology 2022, 12, 834028. [Google Scholar]
- Chandra, M.A.; Bedi, S. Survey on SVM and their application in image classification. International Journal of Information Technology 2021, 13, 1–11. [Google Scholar] [CrossRef]
- Canayaz, M. MH-COVIDNet: Diagnosis of COVID-19 using deep neural networks and meta-heuristic-based feature selection on X-ray images. Biomedical Signal Processing and Control 2021, 64, 102257. [Google Scholar] [CrossRef] [PubMed]
- Adam, S.P.; Alexandropoulos, S.A.N.; Pardalos, P.M.; Vrahatis, M.N. No free lunch theorem: A review. Approximation and optimization: Algorithms, complexity and applications 2019, pp. 57–82.
- Moustafa, G.; Tolba, M.A.; El-Rifaie, A.M.; Ginidi, A.; Shaheen, A.M.; Abid, S. A Subtraction-Average-Based Optimizer for Solving Engineering Problems with Applications on TCSC Allocation in Power Systems. Biomimetics (Basel) 2023, 8, El–Rifaie. [Google Scholar] [CrossRef] [PubMed]
- Sebastian, B.; Dirk, J.; Gregor P, H. Sampling Based on Sobol’ Sequences for Monte Carlo Techniques Applied to Building Simulations, 2011. [CrossRef]
- Yu, F.; Guan, J.; Wu, H.; Chen, Y.; Xia, X. Lens imaging opposition-based learning for differential evolution with cauchy perturbation. Applied Soft Computing 2024, 152, 111211. [Google Scholar] [CrossRef]
- Tizhoosh, H.R. Opposition-Based Learning: A New Scheme for Machine Intelligence. In Proceedings of the International Conference on Computational Intelligence for Modelling, Control and Automation and International Conference on Intelligent Agents, Web Technologies and Internet Commerce (CIMCA-IAWTIC’06), 2005, Vol. 1, pp. 695–701. [CrossRef]
- Mirjalili, S. SCA: a sine cosine algorithm for solving optimization problems. Knowledge-based systems 2016, 96, 120–133. [Google Scholar] [CrossRef]
- Gomes, G.F.; da Cunha, S.S.; Ancelotti, A.C. A sunflower optimization (SFO) algorithm applied to damage identification on laminated composite plates. Engineering with Computers 2019, 35, 619–626. [Google Scholar] [CrossRef]
- Ding, K.; Ma, K.; Wang, S.; Simoncelli, E.P. Image quality assessment: Unifying structure and texture similarity. IEEE transactions on pattern analysis and machine intelligence 2020, 44, 2567–2581. [Google Scholar] [CrossRef]
Figure 1.
Closed-loop control for OLED inkjet printing.
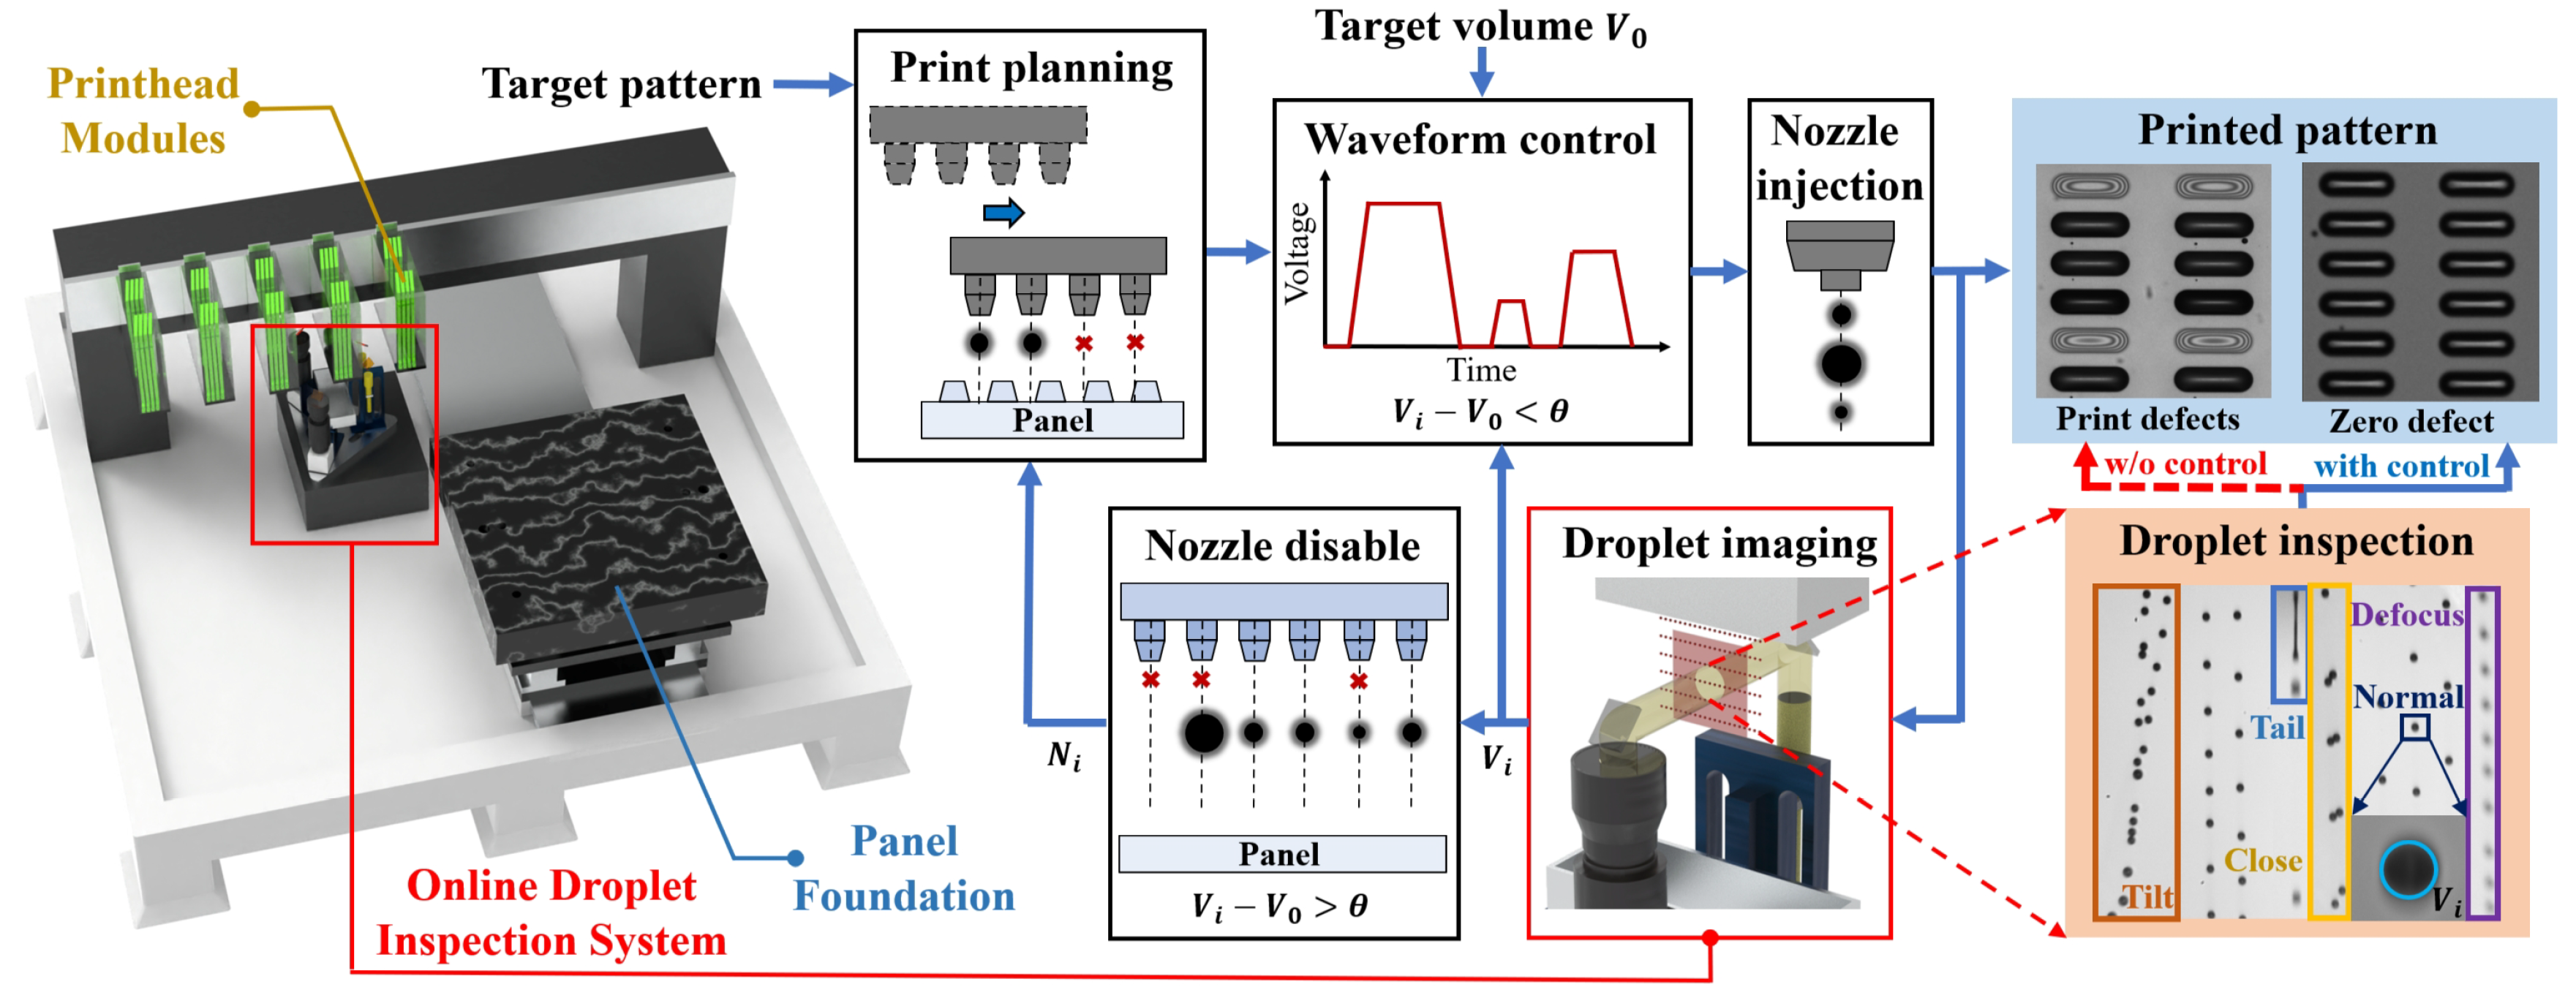
Figure 2.
Gray value distribution of in-flight droplet image. (a) Inkjeted droplets. (b) Zoom-in view of the droplet size. (c) Horizontal gray value distribution of the droplet image. (d) Vertical gray value distribution of the droplet image.
Figure 2.
Gray value distribution of in-flight droplet image. (a) Inkjeted droplets. (b) Zoom-in view of the droplet size. (c) Horizontal gray value distribution of the droplet image. (d) Vertical gray value distribution of the droplet image.
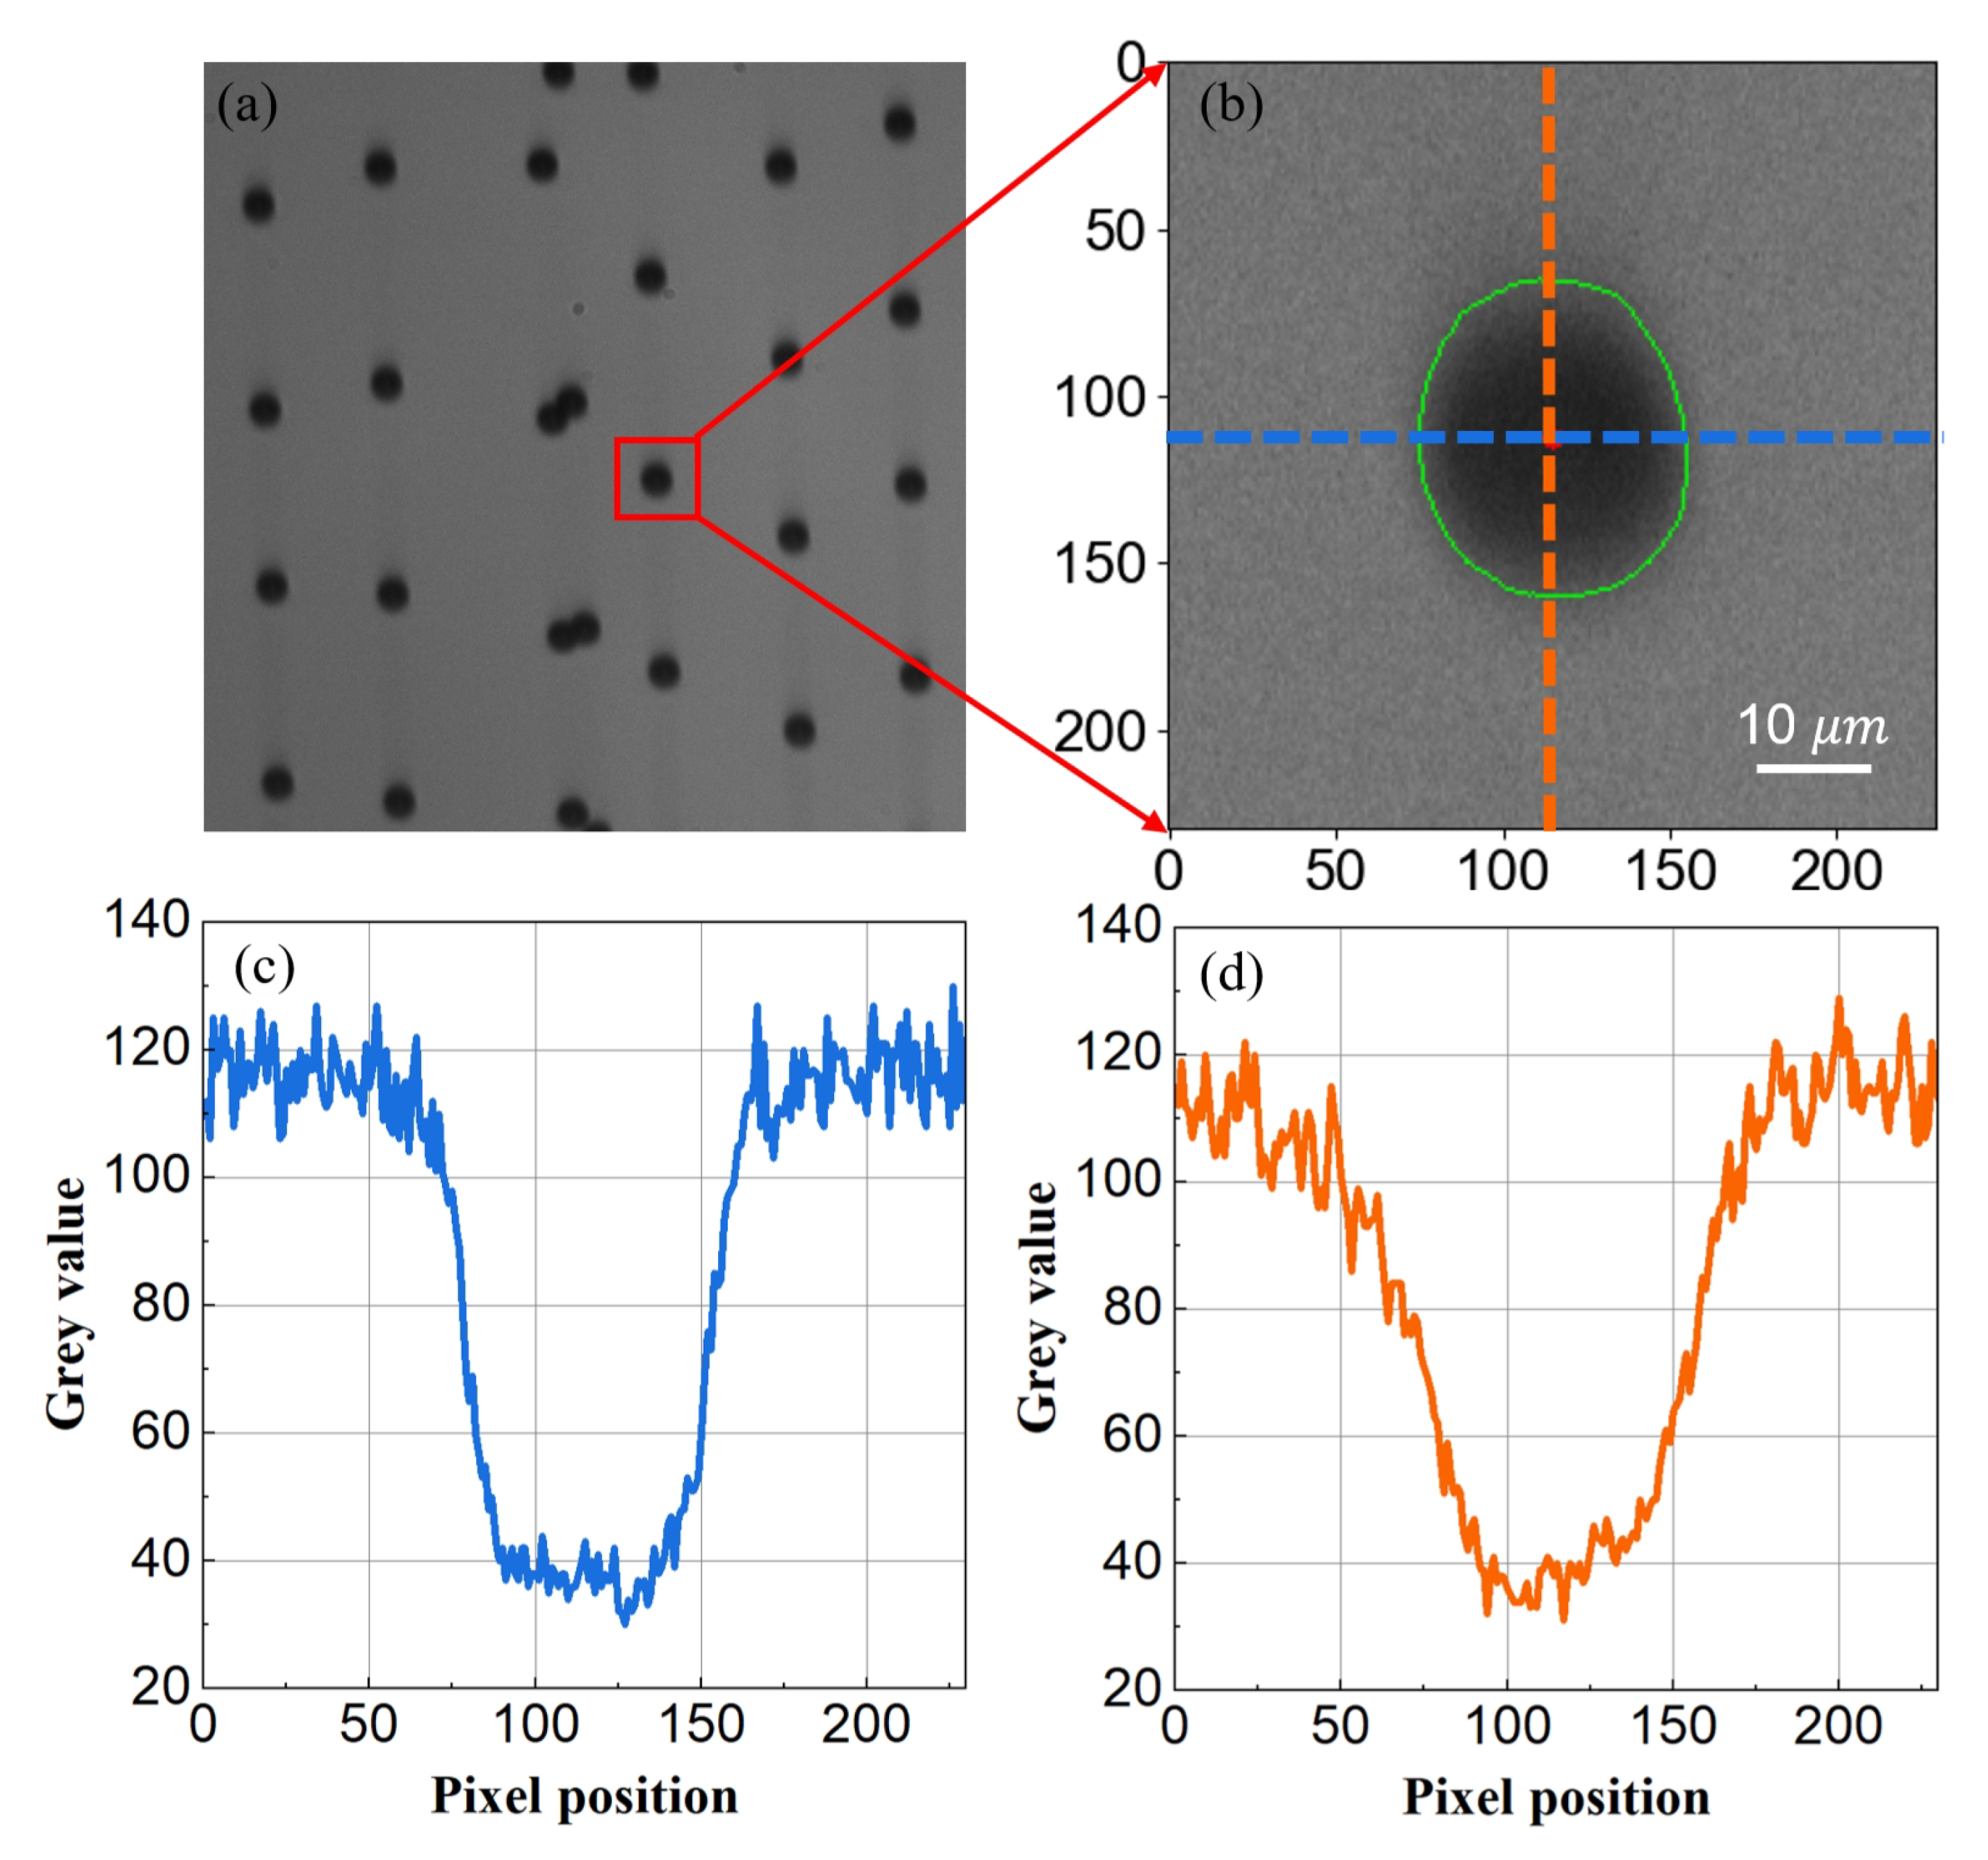
Figure 3.
Physically-Informed DGMN degradation model for droplet images.
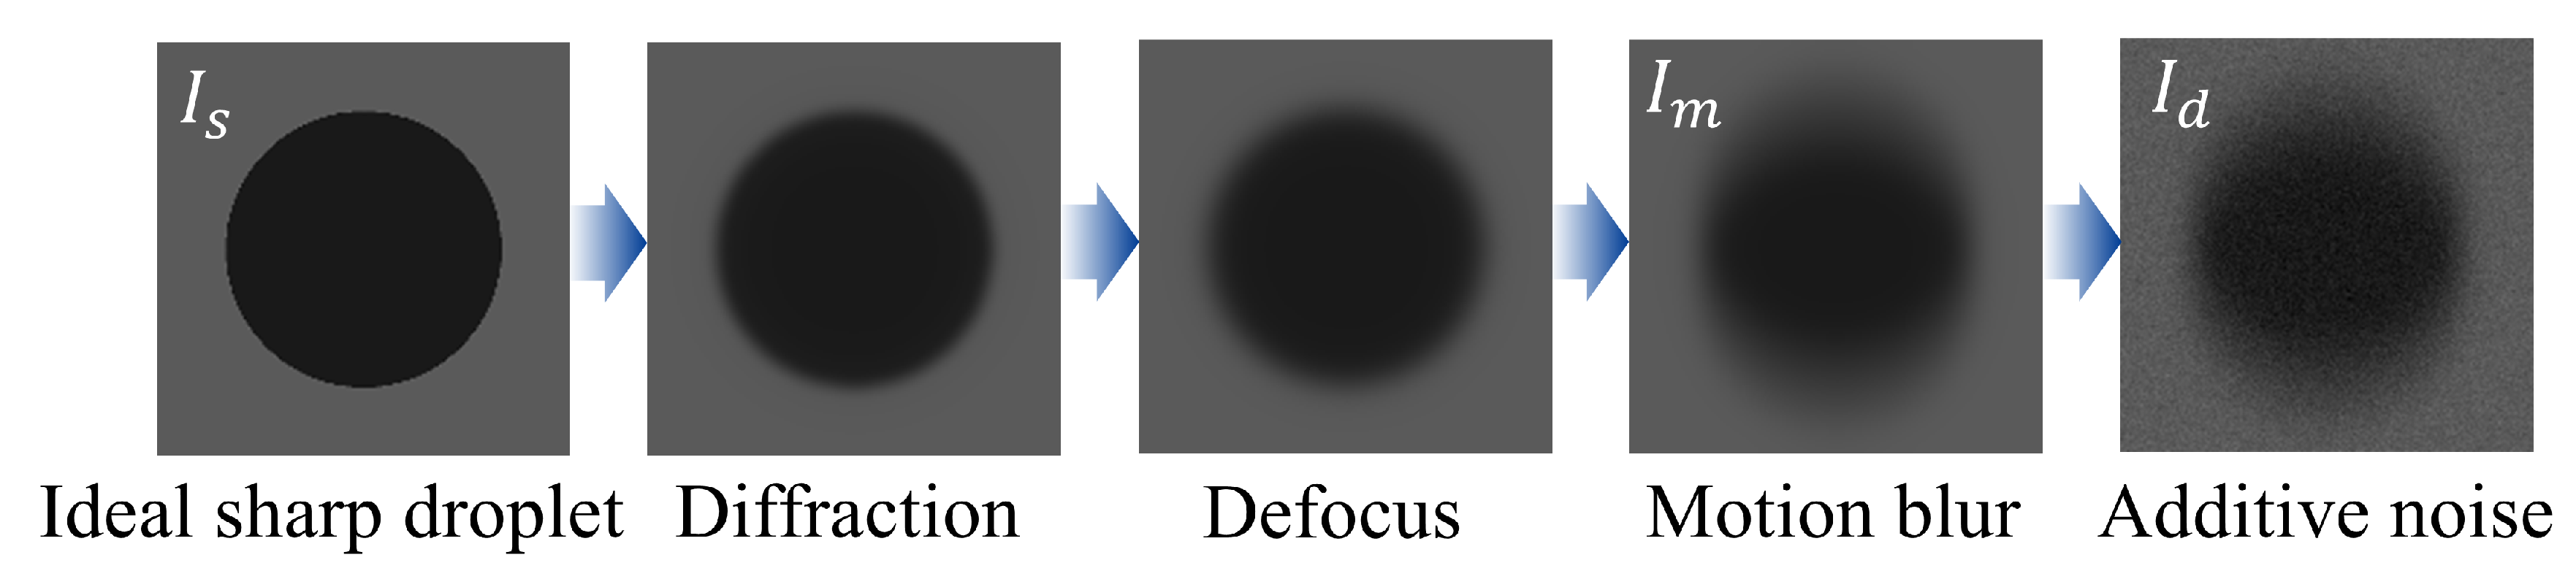
Figure 4.
The schematic of LensOBL.
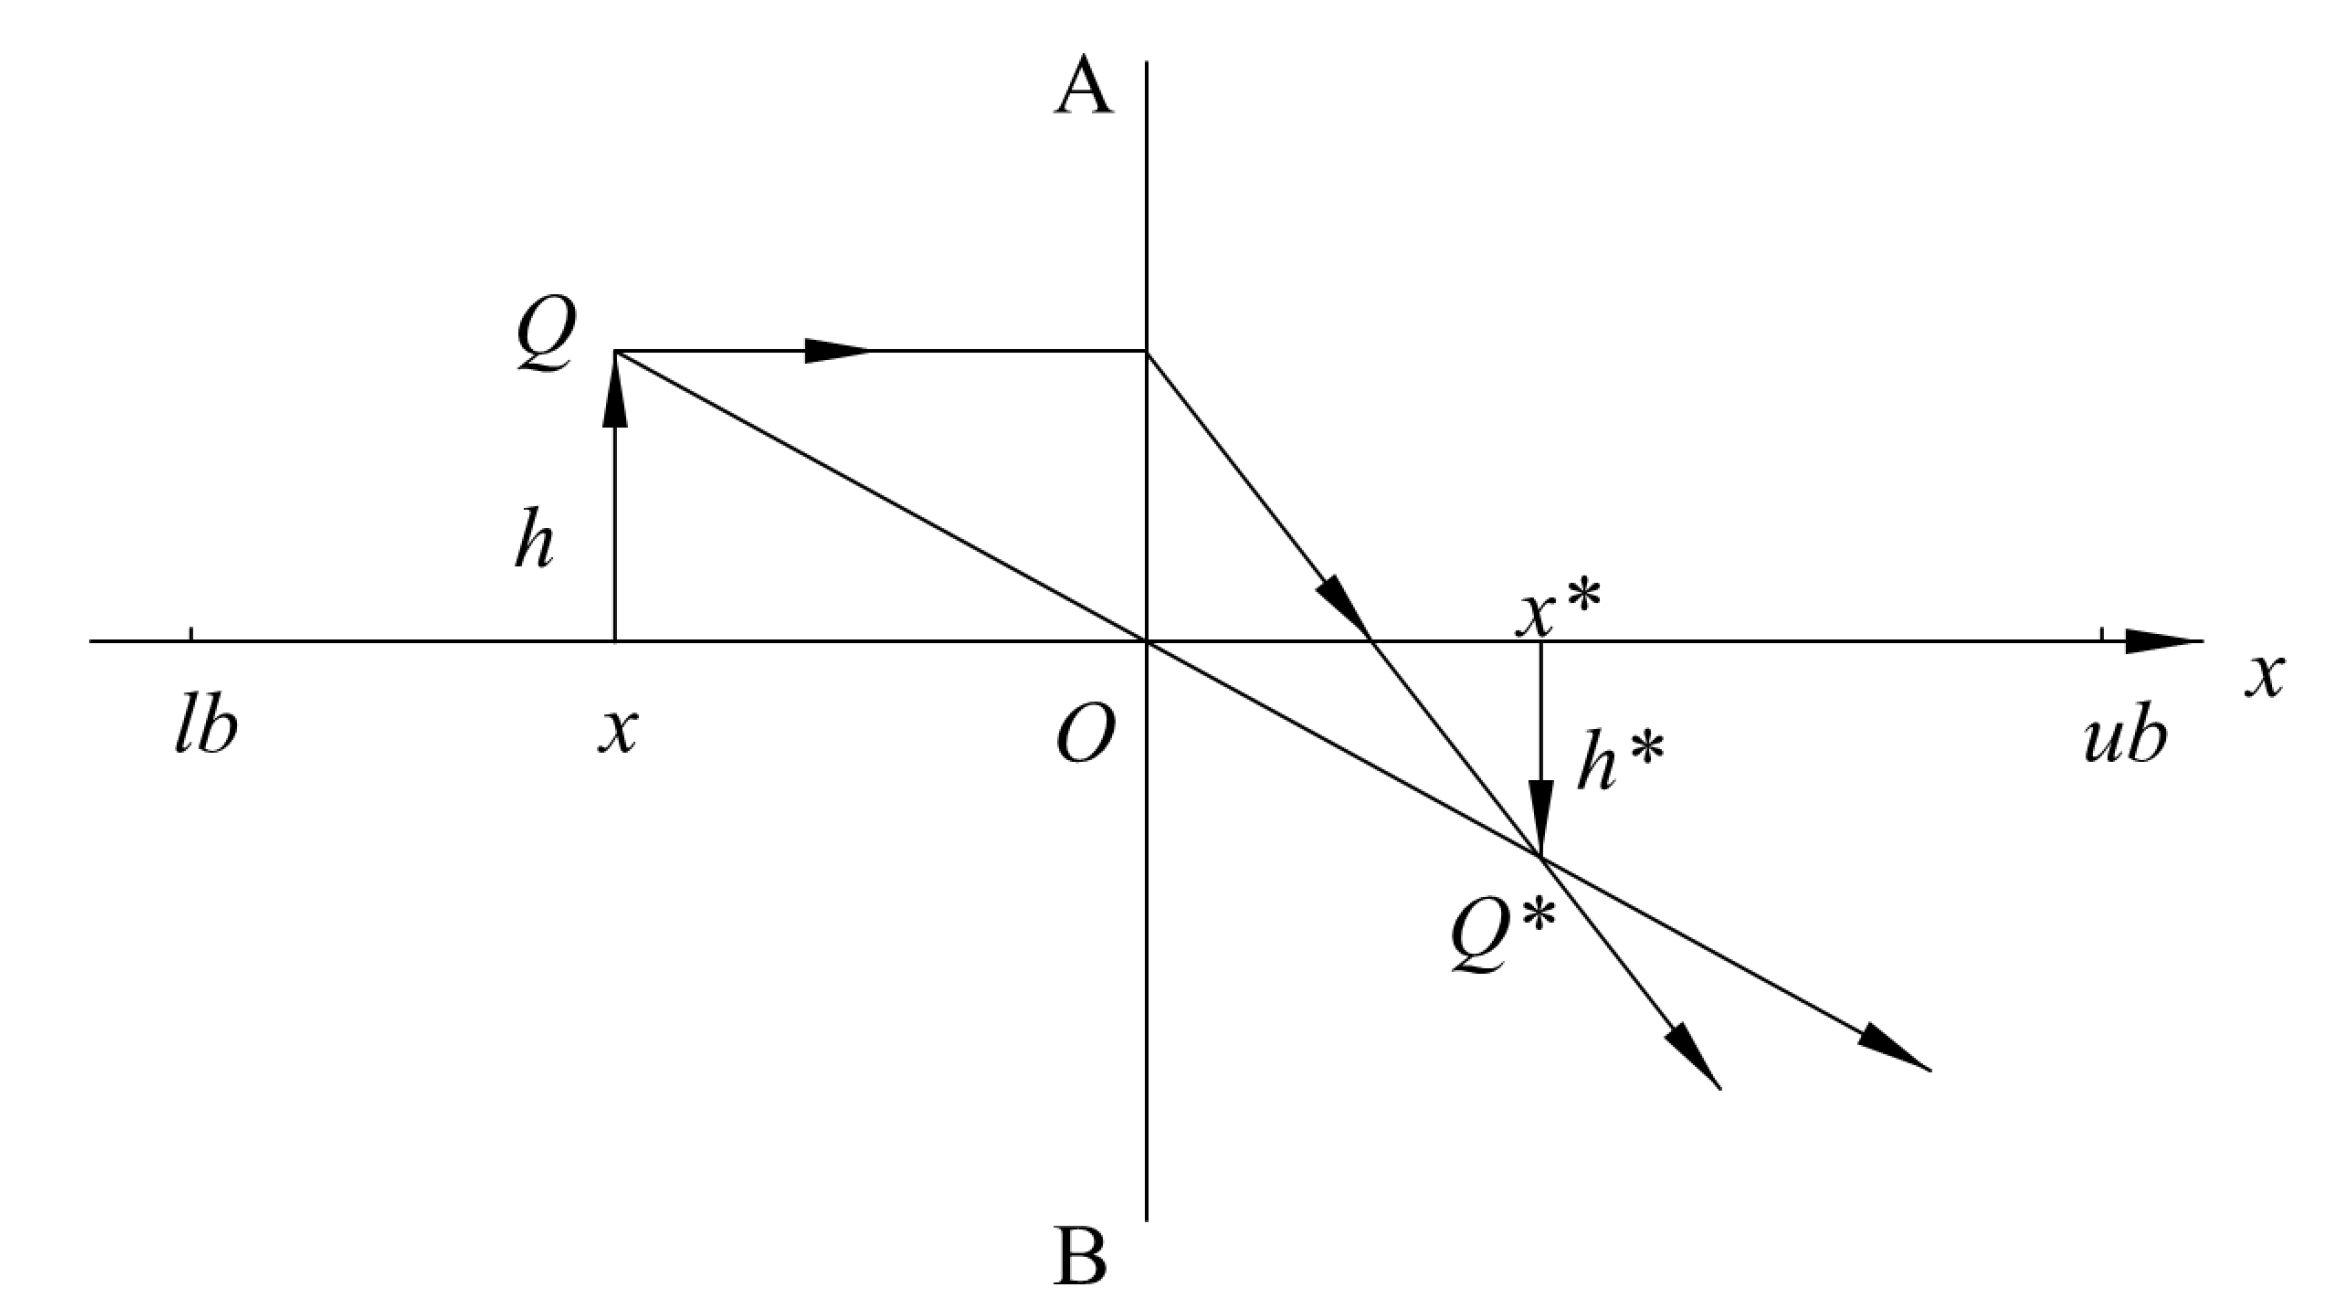
Figure 5.
Iterative results on benchmark functions.
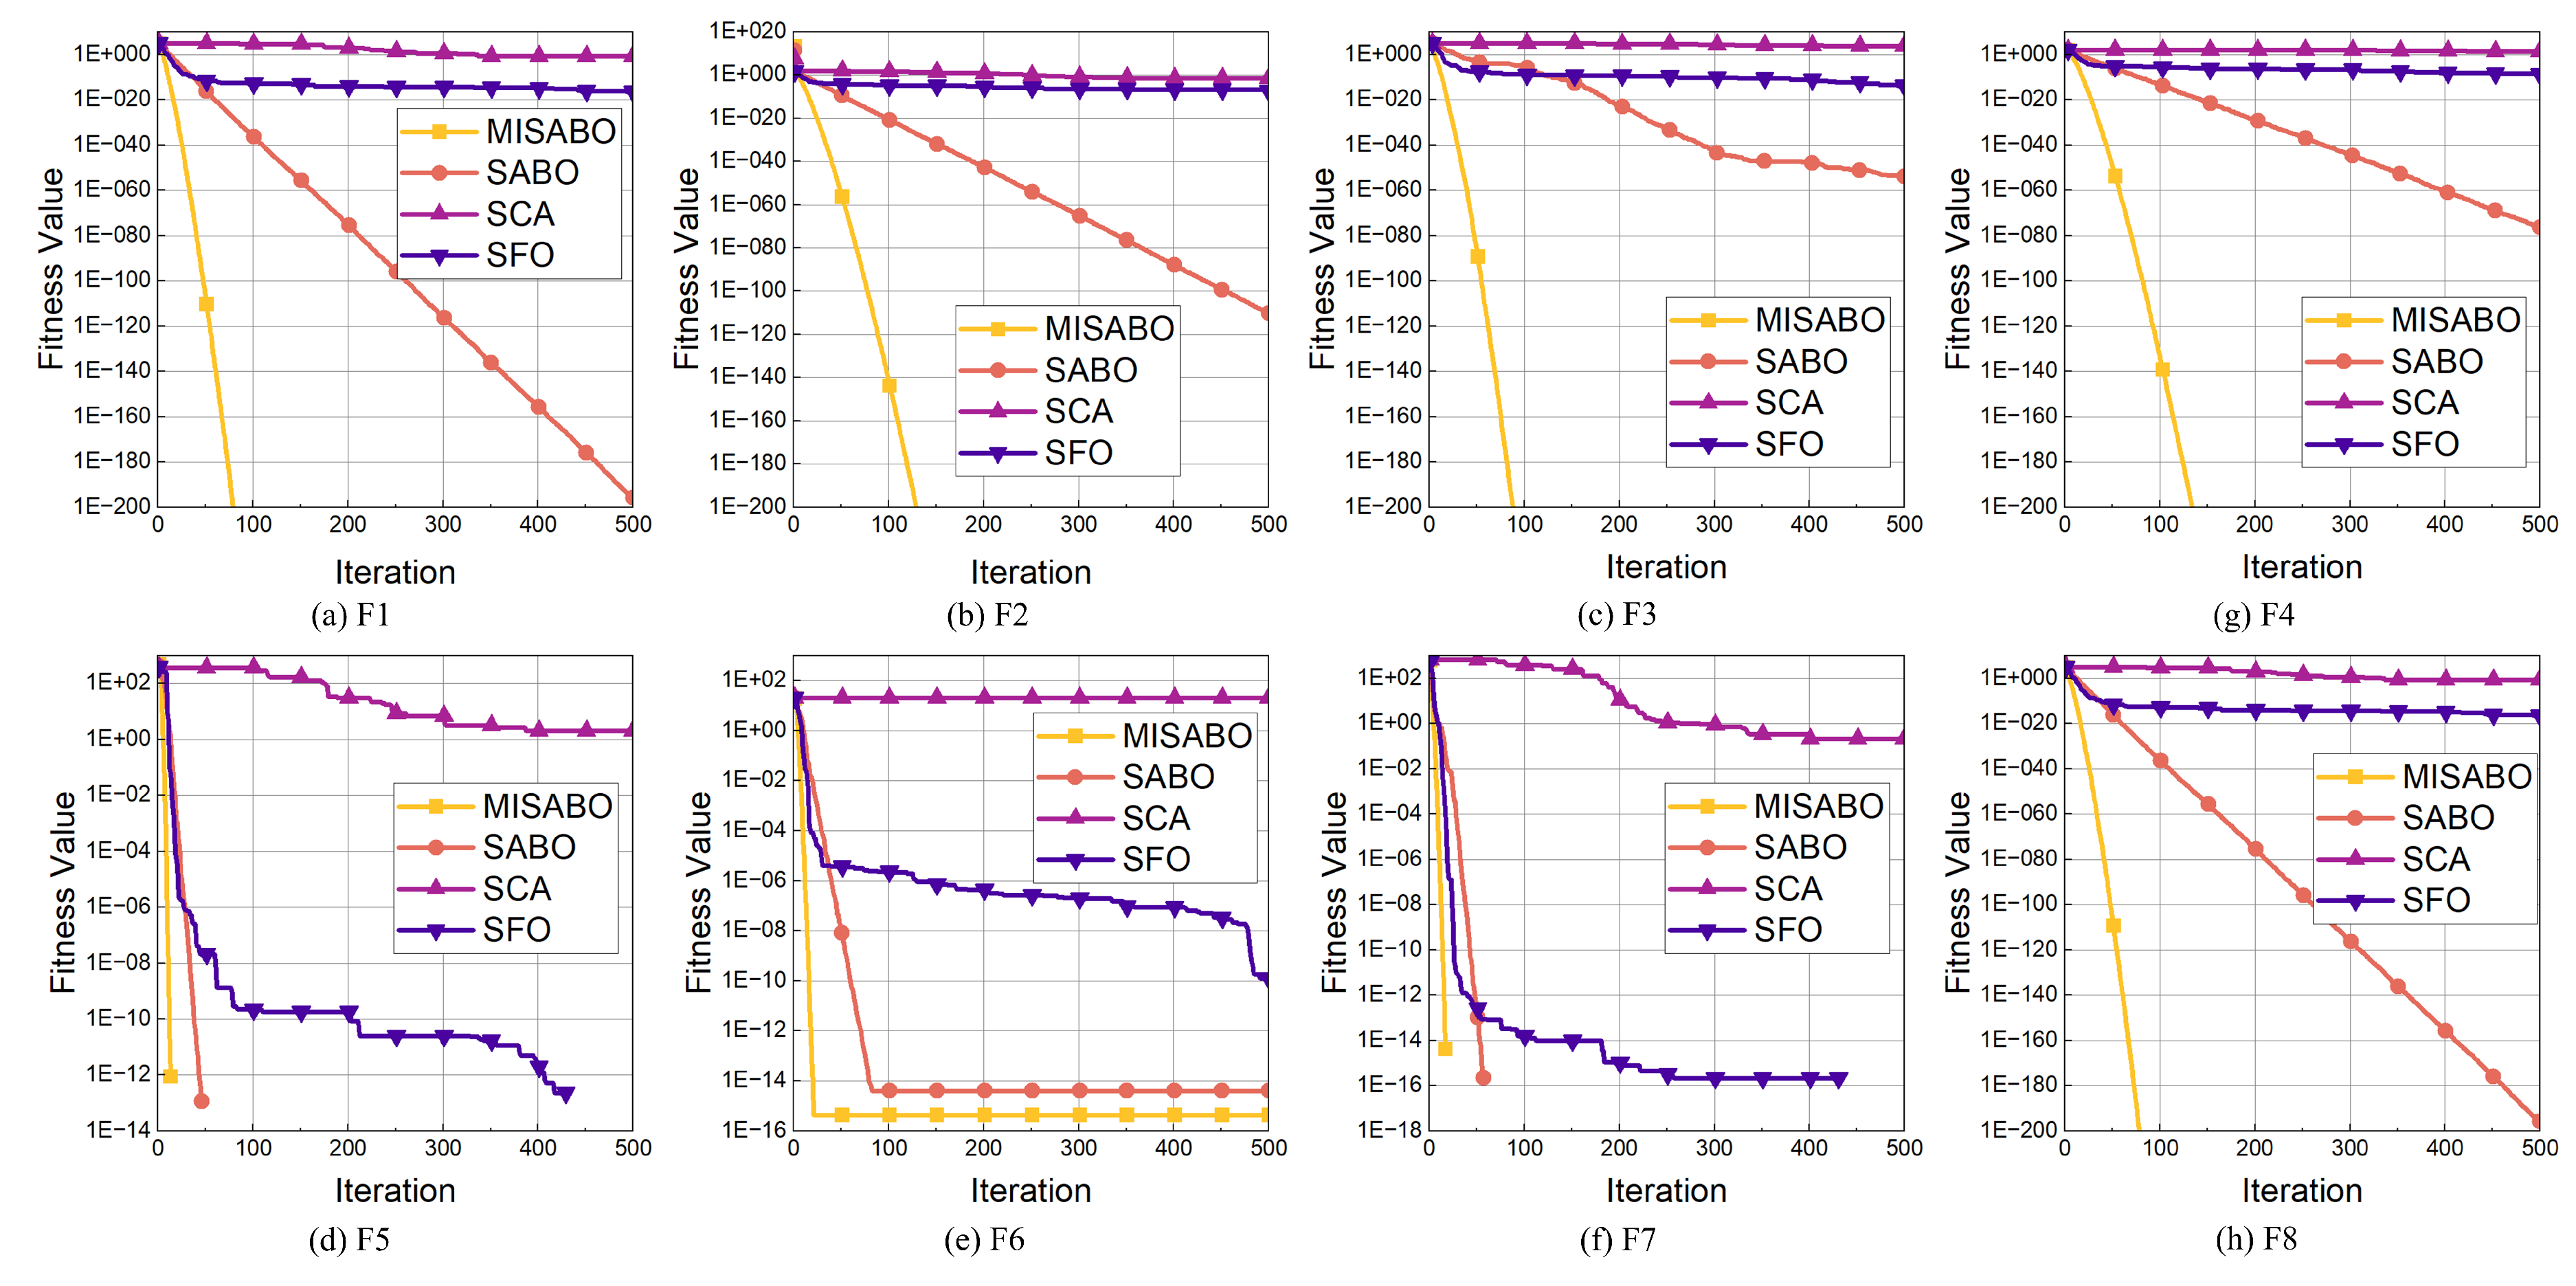
Figure 6.
NEJ-PTG6H inkjet printing equipment. (a) Overview of the printing equipment; (b) Inside of the inkjet printer; (c) Close view of the ODIS system.
Figure 6.
NEJ-PTG6H inkjet printing equipment. (a) Overview of the printing equipment; (b) Inside of the inkjet printer; (c) Close view of the ODIS system.
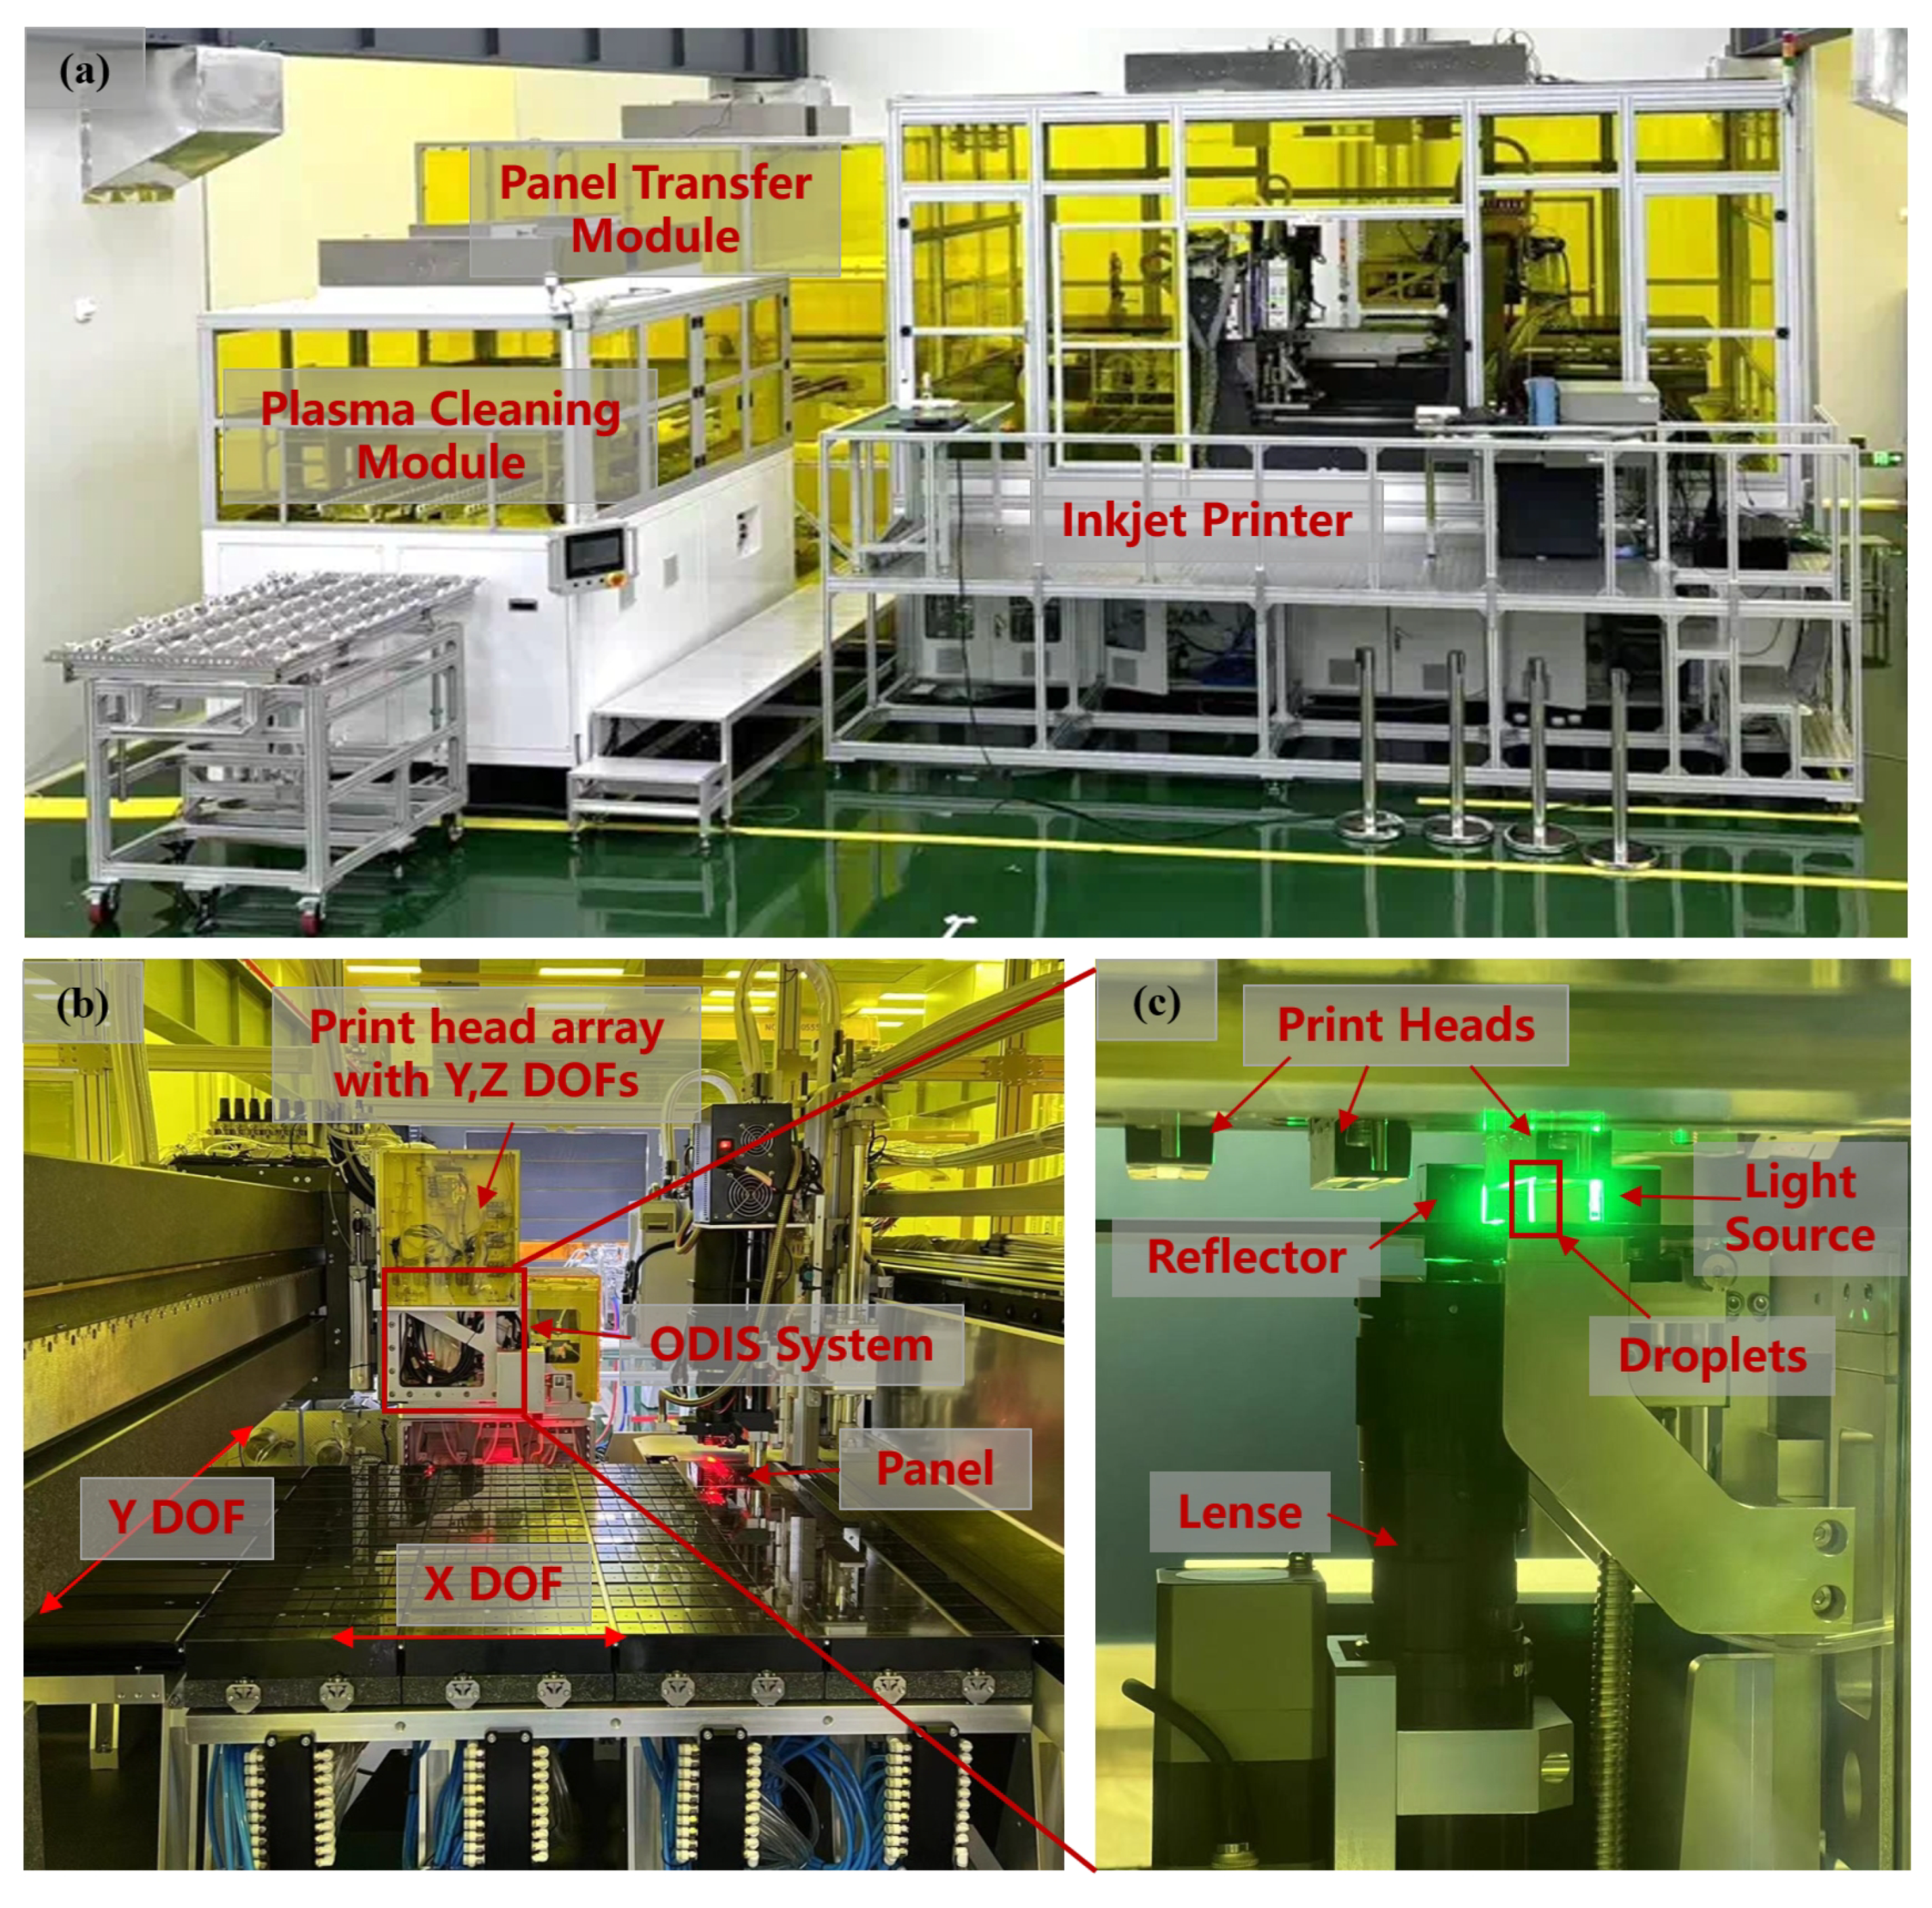
Figure 7.
Examples of captured in-flight droplets image.
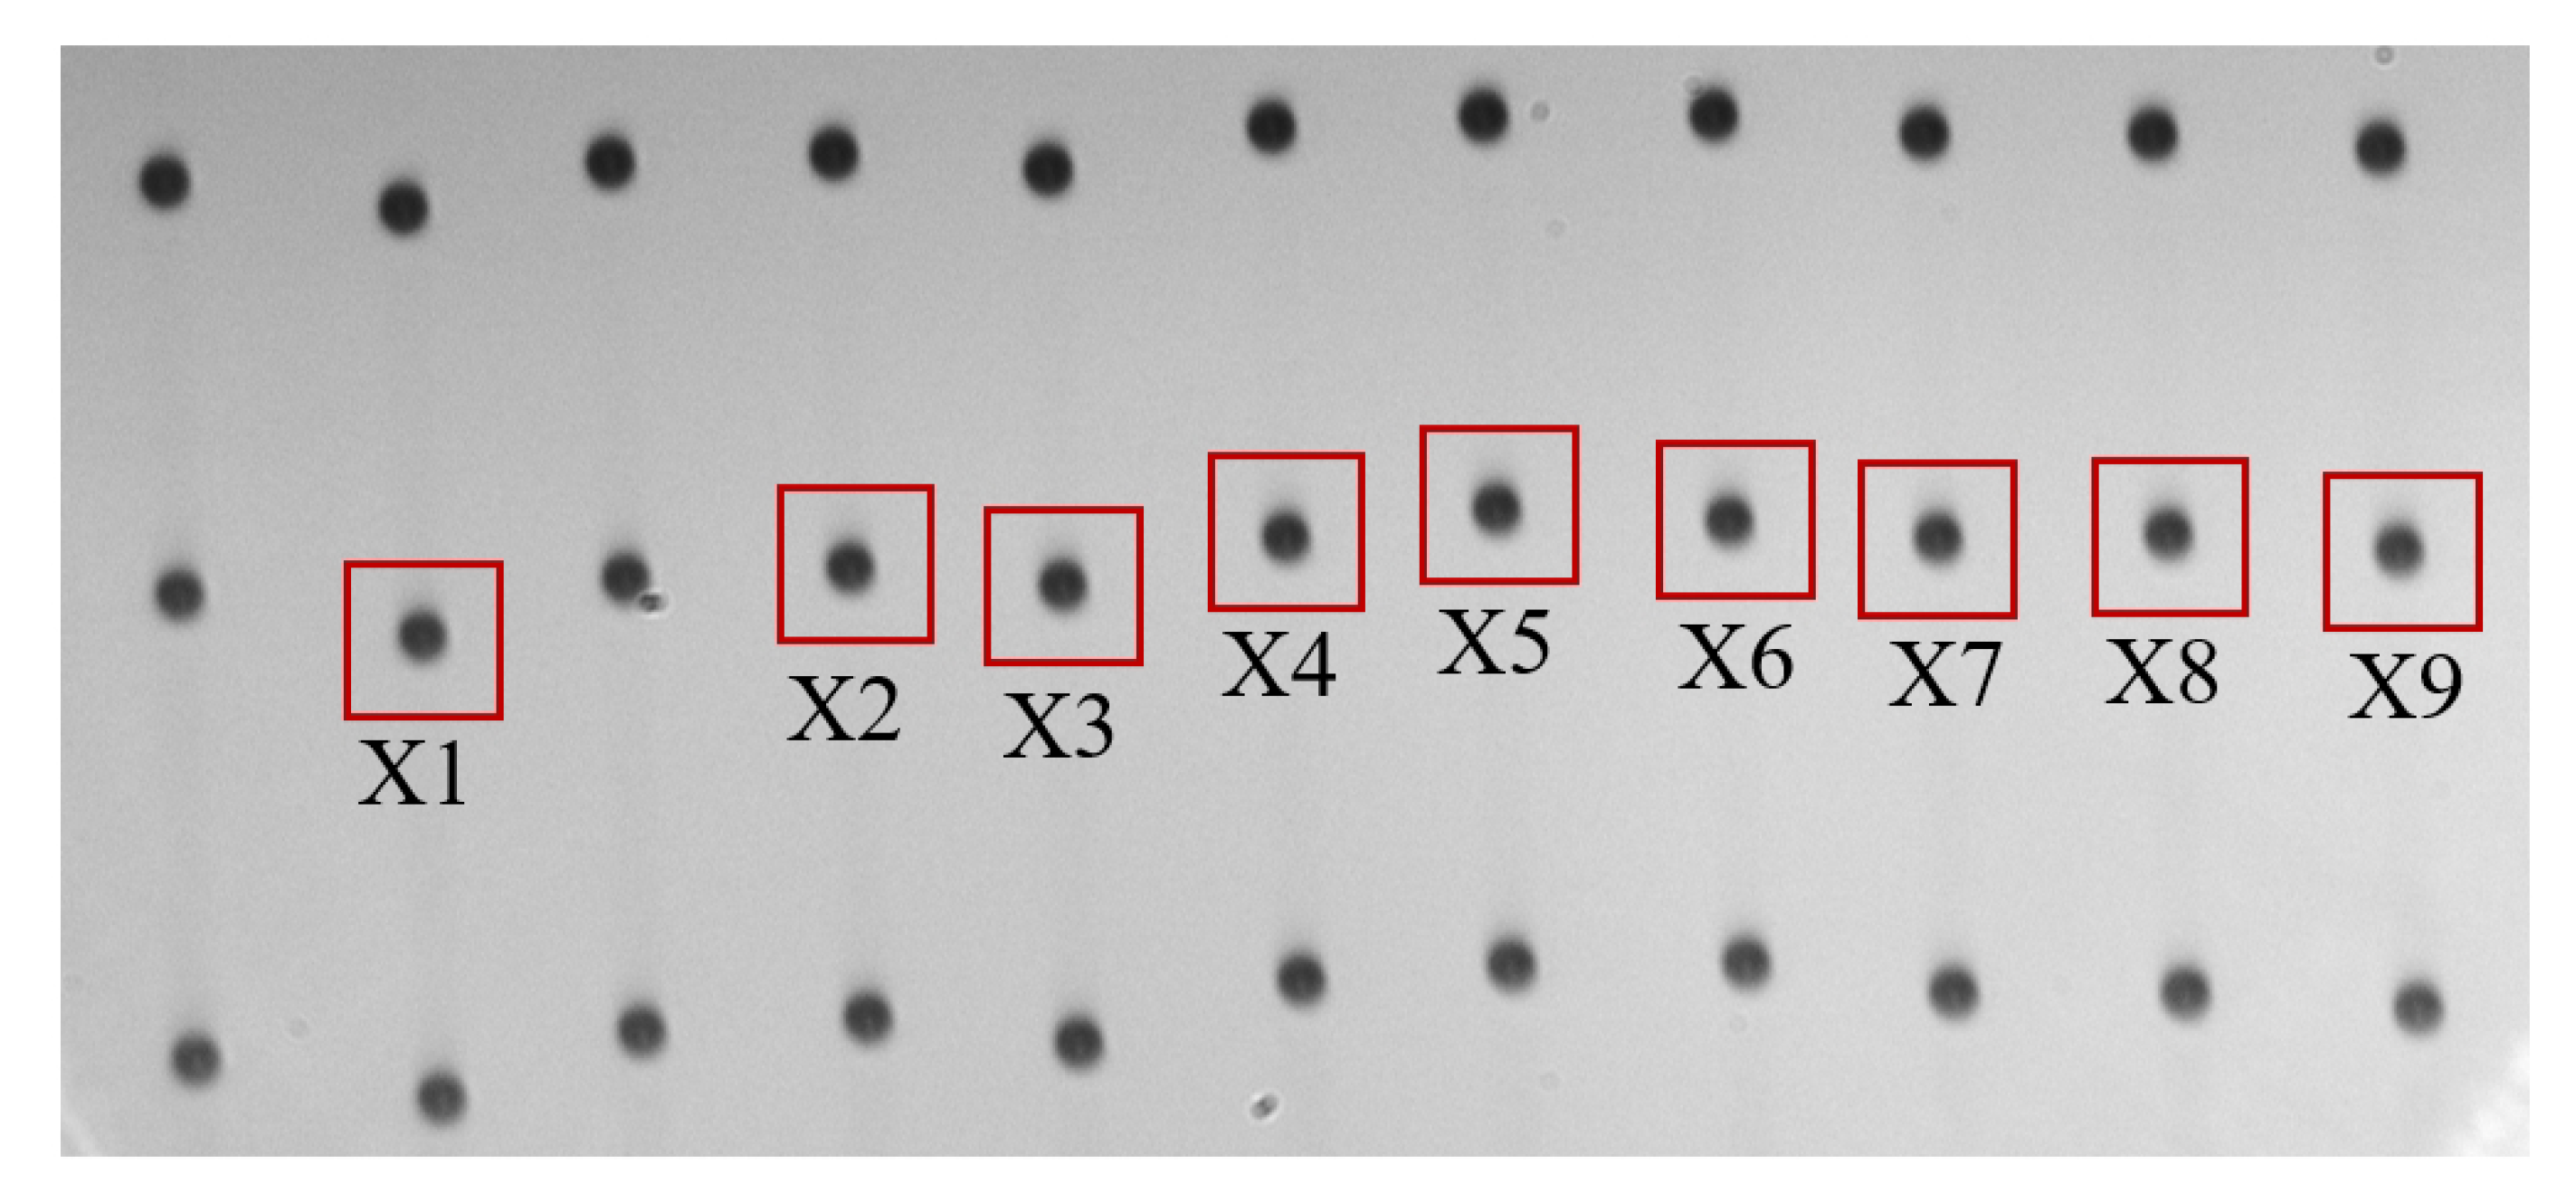
Figure 8.
Convergence trends by the proposed MISABO and its competitors applied to DGMN for synthetic droplet image generation.
Figure 8.
Convergence trends by the proposed MISABO and its competitors applied to DGMN for synthetic droplet image generation.
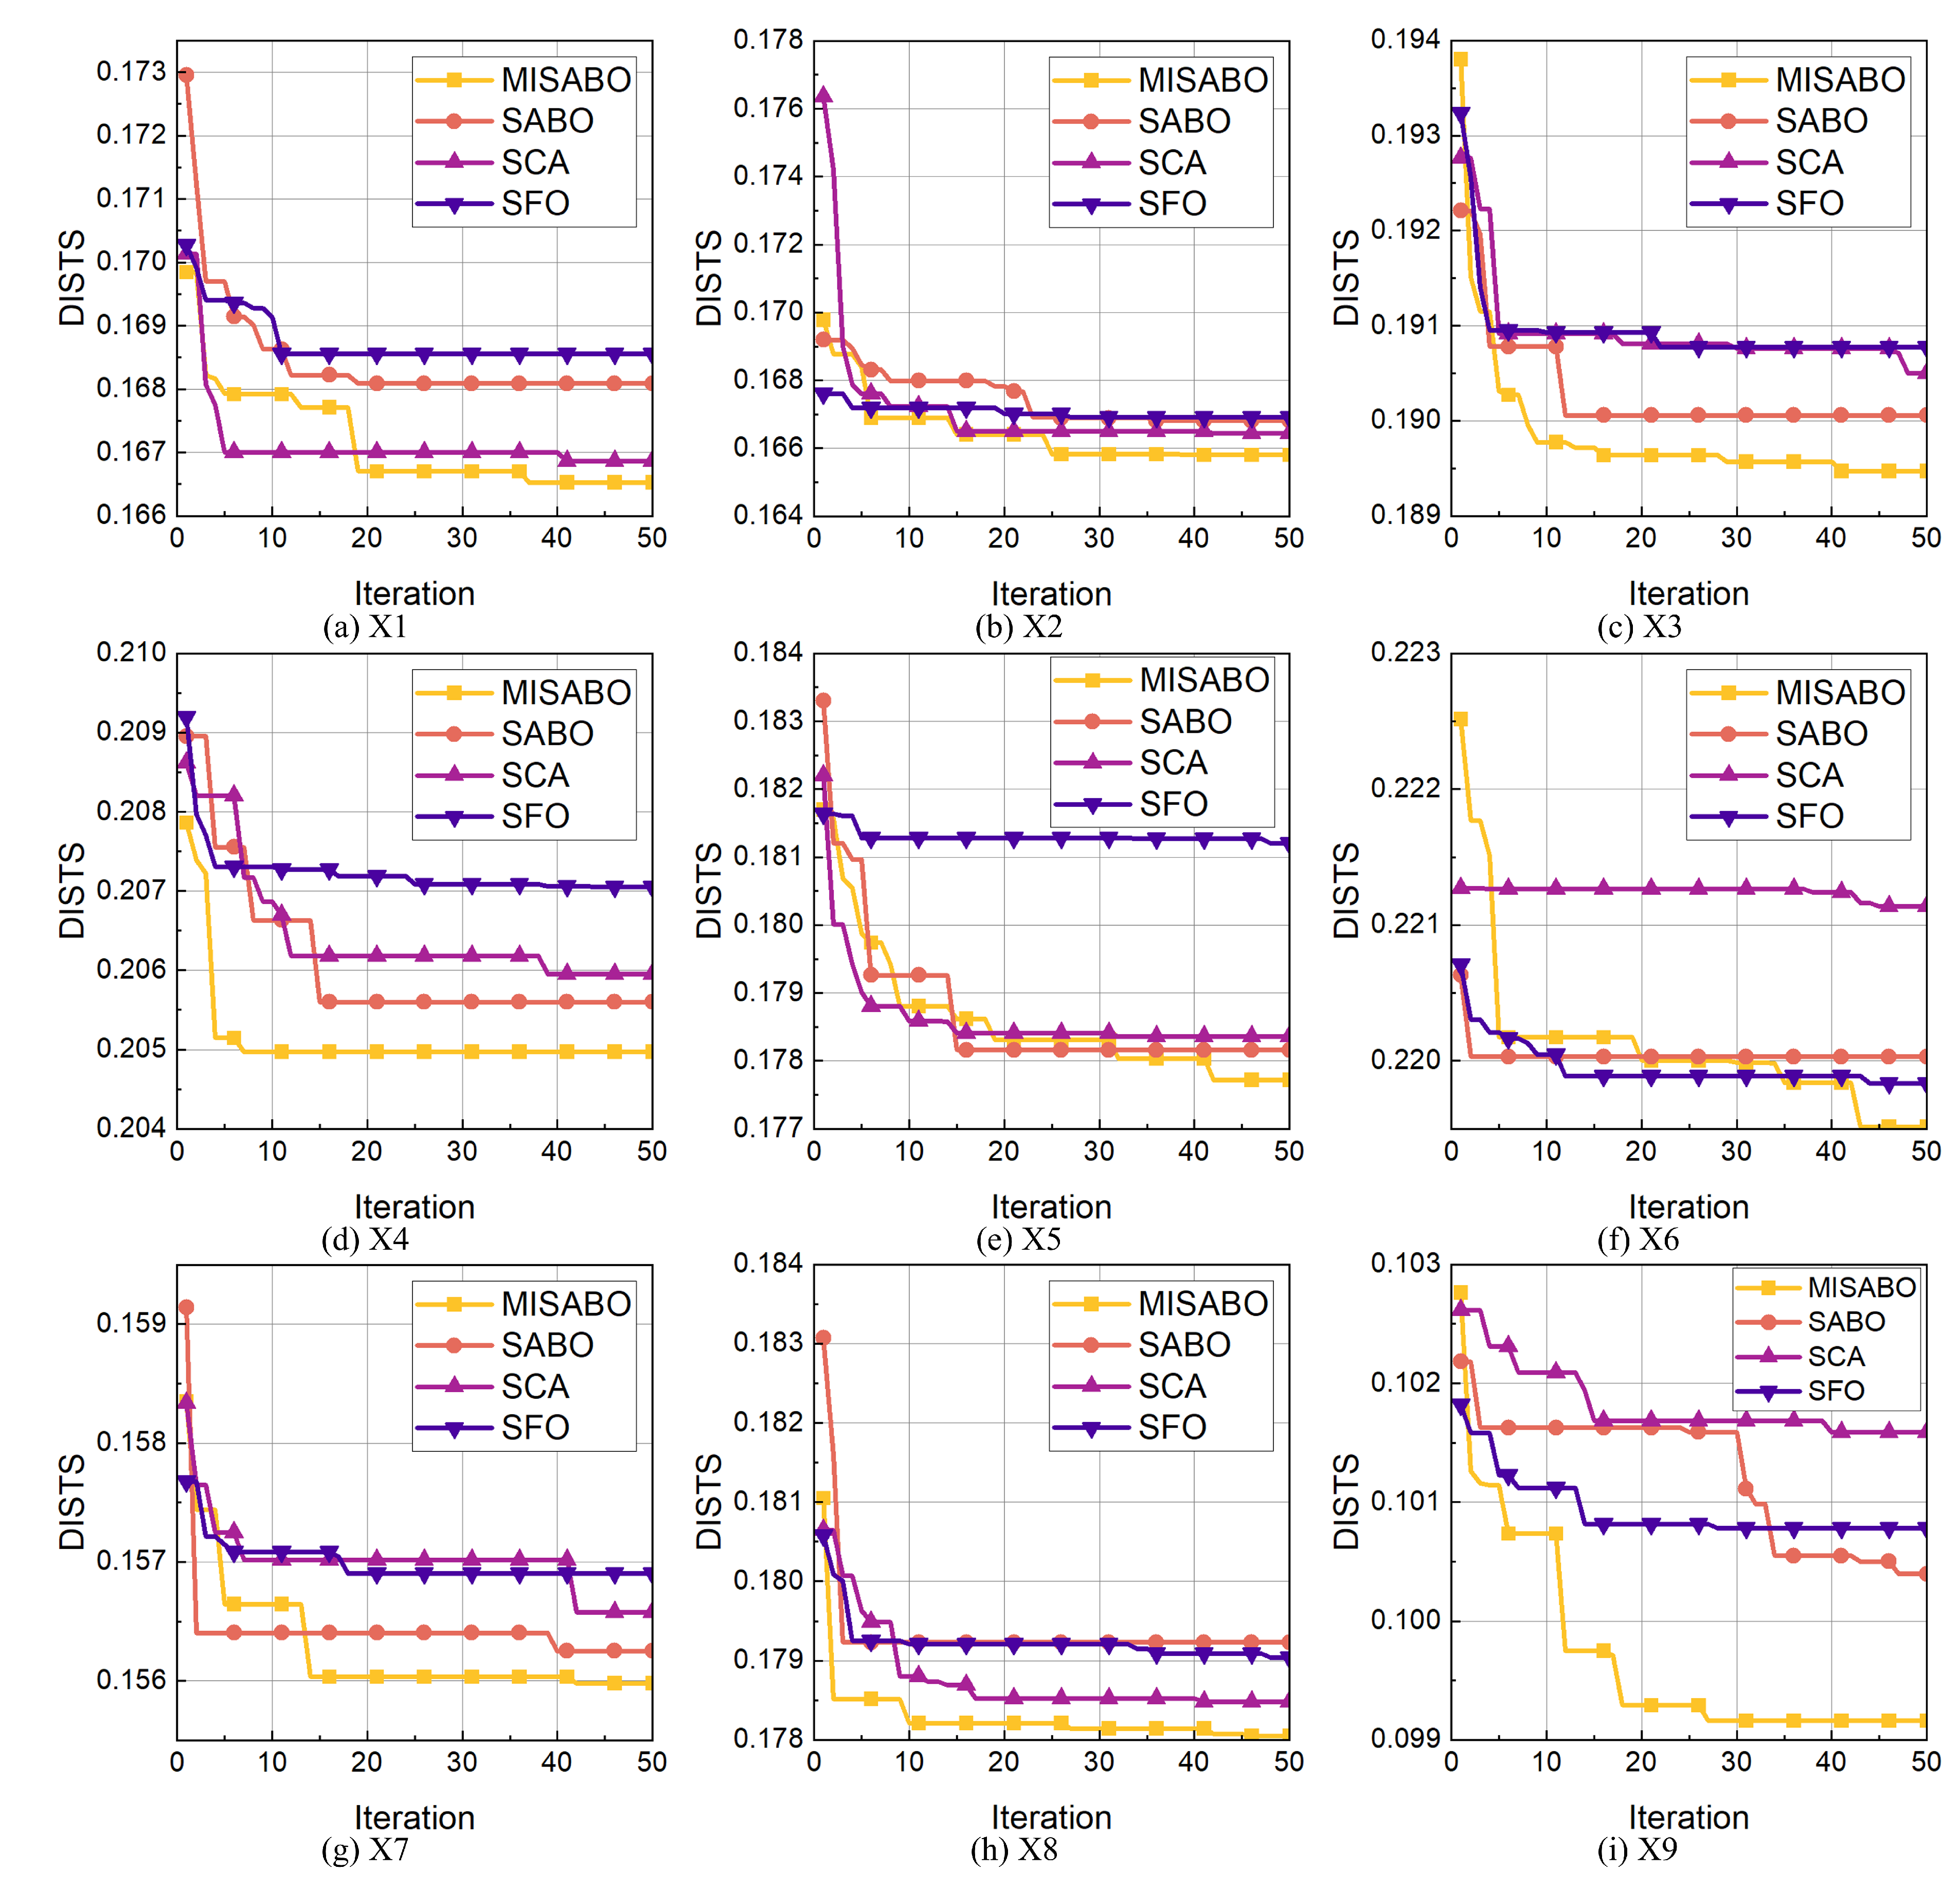
Figure 9.
Examples of Synthetic Droplet Images and Real droplet Images (right).
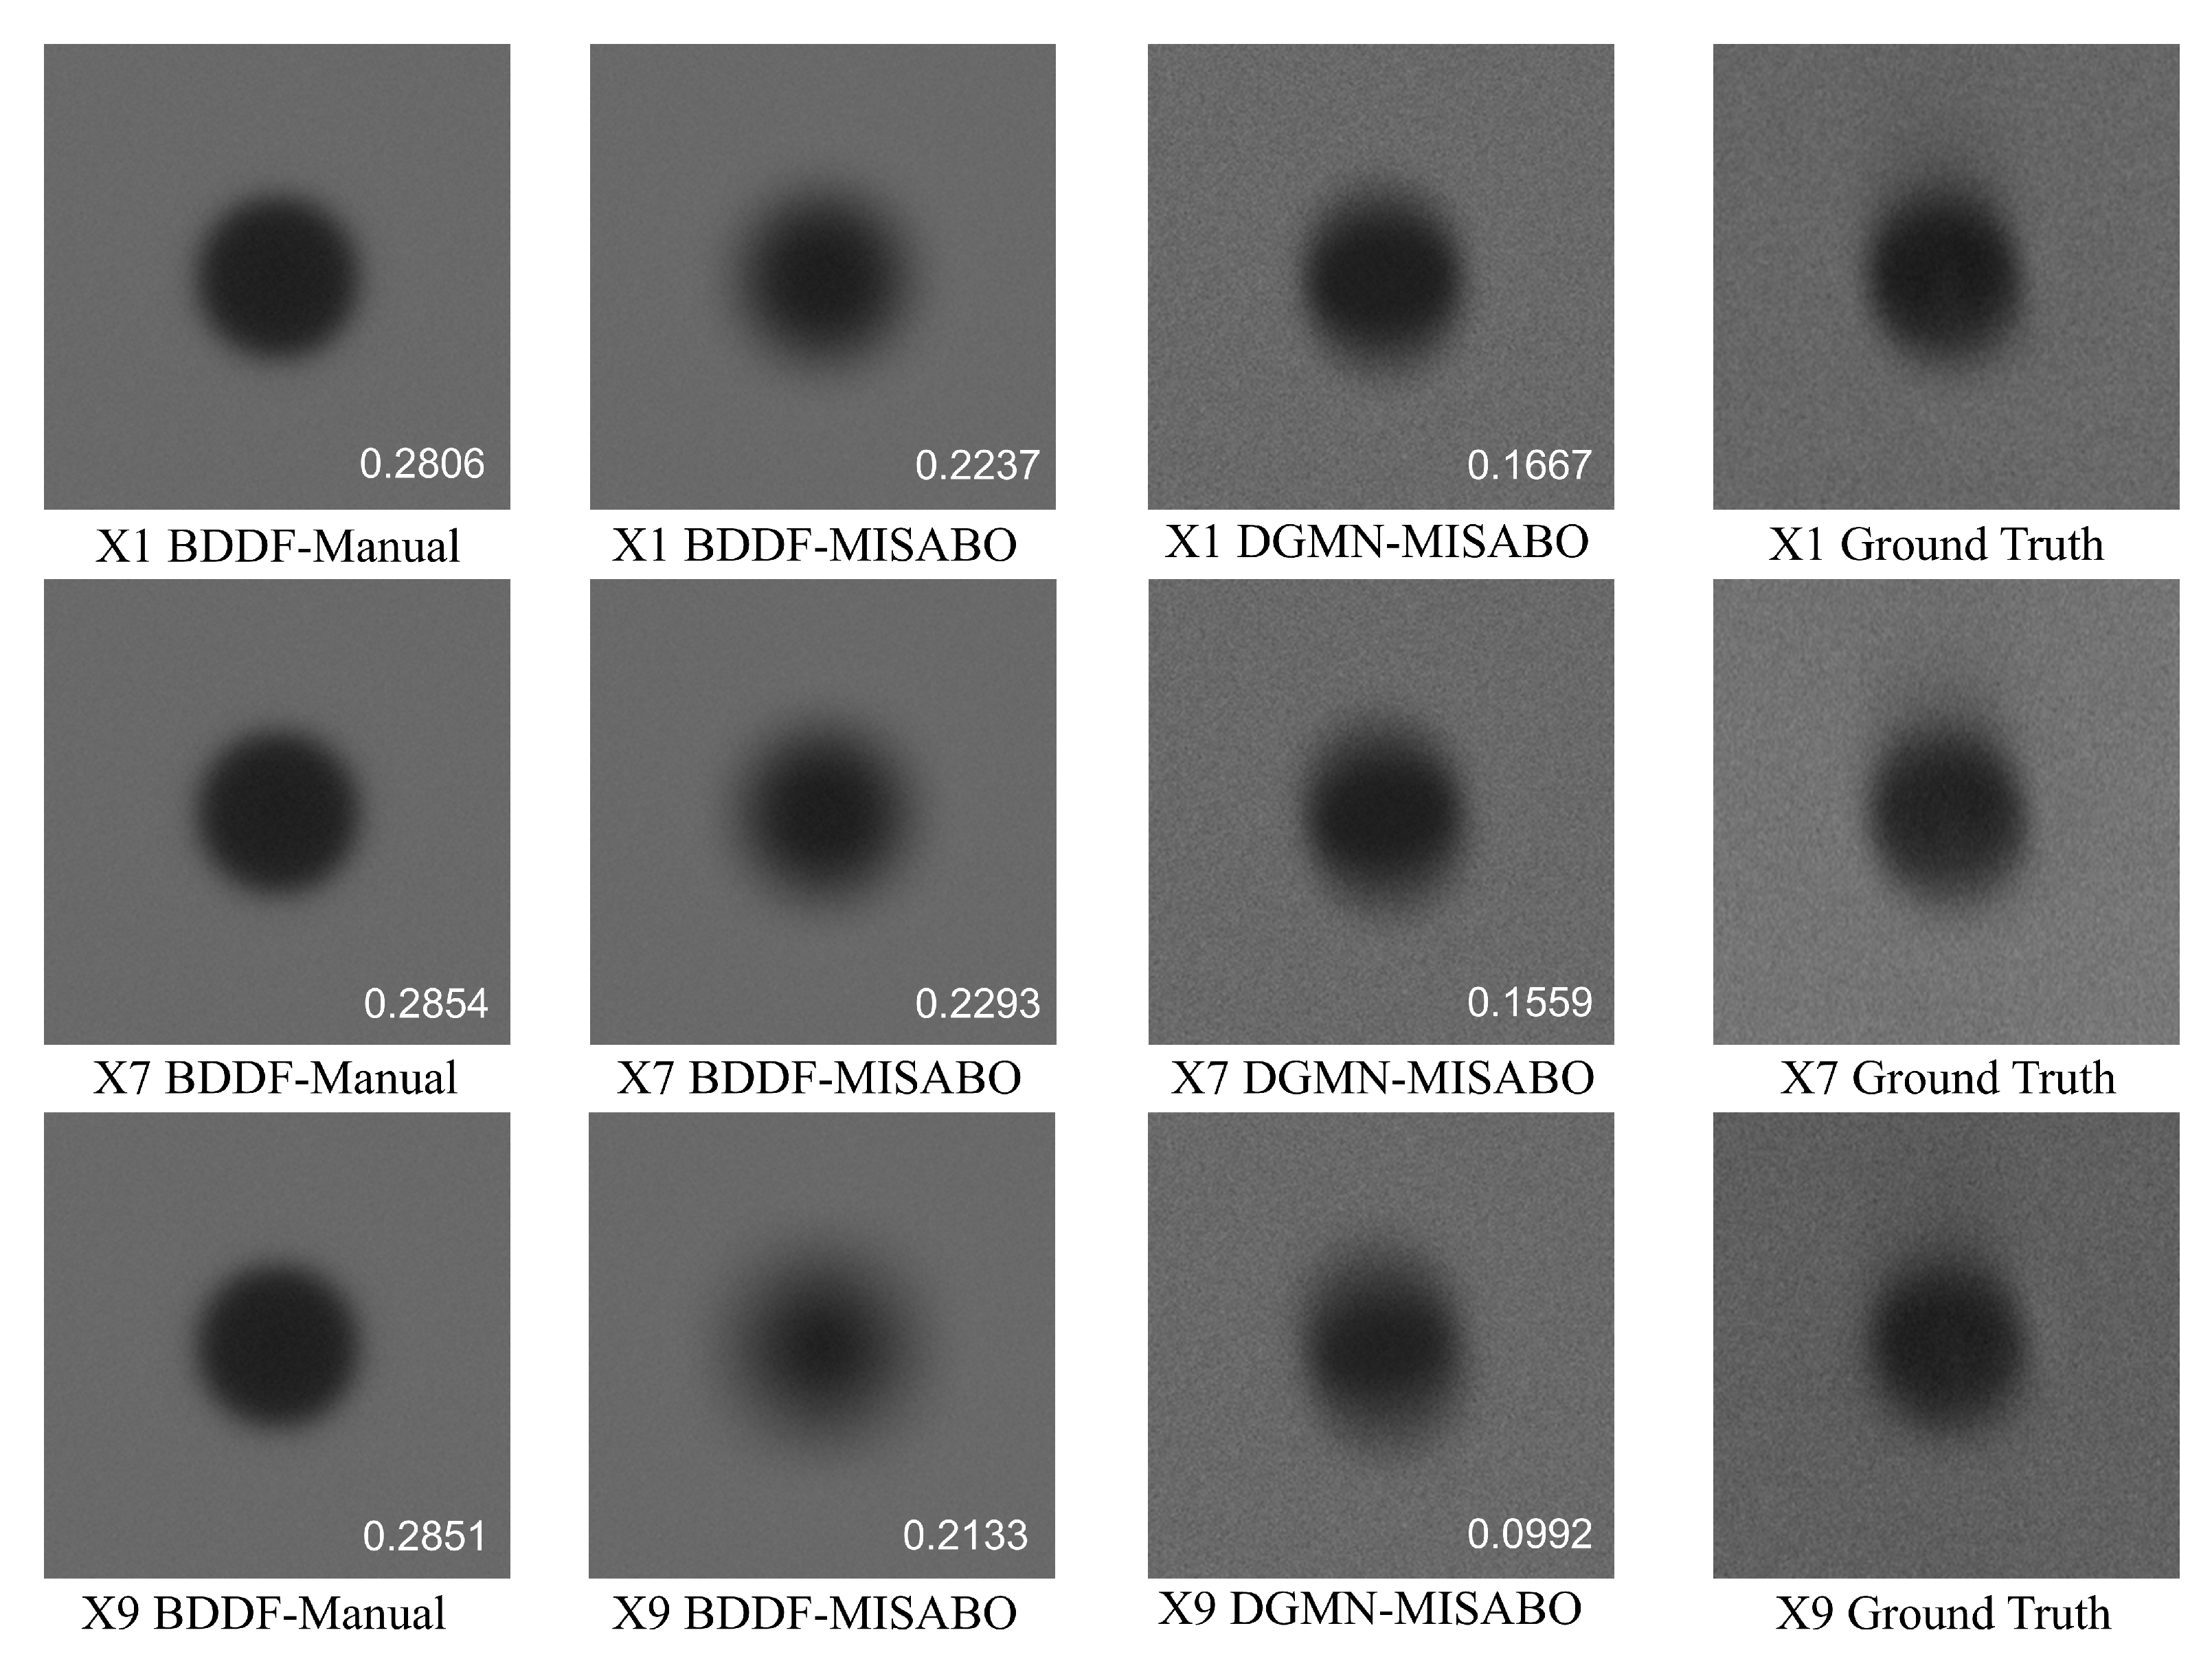

Table 1.
Benchmark Functions Used in Evaluation
| Function | Range | |
|---|---|---|
| 0 | ||
| 0 | ||
| 0 | ||
| 0 | ||
| 0 | ||
|
|
0 | |
|
|
0 | |
|
where, and |
0 |
Table 2.
Optimization Results of Benchmark Functions
| Function | Metric | MISABO | SABO | SCA | SFO |
|---|---|---|---|---|---|
| F1 | mean | 0.00E+00 | 8.50E-201 | 4.36E+00 | 1.39E-18 |
| std | 0.00E+00 | 0.00E+00 | 6.97E+00 | 3.25E-18 | |
| best | 0.00E+00 | 9.50E-204 | 4.24E-02 | 1.09E-21 | |
| worst | 0.00E+00 | 9.45E-200 | 3.12E+01 | 1.66E-17 | |
| F2 | mean | 0.00E+00 | 1.38E-113 | 7.91E-03 | 1.52E-19 |
| std | 0.00E+00 | 4.04E-113 | 1.25E-02 | 6.80E-09 | |
| best | 0.00E+00 | 4.14E-115 | 3.72E-04 | 7.52E-11 | |
| worst | 0.00E+00 | 2.19E-112 | 5.67E-02 | 3.13E-08 | |
| F3 | mean | 0.00E+00 | 1.96E-30 | 5.49E+03 | 5.03E-16 |
| std | 0.00E+00 | 1.06E-29 | 4.15E+03 | 8.83E-16 | |
| best | 0.00E+00 | 5.50E-83 | 4.25E+02 | 9.04E-20 | |
| worst | 0.00E+00 | 5.83E-29 | 1.69E+04 | 4.04E-15 | |
| F4 | mean | 0.00E+00 | 9.36E-78 | 2.62E-01 | 2.11E-10 |
| std | 0.00E+00 | 1.32E-77 | 1.12E-01 | 2.60E-10 | |
| best | 0.00E+00 | 5.62E-79 | 2.32E+00 | 3.62E-12 | |
| worst | 0.00E+00 | 4.82E-77 | 4.43E+01 | 1.11E-09 | |
| F5 | mean | 0.00E+00 | 0.00E+00 | 3.09E+01 | 0.00E+00 |
| std | 0.00E+00 | 0.00E+00 | 3.14E+01 | 0.00E+00 | |
| best | 0.00E+00 | 0.00E+00 | 6.07E-04 | 0.00E+00 | |
| worst | 0.00E+00 | 0.00E+00 | 9.06E+01 | 0.00E+00 | |
| F6 | mean | 4.44E-16 | 3.99E-15 | 1.18E-01 | 5.87E-10 |
| std | 0.00E+00 | 0.00E+00 | 9.46E+00 | 6.32E-10 | |
| best | 4.44E-16 | 3.99E-15 | 8.22E-03 | 9.52E-12 | |
| worst | 4.44E-16 | 3.99E-15 | 2.04E-01 | 2.23E-09 | |
| F7 | mean | 0.00E+00 | 0.00E+00 | 7.78E-01 | 0.00E+00 |
| std | 0.00E+00 | 0.00E+00 | 2.28E-01 | 0.00E+00 | |
| best | 0.00E+00 | 0.00E+00 | 2.72E-01 | 0.00E+00 | |
| worst | 0.00E+00 | 0.00E+00 | 1.09E+00 | 0.00E+00 | |
| F8 | mean | 7.08E-04 | 1.72E-01 | 1.36E+01 | 3.62E-01 |
| std | 2.46E-04 | 7.08E-02 | 2.64E+01 | 3.53E-01 | |
| best | 3.56E-04 | 5.88E-02 | 9.46E-01 | 7.91E-04 | |
| worst | 1.50E-03 | 3.52E-01 | 1.43E+02 | 1.33E+00 |
Table 3.
Control Parameters and Their Value Ranges in the DGMN Model
| Parameter | Value Range |
|---|---|
| Lense NA | |
| Diffraction kernel size | |
| Diffraction kernel scale | |
| Mixed Gaussian kernel size | |
| Mixed Gaussian kernel sigma | |
| Motion kernel size | |
| Droplet flying angle |
Table 4.
DISTS of Each Algorithm in Synthetic Droplet Image Generation, *Method in [15]
Table 4.
DISTS of Each Algorithm in Synthetic Droplet Image Generation, *Method in [15]
| Image | MISABO | SABO | SCA | SFO | Baseline* |
|---|---|---|---|---|---|
| X1 | 0.1665 | 0.1681 | 0.1669 | 0.1686 | 0.2806 |
| X2 | 0.1658 | 0.1668 | 0.1664 | 0.1669 | 0.2703 |
| X3 | 0.1895 | 0.1901 | 0.1905 | 0.1908 | 0.2734 |
| X4 | 0.2049 | 0.2056 | 0.2060 | 0.2071 | 0.2714 |
| X5 | 0.1777 | 0.1782 | 0.1784 | 0.1812 | 0.2831 |
| X6 | 0.2195 | 0.2200 | 0.2211 | 0.2198 | 0.2780 |
| X7 | 0.1559 | 0.1563 | 0.1566 | 0.1570 | 0.2854 |
| X8 | 0.1781 | 0.1792 | 0.1785 | 0.1790 | 0.2758 |
| X9 | 0.0992 | 0.1004 | 0.1016 | 0.1008 | 0.2851 |
| Average | 0.1730 | 0.1739 | 0.1740 | 0.1746 | 0.2781 |
Table 5.
Ablation Studies of the Proposed MISABO-optimized DGMN Model. M1: (B) Basic Droplet Degradation Framework; M2: M1 + Motion Blur; M3: M1 + Adaptive Noise; M4: (D) DGMN; *M1 with manually configured parameters in [15].
Table 5.
Ablation Studies of the Proposed MISABO-optimized DGMN Model. M1: (B) Basic Droplet Degradation Framework; M2: M1 + Motion Blur; M3: M1 + Adaptive Noise; M4: (D) DGMN; *M1 with manually configured parameters in [15].
| Methods | M1 | M2 | M3 | M4 (Ours) |
|---|---|---|---|---|
| B | ||||
| Motion Blur | ||||
| Adaptive Noise | ||||
| DISTS | 0.2781 */0.1905 | 0.1884 | 0.1771 | 0.1730 |
Table 6.
Ablation Studies of Integrated Strategies in MISABO. V1: (S) SABO; V2: V1 + Sobol Initialization; V3: V2 + LensOBL; V4: V3 + DLH.
Table 6.
Ablation Studies of Integrated Strategies in MISABO. V1: (S) SABO; V2: V1 + Sobol Initialization; V3: V2 + LensOBL; V4: V3 + DLH.
| Methods | V1 | V2 | V3 | V4 |
|---|---|---|---|---|
| S | ✔ | ✔ | ✔ | ✔ |
| Sobol | ✔ | ✔ | ✔ | |
| LensOBL | ✔ | ✔ | ||
| DLH | ✔ | |||
| DISTS | 0.1739 | 0.1737 | 0.1733 | 0.1730 |
Disclaimer/Publisher’s Note: The statements, opinions and data contained in all publications are solely those of the individual author(s) and contributor(s) and not of MDPI and/or the editor(s). MDPI and/or the editor(s) disclaim responsibility for any injury to people or property resulting from any ideas, methods, instructions or products referred to in the content. |
© 2025 by the authors. Licensee MDPI, Basel, Switzerland. This article is an open access article distributed under the terms and conditions of the Creative Commons Attribution (CC BY) license (http://creativecommons.org/licenses/by/4.0/).
Copyright: This open access article is published under a Creative Commons CC BY 4.0 license, which permit the free download, distribution, and reuse, provided that the author and preprint are cited in any reuse.


