
Submitted:
23 June 2025
Posted:
25 June 2025
You are already at the latest version
Abstract
Background: Early stage of chronic kidney disease (CKD) is closely associated with vascular remodeling and coronary artery calcification. The aim of the study is to determine whether adropin is associated with asymptomatic coronary calcification in patients with early stages of CKD. Methods: This study were enrolled 337 individuals fulfilling the inclusion criteria of the early stages of CKD (G1-2, A1-3) and divided into two subgroups with (n = 196) and without (n = 141) asymptomatic coronary artery calcification. Native coronary multi-detector computed tomography angiography was conducted to determine coronary artery calcification, which was stratified in four grades depending on the Agatston method. Serum levels of adropin were measured by ELISA. Results: The patients with known asymptomatic coronary artery calcification had significantly lower levels of adropin than those without this condition. The levels of adropin in individuals with mild (130-199 HU), moderate (200-299 HU), severe (300-399 HU) and very severe (≥ 400 HU) calcification were 3.13 (95% CI = 1.92-4.21) ng/mL, 2.3 (95% CI = 1.45-3.6) ng/mL, 2.1 (95% CI = 1.22-3.25) ng/mL and 1.26 (95% CI = 1.13-1.98) ng/mL, respectively. In multivariate logistic regression low adropin (< 2.95 ng/mL), a presence of hypertension, type 2 diabetes mellitus (T2DM) exerted their independent potencies to predict asymptomatic coronary calcification. Moreover, adropin demonstrated better discriminative potency than concomitant hypertension and T2DM. Conclusions: Low levels of circulating adropin significantly predicted a risk of coronary artery calcification in patients with early stage of CKD.
Keywords:
chronic kidney disease
; vascular calcification
; adropin
; circulating biomarkers
; prediction
1. Introduction
Chronic kidney disease (CKD) is a leading cause of cardiovascular (CV) and end-stage kidney disease (ESRD) morbidity and mortality worldwide [1]. The estimated global prevalence of pre-dialysis CKD is 13.4% (11.7-15.1%), and the number of patients with end-stage kidney disease (ESRD) requiring renal replacement therapy is estimated to be between 4.902 and 7.083 million [1, 2]. CKD is mainly driven by the increasing prevalence of diabetes mellitus, hypertension, obesity, dyslipidemia and ageing [3-5].
CKD especially at stage (G) 4-5 is markedly associated with increased CV risk manifested by coronary artery disease (CAD), heart failure, arrhythmias and sudden cardiac death [6]. In fact, in the early stages (G1-2), a chronic pro-inflammatory state along with attributable conventional CV risk factors contributes to myocardial and vascular remodeling processes leading to ectopic calcification, including cardiac valves and vascular calcification, as well as accelerating atherosclerosis and plaque development [6, 7]. On the contrary, in CKD G 3-5, non-classical risk factors such as anemia, electrolyte disturbances including hyperphosphatemia, systemic and microvascular inflammation, oxidative stress, iso- and non-osmotic sodium retention, fluid overload and volume expansion, malnutrition/cachexia, sympathetic hyperactivity, osteoporosis, accumulation of "uremic toxins" and various hormonal disorders are the main factors influencing the prognosis [8]. Although an association of vascular remodeling with CV mortality has been found to be positively associated with CKD stage, coronary calcification is significantly associated with CKD-related CV events across all stages of CKD [9, 10].
The Agatston method is the conventionally used system for quantifying the coronary artery calcium score [11]. Although the coronary artery calcium score is significantly associated with the occurrence of major CV events (MACEs), patients should be categorized at risk according to calcium accumulation that is defined as a density of coronary lesions above 130 Hounsfield units (HU) with the areas of hyperattenuation of at least 1 mm2 [11]. In this context, a certain number of asymptomatic patients with low-to-intermediate accumulation of calcium are likely to be underdiagnosed at the risk of MACEs, because this approach is particularly sensitive to the calcified plaques with high attenuation [12]. In addition, the Expert Consensus Document by the American College of Cardiology Foundation and the American Heart Association now recommends screening individuals at intermediate risk but did not find enough evidence to recommend coronary artery calcium testing and further stratification of those in the low- or high-risk categories for CAD [13]. Meanwhile, certain circulating biomarkers, such as matrix Gla protein, fetuin A, fibroblast growth factor 23, calciprotein particles and bone-related proteins (osteoprotegerin, osteopontin, sclerostin), have been suggested for prediction of plaque shaping and atherosclerosis severity in patients with CKD G3-5, but not in those with CKD G1-2 [14-16].
Recently, adropin, a newly-identified multifunctional secreted peptide encoded by the energy homeostasis-associated (Enho) gene, have been investigated for their potential role in prediction of acute kidney disease to CKD transition and monitoring CKD progression [17-19]. Adropin is involved in the regulation of energy homeostasis, vasodilation via the expression of endothelial nitric oxide synthase, insulin sensitivity through promoting insulin signaling pathways (Akt phosphorylation and the activation of the glucose transporter 4 receptor), reducing endogenous hepatic gluconeogenesis, lipids oxidation and enhancing glucose utilization [20]. There is evidence that adropin acting through the phosphatidylinositol 3-kinase (PI3K)/ protein kinase B (Akt) /mTOR signaling pathway potentially protects against inflammation, oxidative damage, accelerating atherosclerosis and plaque formation [21]. Previous clinical studies have shown that low serum adropin levels were associated with severity of coronary atherosclerosis, as reflected by higher SYNTAX score and Gensini score, either in patients undergoing percutaneous coronary intervention or in individuals without CKD [22-24]. Along with it, adropin is likely be a promising biomarker for predicting the onset of CAD in CKD individuals [25]. However, there is currently no specific evidence for the association between circulating levels of adropin and coronary calcification and plaque progression at early stages of CKD. The purpose of the study is to determine whether adropin is associated with asymptomatic coronary calcification in patients with early stages of CKD.
2. Results
2.1. Baseline Clinical Characteristics
The entire study cohort comprised 337 patients (64.1% male; mean age: 65 years). Baseline characteristics were summarized in Table 1. Patients with asymptomatic coronary calcification were older, and had higher prevalence in hypertension and type 2 diabetes mellitus as well as higher levels of high-sensitivity C-reactive protein (hs-CRP), tumor necrosis factor-alpha (TNF-alpha) and lower levels of adropin than those without the condition.
Abbreviation: BMI, body mass index; BP, blood pressure; CKD, chronic kidney disease; DPP-4, dipeptidyl peptidase-4; eGFR, estimated glomerular filtration rate; E/e‘, early diastolic blood filling to longitudinal strain ratio; FGF23, fibroblast growth factor 23; GLS, global longitudinal strain; GLP-1, glucagon-like peptide-1; HFpEF, heart failure with preserved ejection fraction; HDL-C, high-density lipoprotein cholesterol; hs-CRP, high-sensitivity C-reactive protein; IL, interleukin; LAVI, left atrial volume index; LDL-C, low-density lipoprotein cholesterol; LVH, left ventricular hypertrophy; LVEDV, left ventricular end-diastolic volume; LVESV, left ventricular end-systolic volume; LVEF, left ventricular ejection fraction; LVMMI, left ventricle myocardial mass index; MRA, mineralocorticoid receptor antagonists; NT-proBNP, N-terminal natriuretic pro-peptide; SGLT2, sodium–glucose cotransporter-2; SUA, serum uric acid; TNF-alpha, tumor necrosis factor-alpha; T2DM, type 2 diabetes mellitus; UACR, urinary albumin/creatinine ratio; WHR, waist-to-hip ratio.
No significant differences between subgroups were observed in sex, body mass index (BMI), waist circumference, waist-to-hip ratio, smoking, dyslipidemia, abdominal obesity, left ventricular hypertrophy (LVH), heart failure with preserved ejection fraction (HFpEF), systolic and diastolic blood pressure, hemodynemic parameters ,eGFR, lipid profile, urinary albumin/creatinine ratio (UACR), serum uric acid, creatinine, glucose, calcium and phosphorus levels, soluble suppression of tumorigenicity-2 (sST2), interleukin (IL)-6, fetuin-A, fibroblast growth factor (FGF)-23. Additionally, the individuals with symptomatic coronary calcification were more frequently treated with angiotensin-II receptor blockers and calcium channel blockers with than those without coronary artery calcification. In contrary, in the cohort of non-coronary artery calcification ACE inhibitors were significantly ofter prescribed than in another group.
2.2. Spearman’s Correlations Between the Levels of Circulating Biomarkers and Other Parameters in CKD G1-2 Patients with Asymptomatic Coronary Artery Calcification
Spearman’s correlations coefficients between the levels of circulating biomarkers and other parameters in CKD G1-2 patients with asymptomatic coronary artery calcification are shown in Table 2. The adropin levels were positively associated with global longitudinal strain (GLS), LV ejection fraction (LVEF) and Agatston density range and negatively correlated with the age, BMI, systolic and diastolic blood pressure, LV myocardial mass index (LVMMI), left atrial volume index (LAVI), UACR, fasting plasma glucose, total cholesterol, and LDL-cholesterol. The levels of hs-CRP were inversely correlated with LVMMI, whereas TNF-alpha exhibited borderline positive correlation with BMI.
2.3. The Levels of Adropin Depending on the Weighted Sum of Coronary Artery Lesions with a Density
The levels of adropin in individuals with mild (130-199 HU), moderate (200-299 HU), severe (300-399 HU) and very severe (≥ 400 HU) calcification were 3.13 (95% CI = 1.92-4.21) ng/mL, 2.3 (95% CI = 1.45-3.6) ng/mL, 2.1 (95% CI = 1.22-3.25) ng/mL and 1.26 (95% CI = 1.13-1.98) ng/mL, respectively. The levels of adropin in individuals with different stages of coronary artery lesion showed the significant differences between mild and moderate calcification as well as between severe and very severe calcification (Figure 1).
2.4. Receiver Operating Characteristic Curve Analysis for Adropin
ROC curve analysis was performed to determine the optimal cut-off for adropin as possible predictor of asymptomatic coronary calcification (Figure 2).
We identified that the levels of adropin < 2.95 ng/mL (AUC= 0.886; 95% CI = 0.814 – 0.957; P <0.0001; Sensitivity = 89%, Specificity = 75%, positive likelihood ratio = 2.928).
2.5. Predictors of Asymptomatic Coronary Calcification: Univariate and Multivariate Logistic Regression Analyses
We used the median serum levels of UACR (49 mg/g), hs-CRP (5.15 mg/L) and TNF-α (2.61 pg/mL) as cut-off points for further univariate and multivariate logistic regression analysis (Table 3). In a univariate logistic regression, low adropin (< 2.95 ng/mL), higher levels of hs-CRP (≥5.15 mg/L) and TNF-alpha (≥2.61 pg/mL), as well as a presence of hypertension, T2DM, and HFpEF were found as positive predictors for asymptomatic coronary calcification. Additionally, administration of calcium channel blockers and SGLT2 inhibitors negatively predicted this condition. In multivariate logistic regression the only low adropin (< 2.95 ng/mL), a presence of hypertension, T2DM exerted their independent potencies to predict asymptomatic coronary calcification in patients with early stages of CKD.
2.6. Comparison of the Predictive Models
We compared the predictive models for asymptomatic coronary calcification (Table 4) and found that Model 1 (low levels of adropin [< 2.95 ng/mL]) was significantly (p <0.001 for both cases) better than two other Models. Moreover, Model 2 (the presence of hypertension) and Model 3 (the presence of T2DM) did not differ each another in their ability to predict asymptomatic coronary calcification.
3. Discussion
As cardiovascular complications are one of the factors that predispose patients to mortality in the early stages of CKD, simple and sensitive in vitro tests with high reproducibility are likely to be promising in stratifying patients at a higher risk of vascular remodeling and coronary artery calcification. Although significant cardiovascular risk is exacerbated by inflammation, hyperparathyroidism and the regulation of bone molecules involved in the progression of calcification, these pathogenetic factors intervene in plaque formation at the G3-5 stages of CKD [26]. On the other hand, it remains unclear whether full control for concomitant comorbidities, such as T2DM, obesity, osteoporosis, hypertension, provides sufficient benefits in prevention of asymptomatic coronary artery calcification and whether these factors continue to be evident predictors for unfavorable clinical outcomes across all stages of CKD, but not at G3-5 stages [27]. In our multicenter study we found that low serum levels of adropin independently predicted asymptomatic coronary artery calcification in adequately treated patients with early stages of CKD. Moreover, we also detected an inversely association of adropin concentrations with Agatston score. Additionally, discriminative value of low levels of adropin was sufficient better in comparison with the presence of conventional cardiovascular comorbidity, such as T2DM and hypertension.
Previous clinical studies have revealed than numerous biomarkers, such as bone-relate proteins, brain-derived neurotrophic factor, FGF-23, IL-6, Klotho, Matrix Gla protein, were strongly associated with severe coronary artery calcification in patients with diabetes or hypertension at risk of CKD or without CKD [28-30]. Nevertheless, the biomarkers of inflammation (IL-6, TNF-alpha, hs-CRP, sST2, fetuin-A), kidney damage (cystatin C, UACR), calcium/phosphate metabolism (calcium, phosphate/pyrophosphate, parathyroid hormone, vitamin D), ectopic calcium accumulation (osteopontin, osteocalcin, Matrix Gla protein) have been exerted as indicators of calcified atherosclerotic plaque with clinically significant stenosis (>50%) and clinical signs and symptoms [31]. Overall, the patients at early stages of CKD even without clinical features of atherosclerotic cardiovascular disease (ASCVD) demonstrate life-threatening outcomes frequently associated with vulnerable plaque without serious calcium accumulation and hard plaque cap, while non-stenotic lesions of coronary artery remain to be poorly diagnosed with conventional methods of native coronary visualization due to technical causes. Aline with it, alternative approaches including measurement of increased arterial wave velocity, the ankle-brachial index, as well as diagnose of diabetes and hypertension at CKD G1-2 appear to rather approximation-based strategy than accurate risk assessment. This gape of knowledge requires new approaches to stratify these individuals at risk.
Adropin – a novel pleotropic peptide with organ protective capacity - is involved in the pathophysiological mechanisms of CKD across all stages [32]. Despite adropin was initially recognized as hepatokines, which modulates the responses of liver and muscle to insulin and glucagon, its expression was found in other organs and tissue including kidney parenchyma, vasculature, brain and myocardium [33]. Adropin contributes energy homeostasis, glucose and lipids metabolism and mediates cardiovascular protection via enhancement of nitric oxide production, mediating vascular integrity and vasodilation, blood pressure regulation, prevention of ischemia kidney injury and atherosclerotic plaque formation [34]. Previous studies showed that adropin acts through several signaling pathways, i.e. the Nb-3/Notch, PI3K/ Akt /mTOR, G-protein coupled receptor 19 / mitogen-activated protein kinase/extracellular signal-regulated kinase ½, vascular endothelial growth factor receptor 2, and exerted anti-inflammatory, anti-apoptotic, angiopoetic, anti-oxidative and anti-proliferative properties [35].
Decreased serum levels of adropin were found in individuals with ESRD [36, 37]. Meanwhile, T2DM patients with CKD G3-5 had higher adropin levels than those with early CKD, whereas hypertensive individuals with advanced CKD in contrast had lower levels of adropin than those with early stages of CKD [38, 39]. In our study, the levels of adropin among patients with early CKD with known coronary calcification were lower than in individuals without vascular lesion with calcium accumulation.
As adropin probably plays one of the key roles in preventing the emergence of vulnerable atheroma, we hypothesized that its deficiency may contribute to vascular disintegrity and early calcification through several pathogenetic mechanisms, i.e. direct mediating of subintimal lipid oxidation, proliferation of vascular smooth muscle cells, macrophage transformation / migration, Toll-like receptor activity and worsening of endothelial cell precursor activity. To best of knowledge, low levels of adropin may be detected in individuals with CKD before secondary electrolyte and metabolic disorders that are suitable for advanced stages of the disease [40]. Thus, the negative association of the circulating levels of adropin with Agatston stages of coronary calcification, which we firstly detected in the study, open new perspective for early personifying screening of the individuals who are either angiographically negative or have no clinically significant coronary artery stenosis. Another benefit of the findings is likely to be linked with the possibility to identify asymptomatic patients at higher risk of coronary artery calcification beyond eGFR ≤60 mL/min/1.73 m2. Perhaps this could assist in increasing of sensitivity of native coronary multi-detector computed tomography angiography in this issue.
It is worth noting that the discriminatory potential of adropin not only exceeded that of comorbid conditions such as hypertension and diabetes, but was found in optimally treated CKD G1-2 patients beyond the levels of kidney damage biomarkers. Although biomarkers of renal damage, such as IL-6, FGF-23 and sST2, have previously been associated with coronary atherosclerosis [18], they were not found to be superior to adropin in patients with early-stage CKD in the present study. Interesting, the majority of patients received RAAS inhibitors, and the proportion of the patients SGLT2 inhibitors and CCB was approaching 20%. However, this is the first study to clearly establish the benefits of adropin as a biomarker of asymptomatic coronary artery calcification in optimally treated patients according to current guidelines.
However, this study had several limitations. Firstly, we did not investigate whether patients' nutritional status was related to their adropin concentration. Our hypothesis was based on the assumption that this would probably not provide significant additional information for patients in the early stages of CKD. Secondly, the lack of analysis of coronary atherosclerosis severity using traditional scales such as the Gensini or GRACE scales probably did not affect the results of the study. A final limitation relates to the relatively small patient sample, although the multicentre design of the study overcomes the risks of statistical bias. Overall, we believe that these limitations will not affect the interpretation of our study results.
4. Materials and Methods
4.1. Study Population
We selected 512 white adults (male and female), who had established diagnosis of CKD, among whom 337 individuals fulfilling the inclusion criteria of the early stages of CKD (G1-2, A1-3) were consecutively enrolled from August 2022 to April 2025. All individuals were longitudinally evaluated at three centers: the private hospital "Vita Center" (Zaporozhye, Ukraine), the private medical center “Elitmedservice” (Zaporozhye, Ukraine) and the private hospital “MIRUM clinic” (Kyiv, Ukraine). The inclusion and exclusion criteria, as well as study procedures and determination of vascular calcification, are outlined in Figure 3. Inclusion criteria were both gender of age >18 years, established early CKD (G1-2) with urine albumin-to-creatinine ratio (UACR) ≥30 mg/g and written informed consent to participate in the study. Individuals with acute kidney injury (AKI), acute kidney disease (AKD), systemic vasculitis, autoimmune and connective tissue disease, symptomatic atherosclerotic cardiovascular disease, recent transient ischemic attack / stroke, acute coronary syndrome, myocardial infarction, previous revascularization / coronary artery bypass grafting, peripheral artery disease, ischemia-induced heart failure, known malignancy / ongoing chemotherapy, severe comorbidities (anemia, chronic obstructive pulmonary disease, pulmonary infection, bronchial asthma, liver cirrhosis, valvular heart disease, secondary regurgitation, hyper / hypothyroidism and morbid obesity), cognitive dysfunction and pregnancy were not enrolled in the study. All enrolled individuals were divided into two subgroups with (n = 196) and without (n = 141) asymptomatic coronary artery calcification.
4.2. Determination of Early Stages of CKD
CKD was s defined according to 2024 Kidney Disease: Improving Global Outcomes CKD Work Group as abnormalities of either kidney structure abnormalities detected by imaging / histology or kidney function (biomarkers of kidney injury), present for a minimum of 3 months, with clear clinical significance for health [41]. The assessment of estimated GFR was performed with the conventional CKD-EPI formula [42]. Markers of kidney damage included urine albumin-to-creatinine ratio ≥30 mg/g, persistent hematuria, urine sediment abnormalities, electrolyte disorders and / or other alternative biomarkers when relevant.
4.3. Native Coronary Multi-Detector Computed Tomography Angiography
Native coronary multi-detector computed tomography angiography was conducted in synchrony with the 12-lead electrocardiogram in the mid/late diastole following conventional recommendation [43].
4.4. Determination of Coronary Artery Calcification
Coronary artery calcification was identified as areas of hyperattenuation >1 mm2 with >130 Hounsfield units (HU) or ≥3 adjacent pixels [44]. Based on the Agatston method we used the weighted sum of lesions with a density > 130 HU to identify the area of calcium accumulation: 130-199 HU (factor 1), 200-299 HU (factor 2), 300-399 HU (factor 3) and ≥ 400 HU (factor 4) [44].
4.5. Echocardiography Examination
All enrolled individuals underwent the standard transthoracic B-mode ultrasound examination, which was performed by highly qualified assessors using a GE Healthcare Vivid E95 scanner (General Electric Company, Horton, Norway) in apical 2- and 4-chamber views. The 2018 Guideline of the American Society of Echocardiography [45] was used to evaluate the conventional hemodynamic parameters, including cardiac dimensions, left ventricular (LV) end-diastolic and end-diastolic volumes, left atrial volume index (LAVI), and LV ejection fraction (LVEF), early diastolic blood filling (E), and the mean longitudinal strain ratio (e‘). The estimated E/e’ ratio was expressed as the ratio of the E-wave velocity to the averaged me-dial and lateral e’ velocity. We evaluated the LV global longitudinal strain (GLS) values by 2D speckle-tracking image after acquiring high-quality echocardiographic data during at least three consequent cardiac cycles. The data were stored in the DICOM (Digital Imaging and Communications in Medicine) format for subsequent analysis.
4.6. Clinical Data
The initial demographic characteristics, anthropomorphic data, such as weight, body mass index, waist circumference, and clinical variables included age, sex, current smoking status were collected. Patients were invited to respond to a series of enquiries in the form of a questionnaire about their clinical history of acute kidney injury / disease, CKD, hypertension, dyslipidemia, diabetes mellitus, peripheral artery disease, cardiovascular risk factors, history of stroke/TIA, revascularization, HF, duration and type of atrial fibrillation, and medication use at the time of their enrolment. Hypertension is defined as a systolic blood pressure ≥ 140 mm Hg or a diastolic blood pressure ≥ 80 mm Hg or taking antihypertensive medication [46]. T2DM was detected according to ADA criteria [47]. Dyslipidemia was diagnosed and managed in accordance to the 2019 European Society for Cardiology/European Atherosclerosis Society Guidelines [48]. Heart failure and determination of its phenotypes were provided according to 2021 European Society of Cardiology Guidelines [49].
4.7. Blood Sampling and Biomarker Assessment
Fasting blood samples were collected from the peripheral vein in a BD Vacutainer Serum Tube and stored at room temperature for 30 minutes to clot. After clotting, the samples were centrifuged at 3,000 rpm for 15 minutes. Samples that had hemolysis were not used for further evaluation. Serum fractions were aliquoted and stored at -70°C until ELISA analysis.
Conventional hematological and biochemical parameters including glucose, electrolytes and creatinine levels, and the lipid profile were routinely obtained from fasting blood tests and determined with a Roche P800 analyzer (Basel, Switzerland) without freeze. Concentrations of NT-proBNP, TNF-alpha, sST2, hs-CRP, fetuin-A and IL-6 were measured with ELISA kits (Elabscience, Houston, Texas, USA) Serum levels of intact FGF-23 were measured using ELISA Kit (Biomedica Medizinprodukte GmbH, Wien, Austria). Levels of adropin were detected using an ELISA kit (Antibodies.com, Stockholm, Sweden). Analyses were performed according to the manufacturers' instructions and the results were used for further direct measurements. Each sample was analyzed twice, and the average was used for the final evaluation.
4.8. Statistics
Statistical analysis of received data was carried out using SPSS Statistics 29 (IBM, Armonk, NY, USA) and Prism v.10 (GraphPad, San Diego, CA, USA) software. Continuous variables were expressed as the mean (M) ± standard deviation (SD) or the median (Me) with interquartile range (IQR), depending on the data distribution that was routinely evaluated with the Anderson-Darling test. Either paired t-test or Mann-Whitney test when appropriate were used for group comparisons of continuous variables. Categorical data were presented as counts (n) and percentages (%), and appropriate differences between parameters were assessed using Fisher's exact tests for sparse data, Kruskal-Wallis test for ordinal data, or chi-squared test for nominal data. Spearman’s correlation coefficient (r) was utilized for correlations between circulating biomarkers and other parameters. Plausible predictors of coronary artery calcification were identified using univariate logistic regression and backward stepwise multivariate logistic regression. The factors with a significance of P<0.05 in the univariate log regression analysis were further included in the multivariate log regression model. For each factor odds ratio (OR), 95% confidence interval (CI) and Harrell’s concordance index (c-index) were calculated. The adropin reliability was established using Receiver Operating Curve (ROC) analysis, which involved calculating the area under the curve (AUC), its CI, sensitivity (Se), specificity (Sp) and likelihood ratio. The Youden test was then used to estimate the optimal cut-off point for adropin. The incremental predictive ability of the models was compared to a binary prediction method based on the estimation of integrated discrimination indices (IDIs) and net reclassification improvement (NRI). All tests were two-sided, with P value < 0.05 considered statistically significant.
5. Conclusions
Low levels of circulating adropin significantly predicted a risk of coronary artery calcification in patients with early stage of CKD. Perhaps, these findings are promising for further clinical validation of the findings. Further study with large sample size is required to investigate whether the implementation of adropin in routine praxis is economically useful and diagnostically beneficial to screen the patients with CKD G1-2 at higher risk of ASCVD.
Author Contributions
Conceptualization, A.E.B.; methodology, A.E.B.; software, O.O.B.; validation, T.A.B., A.E.B. and M.L.; formal analysis, O.O.B., T.A.B. and A.E.B.; investigation, O.O.B. and T.A.B.; resources, T.A.B. and O.O.B.; data curation, A.E.B. and T.A.B.; writing—original draft preparation: T.A.B., O.O.B., E.V.N.; M.L. and A.E.B.; writing—review and editing, T.A.B.; O.O.B., E.V.N.; M.L. and A.E.B.; visualization, O.O.B. and E.V.N.; supervision, A.E.B.; project administration, T.A.B. All authors have read and agreed to the published version of the manuscript.
Funding
This research received no external funding.
Institutional Review Board Statement
This study was conducted according to the guidelines of the Declaration of Helsinki and was approved by the Institutional Ethics Committee of Zaporozhye Medical Academy of Post-graduate Education (protocol number: 8; date of approval: 10 October 2020).
Informed Consent Statement
Informed consent was obtained from all subjects involved in the study.”
Data Availability Statement
The data presented in this study are available on request from the corresponding author due to privacy restrictions.
Acknowledgments
We thank all the patients who gave their consent to participate in this study and all the administrative staff and doctors of the private hospital “Vita Centre” for their assistance in the study.
Conflicts of Interest
The authors declare no conflicts of interest.
Abbreviations
The following abbreviations are used in this manuscript:
| AUC | area under curve |
| BMI | body mass index |
| BP | blood pressure |
| CAD | coronary artery disease |
| CKD | chronic kidney disease |
| CV | cardiovascular |
| DPP-4 | dipeptidyl peptidase-4 |
| eGFR | estimated glomerular filtration rate |
| FGF-23 | fibroblast growth factor 23 |
| GLP-1 | glucagon-like peptide-1 |
| GLS | global longitudinal strain |
| HDL-C | high-density lipoprotein cholesterol |
| HFpEF | heart failure with preserved ejection fraction |
| hs-CRP | high-sensitivity C-reactive protein |
| HU | Hounsfield units |
| IL | interleukin |
| LAVI | left atrial volume index |
| LDL-C | low-density lipoprotein cholesterol |
| LVEDV | left ventricular end-diastolic volume |
| LVEF | left ventricular ejection fraction |
| LVESV | left ventricular end-systolic volume |
| LVH | left ventricular hypertrophy |
| LVMMI | left ventricle myocardial mass index |
| MRA | mineralocorticoid receptor antagonists |
| NT-proBNP | N-terminal natriuretic pro-peptide |
| PI3K | phosphatidylinositol 3-kinase |
| ROC | Receiver Operating Curve |
| SGLT2 | sodium–glucose cotransporter-2 |
| SUA | serum uric acid |
| T2DM | type 2 diabetes mellitus |
| TNF-alpha | tumor necrosis factor-alpha |
| UACR | urinary albumin/creatinine ratio |
| WHR | waist-to-hip ratio |
References
- Brück K, Stel VS, Gambaro G, Hallan S, Völzke H, Ärnlöv J, Kastarinen M, Guessous I, Vinhas J, Stengel B, Brenner H, Chudek J, Romundstad S, Tomson C, Gonzalez AO, Bello AK, Ferrieres J, Palmieri L, Browne G, Capuano V, Van Biesen W, Zoccali C, Gansevoort R, Navis G, Rothenbacher D, Ferraro PM, Nitsch D, Wanner C, Jager KJ; European CKD Burden Consortium. CKD Prevalence Varies across the European General Population. J Am Soc Nephrol, 2: 27(7), 2135. [CrossRef]
- Lv JC, Zhang LX. Prevalence and Disease Burden of Chronic Kidney Disease. Adv Exp Med Biol, 3: 1165, 1165. [CrossRef]
- Minutolo R, Gabbai FB, Chiodini P, Provenzano M, Borrelli S, Garofalo C, Bellizzi V, Russo D, Conte G, De Nicola L; Collaborative Study Group on the Conservative Treatment of CKD of the Italian Society of Nephrology. Sex Differences in the Progression of CKD Among Older Patients: Pooled Analysis of 4 Cohort Studies. Am J Kidney Dis. [CrossRef]
- Nair N, Kalra R, Chandra Bhatt G, Narang A, Kumar G, Raina R. The Effect and Prevalence of Comorbidities in Adolescents With CKD and Obesity. Adv Chronic Kidney Dis. 2022; 29(3):251-262. [CrossRef]
- Adler J, Taneva E, Ansorge T, Mertens PR. CKD prevalence based on real-world data: continuous age-dependent lower reference limits of eGFR with CKD-EPI, FAS and EKFC algorithms. Int Urol Nephrol, 2: 54(11), 2929. [CrossRef]
- Jankowski J, Floege J, Fliser D, Böhm M, Marx N. Cardiovascular Disease in Chronic Kidney Disease: Pathophysiological Insights and Therapeutic Options. Circulation, 1: 143(11), 1157. [CrossRef]
- Ding N, Lv Y, Su H, Wang Z, Kong X, Zhen J, Lv Z, Wang R. Vascular calcification in CKD: New insights into its mechanisms. J Cell Physiol, 1160. [CrossRef]
- Zoccali C, Mallamaci F, Adamczak M, de Oliveira RB, Massy ZA, Sarafidis P, Agarwal R, Mark PB, Kotanko P, Ferro CJ, Wanner C, Burnier M, Vanholder R, Wiecek A. Cardiovascular complications in chronic kidney disease: a review from the European Renal and Cardiovascular Medicine Working Group of the European Renal Association. Cardiovasc Res, 2: 119(11), 2017. [CrossRef]
- Charytan DM, Skali H, Shah NR, Veeranna V, Cheezum MK, Taqueti VR, Kato T, Bibbo CR, Hainer J, Dorbala S, Blankstein R, Di Carli MF. Coronary flow reserve is predictive of the risk of cardiovascular death regardless of chronic kidney disease stage. Kidney Int. [CrossRef]
- Murthy VL, Naya M, Foster CR, Hainer J, Gaber M, Dorbala S, Charytan DM, Blankstein R, Di Carli MF. Coronary vascular dysfunction and prognosis in patients with chronic kidney disease. JACC Cardiovasc Imaging, 1025. [CrossRef]
- Agatston AS, Janowitz WR, Hildner FJ, Zusmer NR, Viamonte M Jr, Detrano R. Quantification of coronary artery calcium using ultrafast computed tomography. J Am Coll Cardiol, 8: 15(4). [CrossRef]
- Neves PO, Andrade J, Monção H. Coronary artery calcium score: current status. Radiol Bras. [CrossRef]
- Nasir K, Clouse M. Role of nonenhanced multidetector CT coronary artery calcium testing in asymptomatic and symptomatic individuals. Radiology. 2012;264(3):637-49. [CrossRef]
- Pluquet M, Kamel S, Choukroun G, Liabeuf S, Laville SM. Serum Calcification Propensity Represents a Good Biomarker of Vascular Calcification: A Systematic Review. Toxins (Basel). 2022;14(9):637. [CrossRef]
- Liabeuf S, Okazaki H, Desjardins L, Fliser D, Goldsmith D, Covic A, Wiecek A, Ortiz A, Martinez-Castelao A, Lindholm B, Suleymanlar G, Mallamaci F, Zoccali C, London G, Massy ZA. Vascular calcification in chronic kidney disease: are biomarkers useful for probing the pathobiology and the health risks of this process in the clinical scenario? Nephrol Dial Transplant, 1: 29(7), 1275. [CrossRef]
- Bozic M, Méndez-Barbero N, Gutiérrez-Muñoz C, Betriu A, Egido J, Fernández E, Martín-Ventura JL, Valdivielso JM, Blanco-Colio LM; investigators from the NEFRONA study. Combination of biomarkers of vascular calcification and sTWEAK to predict cardiovascular events in chronic kidney disease. Atherosclerosis. [CrossRef]
- Kaur R, Krishan P, Kumari P, Singh T, Singh V, Singh R, Ahmad SF. Clinical Significance of Adropin and Afamin in Evaluating Renal Function and Cardiovascular Health in the Presence of CKD-MBD Biomarkers in Chronic Kidney Disease. Diagnostics, 3: 2023;13(19), 2023. [CrossRef]
- Berezin AE, Berezina TA, Hoppe UC, Lichtenauer M, Berezin AA. An overview of circulating and urinary biomarkers capable of predicting the transition of acute kidney injury to chronic kidney disease. Expert Rev Mol Diagn. [CrossRef]
- Chen IW, Lin CW, Lin CN, Chen ST. Serum adropin levels as a potential biomarker for predicting diabetic kidney disease progression. Front Endocrinol, 1: 2025;16, 2025. [CrossRef]
- Ali II, D'Souza C, Singh J, Adeghate E. Adropin's Role in Energy Homeostasis and Metabolic Disorders. Int J Mol Sci, 8: 23(15), 8318. [CrossRef]
- Rooban S, Arul Senghor KA, Vinodhini VM, Kumar JS. Adropin: A crucial regulator of cardiovascular health and metabolic balance. Metabol Open, 1: 23, 1002. [CrossRef]
- Wei W, Liu H, Qiu X, Zhang J, Huang J, Chen H, Qiu S, Lin R, Li S, Tu M. The association between serum adropin and carotid atherosclerosis in patients with type 2 diabetes mellitus: a cross-sectional study. Diabetol Metab Syndr. [CrossRef]
- Zhao LP, You T, Chan SP, Chen JC, Xu WT. Adropin is associated with hyperhomocysteine and coronary atherosclerosis. Exp Ther Med, 1065. [CrossRef]
- Wu L, Fang J, Chen L, Zhao Z, Luo Y, Lin C, Fan L. Low serum adropin is associated with coronary atherosclerosis in type 2 diabetic and non-diabetic patients. Clin Chem Lab Med, 7: 52(5). [CrossRef]
- El Moneem Elfedawy MA, El Sadek Elsebai SA, Tawfik HM, Youness ER, Zaki M. Adropin a candidate diagnostic biomarker for cardiovascular disease in patients with chronic kidney disease. J Genet Eng Biotechnol, 1: 22(4), 1004. [CrossRef]
- Morena-Carrere M, Jaussent I, Chenine L, Dupuy AM, Bargnoux AS, Leray-Moragues H, Klouche K, Vernhet H, Canaud B, Cristol JP. Severe Coronary Artery Calcifications in Chronic Kidney Disease Patients, Coupled with Inflammation and Bone Mineral Disease Derangement, Promote Major Adverse Cardiovascular Events through Vascular Remodeling. Kidney Blood Press Res. [CrossRef]
- Wang XR, Yuan L, Shi R, Li H, Wang DG, Wu YG. Predictors of coronary artery calcification and its association with cardiovascular events in patients with chronic kidney disease. Ren Fail, 1172. [CrossRef]
- Jin H, Ji JJ, Zhu Y, Wang XD, Li YP, Shi QY, Chen YF. Brain-Derived Neurotrophic Factor, a New Predictor of Coronary Artery Calcification. Clin Appl Thromb Hemost, 1: 27, 1076. [CrossRef]
- Berlot AA, Fu X, Shea MK, Tracy R, Budoff M, Kim RS, Naveed M, Booth SL, Kizer JR, Bortnick AE. Matrix Gla protein and the long-term incidence and progression of coronary artery and aortic calcification in the Multi-Ethnic Study of Atherosclerosis. Atherosclerosis, 1175. [CrossRef]
- Golüke NMS, Schoffelmeer MA, De Jonghe A, Emmelot-Vonk MH, De Jong PA, Koek HL. Serum biomarkers for arterial calcification in humans: A systematic review. Bone Rep, 1015. [CrossRef]
- Wong ND, Budoff MJ, Ferdinand K, Graham IM, Michos ED, Reddy T, Shapiro MD, Toth PP. Atherosclerotic cardiovascular disease risk assessment: An American Society for Preventive Cardiology clinical practice statement. Am J Prev Cardiol, 1: 10, 1003. [CrossRef]
- Berezina TA, Obradovic Z, Boxhammer E, Berezin AA, Lichtenauer M, Berezin AE. Adropin Predicts Chronic Kidney Disease in Type 2 Diabetes Mellitus Patients with Chronic Heart Failure. J Clin Med, 2231. [CrossRef]
- Butler AA, Havel PJ. Adropin: A cardio-metabolic hormone in the periphery, a neurohormone in the brain? Peptides, 1: 187, 1713. [CrossRef]
- Rooban S, Arul Senghor KA, Vinodhini VM, Kumar JS. Adropin: A crucial regulator of cardiovascular health and metabolic balance. Metabol Open, 1: 23, 1002. [CrossRef]
- Bozic J, Kumric M, Ticinovic Kurir T, Males I, Borovac JA, Martinovic D, Vilovic M. Role of Adropin in Cardiometabolic Disorders: From Pathophysiological Mechanisms to Therapeutic Target. Biomedicines, 1: 9(10), 1407. [CrossRef]
- Boric-Skaro D, Mizdrak M, Luketin M, Martinovic D, Tokic D, Vilovic M, Supe-Domic D, Kurir TT, Bozic J. Serum Adropin Levels in Patients on Hemodialysis. Life, 3: 2021;11(4), 2021. [CrossRef]
- Kiliç AF, Erkuş E, Duysak L. Measurement of serum adropin levels in chronic renal failure patients receiving routine hemodialysis treatment. Medicine, e: 2025;104(12), 2025. [CrossRef]
- Chen IW, Lin CW, Lin CN, Chen ST. Serum adropin levels as a potential biomarker for predicting diabetic kidney disease progression. Front Endocrinol, 1: 2025;16, 2025. [CrossRef]
- El Moneem Elfedawy MA, El Sadek Elsebai SA, Tawfik HM, Youness ER, Zaki M. Adropin a candidate diagnostic biomarker for cardiovascular disease in patients with chronic kidney disease. J Genet Eng Biotechnol, 1: 22(4), 1004. [CrossRef]
- Berezina TA, Fushtey IM, Berezin AA, Pavlov SV, Berezin AE. Predictors of Kidney Function Outcomes and Their Relation to SGLT2 Inhibitor Dapagliflozin in Patients with Type 2 Diabetes Mellitus Who Had Chronic Heart Failure. Adv Ther, 2: 41(1). [CrossRef]
- Kidney Disease: Improving Global Outcomes (KDIGO) CKD Work Group. KDIGO 2024 Clinical Practice Guideline for the Evaluation and Management of Chronic Kidney Disease. Kidney Int, S: 105(4S). [CrossRef]
- Levey AS, Stevens LA, Schmid CH, Zhang YL, Castro AF, 3rd; Feldman HI, et al. A New Equation to Estimate Glomerular Filtration Rate. Ann. Intern. Med. 2009, 150, 604–612. [Google Scholar] [CrossRef] [PubMed]
- Abbara S, Blanke P, Maroules CD, Cheezum M, Choi AD, Han BK, Marwan M, Naoum C, Norgaard BL, Rubinshtein R, Schoenhagen P, Villines T, Leipsic J. SCCT guidelines for the performance and acquisition of coronary computed tomographic angiography: A report of the society of Cardiovascular Computed Tomography Guidelines Committee: Endorsed by the North American Society for Cardiovascular Imaging (NASCI). J Cardiovasc Comput Tomogr. [CrossRef]
- Budoff MJ, Achenbach S, Blumenthal RS, Carr JJ, Goldin JG, Greenland P, Guerci AD, Lima JA, Rader DJ, Rubin GD, Shaw LJ, Wiegers SE; American Heart Association Committee on Cardiovascular Imaging and Intervention; American Heart Association Council on Cardiovascular Radiology and Intervention; American Heart Association Committee on Cardiac Imaging, Council on Clinical Cardiology. Assessment of coronary artery disease by cardiac computed tomography: a scientific statement from the American Heart Association Committee on Cardiovascular Imaging and Intervention, Council on Cardiovascular Radiology and Intervention, and Committee on Cardiac Imaging, Council on Clinical Cardiology. Circulation. 2006. [CrossRef]
- Mitchell C, Rahko PS, Blauwet LA, Canaday B, Finstuen JA, Foster MC, Horton K, Ogunyankin KO, Palma RA, Velazquez EJ. Guidelines for Performing a Comprehensive Transthoracic Echocardiographic Examination in Adults: Recommendations from the American Society of Echocardiography. J Am Soc Echocardiogr, 1: 32(1). [CrossRef]
- McEvoy JW, McCarthy CP, Bruno RM, Brouwers S, Canavan MD, Ceconi C, Christodorescu RM, Daskalopoulou SS, Ferro CJ, Gerdts E, Hanssen H, Harris J, Lauder L, McManus RJ, Molloy GJ, Rahimi K, Regitz-Zagrosek V, Rossi GP, Sandset EC, Scheenaerts B, Staessen JA, Uchmanowicz I, Volterrani M, Touyz RM; ESC Scientific Document Group. 2024 ESC Guidelines for the management of elevated blood pressure and hypertension. Eur Heart J, 3912. [CrossRef]
- American Diabetes Association Professional Practice Committee. 2. Diagnosis and Classification of Diabetes: Standards of Care in Diabetes-2024. Diabetes Care, S: 1). [CrossRef]
- Mach F, Baigent C, Catapano AL, Koskinas KC, Casula M, Badimon L, Chapman MJ, De Backer GG, Delgado V, Ference BA, Graham IM, Halliday A, Landmesser U, Mihaylova B, Pedersen TR, Riccardi G, Richter DJ, Sabatine MS, Taskinen MR, Tokgozoglu L, Wiklund O; ESC Scientific Document Group. 2019 ESC/EAS Guidelines for the management of dyslipidaemias: lipid modification to reduce cardiovascular risk. Eur Heart J. [CrossRef]
- McDonagh TA, Metra M, Adamo M, Gardner RS, Baumbach A, Böhm M, Burri H, Butler J, Čelutkienė J, Chioncel O, Cleland JGF, Coats AJS, Crespo-Leiro MG, Farmakis D, Gilard M, Heymans S, Hoes AW, Jaarsma T, Jankowska EA, Lainscak M, Lam CSP, Lyon AR, McMurray JJV, Mebazaa A, Mindham R, Muneretto C, Francesco Piepoli M, Price S, Rosano GMC, Ruschitzka F, Kathrine Skibelund A; ESC Scientific Document Group. 2021 ESC Guidelines for the diagnosis and treatment of acute and chronic heart failure: Developed by the Task Force for the diagnosis and treatment of acute and chronic heart failure of the European Society of Cardiology (ESC). With the special contribution of the Heart Failure Association (HFA) of the ESC. Eur J Heart Fail. [CrossRef]
Figure 1.
Violin plot of adropin concentrations in individuals with asymptomatic coronary calcification according to Agatston criteria. Notes: factor 1 = 130-199 HU, factor 2 = 200-299 HU, factor 3 = 300-399 HU and factor 4 = ≥ 400 HU. Abbreviations: NS, not significant, HU, Hounsfield units.
Figure 1.
Violin plot of adropin concentrations in individuals with asymptomatic coronary calcification according to Agatston criteria. Notes: factor 1 = 130-199 HU, factor 2 = 200-299 HU, factor 3 = 300-399 HU and factor 4 = ≥ 400 HU. Abbreviations: NS, not significant, HU, Hounsfield units.
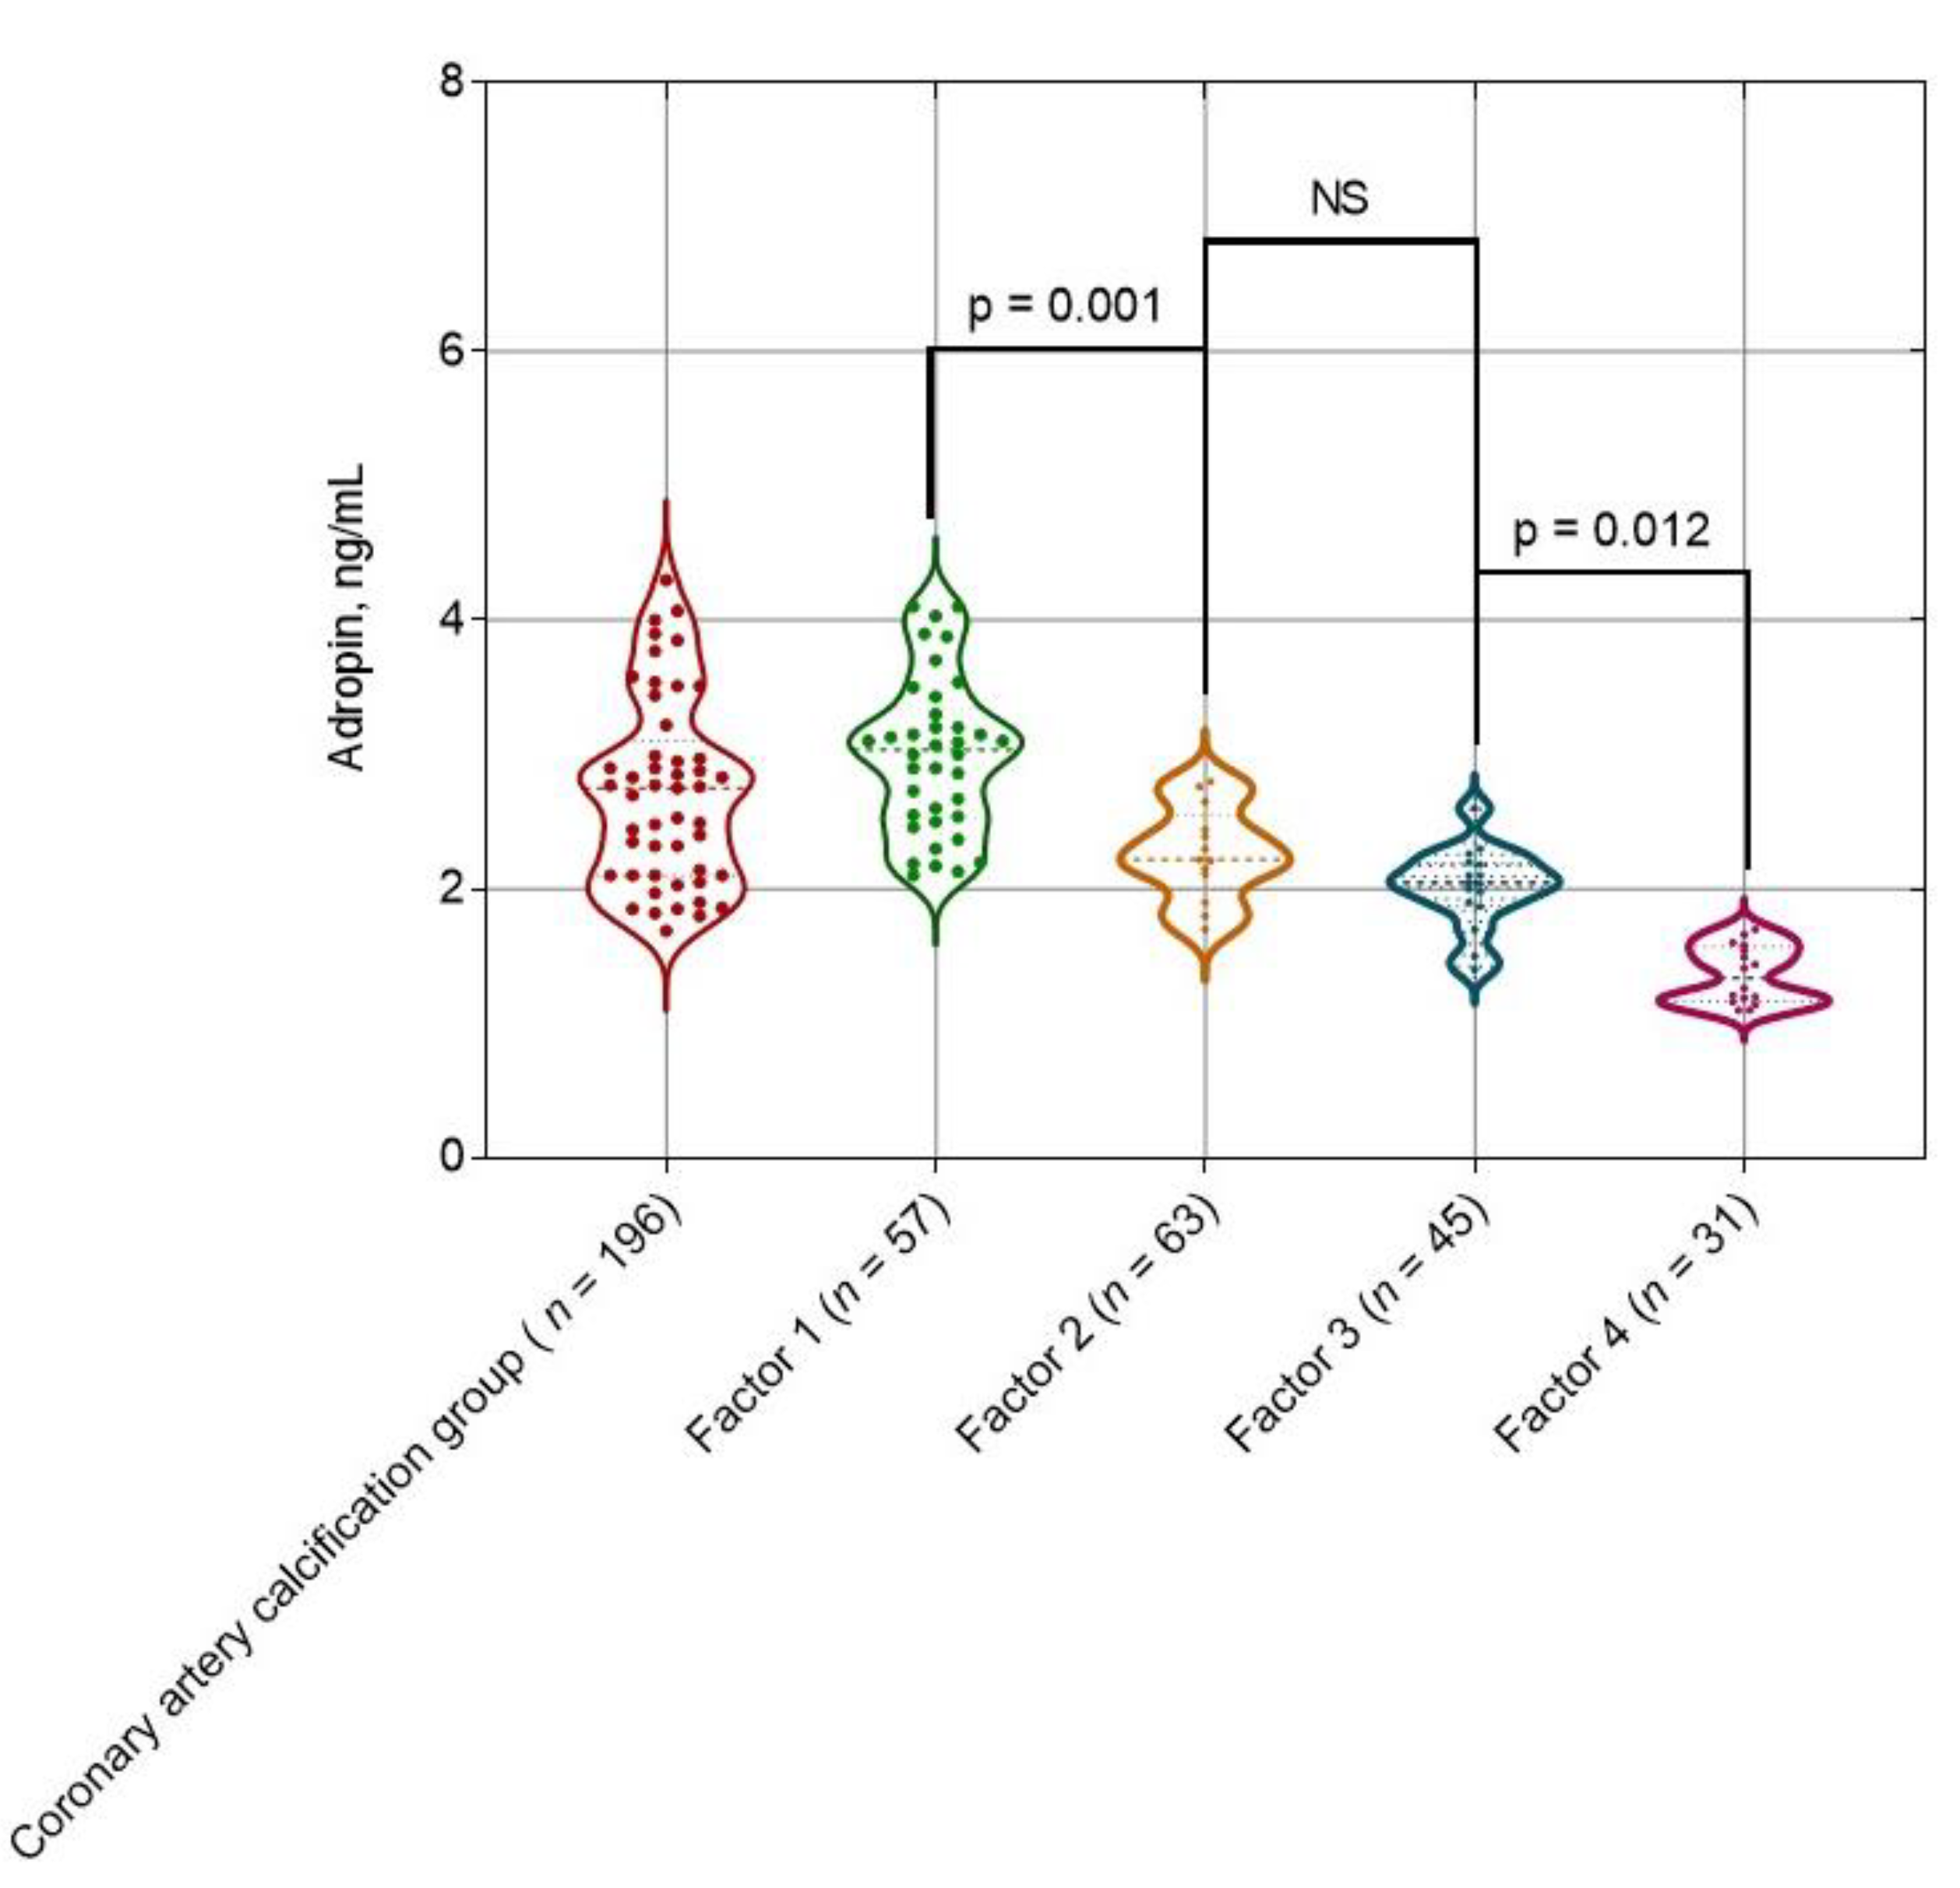
Figure 2.
Receiver Operating Characteristic Curve Analysis for adropin. Abbreviations: AUC, area under curve; CI, confidence interval.
Figure 2.
Receiver Operating Characteristic Curve Analysis for adropin. Abbreviations: AUC, area under curve; CI, confidence interval.
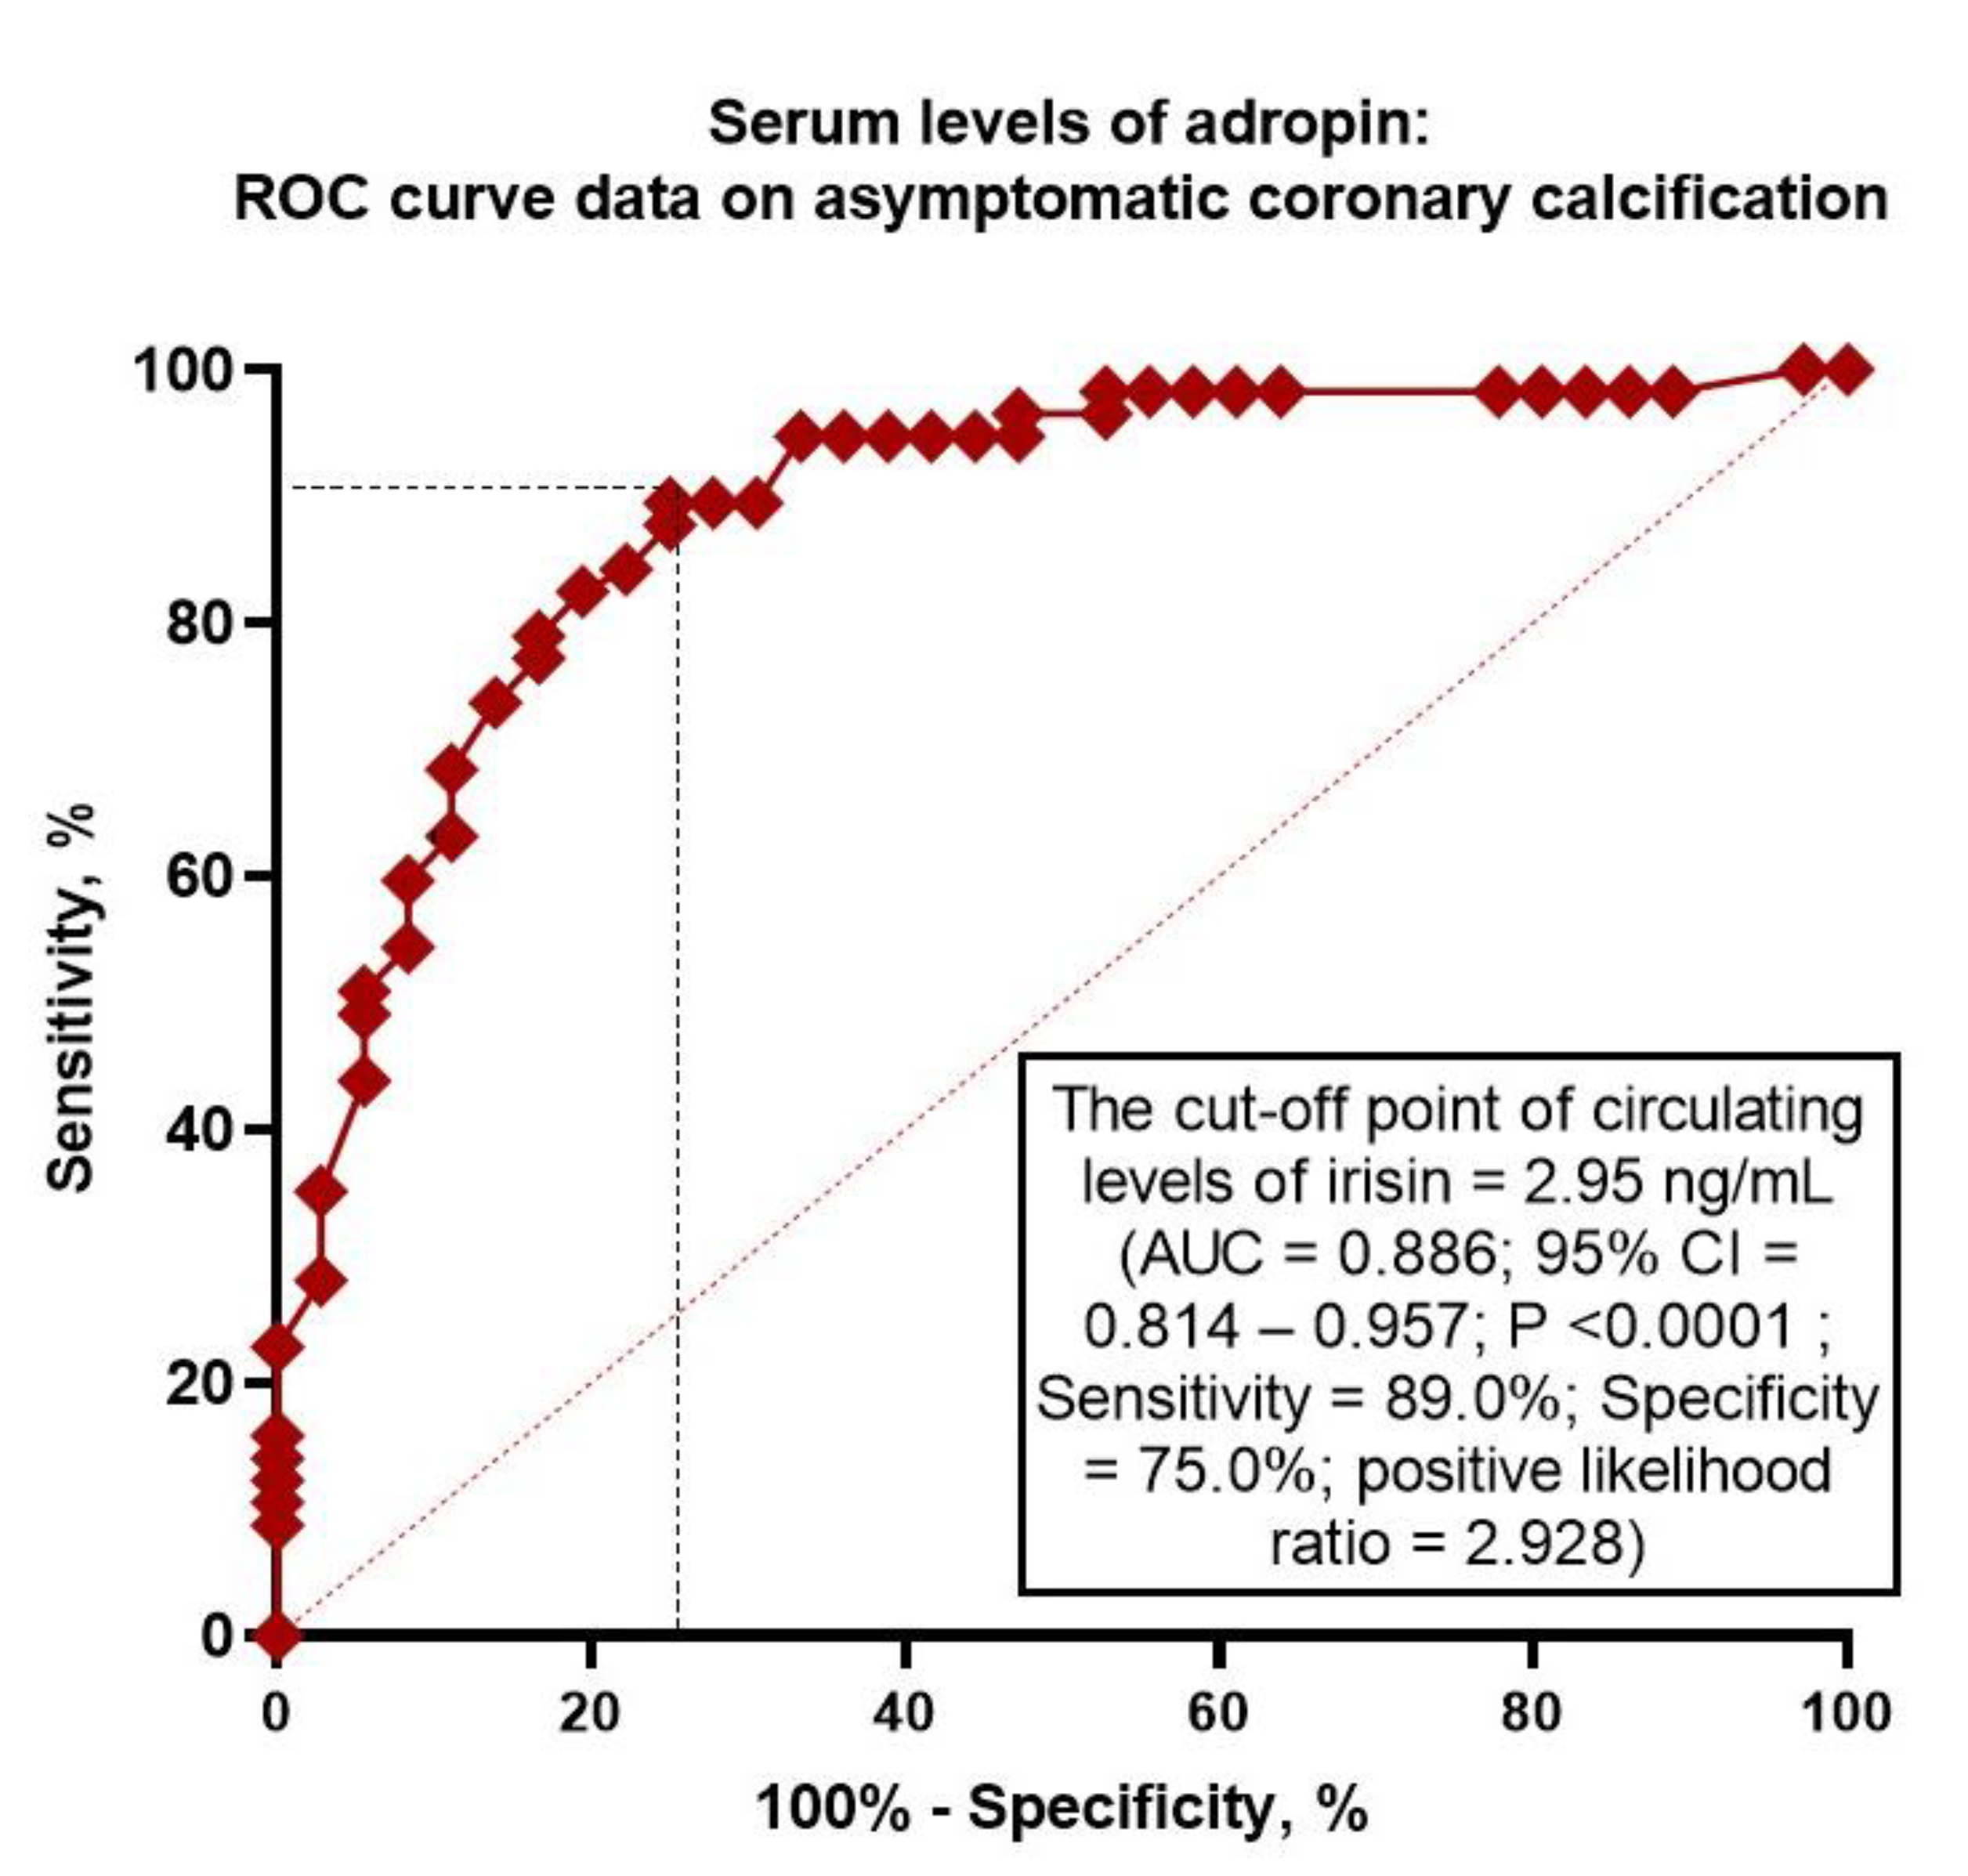
Figure 3.
Flow chart and study design. Abbreviations: AKI, acute kidney injury; AKD, acute kidney disease; CKD, chronic kidney disease; CAD, coronary artery disease; CABG, coronary artery bypass grafting; ECG, electrocardiogram; HF, heart failure; UACR, urine albumin-to-creatinine ratio; eGFR, estimated glomerular filtration rate; NT-proBNP, N-terminal natriuretic pro-peptide; IL, interleukin; FGF, fibroblast growth factor; sST2, soluble suppression of tumorigenicity-2; TNF, tumor necrosis factor; hs-CRP, high-sensitive C-reactive protein.
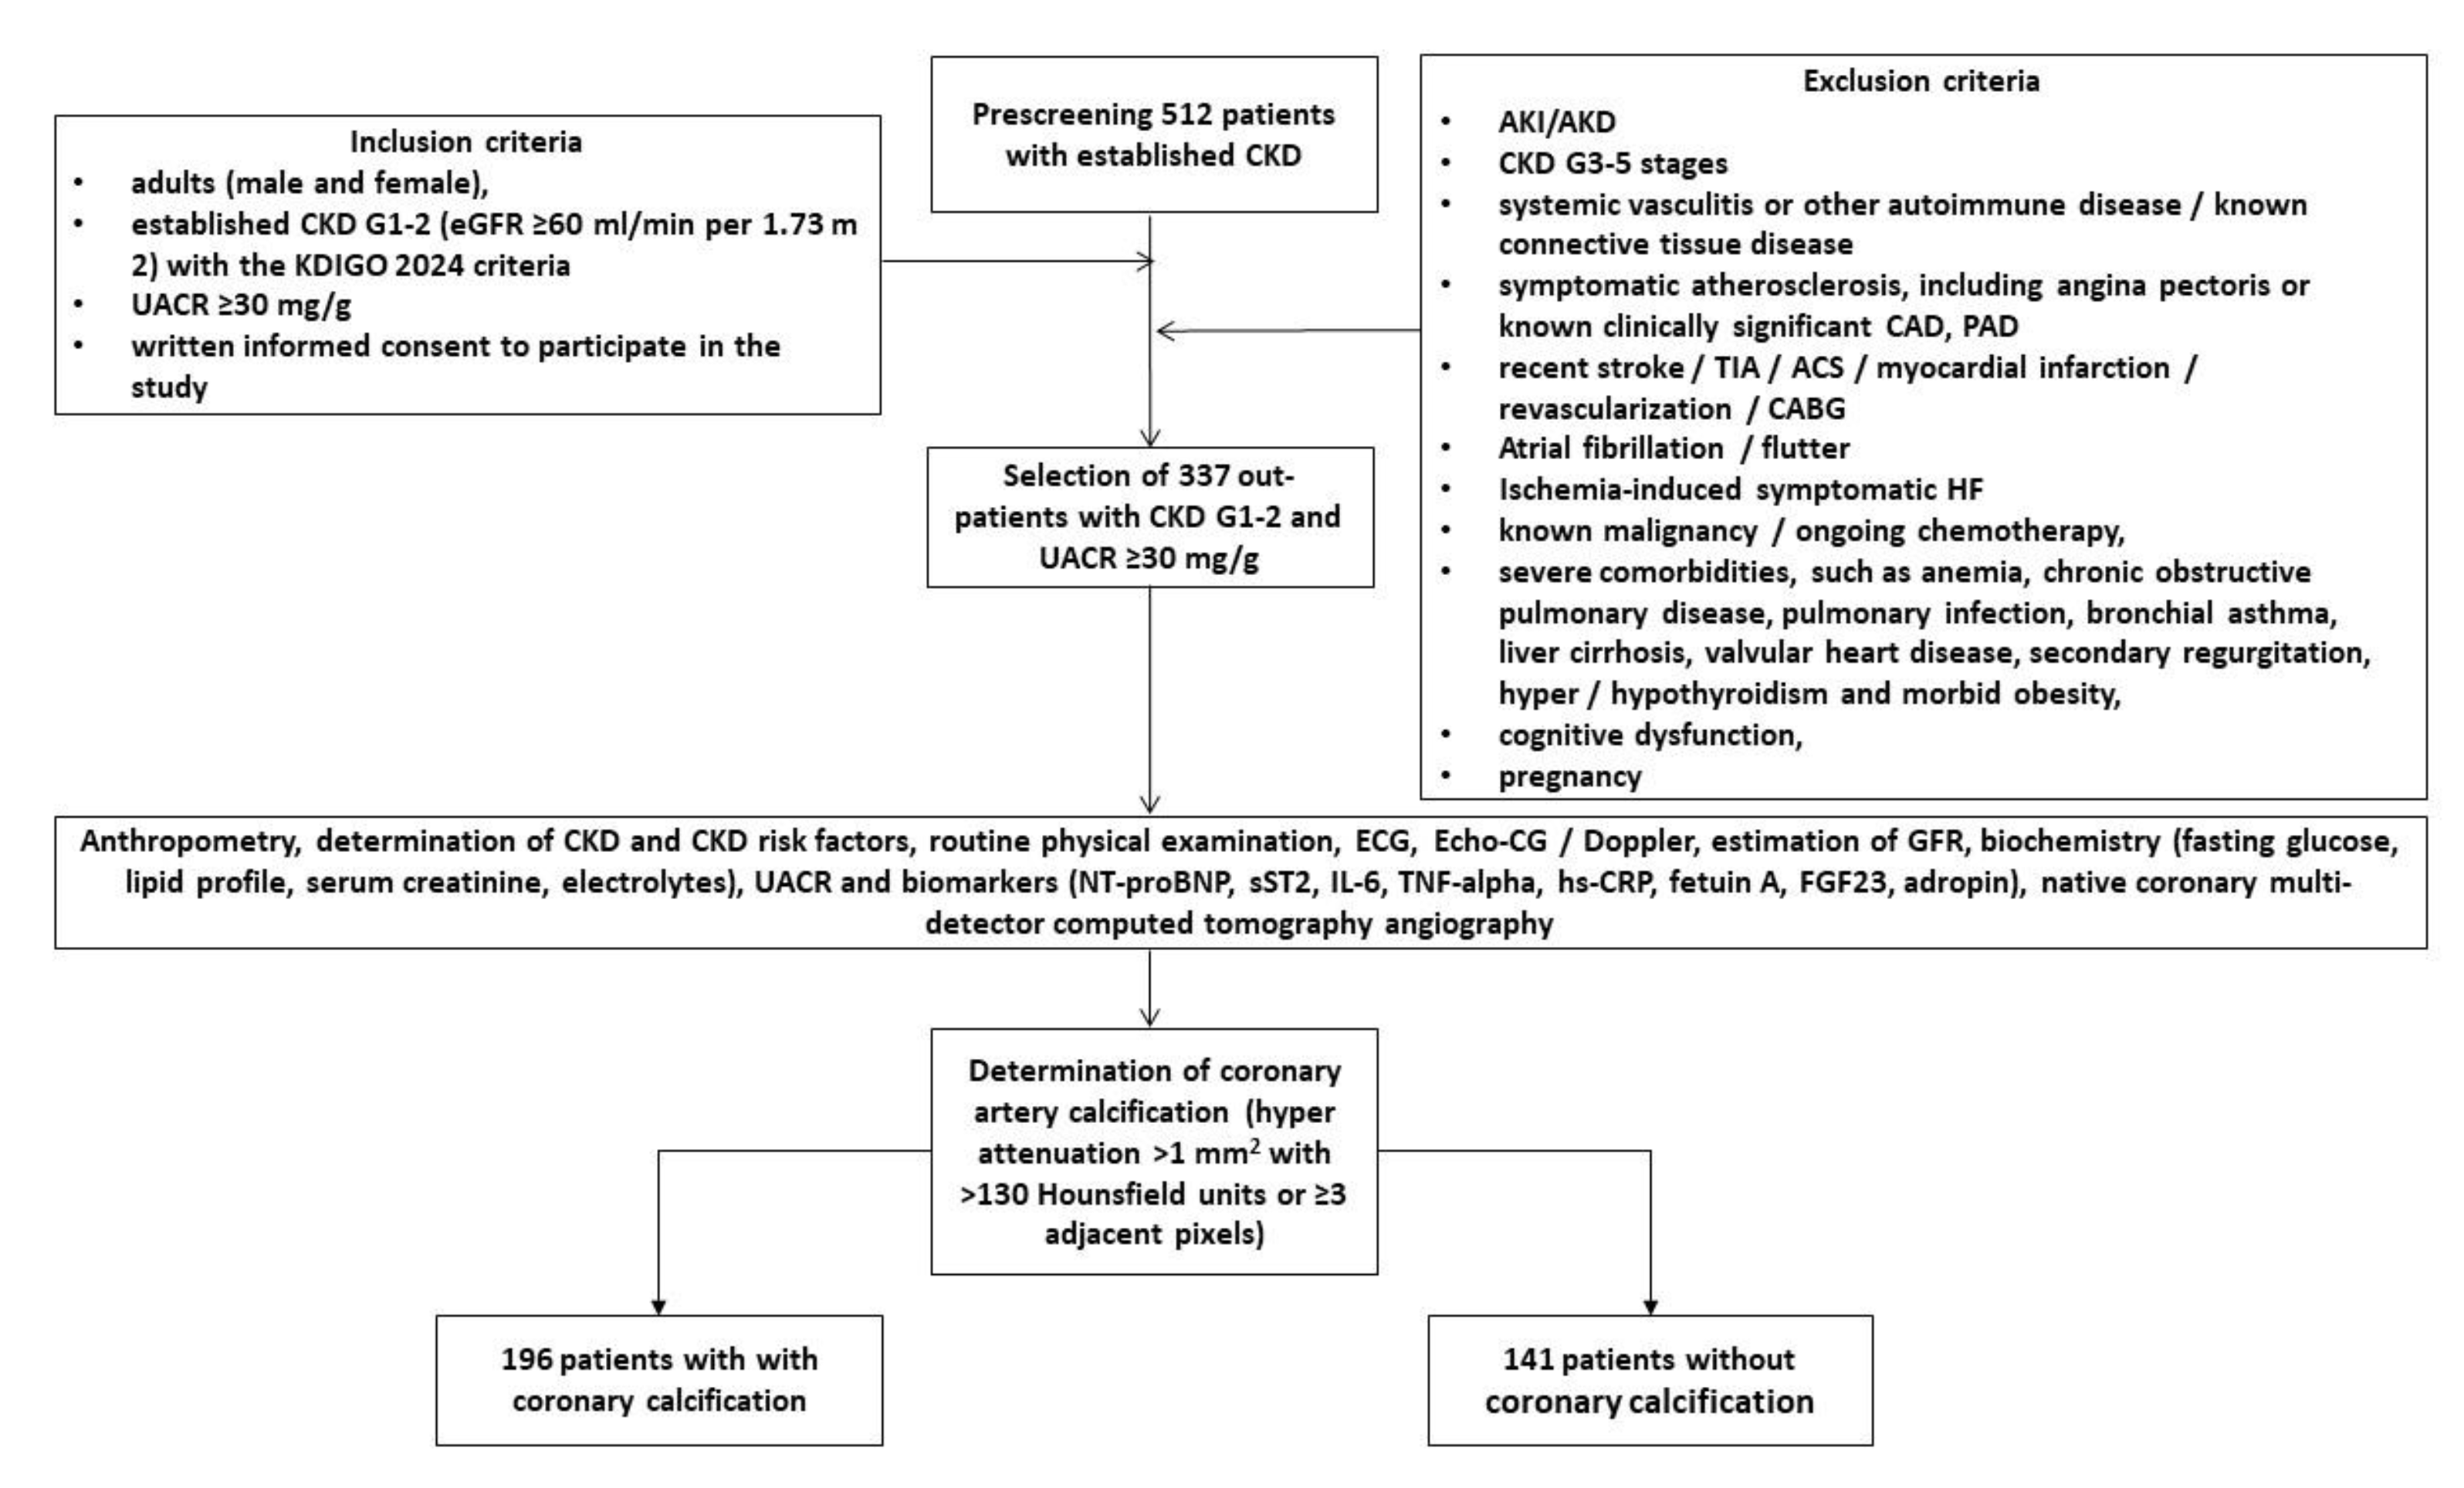

Table 1.
Basic characteristics of the patients involved in this study.
| Variables | Entire Group Patients with early (G1-2) CKD (n = 337) | Patients with coronary calcification (n = 196) | Patients without coronary calcification (n = 141) | p Value |
|---|---|---|---|---|
| Age (years) | 65 (54–77) | 68 (55–79) | 63 (52–74) | 0.044 |
| Male (n (%)) | 216 (64.1) | 125 (63.8) | 91 (64.5) | 0.822 |
| BMI (kg/m2) | 28.4 ± 6.7 | 29.6 ± 5.9 | 27.1 ± 4.6 | 0.710 |
| Waist circumference (cm) | 98 ± 5 | 98 ± 4 | 97 ± 6 | 0.810 |
| WHR (units) | 0.90 ± 0.2 | 0.91 ± 0.1 | 0.88 ± 0.1 | 0.750 |
| Smoking (n (%)) | 115 (34.1) | 71 (36.2) | 44 (31.2) | 0.870 |
| Dyslipidemia (n (%)) | 283 (84.0) | 172 (87.8) | 111 (78.7) | 0.061 |
| Hypertension (n (%)) | 269 (79.8) | 170 (86.7) | 99 (70.2) | 0.046 |
| Abdominal obesity (n (%)) | 92 (27.3) | 55 (28.1) | 37 (26.2) | 0.687 |
| T2DM, (n (%)) | 128 (38.0) | 82 (41.8) | 46 (32.6) | 0.044 |
| LVH (n (%)) | 273 (81.0) | 158 (80.6) | 115 (81.6) | 0.812 |
| HFpEF, (n (%)) | 138 (40.9) | 79 (40.3) | 59 (41.8) | 0.790 |
| Systolic BP (mm Hg) | 142 ± 10 | 143± 9 | 138 ± 7 | 0.660 |
| Diastolic BP (mm Hg) | 84 ± 8 | 86 ± 6 | 83 ± 5 | 0.830 |
| LVEDV (mL) | 149 (140–161) | 150 (140–163) | 149 (138–160) | 0.810 |
| LVESV (mL) | 68 (61–77) | 70 (62–79) | 67 (60–78) | 0.322 |
| LVEF (%) | 55 (51–59) | 53 (50–57) | 55 (51–59) | 0.384 |
| LVMMI (g/m2) | 142 ± 19 | 142 ± 16 | 140 ± 15 | 0.622 |
| LAVI (mL/m2) | 34 (31–38) | 35 (30–39) | 33 (30–37) | 0.646 |
| E/e` (units) | 13 ± 6 | 13 ± 4 | 12 ± 5 | 0.716 |
| GLS (%) | −14.5 (−11.6; −17.0) | −14.7 (−11.2; −17.2) | −14.3 (−12.1; −16.7) | 0.884 |
| eGFR (mL/min/1.73 m2) | 78 ± 15 | 75 ± 13 | 80 ± 14 | 0.776 |
| UACR, (mg/g) | 49 (33–217) | 52 (37–226) | 46 (32–211) | 0.644 |
| Fasting glucose (mmol/L) | 4.81 ± 1.24 | 5.22 ± 1.25 | 4.67 ± 1.30 | 0.292 |
| Creatinine (µmol/L) | 166 ± 39.1 | 173 ± 27 | 159 ± 24 | 0.655 |
| SUA (mcmol/L) | 365 ± 126 | 370 ± 115 | 356 ± 119 | 0.362 |
| Phosphorus (mmol/L) | 1.15 ± 0.28 | 1.15 ± 0.22 | 1.13 ± 0.20 | 0.773 |
| Calcium (mmol/L) | 2.24 (2.06–2.53) | 2.24 (2.10–2.62) | 2.22 (2.02–2.50) | 0.633 |
| Total cholesterol (mmol/L) | 5.70 ± 1.50 | 5.72 ± 1.42 | 5.66 ± 1.38 | 0.551 |
| HDL-C (mmol/L) | 0.99 ± 0.17 | 0.97 ± 0.15 | 0.99 ± 0.17 | 0.446 |
| LDL-C (mmol/L) | 3.82± 0.21 | 3.88 ± 0.20 | 3.79± 0.19 | 0.515 |
| Triglycerides (mmol/L) | 2.21 ± 0.17 | 2.27 ± 0.16 | 2.20 ± 0.15 | 0.524 |
| sST2, ng/mL | 9.8 (1.25 – 16.2) | 10.6 (0.77 – 17.1) | 8.5 (1.25 – 14.6) | 0.228 |
| hs-CRP (mg/L) | 5.15 (2.23–7.16) | 5.21 (2.30–7.30) | 5.03 (2.02–6.43) | 0.048 |
| TNF-alpha (pg/mL) | 2.61 (1.60–3.70) | 2.84 (1.92–4.15) | 2.32 (1.40–3.53) | 0.046 |
| IL-6, pg/mL | 1.67 (0.54–3.92) | 1.74 (0.62–4.15) | 1.58 (0.51–3.77) | 0.128 |
| NT-proBNP (pmol/mL) | 138 (55–219) | 142 (53–233) | 135 (47–215) | 0.563 |
| Adropin (ng/mL) | 3.50 (1.90–5.40) | 2.85 (1.85–4.07) | 3.94 (2.92–5.67) | 0.012 |
| Fetuin-A (μg/mL) | 54.2 (31.2 – 72.4) | 55.9 (33.6 – 75.1) | 53.8 (30.2 – 72.5) | 0.592 |
| FGF-23, pg/mL | 93.8 ± 15.2 | 105.5 ± 13.6 | 88.2 ± 17.8 | 0.055 |
| ACEIs (n (%)) | 217 (64.4) | 116 (59.2) | 101 (71.6) | 0.046 |
| Angiotensin-II receptor blockers (n (%)) | 48 (14.2) | 37 (18.9) | 11 (7.80) | 0.026 |
| Beta-blockers (n (%)) | 276 (81.9) | 157 (80.1) | 119 (84.4) | 0.659 |
| Ivabradine (n (%)) | 27 (8.0) | 17(8.7) | 10 (7.1) | 0.769 |
| Calcium channel blockers (n (%)) | 75 (22.3) | 37 (18.9) | 38 (27.0) | 0.040 |
| Loop or thiazide-like diuretics (n (%)) | 161 (47.8) | 95 (48.5) | 66 (46.8) | 0.725 |
| MRA (n (%)) | 95 (28.2) | 57 (29.1) | 38 (27.0) | 0.488 |
| Antiplatelet agents (n (%)) | 87 (25.8) | 51 (26.0) | 36 (25.5) | 0.873 |
| Metformin (n (%)) | 92 (27.3) | 58 (30.0) | 34 (24.1) | 0.554 |
| DPP4 inhibitors (n (%)) | 18 (5.3) | 9 (4.6) | 9 (6.4) | 0.120 |
| GLP-1 receptor agonists (n (%)) | 11 (3.2) | 5 (2.6) | 6 (4.2) | 0.066 |
| SGLT2 inhibitors (n (%)) | 65 (19.3) | 39 (19.9) | 26 (18.4) | 0.854 |
| Statins (n (%)) | 283 (84.0) | 172 (87.8) | 111 (78.7) | 0.061 |
Table 2.
Spearman’s correlations coefficients between the levels of circulating biomarkers and other parameters in CKD G1-2 patients with asymptomatic coronary artery calcification.
Table 2.
Spearman’s correlations coefficients between the levels of circulating biomarkers and other parameters in CKD G1-2 patients with asymptomatic coronary artery calcification.
| Variables | Adropin | hs-CRP | TNF-alpha | |||
| r | p | r | p | r | p | |
| Age (years) | -0.21 | 0.024 | 0.16 | 0.14 | 0.12 | 0.18 |
| BMI (kg/m2) | -0.23 | 0.001 | 0.19 | 0.04 | 0.18 | 0.05 |
| Systolic BP (mm Hg) | -0.25 | 0.001 | 0.08 | 0.43 | 0.12 | 0.22 |
| Diastolic BP (mm Hg) | -0.24 | 0.001 | 0.10 | 0.42 | 0.12 | 0.21 |
| LVEF (%) | 0.26 | 0.001 | -0.14 | 0.31 | -0.19 | 0.05 |
| LVMMI (g/m2) | -0.31 | 0.001 | -0.21 | 0.026 | -0.13 | 0.11 |
| LAVI (mL/m2) | -0.26 | 0.016 | 0.18 | 0.17 | 0.14 | 0.45 |
| GLS (%) | 0.32 | 0.001 | -0.17 | 0.46 | -0.13 | 0.60 |
| Agatston density range | 0.42 | 0.001 | -0.20 | 0.07 | -0.21 | 0.05 |
| eGFR (mL/min/1.73 m2) | 0.11 | 0.26 | -0.09 | 0.62 | -0.11 | 0.47 |
| UACR, (mg/g) | -0.21 | 0.012 | 0.13 | 0.47 | 0.19 | 0.12 |
| Fasting glucose (mmol/L) | -0.19 | 0.05 | 0.07 | 0.54 | 0.08 | 0.49 |
| Total cholesterol (mmol/L) | -0.25 | 0.03 | -0.08 | 0.57 | -0.10 | 0.55 |
| LDL-C (mmol/L) | -0.22 | 0.04 | 0.11 | 0.29 | 0.13 | 0.43 |
Abbreviations: BP, blood pressure; eGFR, estimated glomerular filtration rate; hs-CRP, high-sensitivity C-reactive protein; GLS, global longitudinal strain; LAVI, left atrial volume index; LVEF, left ventricular ejection fraction; LVMMI, left ventricle myocardial mass index; LDL-C, low-density lipoprotein cholesterol; TNF-alpha, tumor necrosis factor-alpha; UACR, urinary albumin/creatinine ratio.
Table 3.
Predictors of asymptomatic coronary calcification: the results of univariate and multivariate logistic regressions.
Table 3.
Predictors of asymptomatic coronary calcification: the results of univariate and multivariate logistic regressions.
| Variables | Dependent Variable: asymptomatic coronary calcification | |||||||
| Univariate logistic regression | Multivariate logistic regression | |||||||
| OR | 95% CI | p-Value | C-Index | OR | 95% CI | p-Value | C-Index | |
| Low adropin vs. elevated adropin | 1.26 | 1.08–1.52 | 0.001 | 0.66 | 1.27 | 1.13–1.40 | 0.001 | 0.01 |
| UACR ≥49 mg/g vs. UACR <49 mg/g | 1.02 | 0.97-1.08 | 0.438 | 0.09 | - | |||
| hs-CRP ≥5.15 mg/L vs. hs-CRP <5.15 mg/L | 1.06 | 1.01-1.18 | 0.052 | 0.12 | 1.03 | 1.00-1.10 | 0.182 | 0.14 |
| TNF-α ≥2.61 pg/mL vs. TNF-α <2.61 pg/mL | 1.09 | 1.02-1.23 | 0.048 | 0.19 | 1.05 | 1.00-1.18 | 0.068 | 0.13 |
| Hypertension vs. non-hypertension | 1.09 | 1.03–1.22 | 0.044 | 0.32 | 1.09 | 1.07–1.23 | 0.042 | 0.36 |
| T2DM vs. non-T2DM | 1.07 | 1.02–1.15 | 0.042 | 0.31 | 1.05 | 1.01–1.10 | 0.044 | 0.31 |
| LVH vs. non-LVH | 1.08 | 0.96–1.25 | 0.672 | 0.11 | - | |||
| HFpEF vs. non-HFpEF | 1.11 | 1.02–1.24 | 0.046 | 0.37 | 1.14 | 1.00–1.28 | 0.422 | 0.13 |
| Administration of CCB | 0.89 | 0.71–0.99 | 0.042 | 0.39 | 0.90 | 0.70–1.02 | 0.068 | 0.22 |
| Administration of SGLT2i | 0.90 | 0.82–0.98 | 0.040 | 0.42 | 0.91 | 0.78–1.00 | 0.062 | 0.28 |
Abbreviations: OR, odds ratio; CCB, calcium channel blockers; CI, confidence interval; LVH, left ventricular hypertrophy; SGLT2i, sodium–glucose cotransporter-2 inhibitor.
Table 4.
Comparison of predictive models for asymptomatic coronary calcification.
| Predictive models | Dependent Variable: asymptomatic coronary calcification | ||||||||
| AUC | NRI | IDI | |||||||
| M | 95% CI | p Value | M | 95% CI | p Value | M | 95% CI | p Value | |
| Model 1 | 0.886 | 0.814 – 0.957 | - | Reference | Reference | ||||
| Model 2 | 0.724 | 0.699 – 0.751 | 0.001 | 0.09 | 0.05 – 0.15 | 0.688 | 0.11 | 0.08 – 0.16 | 0.426 |
| Model 3 (T2DM) | 0.706 | 0.625 – 0.784 | 0.001 | 0.07 | 0.03 – 0.09 | 0.772 | 0.10 | 0.06 – 0.17 | 0.455 |
Note: p value indicates a significant difference compared to Model 1. Model 1: low levels of adropin (< 2.95 ng/mL) Model 2: a presence of hypertension Model 3: a presence of T2DM Abbreviations: AUC, area under curve; CI, confidence interval; DI, integrated discrimination indices; NRI, net reclassification improvement; T2DM, type 2 diabetes mellitus.
Disclaimer/Publisher’s Note: The statements, opinions and data contained in all publications are solely those of the individual author(s) and contributor(s) and not of MDPI and/or the editor(s). MDPI and/or the editor(s) disclaim responsibility for any injury to people or property resulting from any ideas, methods, instructions or products referred to in the content. |
© 2025 by the authors. Licensee MDPI, Basel, Switzerland. This article is an open access article distributed under the terms and conditions of the Creative Commons Attribution (CC BY) license (http://creativecommons.org/licenses/by/4.0/).
Copyright: This open access article is published under a Creative Commons CC BY 4.0 license, which permit the free download, distribution, and reuse, provided that the author and preprint are cited in any reuse.


