Introduction
Diabetic nephropathy (DN) represents one of the most severe and prevalent complications of type 2 diabetes mellitus (T2DM), contributing significantly to morbidity, mortality, and health care burden worldwide. It is a leading cause of end-stage renal disease (ESRD), with increasing incidence particularly in low- and middle-income countries [
1]. Traditional biomarkers such as glycated haemoglobin (HbA₁c) and urinary albumin excretion have been routinely employed for monitoring glycaemic control and renal involvement. However, these markers are limited in their ability to predict early nephropathy or capture the complex molecular mechanisms underlying renal injury [
2]. Indeed, microalbuminuria, though widely used, is influenced by blood pressure, infections, and physical activity, and some patients with progressive DN remain normoalbuminuric [
3]. This diagnostic gap underscores the need for sensitive, pathophysiology-driven biomarkers that allow earlier detection and more precise risk stratification.
Recent advances in renal pathophysiology highlight the interplay of hyperglycaemia-induced oxidative stress, chronic inflammation, endothelial dysfunction, and complement activation in DN [
4]. The complement system, particularly the terminal membrane attack complex (MAC, C5b-9), has emerged as a central mediator of microvascular injury in diabetic kidneys. CD59, a glycosylphosphatidylinositol-anchored protein, normally inhibits MAC assembly. However, under hyperglycaemic conditions, CD59 undergoes non-enzymatic glycation, impairing its regulatory function and allowing uncontrolled complement activation [
5]. The glycated form of CD59 (gCD59) is released into circulation and can be measured in plasma, providing a mechanistic link between hyperglycaemia, complement dysregulation, and microvascular damage [
6].
Clinical studies increasingly support the utility of gCD59 as a biomarker in diabetes-related complications. Elevated plasma gCD59 has been reported in T2DM patients with microvascular disease, including nephropathy and retinopathy, with strong diagnostic accuracy compared to traditional measures [
7]. Importantly, gCD59 correlates with HbA₁c and renal dysfunction, yet offers additional predictive value by reflecting complement activation rather than glycaemia alone [
7,
8]. In gestational diabetes mellitus (GDM), gCD59 has also shown potential as an early diagnostic and prognostic biomarker, with improved predictive performance when combined with glucose measurements [
9,
10]. These findings highlight its broad applicability across diabetic contexts.
Despite its promise, challenges remain in standardising gCD59 assays and validating population-specific thresholds. Moreover, the role of gCD59 in integrating renal tubular injury and vascular dysfunction pathways has not been extensively studied. Markers such as neutrophil gelatinase-associated lipocalin (NGAL) and kidney injury molecule-1 (KIM-1) provide insights into tubular stress, while soluble ICAM-1/VCAM-1 and apolipoprotein B (ApoB) capture aspects of endothelial dysfunction and lipid-driven injury. Similarly, high-sensitivity C-reactive protein (hs-CRP) reflects systemic inflammation, and soluble MAC (sC5b-9) directly quantifies terminal complement activation. A multi-marker approach integrating gCD59 with these indicators may provide a more comprehensive framework for risk assessment in DN.
In this context, the present study investigates the role of plasma gCD59 in relation to microalbuminuria, renal function (eGFR based on creatinine ± cystatin C), tubular injury, endothelial dysfunction, inflammation, and complement activation in T2DM patients. By combining conventional and emerging biomarkers, this work aims to clarify the utility of gCD59 in early DN detection and to evaluate its integration into clinical practice for improving patient outcomes.
Materials and Methods
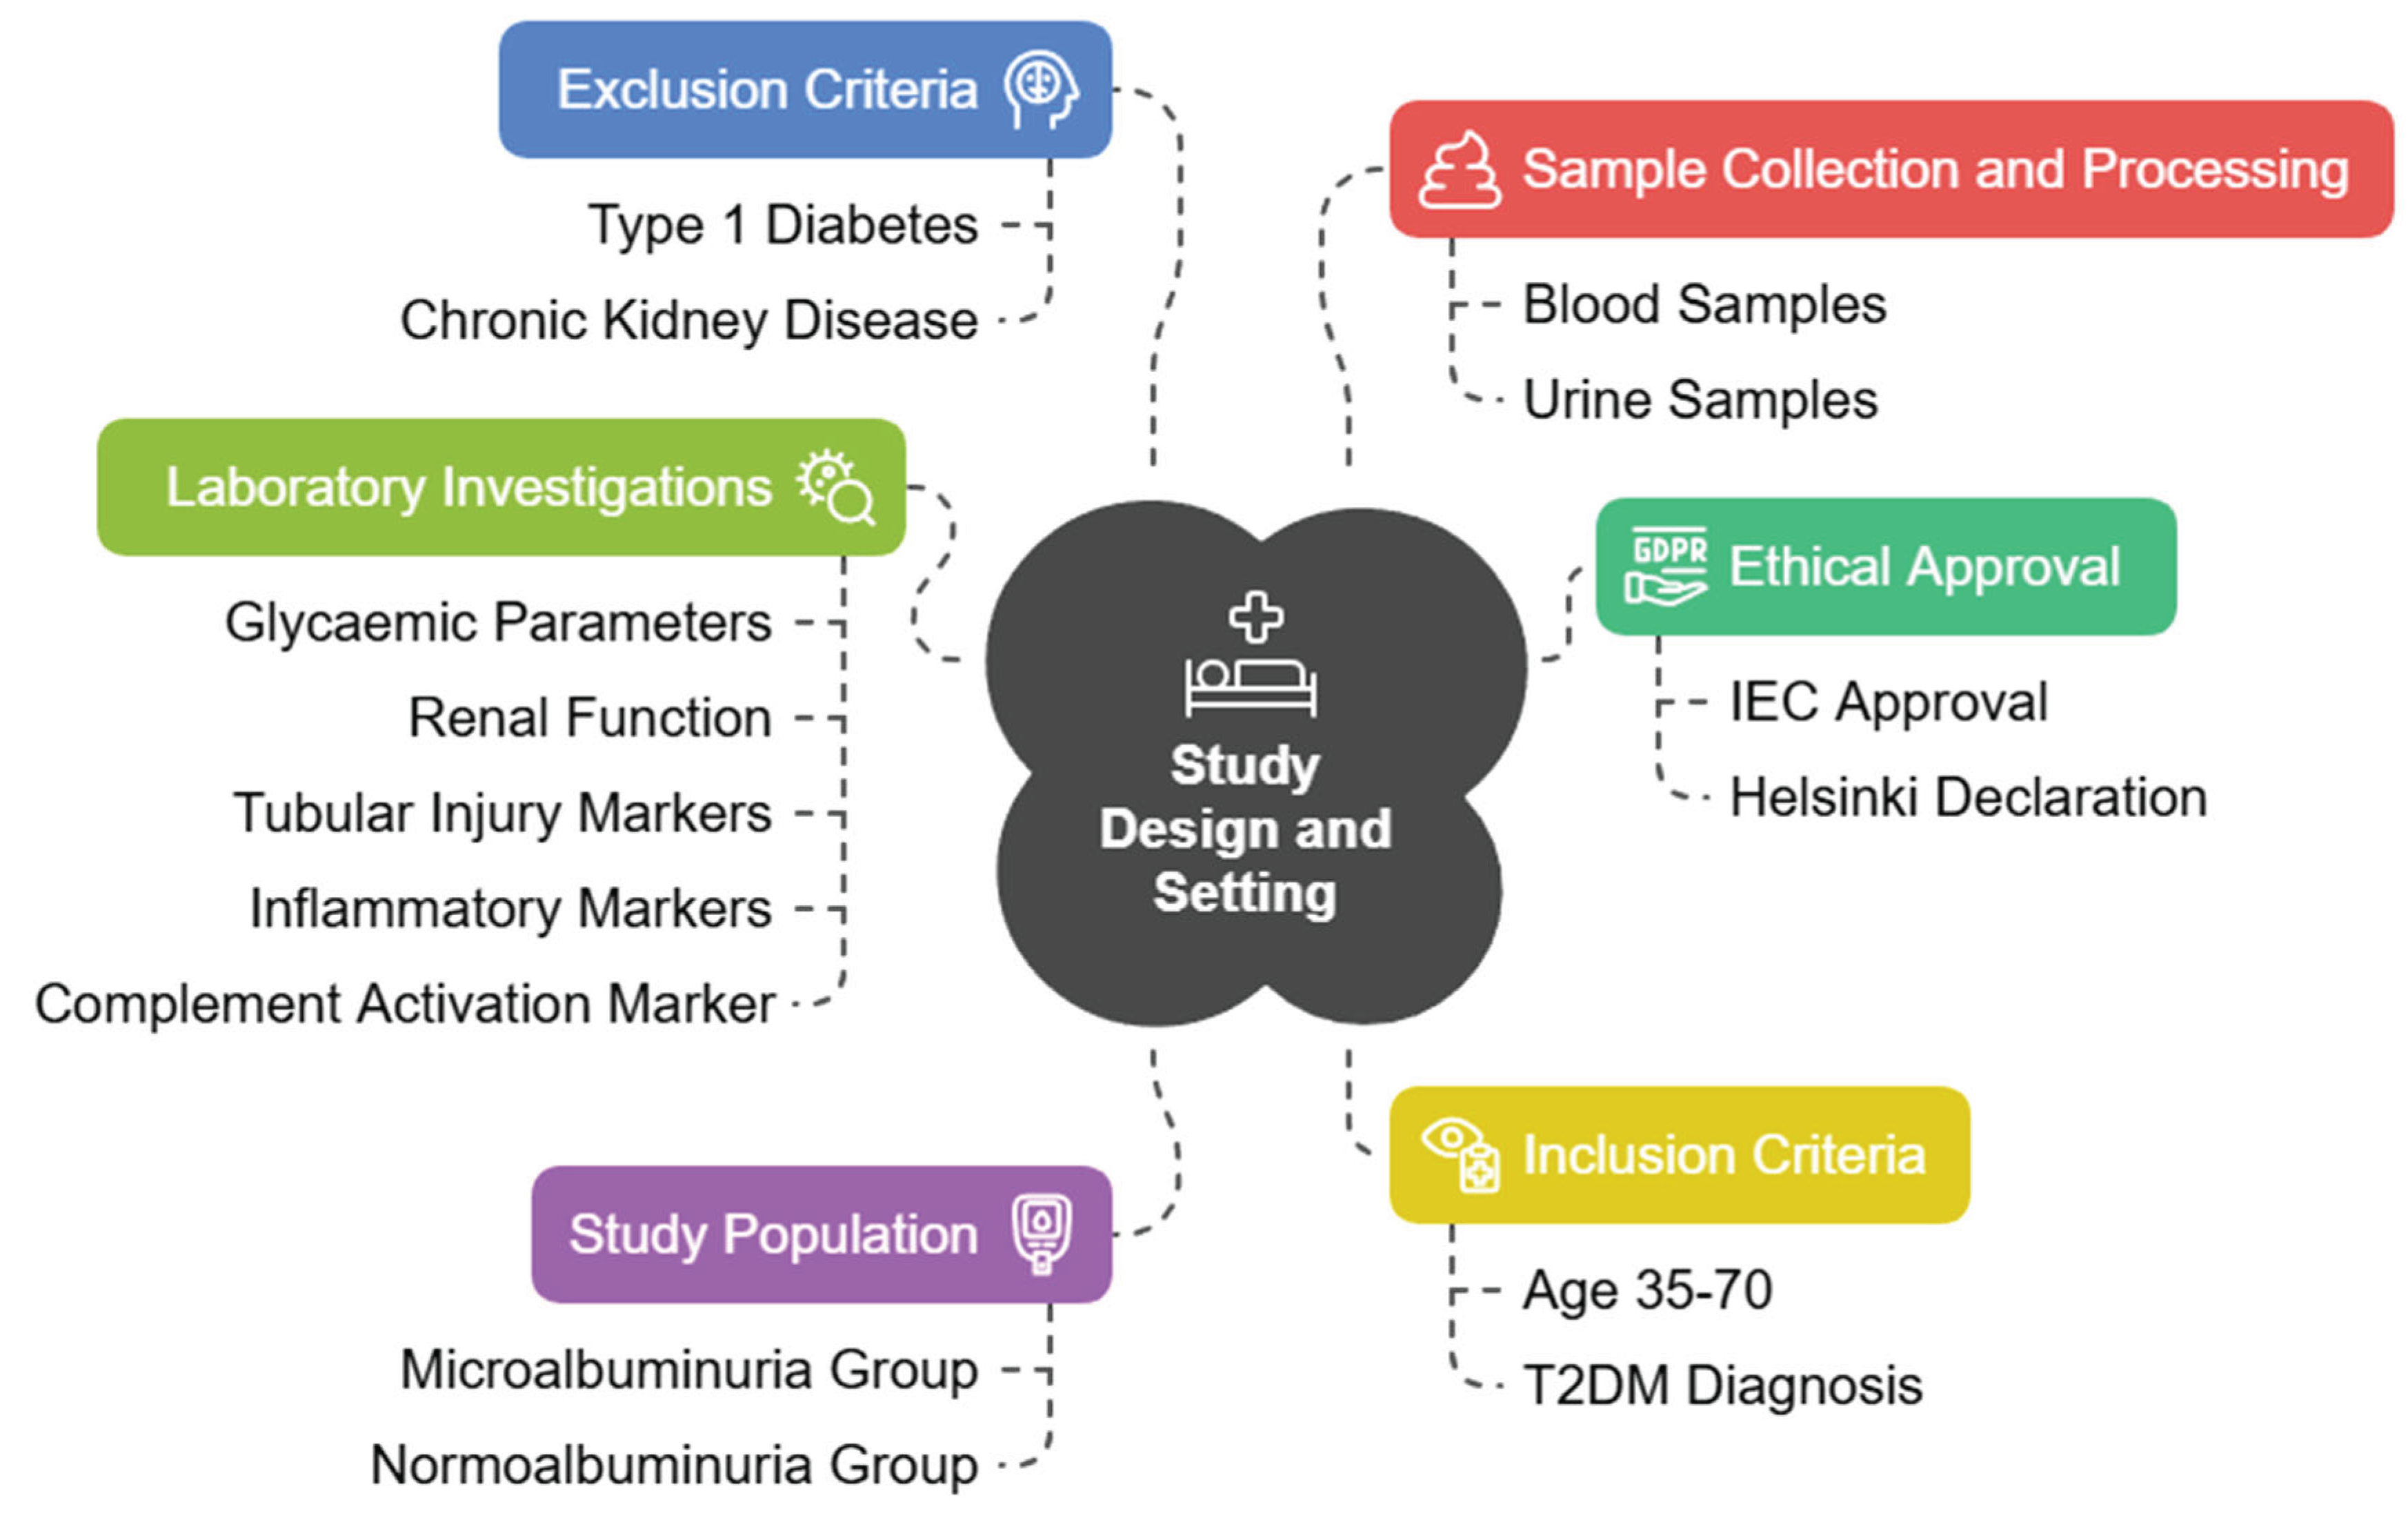
Study Design and Setting
This investigation was designed as a hospital-based, cross-sectional study to explore the relationship of glycated CD59 (gCD59) with microalbuminuria, renal function, tubular injury, inflammation, endothelial dysfunction, and complement activation in patients with T2DM. The study was conducted in collaboration with MGM Hospital, a tertiary care teaching hospital. This center serves as a referral facility for the surrounding districts, thereby ensuring a heterogeneous patient population representative of the region.
Ethical Approval
Prior to commencement, the study protocol was reviewed and approved by the Institutional Ethics Committee (Ref. No: 18/EC/NEW/INST/2023/4032). All procedures were conducted in accordance with the principles outlined in the Declaration of Helsinki (2013 revision) [
11,
12,
13]. Written informed consent was obtained from every participant after providing detailed information about the purpose, procedures, and potential risks and benefits of the study.
Study Population
A total of 320 patients with established T2DM were recruited from the outpatient and inpatient departments of MGM Hospital. To enable comparison, patients were divided into two equal groups: those with microalbuminuria (n = 160) and those without microalbuminuria (n = 160). The diagnosis of microalbuminuria was established by either 24-hour urinary albumin excretion (30–300 mg/24 h) or an albumin-to-creatinine ratio (ACR) of 30–300 mg/g in a spot urine sample, confirmed on at least two occasions.
Inclusion Criteria
Participants eligible for this study were adults aged between 35 and 70 years with a confirmed diagnosis of T2DM according to the American Diabetes Association (ADA) criteria [
14]. Only patients with a minimum disease duration of five years were considered, as longer-standing diabetes is more likely to manifest renal involvement and early nephropathy. Both men and women were included, provided they were clinically stable, able to give written informed consent, and willing to undergo clinical examination and laboratory investigations.
The presence of microalbuminuria was defined as a 24-hour urinary albumin excretion between 30 and 300 mg/day or an albumin-to-creatinine ratio (ACR) between 30 and 300 mg/g in a spot urine sample, confirmed on at least two separate occasions within a three-month period [
15]. Patients with normoalbuminuria (albumin excretion <30 mg/day or ACR <30 mg/g) were recruited as the comparator group. To minimise short-term variations, only patients without recent episodes of severe hyperglycaemia, hypoglycaemia, or acute metabolic decompensation were enrolled. Preference was given to patients receiving standard antidiabetic therapy and regular follow-up at MGM Hospital to ensure uniformity of baseline management.
Exclusion Criteria
Patients were excluded if they had conditions that could confound biomarker interpretation or introduce bias in the evaluation of gCD59. Those with type 1 diabetes mellitus (T1DM), maturity-onset diabetes of the young, or secondary forms of diabetes such as pancreatitis-related diabetes, steroid-induced diabetes, or endocrinopathy-related diabetes were not eligible.
Individuals with chronic kidney disease unrelated to diabetes, including hypertensive nephrosclerosis, glomerulonephritis, polycystic kidney disease, obstructive uropathy, or lupus nephritis, were excluded. Patients with macroalbuminuria, defined as albumin excretion above 300 mg/day or an ACR exceeding 300 mg/g, were also excluded, as the study focused on the early stages of diabetic nephropathy.
Participants with acute infections such as urinary tract infection, pneumonia, or systemic sepsis were excluded to avoid transient elevations in inflammatory and renal biomarkers. Likewise, those with chronic inflammatory or autoimmune diseases, including rheumatoid arthritis, inflammatory bowel disease, or systemic sclerosis, were not eligible, since these conditions independently influence complement activation and endothelial dysfunction.
Patients with active malignancy or those undergoing chemotherapy or radiotherapy were excluded due to the profound effect of these conditions on immune and vascular markers. Similarly, individuals receiving long-term immunosuppressive medications, such as corticosteroids or calcineurin inhibitors, were excluded. Pregnant and lactating women were not included, owing to physiological alterations in renal haemodynamics and biomarker expression during pregnancy. Individuals with severe hepatic dysfunction, including advanced cirrhosis or decompensated hepatitis, were excluded because of their potential impact on lipid metabolism and systemic inflammation.
Finally, patients unwilling or unable to provide informed consent, or those with incomplete clinical and laboratory records, were excluded from the study cohort.
Sample Collection and Processing
Venous blood samples (5 mL) were collected from all participants after an overnight fast of at least 10 hours. Blood was collected in EDTA tubes and plain tubes. Plasma and serum were separated within one hour of collection by centrifugation at 3000 rpm for 15 minutes at 4°C. Aliquots were stored at –80°C in sterile cryovials until biochemical and immunological assays were performed. Midstream urine samples were collected in sterile containers and centrifuged to remove debris before analysis of tubular injury markers.
Laboratory Investigations
Glycaemic and Renal Parameters
Glycated haemoglobin (HbA1c) was estimated by high-performance liquid chromatography (HPLC; Bio-Rad D-10 Hemoglobin Testing System, Bio-Rad Laboratories, Hercules, CA, USA). Renal function was evaluated by estimating serum creatinine using the Jaffe kinetic method (Beckman Coulter AU480 Chemistry Analyzer, Brea, CA, USA). The estimated glomerular filtration rate (eGFR) was calculated using the CKD-EPI equation based on creatinine, and in selected cases, cystatin C was additionally measured using particle-enhanced immunonephelometry (Siemens BN ProSpec System, Siemens Healthcare, Marburg, Germany).
Measurement of Plasma gCD59
Plasma levels of glycated CD59 (gCD59) were quantitatively analyzed in all participants using a sandwich ELISA method (Product # SEB336Hu, USCN Life Science Inc., Wuhan, China). The assay was carried out as per the manufacturer’s protocol, with duplicate measurements performed to ensure reproducibility. Optical density was read at 450 nm using a microplate reader (BioTek ELx808, Winooski, VT, USA).
Tubular Injury Markers
Urinary neutrophil gelatinase-associated lipocalin (NGAL) and kidney injury molecule-1 (KIM-1) were measured by ELISA (NGAL: Product # ab119602, Abcam, Cambridge, UK; KIM-1: Product # DKM100, R&D Systems, Minneapolis, MN, USA). Values were normalized to urinary creatinine to account for variations in urine concentration.
Inflammatory and Endothelial Dysfunction Markers
High-sensitivity C-reactive protein (hs-CRP) was determined by immunoturbidimetric assay (CRP-Latex HS, Roche Diagnostics, Mannheim, Germany). Soluble intercellular adhesion molecule-1 (sICAM-1) and soluble vascular cell adhesion molecule-1 (sVCAM-1) were measured using commercial ELISA kits (sICAM-1: Product # BMS201, Thermo Fisher Scientific, Waltham, MA, USA; sVCAM-1: Product # E-EL-H2166, Elab Science, Houston, Texas, 77079, USA). ApoB concentrations were assessed by ELISA kit (ApoB; Product # BMS201E-EL-H6171, Elab Science).
Complement Activation Marker
Complement activation was assessed by measuring soluble membrane attack complex (sMAC, C5b-9) levels using an ELISA kit (Product # HK328, Hycult Biotech, Uden, The Netherlands). Elevated sMAC reflects enhanced terminal complement activity, consistent with complement dysregulation in DN.
Medication History
Data regarding the use of reno-protective medications, particularly angiotensin-converting enzyme inhibitors (ACEi), angiotensin receptor blockers (ARB), and sodium–glucose cotransporter-2 inhibitors (SGLT2i), were recorded from hospital prescriptions and patient files. Medication status was considered in subgroup analyses to evaluate potential confounding influences on biomarker levels.
Statistical Analysis
All statistical analyses were performed using IBM SPSS Statistics software, version 26.0 (IBM Corp., Armonk, NY, USA). Continuous variables were expressed as mean ± standard deviation (SD) for normally distributed data or as median with interquartile range (IQR) for non-normally distributed data, as assessed by the Shapiro–Wilk test. Between-group comparisons were carried out using the independent samples t-test for normally distributed variables and the Mann–Whitney U test for skewed variables. Categorical variables were compared using the Chi-square test. Correlations between gCD59 and other biomarkers were assessed using Pearson’s correlation coefficient or Spearman’s rank correlation coefficient, as appropriate. To identify independent predictors of microalbuminuria, multivariate logistic regression analysis was performed after adjustment for age, sex, HbA1c, lipid parameters, and medication use. A p-value less than 0.05 was considered statistically significant.
Figure 1.
Study Design and Methodology for T2DM and Renal Complications.
Figure 1.
Study Design and Methodology for T2DM and Renal Complications.
Results
Baseline Characteristics
The baseline demographic and clinical characteristics of the study participants are presented in the table. The mean age of individuals in the normoalbuminuria group was 55.1 years, while those with microalbuminuria had an average age of 56.2 years. This slight difference was not statistically significant (p = 0.21), suggesting that age distribution was comparable between the two groups. Similarly, the proportion of male participants was nearly equal, with 51.9% in the normoalbuminuria group and 54.3% in the microalbuminuria group, showing no significant gender-related difference (χ² = 0.64, p = 0.64).
In contrast, the duration of diabetes revealed a marked variation. Patients with microalbuminuria had been living with diabetes for a longer period, averaging 10.8 years, compared to 8.2 years in those without microalbuminuria. This difference was statistically significant (p < 0.001), highlighting the contribution of longer disease duration to renal involvement.
Body mass index (BMI) was slightly higher among the microalbuminuria group (27.9 kg/m²) compared with the normoalbuminuria group (27.4 kg/m²), but the difference did not reach statistical significance (p = 0.27).
Glycaemic control, assessed by HbA1c, showed a strong distinction between the groups. Patients with microalbuminuria had significantly higher HbA1c levels (8.9%) compared to those without (7.8%), with a highly significant p value (<0.001). This finding indicates poorer glycaemic control among patients who had developed microalbuminuria.
Blood pressure also varied notably between the groups. The mean systolic blood pressure was higher in the microalbuminuria group (138 mmHg) compared to the normoalbuminuria group (131 mmHg). This difference was statistically significant (p = 0.002), suggesting that elevated blood pressure is closely associated with the onset of microalbuminuria (
Table 1).
Biochemical and Biomarker Profile
The comparative analysis of biochemical and biomarker parameters between the normoalbuminuria and microalbuminuria groups revealed significant differences across nearly all measured variables.
Glycaemic control, as reflected by HbA1c levels, was substantially poorer in patients with microalbuminuria. The average HbA1c in this group was 8.9%, compared with 7.8% in those without microalbuminuria, and this difference reached high statistical significance (p < 0.001). This indicates that chronic hyperglycaemia is closely associated with the early renal changes observed in diabetic nephropathy.
Renal function, estimated using the glomerular filtration rate (eGFR), was also notably reduced in patients with microalbuminuria. The mean eGFR was 68.2 mL/min/1.73 m² in the affected group, compared with 85.4 mL/min/1.73 m² in those without albuminuria (p < 0.001). This points to a decline in renal clearance capacity in association with early nephropathy.
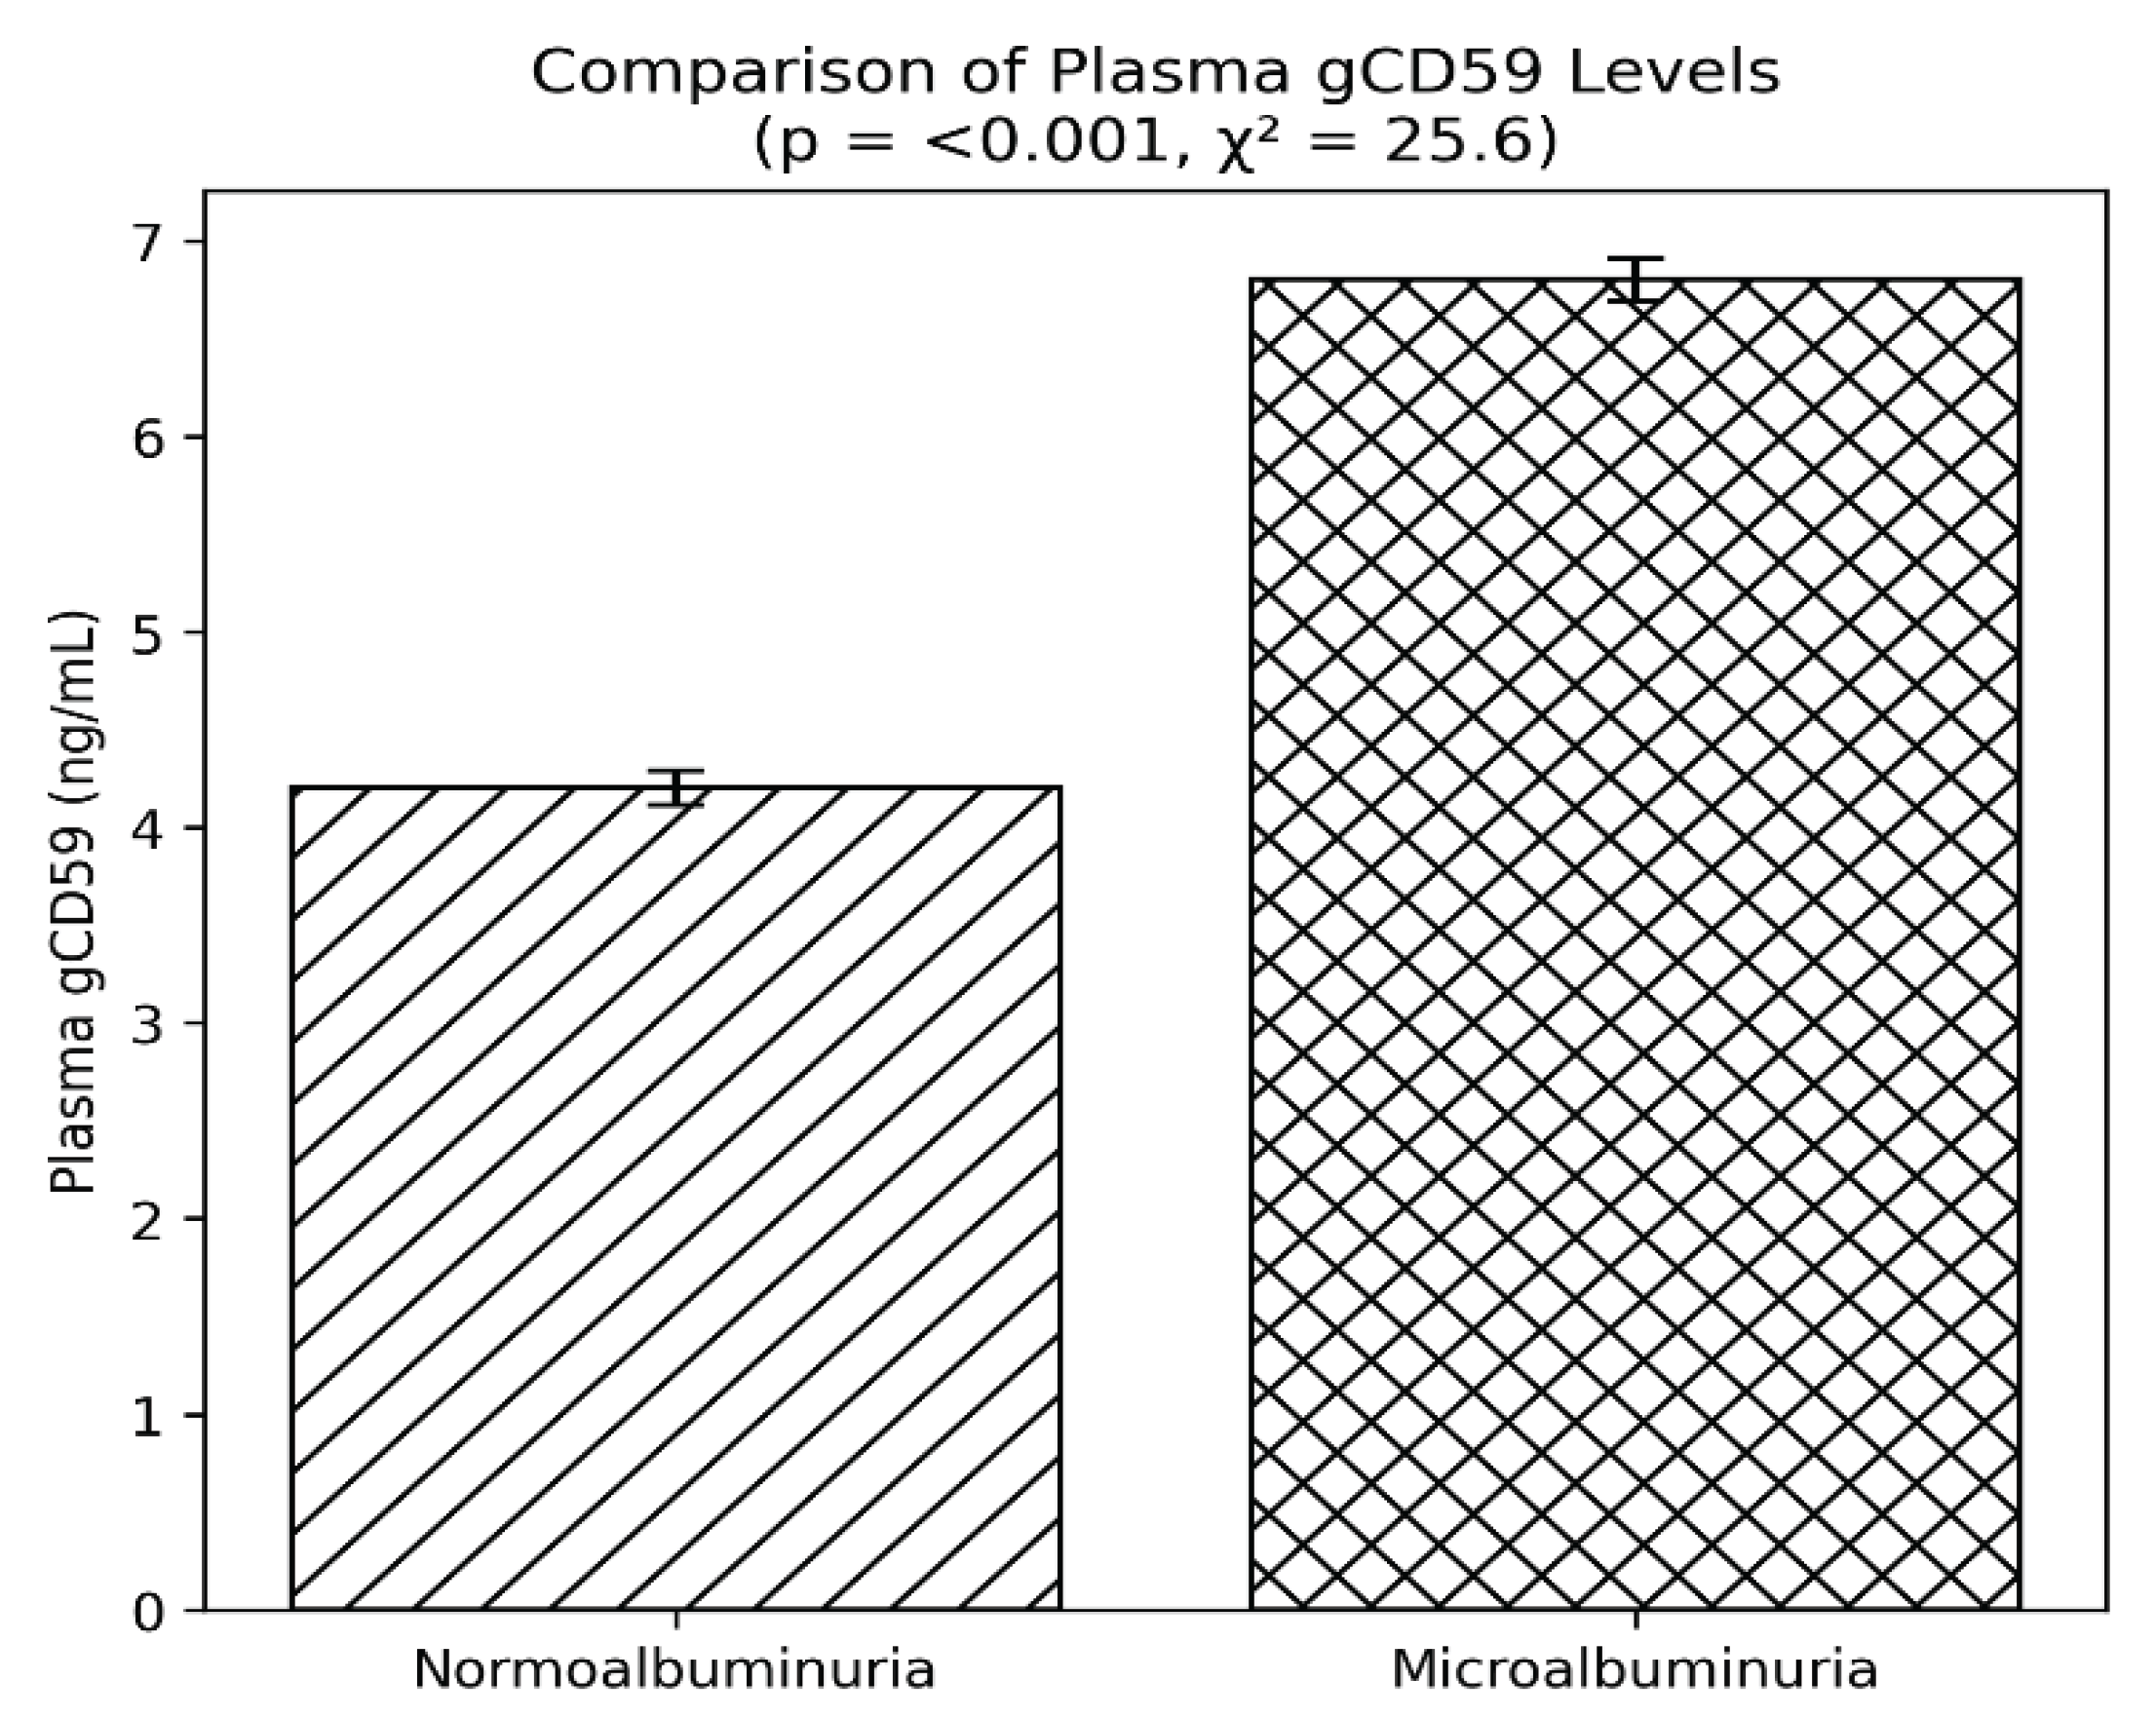
Plasma gCD59, a marker of complement dysregulation under hyperglycaemic conditions, was markedly elevated in the microalbuminuria group, with mean levels of 6.8 ng/mL versus 4.2 ng/mL in the normoalbuminuria group (p < 0.001) (
Figure 2). This supports the role of gCD59 as a potential biomarker for microvascular complications in diabetes.
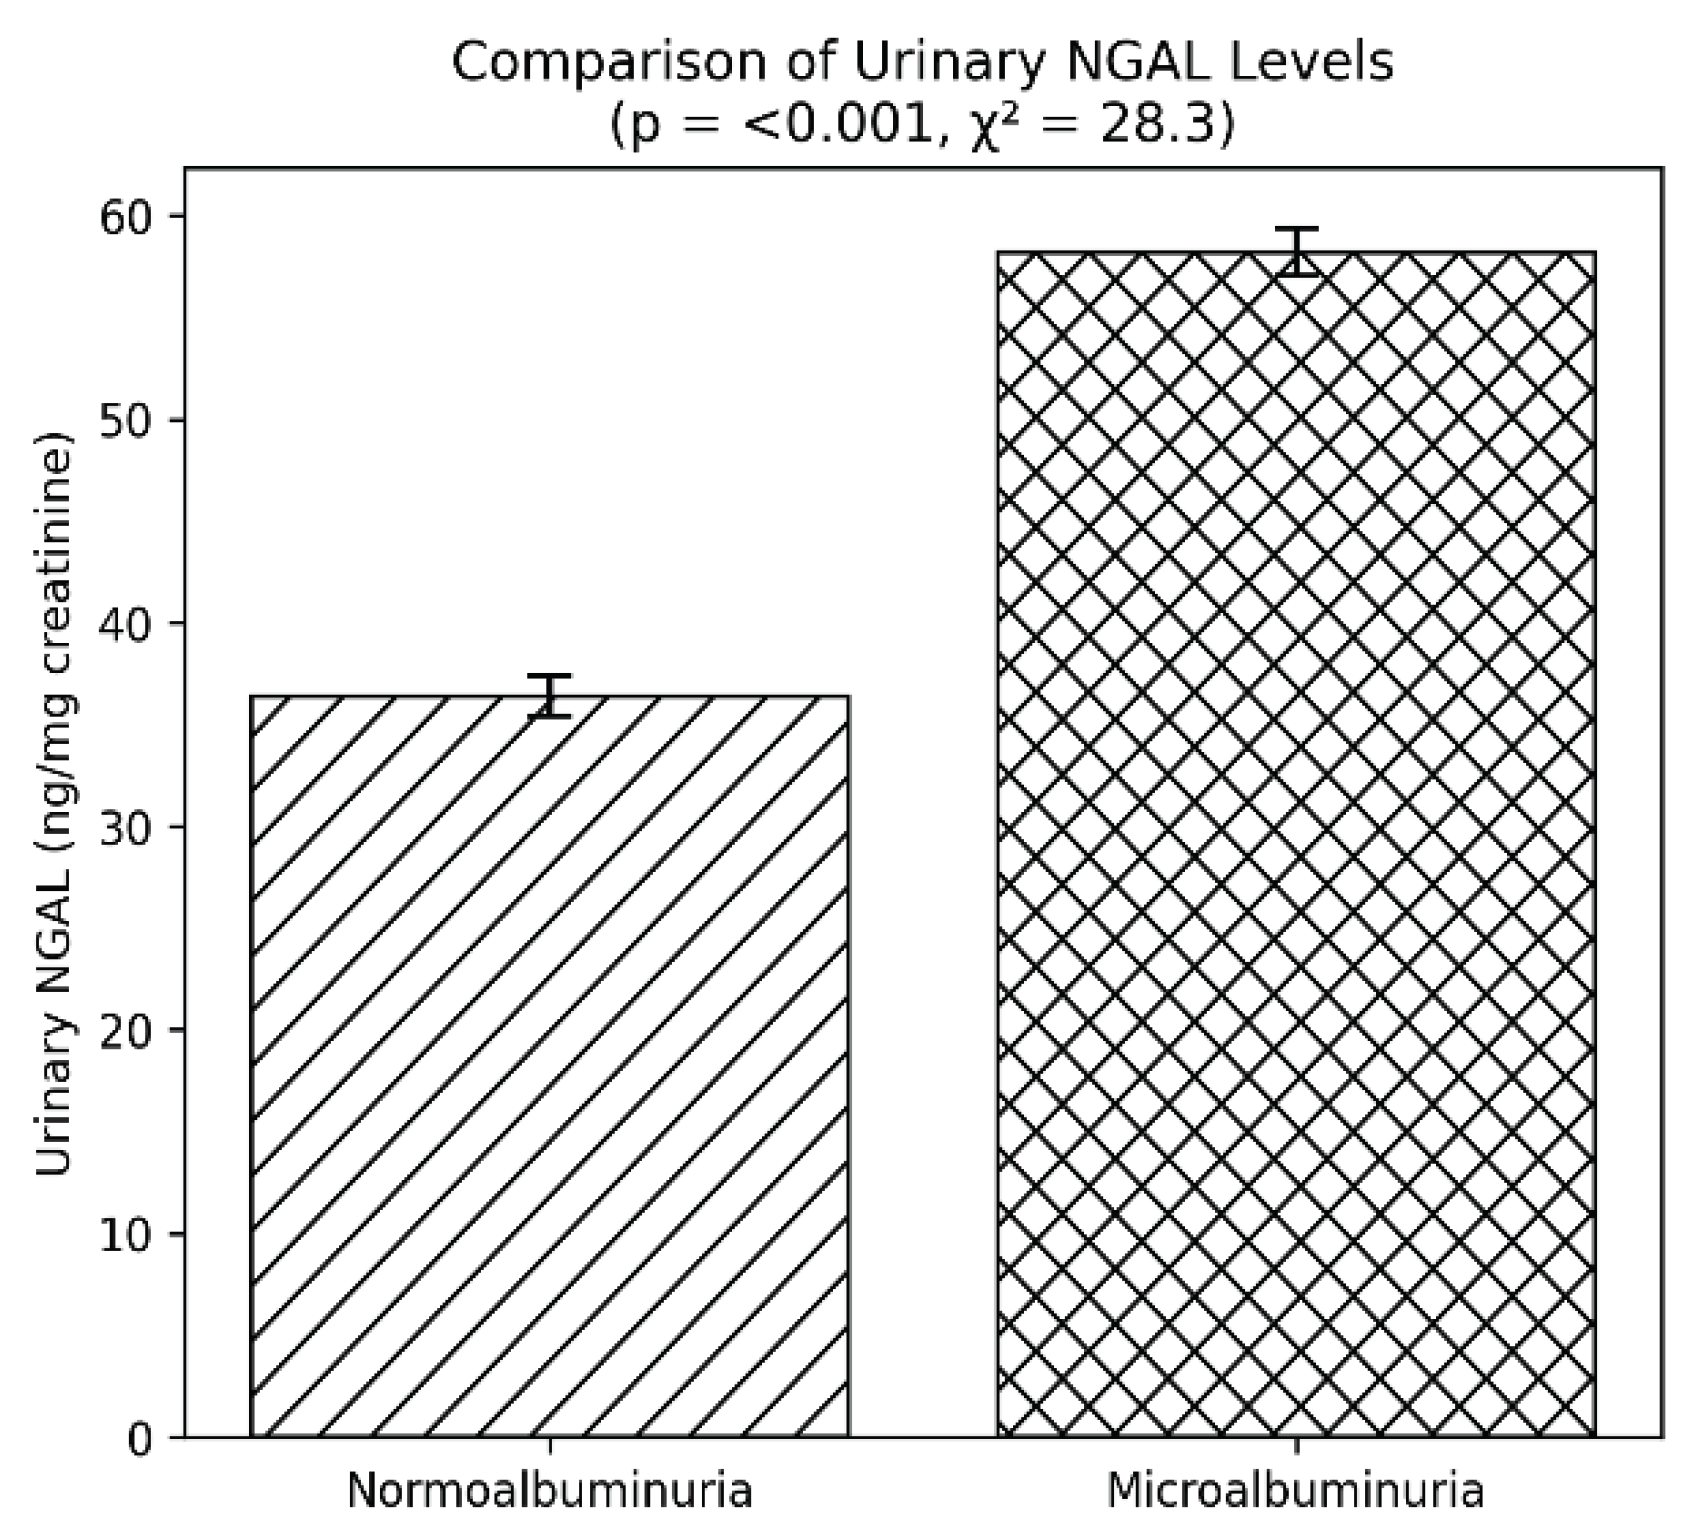
Urinary markers of tubular injury showed similar patterns. NGAL levels were significantly higher in the microalbuminuria group (58.2 ng/mg creatinine) than in the normoalbuminuria group (36.4 ng/mg creatinine, p < 0.001). KIM-1 was also elevated in patients with microalbuminuria (5.2 ng/mg creatinine vs 3.1 ng/mg creatinine, p < 0.001) (
Figure 3). These findings underscore the contribution of tubular damage in the progression of DN.
Inflammatory status, assessed by hs-CRP, was significantly worse in the microalbuminuria group, where levels averaged 4.2 mg/L compared to 2.7 mg/L in normoalbuminuria (p < 0.001). Endothelial dysfunction markers were also considerably elevated. Mean soluble ICAM-1 was 320 ng/mL in microalbuminuria versus 256 ng/mL in normoalbuminuria (p < 0.001), while soluble VCAM-1 was 640 ng/mL versus 490 ng/mL, respectively (p < 0.001). These results reflect heightened endothelial activation in patients with early nephropathy.
In terms of lipid-related parameters, ApoB was significantly higher in patients with microalbuminuria (110 mg/dL) than in those without (96 mg/dL, p < 0.001), highlighting the coexistence of lipid abnormalities with renal dysfunction.
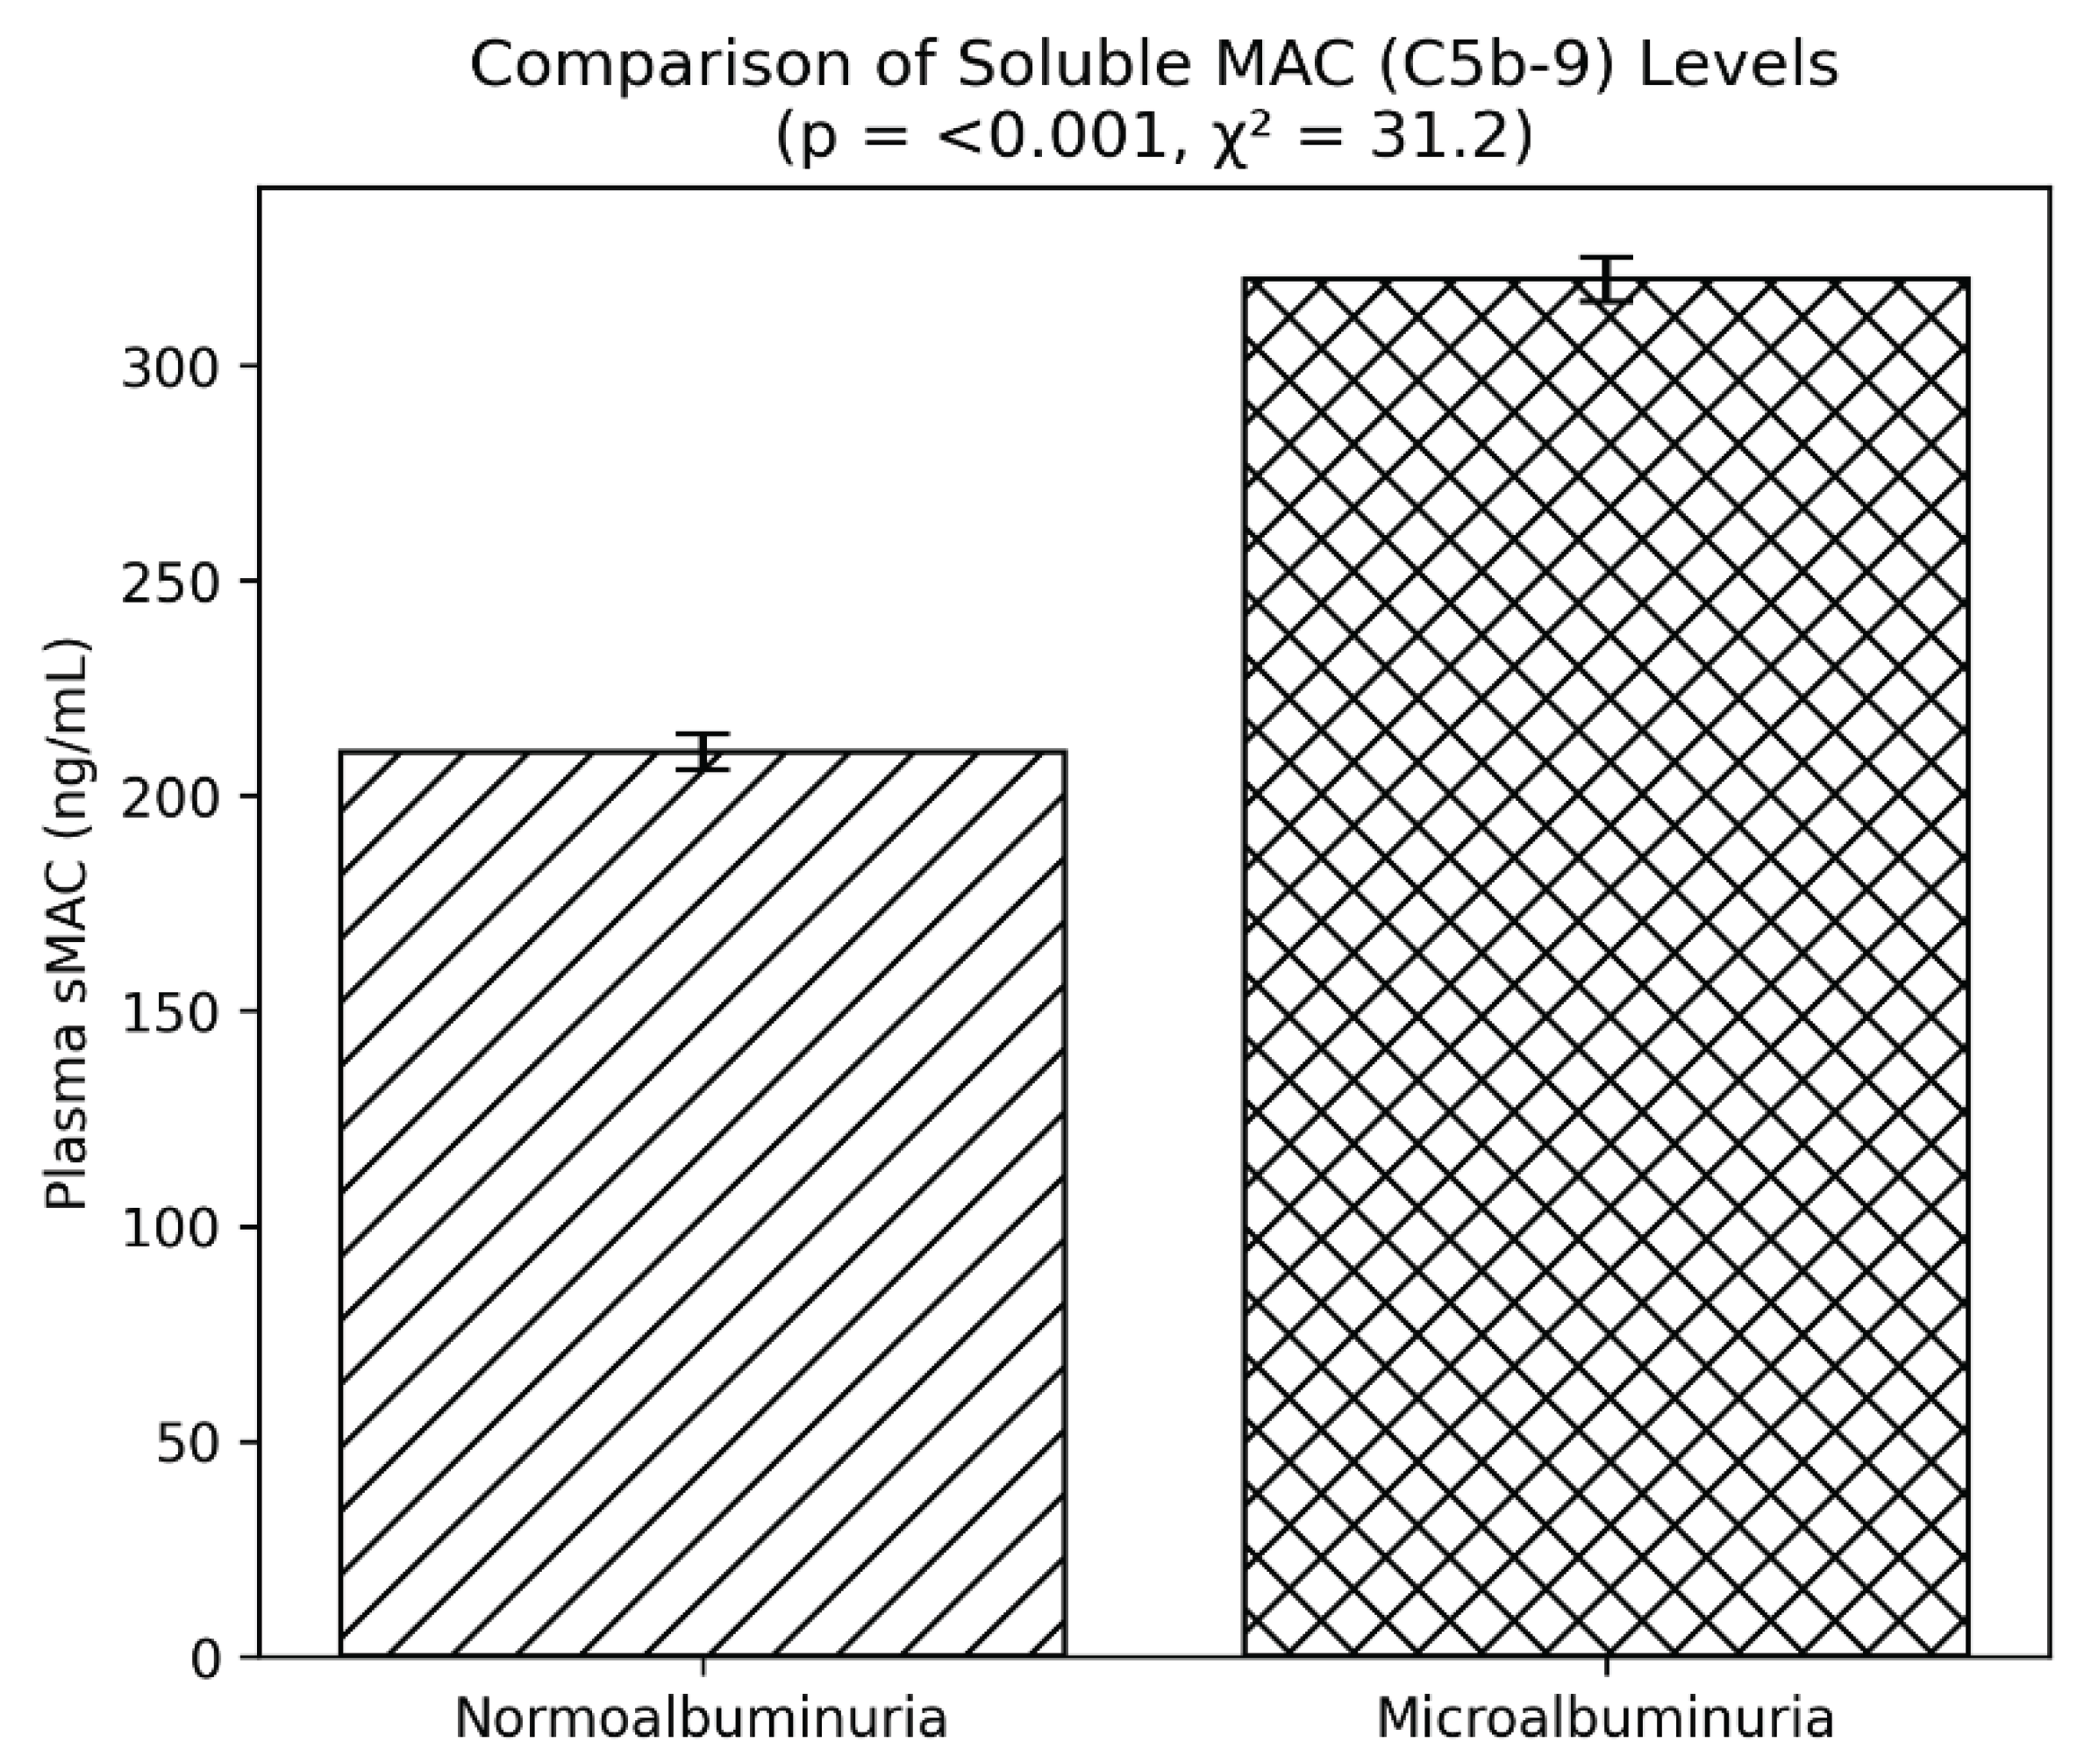
Finally, evidence of complement activation was observed through elevated sMAC levels. Patients with microalbuminuria had mean values of 320 ng/mL, substantially higher than the 210 ng/mL seen in normoalbuminuria (p < 0.001) (
Figure 4). This reinforces the hypothesis that complement system activation plays an important role in the pathogenesis of diabetic nephropathy. Plasma soluble membrane attack complex (sMAC, C5b-9) was elevated in patients with microalbuminuria (320 ± 65 vs 210 ± 52 ng/mL, p < 0.001), indicating increased complement activation (
Table 2).
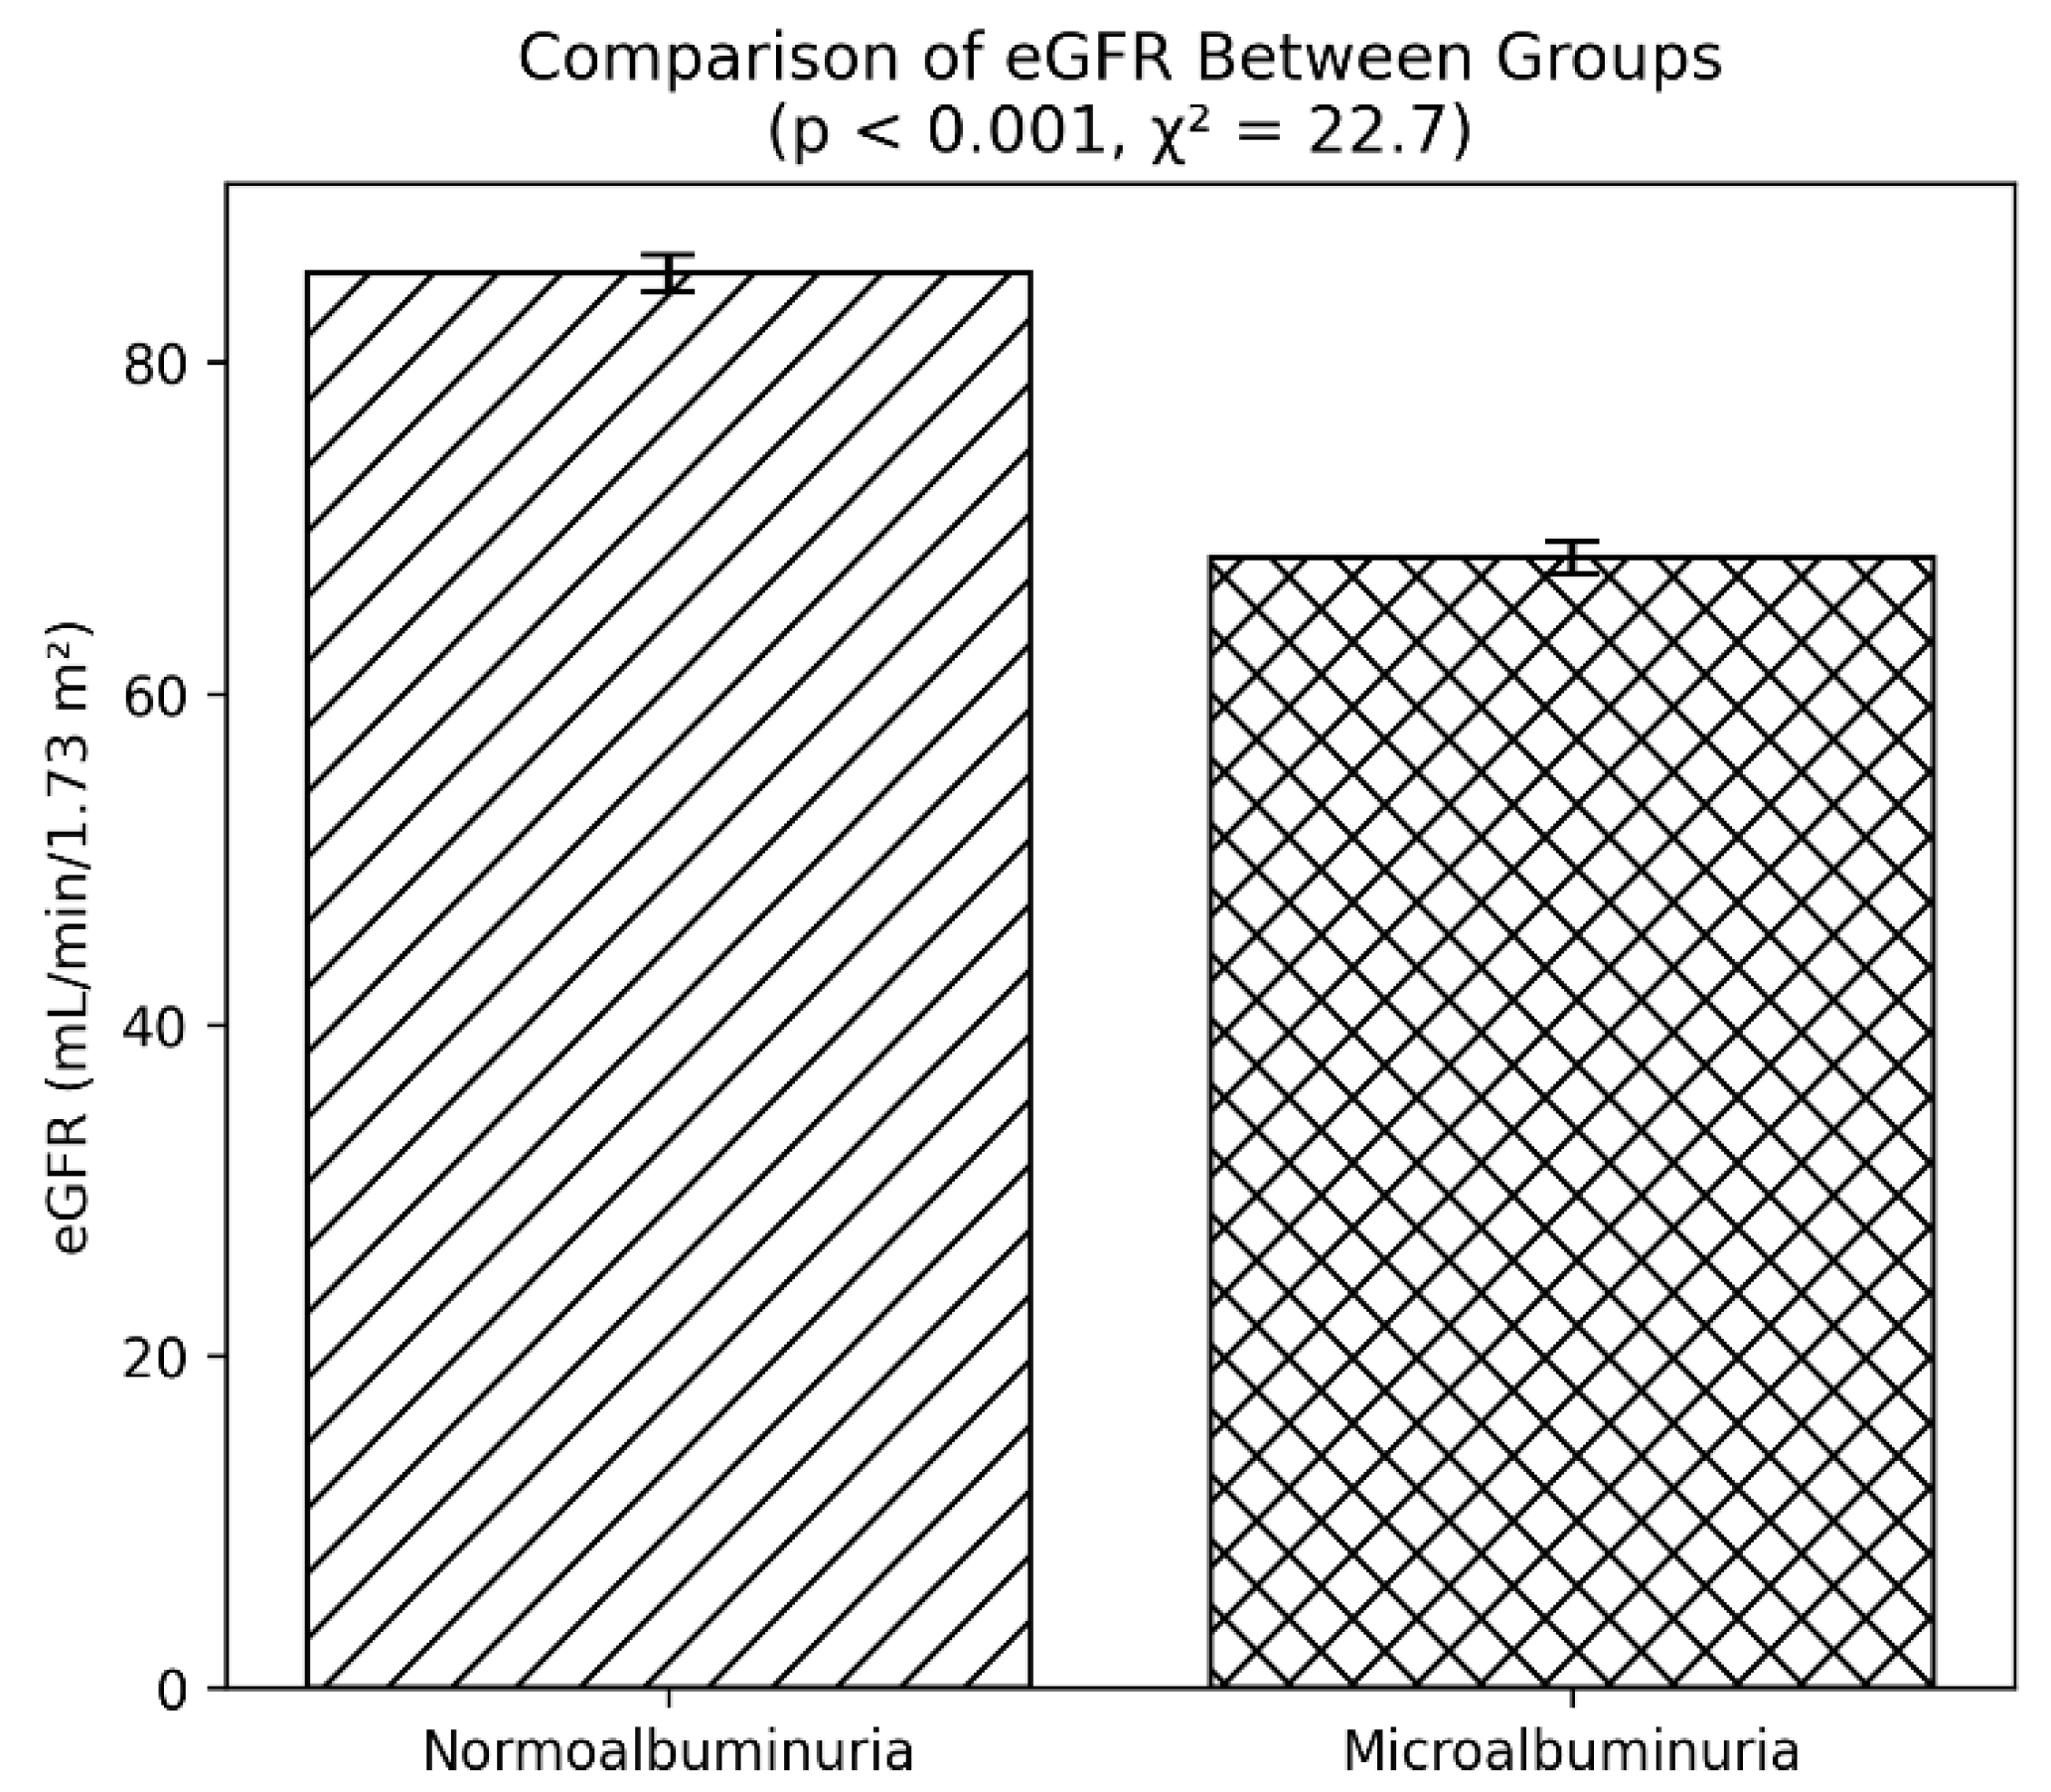
A clear decline in eGFR was observed among patients with microalbuminuria when compared with those who had normoalbuminuria. As depicted in the comparative bar diagram, individuals in the normoalbuminuria group demonstrated a mean eGFR of approximately 85 mL/min/1.73 m², whereas those in the microalbuminuria group had a mean value near 68 mL/min/1.73 m². The bars represent mean values with standard error margins, which show minimal or no overlap, indicating a robust difference between the two categories.
Statistical analysis confirmed the significance of this finding, with a p value of less than 0.001 and a chi-square statistic of 22.7. These results suggest that even in the absence of overt proteinuria, subtle reductions in renal function are already evident in patients with early nephropathy, as indicated by microalbuminuria (
Figure 5). This pattern supports the concept that eGFR decline begins early in the course of diabetic renal involvement and that monitoring both albuminuria status and eGFR provides a more comprehensive understanding of renal health in individuals with type 2 diabetes.
Correlation Analysis
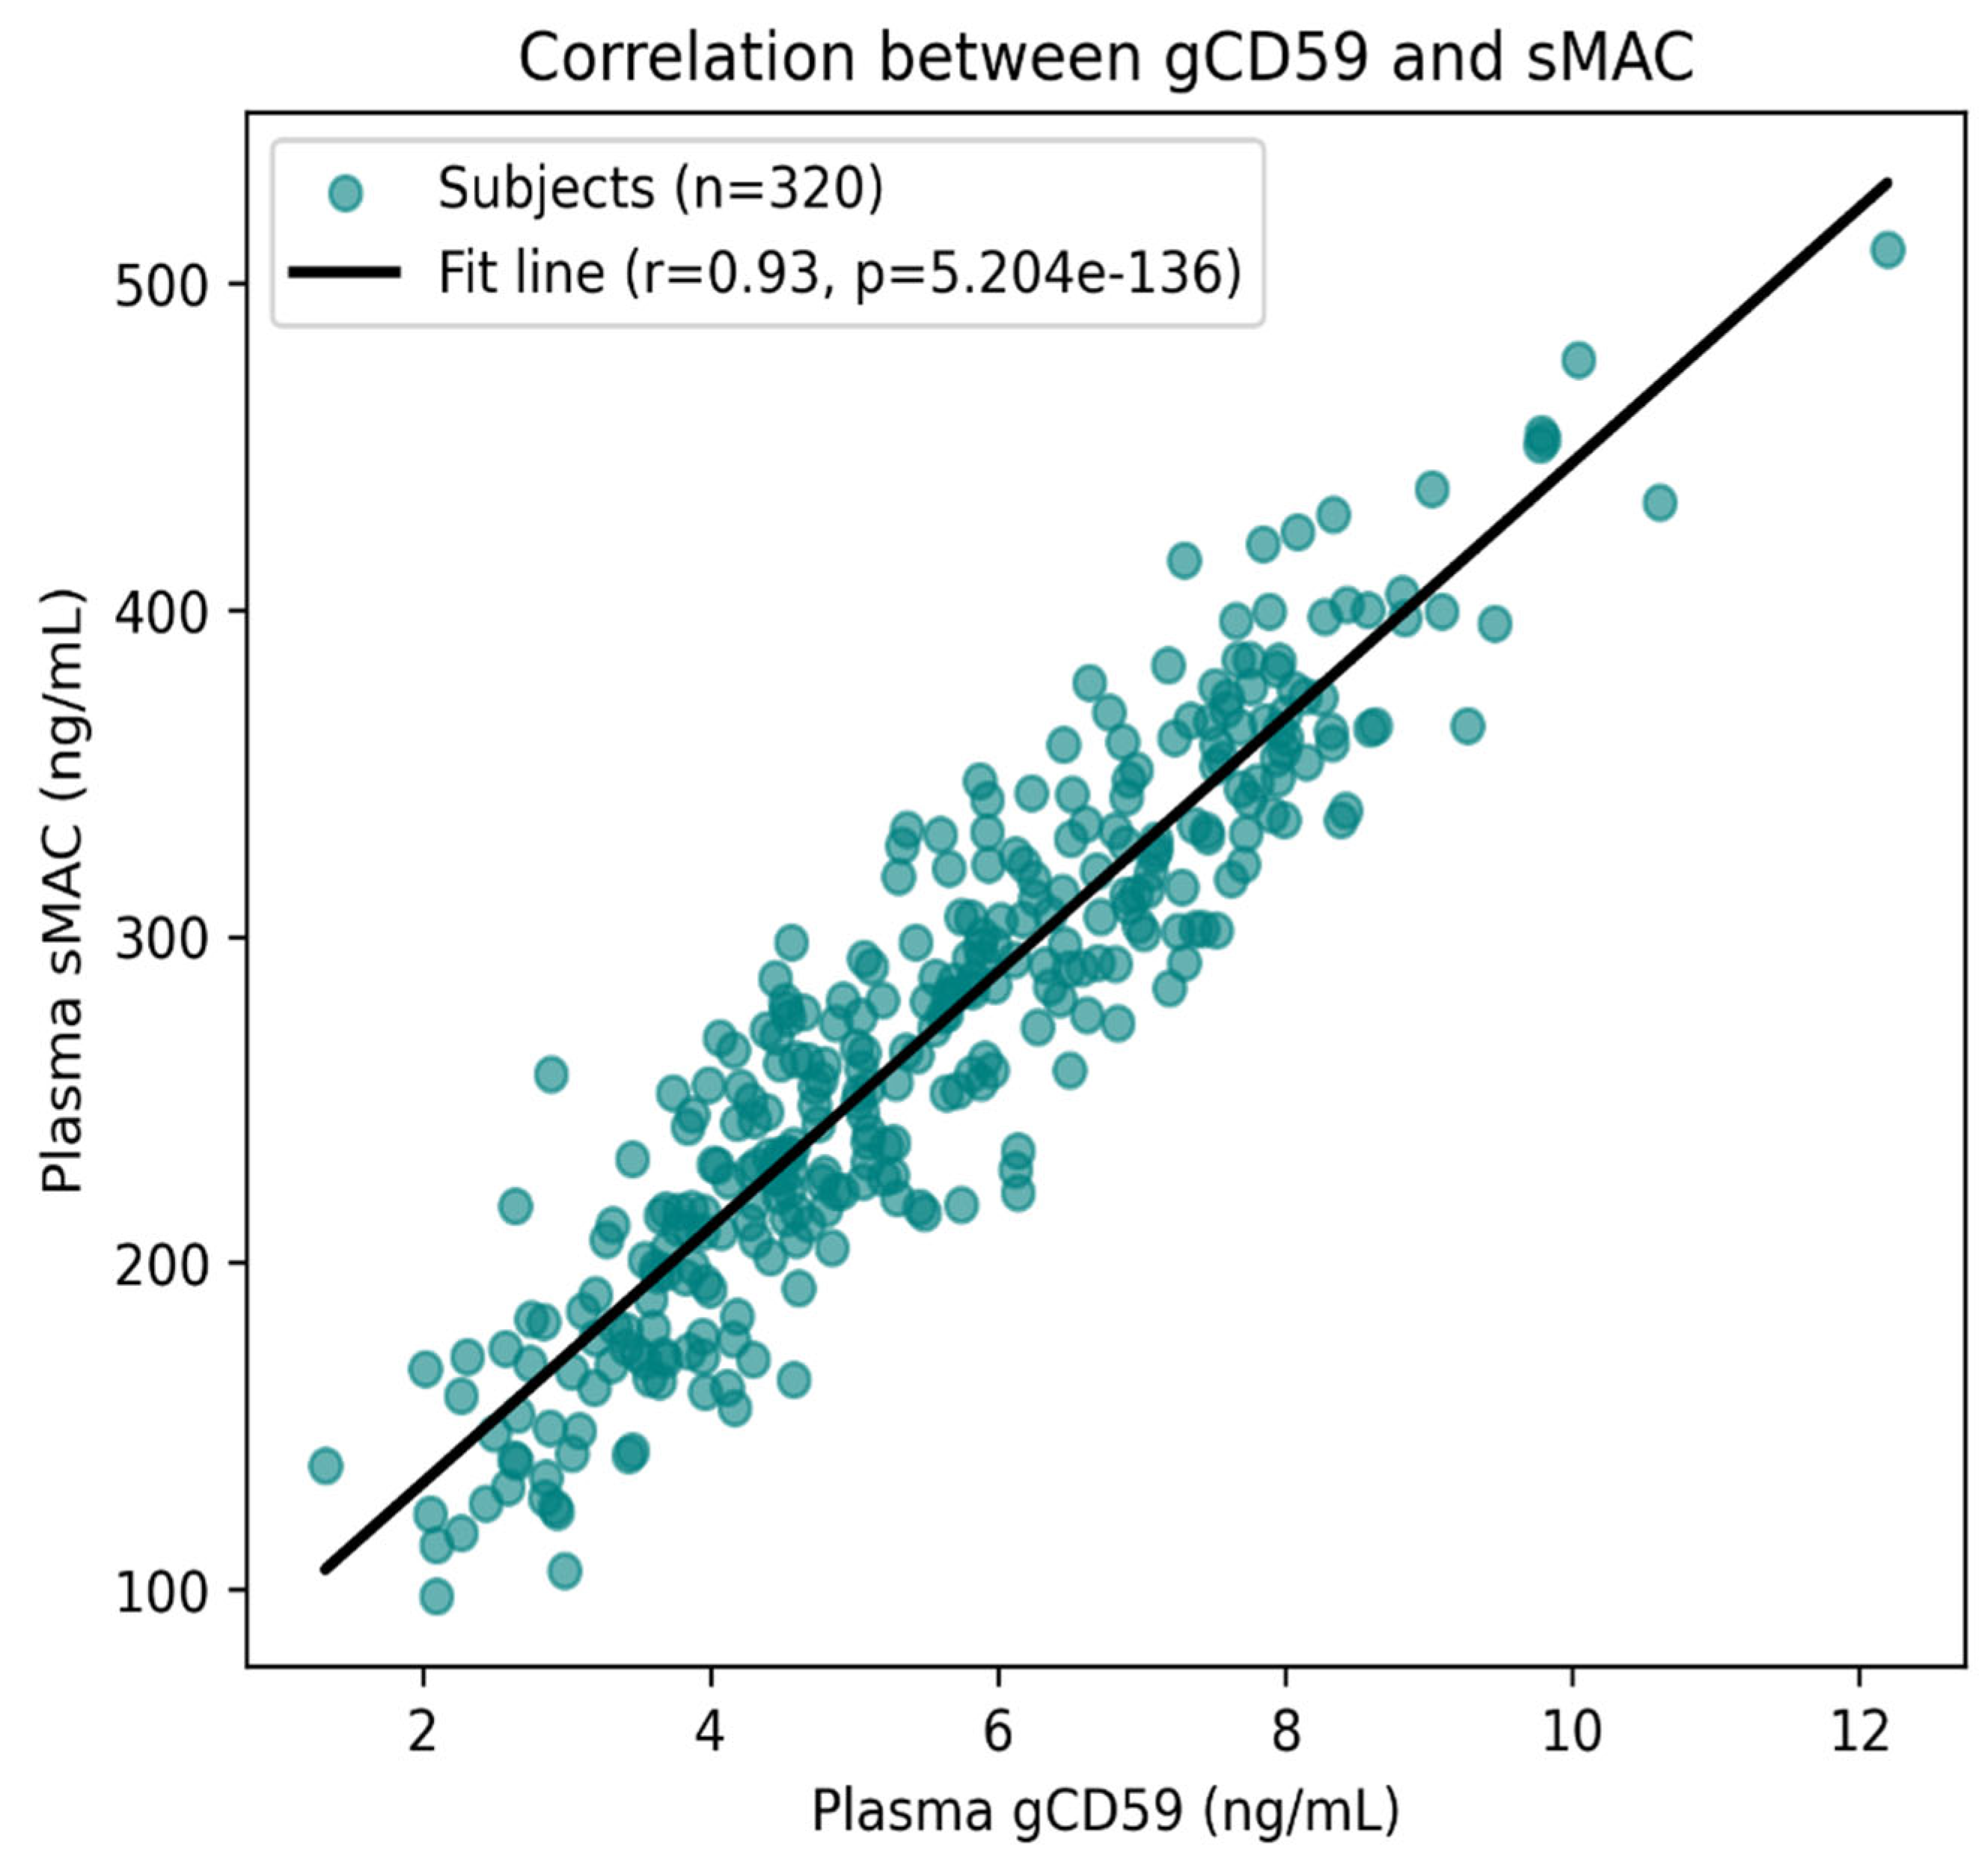
The scatter plot depicts the relationship between gCD59 and sMAC levels in 320 patients with T2DM. Each point corresponds to an individual participant, and the regression line illustrates the overall trend. A clear and consistent positive association was observed, with higher gCD59 concentrations corresponding to higher sMAC levels. This relationship was statistically robust, with a correlation coefficient of r = 0.93 and a highly significant p value (p < 0.001) (
Figure 6). The close clustering of values around the fitted line indicates a strong linear relationship, suggesting that glycation-induced impairment of CD59 is closely linked to complement activation in diabetic nephropathy.
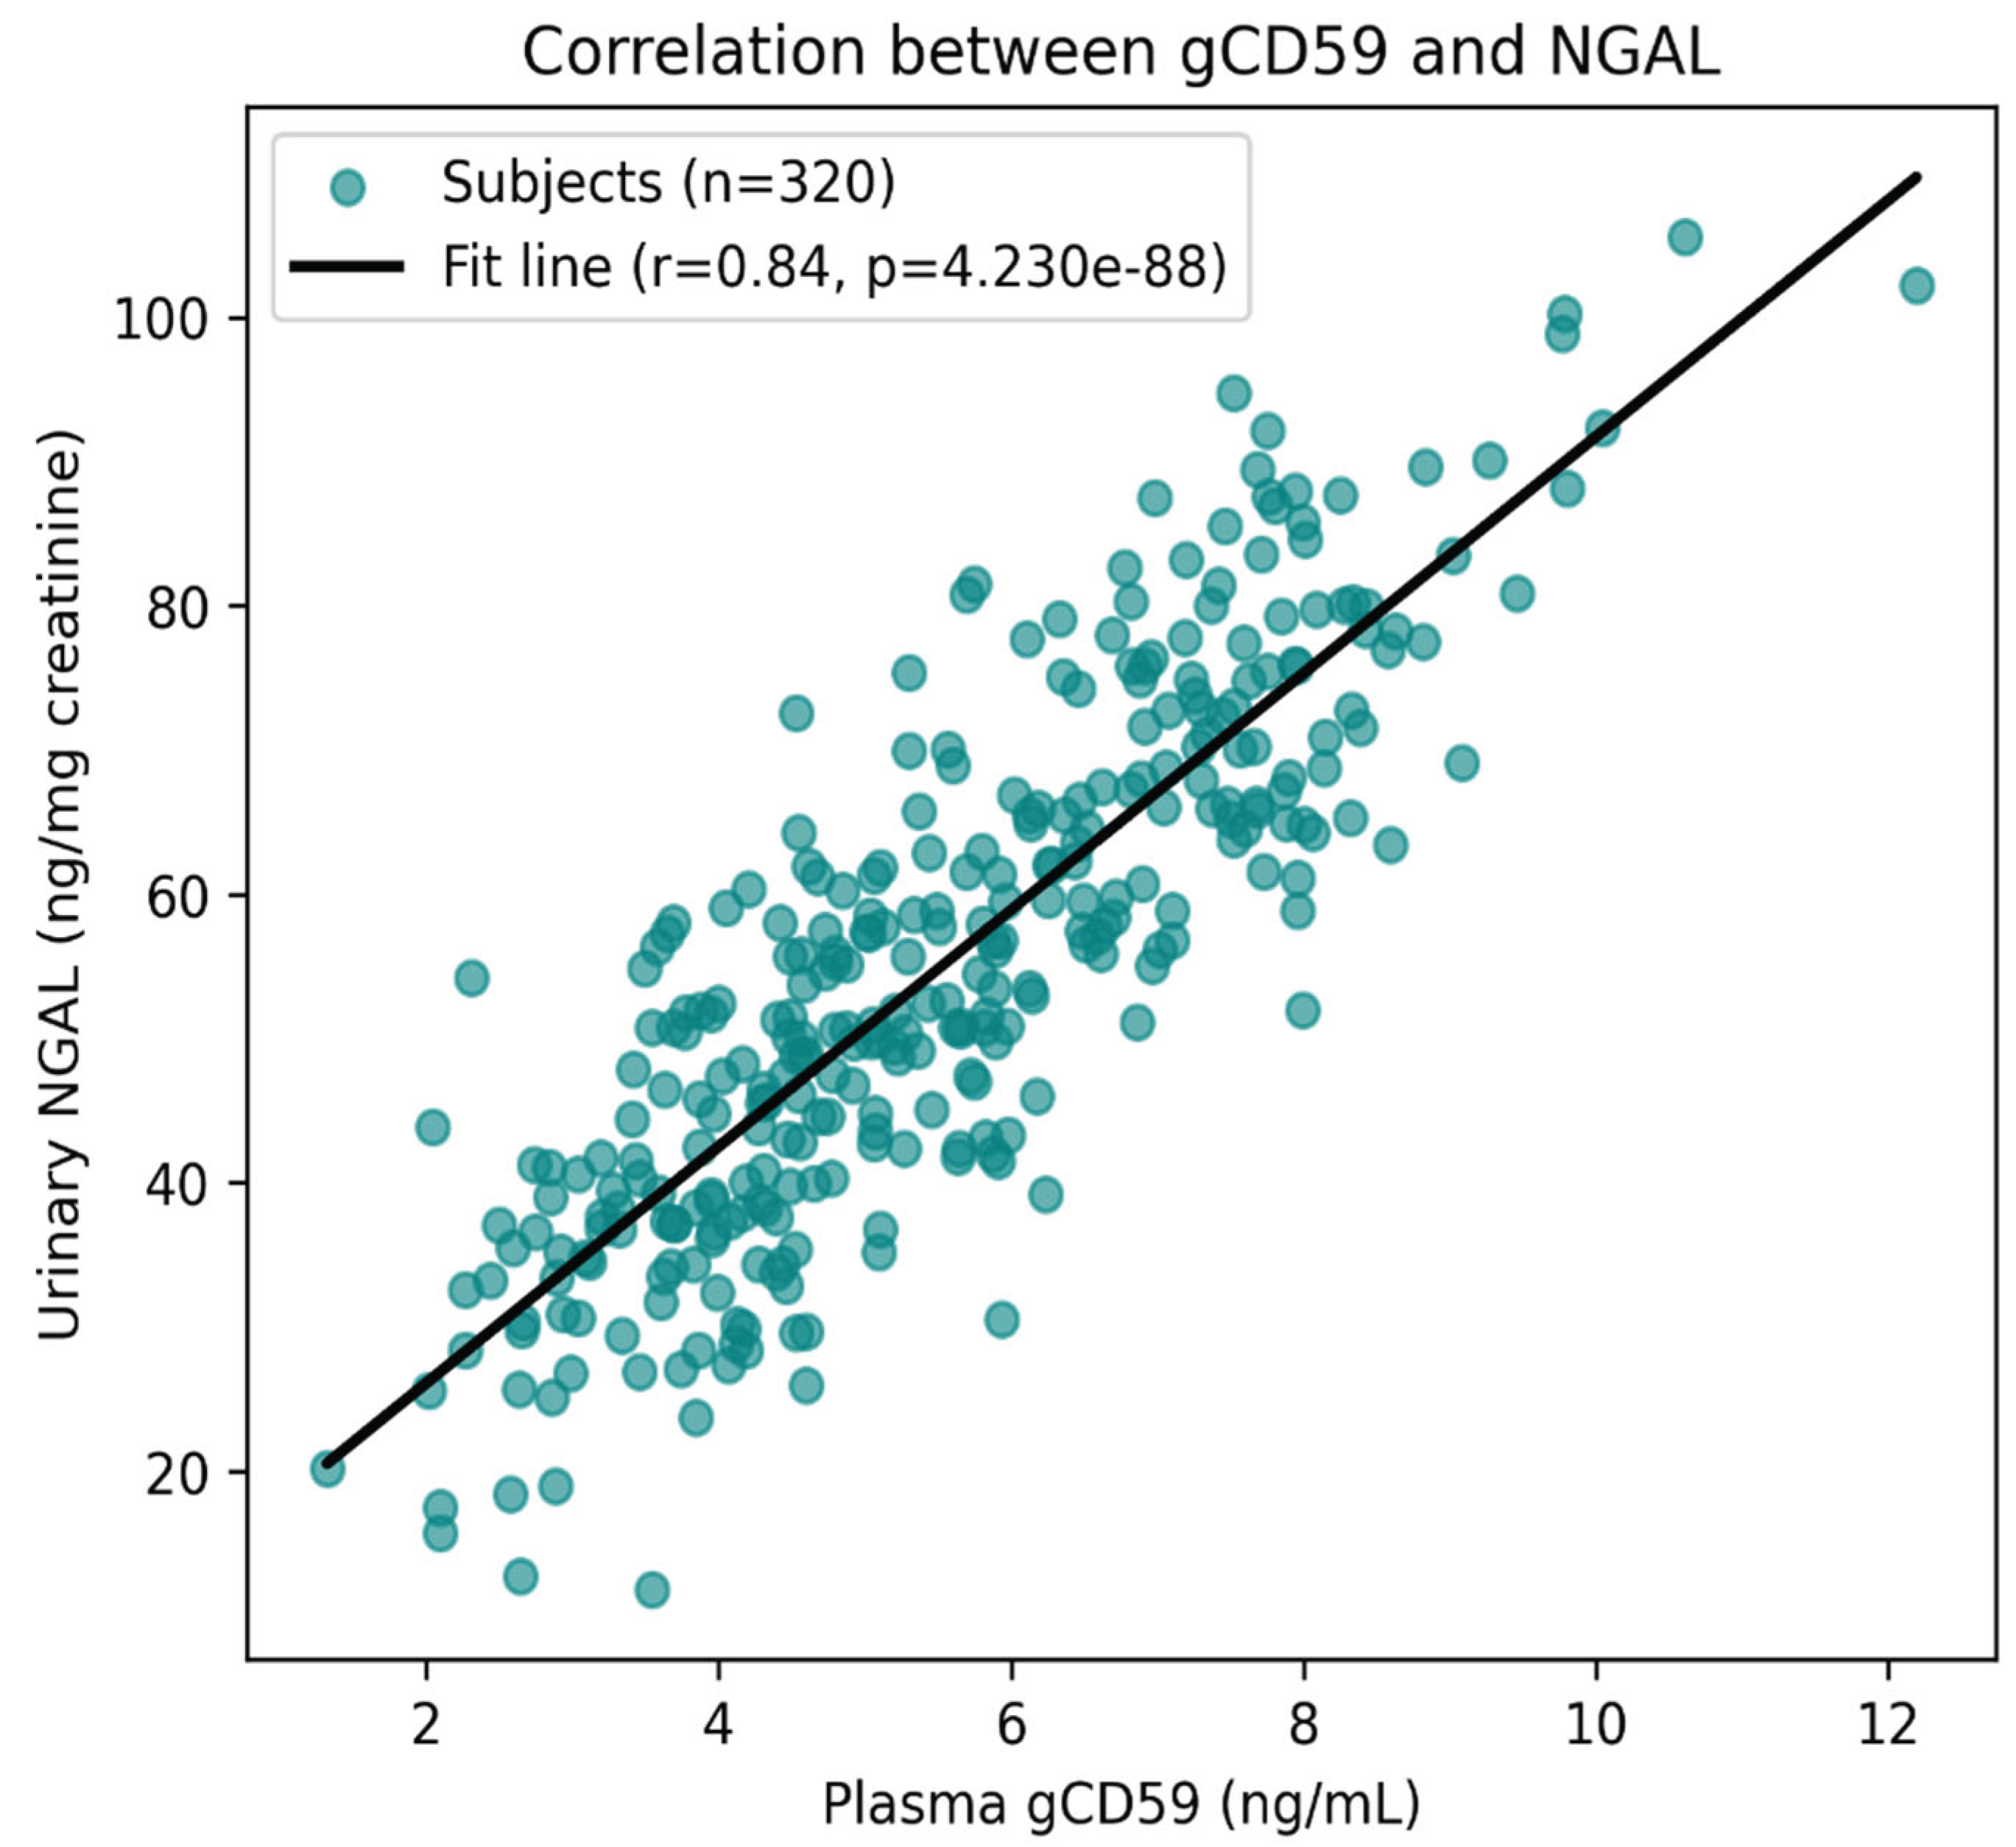
Beyond this strong association, correlation analysis demonstrated that plasma gCD59 levels were also positively related to other biomarkers of renal and metabolic dysfunction. Significant positive correlations were found between gCD59 and urinary NGAL/KIM-1 (r = 0.58, p < 0.001), reflecting tubular injury, as well as with HbA1c (r = 0.55, p < 0.001), highlighting the link between poor glycaemic control and biomarker elevation (
Figure 7). gCD59 additionally showed a moderate positive association with hs-CRP (r = 0.41, p < 0.001), suggesting an inflammatory component to its rise. In contrast, a negative correlation was observed between gCD59 and estimated glomerular filtration rate (eGFR) (r = –0.49, p < 0.001), indicating that higher gCD59 levels were associated with declining renal function.
Taken together, these results emphasize that gCD59 is strongly interconnected not only with complement activation but also with glycaemic burden, tubular damage, inflammation, and renal impairment, supporting its role as an integrative biomarker in the pathophysiology of DN.
Multivariate Regression Analysis
The multivariate logistic regression analysis was performed to identify factors independently associated with the presence of microalbuminuria in patients with T2DM. Adjustments were made for potential confounders, including age, sex, HbA1c, lipid parameters, and the use of reno-protective medications such as ACE inhibitors/ARBs and SGLT2 inhibitors.
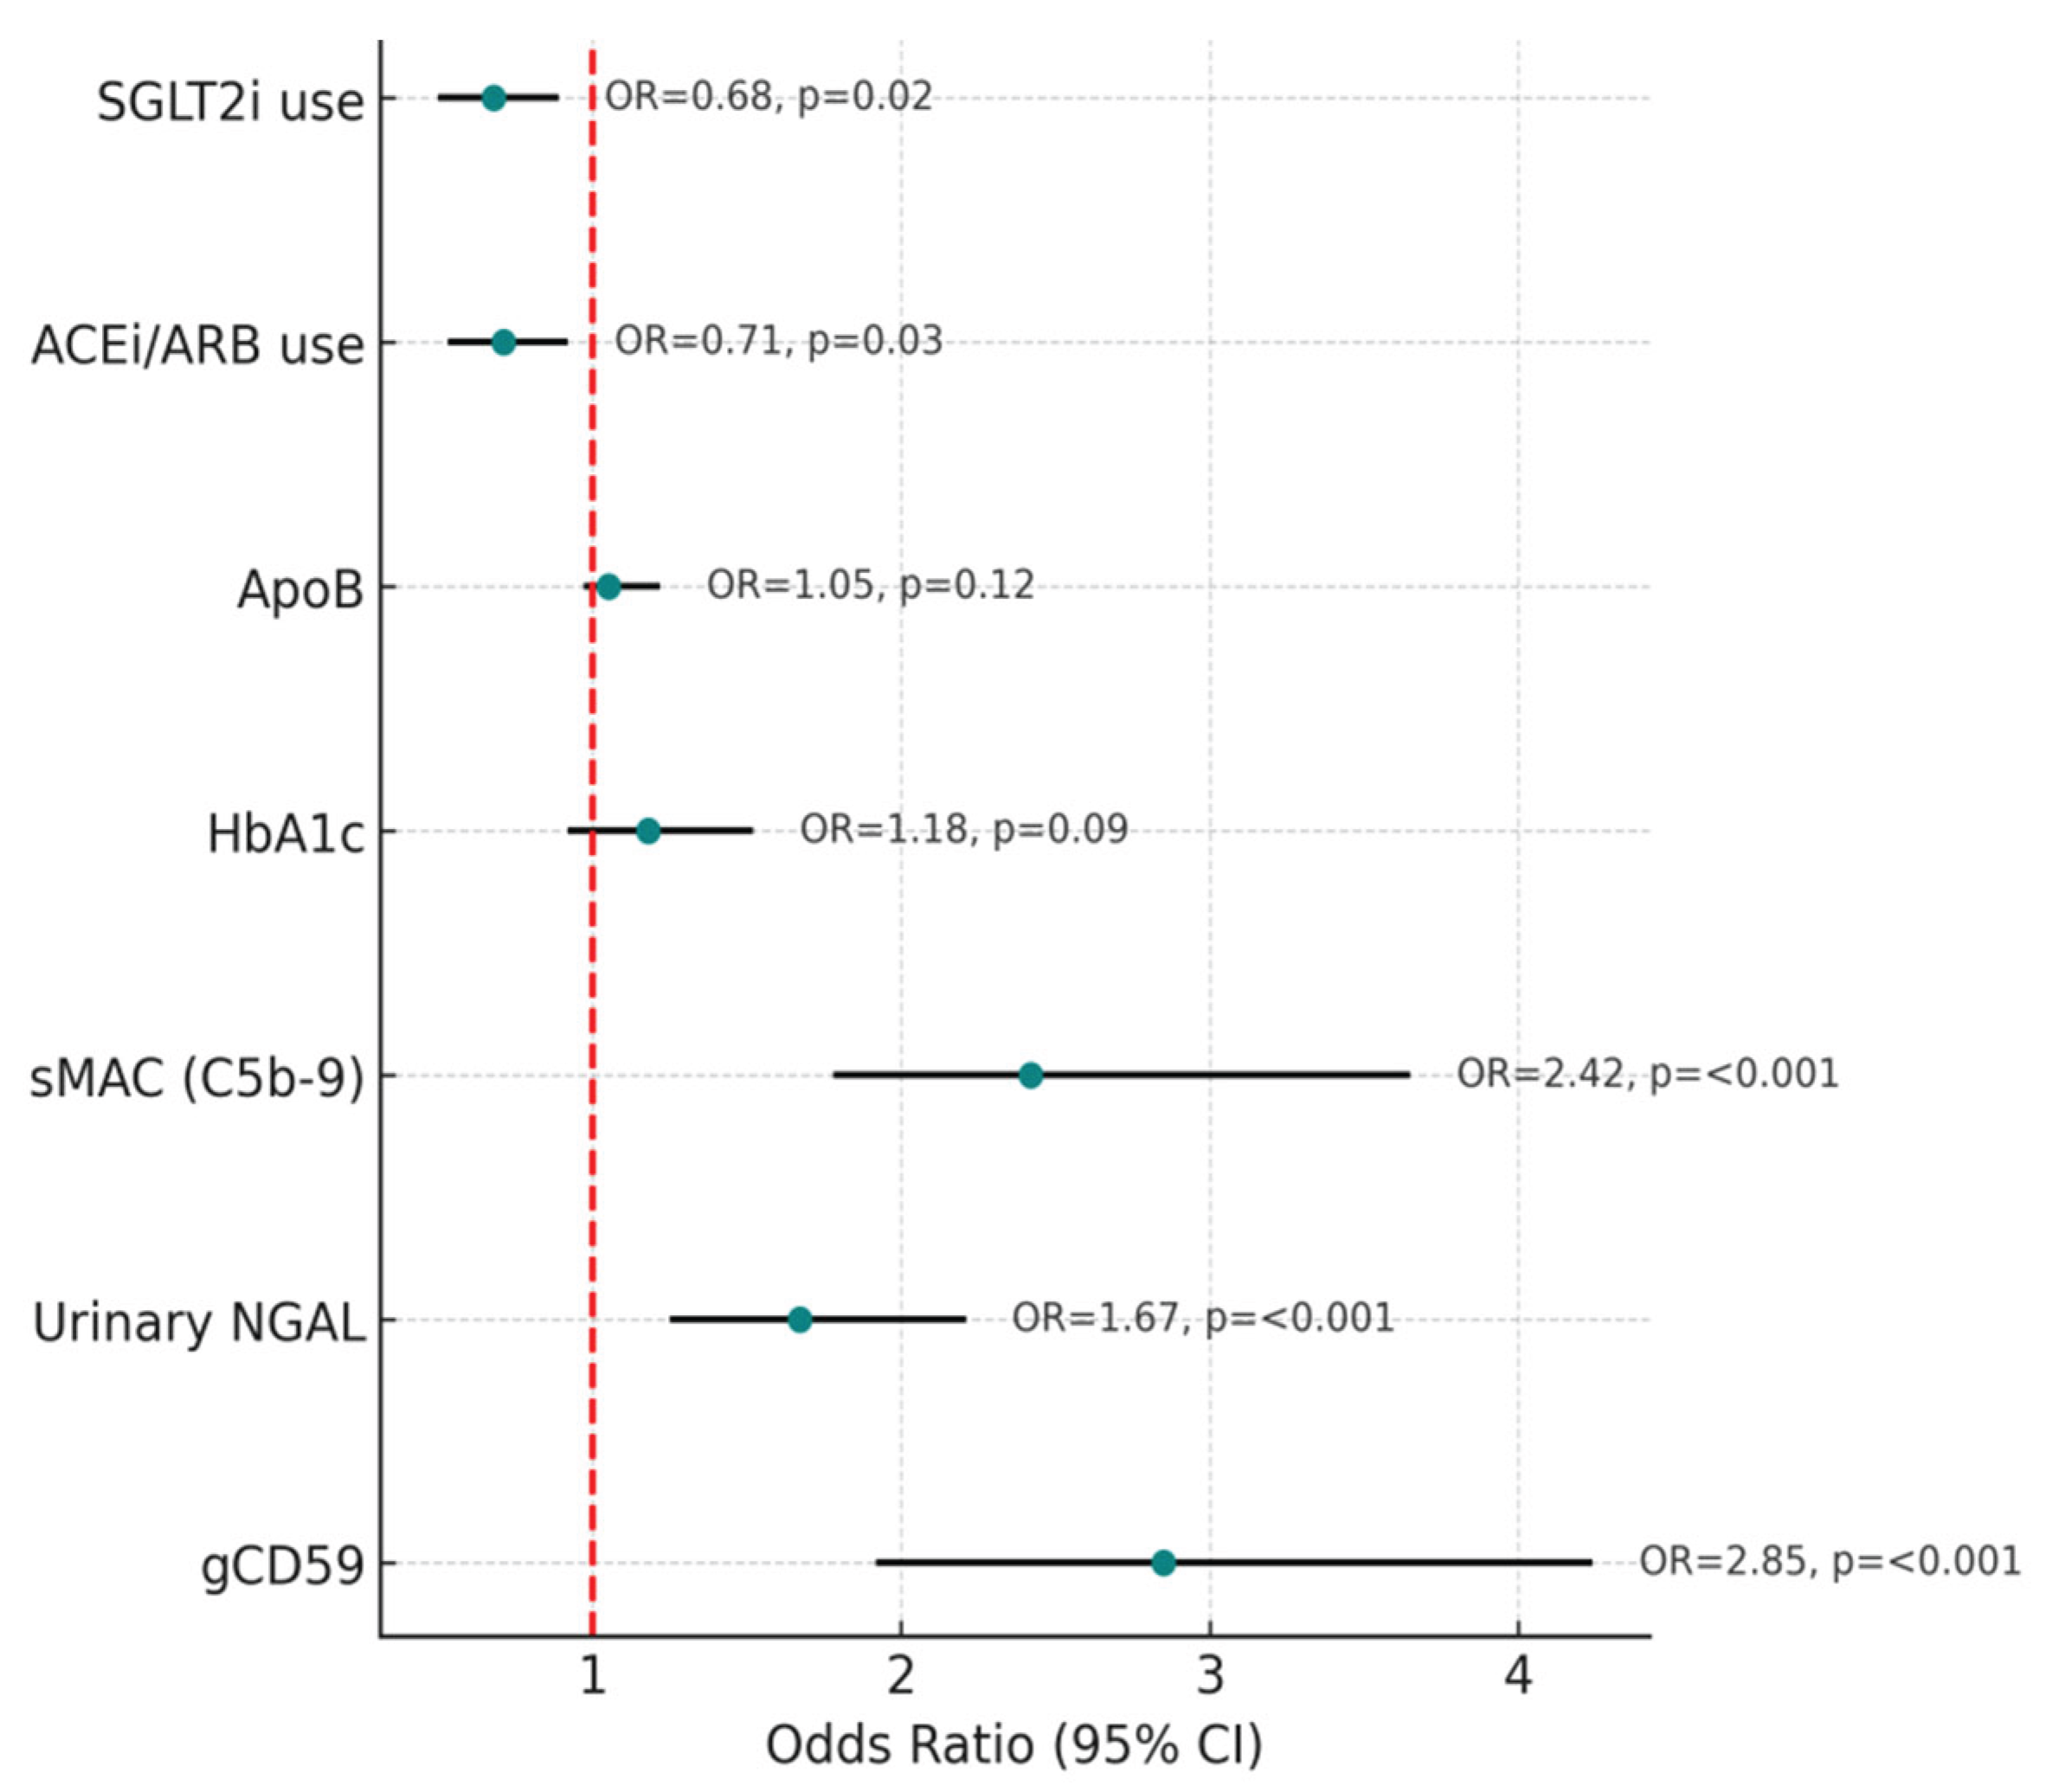
The results revealed that three biomarkers stood out as strong independent predictors of microalbuminuria: gCD59, NGAL, and sMAC. Elevated gCD59 levels were associated with almost a threefold increased risk of microalbuminuria (odds ratio [OR] 2.85; 95% confidence interval [CI] 1.92–4.24; p < 0.001). Similarly, higher urinary NGAL levels, indicative of tubular injury, were linked to an increased risk (OR 1.67; 95% CI 1.25–2.21; p < 0.001). Complement activation, reflected by sMAC, was also strongly predictive, with more than a twofold increased risk (OR 2.42; 95% CI 1.78–3.65; p < 0.001) (
Figure 8).
In contrast, HbA1c and ApoB, although elevated in univariate analysis, did not retain statistical significance after adjustment in the multivariate model (HbA1c: OR 1.18, p = 0.09; ApoB: OR 1.05, p = 0.12). This suggests that the impact of glycaemic burden and lipid abnormalities on microalbuminuria may be partly mediated through pathways involving tubular stress and complement activation.
The influence of medication use was also notable. Patients receiving ACE inhibitors or ARBs demonstrated lower circulating gCD59 (p = 0.03) and sMAC levels (p = 0.02), suggesting a beneficial effect of these agents in attenuating complement-mediated damage. Similarly, SGLT2 inhibitor use was associated with significantly higher eGFR (p = 0.01) and reduced urinary NGAL levels (p = 0.04), underscoring their reno-protective role by mitigating tubular injury and preserving renal function (
Table 3).
Together, these findings highlight that gCD59, NGAL, and sMAC are not only elevated in diabetic patients with microalbuminuria but also serve as independent predictors of its presence, even after adjusting for conventional risk factors. The protective effects observed with ACEi/ARB and SGLT2i further emphasize the relevance of these biomarkers in monitoring treatment response and in guiding early therapeutic strategies for diabetic nephropathy.
Discussion
This study provides new insights into the clinical and mechanistic role of gCD59 in DN. We demonstrated that patients with microalbuminuria exhibited significantly higher levels of gCD59, tubular injury markers, endothelial dysfunction molecules, and complement activation compared with normoalbuminuric controls. Importantly, multivariate analysis identified gCD59, urinary NGAL, and sMAC as independent predictors of microalbuminuria, suggesting their potential as early, mechanistically relevant biomarkers of DN progression.
Our data highlight the strong relationship between gCD59 and sMAC, consistent with the hypothesis that non-enzymatic glycation of CD59 compromises its regulatory role in the complement pathway. This allows uncontrolled assembly of C5b-9 complexes, contributing to glomerular and tubular injury. Experimental work has shown that CD59 protects against complement-mediated cell lysis and that its glycation under hyperglycaemic conditions renders cells vulnerable to complement attack [
16]. Clinical observations have also linked elevated plasma gCD59 with microvascular complications such as retinopathy and nephropathy, supporting its translational relevance [
8,
17]. Recent studies in diabetic kidney disease cohorts confirmed that gCD59 correlates with both renal functional decline and histopathological markers of complement activation [
18]. Our findings therefore extend the literature by demonstrating a robust clinical association between gCD59 and sMAC in a well-characterised T2DM cohort.
Tubular injury is increasingly recognised as a driver of DN progression, rather than being solely a consequence of glomerular dysfunction. In our study, urinary NGAL and KIM-1 levels were significantly elevated in patients with microalbuminuria and correlated with gCD59. These findings align with previous reports showing that NGAL and KIM-1 are sensitive markers of early tubular injury and predict renal decline even in the absence of macroalbuminuria [
19,
20]. Bolignano et al. demonstrated that NGAL rises before overt changes in serum creatinine and can serve as an early warning signal for tubular stress [
21]. Similarly, KIM-1 expression has been linked to proximal tubular injury in both experimental and clinical settings [
22]. By demonstrating correlations between gCD59 and tubular markers, our data suggest that complement dysregulation may accelerate tubular injury, reinforcing the concept that glomerular, tubular, and inflammatory pathways converge in DN pathogenesis.
We also found that gCD59 levels correlated with systemic inflammation, as reflected by hs-CRP, and with endothelial dysfunction markers sICAM-1 and sVCAM-1. The role of inflammation in DN has been widely reported, with cytokines and adhesion molecules contributing to leukocyte infiltration, endothelial activation, and progressive fibrosis [
23,
24]. Mezzano et al. showed that chemokines and adhesion molecules are overexpressed in diabetic kidneys, linking vascular inflammation with disease progression [
25]. Our results confirm and extend these findings by positioning gCD59 as an integrative marker that reflects both complement-driven injury and inflammatory responses.
Although HbA1c was higher in the microalbuminuria group, it did not remain significant in multivariate models, suggesting that glycaemic burden alone does not fully explain DN risk. This is consistent with studies showing that glycaemic control, while important, cannot completely predict which patients develop nephropathy [
26]. 13. Perkovic et al. (2019) reported that a subset of patients experience regression of microalbuminuria despite persistent hyperglycaemia, highlighting the influence of non-glycaemic mechanisms [
26]. Similarly, Heerspink et al. (2020) demonstrated that eGFR decline can occur independently of albuminuria, pointing toward heterogeneous disease pathways [
28]. Our findings add to this evolving understanding by identifying gCD59 and sMAC as biomarkers that capture pathogenic processes not reflected by HbA1c.
The regression analysis revealed that gCD59, urinary NGAL, and sMAC were independent predictors of microalbuminuria. This is clinically important, as these markers reflect three complementary aspects of DN pathology: hyperglycaemia-induced complement dysregulation (gCD59), tubular stress (NGAL), and terminal complement activation (sMAC). In contrast, HbA1c and ApoB lost significance in adjusted models, indicating that conventional markers may be less reliable when mechanistic biomarkers are considered. Forest plots from similar biomarker studies confirm that tubular and inflammatory markers often outperform traditional measures in predicting renal outcomes [
29,
30].
Our analysis also revealed that reno-protective therapies were associated with modulation of biomarker levels. Patients receiving ACE inhibitors or ARBs had lower gCD59 and sMAC, consistent with previous evidence that blockade of the renin–angiotensin system reduces complement activation and endothelial injury [
31]. Similarly, SGLT2 inhibitor use was linked with higher eGFR and lower NGAL, echoing findings from large clinical trials such as CREDENCE and DAPA-CKD, which showed robust reno-protective effects of SGLT2 inhibitors [27, 28]. These observations suggest that gCD59 and related markers may be valuable for monitoring treatment response in clinical practice.
Strengths and Limitations
The strengths of this study include a relatively large, well-defined cohort, simultaneous measurement of glomerular, tubular, inflammatory, and complement markers, and adjustment for major confounders. However, the cross-sectional design limits our ability to infer causality or assess temporal changes in biomarker trajectories. Longitudinal studies are required to determine whether gCD59 can predict incident nephropathy or progression to end-stage kidney disease. In addition, assay variability and lack of standardised cut-off values for gCD59 remain barriers to clinical translation.
Clinical Implications
From a clinical perspective, our findings suggest that gCD59 could serve as a novel biomarker for risk stratification in DN, particularly when combined with tubular and complement markers. Measuring gCD59 alongside albuminuria and eGFR may enable earlier identification of high-risk patients, guiding timely initiation of reno-protective therapies. Furthermore, because gCD59 levels appear responsive to ACEi/ARB and SGLT2i use, they may be useful in monitoring therapeutic efficacy. Ultimately, incorporating gCD59 into biomarker panels could shift DN management toward more personalised, mechanism-based care.
Conclusions
This study demonstrates that gCD59 is significantly elevated in patients with type 2 diabetes and microalbuminuria and is strongly associated with complement activation, tubular injury, systemic inflammation, and endothelial dysfunction. Multivariate analysis identified gCD59, urinary NGAL, and sMAC as independent predictors of microalbuminuria, underscoring their clinical value beyond traditional markers such as HbA1c and albuminuria. Furthermore, the modulatory effects of ACE inhibitors/ARBs and SGLT2 inhibitors on biomarker levels highlight the therapeutic relevance of these pathways in preserving renal function.
Taken together, our findings suggest that gCD59 may serve as a novel integrative biomarker for the early detection and risk stratification of diabetic nephropathy. Incorporating gCD59 into multi-marker panels alongside tubular and complement activation markers could enhance clinical decision-making and guide the timely initiation of reno-protective therapies. Longitudinal studies are warranted to validate its prognostic utility and explore its role in monitoring therapeutic response.
Acknowledgements
The authors sincerely thank the patients who participated in this study and the clinical staff of Mahatma Gandhi Memorial Hospital, Hanumakonda, for their support in patient recruitment and sample collection. The authors also appreciate the constructive inputs from colleagues and collaborators that helped refine the study design and analysis.
Conflict of Interest
This study was supported by institutional research grants from Kakatiya Medical College, Hanumakonda. No external commercial funding was received. The funding body had no role in study design, data collection, analysis, interpretation of results, or the writing of the manuscript.
Funding
The authors declare that there are no conflicts of interest related to this work. The research was conducted in the absence of any commercial or financial relationships that could be construed as a potential conflict of interest.
CRediT authorship taxonomy
R.K. and C.K. were responsible for the conceptualization of the study and development of the methodology. C.K. and W.M. coordinated patient recruitment, clinical data collection, and laboratory investigations, while R.K. and C.K. curated and analysed the data, performed statistical interpretation, and ensured accuracy of the findings. W.M. contributed essential resources and technical support during the biomarker assays. The original draft of the manuscript was prepared by R.K. and C.K., with all authors contributing to critical review and editing. R.K. provided overall supervision of the project. All authors have read and approved the final version of the manuscript. Abbreviations used in this study include: T2DM, type 2 diabetes mellitus; DN, diabetic nephropathy; gCD59, glycated cluster of differentiation 59; HbA1c, glycated haemoglobin; eGFR, estimated glomerular filtration rate; NGAL, neutrophil gelatinase-associated lipocalin; KIM-1, kidney injury molecule-1; hs-CRP, high-sensitivity C-reactive protein; ApoB, apolipoprotein B; sICAM-1, soluble intercellular adhesion molecule-1; sVCAM-1, soluble vascular cell adhesion molecule-1; sMAC, soluble membrane attack complex (C5b-9); ACEi, angiotensin-converting enzyme inhibitor; ARB, angiotensin receptor blocker; SGLT2i, sodium-glucose co-transporter-2 inhibitor; BMI, body mass index; BP, blood pressure; OR, odds ratio; CI, confidence interval.
References
- Forbes, J.M.; Cooper, M.E. Mechanisms of diabetic complications. Physiol Rev. 2013, 93, 137–188. [Google Scholar] [CrossRef]
- Alicic, R.Z.; Rooney, M.T.; Tuttle, K.R. Diabetic Kidney Disease: Challenges, Progress, and Possibilities. Clin J Am Soc Nephrol. 2017, 12, 2032–2045. [Google Scholar] [CrossRef]
- Inker, L.A.; Astor, B.C.; Fox, C.H.; et al. KDOQI US commentary on the 2012 KDIGO clinical practice guideline for the evaluation and management of CKD. Am J Kidney Dis. 2014, 63, 713–735. [Google Scholar] [CrossRef]
- Bus, P.; Chua, J.S.; Klessens, C.Q.F.; et al. Complement Activation in Patients With Diabetic Nephropathy. Kidney Int Rep. 2017, 3, 302–313, Published 2017 Oct 16. [Google Scholar] [CrossRef]
- Couves, E.C.; Gardner, S.; Voisin, T.B.; Bickel, J.K.; Stansfeld, P.J.; Tate, E.W.; Bubeck, D. Structural basis for membrane attack complex inhibition by CD59. Nat Commun. 2023, 14, 890. [Google Scholar] [CrossRef]
- Ghosh, P.; Vaidya, A.; Sahoo, R.; et al. Glycation of the complement regulatory protein CD59 is a novel biomarker for glucose handling in humans. J Clin Endocrinol Metab. 2014, 99, E999–E1006. [Google Scholar] [CrossRef]
- Yilmaz, O.; Erinc, O.; Gungordu, A.G.; Erdogan, M.; Algemi, M.; Akarsu, M. The Relationship of the Plasma Glycated CD59 Level with Microvascular Complications in Diabetic Patients and Its Evaluation as a Predictive Marker. J Clin Med. 2025, 14, 4588. [Google Scholar] [CrossRef] [PubMed]
- Ghosh, P.; Sahoo, R.; Vaidya, A.; et al. A specific and sensitive assay for blood levels of glycated CD59: a novel biomarker for diabetes. Am J Hematol. 2013, 88, 670–676. [Google Scholar] [CrossRef] [PubMed]
- Wang, W.; Xu, C.; Lu, X.; et al. Glycated CD59 is a potential biomarker for gestational diabetes mellitus. Front Endocrinol (Lausanne). 2024, 15, 1374253, Published 2024 Sep 16. [Google Scholar] [CrossRef] [PubMed]
- Bogdanet, D.; Luque-Fernandez, M.A.; Toth-Castillo, M.; Desoye, G.; O’Shea, P.M.; Dunne, F.P.; Halperin, J.A. The role of early pregnancy maternal pGCD59 levels in predicting neonatal hypoglycemia—subanalysis of the DALI study. J Clin Endocrinol Metab. 107, e4311–e4319. [CrossRef]
- World Medical Association. WMA declaration of Helsinki: ethical principles for medical research involving human subjects. First adopted in June 1964, and last amended in October 2013. Available at: https://www.wma.net/policies-post/wma-declaration-of-helsinki-ethical-principles-for-medical-research-involving-human-subjects (Accessed August 25, 2023).
- Kurihara, C.; Kerpel-Fronius, S.; Becker, S.; Chan, A.; Nagaty, Y.; Naseem, S.; Schenk, J.; Matsuyama, K.; Baroutsou, V. Declaration of Helsinki: ethical norm in pursuit of common global goals. Front Med (Lausanne). 2024, 11, 1360653. [Google Scholar] [CrossRef]
- Shrestha, B.; Dunn, L. The Declaration of Helsinki on Medical Research involving Human Subjects: A Review of Seventh Revision. J Nepal Health Res Counc. 2020, 17, 548–552. [Google Scholar] [CrossRef]
- American Diabetes Association Professional Practice Committee; 2. Diagnosis and Classification of Diabetes: Standards of Care in Diabetes—2025. Diabetes Care 2025, (Supplement_1), S27–S49. [CrossRef]
- Naidoo, D.P. The link between microalbuminuria, endothelial dysfunction and cardiovascular disease in diabetes. Cardiovasc J S Afr. 2002, 13, 194–199. [Google Scholar]
- Acosta, J.; Hettinga, J.; Flückiger, R.; et al. Molecular basis for a link between complement and the vascular complications of diabetes. Proc Natl Acad Sci U S A. 2000, 97, 5450–5455. [Google Scholar] [CrossRef]
- KDIGO2024 Clinical Practice Guideline for the Evaluation and Management of Chronic Kidney Disease Stevens Paul, E. et al. Kidney International 105, S117–S314.
- Yilmaz, O.; Demir, S.; Arslan, U.; Koc, A.; Kaya, E. Plasma glycated CD59 and microvascular complications in type 2 diabetes mellitus: a cross-sectional study. International Journal of Clinical Practice. 2025, 79, e15672. [Google Scholar]
- Nielsen, S.E.; Andersen, S.; Zdunek, D.; Hess, G.; Parving, H.H.; Rossing, P. Tubular markers do not predict the decline in glomerular filtration rate in type 1 diabetic patients with overt nephropathy. Kidney Int. 2011, 79, 1113–1118. [Google Scholar] [CrossRef] [PubMed]
- Bolignano, D.; Donato, V.; Coppolino, G.; Campo, S.; Buemi, A.; Lacquaniti, A.; Buemi, M. Neutrophil gelatinase-associated lipocalin (NGAL) as a marker of kidney damage. American Journal of Kidney Diseases. 2008, 52, 595–605. [Google Scholar] [CrossRef] [PubMed]
- Vaidya, V.S.; Ramirez, V.; Ichimura, T.; Bobadilla, N.A.; Bonventre, J.V. Urinary kidney injury molecule-1: a sensitive quantitative biomarker for early detection of kidney tubular injury. Am J Physiol Renal Physiol. 2006, 290, F517–F529. [Google Scholar] [CrossRef]
- Mezzano, S.A.; Droguett, M.A.; Burgos, M.E.; et al. Overexpression of chemokines, fibrogenic cytokines, and myofibroblasts in human membranous nephropathy. Kidney Int. 2000, 57, 147–158. [Google Scholar] [CrossRef]
- Navarro-González, J.F.; Mora-Fernández, C. The role of inflammatory cytokines in diabetic nephropathy. J Am Soc Nephrol. 2008, 19, 433–442. [Google Scholar] [CrossRef]
- Perkins, B.A.; Ficociello, L.H.; Silva, K.H.; Finkelstein, D.M.; Warram, J.H.; Krolewski, A.S. Regression of microalbuminuria in type 1 diabetes. N Engl J Med. 2003, 348, 2285–2293. [Google Scholar] [CrossRef]
- Afkarian, M.; Sachs, M.C.; Kestenbaum, B.; Hirsch, I.B.; Tuttle, K.R.; Himmelfarb, J.; de Boer, I.H. Kidney disease and increased mortality risk in type 2 diabetes. Journal of the American Society of Nephrology. 2013, 24, 302–8. [Google Scholar] [CrossRef] [PubMed]
- Ruggenenti, P.; Perna, A.; Remuzzi, G. ACE inhibitors to prevent end-stage renal disease: when to start and why possibly never to stop: a post hoc analysis of the REIN trial results. Ramipril Efficacy in Nephropathy. J Am Soc Nephrol. 2001, 12, 2832–2837. [Google Scholar] [CrossRef]
- Perkovic, V.; Jardine, M.J.; Neal, B.; et al. Canagliflozin and Renal Outcomes in Type 2 Diabetes and Nephropathy. N Engl J Med. 2019, 380, 2295–2306. [Google Scholar] [CrossRef] [PubMed]
- Heerspink, H.J.L.; Stefánsson, B.V.; Correa-Rotter, R.; et al. Dapagliflozin in Patients with Chronic Kidney Disease. N Engl J Med. 2020, 383, 1436–1446. [Google Scholar] [CrossRef] [PubMed]
- Thomas, M.C.; Brownlee, M.; Susztak, K.; et al. Diabetic kidney disease. Nat Rev Dis Primers. 2015, 1, 15018, Published 2015 Jul 30. [Google Scholar] [CrossRef] [PubMed]
- Coca, S.G.; Nadkarni, G.N.; Huang, Y.; et al. Plasma Biomarkers and Kidney Function Decline in Early and Established Diabetic Kidney Disease. J Am Soc Nephrol. 2017, 28, 2786–2793. [Google Scholar] [CrossRef]
- Holtkamp, F.A.; de Zeeuw, D.; de Graeff, P.A.; et al. Albuminuria and blood pressure, independent targets for cardioprotective therapy in patients with diabetes and nephropathy: a post hoc analysis of the combined RENAAL and IDNT trials. Eur Heart J. 2011, 32, 1493–1499. [Google Scholar] [CrossRef]
Figure 2.
Plasma gCD59 levels in T2DM with and without microalbuminuria. Bars represent mean ± SEM. Normoalbuminuria group (n = 160) and microalbuminuria group (n = 160). Patients with microalbuminuria had significantly higher gCD59 levels (p < 0.001, χ² = 25.6).
Figure 2.
Plasma gCD59 levels in T2DM with and without microalbuminuria. Bars represent mean ± SEM. Normoalbuminuria group (n = 160) and microalbuminuria group (n = 160). Patients with microalbuminuria had significantly higher gCD59 levels (p < 0.001, χ² = 25.6).
Figure 3.
Urinary neutrophil gelatinase-associated lipocalin (NGAL) levels in type 2 diabetes patients with and without microalbuminuria. Bars represent mean ± SEM. NGAL levels were markedly elevated in the microalbuminuria group (p < 0.001, χ² = 28.3), reflecting tubular injury.
Figure 3.
Urinary neutrophil gelatinase-associated lipocalin (NGAL) levels in type 2 diabetes patients with and without microalbuminuria. Bars represent mean ± SEM. NGAL levels were markedly elevated in the microalbuminuria group (p < 0.001, χ² = 28.3), reflecting tubular injury.
Figure 4.
Plasma soluble membrane attack complex (sMAC, C5b-9) levels in type 2 diabetes patients with and without microalbuminuria. Bars represent mean ± SEM. Patients with microalbuminuria showed significantly higher sMAC levels, consistent with complement activation (p < 0.001, χ² = 31.2).
Figure 4.
Plasma soluble membrane attack complex (sMAC, C5b-9) levels in type 2 diabetes patients with and without microalbuminuria. Bars represent mean ± SEM. Patients with microalbuminuria showed significantly higher sMAC levels, consistent with complement activation (p < 0.001, χ² = 31.2).
Figure 5.
eGFR in T2DM patients with and without microalbuminuria. Bars represent mean ± SD. eGFR was significantly lower in the microalbuminuria group (p < 0.001), indicating early renal functional decline.
Figure 5.
eGFR in T2DM patients with and without microalbuminuria. Bars represent mean ± SD. eGFR was significantly lower in the microalbuminuria group (p < 0.001), indicating early renal functional decline.
Figure 6.
Correlation between plasma gCD59 and sMAC in T2DM. Scatter plot with regression line (black) showing a significant positive association (r = 0.62, p < 0.001). Each point represents an individual subject.
Figure 6.
Correlation between plasma gCD59 and sMAC in T2DM. Scatter plot with regression line (black) showing a significant positive association (r = 0.62, p < 0.001). Each point represents an individual subject.
Figure 7.
Correlation between plasma gCD59 and urinary NGAL in T2DM. Scatter plot with regression line (black) showing a significant positive correlation (r = 0.58, p < 0.001). Each point represents an individual subject.
Figure 7.
Correlation between plasma gCD59 and urinary NGAL in T2DM. Scatter plot with regression line (black) showing a significant positive correlation (r = 0.58, p < 0.001). Each point represents an individual subject.
Figure 8.
Forest plot showing the results of multivariate logistic regression analysis for predictors of microalbuminuria in patients with T2DM. OR with 95% CI are displayed for each variable. Plasma gCD59, urinary NGAL, and sMAC, C5b-9 were identified as independent predictors, each showing a statistically significant association with the presence of microalbuminuria (all p < 0.001). Use of reno-protective medications such as ACE inhibitors/ARBs and SGLT2 inhibitors was associated with a reduced likelihood of microalbuminuria (p = 0.03 and p = 0.02, respectively). HbA1c and ApoB did not retain significance after adjustment for confounders. The vertical dashed red line represents the null value (OR = 1).
Table 1.
Baseline demographic and clinical characteristics of the study groups.
Table 1.
Baseline demographic and clinical characteristics of the study groups.
| Parameter |
Normoalbuminuria
(n = 160)
|
Microalbuminuria
(n = 160)
|
p value |
| Age (years) |
55.1 ± 8.4 |
56.2 ± 8.0 |
0.21 |
| Male gender, n (%) |
83 (51.9) |
87 (54.3) |
0.64* |
| Duration of diabetes (y) |
8.2 ± 3.5 |
10.8 ± 3.9 |
<0.001 |
| BMI (kg/m²) |
27.4 ± 3.2 |
27.9 ± 3.6 |
0.27 |
| HbA1c (%) |
7.8 ± 1.1 |
8.9 ± 1.3 |
<0.001 |
| Systolic BP (mmHg) |
131 ± 14 |
138 ± 16 |
0.002 |
Table 2.
Comparison of biochemical and biomarker parameters between groups.
Table 2.
Comparison of biochemical and biomarker parameters between groups.
| Parameter |
Normoalbuminuria (n=160) |
Microalbuminuria (n=160) |
p value |
| HbA1c (%) |
7.8 ± 1.1 |
8.9 ± 1.3 |
<0.001 |
| eGFR (mL/min/1.73m²) |
85.4 ± 13.8 |
68.2 ± 12.5 |
<0.001 |
| gCD59 (ng/mL) |
4.2 ± 1.1 |
6.8 ± 1.4 |
<0.001 |
| NGAL (ng/mg creat.) |
36.4 ± 12.3 |
58.2 ± 14.9 |
<0.001 |
| KIM-1 (ng/mg creat.) |
3.1 ± 0.9 |
5.2 ± 1.4 |
<0.001 |
| hs-CRP (mg/L) |
2.7 ± 0.9 |
4.2 ± 1.3 |
<0.001 |
| sICAM-1 (ng/mL) |
256 ± 35 |
320 ± 42 |
<0.001 |
| sVCAM-1 (ng/mL) |
490 ± 78 |
640 ± 85 |
<0.001 |
| ApoB (mg/dL) |
96 ± 15 |
110 ± 18 |
<0.001 |
| sMAC (ng/mL) |
210 ± 52 |
320 ± 65 |
<0.001 |
Table 3.
Multivariate logistic regression analysis for predictors of microalbuminuria.
Table 3.
Multivariate logistic regression analysis for predictors of microalbuminuria.
| Variable |
Odds Ratio (OR) |
95% CI |
p value |
| gCD59 |
2.85 |
1.92–4.24 |
<0.001 |
| Urinary NGAL |
1.67 |
1.25–2.21 |
<0.001 |
| sMAC (C5b-9) |
2.42 |
1.78–3.65 |
<0.001 |
| HbA1c |
1.18 |
0.92–1.52 |
0.09 |
| ApoB |
1.05 |
0.97–1.22 |
0.12 |
| ACEi/ARB |
0.71 |
0.53–0.92 |
0.03 |
| SGLT2i |
0.68 |
0.50–0.89 |
0.02 |
|
Disclaimer/Publisher’s Note: The statements, opinions and data contained in all publications are solely those of the individual author(s) and contributor(s) and not of MDPI and/or the editor(s). MDPI and/or the editor(s) disclaim responsibility for any injury to people or property resulting from any ideas, methods, instructions or products referred to in the content. |
© 2025 by the authors. Licensee MDPI, Basel, Switzerland. This article is an open access article distributed under the terms and conditions of the Creative Commons Attribution (CC BY) license (http://creativecommons.org/licenses/by/4.0/).