Submitted:
09 June 2025
Posted:
11 June 2025
You are already at the latest version
Abstract
Against the backdrop of profound restructuring in global climate governance, China’s energy management system is undergoing a comprehensive transition from dual energy consumption control to dual carbon emissions control. This policy shift fundamentally the underlying logic of energy-focused regulation and inevitably impacts the Economy-Energy-Environment (3E) system. Innovatively proposing a "Triangular Trinity" theoretical framework-integrating internal, intermediate, and external triangular couplings -this study systematically analyzes the transition’s effects on Guangdong Province’s 3E system, revealing the restructuring logic and mechanisms of dual carbon control on 3E coupling coordination. Key findings include: (1) Policy efficacy evolution: During 2005–2016, dual energy control significantly improved energy conservation and emissions reduction, elevating Guangdong’s 3E coupling coordination. Post-2017, however, its singular focus on total energy consumption revealed limitations, causing declined 3E coordination. Dual carbon control demonstrably enhances 3E systemic synergy. (2) Decoupling dynamics: Dual carbon control accelerates economic-carbon emission decoupling while slowing economic-energy consumption decoupling. This creates an elasticity space of 5.092 million tons of standard coal and reduces carbon emissions by 26.43 million tons, enabling high-quality economic development. (3) Mechanism reconstruction: By leveraging external triangular elements (energy-saving technologies, market mechanisms) to act on the energy subsystem, dual carbon control approaches optimal solutions for the "energy trilemma". This drives systematic restructuring of the sustainability triangle, achieving high-order 3E coupling coordination. The Triangular Trinity framework constructed in this paper perfectly deciphers the logic of China’s energy transition and provides a replicable methodology for resolving global 3E contradictions. These results offer theoretical and practical guidance for establishing dual-control systems in national and subnational energy transitions.
Keywords:
dual carbon control policy
; Economic-Energy-Environmental (3E) system
; "Triangular Trinity" theoretical framework
; coupling coordination development
; mechanism restructuring
; Scenario predictive
1. Introduction
Against the backdrop of profound restructuring in global climate governance, China’s energy management system is undergoing a comprehensive transition. China’s dual energy consumption control system was established during the 11th Five-Year Plan period (2006-2010) [1]. By regulating both total energy consumption and energy consumption per unit of GDP, it effectively curbed extensive growth patterns. However, under the carbon peak and carbon neutrality goals, this undifferentiated approach—imposing blanket controls on all energy sources without distinguishing between fossil and non-fossil energy—has constrained the development of non-fossil energy industries and hindered economic progress. This “one-size-fits-all” management model exposes fundamental value conflicts between energy consumption control and carbon reduction objectives. The 2021 Central Economic Work Conference first proposed “creating conditions to advance the transition from dual energy consumption control to dual carbon emissions control,” [2] marking the beginning of a systemic shift after 15 years of energy-focused regulation (i.e., total energy consumption and energy intensity controls) toward a carbon-centered framework (total carbon emissions and carbon intensity controls). Subsequently, the Chinese government introduced a series of policies to accelerate this transition [3,4]. The 2024 State Council’s Work Plan for Accelerating the Establishment of a Dual Carbon Emissions Control System formally established China’s institutional framework centered on dual control of total carbon emissions and carbon intensity [5].
Dual carbon emissions control is a novel policy first proposed by the Chinese government in 2021. Current research primarily focuses on three dimensions:
(1) Necessity, existing foundations, and challenges in transitioning from dual energy consumption control to dual carbon control. Tian Hongdou et al. [6] analyzed historical evolution and limitations of both policies, comparing national objectives across periods to demonstrate transition necessity. Xie Dian et al. [7] identified implementation barriers including imperfect accounting systems, ambiguous institutional design, and unclear market mechanisms. To address these, Xuan Xiaowei et al. [8] proposed specific measures include expanding carbon market functions, leveraging carbon taxes and standards, optimizing dual carbon control policies and enhancing governmental engagement, core shift is transitioning from “plan-dominant” to “market-driven” mechanisms.
(2)Socioeconomic impacts and implementation pathways of the policy transition. Jiang Chunhai [9] & Tang Lang et al. [10] conducted multi-perspective comparative analyses using a Computable General Equilibrium (CGE) model, found that transitioning from dual energy consumption control to dual carbon control can further reduces carbon emissions and peaks, unleashes clean energy consumption potential (↑ non-fossil energy share),boosts clean energy industries, limited effect on industrial restructuring rationalization, but uncertain economic growth promotion. Tang Fang et al. [11] quantified impacts on regulated aggregates and indicators via an integrated economy-energy-environment model, designing phased transition pathways.
(3) Response strategies under dual carbon control. Provincial governments [12,13,14,15,16,17] developed localized implementation frameworks considering regional disparities. Energy-intensive industries [18,19,20,21] formulated sector-specific decarbonization roadmaps addressing technical and operational constraints.
Although scholars have conducted research on economy, energy, environment, sectors, and industries, quantitative studies remain scarce regarding the extent and mechanisms through which dual carbon control affects the coupling coordination development of the Economy-Energy-Environment (3E) system-also known as the sustainability triangle. China is currently undergoing a critical transition from dual energy consumption control to dual carbon control. There is an urgent need for systematic research on how dual carbon control policies reshape the interactive relationships within the 3E system and reconstruct its coupling coordination mechanisms. To address this gap, this study innovatively constructs a “Triangular Trinity” theoretical framework integrating internal, intermediate, and external triangular couplings. Taking Guangdong Province—a major energy consumer and carbon emitter—as a case study, we analyze impacts of the policy transition on the 3E system, reveal the restructuring logic and mechanisms of dual carbon control on 3E coupling coordination, provide foundational support for establishing governmental dual carbon control institutional systems
Case region introduction: Guangdong province (the geographical location is shown in Figure 1) has the most developed economy (13.57 trillion RMB provincial total economic output in 2023, accounts for 10.85% of the country’s total economic output), the largest energy consumption (376.59 million tons of Standard Coal Equivalent in 2023, accounts for 6.58% of the country’s total energy consumption), the largest population (127.06 million at the end of 2023, accounts for9.01% of the country’s total population ) and the great dependence on external energy supply (only 25.11% of energy self-sufficiency in 2023). Guangdong Province has pioneered nationwide in transitioning from dual energy consumption control to dual carbon emissions control. As early as 2015, it took the lead in proposing the gradual establishment of a dual-control mechanism for both total carbon emissions and carbon intensity, compelling economic transition toward low-carbon development. Subsequent policy documents have repeatedly emphasized the need to systematically establish a system prioritizing carbon intensity control supplemented by total carbon emissions control, thereby advancing the shift from dual energy consumption control to dual control of carbon emissions and intensity [22,23,24]. This initiative has provided critical references for formulating China’s national dual carbon control policy.
2. Materials and Methods
2.1. Construction of the “Triangular Trinity” Theoretical Framework
The “Triangular Trinity” framework is formed by coupling three interconnected triangles: Internal, Intermediate, and External (Figure 2).
The Internal Triangle refers to the “Energy Trilemma” within the energy subsystem [25], the energy subsystem inherently faces an irreconcilable trilemma where security, cleanliness, and affordability cannot be simultaneously optimized: Pursuing greater security (e.g., supply stability) may require increased investment, compromising affordability. Prioritizing cleanliness (e.g., zero-carbon transition) could raise short-term costs, undermining affordability. Exclusive focus on affordability may sacrifice security or cleanliness.
Intermediate Triangle refers to Sustainability Triangle, This represents the synergistic linkages within the Economy-Energy-Environment (3E) system [26]: Economic subsystem: Core driver requiring energy inputs and environmental carrying capacity. Environmental subsystem: Foundational carrier enabling economic/energy activities. Energy subsystem: Material base supplying power for development and ecological preservation. Dynamic interaction: Energy and environment serve the economy, while environment constrains both.
External Triangle refers to Policy-Technology-Market Triad. Critical external forces reshaping the 3E system. Policy, as the foundation of the external triangle, is used to regulate behavior, set goals, and coordinate resource allocation, ensuring that the economic, energy, and environmental systems remain stable and efficient amidst external environmental changes. Technology, as an engine of innovation, promotes system transformation and efficiency improvement. Through instrumental advancements (such as AI, CCUS), it enhances external interaction capabilities, triggering chain reactions (such as industry disruption or efficiency improvements). The market, as a means of providing feedback on supply and demand signals, guides the adjustment of policy directions and technology research and development directions (such as the demand for low-carbon products driving investment in green technology), and tests the effectiveness of policies and technologies.
2.2. Construction of the 3E System (Intermediate Triangle) Indicator Framework
Building upon the “Triangular Trinity” theoretical framework, the Intermediate Triangle serves as the core component and operational carrier of this trinity structure. Based on data accessibility and indicator predictability, we construct the 3E system indicator framework (see Table 1).
2.3. Calculation of Coupling Coordination Degree
The calculation formula of coupling coordination development degree is as follows:
Among them,
In the formula, D is the coupling coordination degree, D∈ [0, 1]; C is the coupling degree, reflecting the synergy level of interaction between systems; T is the coordination degree, reflecting the comprehensive development level of 3E system. x, y and z respectively represent economic subsystem, energy subsystem and environment subsystem; θ, β and γ are the weights to be determined for economic, energy and environmental systems respectively, θ+β+γ=1. f(x), g(y) and h(z) are the comprehensive scores of each subsystem to measure the development level and status of each subsystem. The calculation formula is:
, and represent the values of economic, energy, and environmental system indicators, respectively, after linear proportional transformation and standardization, and are calculated using the extreme value method. , and are the weights assigned to each indicator using the entropy method. Taking the calculation of and wi as an example, the method is described in below [27]. The calculations of , , , and are similar to those of and , where j = 1-3 and k = 1-2. The classification criteria for coupling coordination degree levels can be found in Appendix A.1, Table A1.
Standardization of indicators:
Determine the proportion of indicators:
Calculate the entropy value of the i-th index: where k>0 and k=ln(i)
Calculate the information utility value of the i index:
ui = 1-ei
Calculate the weight of each index:
2.4. Decoupling Assessment of Economy from Energy & Carbon Emissions
To characterize the quantitative impacts of different policy scenarios on economic development, this study will conduct synchronized decoupling assessments of the economy from both energy consumption and carbon emissions. Currently, two mainstream decoupling models exist: the OECD decoupling model and the Tapio decoupling model. Through empirical verification and comparative analysis, scholars have found that the Tapio decoupling model possesses irreplaceable advantages over the OECD model [28]. Given this evidence, our research adopts the Tapio decoupling model to compute decoupling states between the economy and energy/carbon emissions.
The Tapio decoupling model is expressed as:
where C represents carbon emissions in the target year; ΔC denotes the change in carbon emissions relative to the base period; GDP signifies the gross domestic product in the target year; and ΔGDP indicates the GDP variation relative to the base period. This study employs 5-year time intervals, with the starting year of each period designated as the base period. Based on decoupling elasticity values, Tapio defines eight distinct decoupling states, as detailed in Appendix A.1, Table A2.
2.5. Scenario Design
This study establishes three policy scenarios: Business-as-Usual (BAU), Enhanced Dual Energy Control (EC) and Dual Carbon Control (CC). Scenario descriptions and parameter configurations are detailed in Table 2. Using 2023 as the base year, the projection period spans from 2024 to 2035.
2.6. Data Sources and Processing
The data are sourced from publicly available documents and statistical materials, including national and Guangdong provincial statistical yearbooks, government planning documents, and other official publications. This study primarily employs three analytical tools: the coupling coordination model, the Tapio decoupling model, and the SPSSAU statistical analysis software for data processing.
3. Results
3.1. Evolution of 3E System Coupling Coordination Development
(1) Historical evolution patterns of 3E system coordination
Since the implementation of Dual Energy Control policy in 2005, the coupling coordination level of Guangdong’s 3E system demonstrated steady improvement from 2005 to 2016 (except in 2011, primarily due to a significant decline in energy self-sufficiency rate caused by reduced primary electricity production that year) (Figure 3). The coupling coordination index peaked at 0.68, reaching the primary coordination stage, indicating that energy control policies significantly promoted coordinated development of Guangdong’s 3E system. Notably, the high coupling degree among the three subsystems reflected strong interdependence and mutual constraints. From 2005 to 2011, the coordination degree declined markedly, suggesting diminished benign coupling within the 3E system—a phenomenon attributable to initial adaptation challenges to the new policy framework. After a six-year adaptation period, coordination began increasing annually, achieving a cyclical peak by 2016. Since 2016, as China’s economy entered a high-growth phase, rapid energy demand expansion exacerbated carbon emissions and environmental pollution, revealing limitations of dual energy control. Consequently, the 3E system’s coupling coordination level deteriorated, with the index dropping to 0.34 by 2023-transitioning to a mild discordance state.
(2) Development trends under different policy scenarios
All three policy scenarios exhibit upward trends in 3E system coupling coordination levels (Figure 4), yet with significantly divergent growth rates. The baseline scenario (BAU) demonstrates higher coordination levels than the enhanced dual energy control scenario (EC), indicating that intensifying energy controls fails to substantially improve 3E system coordination. The dual carbon control scenario (CC) achieves the highest coordination level with the most rapid progression, confirming that carbon-focused policies markedly enhance 3E system synergy. By 2035 under CC, the coordination degree rises to 0.74, transitioning from mild discordance (2023) to intermediate coordination. Regarding coordination degree (Figure 5), CC significantly strengthens positive coupling, outperforming other scenarios. For coupling degree (Figure 6), although CC initially lags behind during the 15th Five-Year Plan period (2026-2030), its accelerated growth surpasses EC by 2028 and nearly closes the gap with BAU by 2035. This progression reveals that after a decade-long adaptation period, carbon control policies progressively tighten inter dependencies within the 3E system.
3.2. Differential Analysis of Energy Conservation and Emission Reduction Under Policy Scenarios
(1) Energy consumption trajectories
From 2005 to 2023, total energy consumption exhibited persistent annual growth (Figure 7). During 2024-2035, all three scenarios maintain this upward trend, with the CC scenario registering the highest consumption (reaching 538 million tce by 2035). This stems from the discontinuation of Dual Energy Control assessments under carbon-focused policies, creating additional consumption space for renewable energy enterprises. Consequently, energy demand expands alongside rapid economic development, exceeding BAU by 50.92 million tce and EC by 92.76 million tce in 2035.
(2)Carbon emission dynamics
BAU and EC scenarios show continuously rising emissions without discernible peaks during the study period (Figure 8). In contrast, the CC scenario achieves its carbon peak in 2030 (212.5 million metric tons carbon), fulfilling China’s national carbon neutrality timeline. Post-peak emissions decline steadily, resulting in 5.43 million tons less carbon than EC and 26.43 million tons less than BAU by 2035. At the 2035 average carbon trading price of 180 yuan/metric ton, scenario CC incurs 977 million yuan and 4.757 billion yuan higher carbon costs than scenario EC and scenario BAU respectively.
(3)Decoupling evolution analysisThe declining decoupling elasticity indices between economy-energy and economy-emissions during 2005-2015 demonstrate that dual energy control implementation facilitated decoupling processes. From 2015 to 2025, the economy-energy decoupling elasticity index rebounded upward, while the economy-emissions elasticity index rose initially before declining, yet both indices remained in a state of weak decoupling (Figure 9). During 2025-2030, Dual Carbon Control implementation slowed economy-energy decoupling but accelerated economy-emissions decoupling. Notably since 2030, the CC scenario has achieved strong decoupling between economy and carbon emissions, as evidenced by a negative elasticity index.
In essence, carbon-focused policies effectively constrain emissions while liberating energy consumption space for economic growth, enabling robust economy-emissions decoupling.
4. Discussion
Under the dual carbon control policy framework, the 3E system establishes dynamic coupling through three interconnected triangular mechanisms (Figure 10). Specifically, carbon control policies synergize with energy-saving technologies and market mechanisms to act upon the energy subsystem. This integrated approach progressively approximates the optimal solution to the Energy Trilemma. Consequently, it drives sustainable development of the central triangle (the 3E system itself). Ultimately, this process achieves high-order coupling within the 3E system.
4.1. Dual Carbon Control Policy’s Resolution of Energy Trilemma (Internal Triangle)
Through dynamic adjustments integrating dual carbon control policy with energy-saving technologies and market mechanisms, it progressively approximates the optimal solution to the Energy Trilemma, thereby resolving its long-standing paradox. Regarding cleanliness, the policy explicitly excludes non-fossil energy sources from total energy consumption assessments, unlocking constraints on clean energy development and liberating clean energy consumption space for economic growth. Under the CC scenario, the share of non-fossil energy consumption increases annually from 2025 to 2035, reaching 45% by 2035. Carbon emissions decrease by 26.43 million tons compared to the BAU scenario and by 5.43 million tons relative to the EC scenario. Strong decoupling is achieved between economic development and carbon emissions. Energy cleanliness level significantly improves, with notable carbon reduction effectiveness. For economic cost balancing, carbon market quota trading, green electricity transactions, and green finance (e.g., carbon reduction loans) reduce corporate low-carbon transition costs. Carbon pricing signals guide technological upgrades in energy-intensive industries. Regarding security assurance, promoting energy storage applications and grid flexibility retrofits addresses renewable energy intermittency. This enhances the resilience of the energy system.
4.2. Reconstruction Logic of Dual Carbon Control Policy on 3e System (Central Triangle) Coupling Relationships
The dual carbon control policy drives systemic reconstruction of the 3E system through low-carbon restructuring of the energy system, structural reshaping of the economic system, and synergistic improvement of the environmental system, thereby promoting high-order coupling within the 3E system.
(1) Low-carbon restructuring of energy system
Carbon emission controls accelerate energy structure transformation through the “non-fossil energy exemption” and “multi-energy complementarity” mechanisms. Under the policy’s impetus, Guangdong’s non-fossil energy consumption share increases from 30% in 2023 to 45% by 2035 (Figure 11),thermal power installed capacity and its proportion decrease annually (Figure 12), non-fossil energy power generation share rises progressively. Energy structure and power generation mix achieve higher cleanliness levels By 2035, Guangdong’s energy consumption per unit of GDP drops by 19% below 2020 levels, energy utilization efficiency demonstrates continuous optimization. In the near term, increased investments in new energy sources drive up energy use costs. Over the long term, however, advancements in energy storage technologies and carbon market revenues will gradually reduce this cost pressure. Consequently, energy security and cost equilibrium remain effectively safeguarded.
(2) Structural reshaping of the economic system
The dual carbon control policy compels industrial upgrading and technological innovation through “exempting clean energy from energy consumption assessments” and “strengthening constraints on high-carbon industries”. The proportion of the tertiary industry increases from 55% in 2023 to 60% by 2035. Using carbon emission intensity as a binding indicator, it drives decoupling between GDP growth and carbon emissions (see Figure 9 for details).
(3) Synergistic improvement of the environmental system
Under the dual carbon control policy, the environmental system transitions from end-of-pipe treatment to source control. Guangdong province achieves carbon peak by 2030, after which total carbon emissions enter a sustained decline phase. Through implementing this policy: Carbon emissions per unit GDP in Guangdong are projected to decrease by 40.7% by 2035 compared to 2025, decline by 76.56% compared to 2005 levels (Figure 13), drives co-reduction of pollutants such as sulfur dioxide (SO₂) and nitrogen oxides (NOₓ). Via the forest carbon sink trading mechanism, Guangdong’s annual carbon sequestration increment averages 50 million tons during 2025-2035. Emission reduction contribution remains stable at approximately 23%. This enables a positive feedback loop between environmental protection and economic development.
4.3. Analysis of the Supporting Role of Dual Carbon Control Policy on the External Triangle
China has designed a “three-phase implementation path” for the Dual Carbon Control policy: improving the accounting system before 2025, prioritizing intensity control during the 15th Five-Year Plan period (2026–2030), and transitioning to total carbon emission control post-peak (after 2030). The late stage of the 14th Five-Year Plan and the 15th Five-Year Plan period will focus on policy articulation, establishing synergy mechanisms between carbon dual-control and carbon markets to prevent the occurrence of dual assessment conflicts.
At the technical level, theDual Carbon Control policy requires enhancing the carbon emission accounting system (e.g., releasing 70 national standards in 2024), while simultaneously introducing supportive policies to advance technological breakthroughs in hydrogen energy (“production, storage, transportation, and utilization”) and CCUS. Precision management will be achieved through the development of carbon footprint databases.
At the market level, both national and provincial carbon markets are progressively expanding, guiding corporate emission reductions through carbon quota trading. As of May 2025, emission-regulated enterprises covered by the national carbon market include those in the power, steel, cement, and electrolytic aluminum sectors. Guangdong Provincial Carbon Emission Trading Market encompasses power, petrochemicals, papermaking, textiles (selected enterprises), ceramics (construction and sanitary), transportation (ports), civil aviation, and data centers. The coordinated development of market mechanisms and dual carbon control policy instruments forms a “policy-market” dual-driver approach that will effectively enhance energy conservation and carbon reduction.
Conclusions
Based on the constructed”Triangular Trinity” theoretical framework, this study employs quantitative models and methods—including coupling coordination degree, decoupling analysis, and scenario prediction—to examine how the transition from dual energy consumption control to dual carbon emissions control impacts the coupling coordination relationship within the 3E system. It further discusses the reconstruction logic and mechanisms of dual carbon control policy on 3E system coupling relationships. The main conclusions are as follows:
(1) During 2005–2016, the dual energy consumption control demonstrated remarkable energy-saving and emission-reduction outcomes, significantly promoting coordinated development within Guangdong’s 3E system. Since 2017, limitations arising from solely controlling total energy consumption have become apparent, leading to a notable decline in 3E system coordination. Conversely, implementing carbon dual-control policies can substantially elevate 3E system coordination levels.
(2) The shift from dual energy consumption control to dual carbon emissions control effectively decouples economic growth from carbon emissions while temporarily slowing economic-energy consumption decoupling. This transition provides Guangdong’s low-carbon transformation with a clean energy flexibility space equivalent to 50.92 million tonnes of coal equivalent (Mtce) and reduces carbon emissions by 26.43 million tonnes, thereby facilitating high-quality economic development.
(3) Integrating with external triangle elements (energy-saving technologies and market mechanisms), carbon dual-control policies optimize solutions for the energy “Energy Trilemma” constraints, driving systematic reconstruction of the sustainable development triangle and achieving advanced coupling within the 3E system.
The “Triangular Trinity” theoretical framework developed in this study integrates fragmented energy contradictions, developmental goals, and driving factors into a dynamically evolving complex system. Through configurational alignment of multidimensional policy tools, technological innovation, and market mechanisms, it enables a paradigm shift from the “Energy Trilemma” to the “Sustainable Triangle.” This framework not only elucidates the logic of China’s distinctive energy transition but also provides a reusable methodology for resolving global 3E systemic contradictions.
Author Contributions
Y.X. and W.W. contributed equally to this work. Y.X.: data curation, methodology. W.W.: conceptualization, writing-original draft, visualization, validation. W.Y.: data curation. G.C.: methodology. L.C.: validation. H.C.: data curation. Z.L. validation. All authors have read and agreed to the published version of the manuscript.
Funding
This research is funded by Guangdong Power Grid Co., Ltd Special Project on Power Planning (0301002024030301QY00016).
Data Availability Statement
The data presented in this study are available on request from the corresponding author.
Conflicts of Interest
The authors declare no conflict of interest.
Appendix A
Appendix A.1

Table A1.
Coupling coordination degree level classification standard.
| Coupling Coordination Degree D-value Interval | Coordination Level | Degree of Coupling Coordination |
|---|---|---|
| [0.0~0.1) | 1 | Extreme disorder |
| [0.1~0.2) | 2 | Barely coordinated |
| [0.2~0.3) | 3 | Moderate disorder |
| [0.3~0.4) | 4 | Mild disorder |
| [0.4~0.5) | 5 | Verging on disorder |
| [0.5~0.6) | 6 | Barely coordinated |
| [0.6~0.7) | 7 | Primary coordination |
| [0.7~0.8) | 8 | Intermediate coordination |
| [0.8~0.9) | 9 | Good coordination |
| [0.9~1.0] | 10 | High-quality coordination |
Appendix A.2
Table A2.
Eight decoupling states defined by Tapio.
| Decoupling Elasticity Value (Dt) | ΔC/C | ΔGDP/GDP | Decoupling State | Description |
|---|---|---|---|---|
| Dt <0 | <0 | >0 | Strong Decoupling | Economic growth with decreasing carbon emissions |
| 0≤Dt <0.8 | >0 | >0 | Weak Decoupling | Economic growth rate is higher than carbon emission growth rate |
| 0.8≤Dt≤1.2 | >0 | >0 | Expansive Coupling | Economic growth rate is relatively synchronized with carbon emission growth rate |
| Dt >1.2 | >0 | >0 | Expansive Negative Decoupling | Economic growth rate is lower than carbon emission growth rate |
| Dt <0 | >0 | <0 | Strong Negative Decoupling | Economic decline with increasing carbon emissions |
| 0≤Dt <0.8 | <0 | <0 | Weak Negative Decoupling | Economic decline rate is greater than carbon emission decline rate |
| 0.8≤Dt≤1.2 | <0 | <0 | Recessive Coupling | Economic decline rate is relatively synchronized with carbon emission decline rate |
| Dt >1.2 | <0 | <0 | Recessive Decoupling | Economic decline rate is lower than carbon emission decline rate |
References
- State Council. Notice on the Division of Work for Implementing the Main Objectives and Tasks of the “Outline of the Eleventh Five-Year Plan for National Economic and Social Development of the People’s Republic of China”. Gazette of the State Council of the People’s Republic of China 2006.(29),30-36.
- Xinhua News Agency. Central Economic Work Conference Held, Xi Jinping and Li Keqiang Deliver Important Speeches. [Online]. Available online: https://www.gov.cn/xinwen/2021-12/10/content_5659796.htm (accessed on 20 May 2025).
- State Council of the People’s Republic of China. Outline of the 14th Five-Year Plan for National Economic and Social Development and the Long-Range Objectives Through the Year 2035, 2021. Available online: https://www.gov.cn/xinwen/2021-03/13/content_5592681.htm (accessed on 1 April 2025).
- tate Council of the People’s Republic of China; National Development and Reform Commission; National Energy Administration. Notice on Printing and Distributing the “14th Five-Year Plan for Modern Energy System”: Development and Reform Energy [2022] No. 210, 2022. Available online: https://www.gov.cn/zhengce/zhengceku/2022-03/23/content_5680759.htm (accessed on 29 March 2025).
- General Office of the State Council. Notice on Printing and Distributing the “Work Plan for Accelerating the Construction of the Carbon Emission Dual Control System”: Guobanfa [2024] No. 39, 2024. Available online: https://www.gov.cn/zhengce/zhengceku/202408/content_6966080.htm (accessed on 20 March 2025).
- Tian, H.D.; Wang, W.; Luo, B.H.; Peng, Q.S. Internal logic and realization path of transformation from “double control” of energy consumption to “double control” of carbon emission under the “double carbon” strategy. Energy Research and Management 2023.15(4),16-22.
- Xie, D.; Gao, Y.J.; Lu, X.B.; et al. Implementation path study of the transition from energy consumption “dual control” to carbon emission “dual control”. Comprehensive Smart Energy 2022.44(7),73-80.
- Xuan, X.W. From “dual control” of energy consumption to “dual control” of carbon: challenges and countermeasures. Urban and Environmental Studies 2022.(3),42-55.
- Jang, C.H.; Yan, Z.H.; Wang, M. From dual control of energy consumption to dual control of carbon emissions under the constraints of carbon peaking and carbon neutrality goals: regulatory tools, effect simulation and policy evaluation. China’s Industrial Economics 2024.(11),5-23.
- Tang, L.; Wang, P.; Ren, S.Y. From dual control of energy consumption to dual control of carbon: a comparative study of policies from multiple perspectives. Science Technology and Engineering 2024.24(25):11019-11029.
- Tang, F.; Dai, H.C.; Zhang, N.; Wu, Y.; Xue, M.M.; Chen, R. Effect analysis and promotion path design for transformation from energy consumption “dual control” to carbon “dual control”. Electric Power 2023.56(12),255-261.
- Yang, F. Some thoughts on the transition from dual control of energy consumption to dual control of carbon emissions in Inner mongolia. Environment and Development 2023.35(3),18-22.
- Li, CL; Chang, XQ; Lu, H. Analysis and forecast of the shift from double control of energy consumption to double control of carbon emissions in Xinjiang. Power Generation Technology 2024.45(6),1114-1120.
- An, K.X.; Liu, M.K.; Fan, S.T.; et al. Impact of transition from the energy consumption “dual control” to the carbon “dual control”: a CGE-based case study of Anhui. China Environmental Science 2024.44(4),1795-1804.
- Li, Z.C.; Pan, J.R.; Zhong, L. Research on promoting the shift from dual control of energy consumption to dual control of carbon emissions and striving to achieve peak carbon dioxide emissions and carbon neutrality: A case study of Jiangxi. Prices Monthly (online).
- Wang, C.; Ye, J.H.; Zhang, T.Y.; Huang, W. Research on the coal reduction path in Zhejiang Province under the background of transforming “Amount and Intensity Control of Energy Consumption” to “Amount and Intensity Control of Carbon Emission”.Environmental Pollution and Control 45(9),1307-1311.
- Wu, L.P. Considerations on Shanghai taking the lead in promoting the transition from “dual energy consumption control” to “dual carbon emissions control”. Shanghai Energy Conservation 2023.(5),546-552.
- Chang, W.;Lu, L.F.;Cao, D.Y.Analysis of development status and suggestions on response paths for the automotive industry under carbon emission dual control requirements. Automobile & Parts 2024.(24),24-28.
- Sun, W.J.; Zhang, S.J.; Men, X.J. Impact and countermeasures of the shift from dual control of energy consumption to dual control of carbon emissions on the oil and gas industry. Oil & Gas and New Energy 2024.36(1),34-40.
- Xu, H. Enterprise adaptation strategy under policy from dual control of energy consumption to dual control of carbon emission. Energy and Energy Conservation 2024.(4),68-71.
- Hu, M.Y.; Gao, H.W.; Liao, J.; et al. Research on response strategies for petrochemical enterprises under the trend of “dual carbon control” policy. Green Petroleum and Petrochemicals 2023.8(2),10-14,27.
- Guangdong Provincial People’s Government. Notice of Guangdong Provincial People’s Government on Printing and Distributing the Implementation Plan for Carbon Peaking in Guangdong Province (Yuefu [2022] No. 56), 2022. Available online: http://www.gd.gov.cn/zwgk/gongbao/2023/4/content/post_4091315.html (accessed on 21 March 2025).
- Guangdong Provincial Committee of the Communist Party of China; Guangdong Provincial People’s Government. Implementation Opinions on Fully, Accurately and Comprehensively Implementing the New Development Concept to Promote Carbon Peaking and Carbon Neutrality Work, 2022. Available online: http://www.gd.gov.cn/zwgk/zcjd/snzcsd/content/post_3980099.html (accessed on 20 March 2025).
- Guangdong Provincial Development and Reform Commission. Notice on Further Strengthening the Energy Security for High-Quality Development in the Province (Yuefa Gai Neng Yuan Han [2023] No. 491), 2023. Available online: http://drc.gd.gov.cn/ywtz/content/post_4169964.html (accessed on 20 March 2025).
- Cen, H.; Wang, W.; Chen, L.; Hao, W.; Guan, Z.; Lu, J.; Cai, G. Multi-Scenario Research on the Coupled and Coordinated Development of the Economic–Energy–Environmental (3E) System under the Reconstruction of the Power System—New Exploration Based on the “Dual Triangle” Theory. Energies 2024.17,3468.
- Lu, G.; Xu, S. Z.; Wang, P. Strategic Thinking of the Path for Electric Power Carbon Peak and Carbon Neutrality on Basis of Energy-Economy-Environment Relations. Petroleum Science and Technology Forum 2020.(01):57-62,107.
- Yang, L.; Sun, Z.C. The Development of western new type urbanization level evaluation based on entropy method. On Economic Problems 2015.(3):115-119.
- Zhao, A.W.; Li, D. Empirical analysis of the decoupling relationship between carbon emissions and economic growth in China. Journal of Technology Economics 2013.32(1),106-111.
Figure 1.
The geographical location of Guangdong province in China (sketch map).
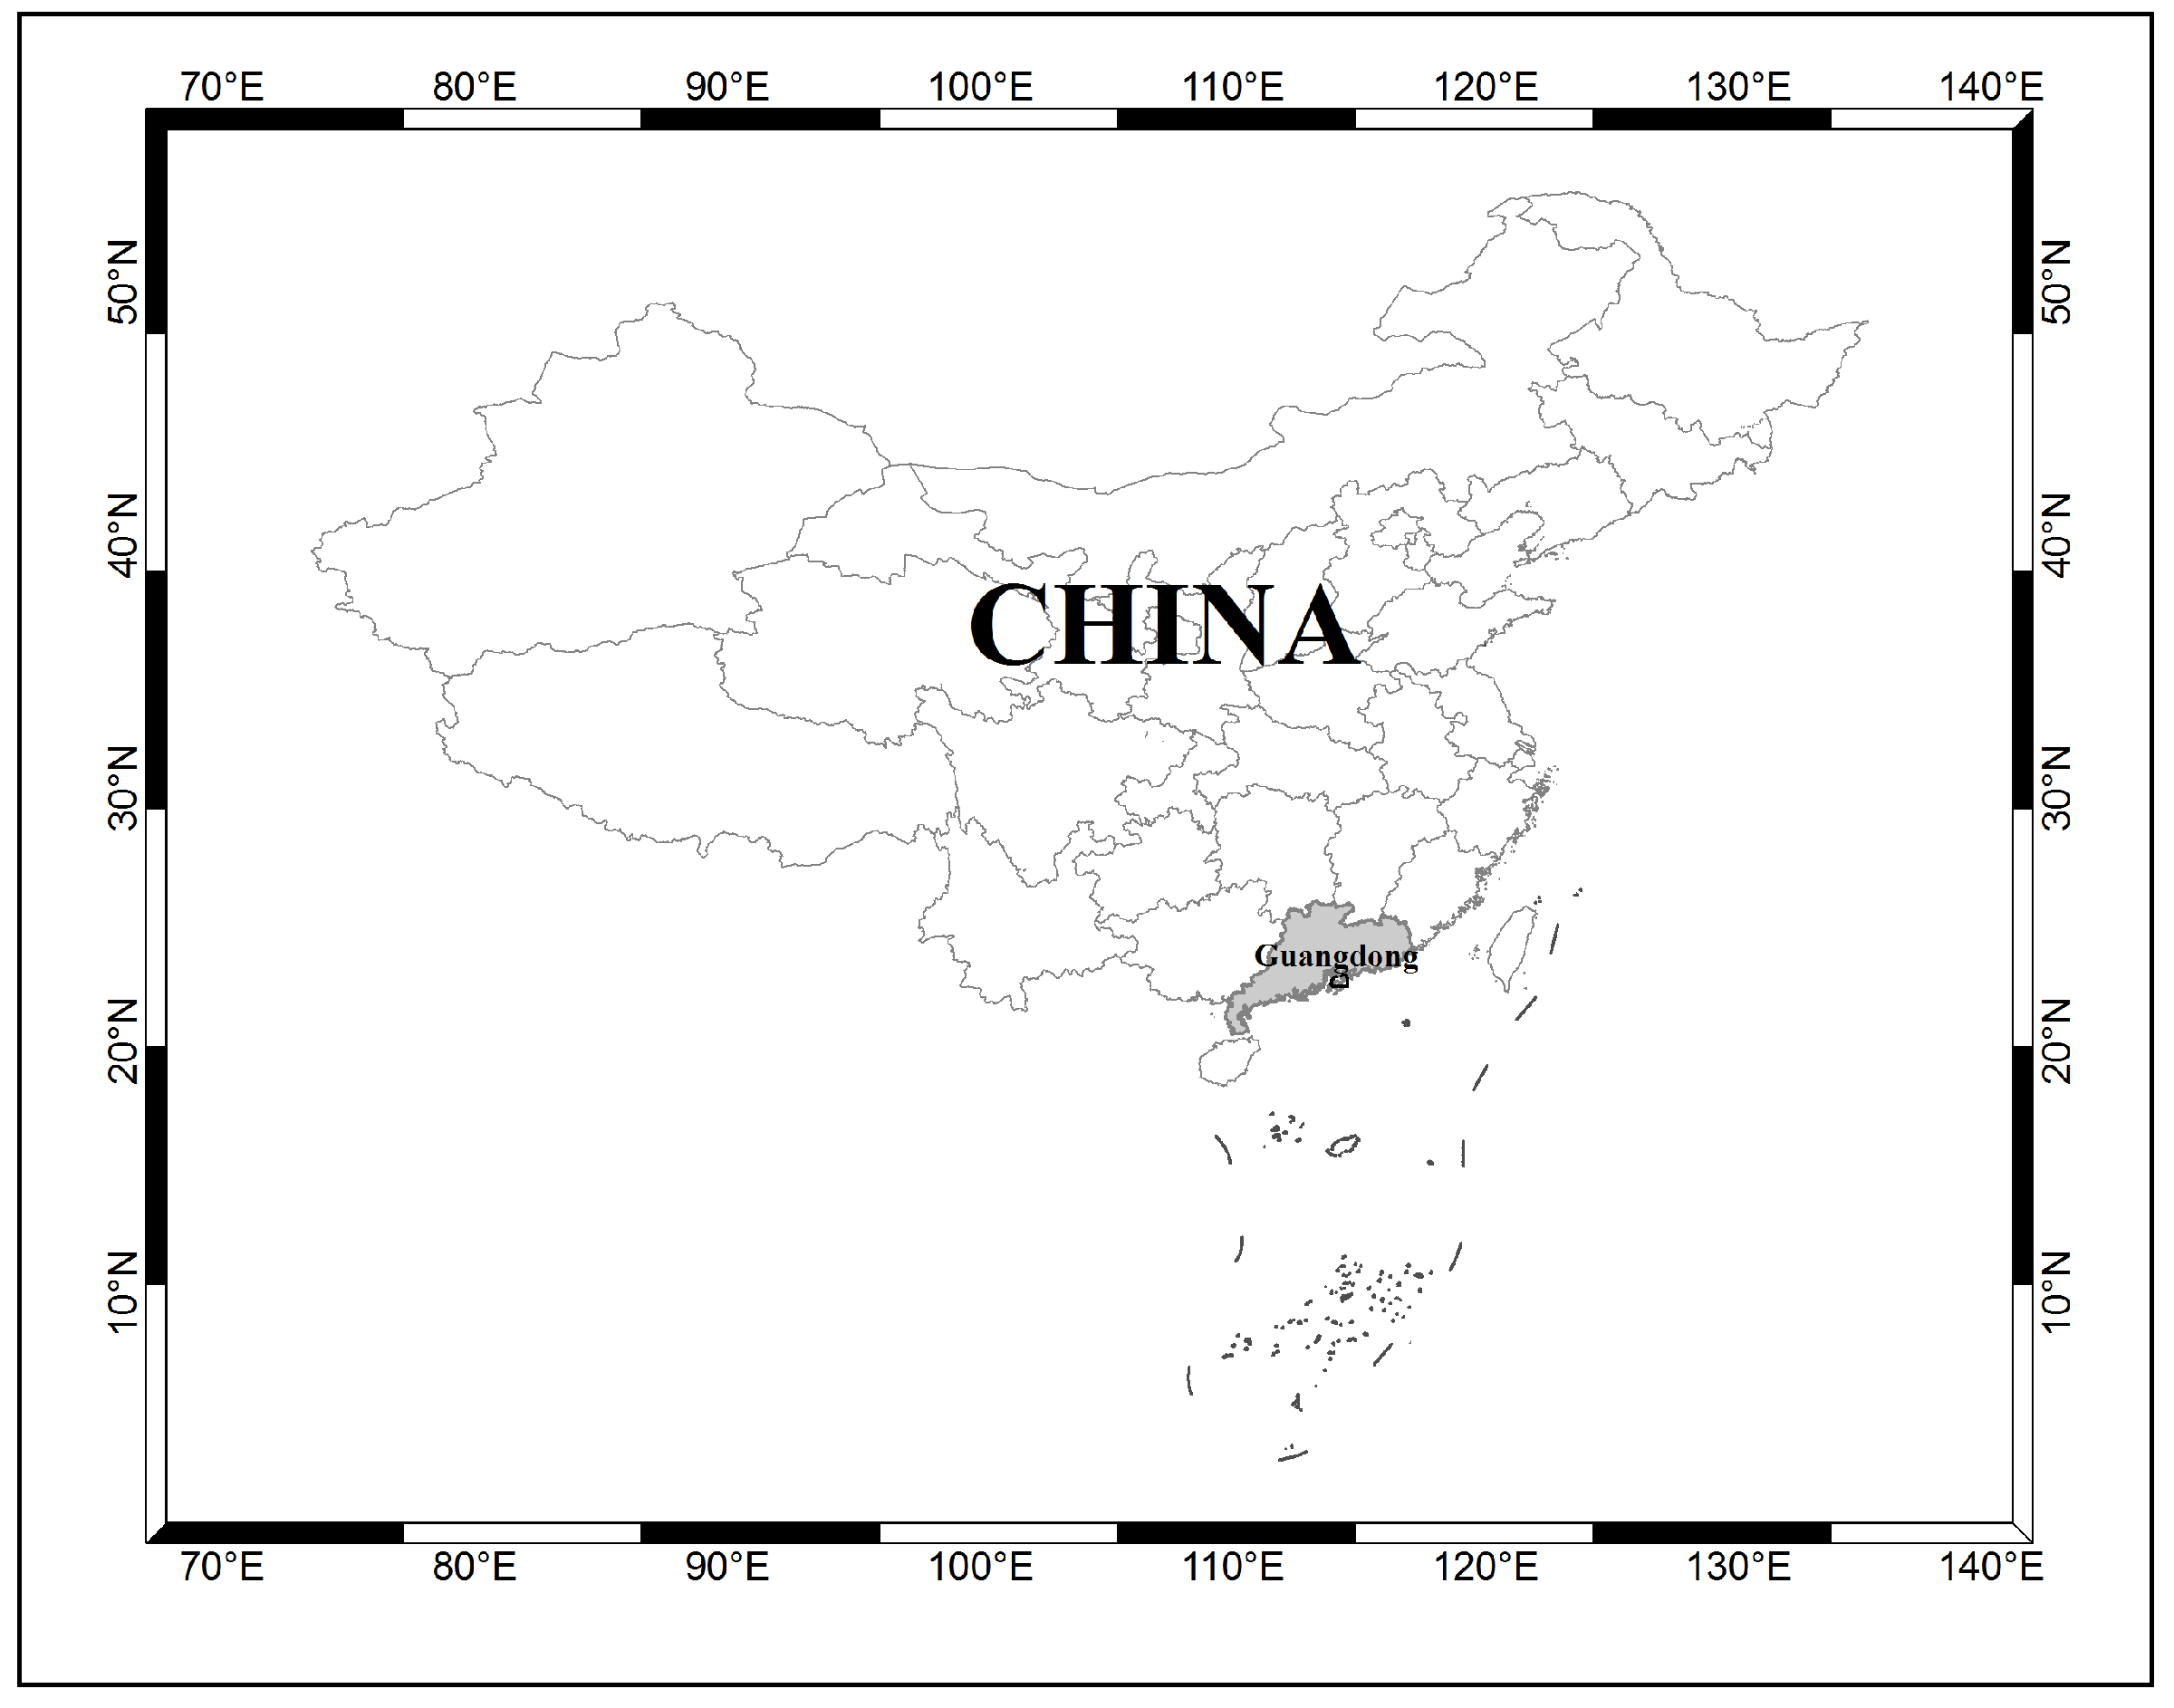
Figure 2.
“Triangular Trinity” theoretical framework.
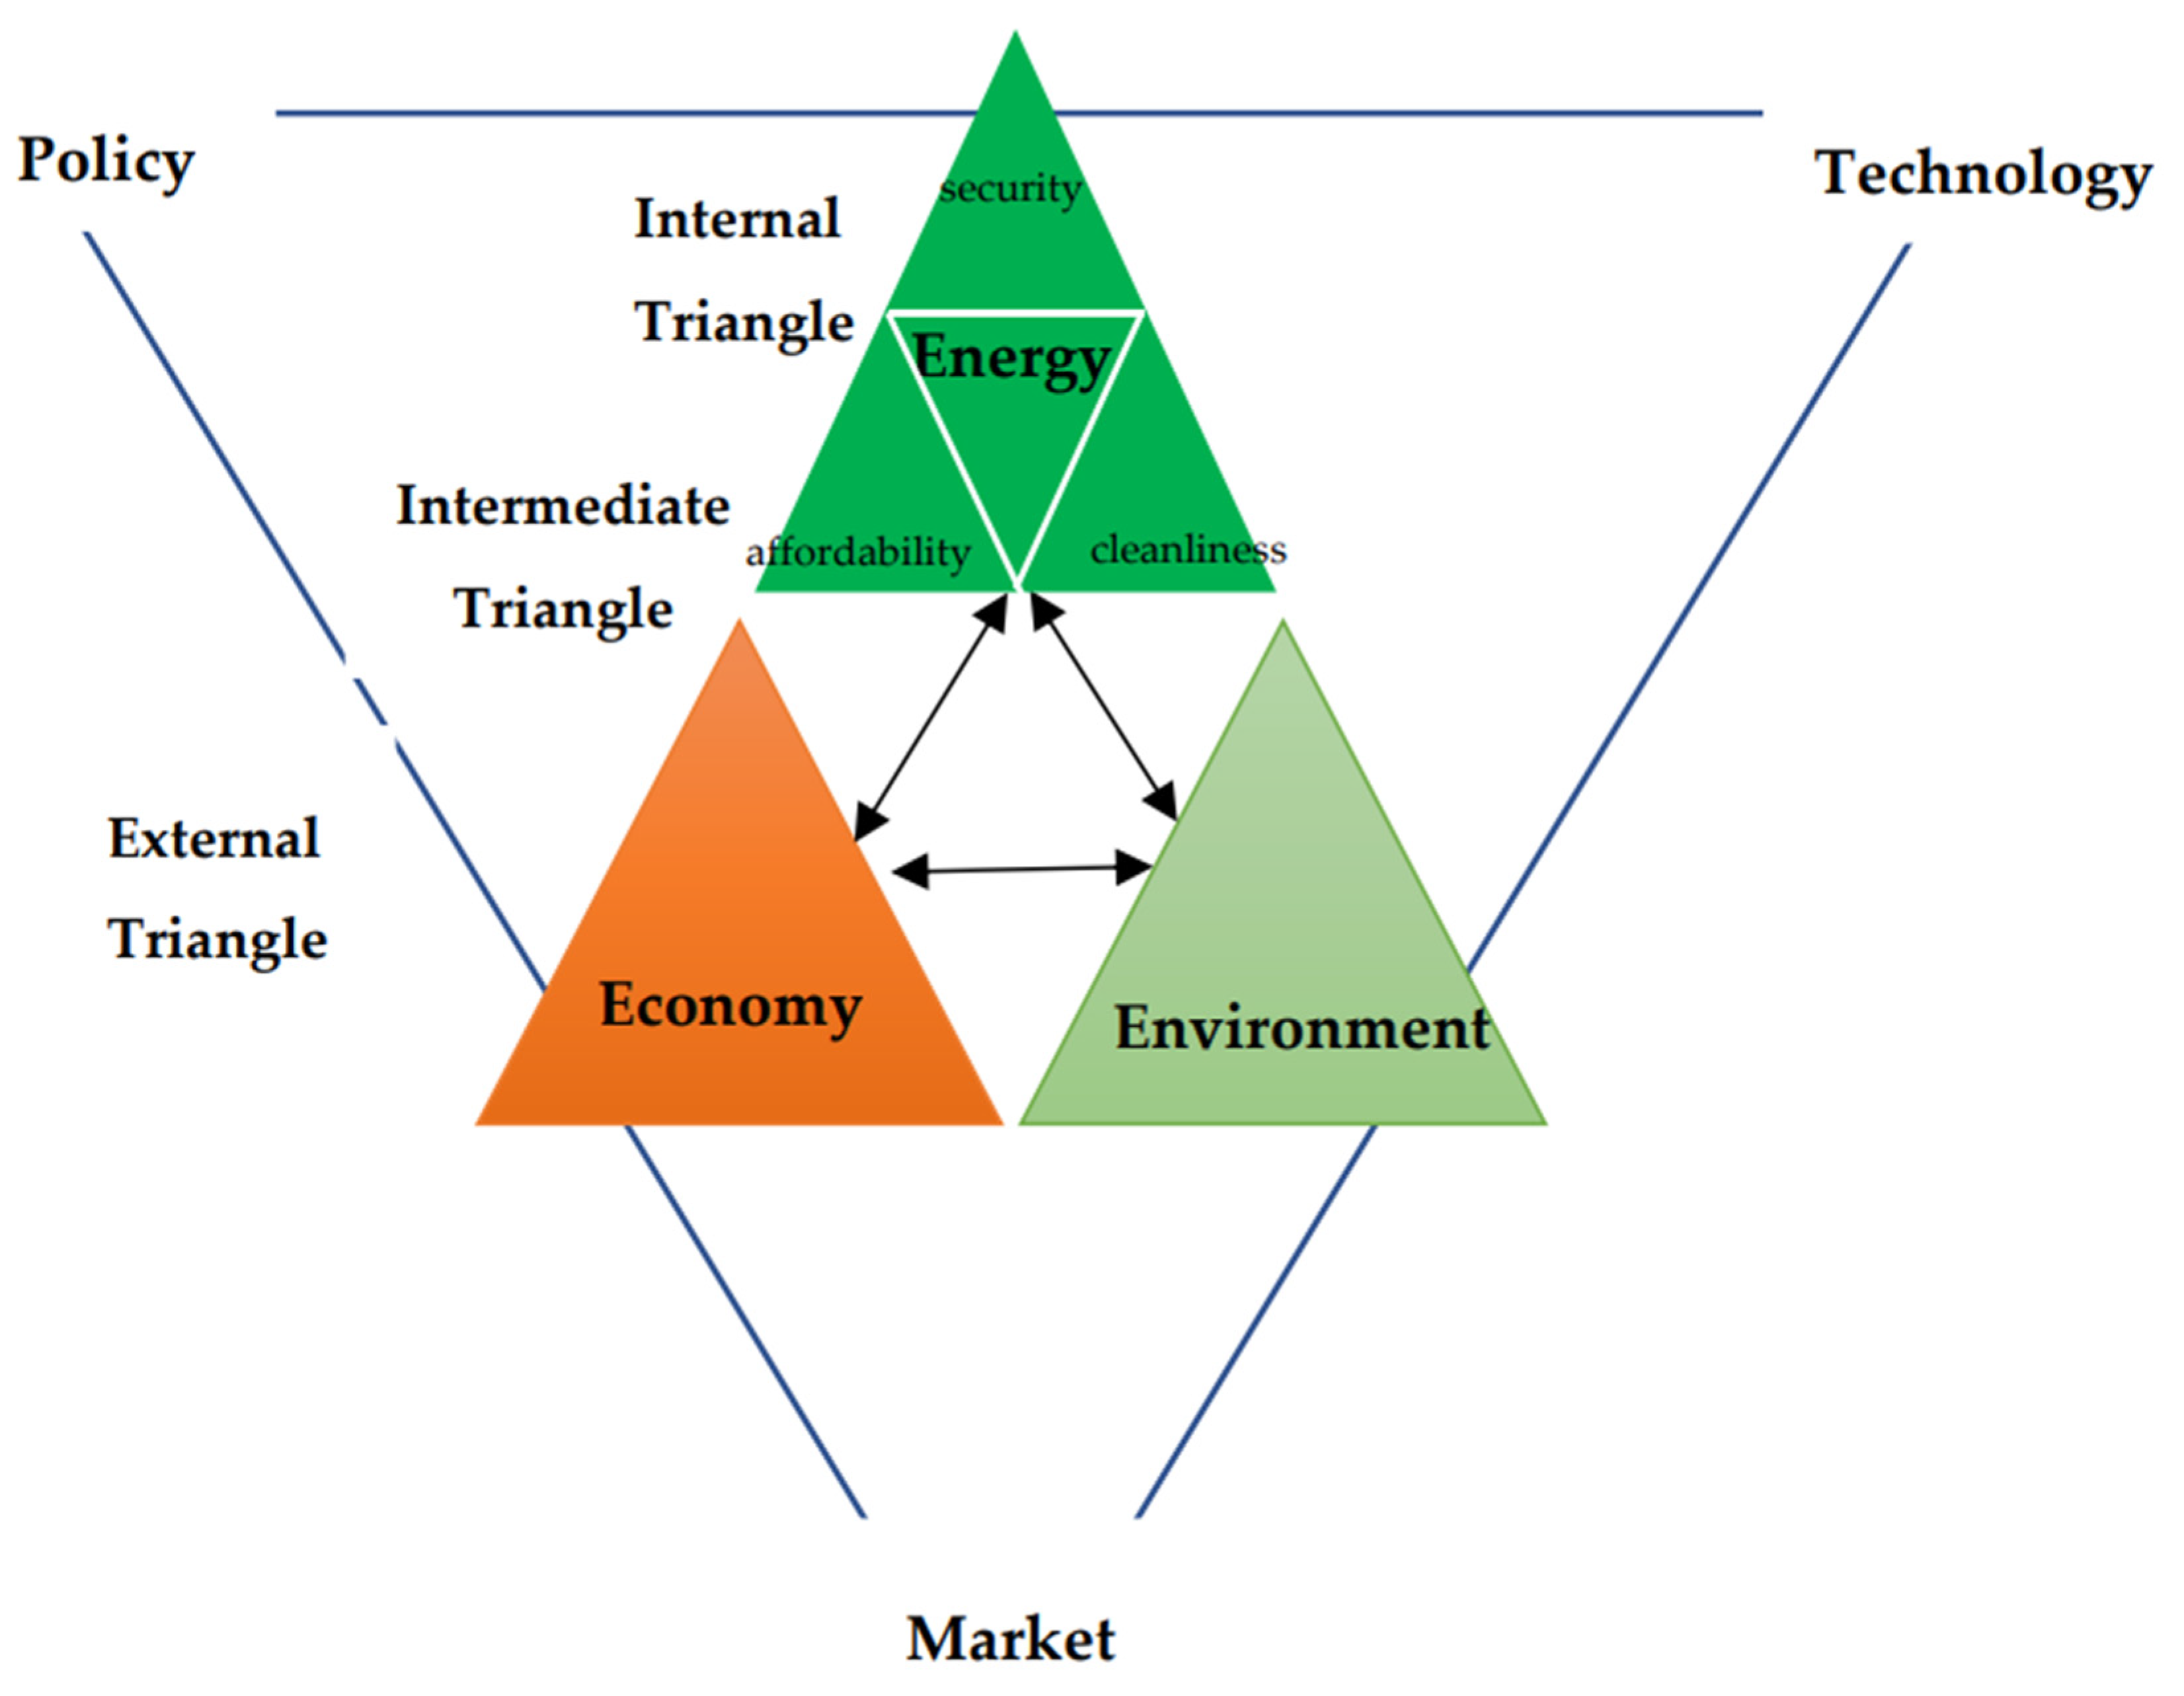
Figure 3.
Evolution patterns of 3E system coupling coordination degree (2005-2023).
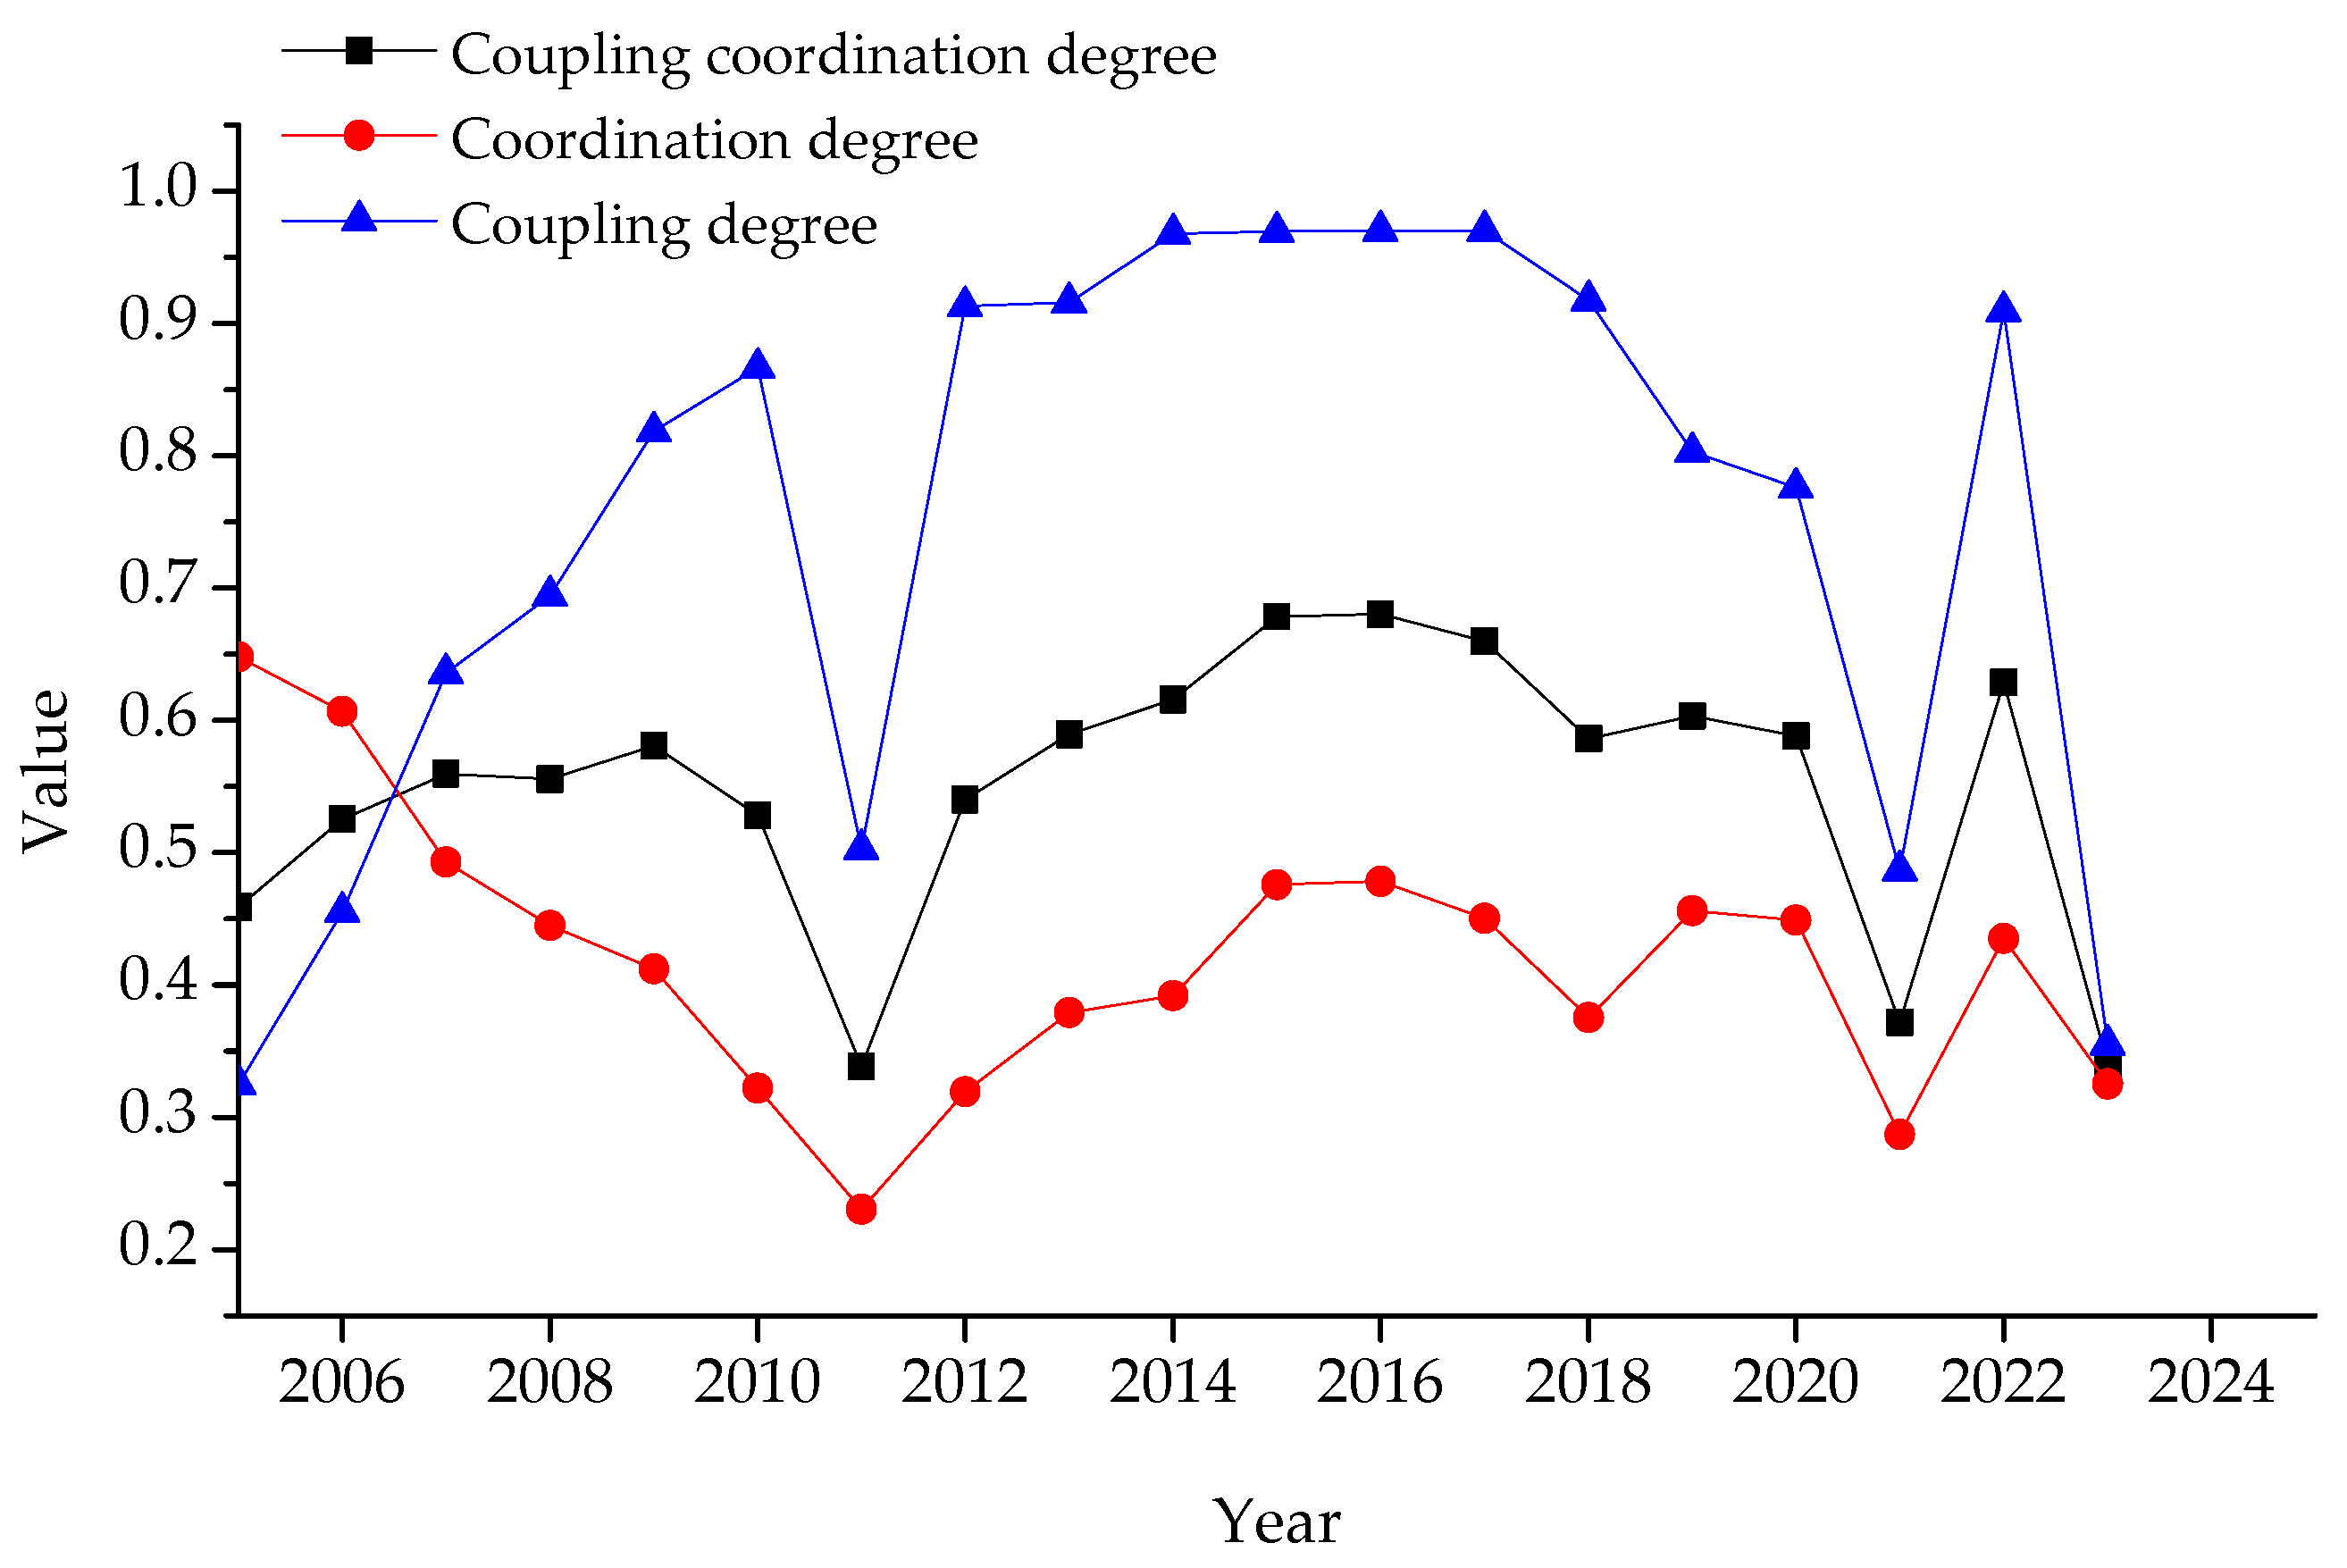
Figure 4.
Evolution of 3E system coupling coordination degree under three policy scenarios.
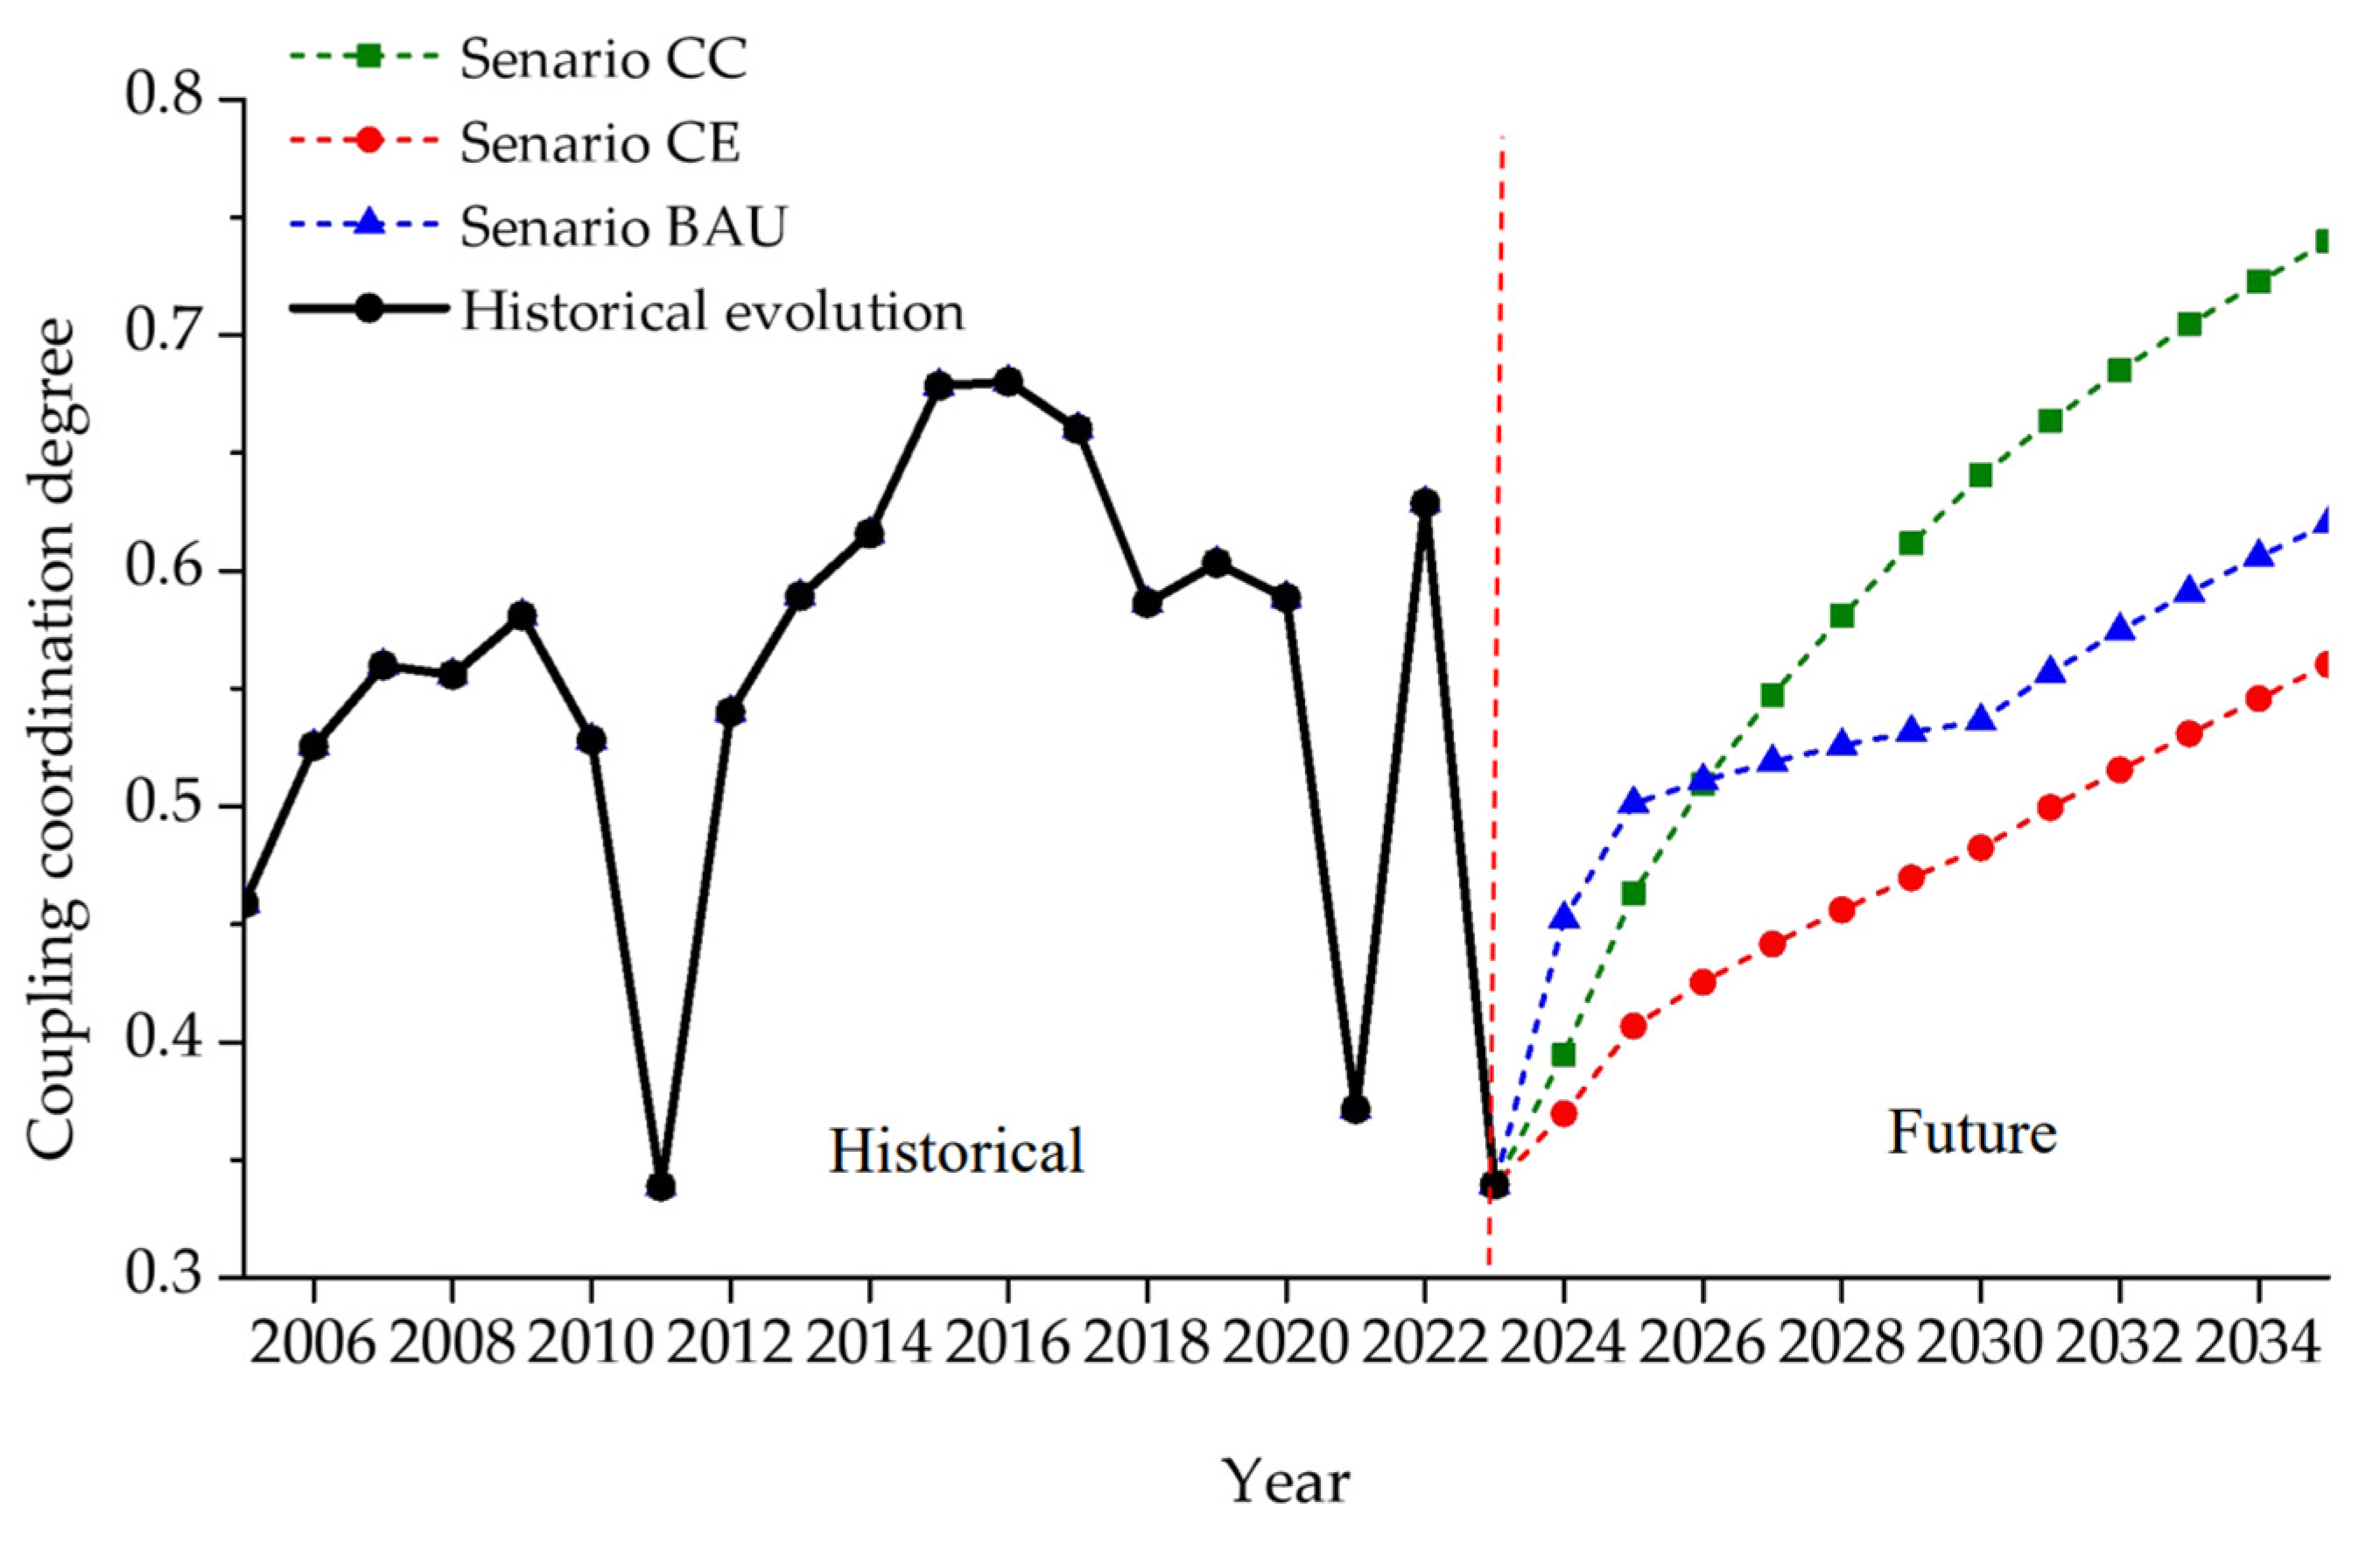
Figure 5.
Evolution of 3E system coordination degree under three policy scenarios.
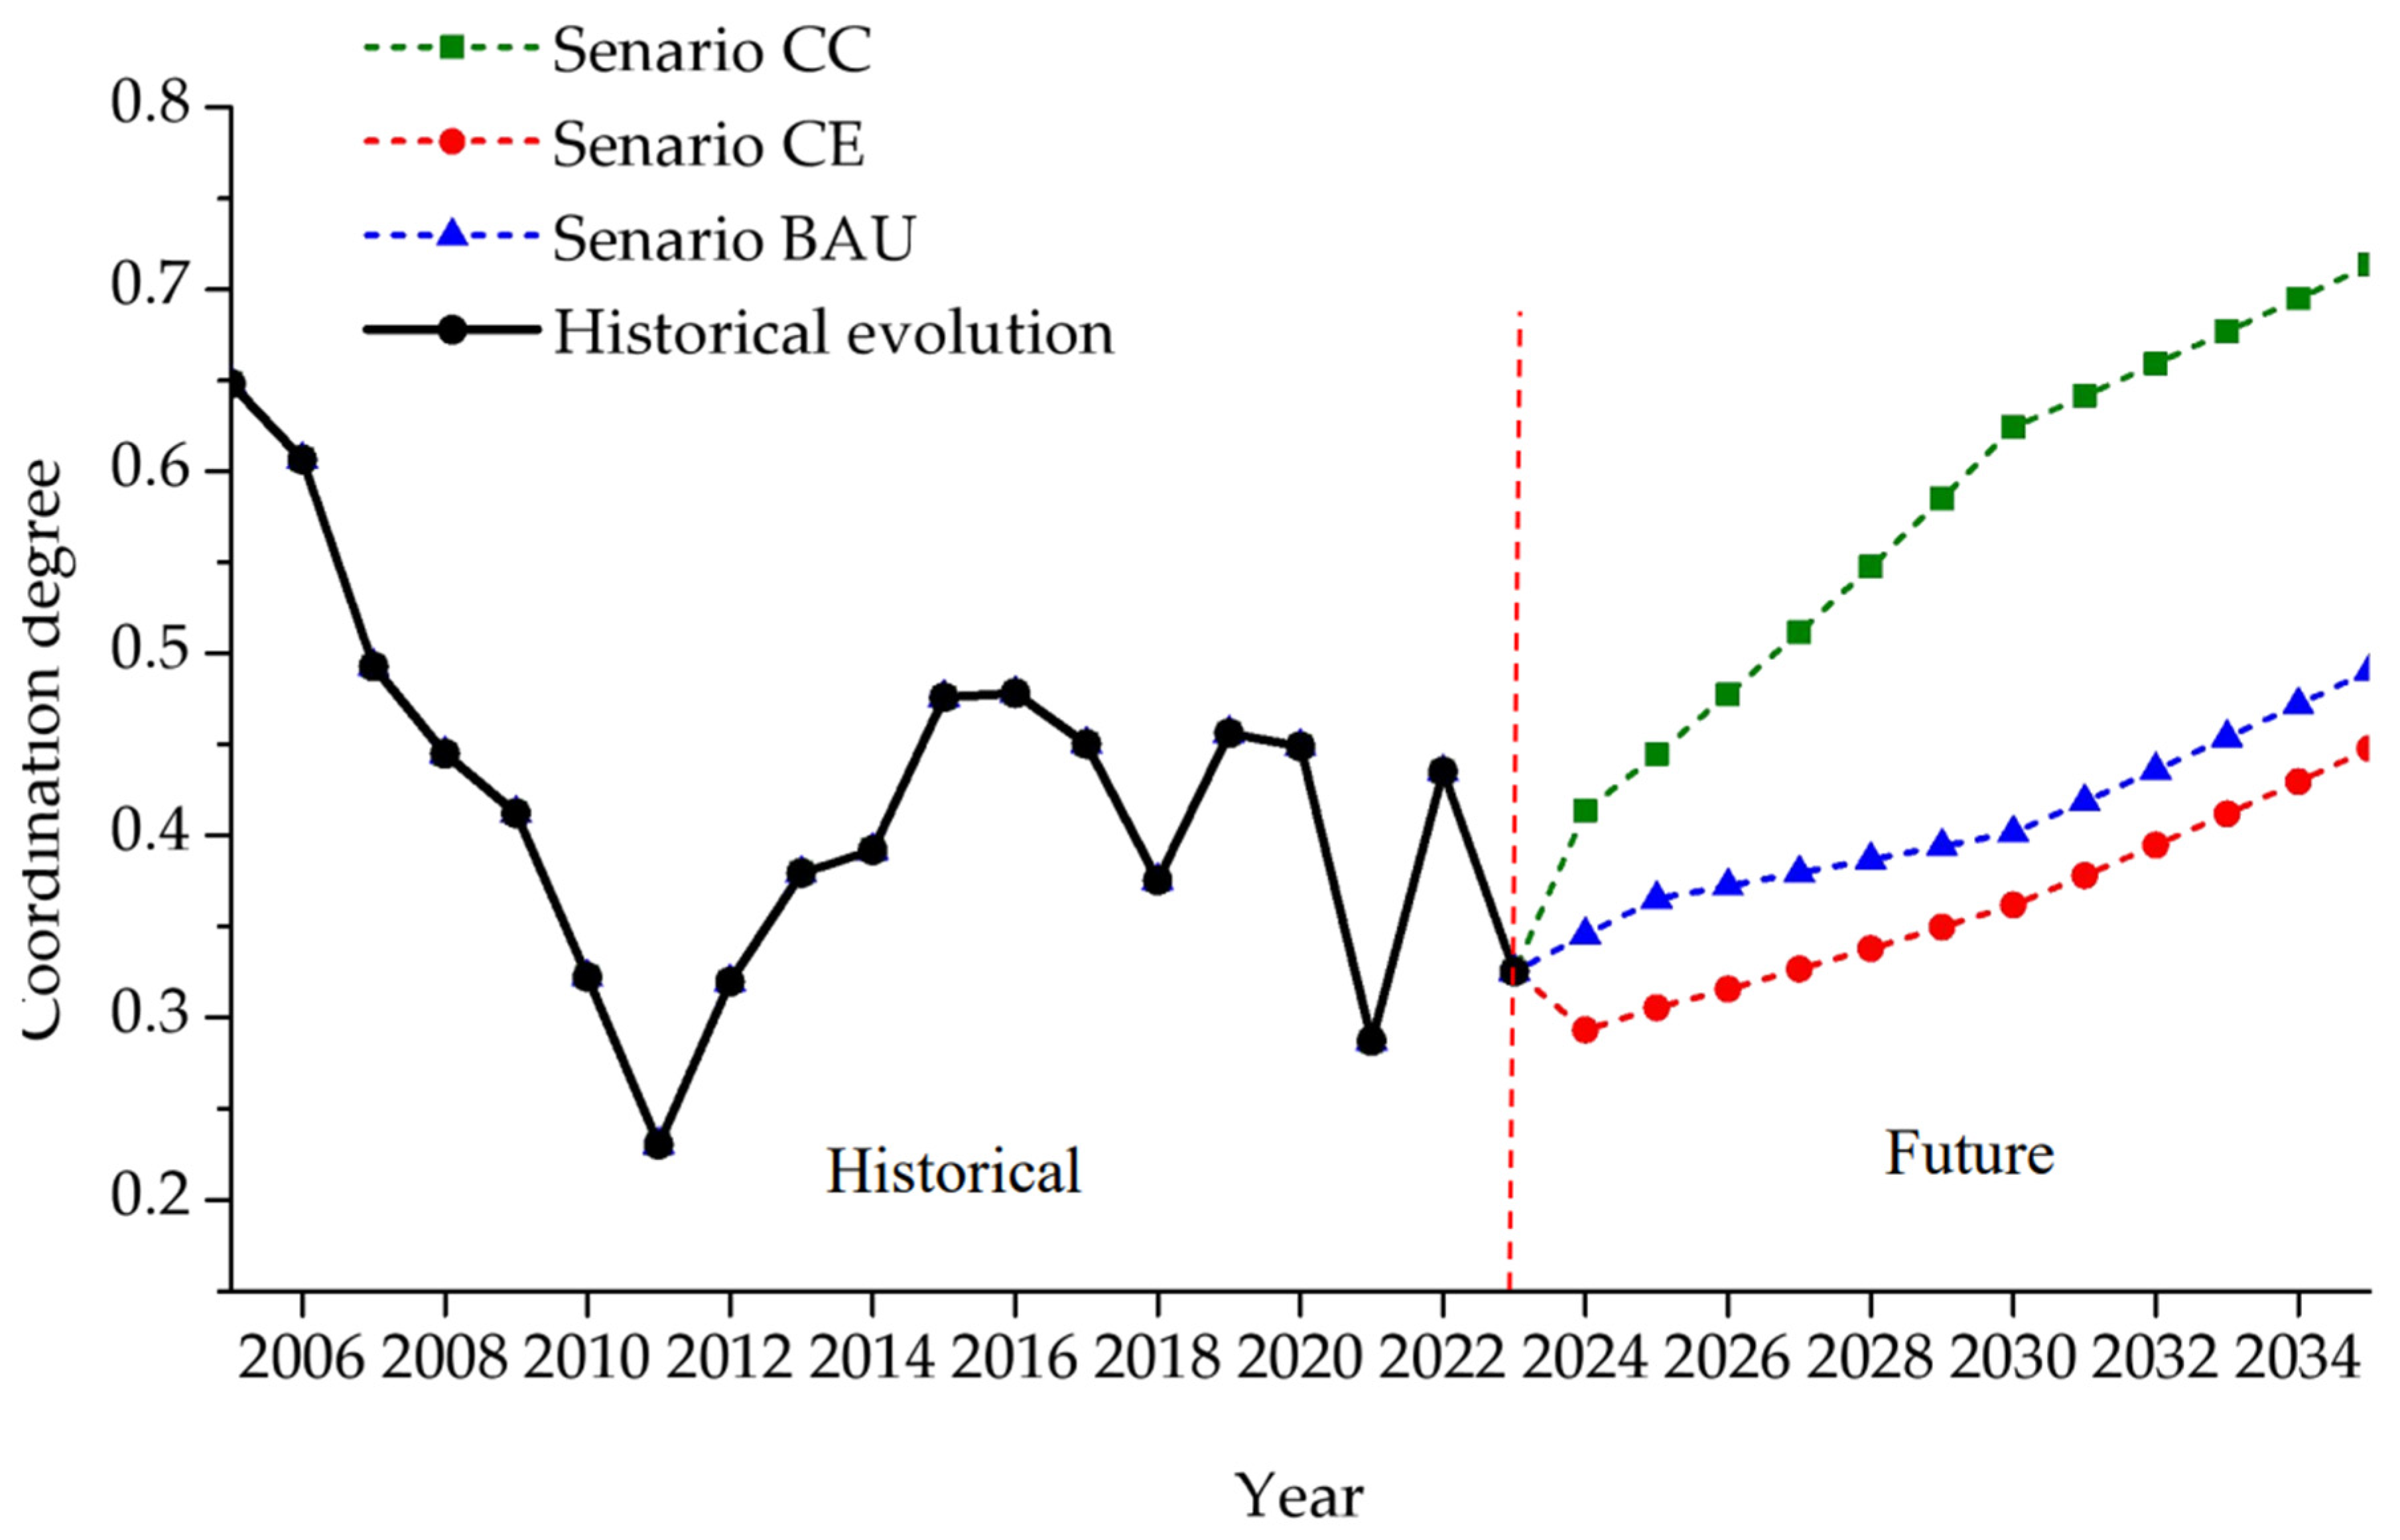
Figure 6.
Evolution of 3E system coupling degree under three policy scenarios.

Figure 7.
Evolution patterns and future trajectory of Guangdong’s total energy consumption (2005-2035).
Figure 7.
Evolution patterns and future trajectory of Guangdong’s total energy consumption (2005-2035).
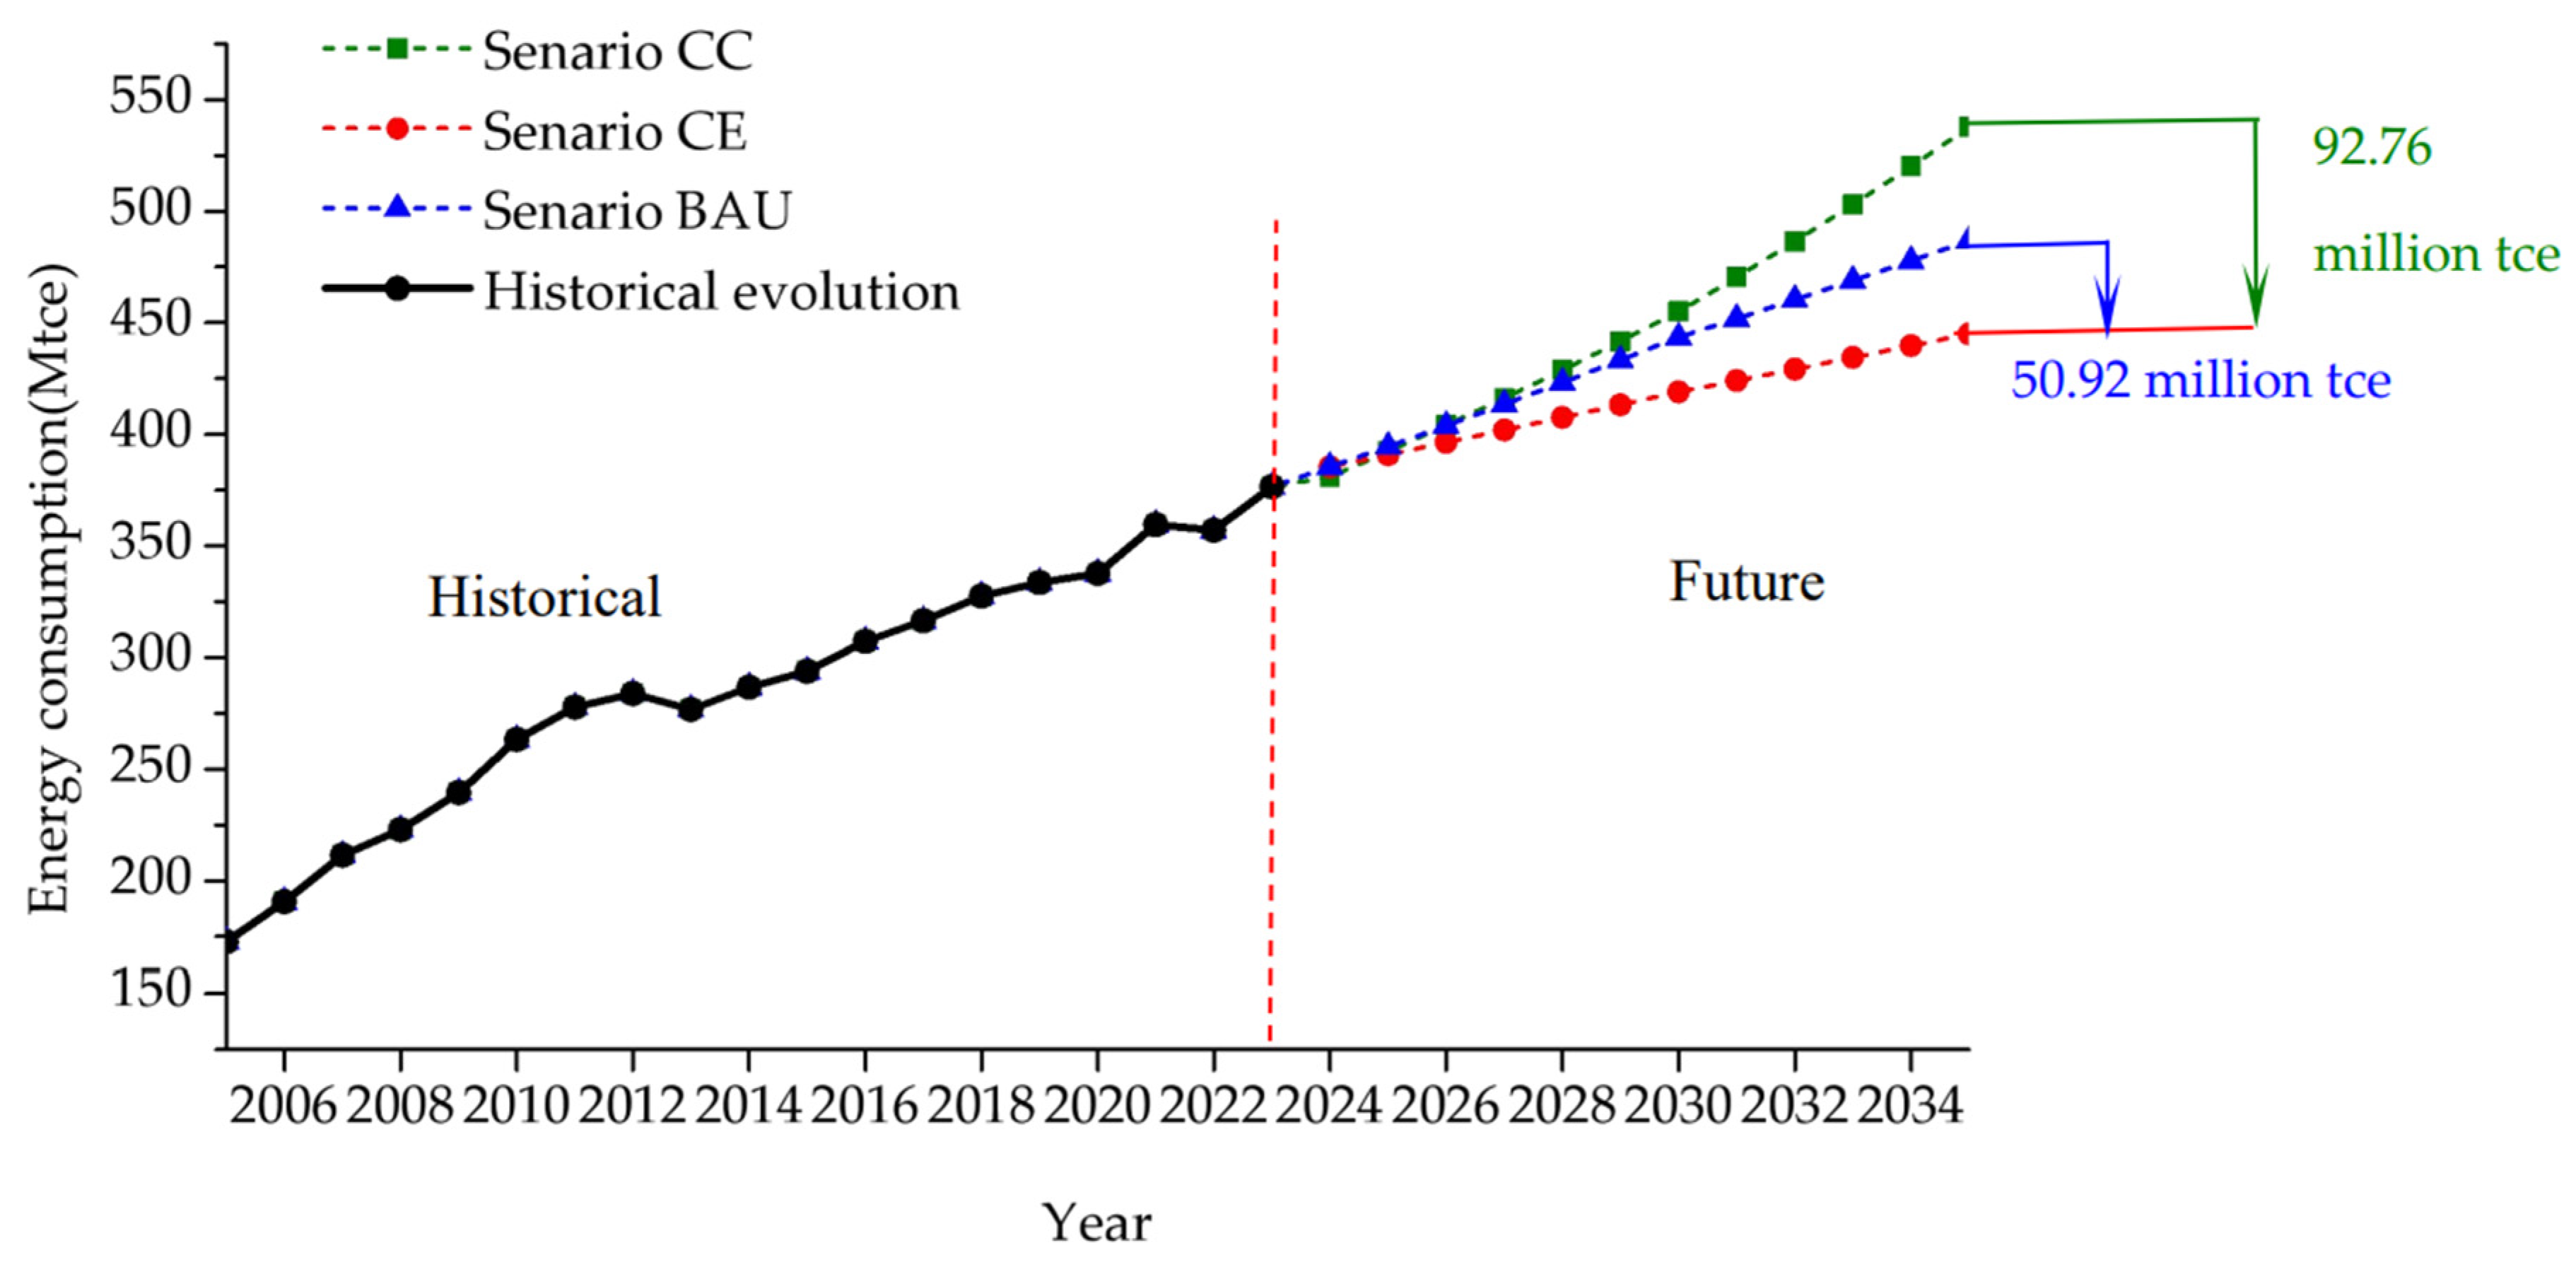
Figure 8.
Evolution patterns and future trajectory of Guangdong’s carbon emissions (2005-2035).
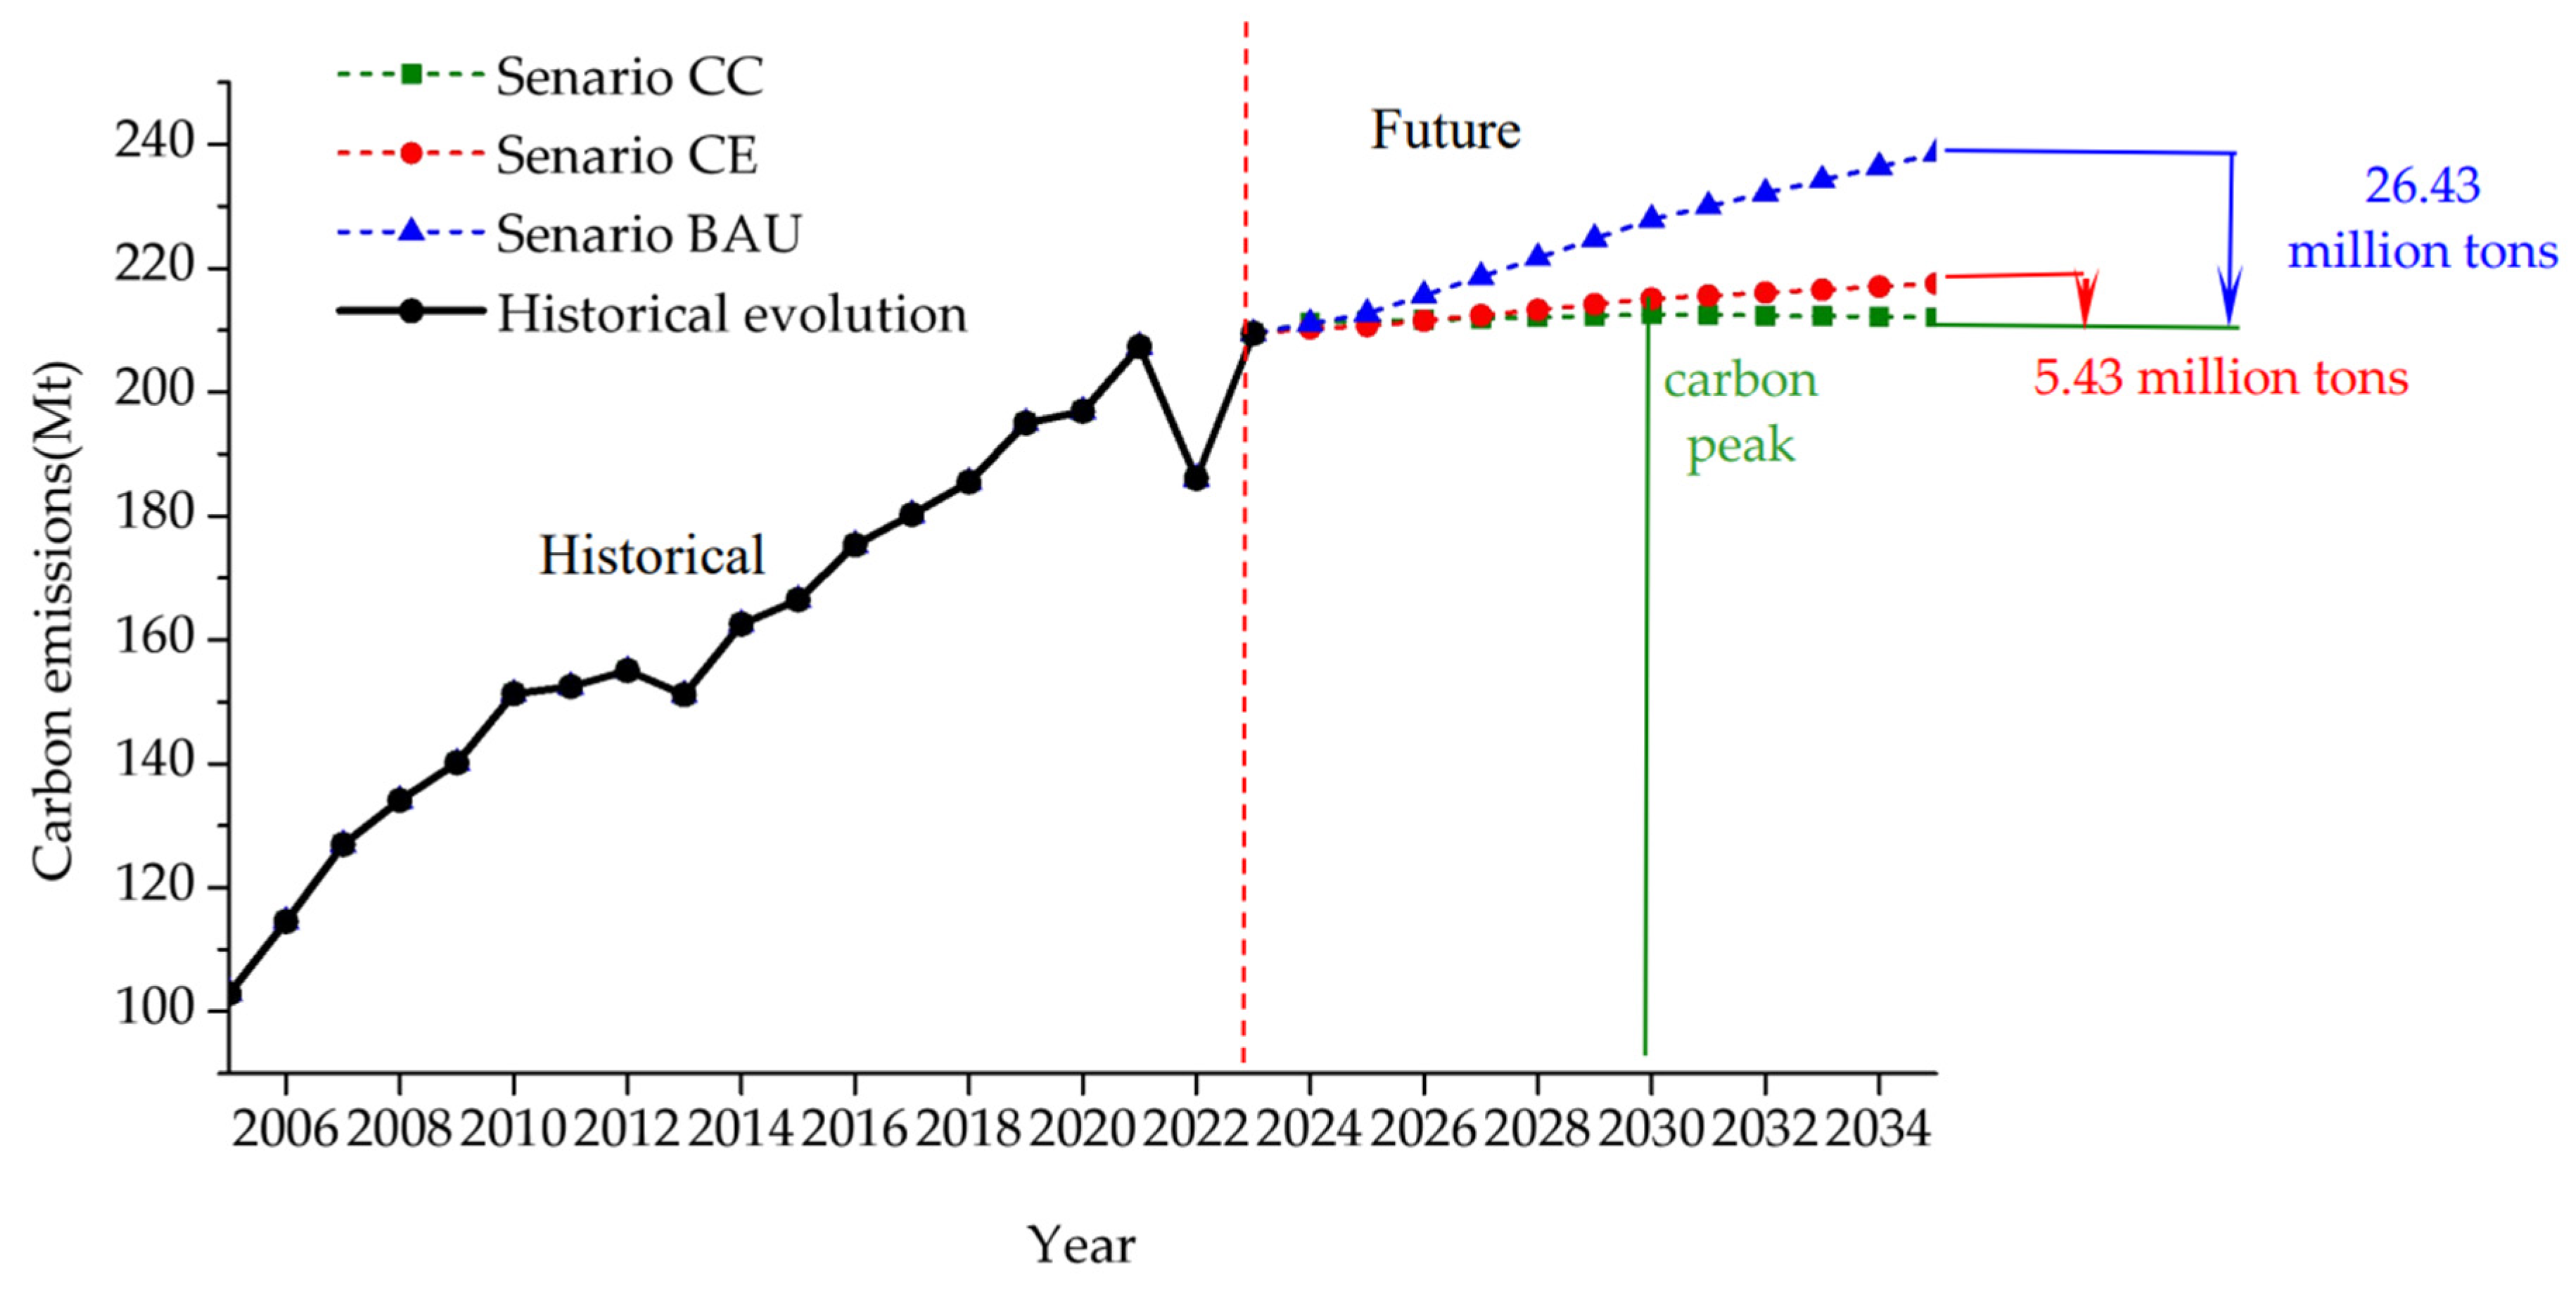
Figure 9.
Evolution patterns of decoupling status between economy-energy and economy-emissions in Guangdong (2005-2035).
Figure 9.
Evolution patterns of decoupling status between economy-energy and economy-emissions in Guangdong (2005-2035).
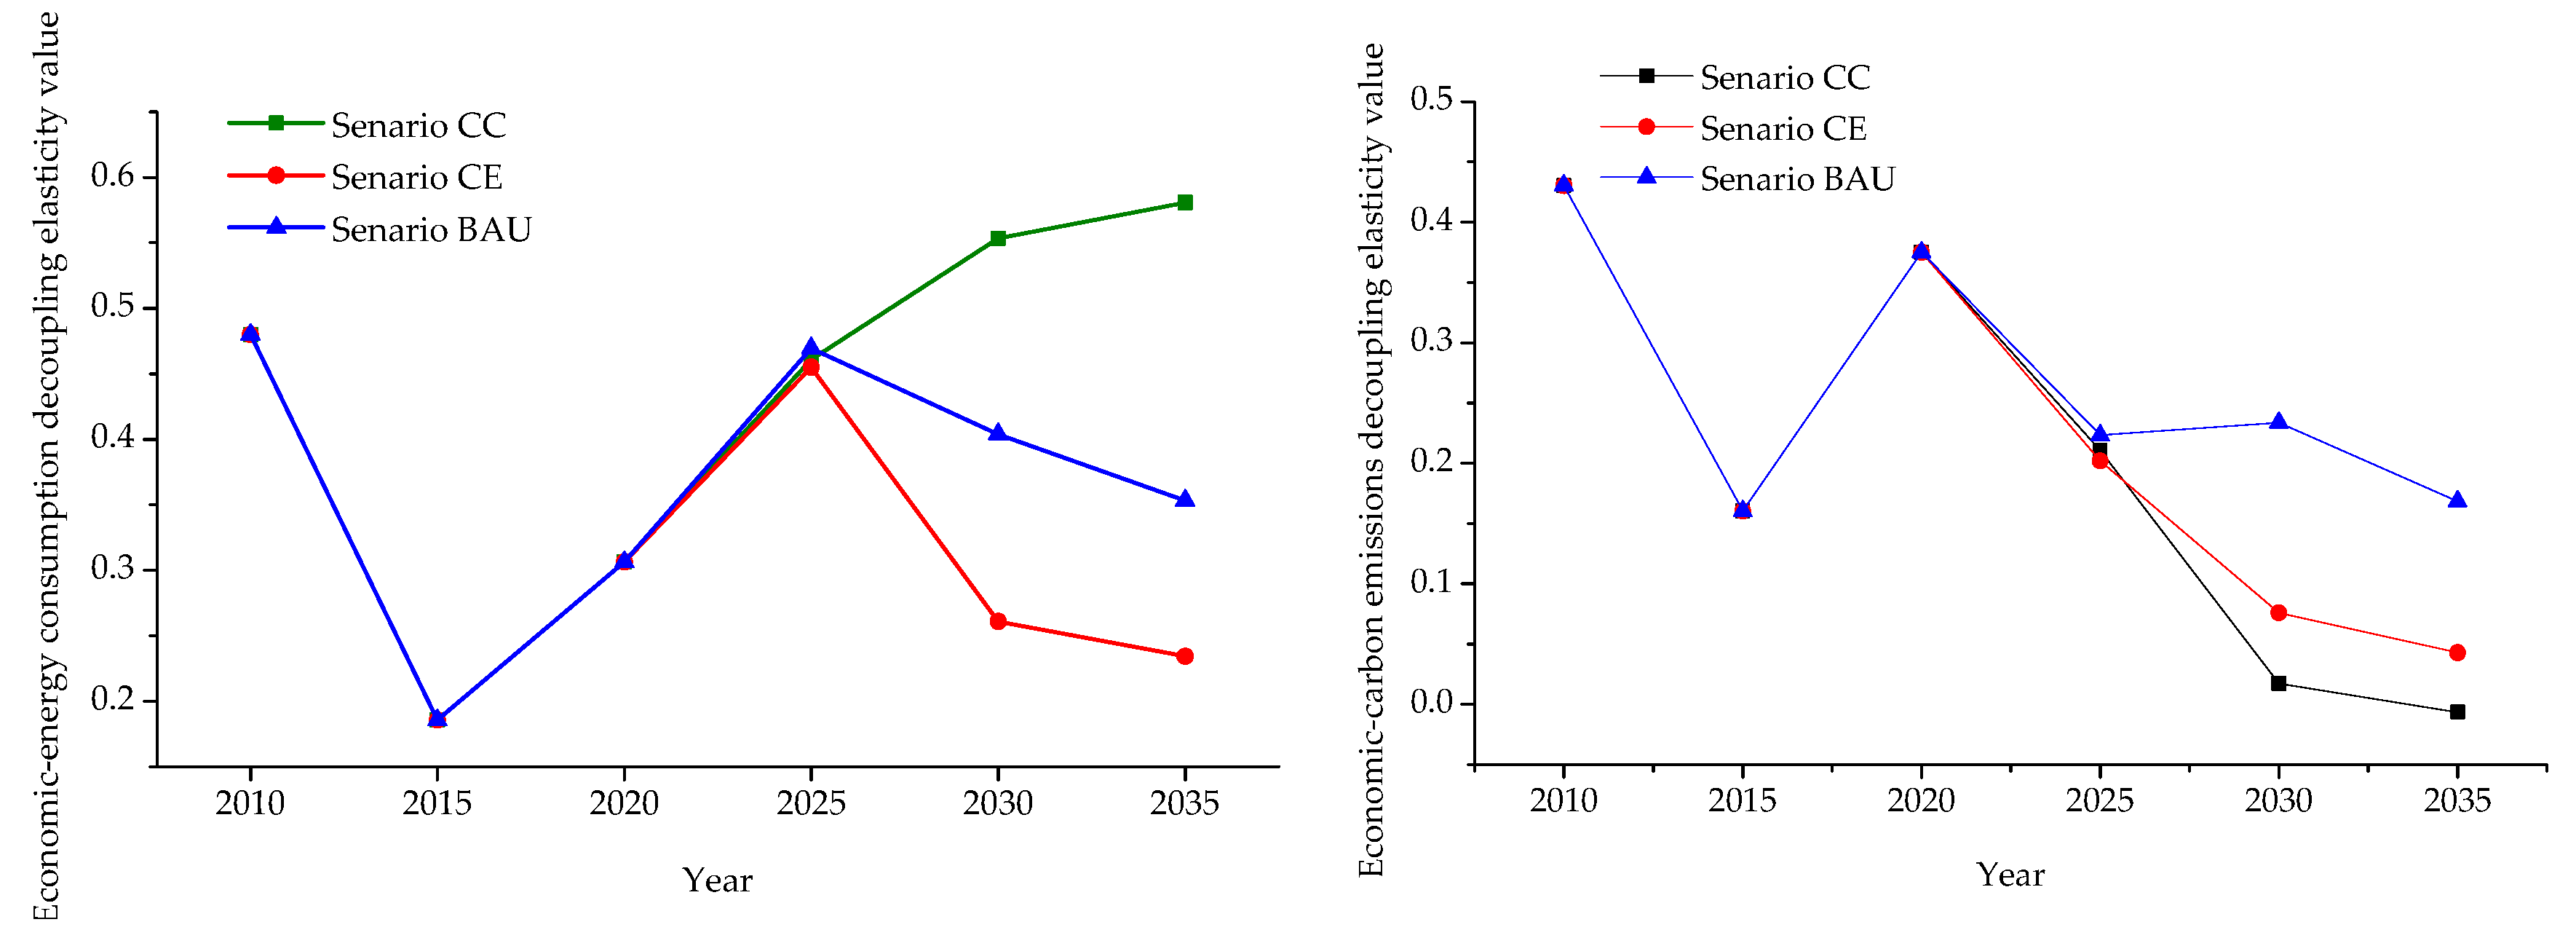
Figure 10.
Transmission pathway of 3E system coupling coordination mechanism via triple-triangle framework.
Figure 10.
Transmission pathway of 3E system coupling coordination mechanism via triple-triangle framework.
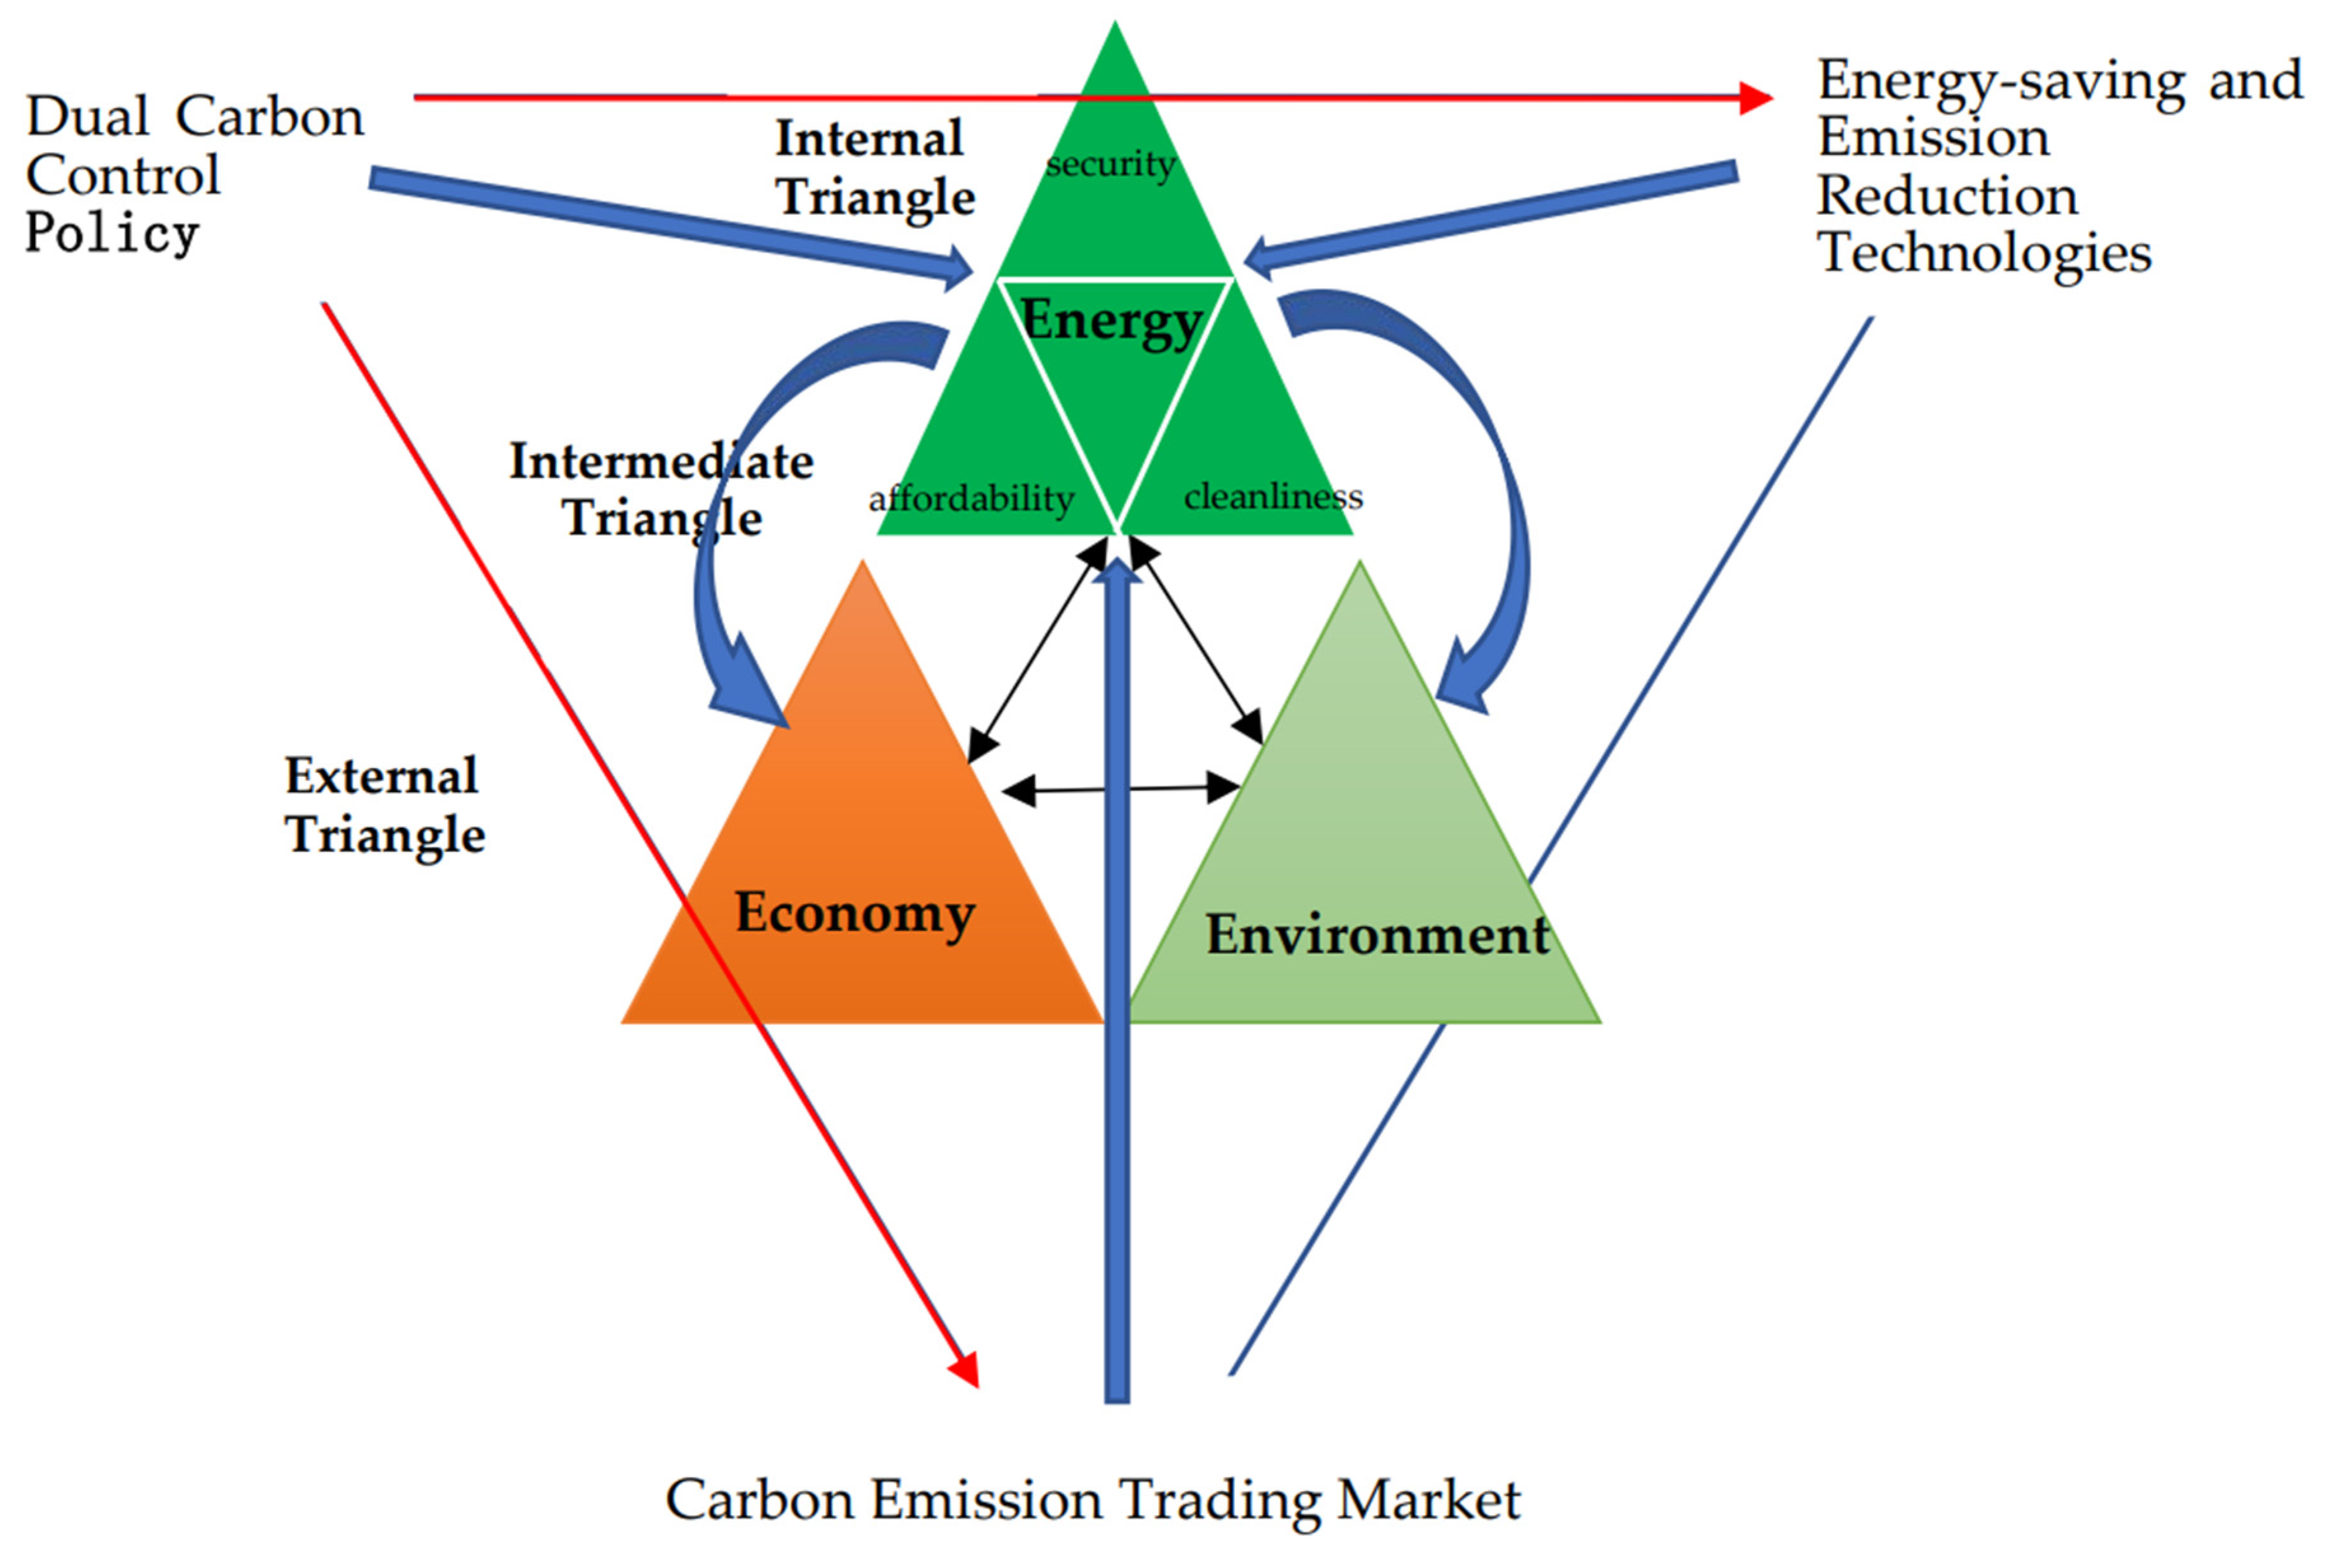
Figure 11.
Energy structure and efficiency under dual carbon control (CC) scenario.
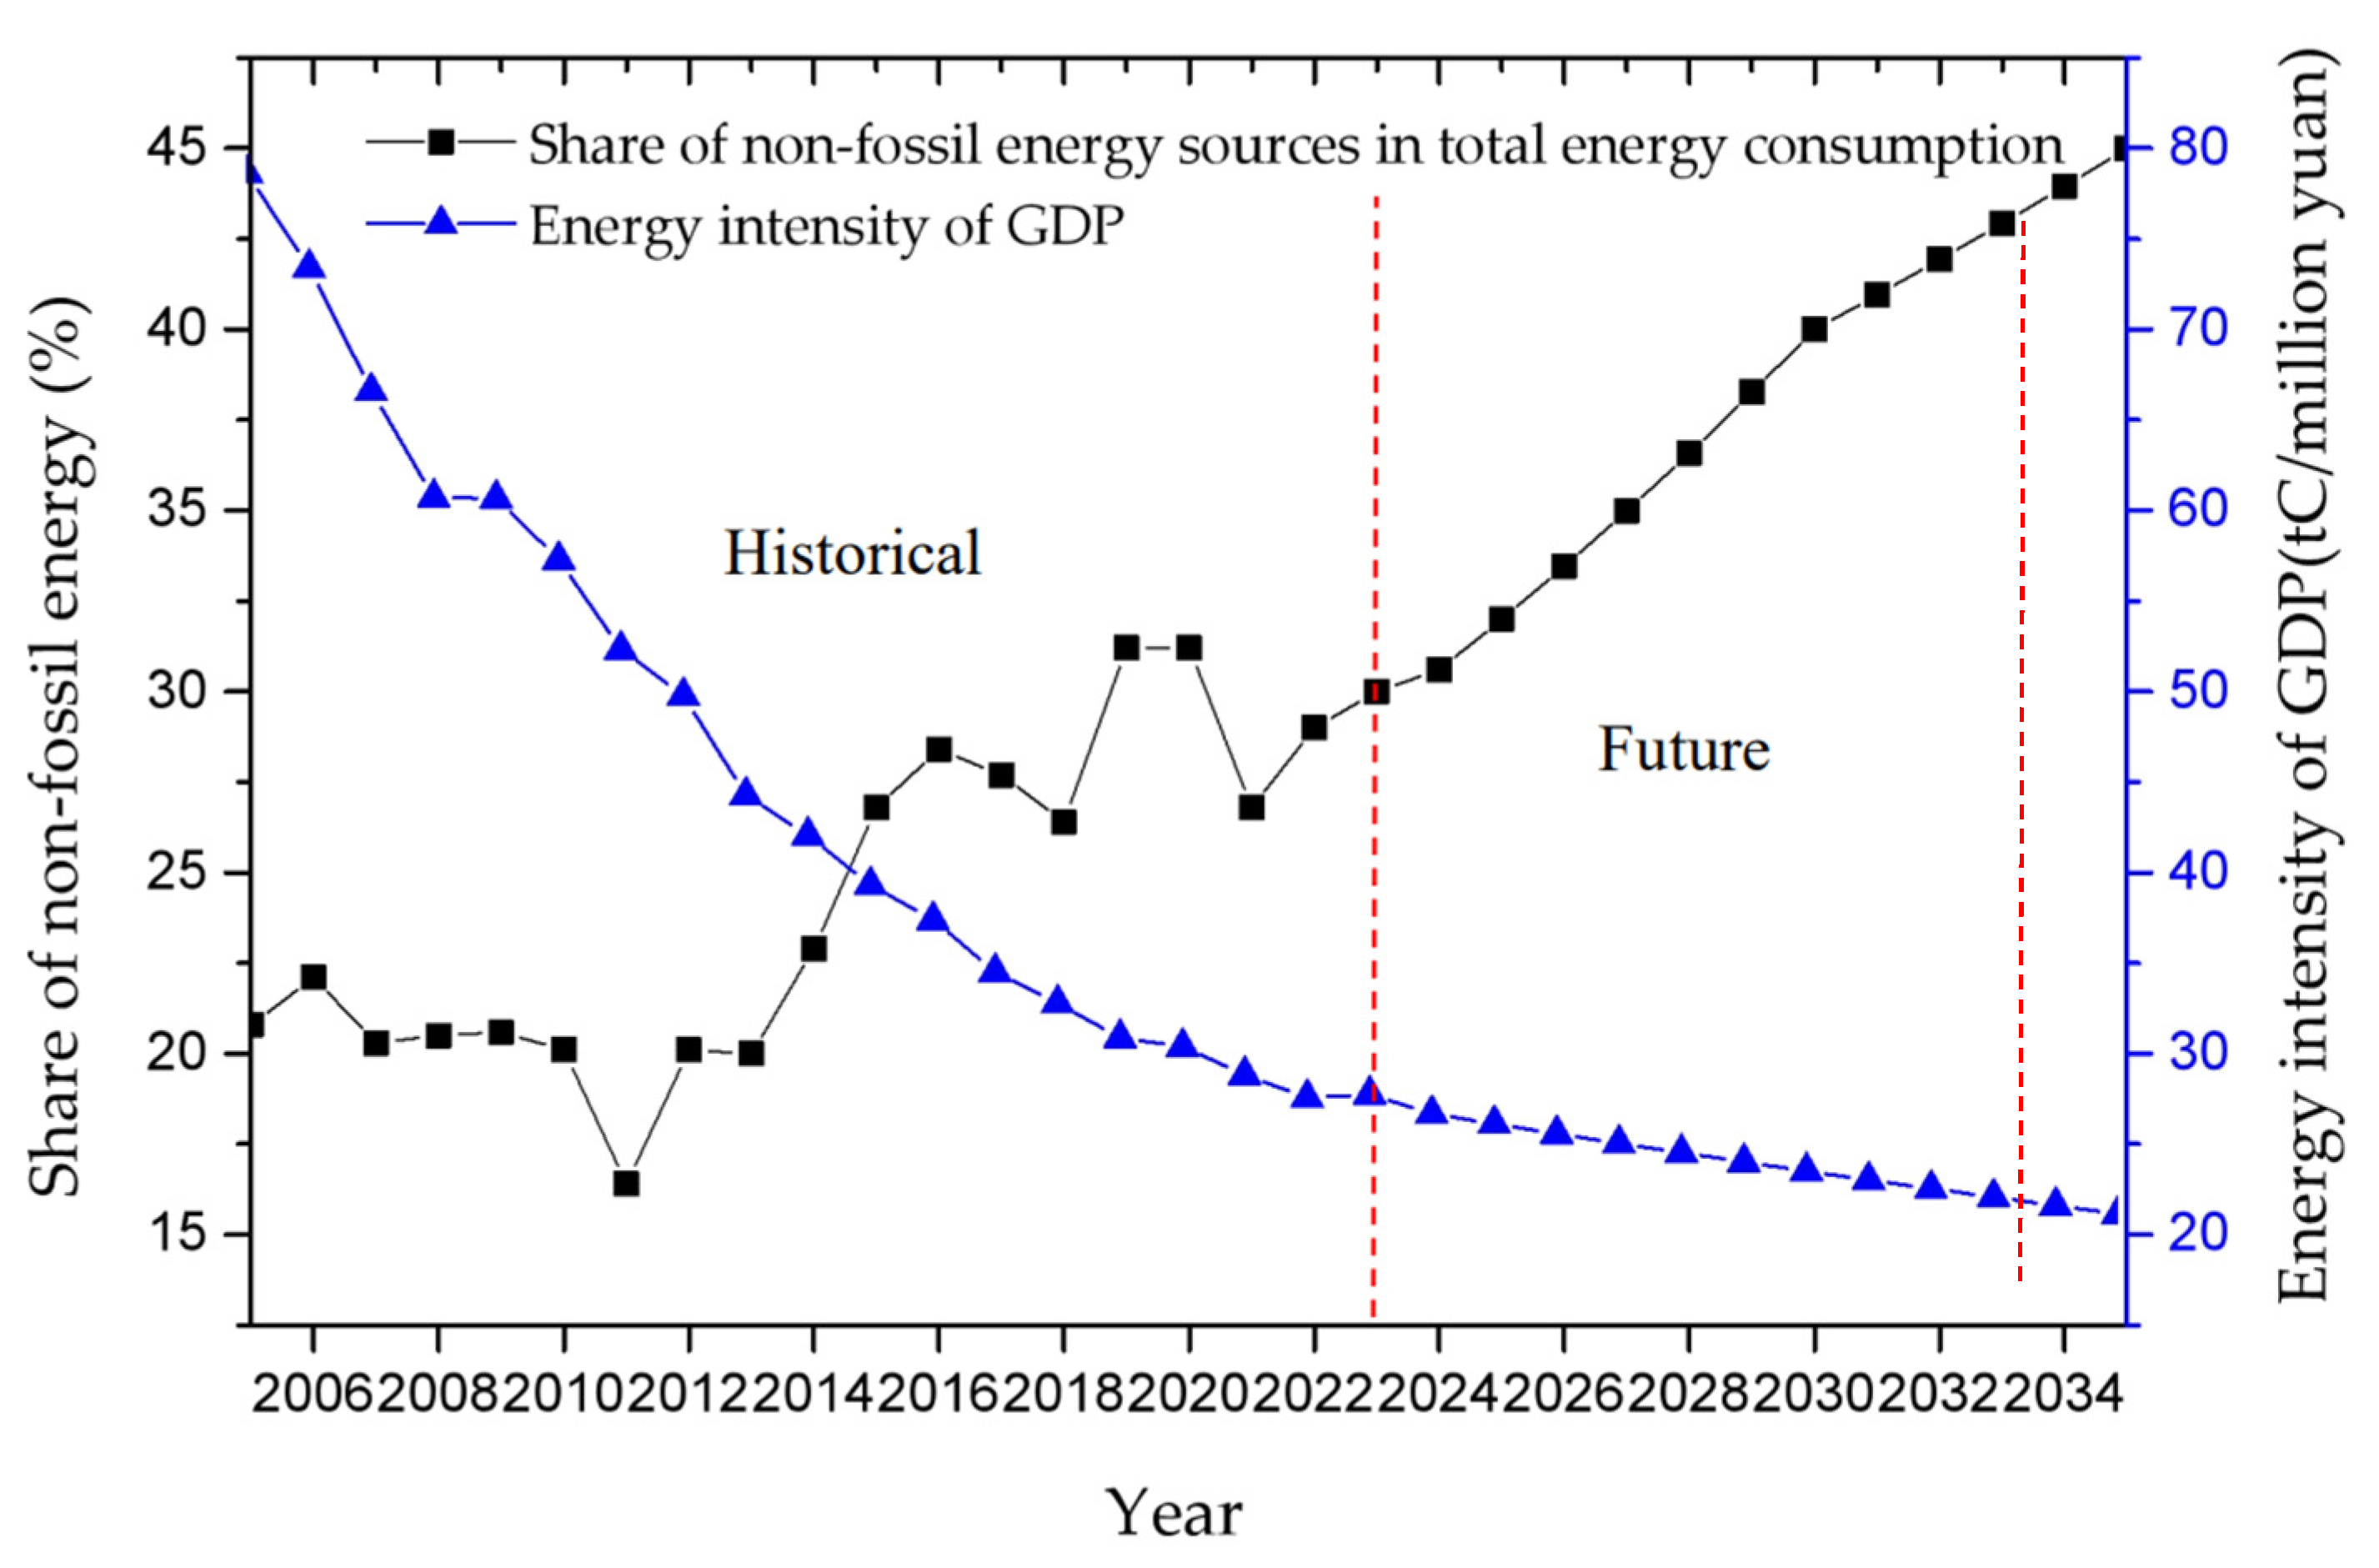
Figure 12.
Power installed capacity structure under dual carbon control (CC) scenario.
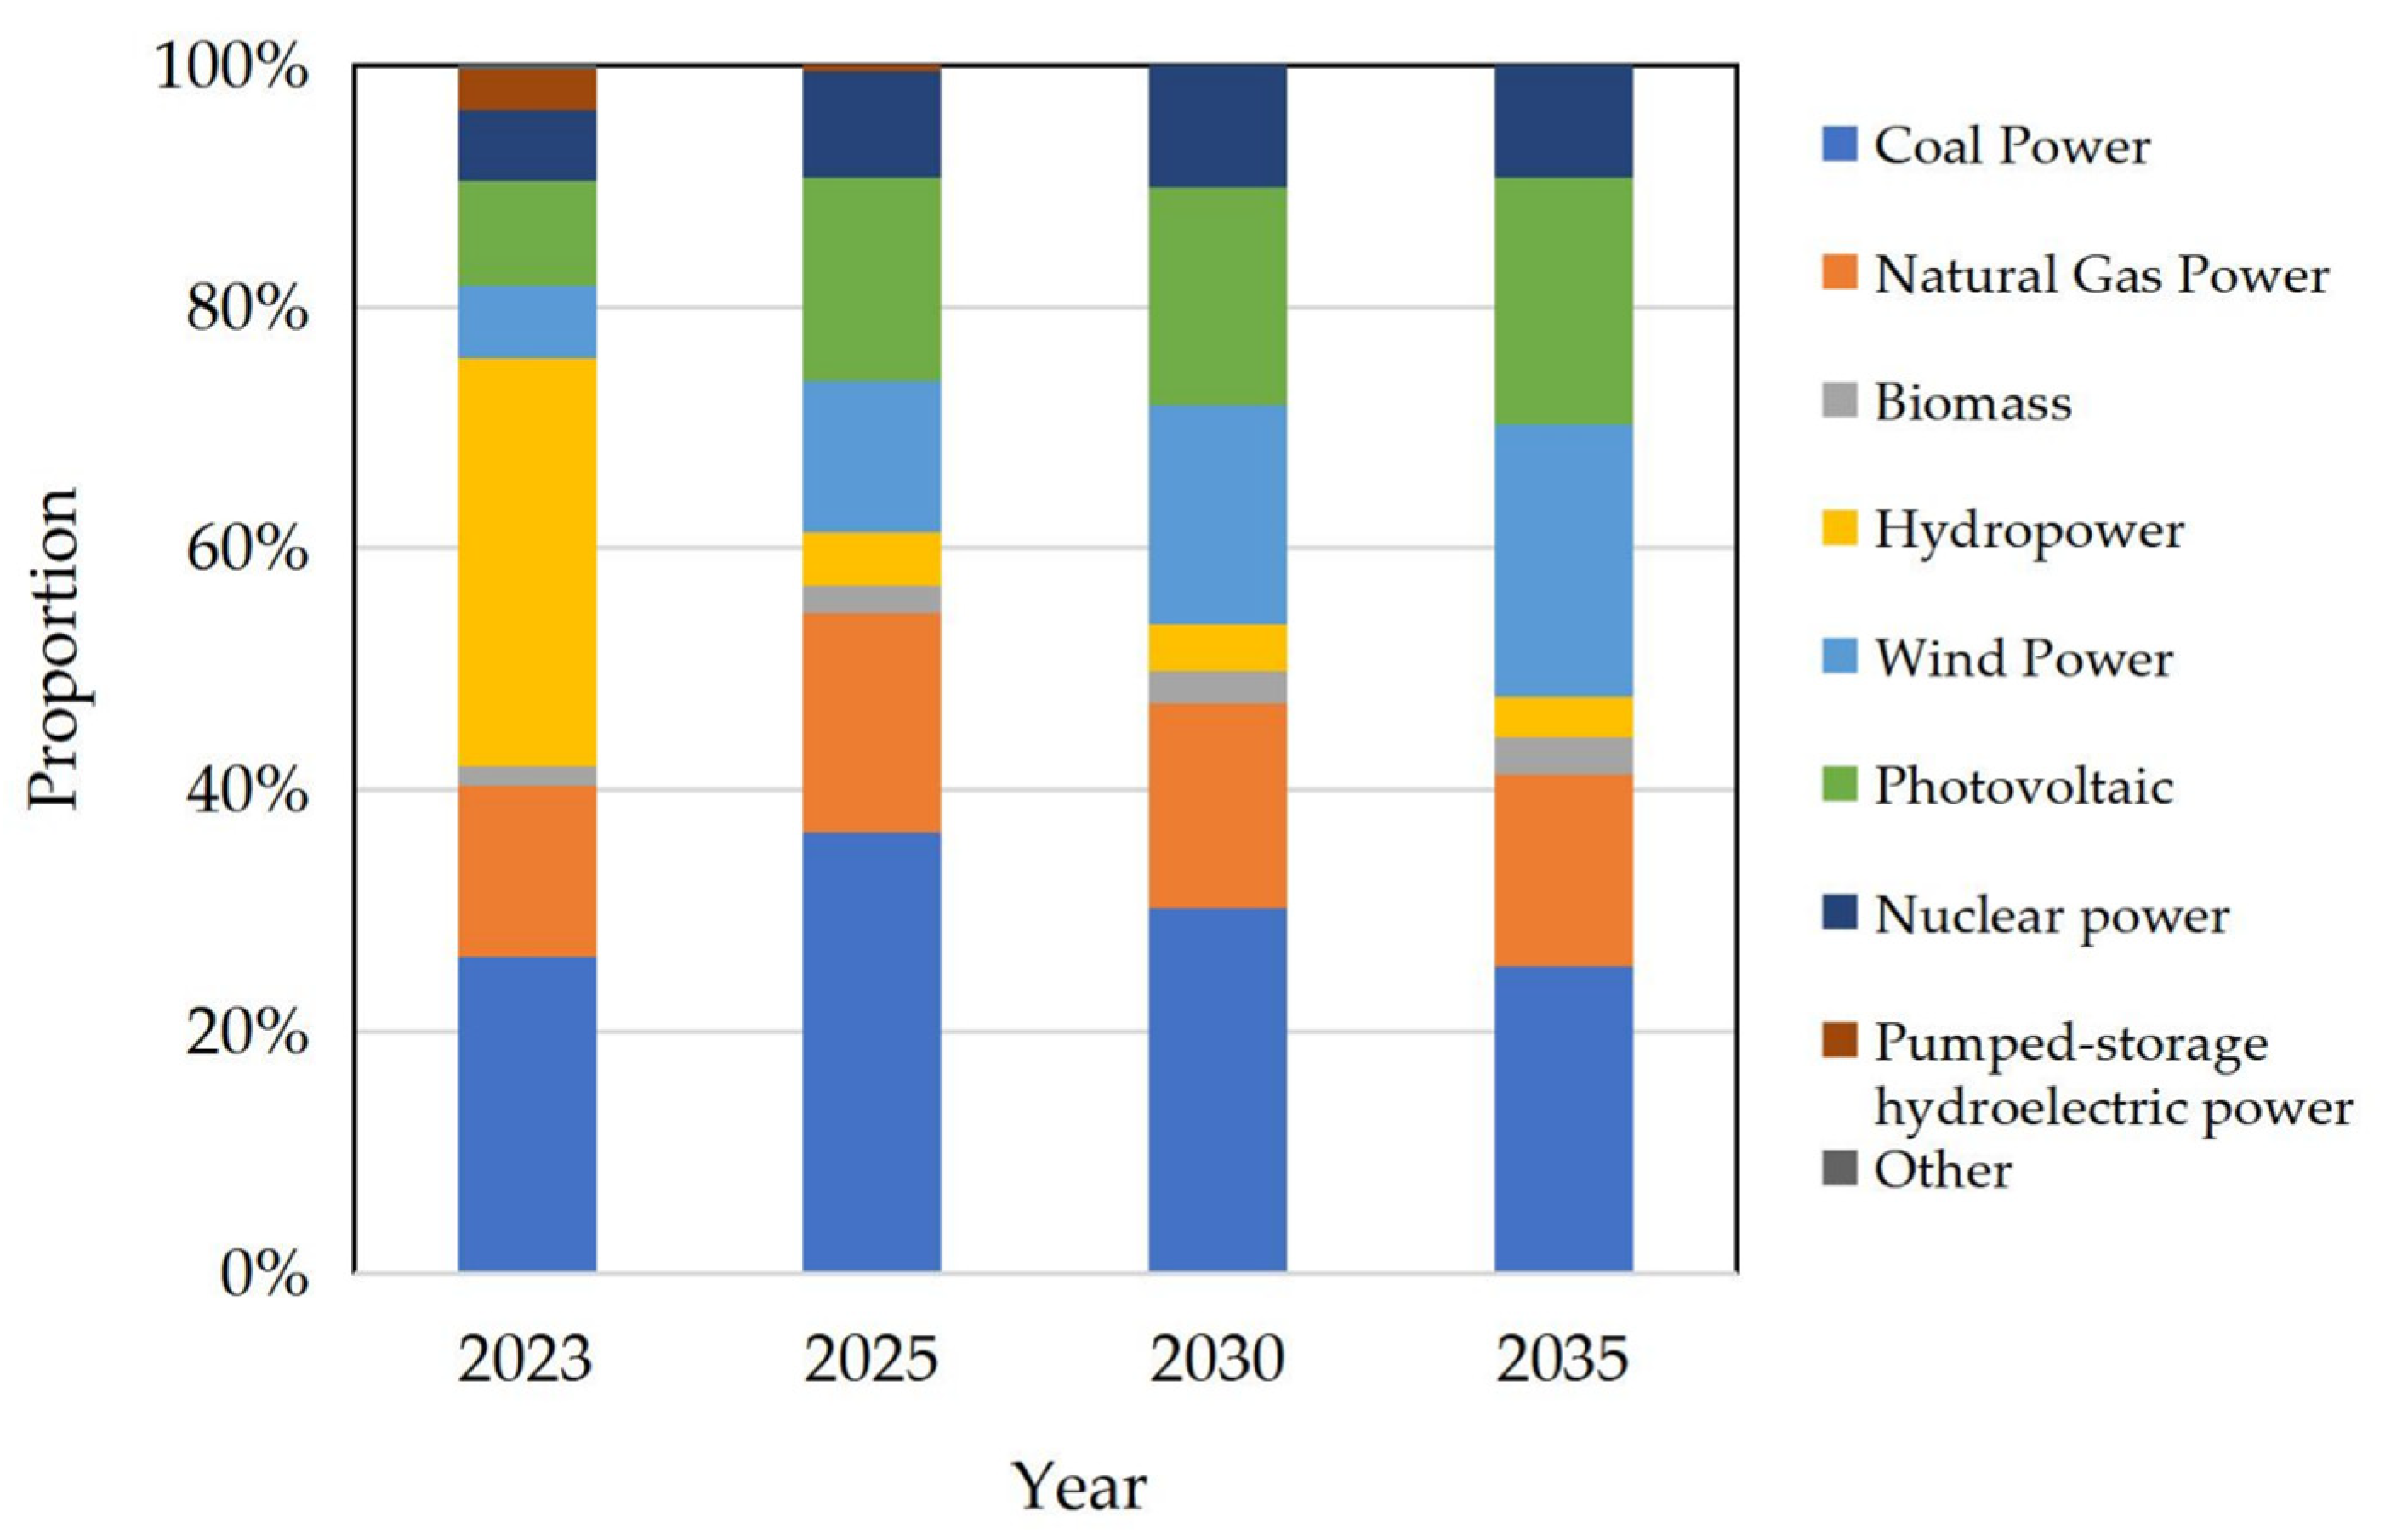
Figure 13.
Change trends of carbon intensity and carbon sinks during 2005-2035.
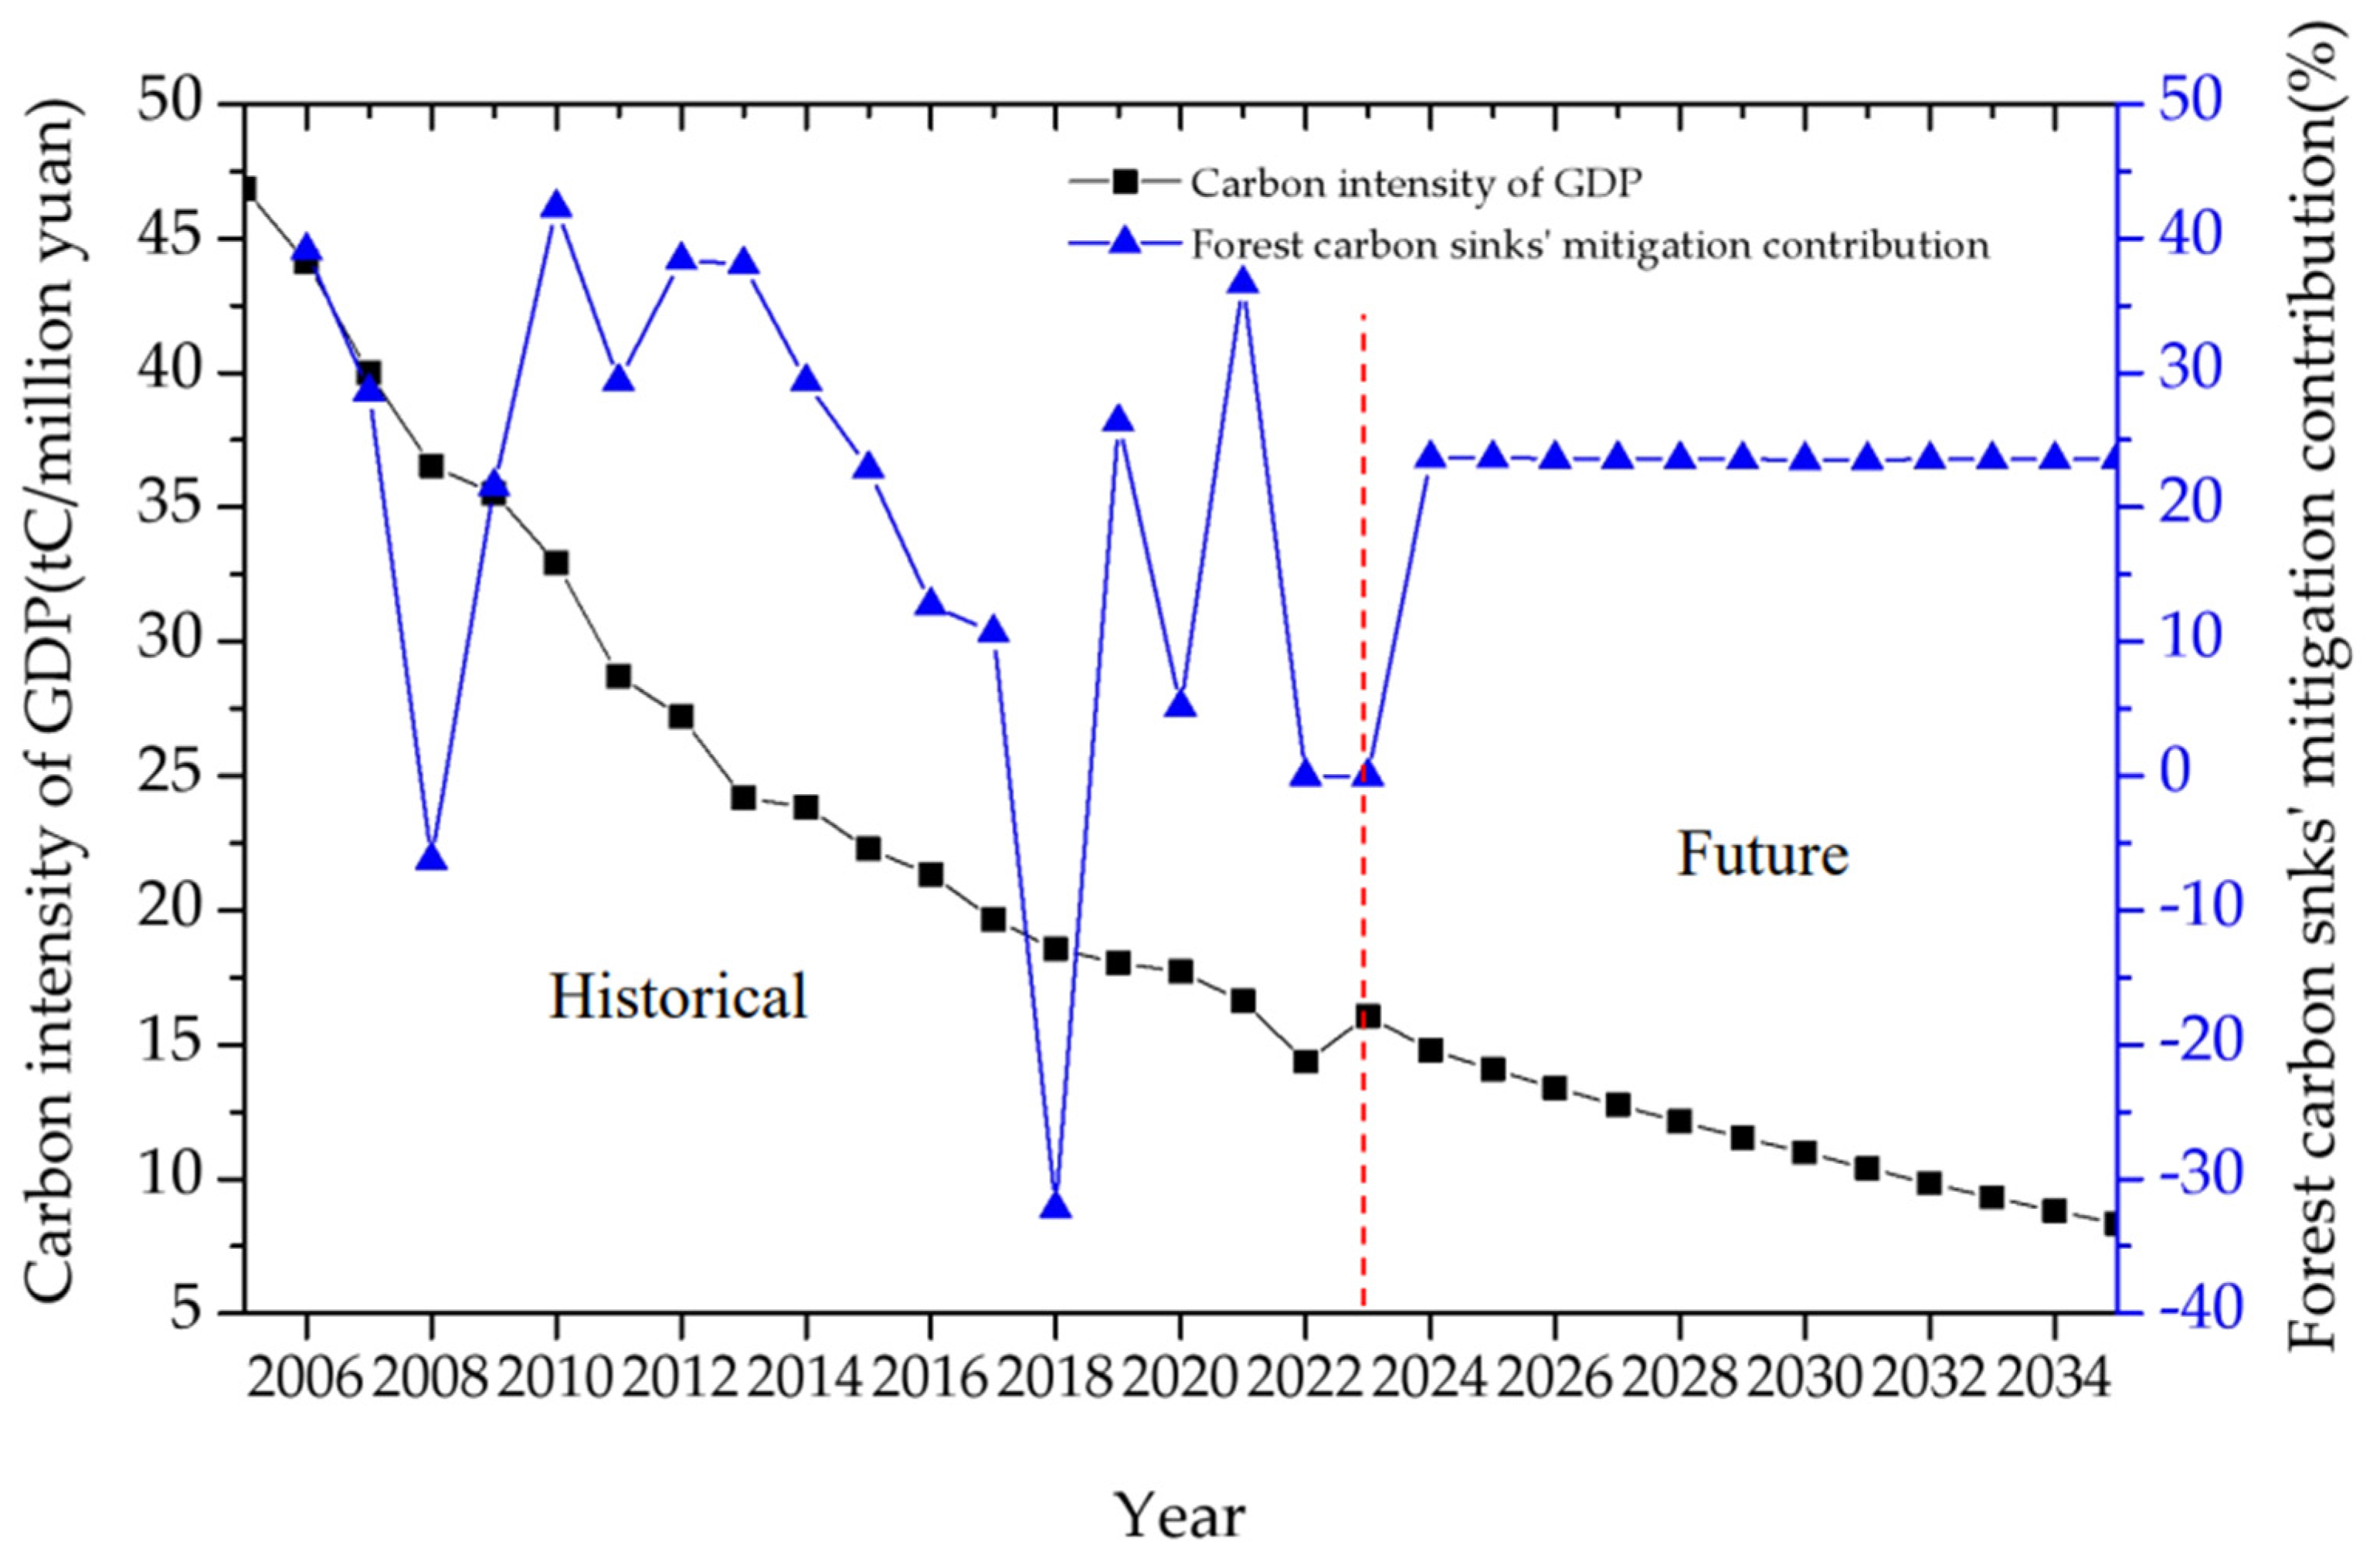
Table 1.
System index of 3E system.
| 3E System Index | |
|---|---|
| Economic subsystem (2) | Gross GDP (+) Proportion of tertiary industry (+) |
| Energy subsystem (3) | Total energy consumption (-) Self-sufficiency rate of energy (+) Share of non-fossil energy (+) |
| Environment subsystem (2) | Carbon emissions (-) |
| Carbon sinks(+) |
Note:“+” represent positive index; “-” represent negative index.
Table 2.
Description of scenario parameters.
| Scenarios | Scenario description | Parameter setting |
|---|---|---|
| Business-as-Usual (BAU) | Continuation of existing policies with maintained Dual Energy Control mechanism. | (1)Economic Targets GDP annual growth rate: 5.5% for 2025-2030, declining to 5% for 2030-2035. Service sector proportion increases steadily at the average growth rate observed during the 14th Five-Year Plan period. (2) Energy Constraints Energy intensity reduction target remains consistent with the 14th Five-Year Plan (14%). Non-fossil energy consumption share rises steadily at the Plan’s average growth rate. (3)Environmental Boundaries Carbon intensity reduction target is marginally lower than the 14th Five-Year Plan (18%). Forest carbon sink increases by 40 million metric tons annually. |
| Enhanced Dual Energy Control (EC) | Building upon the BAU scenario, this intensifies Dual Energy Control targets. | (1)Economic Impacts Energy controls moderately decelerate economic growth: GDP annual growth averages 5% during 2025-2030 and 4.8% during 2030-2035. Service sector proportion remains consistent with the BAU scenario. (2)Energy Constraints Energy intensity reduction margin increases to 16% (relative to BAU). Non-fossil energy consumption share rises marginally relative to BAU. (3) Environmental Regulations Carbon intensity reduction target escalates to 20%. Strengthened ecological restoration measures boost forest carbon sink by 45 million metric tons annually. |
| Dual Carbon Control (CC) | Comprehensive implementation of Dual Control of Carbon Emissions (Total Volume & Intensity). | (1)Economic Trajectory GDP annual growth averages 5.2% during 2025-2030, accelerating to 5.6% during 2030-2035. Service sector proportion increases steadily. (2)Energy Constraints Although assessments of total energy consumption and intensity are discontinued, carbon intensity reduction drives energy intensity down by approximately 10%. Non-fossil energy consumption share rises steadily relative to BAU. (3)Environmental Targets Carbon intensity declines by 22% during 2026-2030 and 24% during 2031-2035. Through forest quality enhancement, area expansion, and ecological restoration, forest carbon sink increases by 50 million metric tons annually. |
Disclaimer/Publisher’s Note: The statements, opinions and data contained in all publications are solely those of the individual author(s) and contributor(s) and not of MDPI and/or the editor(s). MDPI and/or the editor(s) disclaim responsibility for any injury to people or property resulting from any ideas, methods, instructions or products referred to in the content. |
© 2025 by the authors. Licensee MDPI, Basel, Switzerland. This article is an open access article distributed under the terms and conditions of the Creative Commons Attribution (CC BY) license (https://creativecommons.org/licenses/by/4.0/).
Copyright: This open access article is published under a Creative Commons CC BY 4.0 license, which permit the free download, distribution, and reuse, provided that the author and preprint are cited in any reuse.


