
Submitted:
22 May 2025
Posted:
22 May 2025
You are already at the latest version
Abstract
Empathy has been linked to enhanced processing of social information, yet the neurophysiological correlates of such individual differences remain underexplored. Objectives: The aim of this study was to investigate how individual differences in trait empathy are reflected in oscillatory brain activity during the perception of non-verbal social cues. Methods: In this EEG study involving 30 participants, we examined spectral and time-frequency dynamics associated with trait empathy during a visual task requiring the interpretation of others' body gestures. Results: FFT Power spectral analyses revealed that individuals with high empathy quotients (High-EQ) exhibited significantly increased beta-band activity over frontal regions and decreased alpha-band activity over occipito-parietal areas compared to their low-empathy counterparts (Low-EQ), suggesting heightened attentional engagement and reduced cortical inhibition during social information processing. In contrast, time-frequency analysis using Morlet wavelets showed no significant group differences in mu rhythm suppression, challenging prior claims linking mu desynchronization to mirror neuron activity in empathic processing. These findings align with recent literature associating frontal beta oscillations with top-down attentional control and emotional regulation, and posterior alpha with vigilance and sensory disengagement. Conclusions: Our results indicate that empathic traits are differentially reflected in anterior and posterior oscillatory dynamics, supporting the notion that individuals high in empathy deploy greater cognitive and attentional resources when decoding non-verbal social cues. These neural patterns may underlie their superior ability to interpret body language and mental states from visual input.

Keywords:
EEG
; time frequency
; Alpha
; Mu suppression
; Attention
; Individual differences
; Mirror Neurons
; Empathy
1. Introduction
The aim of the present study was to investigate whether EEG oscillatory activity, measured through both Fast Fourier Transform (FFT) and time–frequency wavelet analysis, differed between neurotypical individuals with low versus high levels of trait empathy during a task requiring the interpretation of gestures and body postures (i.e., body language comprehension). While some studies suggest an enhancement of sensorimotor activity—reflected in “mu” rhythm suppression (or Event-related desynchronization, ERD, [1])—during the observation of actions or socio-affective stimuli in highly than less empathic individuals, others have failed to replicate such findings and, in fact, reported evidence to the contrary, proposing instead that empathy may be associated with increased alpha power over the right frontal areas (right frontal alpha asymmetry: e.g., [2,3]).
The evidence on this matter remains limited and inconclusive. For instance, Woodruff et al. [4] investigated the relationship between mu rhythm suppression and empathic abilities. They found that individuals showing greater differences in mu suppression between action execution and observation scored higher on the perspective-taking subscale of the Interpersonal Reactivity Index, suggesting that these mu modulation patterns may reflect individual differences in empathic perspective-taking. Similarly, Hoenen et al. [5] observed stronger mu suppression when participants viewed actors associated with sad narratives compared to neutral ones. In that study, state empathy was positively correlated with the difference in mu suppression between executed and observed movements, indicating that top-down empathic processes can modulate mirror neuron activity. In the same vein, Peled-Avron et al. [6] examined neural responses to observed human social touch. Their findings showed that individuals with higher empathic traits exhibited greater mu suppression when observing social as opposed to nonsocial or absent touch. Notably, higher levels of personal distress—a component of empathy—predicted both stronger mu suppression and more positive emotional evaluations of the observed touch, underscoring the influence of empathy on sensorimotor resonance. It is thought that mu suppression, associated with motor processing such as action imitation and mimicry [7,8], gesture observation [9,10,11,12], tool perception [13], and motor imagery [14], may reflect heightened attentional engagement during action observation in individuals with higher empathy, rather than serving as a direct marker of empathic traits or mirror system activity.
On the opposite side, other studies have failed to find an association between mu suppression and empathy. In a large-scale study involving more than 250 participants, DiGirolamo et al. [15] reported no significant relationship between trait empathy and mu suppression during action observation. These findings suggest that mu suppression may be more sensitive to state-dependent cognitive variables, such as selective attention, than to stable empathic dispositions. Similarly, Goodarzi et al. [16] found no significant associations between mu suppression and empathy scores in a sample of male nurses. Together, these null findings reinforce the idea that mu rhythm suppression may not be a reliable index of trait empathy per se and highlight the potential role of alternative factors—such as attentional engagement or social interest—in modulating empathic responses. They also underscore the complexity of the interplay between sensorimotor resonance and empathy, highlighting the importance of considering both attentional and emotional factors in understanding empathic processes. It should further be noted that mu rhythm may be confounded with occipital alpha activity (at this regard see [17]), given that their distinction rests solely on the topographical origin of the signal—namely, the sensorimotor cortex as opposed to occipital or occipito/parietal regions.
In the present study, we investigated whether alpha-band EEG spectral power (8–13 Hz) over occipito-parietal regions—which is typically interpreted as an index of attentional disengagement [18,19] will be lower in highly empathic individuals compared to less empathic ones during a task involving the inference of others' mental states based on visual analysis of body language. Furthermore, we propose that greater empathy will be associated with increased frontal beta-band power, in line with previous literature linking frontal beta activity to sustained attention [20] and higher-order cognitive processes such as mental state attribution.
In a recent Event Related Potential (ERP) study on gestures and body language comprehension [21] in healthy students it was found that individual differences in empathic traits significantly influenced both behavioral and neural responses. Specifically, participants with higher empathy levels exhibited faster response times and larger anterior frontal N250 responses to stimuli; this response was not only enhanced in high-empathy participants but also showed a positive correlation with empathy scores, suggesting a direct link between early socio-emotional processing and dispositional empathy. Furthermore, in a later time window, the N400 component recorded at fronto-central sites revealed a significant interaction between empathic traits, face presence, and semantic congruence. High-empathy individuals displayed a more pronounced differentiation between congruent and incongruent stimuli, indicating a heightened sensitivity to social-contextual alignment in emotionally salient scenarios, which correlated with the superior performance. It was hypothesized that high-EQ individuals were possibly paying more attention, or were more engaged in the body language comprehension task, whereas low-EQ individuals might be less attentively engaged or able to decipher bodily gestures. These data were here analyzed in the time frequency domain. To characterize frequency-specific neural dynamics associated with stimulus processing, a Fast Fourier Transform (FFT) power spectrum analysis was applied to ERP epochs extending from 150 ms to 800 ms post-stimulus onset. This time window was selected to exclude early sensory components and focus on sustained cognitive and sensorimotor activity. Spectral decomposition was conducted to quantify oscillatory power within four canonical EEG frequency bands: 8–13 Hz, encompassing alpha and mu rhythms typically implicated in attentional and sensorimotor processes; 15–24 Hz (low beta, β1) and 25–30 Hz (high beta, β2), both of which are often associated with motor preparation and cognitive control; and 38–42 Hz (gamma), a high-frequency range linked to integrative cortical processing and perceptual binding. For each trial, mean spectral power was computed within these bands and subsequently averaged across trials to yield robust estimates of task-related neural oscillatory activity.
To examine the temporal evolution of frequency-specific neural activity with high time-frequency resolution, time–frequency decomposition was performed using wavelet analysis on EEG epochs ranging from −100 ms to 800 ms relative to stimulus onset. This approach allows for precise tracking of oscillatory dynamics over time, particularly in the lower alpha band. Spectral power was computed across five narrow frequency bins within the alpha range (8–9 Hz, 9–10 Hz, 10–11 Hz, 11–12 Hz, and 12–13 Hz), enabling a fine-grained characterization of alpha sub-band modulations potentially linked to distinct cognitive processes such as expectancy, attention, and early post-stimulus processing. Baseline correction was applied using the −100 ms to 0 ms pre-stimulus interval.
2. Materials and Methods
2.1. Participants
Thirty healthy male and female University students ranging in age from 20 to 31 years (mean age= 23 years, SD= 2.9 years) were included in the study. EEG data from 1 participant (male) were disregarded due to an abundance of EEG artifacts. The final sample consisted of 14 males and 15 female participants, with a mean age of 23.4 years. Fifteen participants constituted the high-EQ group (mean age = 23.07, SD = 2.28), and fourteen participants formed the low-EQ group [mean age = 23.78, SD= 3.5] (Table 1). The two experimental groups were classified according to their Empathy Quotient, assessed using the Italian-language version of the Empathy Quotient [22], which was administered to participants subsequent to EEG recordings. This questionnaire is derived from the original Empathy Quotient by Baron-Cohen et al. [23], as it was adapted and validated for the Italian population while maintaining the theoretical framework of the original scale. Participants were matched for socio-cultural status, and were all native Italian speakers. Their lateral preference was assessed through the administration of the Edinburgh Inventory. All participants had normal or glass-corrected vision and normal hearing. No participant suffered or ever suffered from neurological or psychiatric disorders (including dyslexia, alexia, autism, ADHD, depression, personality disorders). All participants provided written informed consent and were unaware of the research purpose. The study lasted approximately 2 h, encompassing breaks, training, and administering the questionnaire. Questionnaire administration followed EEG recording for not inducing a psychological bias. Participants voluntarily offered their participation or received academic credits. The Ethics Committee of University of Milano-Bicocca (protocol number 0000273/14/08012014) approved the project.
2.2. Stimuli
The stimuli comprised 200 images selected from a validated set of pictures designed to assess nonverbal behavior [24]. Each color photograph depicted half of the body of a male or female actor, attired in a black sweater and captured against a white background (Figure 1). The set included six distinct actors (three males and three females) performing 187 unique gestures, categorized into one of three types: iconic (visual representations of referential meaning), deictic (gestures indicating real, implied, or imagined persons, objects, or directions), or emblematic (symbolic and conventional gestures conveying standardized meanings, such as a thumbs-up gesture to denote 'good'). The stimuli were 371 × 278 pixels in size and had an average luminance of 13.66 cd/m². Each gesture was accompanied by a brief verbal label, presented in yellow Times New Roman font for 700 ms at the center of the screen, followed by an inter-stimulus interval (ISI) ranging from 100 to 200 ms before the corresponding image appeared. The outer background of the display was light gray.
2.3. Procedure
Participants were comfortably seated in a dark, acoustically and electrically shielded cubicle, positioned 100 cm from a high-resolution screen. They were instructed to maintain their gaze on a central fixation cross on the screen and to minimize eye or body movements throughout the session. The task consisted in deciding whether the gesture and its corresponding caption were congruent and also involved perceiving pictures in which faces were obscured. The data here processed only concern the recognition of body-language in congruent displays provided with appropriate facial expressions.
2.4. EEG Recordings and Analysis
EEG data were recorded as described in [21] where Event-Related Potentials to stimuli were computed. Brain activity was monitored using 128 electrodes placed according to the 10-5 International system, with horizontal and vertical electro-oculograms also being recorded. The averaged mastoids were used as the reference. Electrode impedance was kept below 5 kΩ, and the sampling rate was 512 Hz. EEG and EOG signals were captured using the Cognitrace system (ANT Software) and amplified with a bandpass filter (0.016–70 Hz). Any EEG artifacts exceeding ±50 μV were automatically rejected before averaging. EEG epochs synchronized with stimulus presentation were processed through the EEProbe system (ANT Software). ERPs were averaged offline from 100 ms before to 1200 ms after stimulus onset. FFT analysis was applied to ERP signals reflecting perception of congruently labelled body-language displays during a tasl involving the understanding of body-language meaning.
Fast Fourier Transform (FFT) power spectrum analysis was performed on ERP epochs spanning 150 ms to 800 ms post-stimulus, extracting mean spectral power within four canonical EEG frequency bands: 8–13 Hz (alpha/mu), 15–24 Hz (low beta, β1), 25–30 Hz (high beta, β2), and 38–42 Hz (gamma). A Morlet wavelet transform was applied to the EEG signal over the epoch ranging from –100 milliseconds (ms) to 800 ms, using 1-Hz resolution frequency bands spanning from 8 to 13 hertz (Hz). Multifactorial repeated measures of analyses of variance (ANOVAs) were applied to EEG power values, using a between-subject factor of Empathy group (Low-EQ, High-EQ) and the within-subject factors Electrode (depending on the EEG rhtyhm) and Hemisphere (Left, Right). Multiple post-hoc comparisons of means were performed by means of Fisher tests. Isocolour topographical maps were performed by plotting surface potentials recorded during latency range relative to the main ERP components of interest. Spectral power data (µV²/Hz), obtained through Morlet wavelet transformation, were analyzed using a repeated-measures ANOVA with Empathic Trait (Low-EQ, High-EQ) as a between-subjects factor, and EEG Band (8–9 Hz, 9–10 Hz, 10–11 Hz, 11–12 Hz, 12–13 Hz) and Scalp Area (central: C3/4, CCP1h/2h; occipital: PO3/4, O1/2) as within-subjects factors.
3. Results
Figure 2 showsEEG Frequency Analysis performed via Fast Fourier Transform (FFT).This bar graph illustrates the mean spectral power (expressed in µV²/Hz) across distinct EEG frequency bands—Mu/Alpha (8–13 Hz), Beta (15–24 Hz), High Beta (25–30 Hz), and Gamma (38–42 Hz)—for multiple scalp electrodes. Each bar represents the average power computed at a specific electrode site, color-coded accordingly. Notably, the Mu/Alpha band exhibits the highest power, particularly over parietal-occipital regions, but also medial frontal ones, consistent with typical resting-state EEG topographies. The progressive decline in power from lower to higher frequency bands reflects the expected spectral distribution in cortical activity. Since only alpha/mu and beta ranges showed a significant EEG power, their signals were processed through statistical analyses.
3.1. Fast Fourier Frequency Analysis (FFT)
An ANOVA conducted on alpha power recorded from posterior scalp sites (P3, P4, PO1, PO2, O1, O2) revealed a significant main effect of Empathic Trait [F(1, 27) = 4.64, p < 0.04], with greater alpha power observed in Low-EQ participants (M = 0.315 μV²/Hz, SE = 0.06) relative to High-EQ participants (M = 0.13 μV²/Hz, SE = 0.05) over occipito-parietal regions (see Figure 3). In contrast, no significant main effect of Empathic Trait was found for mu power at central scalp sites (C3, C4, CCP1h, CCP2h, CP1, CP2). However, a significant main effect of Scalp Region emerged [F(2, 54) = 6.10, p < 0.005], with higher mu power at CCP1 and CCP2 compared to the remaining central sites.
The analysis of mean beta power at anterior electrodes (Fp1, Fp2, AFp3h, AFp4h, F1, F2, F3, F4) yielded a significant Area × Empathy interaction [F(3, 81) = 3.10, p < 0.035]. Post hoc comparisons (Fisher’s LSD) indicated greater beta power in High-EQ participants, particularly at prefrontal sites, relative to those with lower trait empathy (see Figure 4 for mean values with SD, and Figure 5 for the topographical distribution of all EEG bands).
3.2. Wavelet Analysis
The ANOVA yielded the significance of Area [F1, 135 = 23.27, p < 0.00005] with stronger signals over occipital (0.11 µV2/Hz, SE = 0.006) than central (0.04 µV2/Hz, SE = 0.02) area. Further significant was the factor Area x Empathic trait [F1, 135 = 5.6, p < 0.02] with greater alpha signals in low-EQ than High-EQ participants, but only over occipital sites (see Figure 6 for means and SD values).
No effect of empathy was observed at central sites (mu rhythm). The further significance of Empathic Trait x Hemisphere [F1, 135 = 5.3, p < 0.02] indicated an enhancement of alpha power over the right hemisphere in Low-EQ participants. Also significant was the interaction of Area x Hemisphere [F1, 135 = 11.21, p < 0.001], with much stronger EEG power over occipital than central area, where it was observed a large hemispheric asymmetry (see Figure 7 for a Time–frequency representation, i.e., scalogram).
4. Discussion
Overall FFT analyses showed a stronger anterior beta power and reduced posterior alpha power in High-EQ than Low-EQ participants during a visual task involving understanding of body gestures. Additionally, a Morlet wavelet transform to the EEG signal relative to stimulus processing revealed no group difference in the mu power, with no larger Mu suppression or ERD in the more empathic individuals, as instead predicted by few studies in the literature (e.g., [4]) in the light of mirror neurons activation hypothesis.
Interestingly, Maffei et al. [20] demonstrated that increased beta-band activity in the frontal regions is associated with enhanced attention and emotion regulation, suggesting that individuals with higher empathy may exhibit greater beta power during tasks requiring mental state inference. A growing body of evidence indicates that increased beta-band activity in frontal cortical regions is consistently associated with enhanced visual attention, supporting the notion that frontal beta oscillations play a critical role in the top-down modulation of sensory processing and attentional control (e.g., [25,26,27]). In this vein, High-EQ people might be more attracted to social information, and better at understanding the others body language. In fact, individuals with higher empathy quotients tend to be more interested in others, which enhances their ability to read and understand non-verbal cues [28]. Conversely, when attention is reduced (e.g., when sensory input is less relevant or when we are less focused), alpha power tends to increase in the occipital/parietal areas as a form of sensory inhibition [29]. In fact, Matsuoka et al. [18] found that alpha-band power in occipito-parietal regions decreases during tasks involving self-reflection and social cognition, indicating that lower alpha power may reflect higher attentional engagement in empathic processing. Indeed, elevated alpha-band oscillatory activity (8–12 Hz) over occipital regions during visual image comprehension tasks is often associated with functional inhibition of visual cortical areas. Increased occipital alpha power correlates with reduced excitability of the visual cortex, for instance, Romei et al. [30] demonstrated that higher resting-state alpha power over posterior sites was linked to increased thresholds for visual perception, suggesting a state of cortical inhibition. In the context of visual image comprehension, elevated occipital alpha power may thus signify an active suppression of extraneous visual input, allowing for enhanced focus on internal representations such as self-relevant information, rather than paying attention to gestures. Elevated alpha power is commonly associated with reduced vigilance and attentional engagement. Studies have demonstrated that conditions such as sleep deprivation lead to increased alpha activity, correlating with heightened sleepiness and diminished vigilance. For instance, research indicates that even mild sleep loss can result in more intense alpha bursts and decreased performance in vigilance tasks [31]. Additionally, during sustained attention tasks, a time-on-task effect is observed where alpha power progressively increases, reflecting a decline in vigilance over time [32]. These findings underscore the role of alpha oscillations as neural markers of vigilance states, providing valuable insights into cognitive fatigue and attentional lapses. The right hemispheric asymmetry in alpha power is consistent with current knowledge on alpha distribution. Increased alpha power over right occipito-parietal regions has been consistently associated with reduced external attentional engagement and vigilance, as evidenced by findings linking such asymmetry to internally directed cognition [33], hypoxia-induced attentional suppression [34], and diminished spatial attentional deployment [35].
Given that the related ERP study [21] demonstrated poorer performance and reduced discriminative anterior ERP responses in low-EQ participants compared to their high-EQ counterparts—specifically in a task requiring them to assess whether a verbal label accurately described the mental, physiological, or emotional state of a character—it is plausible to hypothesize a correlation between lower empathic traits and diminished attentional engagement or interest in body language cues. According to the literature, individuals with lower empathic traits tend to exhibit diminished attentional engagement with emotional facial expressions, which are critical components of body language cues [36]. ERP studies have shown that individuals with higher empathy scores display enhanced neural responses, such as more pronounced N170 and late positive potential (LPP) amplitudes, when processing various emotional facial expressions. These findings suggest that higher empathy is associated with increased attention to emotional cues from the early stages of face processing. Conversely, individuals with lower empathy traits may show reduced neural responsiveness to these cues, indicating a potential lack of attentional engagement with others' emotional states. Further research supports this association, demonstrating that individuals with higher empathy not only process emotional facial expressions more efficiently but also exhibit more scanning eye movements and facial responsiveness, indicating a more engaged and responsive interaction with emotional cues [37]. Regarding the absence of group differences based on empathic traits in mu rhythm power—which was generally low, potentially reflecting an ERD linked to the processing of implicit action gestures [1,9,10,11,12]—it can be hypothesized that while visuomotor mechanisms underlying action understanding are similarly and automatically engaged across individuals, it is the varying degree of interest and attentional allocation that modulates the empathic response to social information.
5. Conclusions
In conclusion, our findings highlight the importance of individual differences in empathic traits in shaping oscillatory brain dynamics during the processing of socially relevant visual stimuli. The observed enhancement of frontal beta activity and concomitant reduction of posterior alpha power in High-EQ individuals point to a more engaged top-down attentional state, likely facilitating the decoding of others’ intentions and emotions through body language. The absence of group differences in mu suppression challenges simplistic interpretations of empathy as a mirror neuron–driven process, and instead underscores the multifaceted nature of empathic engagement, in which attentional, motivational, and regulatory mechanisms play a central role. Taken together, these results provide novel evidence that empathy-related neural responses extend beyond sensorimotor mirroring and involve broader attentional and cognitive control networks, with potential implications for understanding the neural bases of social cognition in both typical and atypical populations.
Author Contributions
Conceptualization, A.M.P.; methodology, A.M.P. and P.S.; formal analysis, P.S.; investigation, A.M.P. and P.S.; resources, A.M.P.; data curation, P.S. and A.M.P.; writing—original draft preparation, A.M.P. All authors have read and agreed to the published version of the manuscript.”
Funding
This research received no external funding.
Institutional Review Board Statement
The study was conducted in accordance with the Declaration of Helsinki, and approved by the Ethics Committee of University of Milano-Bicocca (protocol number 0000273/14/08012014) for studies involving humans.
Informed Consent Statement
Informed consent was obtained from all subjects involved in the study.
Data Availability Statement
Stimulus dataset can be inspected at this OA repository: Proverbio, Alice Mado; Gabaro, Veronica (2025), “A Nonverbal Signs Dataset for the Italian Population”, Bicocca Open Archive Research Data, V1, doi: 10.17632/vwwmmd99r3.1
Acknowledgments
The authors are very grateful to Benedetta Baraldi and Veronica Gabaro for their precious contribution.
Conflicts of Interest
The authors declare no conflicts of interest. The funders had no role in the design of the study; in the collection, analyses, or interpretation of data; in the writing of the manuscript; or in the decision to publish the results.
Abbreviations
The following abbreviations are used in this manuscript:
| ANOVA | Analysis of Variance |
| EEG | Electroencephalogram |
| EOG | Electro-oculogram |
| ERD | Event-related desynchronization |
| ERP | Event-Related Potential |
| FFT | Fast Fourier Transform |
| High-EQ | High empathy quotient |
| Low-EQ | Low empathy quotient |
References
- Rizzolatti, G.; Kalaska, J.F. Voluntary movement: The parietal and premotor cortex. In Principles of Neural Science, 5th ed.; McGraw-Hill: New York, NY, USA, 2012; pp. 865–893. [Google Scholar] [CrossRef]
- Light, S.N.; Coan, J.A.; Zahn-Waxler, C.; Frye, C.; Goldsmith, H.H.; Davidson, R.J. Empathy Is Associated With Dynamic Change in Prefrontal Brain Electrical Activity During Positive Emotion in Children. Child Dev. 2009, 80, 1210–1231. [Google Scholar] [CrossRef] [PubMed]
- Tullett, A.M.; Harmon-Jones, E.; Inzlicht, M. Right frontal cortical asymmetry predicts empathic reactions: Support for a link between withdrawal motivation and empathy. Psychophysiology 2012, 49, 1145–1153. [Google Scholar] [CrossRef] [PubMed]
- Woodruff, C.C.; Martin, T.; Bilyk, N. Differences in self- and other-induced Mu suppression are correlated with empathic abilities. Brain Res. 2011, 1405, 69–76. [Google Scholar] [CrossRef] [PubMed]
- Hoenen, M.; Schain, C.; Pause, B.M. Down-modulation of mu-activity through empathic top-down processes. Soc. Neurosci. 2013, 8, 515–524. [Google Scholar] [CrossRef] [PubMed]
- Peled-Avron, L.; Levy-Gigi, E.; Richter-Levin, G.; Korem, N.; Shamay-Tsoory, S.G. The role of empathy in the neural responses to observed human social touch. Cogn. Affect. Behav. Neurosci. 2016, 16, 802–813. [Google Scholar] [CrossRef] [PubMed]
- Frenkel-Toledo, S.; Liebermann, D.G.; Bentin, S.; Soroker, N. Dysfunction of the Human Mirror Neuron System in Ideomotor Apraxia: Evidence from Mu Suppression. J. Cogn. Neurosci. 2016, 28, 775–791. [Google Scholar] [CrossRef]
- Hogeveen, J.; Chartrand, T.L.; Obhi, S.S. Social Mimicry Enhances Mu-Suppression During Action Observation. Cereb. Cortex 2014, 25, 2076–2082. [Google Scholar] [CrossRef]
- Cabrera, M.E.; Novak, K.; Foti, D.; Voyles, R.; Wachs, J.P. Electrophysiological indicators of gesture perception. Exp. Brain Res. 2020, 238, 537–550. [Google Scholar] [CrossRef]
- Hervault, M.; Zanone, P.-G.; Buisson, J.-C.; Huys, R. Cortical sensorimotor activity in the execution and suppression of discrete and rhythmic movements. Sci. Rep. 2021, 11, 1–15. [Google Scholar] [CrossRef]
- Neuper, C.; Wörtz, M.; Pfurtscheller, G. ERD/ERS patterns reflecting sensorimotor activation and deactivation. Prog Brain Res. 2006, 159, 211–222. [Google Scholar] [CrossRef]
- Nyström, P.; Ljunghammar, T.; Rosander, K.; von Hofsten, C. Using mu rhythm desynchronization to measure mirror neuron activity in infants. Dev. Sci. 2011, 14, 327–335. [Google Scholar] [CrossRef] [PubMed]
- Proverbio, A.M. Tool perception suppresses 10–12Hz μ rhythm of EEG over the somatosensory area. Biol. Psychol. 2012, 91, 1–7. [Google Scholar] [CrossRef] [PubMed]
- Grazia, A.; Wimmer, M.; Müller-Putz, G.R.; Wriessnegger, S.C. Neural Suppression Elicited During Motor Imagery Following the Observation of Biological Motion From Point-Light Walker Stimuli. Front. Hum. Neurosci. 2022, 15, 788036. [Google Scholar] [CrossRef] [PubMed]
- DiGirolamo, M.A.; Simon, J.C.; Hubley, K.M.; Kopulsky, A.; Gutsell, J.N. Clarifying the relationship between trait empathy and action-based resonance indexed by EEG mu-rhythm suppression. Neuropsychologia 2019, 133, 107172–107172. [Google Scholar] [CrossRef]
- Goodarzi, N.; Azma, K.; Tavakolian, E.; Peyvand, P. Association of Nurses' Self-Reported Empathy and Mu Suppression with Patients' Satisfaction. J. Caring Sci. 2015, 4, 197–205. [Google Scholar] [CrossRef]
- Hobson, H.M.; Bishop, D.V.M. The interpretation of mu suppression as an index of mirror neuron activity: past, present and future. R. Soc. Open Sci. 2017, 4, 160662. [Google Scholar] [CrossRef]
- Matsuoka, T.; Shimode, T.; Ota, T.; Matsuo, K. Event-Related Alpha-Band Power Changes During Self-reflection and Working Memory Tasks in Healthy Individuals. Front. Hum. Neurosci. 2021, 14. [Google Scholar] [CrossRef]
- Rana, K.D.; Vaina, L.M. Functional Roles of 10 Hz Alpha-Band Power Modulating Engagement and Disengagement of Cortical Networks in a Complex Visual Motion Task. PLOS ONE 2014, 9, e107715–e107715. [Google Scholar] [CrossRef]
- Maffei, A.; Coccaro, A.; Jaspers-Fayer, F.; Goertzen, J.; Sessa, P.; Liotti, M. EEG alpha band functional connectivity reveals distinct cortical dynamics for overt and covert emotional face processing. Sci. Rep. 2023, 13, 1–11. [Google Scholar] [CrossRef]
- Proverbio AM, Baraldi, B. (2025). Empathy boosts the comprehension of nonverbal behavior. Social Neuroscience (in revision).
- Senese, V.P.; De Nicola, A.; Passaro, A.; Ruggiero, G. The Factorial Structure of a 15-Item Version of the Italian Empathy Quotient Scale. Eur. J. Psychol. Assess. 2018, 34, 344–351. [Google Scholar] [CrossRef]
- Baron-Cohen, S.; Wheelwright, S. The Empathy Quotient: An Investigation of Adults with Asperger Syndrome or High Functioning Autism, and Normal Sex Differences. J. Autism Dev. Disord. 2004, 34, 163–175. [Google Scholar] [CrossRef] [PubMed]
- Proverbio, A.M.; Gabaro, V.; Orlandi, A.; Zani, A. Semantic brain areas are involved in gesture comprehension: An electrical neuroimaging study. Brain Lang. 2015, 147, 30–40. [Google Scholar] [CrossRef] [PubMed]
- Basharpoor, S.; Heidari, F.; Molavi, P. EEG coherence in theta, alpha, and beta bands in frontal regions and executive functions. Appl. Neuropsychol. Adult 2019, 28, 310–317. [Google Scholar] [CrossRef]
- Angelidis, A.; van der Does, W.; Schakel, L.; Putman, P. Frontal EEG theta/beta ratio as an electrophysiological marker for attentional control and its test-retest reliability. Biol. Psychol. 2016, 121, 49–52. [Google Scholar] [CrossRef] [PubMed]
- Palacios-García, I.; Silva, J.; Villena-González, M.; Campos-Arteaga, G.; Artigas-Vergara, C.; Luarte, N.; Rodríguez, E.; Bosman, C.A. Increase in Beta Power Reflects Attentional Top-Down Modulation After Psychosocial Stress Induction. Front. Hum. Neurosci. 2021, 15. [Google Scholar] [CrossRef]
- Fernández-Abascal, E.G.; Martín-Díaz, M.D. Relations Between Dimensions of Emotional Intelligence, Specific Aspects of Empathy, and Non-verbal Sensitivity. Front. Psychol. 2019, 10, 1066. [Google Scholar] [CrossRef]
- Cooper, N.R.; Croft, R.J.; Dominey, S.J.; Burgess, A.P.; Gruzelier, J.H. Paradox lost? Exploring the role of alpha oscillations during externally vs. internally directed attention and the implications for idling and inhibition hypotheses. Int. J. Psychophysiol. 2003, 47, 65–74. [Google Scholar] [CrossRef]
- Romei, V.; Rihs, T.; Brodbeck, V.; Thut, G. Resting electroencephalogram alpha-power over posterior sites indexes baseline visual cortex excitability. NeuroReport 2008, 19, 203–208. [Google Scholar] [CrossRef] [PubMed]
- Gibbings, A.; Ray, L.; Berberian, N.; Nguyen, T.; Zandi, A.S.; Owen, A.; Comeau, F.; Fogel, S. EEG and behavioural correlates of mild sleep deprivation and vigilance. Clin. Neurophysiol. 2021, 132, 45–55. [Google Scholar] [CrossRef]
- Pershin, I.; Candrian, G.; Münger, M.; Baschera, G.-M.; Rostami, M.; Eich, D.; Müller, A. Vigilance described by the time-on-task effect in EEG activity during a cued Go/NoGo task. Int. J. Psychophysiol. 2022, 183, 92–102. [Google Scholar] [CrossRef]
- Benedek, M.; Schickel, R.J.; Jauk, E.; Fink, A.; Neubauer, A.C. Alpha power increases in right parietal cortex reflects focused internal attention. Neuropsychologia 2014, 56, 393–400. [Google Scholar] [CrossRef] [PubMed]
- Zani, A.; Tumminelli, C.; Proverbio, A.M. Electroencephalogram (EEG) Alpha Power as a Marker of Visuospatial Attention Orienting and Suppression in Normoxia and Hypoxia. An Exploratory Study. Brain Sci. 2020, 10, 140. [Google Scholar] [CrossRef] [PubMed]
- Kornrumpf, B.; Dimigen, O.; Sommer, W. Lateralization of posterior alpha EEG reflects the distribution of spatial attention during saccadic reading. Psychophysiology 2017, 54, 809–823. [Google Scholar] [CrossRef] [PubMed]
- Choi, D.; Nishimura, T.; Motoi, M.; Egashira, Y.; Matsumoto, R.; Watanuki, S. Effect of empathy trait on attention to various facial expressions: evidence from N170 and late positive potential (LPP). J. Physiol. Anthr. 2014, 33, 18–18. [Google Scholar] [CrossRef]
- Balconi, M.; Canavesio, Y. Is empathy necessary to comprehend the emotional faces? The empathic effect on attentional mechanisms (eye movements), cortical correlates (N200 event-related potentials) and facial behaviour (electromyography) in face processing. Cogn. Emot. 2014, 30, 210–224. [Google Scholar] [CrossRef]
Figure 1.
Examples of body language displays (congruent with their captions). From left to right (first row): Let us put this aside; May I have a word? A little something, please; Let me think about it; I am full, I have eaten too much. Second row: What an unbearable heat; Oh, how wonderful! I'm going to kill you! It was him! Such an intolerable smell! The captions were originally presented in Italian. The complete set of stimuli is available at the Bicocca Open Archive Research Data, DOI: 10.17632/vwwmmd99r3.1. Informed consent and release forms were obtained from all individuals photographed.
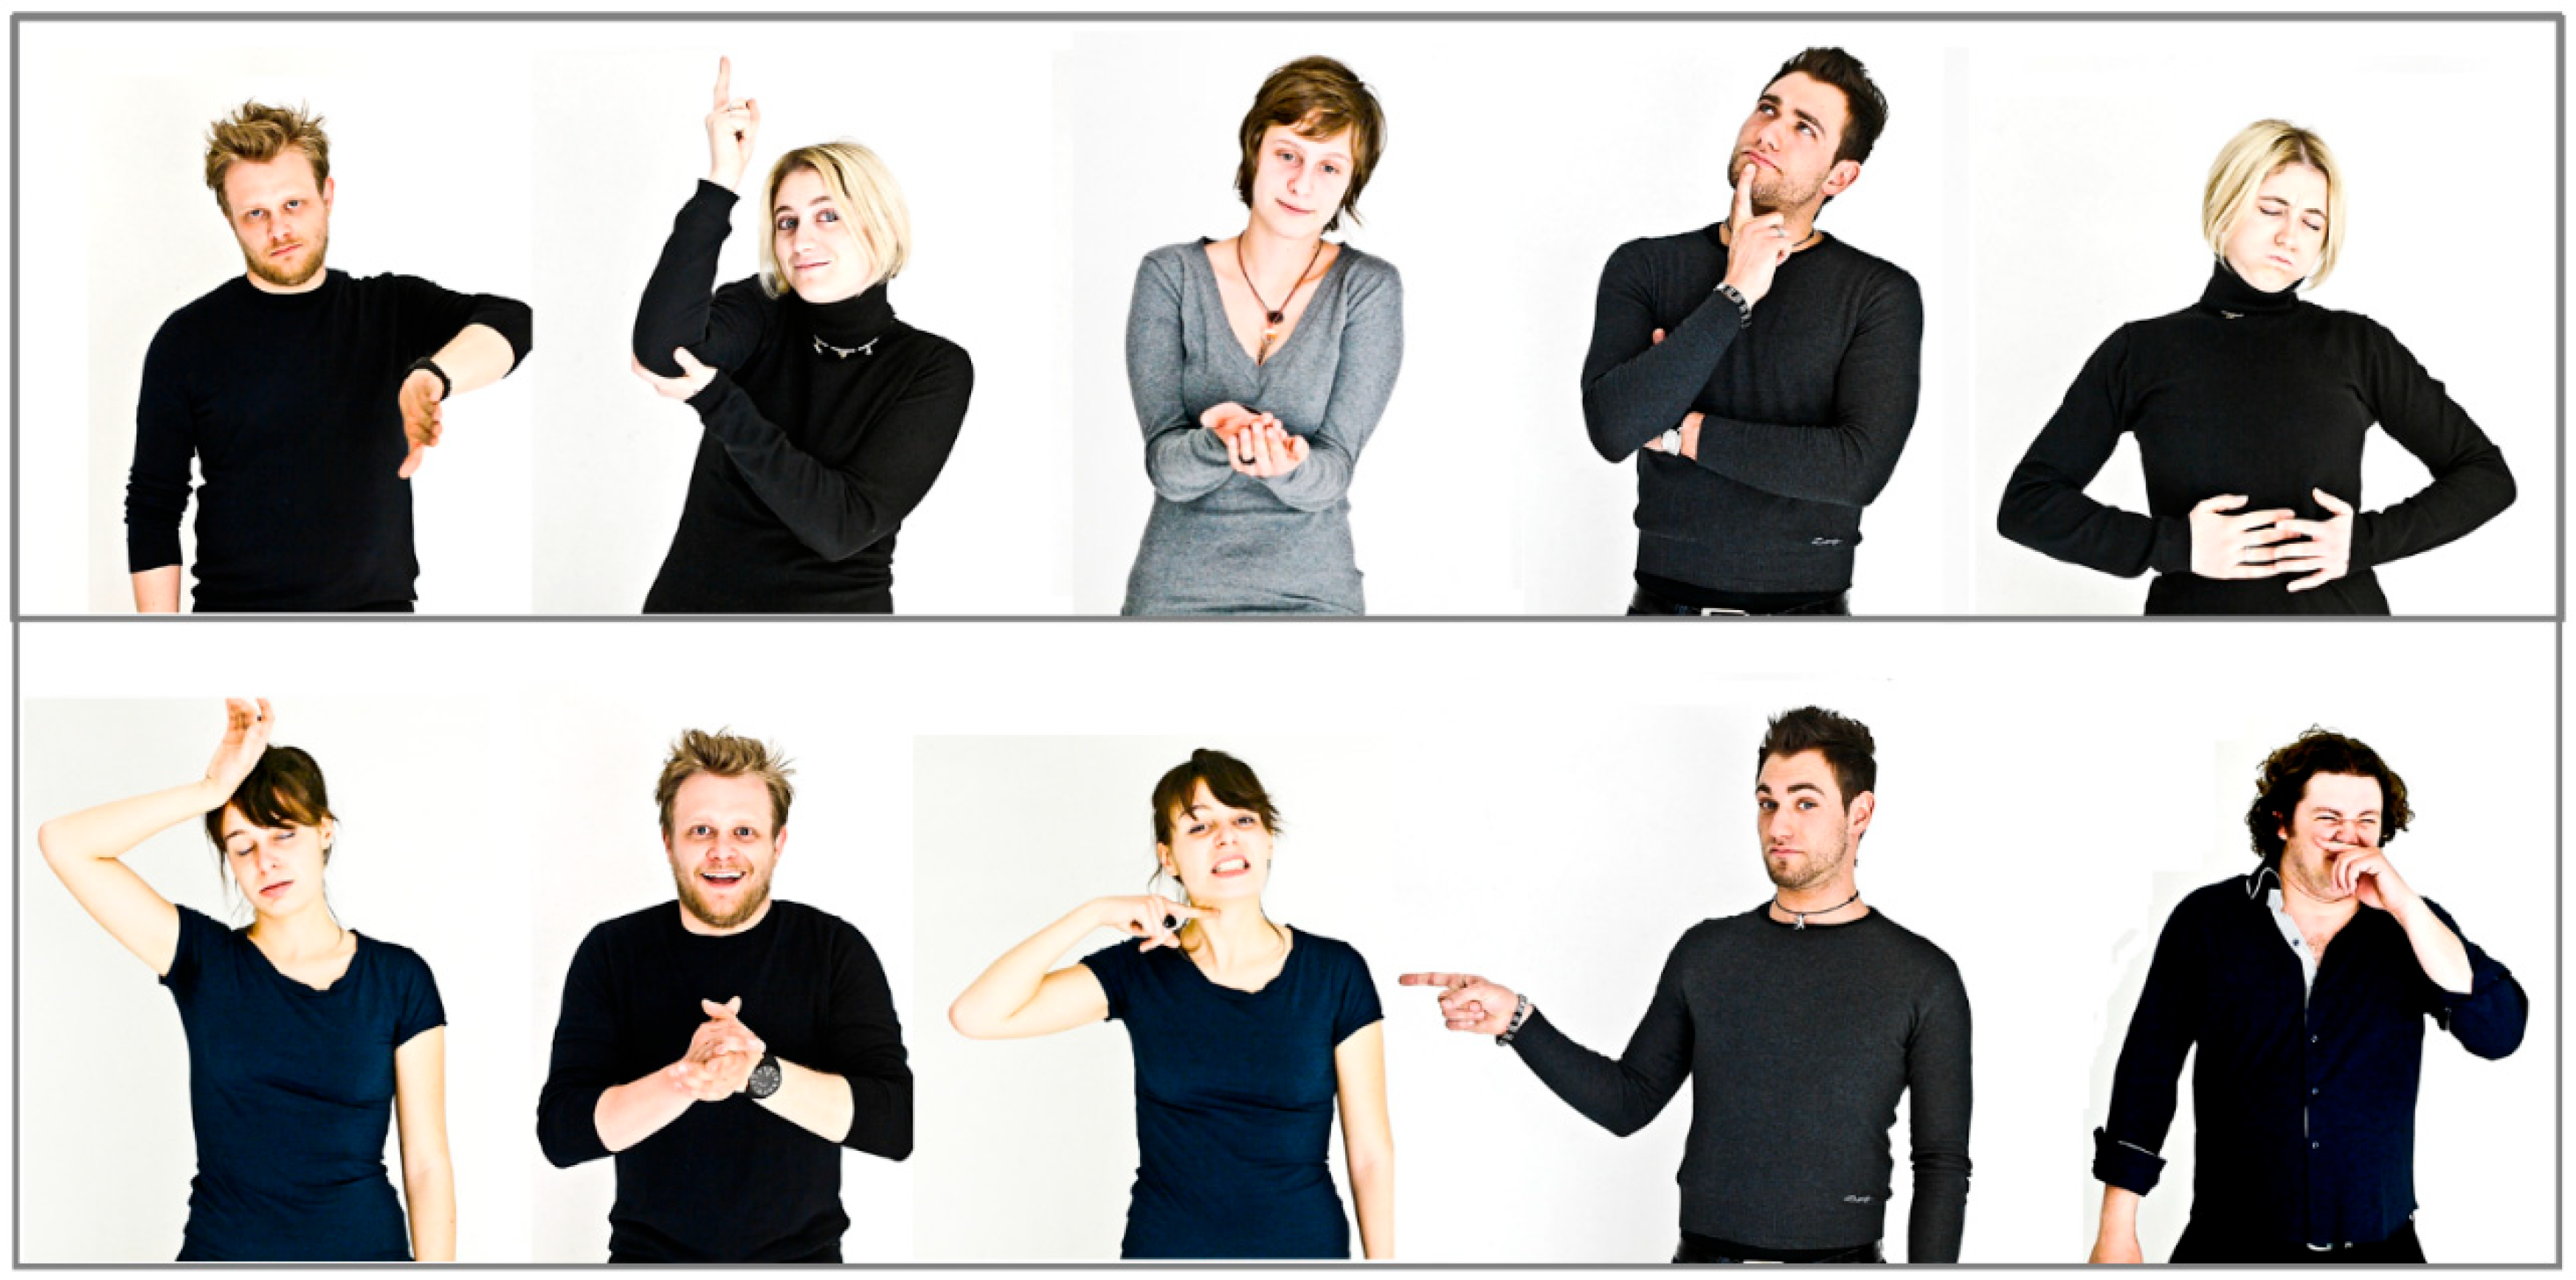
Figure 2.
EEG Frequency Analysis performed via Fast Fourier Transform (FFT). Mean spectral power (expressed in µV²/Hz) across distinct EEG frequency bands—Mu/Alpha (8–13 Hz), Beta (15–24 Hz), High Beta (25–30 Hz), and Gamma (38–42 Hz)—for 34 different scalp electrodes located at the anterior, central temporal and posterior brain areas.
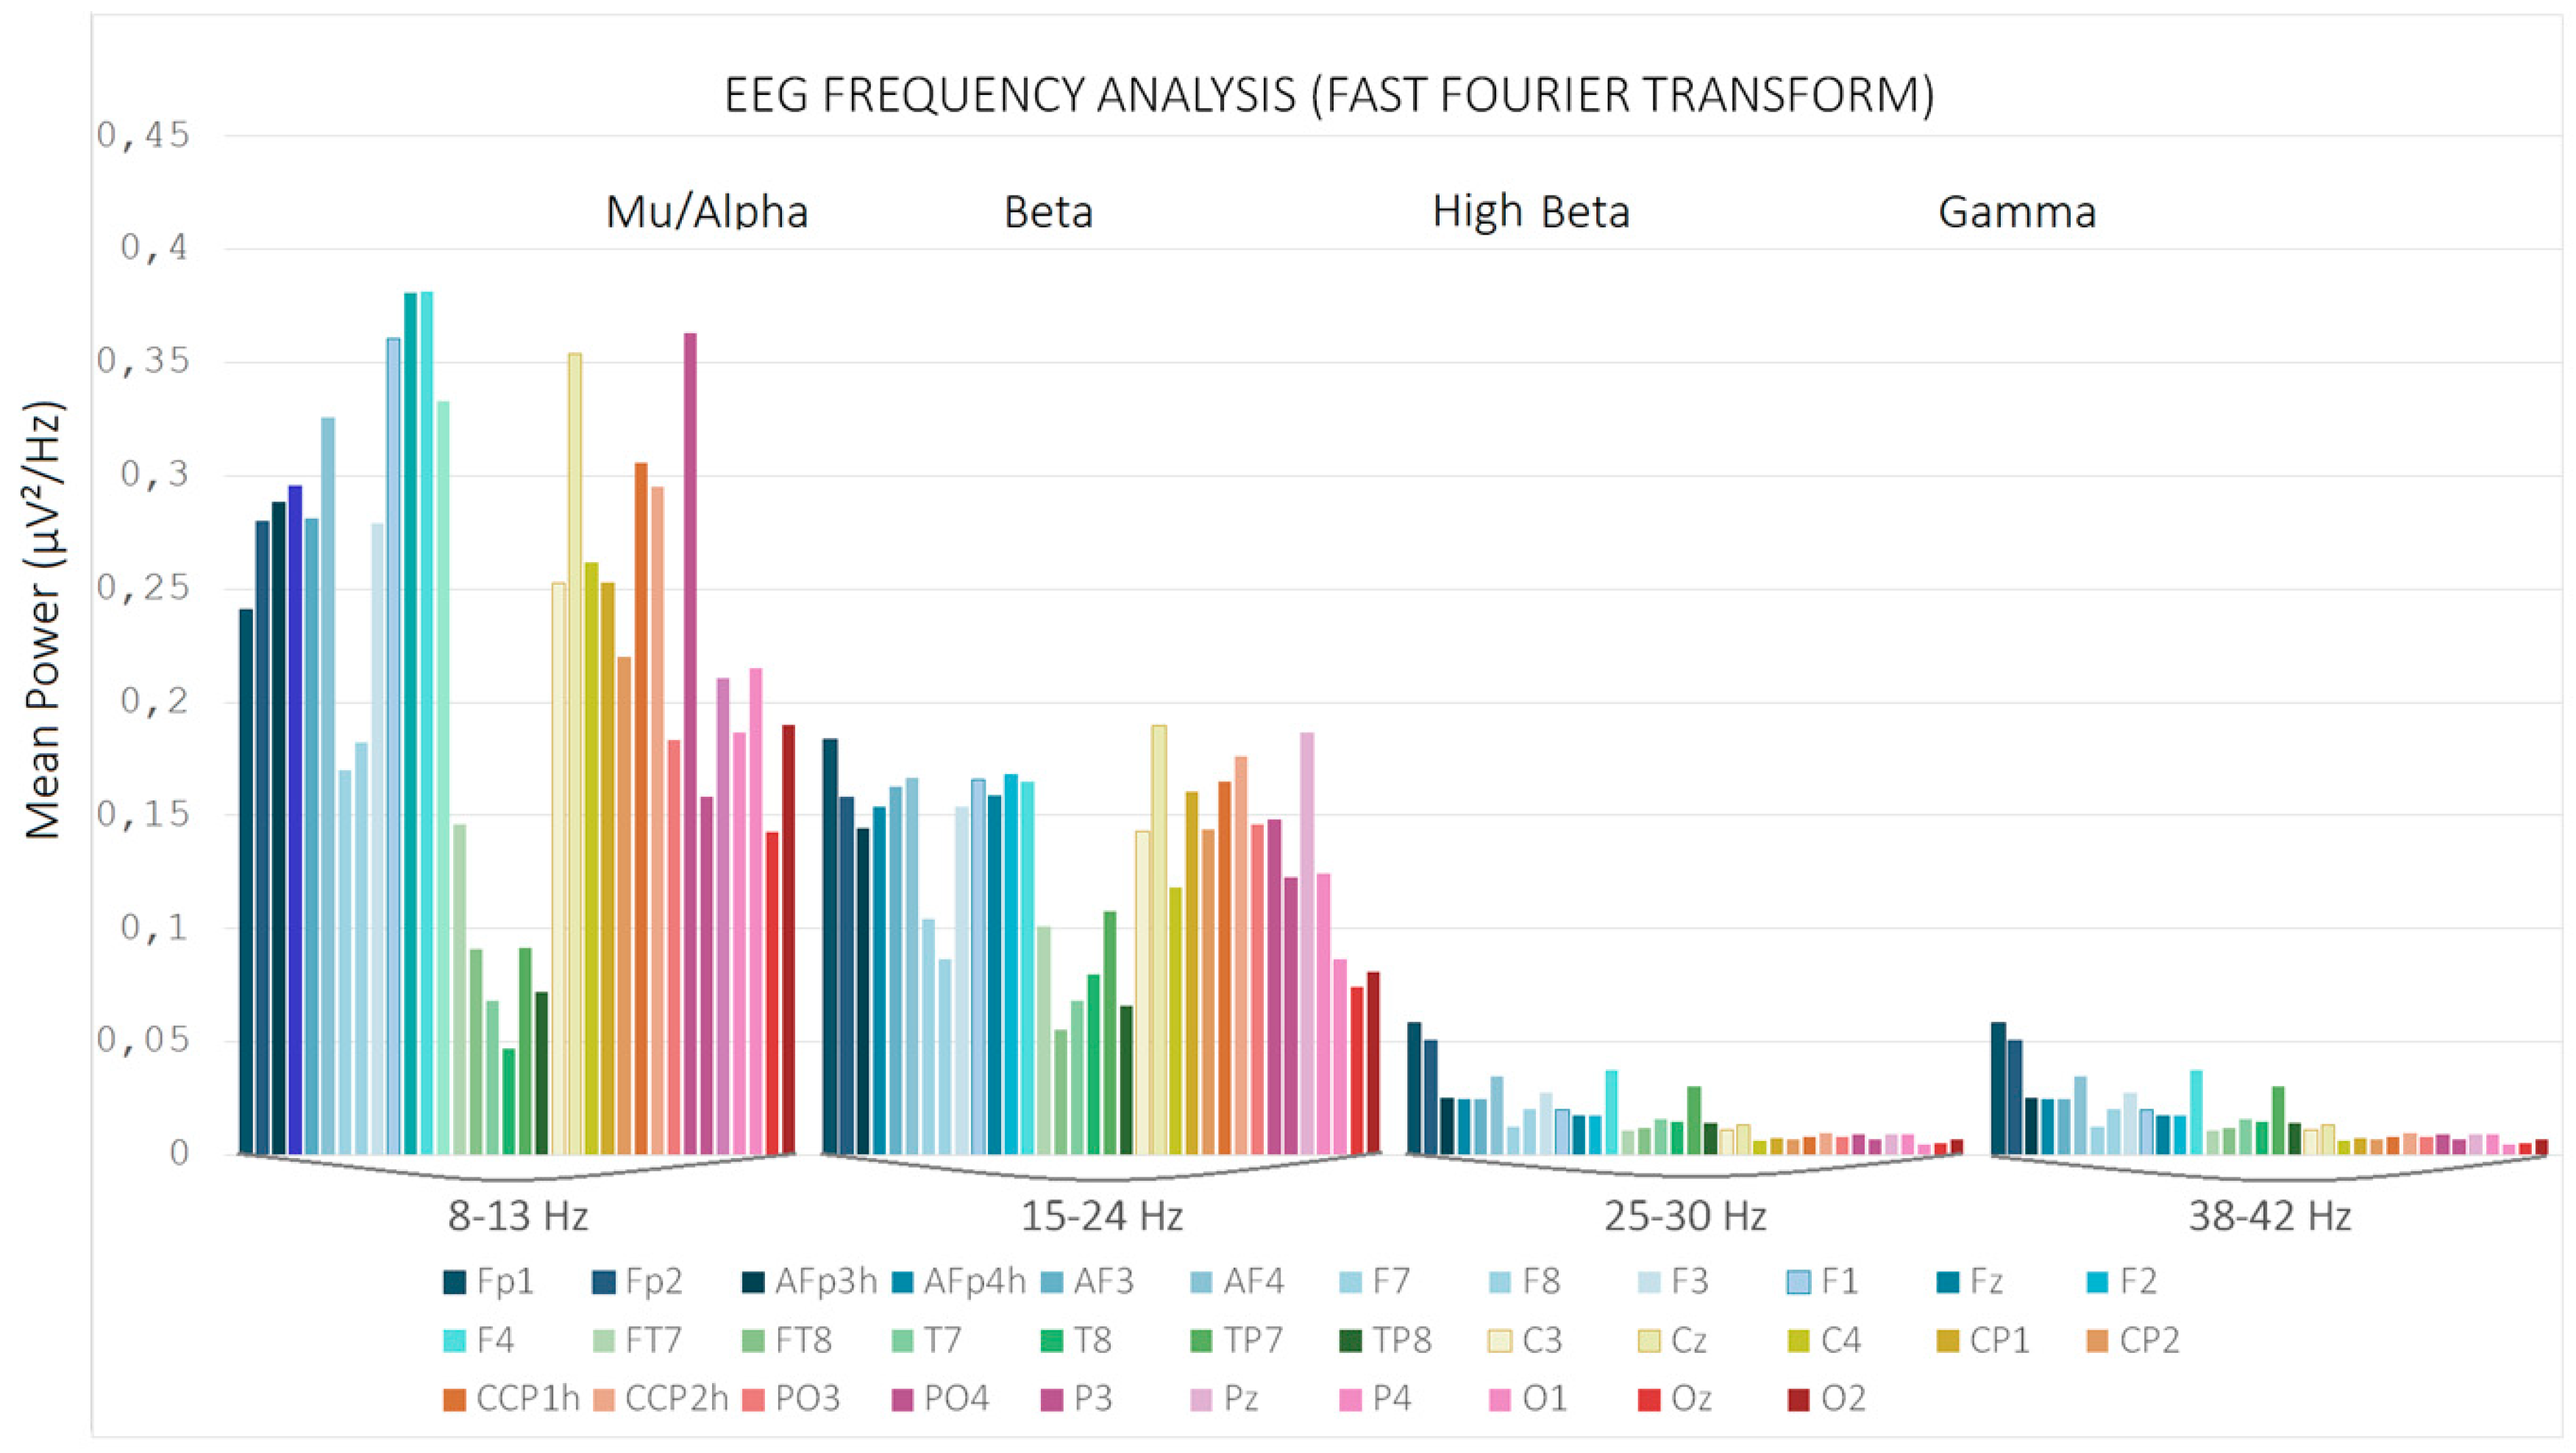
Figure 3.
Mean spectral power relative to Mu/Alpha rhythm (8–13 Hz) according to electrode sites, hemisphere of recording and Empathy group.
Figure 3.
Mean spectral power relative to Mu/Alpha rhythm (8–13 Hz) according to electrode sites, hemisphere of recording and Empathy group.
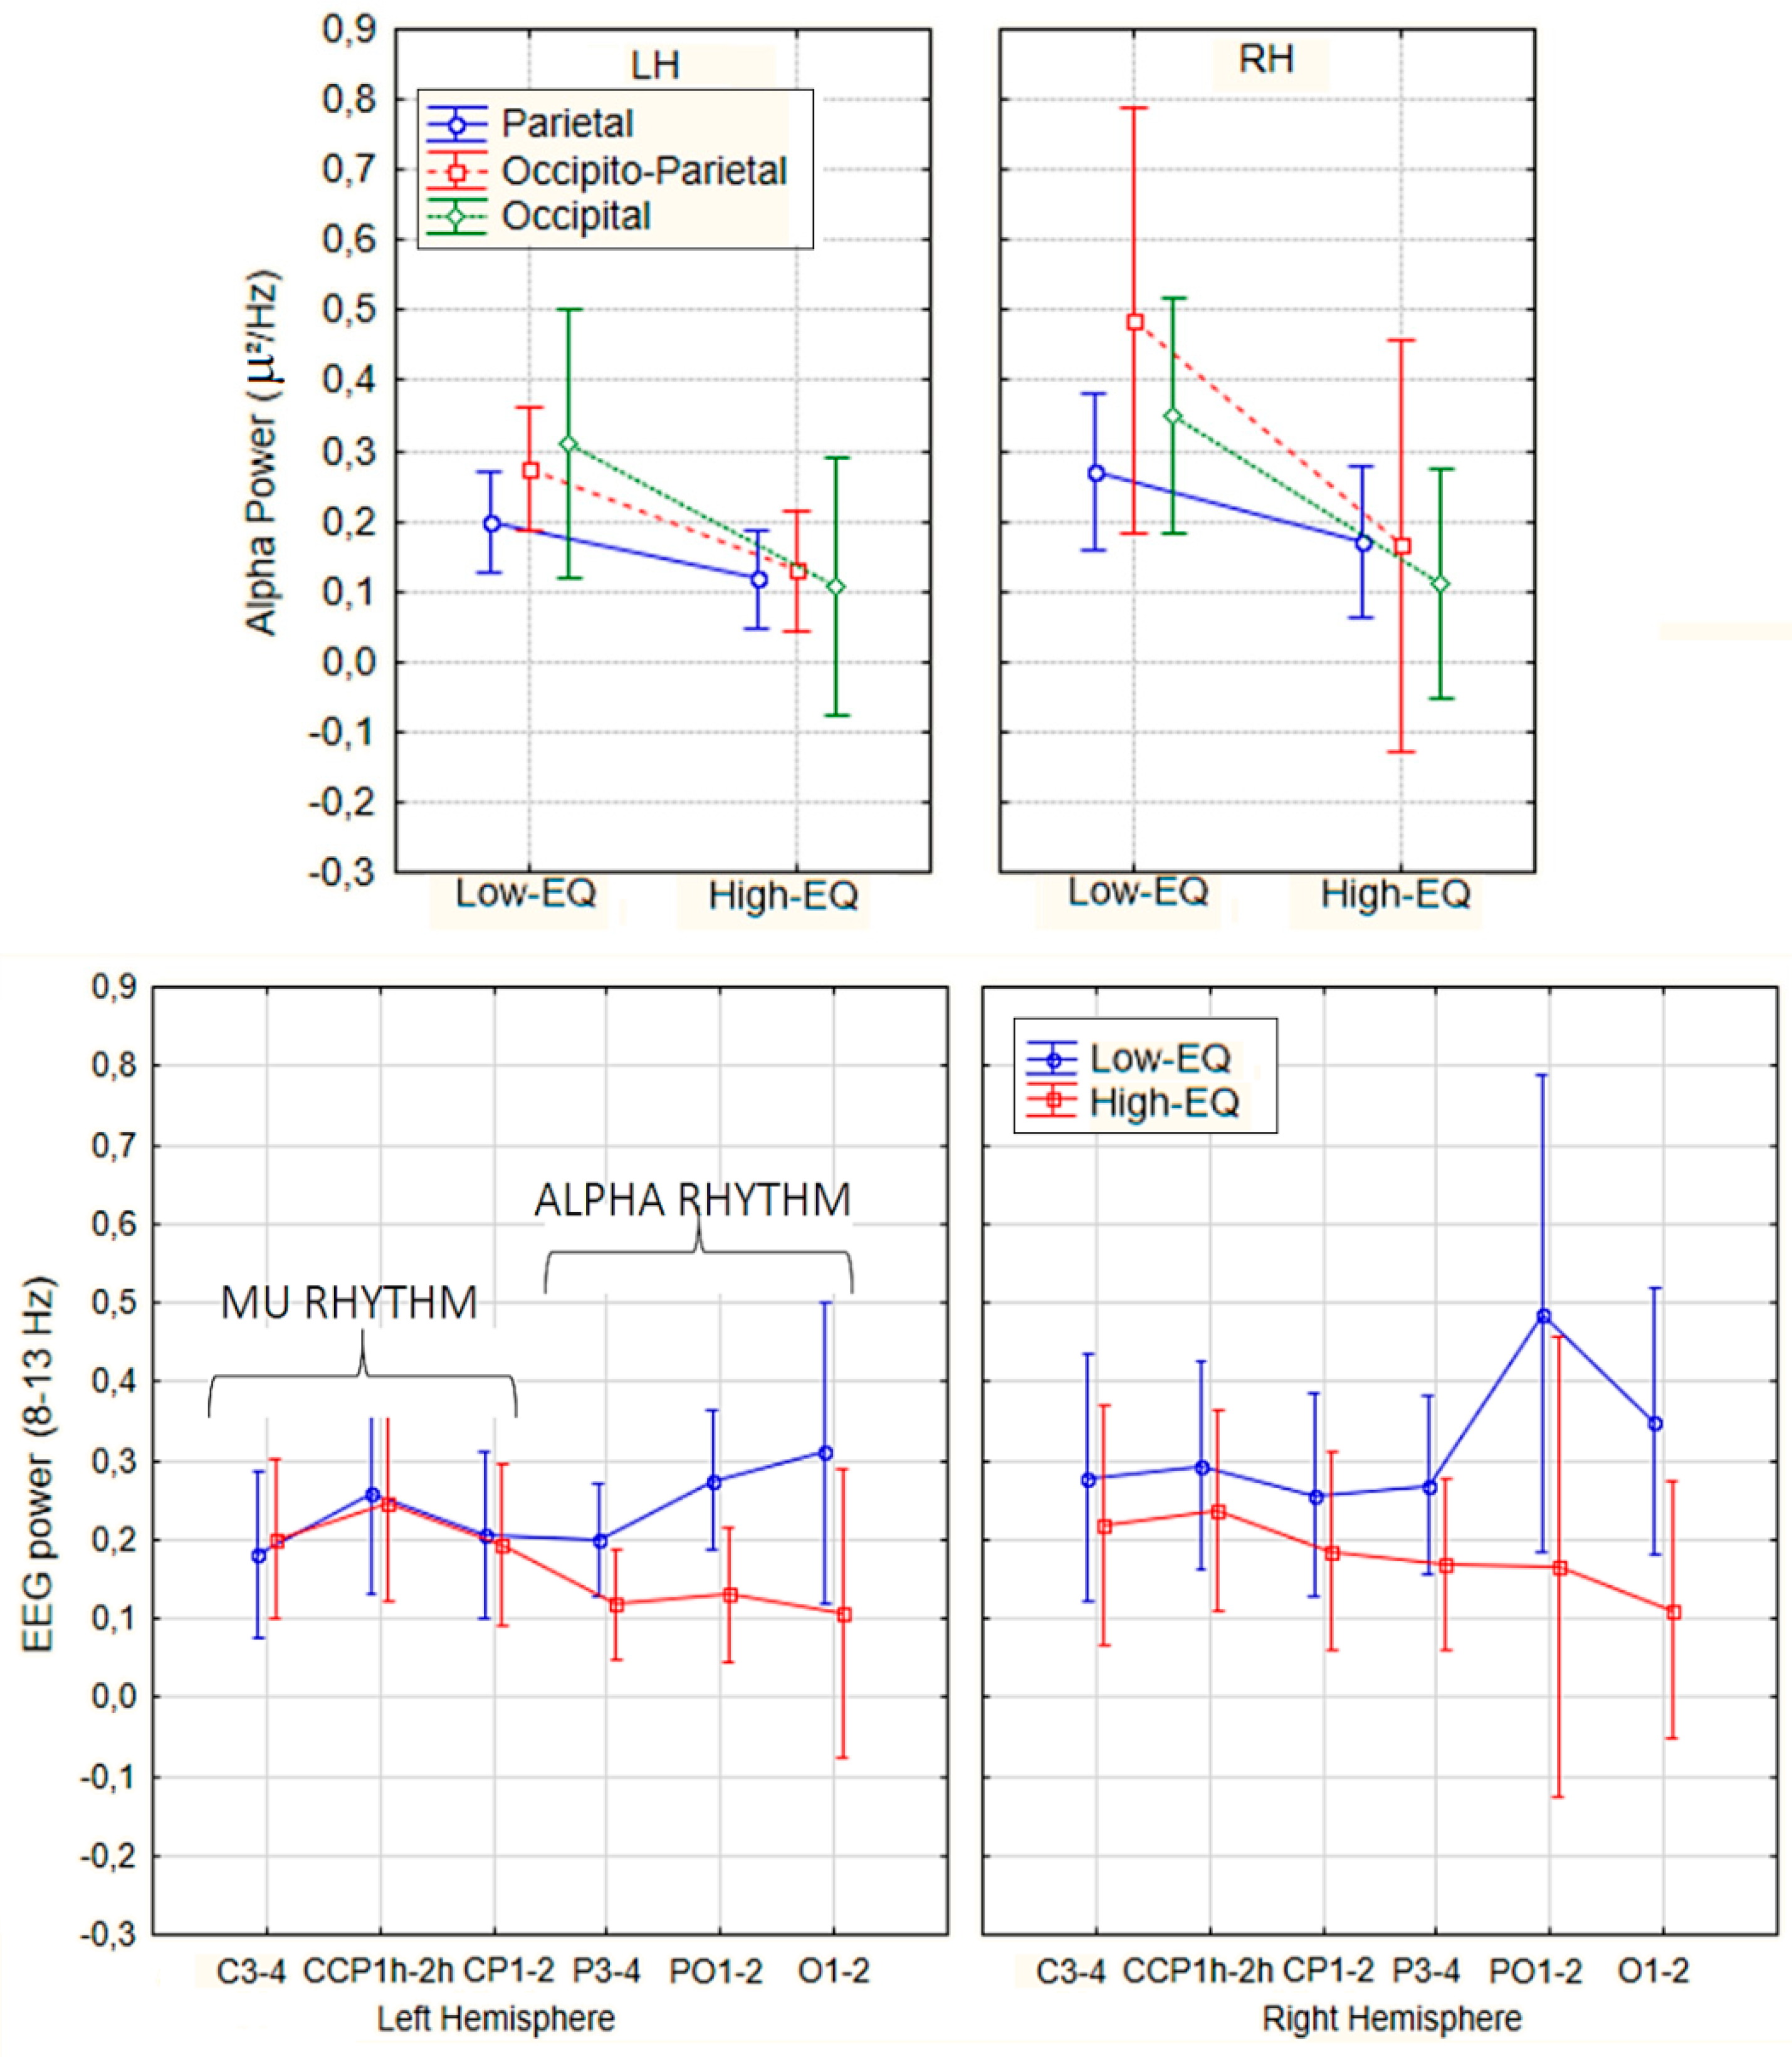
Figure 4.
Mean spectral power relative to Beta band (15–24 Hz) according to electrode sites, hemisphere of recording and Empathy group.
Figure 4.
Mean spectral power relative to Beta band (15–24 Hz) according to electrode sites, hemisphere of recording and Empathy group.
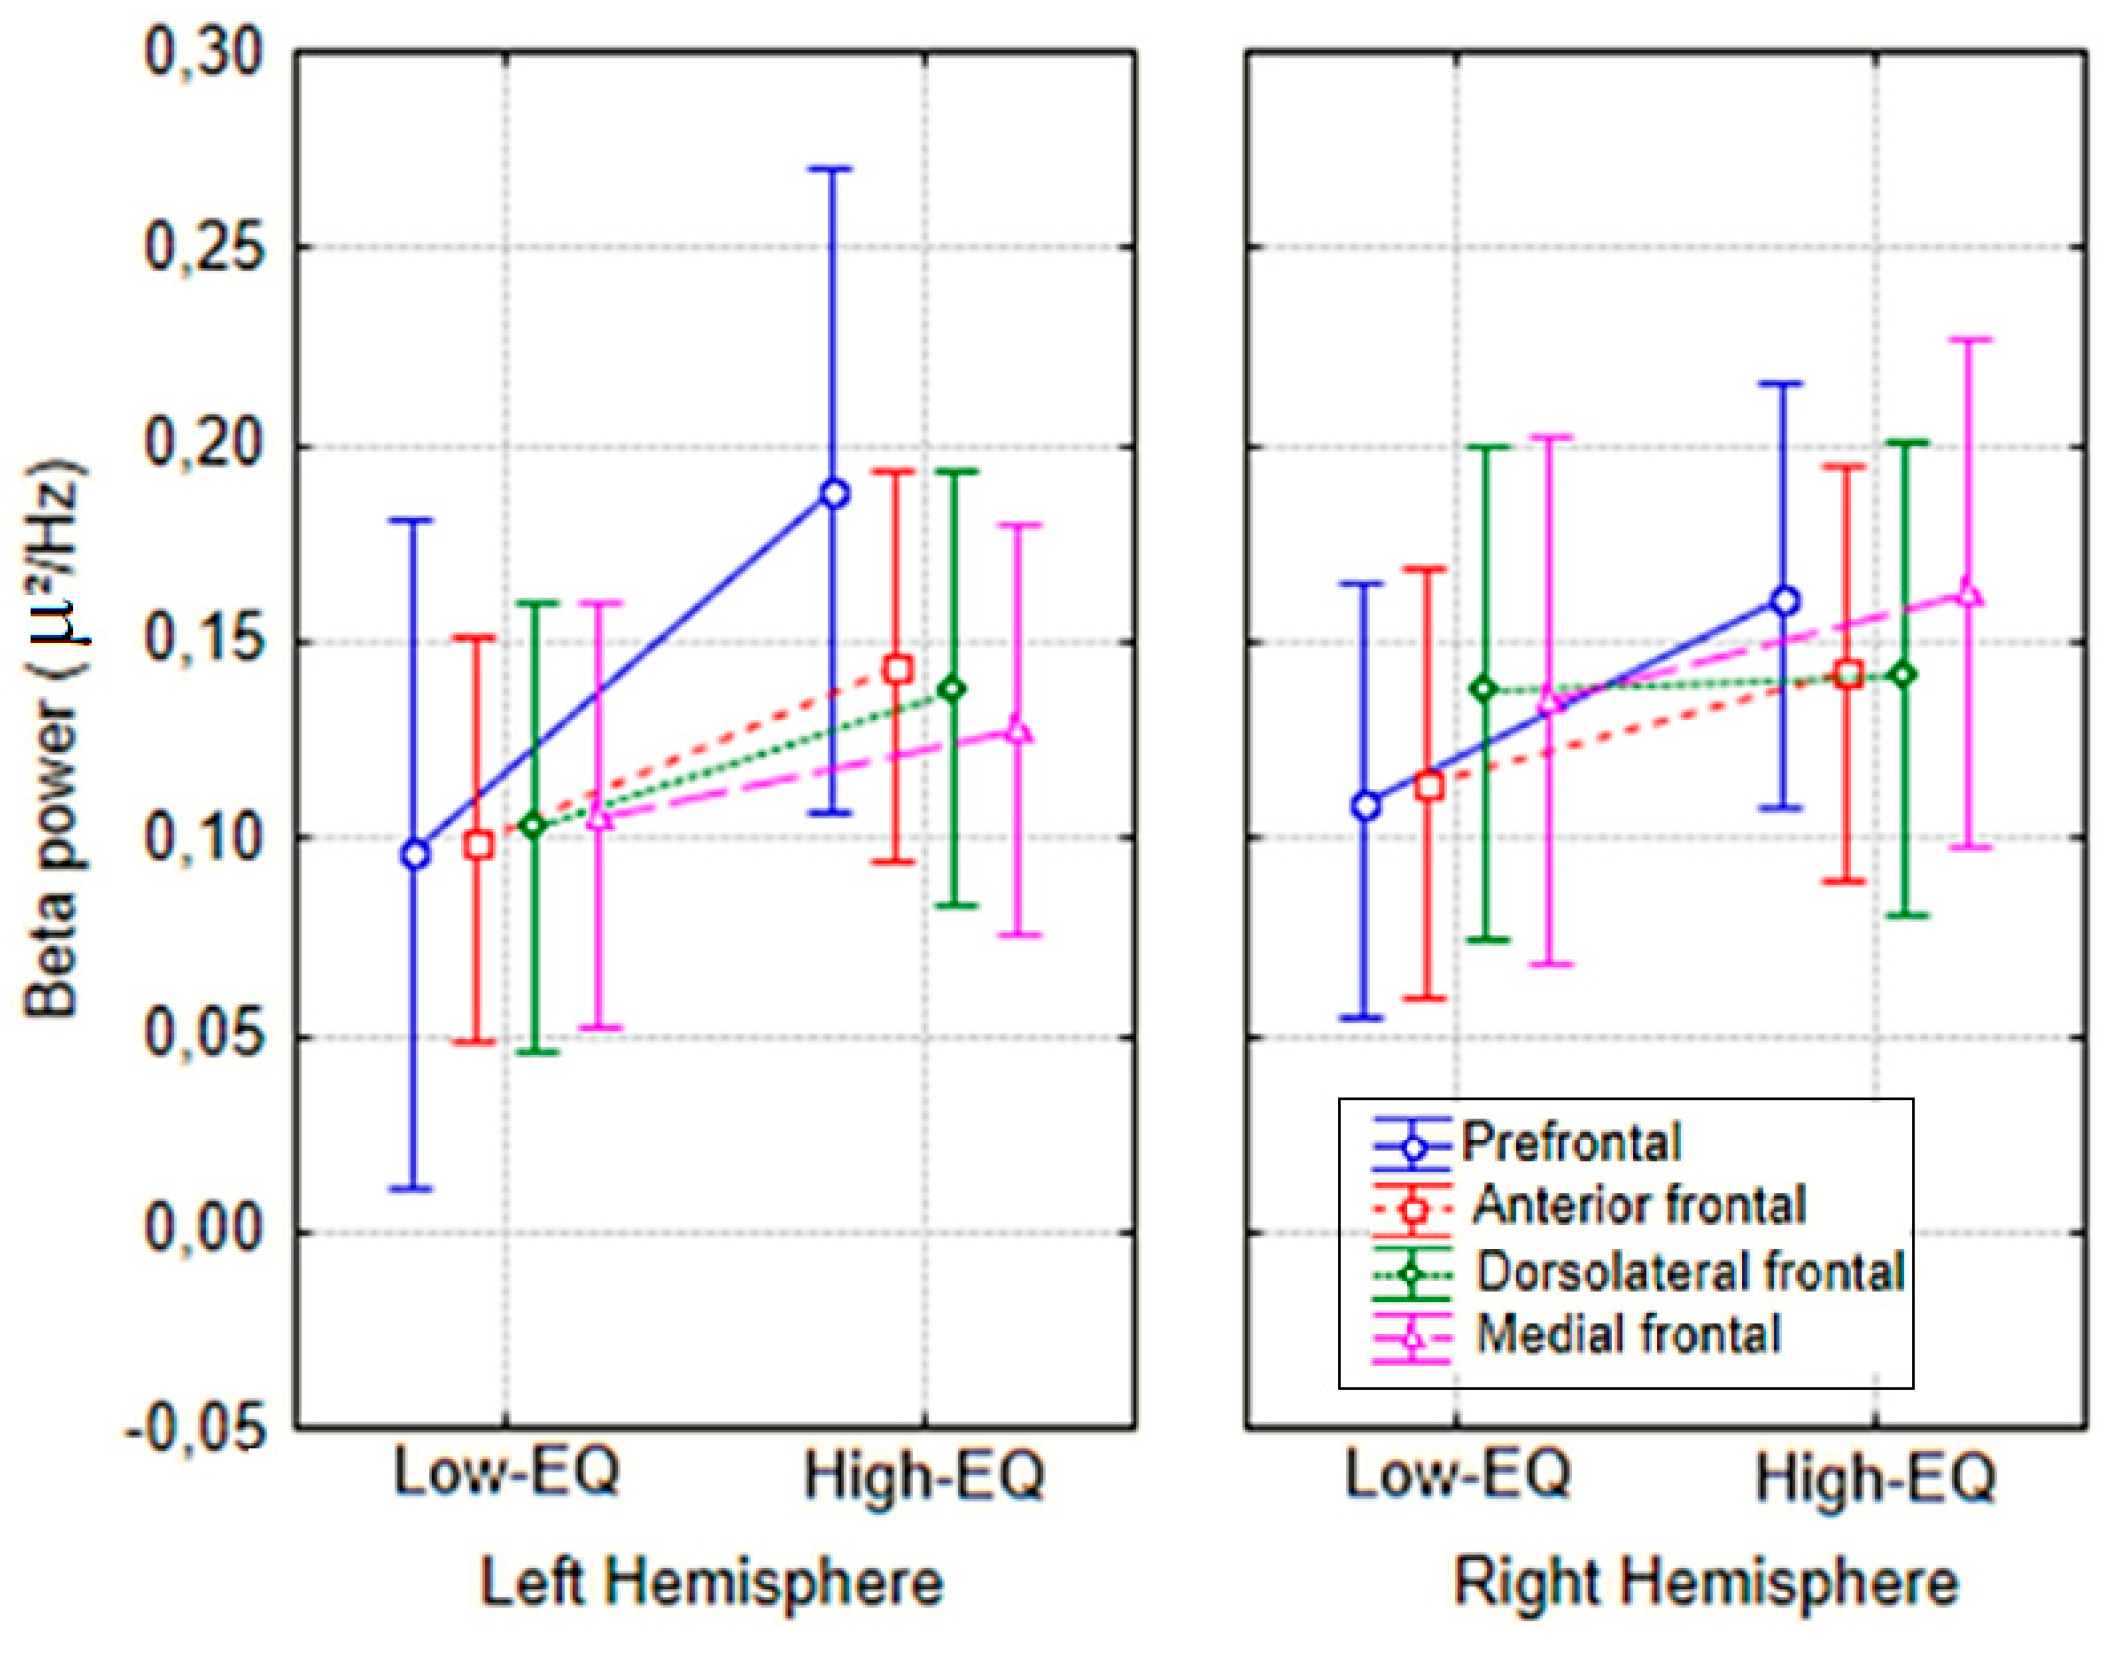
Figure 5.
Topographical distribution of EEG spectral power across Alpha (8.0–13.0 Hz), Mu (8.0–13.0 Hz), and Beta (15.0–24.0 Hz) frequency bands for participants with low and high empathy quotient (EQ). Scalp maps illustrate the normalized power (in μV²) projected onto a standard head model, with color gradients indicating relative power intensity. Notably, differences between Low-EQ and High-EQ groups emerge prominently in frontal regions, particularly in the Beta band, and in occipito/parietal regions, particularly in the alpha band.
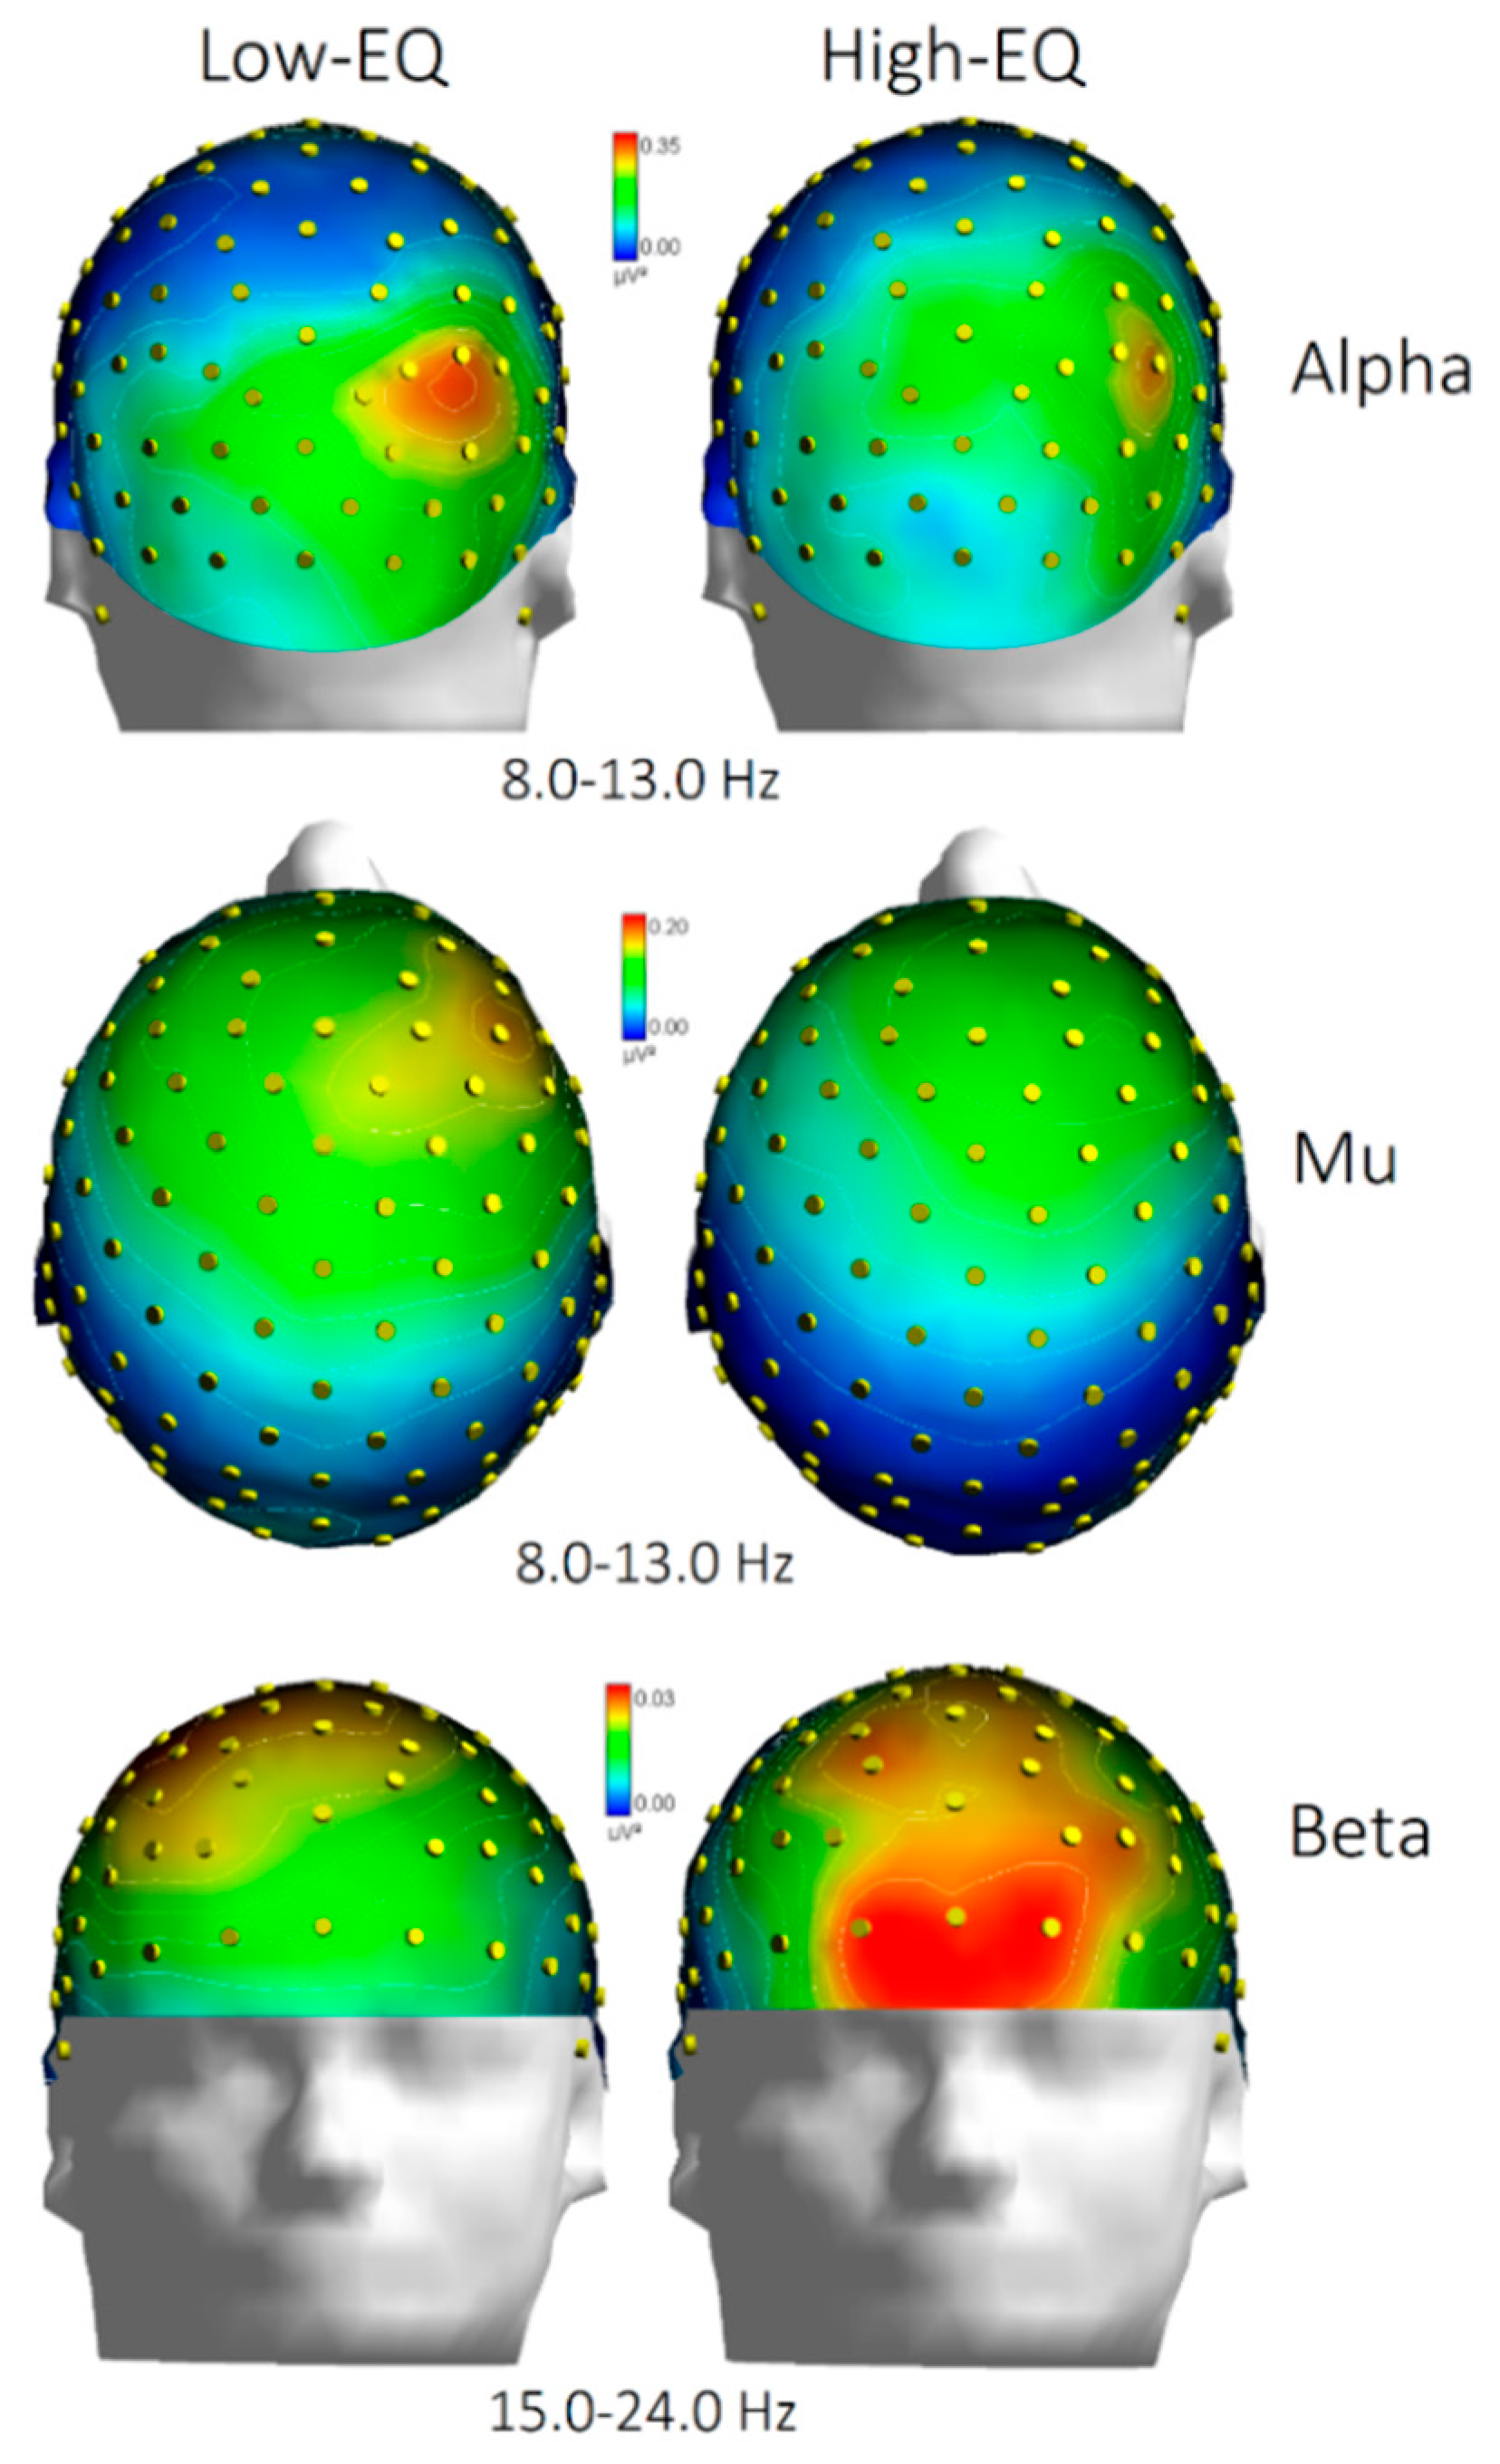
Figure 6.
Mean EEG spectral power (µV²/Hz) in the alpha/mu range, as a function of electrode site, EEG band and Empathy group. .
Figure 6.
Mean EEG spectral power (µV²/Hz) in the alpha/mu range, as a function of electrode site, EEG band and Empathy group. .
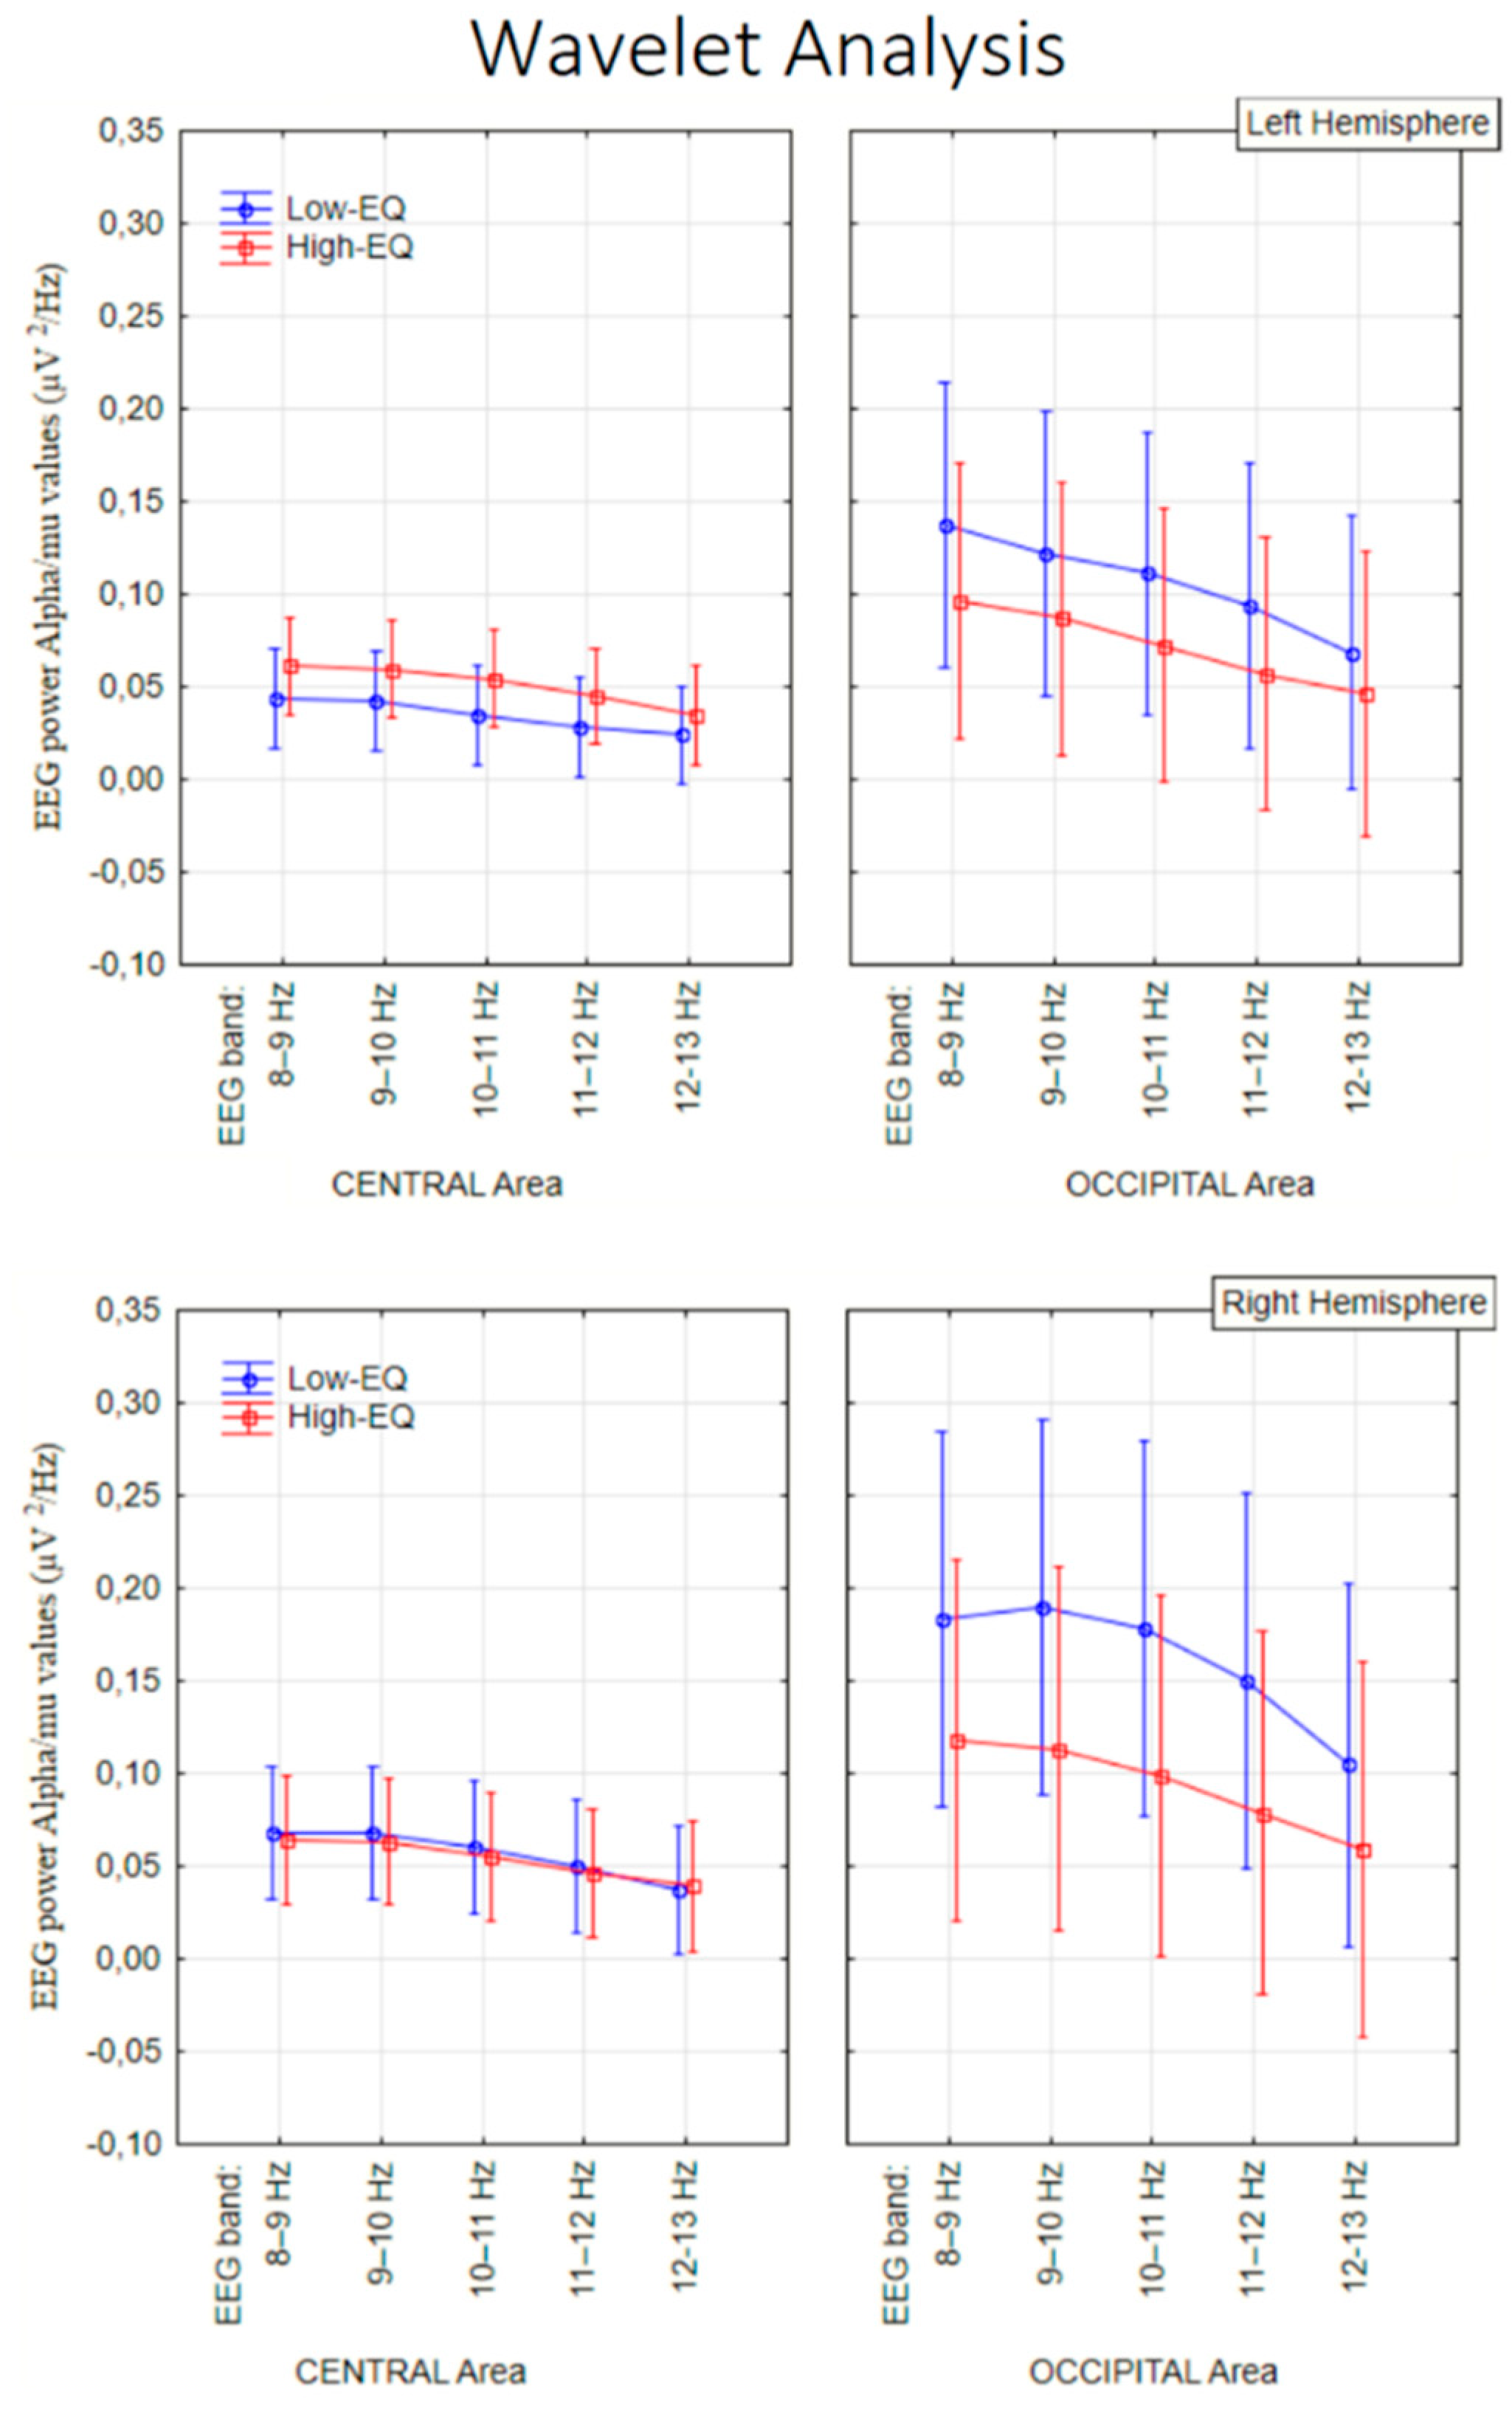
Figure 7.
Time–frequency representations of EEG spectral power (µV²/Hz) in the 8–13 Hz range for Low-EQ and High-EQ participants, computed using Morlet wavelet transformation. Each subplot displays data from a specific electrode site (central: C3, C4, CCP1h, CCP2h; occipital: PO3, PO4, O1, O2), with time (ms) on the x-axis and frequency (Hz) on the y-axis. Color gradients indicate the magnitude of spectral power, with warmer colors representing higher power. Notable group differences emerge in posterior regions, particularly around 150–250 ms post-stimulus.
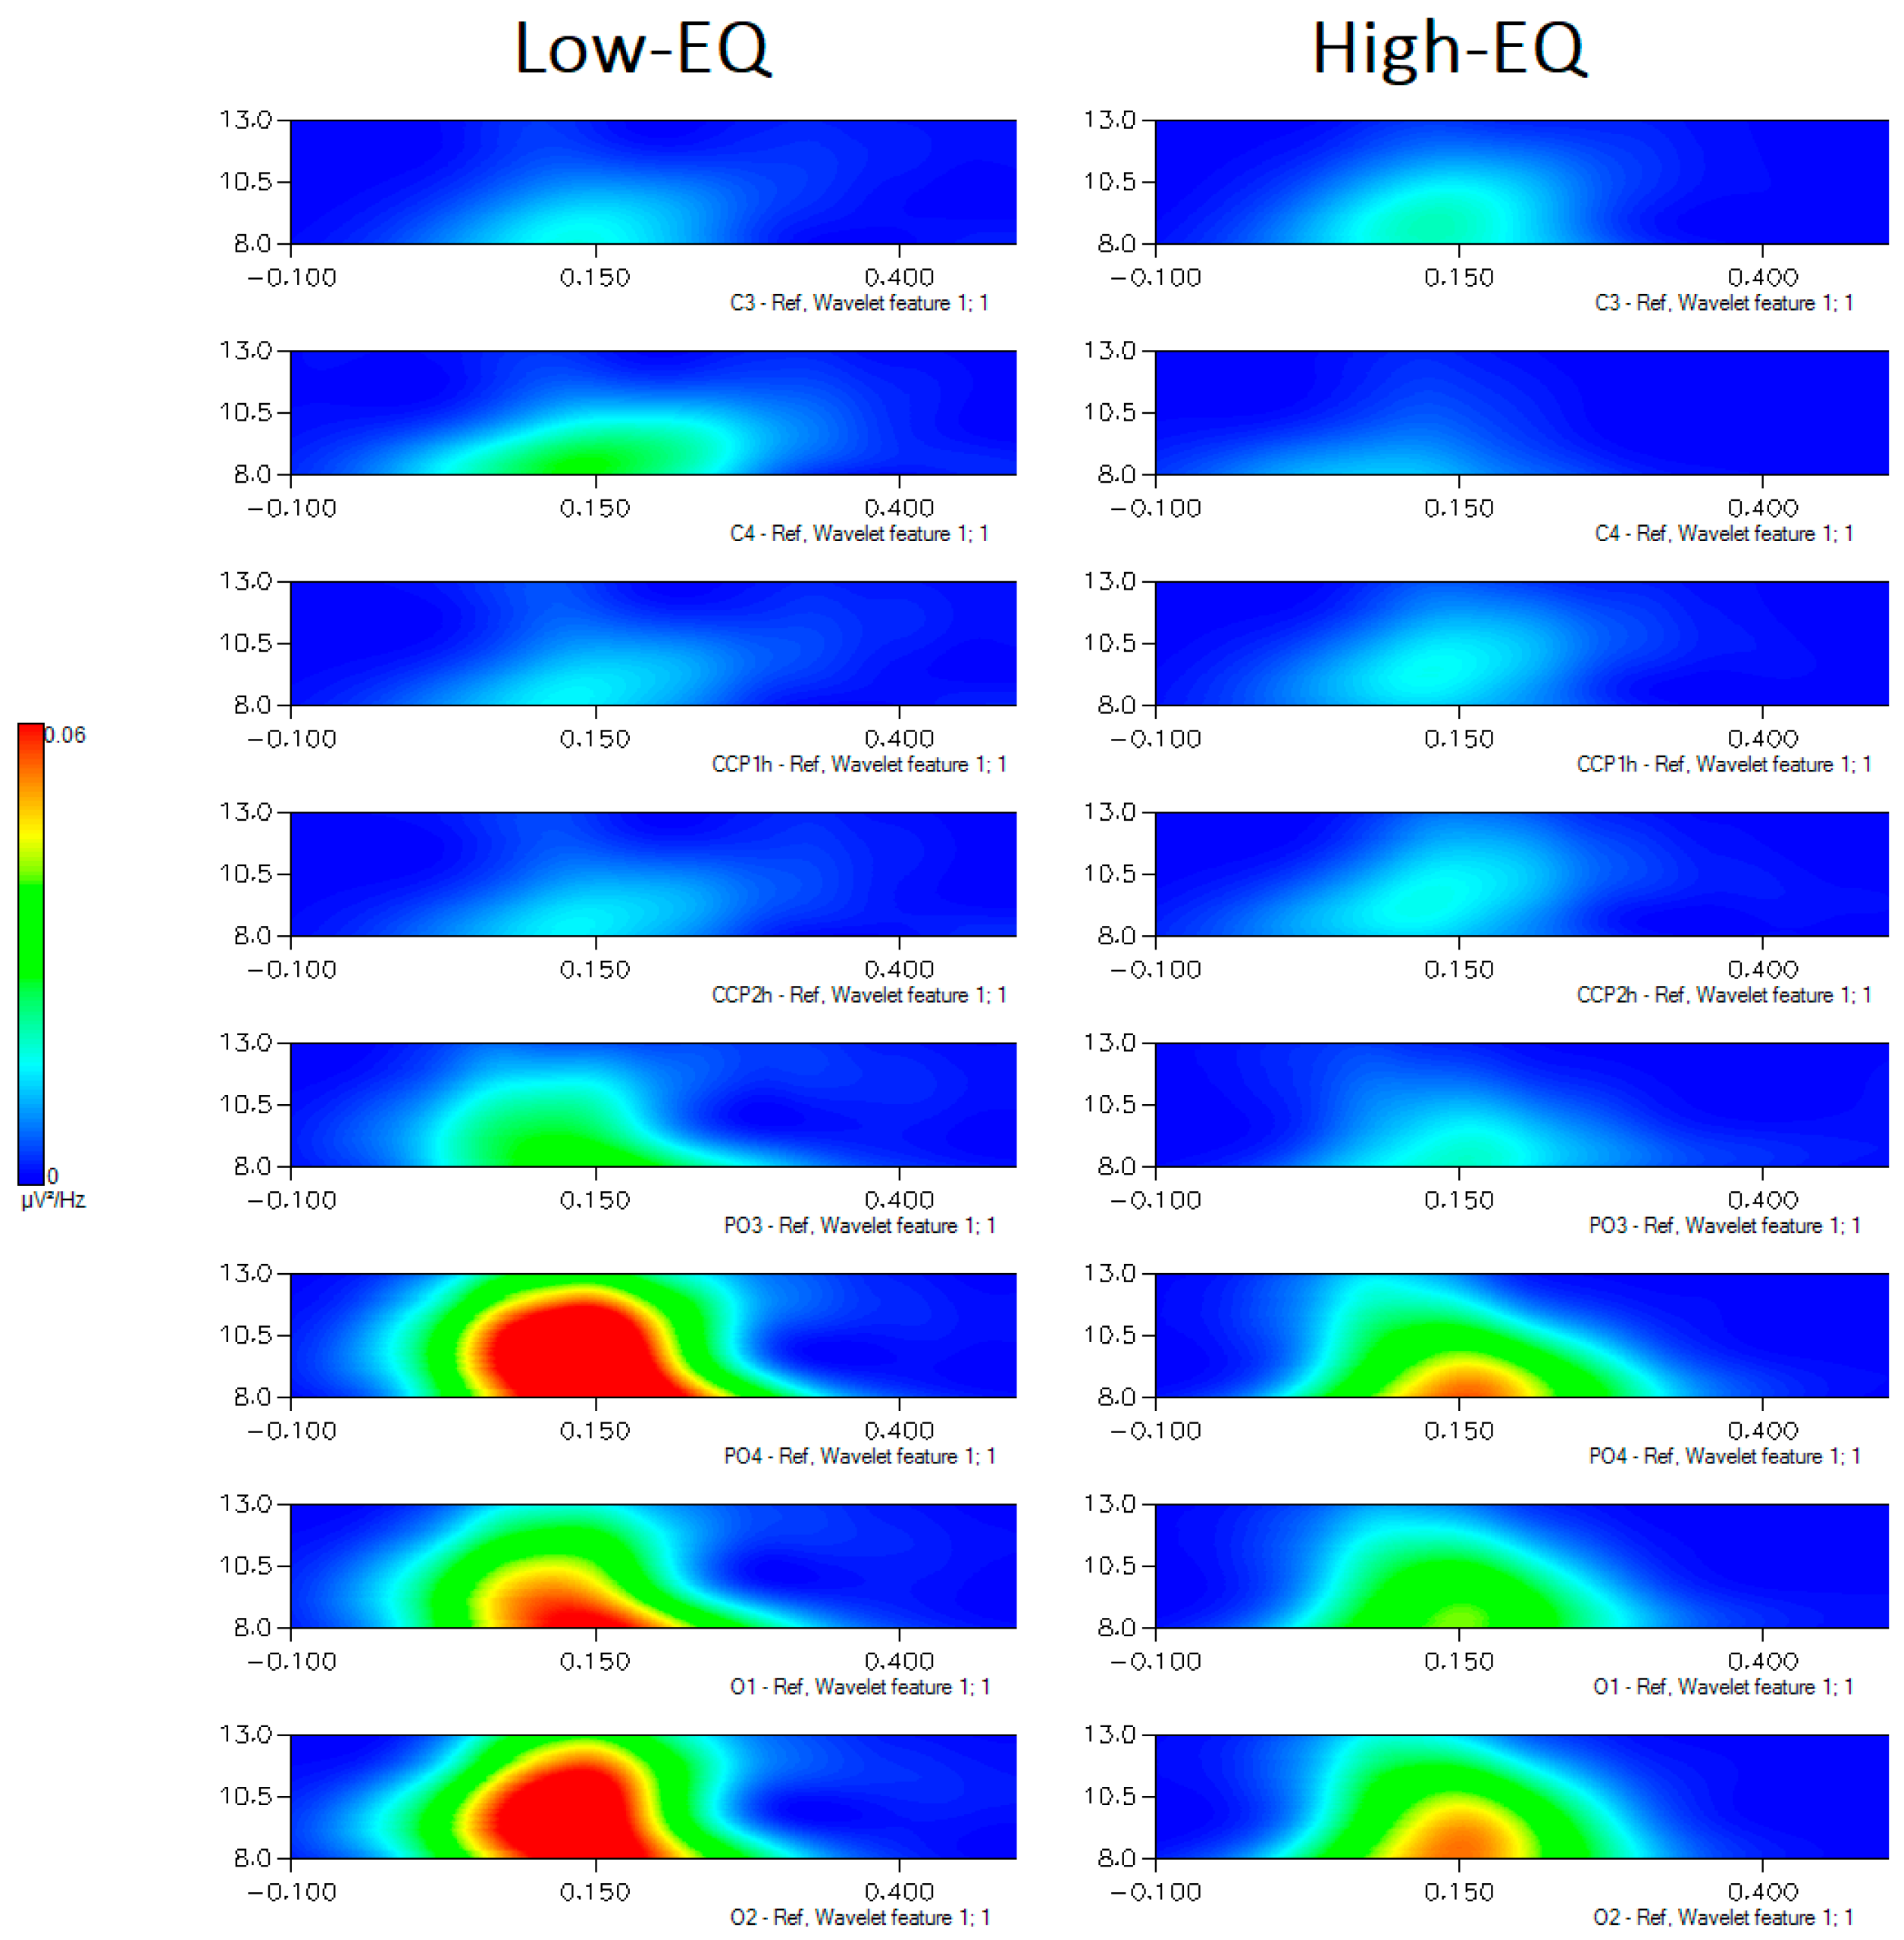

Table 1.
Mean empathy scores for the two participant groups. Normalized scores (obtained by scaling the raw total relative to twice the number of items), minimum and maximum values, and standard deviation (SD) values, are also provided.
Table 1.
Mean empathy scores for the two participant groups. Normalized scores (obtained by scaling the raw total relative to twice the number of items), minimum and maximum values, and standard deviation (SD) values, are also provided.
| Groups | Norm. score | N° SS | MIN | MAX | SD | Mean score |
| Low-ES | 0.511 | 14 | 0.27 | 0.60 | 0.091 | 15.286 |
| High-ES | 0.729 | 15 | 0.60 | 0.90 | 0103 | 21.867 |
Disclaimer/Publisher’s Note: The statements, opinions and data contained in all publications are solely those of the individual author(s) and contributor(s) and not of MDPI and/or the editor(s). MDPI and/or the editor(s) disclaim responsibility for any injury to people or property resulting from any ideas, methods, instructions or products referred to in the content. |
© 2025 by the authors. Licensee MDPI, Basel, Switzerland. This article is an open access article distributed under the terms and conditions of the Creative Commons Attribution (CC BY) license (http://creativecommons.org/licenses/by/4.0/).
Copyright: This open access article is published under a Creative Commons CC BY 4.0 license, which permit the free download, distribution, and reuse, provided that the author and preprint are cited in any reuse.


