
Submitted:
21 April 2025
Posted:
22 April 2025
You are already at the latest version
Abstract
Students’ retention rates (RR), progression or persistence or progress rates (PR), graduation or completion rates (GR or CR), and attrition or dropout rates (AR or DR) are statistical figures commonly used in higher education to monitor the performance of higher education institutions (HEI), academic degree programs, or their students. Because there is no universal definition of these educational quality metrics, their values should be interpreted carefully with a clear understanding of how they were computed to avoid misleading judgments and unfair comparisons. In this study, we develop clearly defined benchmarking retention, progression, and graduation rates by curating and manipulating well-documented public longitudinal raw data about undergraduate higher institutions over four recent consecutive cohorts, as released by the U.S. National Center for Education Statistics (NCES), and by the Research Center of the U.S. National Student Clearinghouse (NSC-RC). We aim at proposing generalized benchmarking standards that are applicable to a wide range of undergraduate education contexts. We particularly account for the variability in the desired time window over which some rates are reported, and for the presence of a foundation offered as a preparatory stage of postsecondary education before the college program. In addition to developing overall benchmarking rates, we also derive discipline-specific retention and progression rates for the following selected broad academic specializations: (1) Architecture, (2) Business/Management, (3) Computer/Information Science, (4) Engineering, (5) Engineering Technology, (6) Health/Clinical, and (7) Law. For these seven disciplines; our analysis shows that both retention and progression are best in Engineering (and closely Architecture), while they are poorest in Engineering Technology. The overall benchmarking retention rate after one year of entry is 75.93%, the overall benchmarking persistence rate after one year of entry is 75.22%, and the overall benchmarking graduation rate within 150% of the normal degree duration is 64.2%. Our study can benefit higher education institutions globally seeking criteria for assessing their students’ tracking rates, either for internal quality assurance or for third-party accreditation.
Keywords:
retention
; progression
; persistence
; graduation
; completion
; attrition
; rates
; higher education
; undergraduate
; students
1. Nomenclature (in Alphabetical Order; Greek Symbols First)
| Relaxation factor used in adjusting the progression rate to account for the effect of a foundation year (if applicable) | |
| Discount factor for extrapolating first-year retention rates, from 0 to 1 | |
| Discount factor for extrapolating first-year progression rates, from 0 to 1 | |
| Progression rate adjustment factor (or penalty factor) to account for the effect of a foundation year (if applicable) | |
| AR | Attrition rate (the complement of the retention rate; their sum is always 100%) |
| CR | Completion rate (same as the graduation rate) |
| CR′ | Scaled completion rate for a perfect 0-100% range (proposed, but not used here) |
| DR | Dropout rate (same as the attrition rate) |
| ED | United States Department of Education |
| GR | Graduation rate, equivalently called “completion rate” |
| GR′ | Scaled graduation rate for a perfect 0-100% range (proposed, but not used here) |
| HE | Higher education (equivalently “postsecondary education” or “tertiary education”) |
| HEI | Higher education institution (a university, academic institute, academy, or a standalone college) |
| IES | Institute of Education Sciences (part of ED) |
| NCEE | National Center for Education Evaluation and Regional Assistance (one of four centers under IES) |
| NCER | National Center for Education Research (one of four centers under IES) |
| NCES | National Center for Education Statistics (one of four centers under IES) |
| NCSER | National Center for Special Education Research (one of four centers under IES) |
| IPEDS | Integrated Postsecondary Education Data System (a system of annual data collection about higher education, conducted by NCES) |
| NSC-RC | National Student Clearinghouse – Research Center (located in the state of Virginia, USA) |
| PR | Progression rate (when defined as a modified version of the retention rate; we refer to this form of progression rate as the “expanded retention rate”), equivalently called “persistence rate” or “progress rate” (this is the type actually adopted in the date used by this study) |
| Average progression rate over four consecutive years | |
| Progression rate (when defined as a measure of the satisfactory pace of students’ advancement in their study within the same institution or degree program; we refer to this form of progression rate as the “within-institution/program study advancement” or simply the “within-institution/program”), equivalently called “persistence rate” or “progress rate” (explained, but not used here) | |
| Adjusted for the influence foundation year | |
| ′ | Scaled for a perfect 0-100% range (proposed, but not used here) |
| ′′ | Scaled performance-based (proposed, but not used here) |
| RR | Retention Rate |
| Average retention rate over four consecutive years |
2. Introduction
2.1. Background
Undergraduate higher (postsecondary/tertiary) education, is an important stage of the qualifications framework, where many students are being prepared for starting their career and professional life, rather than for a subsequent stage of formal education [1,2,3,4]. Quality assurance in this stage involves a continuous improvement process, where several performance elements (qualitative indicators and quantitative metrics) are regularly evaluated and monitored against target levels or benchmarked with peers, such as the students-faculty ratio, retention rates (RR), progression rates (PR) – also known as persistence rates, graduation rates (GR) – also known as completion rates (CR), attrition rates (AR), students’ satisfaction, post-graduation job satisfaction, community engagement, institutional ranking, institutional affiliations, industrial collaboration and interaction with professional bodies, alignment with professional licensure, students’ scores on third-party standardized tests, practicum/field work and other experiential learning modes, entrepreneurial support, participation in competitions or innovation exhibitions, internationalization and students’ mobility, attractive students’ activities and campus life, and focus on sustainability [5,6,7,8,9,10,11,12,13,14,15,16,17,18,19,20,21,22,23,24,25,26,27,28,29,30,31,32,33,34,35,36,37,38,39,40,41,42,43,44,45,46,47,48,49,50].
Students’ retention rates (RR), students’ progression rates (PR), and students’ graduation rates (GR) are three quantitative quality metrics for tracking students and assessing their success from the entry/admission point till the completion/graduation point, or for compliance with accreditation requirements [51,52,53,54,55,56,57].
Retention rates generally express the ability of an HEI or an academic degree program to retain its students; such that after a specified duration (one year for example), if a student remains enrolled (maintaining their active ID number) in the same HEI or program or earns a credential (academic degree) form it, then that student is considered “retained”. High retention rates (ideally 100%) are favored; as they show the attractiveness of the HEI or program, its stability, reputation, financial wellbeing, and a healthy relationship with its students that suggests a sense of belonging and an atmosphere of inclusion [58,59,60,61,62,63]. Mathematically, the retention rate is expressed as
where the term “initial students” here refers to students at the beginning of the retention computation period; such as the beginning of the entire undergraduate degree program at the admission/entry point. Thus, if all initial students are retained, RR reaches its upper limit of 100%. With this expression, RR is guaranteed to lie exactly within the normalized range 0-100% as an inclusive interval of all possibilities, making it straightforward to interpret as any efficiency figure adopted for convenient performance characterization in energy systems or industrial processes [64,65,66,67,68,69,70,71,72,73,74,75,76,77,78,79,80,81].
The opposite (or complement) of retention is attrition or dropout, which refers to students who do not remain in their HEI or academic program, because of transferring out, withdrawal, or dismissal [82,83,84,85,86]. Thus, the attrition rate (AR) or dropout rate (DR) is 100% minus the retention rate (RR) as expressed in Equation (2). For example, a retention rate of 80% corresponds to an attrition rate (or a dropout rate) of 20%.
Or
where the term “dropout students” here refers to all students who do not continue their enrollment in the HEI or program, because of transferring out, withdrawal, or dismissal. The ideal attrition rate is 0%; it is aimed to be minimized.
Progression rates (or persistence rates or progress rates) commonly refer to the ability of the students to advance through their academic program with a satisfactory rate that enables them to graduate within the normal duration of study (such as four years in a bachelor’s degree program) [87,88,89,90,91,92,93]. The portion of students who maintain a satisfactory pace of passing courses or earning credit hours over a specified period gives the progression rate (PR). Mathematically, the progression rate can be described as
The circumflex (hat) notation is intentionally added to the above acronym of the progression (persistence) rate to emphasize that it is just one form of multiple forms in which it was defined in the literature. There is an alternative way to define the progression (persistence) rate, making it the result of augmenting the retention rate by including those students who transfer out to other institutions or complete a credential there (in this definition, a student is persistent or progressing if she or he continues studying regardless of where). Mathematically, this alternative definition of the progression (persistence) rate can be expressed as
In fact, this alternative definition was adopted by the source of raw progression (persistence) rates we used here. This alternative definition of the progression (persistence) rate makes it less interesting to an individual higher education institution or academic program (it remains interesting at a country-level), and such a rate in this case does not qualify for institutional-level or program-level benchmarking and quality assessment, while the definition we expressed is much more useful and practicable. Despite this, all the progression (persistence) rates in our study refer to the alternative definition of being an “expanded retention rate” as per Equation (5), rather than being a “within-institution/program study advancement” as per Equation (4).
We also notice that some sources use the term “persistence rate” or “progression rate” with a similar meaning to what we call “retention rate”; but for the purpose of this study, these terms are different [94,95,96]. One study defined the progression rate during a college study in a different way as the duration of time to graduate following an anticipated progression pattern till graduation (for example, being a sophomore "second-year" student, then a junior "third-year" student, and then a senior "fourth-year" student) [97]. There are higher education institutions We understand that the term “progression” is easier to delineate in a school system with uniformly set sequential grades as compared to a college system where students have more freedom in deciding the sequence of courses they complete [98,99,100,101,102]. We also notice that there are higher education institutions or academic programs that do not monitor progression rates, but monitor retention rates and graduation rates; considering them sufficient for the tracking process [103,104,105].
Graduation rates (GR) or completion rates (CR) represent the portion of those students who successfully complete their graduation requirements within a specified period of time, which is commonly taken as 150% (one and half) times the nominal program’s completion period (normal or expected period for graduation); and this extension in the graduation window allows a less-biased and more-complete analysis, with accommodation for students who need additional study semesters, for example to balance their study with family or work commitments. This intentional time extension allows for accommodating such cases that otherwise penalize the HEI or program through low graduation rates driven mainly by a small number of exceptional students, reflecting a highly-skewed distribution of graduation durations [106,107,108,109,110,111,112,113,114]. Thus, for a four-year bachelor’s degree program, the graduation rate is the portion of students who complete the program within six years; while for a three-year undergraduate advanced diploma program, the graduation rate is the portion of students who complete the program within 54 months; and for a two-year diploma (associate degree) program, the graduation rate is the portion of students who complete the program within three years; and for a one-year undergraduate certificate program, the graduation rate is the portion of students who complete the program within 18 months; and other students who fail to graduate within that extended graduation window represent “non-completion” cases, and their portion is the a complementary non-completion rate (NCR), defined as [115,116,117,118,119,120,121,122,123,124]
Mathematically, the graduation (completion) rate can be expressed as
where the term “extended period” refers here to 150% of the nominal period for completion.
Several approaches can improve students’ retention, progression, or graduation rates; such as advising and mentorship, customized educational environment, and student-centered learning [125,126,127,128,129,130,131,132]. For example, one study suggested innovative teaching techniques; such as project-based learning, peer teaching, and retrieval practice (which improves memory retention through 'active' recall of information in response to a question, as compared to 'passive' review methods); and such active learning strategies through systemic educational reforms boost an equitable and inclusive learner-centered environment and address learning barriers [133]. Another study found, through empirical research and hypotheses testing, that disparity in graduation rates among different higher education institutions is linked to the variations in institutional resources; and suggested that policy interventions can be adopted to remedy this issue where many higher education students are unable to earn a degree after enrolling in a four-year college [134]. In another study, offering a for-credit course titled “Psychology of Success” about positive psychology to academically-warned students after their first semester (with an option to drop this course after enrollment) was found to foster retention, progression, and graduation; based on results analyzed after four years of implementing this methodology [135].
2.2. Goal of the Study
This work was motivated by our experience with accreditation and administrative roles in higher education, particularly for undergraduate education, where the regular reporting of retention, progression, and graduation rates for a particular degree program is mandatory. While the computing of these rates can be automated through digital information systems, the evaluation of these rates remains a source of subjectiveness and perplexity if no clear targets or benchmarking standards exit. When attempting to compare the obtained students’ tracking rates (retention, progression, and graduation) with peer values, one can get highly misleading outcomes due to the variability in how these rates are computed. The problem becomes more pronounced in a higher education system that is based on credits (credit hours or credit points), rather than sequential semesters; because terms like “first year of study” and “second year of study” become not uniquely defined [136,137,138,139]. A student may be taking a course from the third year of the nominal study plan at the same time as taking a course from the second or even the third year, as long as the prerequisites are satisfied. Furthermore, undergraduate programs that involve a non-credit preparatory year (to be called here a ‘foundation year’) as a transition stage (a bridging step) between high school (secondary school) and the degree program in colleges need careful treatment when the student’s tracking rates are either computed or interpreted [140,141,142,143].
In the current study, we primarily aim at presenting general benchmarking value for the three students’ tracking rates (retention, progression, and graduation) based on selected and processed values, such that they may suit a wide range of higher education institutions as benchmarking standards for their particular situation.
3. Research Method
3.1. Data Sources
The present study is largely based on quantitative descriptive statistical analysis, with a small component involving inferential statistics and hypothesis testing.
The raw data about undergraduate students’ tracking rates were selected from two US-based sources, which are the National Center for Education Statistics (NCES), and the National Student Clearinghouse – Research Center (NSC-RC). The rationale behind using these particular sources is the robustness and reliability of their data being managed by well-established national-level entities having long specialized experiences in this process. The use of both sources, rather than only one of them, is because each source provides a certain set of data that partly fulfills the needs of our study; but both sources together provide all the data needed.
The National Center for Education Statistics (NCES) is one of the four centers belonging to the Institute of Education Sciences (IES) of the United States Department of Education (ED), and its mission traces back to the time when the Department of Education was instituted in 1867, and this mission involves collecting statistics and facts that describe the condition and progress of education in the several US states, as well as diffusing such data to allow people in the USA to establish and maintain efficient education systems [144,145]. The other three centers under IES are the National Center for Education Evaluation and Regional Assistance (NCEE), the National Center for Education Research (NCER), and the National Center for Special Education Research (NCSER) [146,147]. NCES is the main federal entity in the USA for collecting and analyzing data related to higher education, and it utilizes a robust and well-documented data system for the annual collection of data about higher education institutions in the USA, which include retention rates and graduation rates, among many other elements. This data system is the Integrated Postsecondary Education Data System (IPEDS), which represents 12 interrelated survey components that are conducted annually for gathering data from every college, university, and technical and vocational institution that participates in the federal student financial aid programs; and these data collections take place in the fall, winter, and spring semesters [148,149,150]. A free online portal called “College Navigator” was established by NCES, in which various metrics and indicators can be accessed for a particular higher education institution. However, since in our study we focus on aggregate national rates rather than individual institutions’ data, we use another free online data explorer, which is the Trend Generator [151,152].
The National Student Clearinghouse – Research Center (NSC-RC) is the research branch of the National Student Clearinghouse (NSC), and it works with higher education institutions and other educational organizations to better inform policymakers and practitioners about the educational pathways of students through reporting data outcomes. The Clearinghouse has been a non-profit education partner to colleges and universities in the USA since 1993, providing them with educational reports, studies on educational progress, and research services [153,154].
Table 1 lists the data we curated in the current study and their sources.
It should be noted that the seven disciplines selected here for additional discipline-specific analysis are not the exhaustive set of disciplines available in the NSC-RC data. Instead, we selected these disciplines as examples of personal interest that allow reasonable diversity in the coverage. Examples of additional available disciplines in the NSC-RC data are Agriculture, Biological/Biomedical Sciences, Communication/Journalism, Education, English Language, History, Liberal Arts, Mathematics/Statistics, Military Technologies, Parks/Recreation/Leisure/Fitness Studies, Philosophy and Religious Studies, Physical Sciences, Psychology, and Public Administration.
3.2. Retention and Progression Extrapolation
Because the reported retention rates in both sources used here (NCES or NSC-RC) and the progression rates (called persistence rates) reported by NSC-RC are based on the first year of college study; institutions that adopt longer time windows (such as the entire nominal duration of the program) for computing their retention rates should not compare their retention or progression rates with those directly reported by NCES or NSC-RC; as such comparison becomes misleading and unfair for those institutions because the retention or progression over a wider multi-year window is expected to be lower than those of the narrower first-year window. Therefore, we suggest a nonlinear extrapolation where either the first-year retention rate or the first-year progression rate is penalized when estimated for a multi-year period with a multiplicative “discount factor” () that is the average of the square roots of the first-year retention rates (or the first-year progression rates) in the last four years. The rationale of our choice of this extrapolation mechanism combines both the simplicity of implementation (a single factor is involved in the extrapolation process) and the reasonable assumption that either progression or retention in subsequent years is better than their counterpart in the first year, where students might be experiencing a new college environment and education system that are different from those they are aware of during their earlier school study. Thus, instead of multiplying with the first-year rate itself, taking the square root brings the multiplicative factor closer to unity, and thus serves to weaken the anticipated decline in either the retention rate or the progression rate. After this, taking an average over four years helps in smoothening the computation and reduces the possibility of short-term irregularity due to exceptional rates in a particular year, such as during the COVID-19 pandemic [158,159,160,161,162,163].
Mathematically, if the first-year retention rates for the last four consecutive cohorts are RR1 (oldest: corresponding to Fall 2019-20 in our study), RR2, RR3, and RR4 (latest: corresponding to Fall 2022-23 in our study); then the discount factor for extrapolating the retention rate () is
If the average retention rate for the four years is
then, the extrapolation of the first-year retention rate is performed as
Similarly, if the first-year progression rates for the last four consecutive cohorts are PR1 (oldest: based on the entering cohort of 2019-20 in our study), PR2, PR3, and PR4 (latest: based on the entering cohort of 2022-23 in our study); then the discount factor for extrapolating the progression rate () is
and the average progression rate for the four years is
Then, the extrapolation of the first-year progression rate is performed as
3.3. Progression Adjustment for Foundation Year
In the case that the progression (persistence) rate is a measure of the satisfactory pace of students’ advancement in their study within the same institution or degree program (we designate this form of progression rate by the symbol ); then when computing the progression rates for an academic program that offers obligatory non-credit foundation year, the computation of such as progression rate becomes difficult as the transition from the foundation year to the college study is not necessarily happening concurrently at a single point; as some students may need more than one year to finish the foundation phase (for example because repeating a foundational course) or may need less than one year to finish it (for example, because the student transfers from another higher education institution in which the student completed part of the foundation requirement; or because the student can be exempted from part of the foundation requirement due to prior attained standardized certificate or due to receiving a high score in a placement test) [164,165]. The existence of such a foundation year does not impact the computation of retention rates, but largely worsens the progression rates if they are computed over a time window that starts after the students’ admission to the higher education institution, regardless of the student being subject to a foundation year or being partly or fully exempted from it. Our proposed adjustment here for proper benchmarking (when the available reference progression rates correspond to a system not having a foundation year, where students get admitted directly to the degree program) is scaling down these reference progression rates through a multiplicative “penalty” factor. We propose that this penalty factor starts at 0.5 (selected here as the midway between the extreme limits of 0 and 1) in the first-year progression rate, which means that if the foundation-free (unadjusted) benchmarking value or target for the first-year progression rate is 80% for example, the higher education institution may expect to achieve only half of this as a result of having students spending their first year in the non-credit foundation year, which is not considered when the progress in the degree program is quantified. We further suggest that this penalty factor (progression rate adjustment factor) is relaxed if the first-year progression rates are extrapolated to obtain multi-year estimates, with a relaxation factor of (=1/0.9=1.11111). Thus, the two-year progression rate adjustment factor is 0.5/0.9 = 0.55556; the three-year progression rate adjustment factor is 0.5/0.92 = 0.61728; and the four-year progression rate adjustment factor is 0.5/0.93 = 0.68587. The reason for this suggested relaxation is the decay of the interruption caused by the initial foundation year as students exit it and advance through the for-credit degree program.
Designating the progression rate adjustment factor by the symbol (), and the adjusted progression rate for the effect of a foundation year by the symbol (), then the following expression describes mathematically the suggested correction to incorporate the effect of a foundation year:
Figure 1 visualizes the variation of the adjustment factor () and the duration to which the progression rate corresponds. The gradual increase in the value of that penalty factor is the result of the relaxation parameter (). Although the variation appears linear (represented by a straight line), it is actually nonlinear (represented by a concave-up curve in the figure), but the nonlinearity is not pronounced because the relaxation parameter () is close to 1.0.
In all the progression figures presented in the subsequent “Results” section, two sets of progression rates are presented; the smaller progression rate is the one after applying the aforementioned adjustment model for approximating the influence of a foundation year, and it is more suitable for higher education institutions that employ such a preparatory non-credit bridging scheme and also define the progression rate according to the “within-institution/program study advancement” type. Although the raw progression (persistence) data curated here are based on the “expanded retention rate” type, where the aforementioned adjustment is irrelevant; we still apply it for numerical demonstration purposes, and the reader should pay attention to this.
4. Results
4.1. Overall Full-Time Bachelor’s Degree Retention Rates
Our results start with the overall (not the discipline-specific) retention rates. Figure 1 shows the estimated retention rates for bachelor’s degree students. These estimates are based on raw data from NCES (National Center for Education Statistics) covering a large number of higher education institutions (4,923), and raw retention rates reported over four consecutive years (from Fall 2019-20 to Fall 2022-23). The average first-year retention rate (this corresponds to in our mathematical expressions) is 75.93%. Thus, about three-quarters of the bachelor’s degree students are retained; which gives an average first-year attrition rate of 24.07%. For higher education institutions or academic programs that report their retention rates over an entire nominal undergraduate study period of four years, the extrapolated benchmarking retention rate drops to 50.23%. If an additional fifth year of a foundation bridging phase also exists after admission, our suggested benchmarking retention rate is the five-year extrapolated value of 43.77%.
4.2. Discipline-Specific Retention Rates
For the selected seven broad disciplines, and based on our proposed analysis of the raw data of NSC-RC (National Student Clearinghouse – Research Center), we provide here estimated discipline-specific undergraduate retention rates for benchmarking purposes.
Figure 3 shows the retention rates (with five time windows, from one year to five years) for the architecture discipline, based on an average number of 10,390 undergraduate students (average of four consecutive years, representing the admission cohorts of Fall 2019-20, Fall 2020-21, Fall 2021-22, and Fall 2022-23); who are mostly bachelor’s degree students (83.51%), with a small fraction of 14.72% at the associate degree (diploma) level, and only 1.77% at the level of undergraduate certificate. These retention rates correspond to the precise classification category “Architecture and Related Services”. Relative to the overall average first-year retention rate of 75.93%, the architecture-specific average first-year retention rate is higher by about six percentage points (6 pp), with a value of 81.00%; which is the second highest among the seven disciplines covered in this study, and it is close to the highest (being 82.21%) for engineering.
Figure 4 shows the retention rates for the business/management discipline, based on an average number of 309,734 undergraduate students, with the distribution by degree being 63.99% at the bachelor’s level, 31.23% at the diploma’s level, and 4.78% at the certificate’s level. These retention rates correspond to the precise classification category “Business, Management, Marketing, and Related Support”. Relative to the overall average first-year retention rate of 75.93%, this discipline has a lower average first-year retention rate of 66.82%.
Figure 5 shows the retention rates for the computer/information science discipline, based on an average number of 105,674 undergraduate students, with the distribution by degree being 58.61% at the bachelor’s level, 35.53% at the diploma’s level, and 5.86% at the certificate’s level. These retention rates correspond to the precise classification category “Computer and Information Sciences and Support Services”. Relative to the overall average first-year retention rate of 75.93%, this discipline has a lower average first-year retention rate of 68.30%.
Figure 6 shows the retention rates for the engineering discipline, based on an average number of 125,426 undergraduate students, with the distribution by degree being 85.91% at the bachelor’s level, 12.82% at the diploma’s level, and 1.27% at the certificate’s level. These retention rates correspond to the precise classification category “Engineering”. Relative to the overall average first-year retention rate of 75.93%, this discipline has a higher average first-year retention rate of 82.21%; which is in fact the highest among the seven disciplines covered in this study.
Figure 7 shows the retention rates for the engineering technology discipline, based on an average number of 32,747 undergraduate students, with the distribution by degree being 27.47% at the bachelor’s level, 57.51% at the diploma’s level, and 15.02% at the certificate’s level. These retention rates correspond to the precise classification category “Engineering Technologies/Technicians”. Relative to the overall average first-year retention rate of 75.93%, this discipline has a lower average first-year retention rate of 59.67%; which is in fact the lowest among the seven disciplines covered in this study.
Figure 8 shows the retention rates for the health/clinical discipline, based on an average number of 218,711 undergraduate students, with the distribution by degree being 50.71% at the bachelor’s level, 36.99% at the diploma’s level, and 12.31% at the certificate’s level. These retention rates correspond to the precise classification category “Health Professions and Related Clinical Sciences”. Relative to the overall average first-year retention rate of 75.93%, this discipline has a lower average first-year retention rate of 64.64%.
Figure 9 shows the retention rates for the law discipline, based on an average number of 5,554 undergraduate students, with the distribution by degree being 43.93% at the bachelor’s level, 48.17% at the diploma’s level, and 7.90% at the certificate’s level. These retention rates correspond to the precise classification category “Legal Professions and Studies”. Relative to the overall average first-year retention rate of 75.93%, this discipline has a lower average first-year retention rate of 63.08%.
4.3. Overall Progression Rates
Going back to overall (not discipline-specific) results, Figure 10 shows the estimated undergraduate graduation rates. These estimates are based on raw data from NSC-RC, covering a large number of students (2,439,729) averaged over four consecutive Fall-entry cohorts from 2019-20 to 2022-23. After averaging over these four years, we found that these undergraduate students were distributed as 79.34% full-time students, 16.35% part-time students, 1.50% non-credential students, and 2.81% students with unspecified "unknown" programs. The average first-year progression rate is 75.22% (this is ); which is close to the average first-year overall bachelor’s degree full-time retention rate previously obtained as 75.93% (this is or ). For higher education institutions or academic programs that adopt a non-credit bridging foundation, if this progression rate is of the “within-institution/program study advancement” type (this is ), then its adjusted average first-year value is 37.61% (this is , which in our model is approximated as ). If our extrapolation model is applied, the obtained four-year progression rates become either 49.07% (without a foundation year; this is ) or 33.66% (with a foundation year “hypothetical situation in this work”; this is ). This means that about one-half of the students who are admitted to a four-year undergraduate degree program are expected to remain progressing (persistent) four years after they start the program; whereas in the case that the students are typically admitted to a one-year foundation studies, then about one-third of them is expected to graduate within four years after admission (roughly three years after transitioning from the non-credit foundational component and starting their for-credit college component). The influence of the foundation year is reflected by having a lower benchmarking level for graduation, which makes the comparison fairer by taking into account the influence of the foundation year into statistical progression data that do not originally reflect the presence of such an additional study load.
4.4. Discipline-Specific Progression Rates
For the selected seven disciplines, and based on our proposed analysis of the raw data of NSC-RC, we provide here estimated discipline-specific undergraduate progression rates for benchmarking purposes; in a similar manner that was followed for the discipline-specific retention rates. The number of undergraduate students in each discipline, their distribution by degree level, and the precise classification category title are the same as those mentioned earlier when presenting the discipline-specific retention rates; and thus are not repeated here.
Figure 11, Figure 12, Figure 13, Figure 14, Figure 15, Figure 16 and Figure 17 show the progression rates (with four time windows, from one year to four years) for the architecture, business/management, computer/information science, engineering, engineering technology, health, and law disciplines; respectively. The overall average first-year progression rates for these disciplines are 87.48%, 75.03%, 74.69%, 88.88%, 64.88%, 72.83%, and 70.14%; respectively. Relative to the overall average first-year progression rate of 75.22%, the engineering progression rate is the highest among the seven disciplines covered in this study, exceeding the overall progression rate by about twelve percentage points (12 pp); then comes the architecture progression rate with a small difference. The lowest (worst) discipline-specific progression rate among the examined seven disciplines is for engineering technology, lying more than ten percentage points (10 pp) below the overall average. These three relative positions of the progression rates match those observed earlier in the case of the discipline-specific retention rates.
4.5. General Full-Time Bachelor’s Degree Graduation Rates
After presenting the retention rates and the progression rates, we present our estimation for the benchmarking graduation rates. Figure 18 shows the 150% graduation rates (graduation over 150% of the nominal study period) for four consecutive cohorts (from Fall 2013-14 to Fall 2016-17), based on raw data from NCES, covering full-time bachelor’s degree study in 1,937 four-year higher education institutions. The graduation rate was consistently increasing in the first three cohorts, rising from 63.4% to 64.6%, which remained at the same level for the fourth cohort. The four-cohort average rate is 64.2%, and this is our suggested benchmarking graduation (or completion) rate.
4.6. Retention-Progression Correlation
The observed matching of the disciplines having extremum retention rates and progression rates stimulates further investigation of the correlation between the retention rates and progression rates for the seven disciplines covered here. Through Figure 19, we show that there is nearly a linear correlation between the two tracking rates (the figure is based on the rates with a one-year time window, without extrapolation); where we obtained the following reduced-order model, with the coefficient of determination (or R-squared) being 0.9856, and its adjusted R-squared value being 0.9827; and both values are favorably close to one, suggesting string linear dependence [166,167,168,169,170,171,172,173,174,175]:
RR(one year) = 0.9885 PR(one year) − 6.01%
Further statistical analysis (hypothesis testing) shows that this linear dependence is statistically significant, with a p-value of only 8.50×10⁻⁶, which is much less than the typical threshold significance level of 0.05 [176,177,178,179,180,181,182,183]. Furthermore, the 95% confidence interval for the regression coefficient (0.9885) is (0.8511-1.1259), and the 99% confidence interval for it is (0.7730-1.2040); and both intervals are relatively far from the trivial zero value; therefore, that the null hypothesis that retention rates are not dependent on the progression rates can be rejected.
It should be noted that the linear correlation obtained here is partly attributed to the inherent coupling mentioned earlier between the retention rate and progression rate, according to the way both are defined.
5. Discussion
In this section, we make five supplementary comments.
First, it should be noted that according to the defining expression in Equation (4) for the “within-institution/program” progression rate (), this progression rate is actually influenced by the retention rate, where cannot reach 100% if RR is below 100%. This feature mandates that should not be interpreted independently of RR, due to the coupling between them. A preferred expression for a scaled “within-institution/program” progression rate (′) that is magnified for properly becoming an efficiency-like figure normalized to lie exactly between 0 and 100% or 1.0 is [184,185,186,187,188,189,190,191]
Similarly, according to the defining expression in Equation (7) for the graduation rate (GR) or completion rate (CR), this graduation rate is actually influenced by the retention rate, where GR cannot reach 100% if RR is below 100%. This feature mandates that GR should not be interpreted independently of RR, due to the coupling between them. A preferred expression for a scaled graduation rate (GR′) or a scaled completion rate (CR′) that is magnified for properly becoming an efficiency figure (exactly bounded between 0% and 100% or 1.0) is
Second, all the students’ tracking rates analyzed in the current study (retention, progression, and graduation) are not affected by the grades of the students. While this might not be a problem for the retention rate and the graduation rate; it can be viewed as a shortcoming in the progression rate, because it does not allow distinguishing between students who advance toward graduation while maintaining higher grades and those also advancing at the same rate while receiving only the passing marks. Thus, an additional metric may be devised for monitoring this aspect, such as the portion of students with a cumulative grade point average (CGPA) above a set threshold. Alternatively, a performance-based “within-institution/program” progression rate (′′) may be introduced, rather than being merely based on passing courses regardless of the level of academic performance. Such a performance-based progression rate may be expressed as
Third, for programs that may have ambiguity in terms of their classification into one of the seven broad disciplines covered in this study, such as being possibly considered an “engineering” program but also possibly viewed as a “computer/information science” program; we propose that the official title of the program is used a criterion for the classification [192,193,194,195,196,197]. If the program title has the word “Engineering”, then our suggested engineering retention and progression benchmarking rates can be used for that program. This proposed method for resolving any classification conflict is aligned with the program eligibility requirement for accreditation by ABET (Accreditation Board for Engineering and Technology), where the word “engineering” in the program's name is necessary to be accredited according to the Engineering criteria of ABET, whereas the phrase “engineering technology” in the program's name is necessary to be accredited according to the Engineering Technology criteria of ABET [198,199,200,201,202,203]. For example, we prefer that a “Computer Engineering” undergraduate program utilizes our suggested benchmarking rates for the (engineering) discipline, whereas we prefer that a “Computer Science” program utilizes our suggested benchmarking rates for the (computer/information science) discipline. Similarly, we prefer that an “Architectural Engineering” undergraduate program utilizes our suggested benchmarking rates for the (engineering) discipline, whereas we prefer that an “Interior Architecture” program utilizes our suggested benchmarking rates for the (architecture) discipline.
Fourth, the way how the raw progression (persistence) rates were obtained explains why the progression rate here is always larger than the retention rate for the same discipline; because each retained student is automatically progressing (persistent), while not each progressing (persistent) student is necessarily retained. If these raw progression (persistence) rates were obtained based on the study advancement within the same institution or program, then the progression rate is always less than or equal to the retention rate; because each progressing (persistent) student is automatically retained in this case, while not each retained student is necessarily progressing (persistent).
Fifth, by summarizing some of the previously listed discipline-specific characteristics of the seven disciplines covered here, some insights can be made regarding how these disciplines compare to each other. Such a summary is given in Table 2. In terms of the number of students, the business/management discipline is the largest while the law discipline is the smallest. In terms of the potion of students studying for a bachelor’s degree, the engineering discipline is the largest (and closely comes the architecture discipline after it). In terms of the portion of students studying for a diploma degree (associate degree), engineering technology is the largest (and then comes the law discipline).
6. Conclusions
In the current empirical study, various benchmarking rates for tracking the performance of undergraduate students and their academic programs or higher education institutions were developed under different settings, such that a wide range of institutions and programs select and adopt rates that suit their own condition, with less chance of wrong decision and interpretation due to setting a benchmarking target that belongs to an irrelevant education structure. In addition to the general rates, seven broad disciplines were selected for obtaining additional discipline-specific rates, which are architecture, business/management, computer/information science, engineering, engineering technology, health/clinical, and law. Although the data are US-based, their large size makes them representative of a wide spectrum of students and institutions. The following findings can be stated:
- Overall, the recommended benchmarking first-year retention rate for bachelor’s degree students is 76%.
- Overall, the recommended benchmarking first-year progression rate for undergraduate students admitted directly to the degree program is 75%.
- Overall, the recommended benchmarking graduation rate for bachelor’s degree students within 150% of the nominal study period is 64%.
- Among the seven disciplines examined here, engineering and architecture have similarly high retention rates, progression rates, as well as portions of bachelor’s degree students (as compared to diploma/associate degree students).
- Among the seven disciplines examined here, engineering technology has the lowest retention rates, progression rates, as well as the portion of bachelor’s degree students (as compared to diploma/associate degree students).
- The progression (or persistence) rate is more ambiguous compared to the retention rate and the graduation rate, with multiple definitions existing in the literature for it. Thus, one should be more cautious when dealing with reported progression (persistence) rates. The other two rates can also be defined differently by different sources, but their overall purpose seems to be less scattered.
Supplementary Material or Data Availability Statement
The data presented in this study were derived from the resources available in the public domain, as described in the relevant references.
Declaration of Competing Interests Statement
The author declares that they have no known competing financial interests or personal relationships that could have appeared to influence the work reported in this paper.
Funding
Not applicable (this research received no funding).
References
- [Oman Authority for Academic Accreditation and Quality Assurance of Education] OAAAQA, Oman Qualifications Framework (OQF) Document, Version 3, Muscat, Sultanate of Oman, 2023. https://oaaaqa.gov.om/getattachment/5b4dda1a-c892-48bc-afb9-7b39d1d8611f/OQF%20Document.aspx (accessed October 8, 2024).
- L. Wheelahan, From old to new: the Australian qualifications framework, Journal of Education and Work 24 (2011) 323–342. [CrossRef]
- M. Young, Qualifications Frameworks: some conceptual issues, European Journal of Education 42 (2007) 445–457. [CrossRef]
- M.F.D. Young, National Qualifications Frameworks as a Global Phenomenon: A comparative perspective, Journal of Education and Work (2003). [CrossRef]
- E. Davenport, B. Cronin, Knowledge management, performance metrics, and higher education: Does it all compute?, New Review of Academic Librarianship (2001). [CrossRef]
- D. Palfreyman, Markets, models and metrics in higher education, Perspectives: Policy and Practice in Higher Education 11 (2007) 78–87. [CrossRef]
- O.A. Marzouk, Benchmarks for the Omani higher education students-faculty ratio (SFR) based on World Bank data, QS rankings, and THE rankings, Cogent Education 11 (2024) 2317117. [CrossRef]
- C. Spence, ‘Judgement’ versus ‘metrics’ in higher education management, High Educ 77 (2019) 761–775. [CrossRef]
- A. Gunn, Metrics and methodologies for measuring teaching quality in higher education: developing the Teaching Excellence Framework (TEF), Educational Review 70 (2018) 129–148. [CrossRef]
- I.J. Pettersen, From Metrics to Knowledge? Quality Assessment in Higher Education, Financial Accountability & Management 31 (2015) 23–40. [CrossRef]
- J. Wilsdon, Responsible metrics, in: Higher Education Strategy and Planning, Routledge, 2017.
- P. Andras, Research: metrics, quality, and management implications, Research Evaluation 20 (2011) 90–106. [CrossRef]
- W.E. Donald, Merit beyond metrics: Redefining the value of higher education, Industry and Higher Education (2024) 09504222241264506. [CrossRef]
- O.A. Marzouk, The Sod gasdynamics problem as a tool for benchmarking face flux construction in the finite volume method, Scientific African 10 (2020) e00573. [CrossRef]
- A.M. Langan, W.E. Harris, National student survey metrics: where is the room for improvement?, High Educ 78 (2019) 1075–1089. [CrossRef]
- G. Haddow, B. Hammarfelt, Quality, impact, and quantification: Indicators and metrics use by social scientists, Journal of the Association for Information Science and Technology 70 (2019) 16–26. [CrossRef]
- J.-A. Baird, V. Elliott, Metrics in education—control and corruption, Oxford Review of Education 44 (2018) 533–544. [CrossRef]
- O.A. Marzouk, W.A.M.H.R. Jul, A.M.K.A. Jabri, H.A.M.A. Al-ghaithi, Construction of a Small-Scale Vacuum Generation System and Using It as an Educational Device to Demonstrate Features of the Vacuum, International Journal of Contemporary Education 1 (2018) 1–11. [CrossRef]
- R. Chugh, D. Turnbull, M.A. Cowling, R. Vanderburg, M.A. Vanderburg, Implementing educational technology in Higher Education Institutions: A review of technologies, stakeholder perceptions, frameworks and metrics, Educ Inf Technol 28 (2023) 16403–16429. [CrossRef]
- R. Clemons, M. Jance, Defining Quality in Higher Education and Identifying Opportunities for Improvement, Sage Open 14 (2024) 21582440241271155. [CrossRef]
- P. Chaudhary, R.K. Singh, Quality of teaching & learning in higher education: a bibliometric review & future research agenda, On the Horizon: The International Journal of Learning Futures ahead-of-print (2024). [CrossRef]
- K. Khairiah, Digitalization, Webometrics, and Its Impact on Higher Education Quality During the COVID-19 Pandemic, Esiculture (2024) 802–815. [CrossRef]
- O.A. Marzouk, Globalization and diversity requirement in higher education, in: WMSCI 2007 / ISAS 2007, International Institute of Informatics and Systemics (IIIS), Orlando, Florida, USA, 2007: pp. 101–106.
- A.M. Dima, R. Argatu, M. Rădoi, Performance Evaluation in Higher Education – A Comparative Approach, Proceedings of the International Conference on Business Excellence 18 (2024) 2453–2471. [CrossRef]
- M.J.B. Ludvik, M.J.B. Ludvik, Outcomes-Based Program Review: Closing Achievement Gaps In- and Outside the Classroom With Alignment to Predictive Analytics and Performance Metrics, 2nd ed., Routledge, New York, 2023. [CrossRef]
- R. Herrera-Limones, J. Rey-Pérez, M. Hernández-Valencia, J. Roa-Fernández, Student Competitions as a Learning Method with a Sustainable Focus in Higher Education: The University of Seville “Aura Projects” in the “Solar Decathlon 2019,” Sustainability 12 (2020) 1634. [CrossRef]
- P.C. Wankat, Undergraduate Student Competitions, Journal of Engineering Education 94 (2005) 343–347. [CrossRef]
- M. Gadola, D. Chindamo, Experiential learning in engineering education: The role of student design competitions and a case study, International Journal of Mechanical Engineering Education 47 (2019) 3–22. [CrossRef]
- G. Nabi, F. Liñán, A. Fayolle, N. Krueger, A. Walmsley, The Impact of Entrepreneurship Education in Higher Education: A Systematic Review and Research Agenda, AMLE 16 (2017) 277–299. [CrossRef]
- O.A. Marzouk, Zero Carbon Ready Metrics for a Single-Family Home in the Sultanate of Oman Based on EDGE Certification System for Green Buildings, Sustainability 15 (2023) 13856. [CrossRef]
- R.T. Syed, D. Singh, D. Spicer, Entrepreneurial higher education institutions: Development of the research and future directions, Higher Education Quarterly 77 (2023) 158–183. [CrossRef]
- C. Sam, P. van der Sijde, Understanding the concept of the entrepreneurial university from the perspective of higher education models, High Educ 68 (2014) 891–908. [CrossRef]
- Y. Hunter-Johnson, B. Farquharson, R. Edgecombe, J. Munnings, N. Bandelier, N. Swann, F. Butler, T. McDonald, N. Newton, L. McDiarmid, Design and Development of Virtual Teaching Practicum Models: Embracing Change During COVID 19, International Journal of Multidisciplinary Perspectives in Higher Education 8 (2023) 1–29. [CrossRef]
- O.A. Marzouk, Urban air mobility and flying cars: Overview, examples, prospects, drawbacks, and solutions, Open Engineering 12 (2022) 662–679. [CrossRef]
- C.N. Lippard, C.D. Vallotton, M. Fusaro, R. Chazan-Cohen, C.A. Peterson, L. Kim, G.A. Cook, Practice matters: how practicum experiences change student beliefs, Journal of Early Childhood Teacher Education 45 (2024) 371–395. [CrossRef]
- B. Rivza, U. Teichler, The Changing Role of Student Mobility, High Educ Policy 20 (2007) 457–475. [CrossRef]
- T. Kim, Transnational academic mobility, internationalization and interculturality in higher education, Intercultural Education 20 (2009) 395–405. [CrossRef]
- O.A. Marzouk, Expectations for the Role of Hydrogen and Its Derivatives in Different Sectors through Analysis of the Four Energy Scenarios: IEA-STEPS, IEA-NZE, IRENA-PES, and IRENA-1.5°C, Energies 17 (2024) 646. [CrossRef]
- C. Holdsworth, ‘Going Away to Uni’: Mobility, Modernity, and Independence of English Higher Education students, Environ Plan A 41 (2009) 1849–1864. [CrossRef]
- U. Teichler, Internationalisation Trends in Higher Education and the Changing Role of International Student Mobility, Journal of International Mobility 5 (2017) 177–216. [CrossRef]
- H. Hottenrott, C. Lawson, What is behind multiple institutional affiliations in academia?, Science and Public Policy 49 (2022) 382–402. [CrossRef]
- H. Hottenrott, M.E. Rose, C. Lawson, The rise of multiple institutional affiliations in academia, Journal of the Association for Information Science and Technology 72 (2021) 1039–1058. [CrossRef]
- O.A. Marzouk, Compilation of Smart Cities Attributes and Quantitative Identification of Mismatch in Rankings, Journal of Engineering 2022 (2022) 1–13. [CrossRef]
- A. Bernasconi, Does the Affiliation of Universities to External Organizations Foster Diversity in Private Higher Education? Chile in Comparative Perspective, High Educ 52 (2006) 303–342. [CrossRef]
- M. Kosior-Kazberuk, W. Pawlowski, The Role of Student Initiatives in the Process of Improving the Quality of Higher Education, in: Seville, Spain, 2019: pp. 3432–3440. [CrossRef]
- A. Innab, M.M. Almotairy, N. Alqahtani, A. Nahari, R. Alghamdi, H. Moafa, D. Alshael, The impact of comprehensive licensure review on nursing students’ clinical competence, self-efficacy, and work readiness, Heliyon 10 (2024). [CrossRef]
- D.M. Salvioni, S. Franzoni, R. Cassano, Sustainability in the Higher Education System: An Opportunity to Improve Quality and Image, Sustainability 9 (2017) 914. [CrossRef]
- Žalėnienė, P. Pereira, Higher Education For Sustainability: A Global Perspective, Geography and Sustainability 2 (2021) 99–106. [CrossRef]
- O.A. Marzouk, One-way and two-way couplings of CFD and structural models and application to the wake-body interaction, Applied Mathematical Modelling 35 (2011) 1036–1053. [CrossRef]
- D.T. Jefferys, S. Hodges, M.S. Trueman, A Strategy for Success on the National Council Licensure Examination for At-Risk Nursing Students in Historically Black Colleges and Universities: A Pilot Study, International Journal of Caring Sciences 10 (2017) 1705–1709.
- M. Millea, R. Wills, A. Elder, D. Molina, What Matters in College Student Success? Determinants of College Retention and Graduation Rates, Education 138 (2018) 309–322.
- M. Dagley, M. Georgiopoulos, A. Reece, C. Young, Increasing Retention and Graduation Rates Through a STEM Learning Community, Journal of College Student Retention: Research, Theory & Practice 18 (2016) 167–182. [CrossRef]
- M.R. Jeffreys, Tracking students through program entry, progression, graduation, and licensure: Assessing undergraduate nursing student retention and success, Nurse Education Today 27 (2007) 406–419. [CrossRef]
- S. Robertson, C.W. Canary, M. Orr, P. Herberg, D.N. Rutledge, Factors Related to Progression and Graduation Rates for RN-to-Bachelor of Science in Nursing Programs: Searching for Realistic Benchmarks, Journal of Professional Nursing 26 (2010) 99–107. [CrossRef]
- T.I. Poirier, T.M. Kerr, S.J. Phelps, Academic Progression and Retention Policies of Colleges and Schools of Pharmacy, American Journal of Pharmaceutical Education 77 (2013) 25. [CrossRef]
- [Oman Authority for Academic Accreditation and Quality Assurance of Education] OAAAQA, Programme Standards Assessment Manual (PSAM) - Programme Accreditation, Version 1, Muscat, Sultanate of Oman, 2023. https://oaaaqa.gov.om/getattachment/4359b83e-5ab9-4147-8e73-1ff0f9adcfae/Programme%20Standards%20Assessment%20Manual.aspx (accessed October 8, 2024).
- [Oman Authority for Academic Accreditation and Quality Assurance of Education] OAAAQA, Institutional Standards Assessment Manual (ISAM) - Institutional Accreditation: Stage 2, Version 1, Muscat, Sultanate of Oman, 2016. https://oaaaqa.gov.om/getattachment/c63fde93-150b-430d-a58f-9f68e6dc2390/Institutional%20Standards%20Assessment%20Manual.aspx (accessed October 8, 2024).
- S.A. Barbera, S.D. Berkshire, C.B. Boronat, M.H. Kennedy, Review of Undergraduate Student Retention and Graduation Since 2010: Patterns, Predictions, and Recommendations for 2020, Journal of College Student Retention: Research, Theory & Practice 22 (2020) 227–250. [CrossRef]
- J. Salmi, A. D’Addio, Policies for achieving inclusion in higher education, Policy Reviews in Higher Education 5 (2021) 47–72. [CrossRef]
- J.M. Ortiz-Lozano, A. Rua-Vieites, P. Bilbao-Calabuig, M. Casadesús-Fa, University student retention: Best time and data to identify undergraduate students at risk of dropout, Innovations in Education and Teaching International 57 (2020) 74–85. [CrossRef]
- C.A. Palacios, J.A. Reyes-Suárez, L.A. Bearzotti, V. Leiva, C. Marchant, Knowledge Discovery for Higher Education Student Retention Based on Data Mining: Machine Learning Algorithms and Case Study in Chile, Entropy 23 (2021) 485. [CrossRef]
- M. Tight, Student retention and engagement in higher education, Journal of Further and Higher Education 44 (2020) 689–704. [CrossRef]
- A.W. Astin, How “Good” is Your Institution’s Retention Rate?, Research in Higher Education 38 (1997) 647–658. [CrossRef]
- E. Tatem, J.L. Payne, The impact of a College of Nursing Retention Program on the graduation rates of nursing students, ABNF J 11 (2000) 59–63.
- M. Kanoğlu, Y.A. Çengel, I. DinCer, Efficiency Evaluation of Energy Systems, Springer Science & Business Media, 2012.
- O.A. Marzouk, Subcritical and supercritical Rankine steam cycles, under elevated temperatures up to 900°C and absolute pressures up to 400 bara, Advances in Mechanical Engineering 16 (2024) 1–18. [CrossRef]
- I. Dincer, M. Temiz, Integrated Energy Systems, in: I. Dincer, M. Temiz (Eds.), Renewable Energy Options for Power Generation and Desalination, Springer International Publishing, Cham, 2024: pp. 319–361. [CrossRef]
- O.A. Marzouk, Performance analysis of shell-and-tube dehydrogenation module: Dehydrogenation module, Int. J. Energy Res. 41 (2017) 604–610. [CrossRef]
- F.O. Ifeanyieze, K.R. Ede, E.C. Isiwu, Effect of Career Counseling on Students’ Interest, Academic Performance and Retention Rate in Agricultural Education Programme in Universities in South East Nigeria, Interdisciplinary Journal of Educational Practice (IJEP) 10 (2023) 64–77. [CrossRef]
- O.A. Marzouk, Land-Use competitiveness of photovoltaic and concentrated solar power technologies near the Tropic of Cancer, Solar Energy 243 (2022) 103–119. [CrossRef]
- T. Bruckner, I.A. Bashmakov, Y. Mulugetta, H. Chum, A. De la Vega Navarro, J. Edmonds, A. Faaij, B. Fungtammasan, A. Garg, E. Hertwich, D. Honnery, D. Infield, M. Kainuma, S. Khennas, S. Kim, H.B. Nimir, K. Riahi, N. Strachan, R. Wiser, X. Zhang, Chapter 7 - Energy systems, in: Cambridge University Press, 2014. http://www.ipcc.ch/pdf/assessment-report/ar5/wg3/ipcc_wg3_ar5_chapter7.pdf (accessed October 8, 2024).
- O.A. Marzouk, Tilt sensitivity for a scalable one-hectare photovoltaic power plant composed of parallel racks in Muscat, Cogent Engineering 9 (2022) 2029243. [CrossRef]
- A.E.M. van den Oever, D. Costa, G. Cardellini, M. Messagie, Systematic review on the energy conversion efficiency of biomass-based Fischer-Tropsch plants, Fuel 324 (2022) 124478. [CrossRef]
- O.A. Marzouk, Lookup Tables for Power Generation Performance of Photovoltaic Systems Covering 40 Geographic Locations (Wilayats) in the Sultanate of Oman, with and without Solar Tracking, and General Perspectives about Solar Irradiation, Sustainability 13 (2021) 13209. [CrossRef]
- J. Peckham, P. Stephenson, J.-Y. Hervé, R. Hutt, M. Encarnação, Increasing student retention in computer science through research programs for undergraduates, in: Proceedings of the 38th SIGCSE Technical Symposium on Computer Science Education, Association for Computing Machinery, New York, NY, USA, 2007: pp. 124–128. [CrossRef]
- O.A. Marzouk, A.H. Nayfeh, Characterization of the flow over a cylinder moving harmonically in the cross-flow direction, International Journal of Non-Linear Mechanics 45 (2010) 821–833. [CrossRef]
- M.K. Burns, Test-retest reliability of individual student acquisition and retention rates as measured by instructional assessment, Doctor of Philosophy, School of Education, Andrews University, 1999.
- O.A. Marzouk, Characteristics of the Flow-Induced Vibration and Forces With 1- and 2-DOF Vibrations and Limiting Solid-to-Fluid Density Ratios, Journal of Vibration and Acoustics 132 (2010) 041013. [CrossRef]
- H. Chen, M. Yang, Investigation of the key factors that influence high-achieving students’ enrolment and retention rate into a small honours programme and their satisfaction level towards the programme, Perspectives: Policy and Practice in Higher Education 28 (2024) 46–54. [CrossRef]
- O.A. Marzouk, Energy Generation Intensity (EGI) of Solar Updraft Tower (SUT) Power Plants Relative to CSP Plants and PV Power Plants Using the New Energy Simulator “Aladdin,” Energies 17 (2024) 405. [CrossRef]
- D. Singh, B. Singh, Investigating the impact of data normalization on classification performance, Applied Soft Computing 97 (2020) 105524. [CrossRef]
- D. Delen, Predicting Student Attrition with Data Mining Methods, Journal of College Student Retention: Research, Theory & Practice 13 (2011) 17–35. [CrossRef]
- G.G. Smith, D. Ferguson, Student attrition in mathematics e-learning, Australasian Journal of Educational Technology 21 (2005). [CrossRef]
- C. Beer, C. Lawson, The problem of student attrition in higher education: An alternative perspective, Journal of Further and Higher Education 41 (2017) 773–784. [CrossRef]
- R.C. Harris, L. Rosenberg, O.M.E. Grace, Addressing the Challenges of Nursing Student Attrition, Journal of Nursing Education 53 (2014) 31–37. [CrossRef]
- L. Grebennikov, M. Shah, Investigating attrition trendsin order to improvestudent retention, Quality Assurance in Education 20 (2012) 223–236. [CrossRef]
- S. Stewart, D.H. Lim, J. Kim, Factors Influencing College Persistence for First-Time Students, Journal of Developmental Education 38 (2015) 12–20.
- S.E. Childs, R. Finnie, F. Martinello, Postsecondary Student Persistence and Pathways: Evidence From the YITS-A in Canada, Res High Educ 58 (2017) 270–294. [CrossRef]
- J.C. Somers Patricia, Within-Year Persistence of Students at Two-Year Colleges, Community College Journal of Research and Practice 24 (2000) 785–807. [CrossRef]
- J. Su, M.L. Waugh, Online Student Persistence or Attrition: Observations Related to Expectations, Preferences, and Outcomes, Journal of Interactive Online Learning 16 (2018) 63–79.
- Newlane University, How We Calculate Progress, Rentention, and Completion Rates, (2024). https://newlane.edu/how-we-calculate-progress-rentention-and-completion-rates (accessed September 28, 2024).
- J. Burrus, D. Elliott, M. Brenneman, R. Markle, L. Carney, G. Moore, A. Betancourt, T. Jackson, S. Robbins, P. Kyllonen, R.D. Roberts, Putting and Keeping Students on Track: Toward a Comprehensive Model of College Persistence and Goal Attainment, ETS Research Report Series 2013 (2013) i–61. [CrossRef]
- S. Prakash, D.K. Saini, L. Suni, Factors influencing Progression Rate in Higher Education in Oman - Data Engineering and Statistical Approach, in: Proceedings of the World Congress on Engineering 2013, IAENG [International Association of Engineers], London, UK, 2013: pp. 1–6. https://www.iaeng.org/publication/WCE2013/WCE2013_pp299-304.pdf (accessed October 15, 2024).
- [Irish Higher Education Authority] HEA, Non Progression and Completion Dashboard, (n.d.). https://hea.ie/statistics/data-for-download-and-visualisations/students/progression/non-progression-and-completion-dashboard (accessed September 27, 2024).
- [Rock Valley College - Office of Institutional Research and Effectiveness] RVC-OIRE, Persistence and Retention Rates, Rock Valley College, Rockford, Illinois, USA, 2023. https://rockvalleycollege.edu/_resources/files/institutional-research/reports/BoT-Persistence-Retention-Jan-2023.pdf (accessed October 15, 2024).
- L.N. Williams, Grit and Academic Performance of First- and Second-Year Students Majoring in Education, Doctor of Philosophy, Curriculum and Instruction with an emphasis in Higher Education Administration, University of South Florida, n.d. https://www.proquest.com/openview/bc1ff37842b340f8c4b0efc4eaa07ff1/1?pq-origsite=gscholar&cbl=18750 (accessed October 15, 2024).
- E.J. Gosman, B.A. Dandridge, M.T. Nettles, A.R. Thoeny, Predicting student progression: The influence of race and other student and institutional characteristics on college student performance, Res High Educ 18 (1983) 209–236. [CrossRef]
- X. Hu, X. Zhang, S. McGeown, Foreign language anxiety and achievement: A study of primary school students learning English in China, Language Teaching Research (2021). [CrossRef]
- R.C.P. Silveira, M.L.C.C. Robazzi, Impacts of work in children’s and adolescents school performance: a reality report, Injury Prevention 16 (2010) A150–A150. [CrossRef]
- K.M. Lewin, Access to education in sub-Saharan Africa: patterns, problems and possibilities, Comparative Education 45 (2009) 151–174. [CrossRef]
- I. Coxhead, N.D.T. Vuong, P. Nguyen, Getting to Grade 10 in Vietnam: does an employment boom discourage schooling?, Education Economics 31 (2023) 353–375. [CrossRef]
- J. Smith, S. Paquin, J. St-Amand, C. Singh, D. Moreau, J. Bergeron, M. Leroux, A remediation measure as an alternative to grade retention: A study on achievement motivation, Psychology in the Schools 59 (2022) 1209–1221. [CrossRef]
- [University of Sharjah] UoSh, Retention and Graduation Rates (College of Communication) │ UoSh, [University of Sharjah, Sharjah, UAE, 2023. https://www.sharjah.ac.ae/en/academics/Colleges/Communication/Documents/Retention_Graduation_Rates_2023.pdf (accessed October 16, 2024).
- [New York University Abu Dhabi] NYUAD, Facts and Figures (Retention and Graduation Rates) │ NYUAD, New York University Abu Dhabi (n.d.). https://nyuad.nyu.edu/en/about/facts-and-figures.html (accessed October 16, 2024).
- [Zayed University] ZU, Graduation & Retention Rates │ ZU, (2024). https://www.zu.ac.ae/main/en/colleges/colleges/__college_of_comm_media_sciences/accreditation/graduation-and-retention-rates (accessed October 16, 2024).
- [United States National Center for Education Statistics] NCES, College Navigator │ NCES - California Institute of Technology, (2024). https://nces.ed.gov/collegenavigator/?q=california+institute&s=all&id=110404 (accessed October 8, 2024).
- O.A. Marzouk, Temperature-Dependent Functions of the Electron–Neutral Momentum Transfer Collision Cross Sections of Selected Combustion Plasma Species, Applied Sciences 13 (2023) 11282. [CrossRef]
- B. Miller, More Is Less: Extra Time Does Little to Boost College Grad Rates, Education Secto, 2010. https://www.air.org/sites/default/files/publications/EDS006%20CYCT-MoreIsLess_RELEASE.pdf (accessed October 9, 2024).
- T. Bailey, J.C. Calcagno, D. Jenkins, T. Leinbach, G. Kienzl, IS STUDENT-RIGHT-TO-KNOW ALL YOU SHOULD KNOW? An Analysis of Community College Graduation Rates, Res High Educ 47 (2006) 491–519. [CrossRef]
- O.A. Marzouk, Estimated electric conductivities of thermal plasma for air-fuel combustion and oxy-fuel combustion with potassium or cesium seeding, Heliyon 10 (2024) e31697. [CrossRef]
- S. Boumi, A.E. Vela, Improving Graduation Rate Estimates Using Regularly Updating Multi-Level Absorbing Markov Chains, Education Sciences 10 (2020) 377. [CrossRef]
- R. Larocca, D. Carr, The Effect of Higher Education Performance Funding on Graduation Rates, Journal of Education Finance 45 (2020) 493–526.
- O.A. Marzouk, Radiant Heat Transfer in Nitrogen-Free Combustion Environments, International Journal of Nonlinear Sciences and Numerical Simulation 19 (2018) 175–188. [CrossRef]
- B.B. Gresham, M. Thompson, K. Luedtke-Hoffmann, M. Tietze, Institutional and Program Factors Predict Physical Therapist Assistant Program Graduation Rate and Licensure Examination Pass Rate, Journal of Physical Therapy Education 29 (2015) 27.
- L.E.C. Delnoij, K.J.H. Dirkx, J.P.W. Janssen, R.L. Martens, Predicting and resolving non-completion in higher (online) education – A literature review, Educational Research Review 29 (2020) 100313. [CrossRef]
- [Oman Authority for Academic Accreditation and Quality Assurance of Education] OAAAQA, Requirements for Oman’s System of Quality Assurance (ROSQA), Muscat, Sultanate of Oman, 2013. https://oaaaqa.gov.om/getattachment/66516266-7fe6-43bd-8fd0-8b0e38b83441/ROSQA%20-%20Requirements%20for%20Oman%60s%20System%20of%20Quality%20Assurance.aspx (accessed October 25, 2018).
- M.L. Skolnik, Higher Vocational Education in Canada: The Continuing Predominance of Two-Year Diploma Programmes, in: E. Knight, A.-M. Bathmaker, G. Moodie, K. Orr, S. Webb, L. Wheelahan (Eds.), Equity and Access to High Skills through Higher Vocational Education, Springer International Publishing, Cham, 2022: pp. 103–124. [CrossRef]
- M. Skolnik, The Origin and Evolution of an Anomalous Academic Credential: The Ontario College Advanced Diploma, Canadian Journal of Higher Education 53 (2023) 1–15. [CrossRef]
- J. Wood, Institutes and Colleges of Advanced Education, Australian Journal of Education 13 (1969) 257–269. [CrossRef]
- S. Nasser, Current status, challenges, and future career pathways of diploma-prepared nurses from the stakeholders’ perspective: a qualitative study, BMC Nurs 23 (2024) 542. [CrossRef]
- L.M. Blair, M.G. Finn, W. Stevenson, The Returns to the Associate Degree for Technicians, The Journal of Human Resources 16 (1981) 449–458. [CrossRef]
- S. Hussain, F.U. Zaman, S. Muhammad, A. Hafeez, Analysis of the Initiatives taken by HEC to Implement Associate Degree Program: Opportunities and Challenges, International Research Journal of Management and Social Sciences 4 (2023) 193–210.
- E. Mahaffey, The Relevance of Associate Degree Nursing Education: Past, Present, Future, Online J Issues Nurs 7 (2002). [CrossRef]
- [United States National Center for Education Statistics] NCES, Trend Generator - Graduation rate within 150% of normal time at 4-year postsecondary institutions, (2024). https://nces.ed.gov/ipeds/TrendGenerator/app/answer/7/19 (accessed September 28, 2024).
- A.D. Young-Jones, T.D. Burt, S. Dixon, M.J. Hawthorne, Academic advising: does it really impact student success?, Quality Assurance in Education 21 (2013) 7–19. [CrossRef]
- V.N. Gordon, W.R. Habley, T.J. Grites, Academic Advising: A Comprehensive Handbook, John Wiley & Sons, 2011.
- S. Hoidn, M. Klemenčič, eds., The Routledge International Handbook of Student-Centered Learning and Teaching in Higher Education, Routledge, London, 2020. [CrossRef]
- K.H.D. Tang, Student-centered Approach in Teaching and Learning: What Does It Really Mean?, Acta Pedagogia Asia 2 (2023) 72–83. [CrossRef]
- S.B. Merriam, G. Ntseane, Transformational Learning in Botswana: How Culture Shapes the Process, Adult Education Quarterly 58 (2008) 183–197. [CrossRef]
- S. Choy, Transformational Learning in the Workplace, Journal of Transformative Education 7 (2009) 65–84. [CrossRef]
- M.C. Clark, Transformational learning, New Directions for Adult and Continuing Education 1993 (1993) 47–56. [CrossRef]
- F. Boyle, J. Kwon, C. Ross, O. Simpson, Student–student mentoring for retention and engagement in distance education, Open Learning: The Journal of Open, Distance and e-Learning 25 (2010) 115–130. [CrossRef]
- A. Gunter, G. Polidori, STEM Graduation Trends and Educational Reforms: Analyzing Factors and Enhancing Support, American Journal of STEM Education 1 (2024). https://ojed.org/STEM/article/view/7026 (accessed October 10, 2024).
- B. Tesfamariam, C. Alamo-Pastrana, E.H. Bradley, Four-Year College Completion Rates: What Accounts for the Variation?, Journal of Education 204 (2024) 527–535. [CrossRef]
- M.L. Breyfogle, K.A. Daubman, Increasing Undergraduate Student Retention with “Psychology of Success”: A Course for First-Year Students on Academic Warning, Student Success 15 (2024) 86–91. [CrossRef]
- J. Gu, X. Li, L. Wang, Undergraduate Education, in: J. Gu, X. Li, L. Wang (Eds.), Higher Education in China, Springer, Singapore, 2018: pp. 117–144. [CrossRef]
- D.P.K. Tripathi, Attitude Of Under- Graduate Students Towards Choice Based Credit System (Cbcs) In Relation To Their Academic Achievements- A Case Study., Journal of Survey in Fisheries Sciences (2021) 153–158. [CrossRef]
- T. Hotta, The Development of “Asian Academic Credits” as an Aligned Credit Transfer System in Asian Higher Education, Journal of Studies in International Education 24 (2020) 167–189. [CrossRef]
- T.C. Mason, R.F. Arnove, M. Sutton, Credits, curriculum, and control in higher education: Cross-national perspectives, Higher Education 42 (2001) 107–137. [CrossRef]
- K. Thomas Baby, Integrating Content-Based Instruction in a Foundation Program for Omani Nursing Students, in: R. Al-Mahrooqi, C. Denman (Eds.), English Education in Oman: Current Scenarios and Future Trajectories, Springer, Singapore, 2018: pp. 247–257. [CrossRef]
- E. Davison, R. Sanderson, T. Hobson, J. Hopkins, Skills for Success? Supporting transition into higher education for students from diverse backgrounds., Widening Participation and Lifelong Learning 24 (2022) 165–186. [CrossRef]
- R. Khalil, A Re-evaluation of Academics’ Expectations of Preparatory Year Egyptian Students: A Reconstructed Understanding, The International Journal of Interdisciplinary Educational Studies 7 (2013) 55–72. [CrossRef]
- H.B. Khoshaim, A.B. Khoshaim, T. Ali, Preparatory Year: The Filter for Mathematically Intensive Programs, International Interdisciplinary Journal of Education 7 (2018) 127–136. [CrossRef]
- [United States National Center for Education Statistics] NCES, About Us │ NCES, (2024). https://nces.ed.gov/about (accessed October 12, 2024).
- [United States National Center for Education Statistics] NCES, History │ NCES, (2024). https://nces.ed.gov/about/?sec=nceshistory (accessed October 12, 2024).
- [United States Institute of Education Sciences] IES, About Us │ IES, (2024). https://ies.ed.gov/aboutus (accessed October 12, 2024).
- C.S. Chhin, K.A. Taylor, W.S. Wei, Supporting a Culture of Replication: An Examination of Education and Special Education Research Grants Funded by the Institute of Education Sciences, Educational Researcher 47 (2018) 594–605. [CrossRef]
- [United States National Center for Education Statistics] NCES, IPEDS (Integrated Postsecondary Education Data System) - Use The Data, (2024). https://nces.ed.gov/ipeds/use-the-data (accessed September 28, 2024).
- [United States National Center for Education Statistics] NCES, IPEDS (Integrated Postsecondary Education Data System) - Glossary, (2024). https://surveys.nces.ed.gov/ipeds/public/glossary (accessed September 28, 2024).
- C. Zong, A. Davis, Modeling University Retention and Graduation Rates Using IPEDS, Journal of College Student Retention: Research, Theory & Practice 26 (2024) 311–333. [CrossRef]
- [United States National Center for Education Statistics] NCES, IPEDS (Integrated Postsecondary Education Data System) - Trend Generator User Guide, Institute of Education Sciences (IES) at the U.S. Department of Education, Washington, DC, USA, 2018. https://nces.ed.gov/ipeds/TrendGenerator/Sources/IPEDS_Trend_Generator_User_Guide.pdf (accessed September 28, 2024).
- [United States National Center for Education Statistics] NCES, College Navigator │ NCES, (2024). https://nces.ed.gov/collegenavigator (accessed September 28, 2024).
- [National Student Clearinghouse Research Center] NSC-RC, About Us │ NSC-RC, (2024). https://nscresearchcenter.org/aboutus (accessed September 28, 2024).
- [National Student Clearinghouse Research Center] NSC-RC, Publications │ NSC-RC, (2024). https://nscresearchcenter.org/publications (accessed September 28, 2024).
- [United States National Center for Education Statistics] NCES, Trend Generator - Full-time retention rate in postsecondary institutions, (2024). https://nces.ed.gov/ipeds/trendgenerator/app/answer/7/32 (accessed September 28, 2024).
- [United States National Center for Education Statistics] NCES, Trend Generator - Graduation rate within 150% of normal time for bachelor’s or equivalent degree-seeking undergraduate students who received a bachelor’s or equivalent degree at 4-year postsecondary institutions, (2024). https://nces.ed.gov/ipeds/trendgenerator/app/answer/7/20 (accessed October 4, 2024).
- [National Student Clearinghouse Research Center] NSC-RC, Persistence and Retention: Fall 2022 Beginning Postecondary Student Cohort, 2024. https://nscresearchcenter.org/wp-content/uploads/PersistenceandRetention2024_Appendix.xlsx.
- S.J. Daniel, Education and the COVID-19 pandemic, Prospects 49 (2020) 91–96. [CrossRef]
- S. Pokhrel, R. Chhetri, A Literature Review on Impact of COVID-19 Pandemic on Teaching and Learning, Higher Education for the Future 8 (2021) 133–141. [CrossRef]
- M. Ciotti, M. Ciccozzi, A. Terrinoni, W.-C. Jiang, C.-B. Wang, S. Bernardini, The COVID-19 pandemic, Critical Reviews in Clinical Laboratory Sciences 57 (2020) 365–388. [CrossRef]
- C.H. Liu, S. Pinder-Amaker, H. “Chris” Hahm, J.A. Chen, Priorities for addressing the impact of the COVID-19 pandemic on college student mental health, Journal of American College Health 70 (2022) 1356–1358. [CrossRef]
- A.M. Lederer, M.T. Hoban, S.K. Lipson, S. Zhou, D. Eisenberg, More Than Inconvenienced: The Unique Needs of U.S. College Students During the COVID-19 Pandemic, Health Educ Behav 48 (2021) 14–19. [CrossRef]
- T. Karalis, Planning and Evaluation During Educational Disruption: Lessons Learned From COVID-19 Pandemic for Treatment of Emergencies in Education, European Journal of Education Studies (2020). [CrossRef]
- [Oman Authority for Academic Accreditation and Quality Assurance of Education] OAAAQA, Oman Academic Standards for General Foundation Programs (GFP), Muscat, Sultanate of Oman, 2008. https://oaaaqa.gov.om/getattachment/54ac4e6a-0d27-4dd9-b4a2-ba8759979c25/GFP%20Standards%20FINAL.aspx (accessed October 16, 2024).
- [Gulf College] GC, General Foundation Programme (GFP) │ GC, Gulf College (2024). https://gulfcollege.edu.om/programmes/general-foundation-programme/ (accessed October 16, 2024).
- R. Ravid, Practical Statistics for Educators, Rowman & Littlefield, 2024.
- O.A. Marzouk, Adiabatic Flame Temperatures for Oxy-Methane, Oxy-Hydrogen, Air-Methane, and Air-Hydrogen Stoichiometric Combustion using the NASA CEARUN Tool, GRI-Mech 3.0 Reaction Mechanism, and Cantera Python Package, Eng. Technol. Appl. Sci. Res. 13 (2023) 11437–11444. [CrossRef]
- G. Casella, R. Berger, Statistical Inference, CRC Press, 2024.
- O.A. Marzouk, Direct Numerical Simulations of the Flow Past a Cylinder Moving With Sinusoidal and Nonsinusoidal Profiles, Journal of Fluids Engineering 131 (2009) 121201. [CrossRef]
- T. Elsayed, R.M. Hathout, Evaluating the prediction power and accuracy of two smart response surface experimental designs after revisiting repaglinide floating tablets, Futur J Pharm Sci 10 (2024) 34. [CrossRef]
- O.A. Marzouk, A.H. Nayfeh, New Wake Models With Capability of Capturing Nonlinear Physics, in: American Society of Mechanical Engineers Digital Collection, 2009: pp. 901–912. [CrossRef]
- J. Karch, Improving on Adjusted R-Squared, Collabra: Psychology 6 (2020) 45. [CrossRef]
- O.A. Marzouk, A.H. Nayfeh, A Study of the Forces on an Oscillating Cylinder, in: American Society of Mechanical Engineers Digital Collection, 2009: pp. 741–752. [CrossRef]
- I. Khalismatov, R. Zakirov, S. Shomurodov, R. Isanova, F. Joraev, Y. Ergashev, Correlation analysis of geological factors with the coefficient of gas transfer of organizations, E3S Web Conf. 497 (2024) 01018. [CrossRef]
- O.A. Marzouk, Contrasting the Cartesian and polar forms of the shedding-induced force vector in response to 12 subharmonic and superharmonic mechanical excitations, Fluid Dyn. Res. 42 (2010) 035507. [CrossRef]
- M. Fiandini, A.B.D. Nandiyanto, D.F.A. Husaeni, D.N.A. Husaeni, M. Mushiban, How to Calculate Statistics for Significant Difference Test Using SPSS: Understanding Students Comprehension on the Concept of Steam Engines as Power Plant, Indonesian Journal of Science and Technology 9 (2024) 45–108.
- P. Fryzlewicz, Robust Narrowest Significance Pursuit: Inference for Multiple Change-Points in the Median, Journal of Business & Economic Statistics 42 (2024) 1389–1402. [CrossRef]
- M. Moland, A. Michailidou, Testing Causal Inference Between Social Media News Reliance and (Dis)trust of EU Institutions with an Instrumental Variable Approach: Lessons From a Null-Hypothesis Case, Political Studies Review 22 (2024) 412–426. [CrossRef]
- O.A. Marzouk, Assessment of global warming in Al Buraimi, sultanate of Oman based on statistical analysis of NASA POWER data over 39 years, and testing the reliability of NASA POWER against meteorological measurements, Heliyon 7 (2021) e06625. [CrossRef]
- A. Olawale, The impact of capital market on the economic growth of Nigeria, GSC Advanced Research and Reviews 21 (2024) 013–026. [CrossRef]
- A. Salih, L. Alsalhi, A. Abou-Moghli, Entrepreneurial orientation and digital transformation as drivers of high organizational performance: Evidence from Iraqi private bank, Uncertain Supply Chain Management 12 (2024) 9–18. [CrossRef]
- Z.T. Rony, I.M.S. Wijaya, D. Nababan, J. Julyanthry, M. Silalahi, L.M. Ganiem, L. Judijanto, H. Herman, N. Saputra, Analyzing the Impact of Human Resources Competence and Work Motivation on Employee Performance: A Statistical Perspective, Journal of Statistics Applications & Probability 13 (2024) 787–793.
- H. Tannady, C.S. Dewi, Gilbert, Exploring Role of Technology Performance Expectancy, Application Effort Expectancy, Perceived Risk and Perceived Cost On Digital Behavioral Intention of GoFood Users, Jurnal Informasi Dan Teknologi (2024) 80–85. [CrossRef]
- B. Uragun, R. Rajan, Developing an Appropriate Data Normalization Method, in: 2011 10th International Conference on Machine Learning and Applications and Workshops, 2011: pp. 195–199. [CrossRef]
- O.A. Marzouk, A two-step computational aeroacoustics method applied to high-speed flows, Noise Control Eng. J. 56 (2008) 396. [CrossRef]
- P. Källback, M. Shariatgorji, A. Nilsson, P.E. Andrén, Novel mass spectrometry imaging software assisting labeled normalization and quantitation of drugs and neuropeptides directly in tissue sections, Journal of Proteomics 75 (2012) 4941–4951. [CrossRef]
- O.A. Marzouk, Detailed and simplified plasma models in combined-cycle magnetohydrodynamic power systems, Int. j. Adv. Appl. Sci. 10 (2023) 96–108. [CrossRef]
- W. Wang, X. Zhang, S. Gombault, S.J. Knapskog, Attribute Normalization in Network Intrusion Detection, in: 2009 10th International Symposium on Pervasive Systems, Algorithms, and Networks, 2009: pp. 448–453. [CrossRef]
- O.A. Marzouk, A.H. Nayfeh, Loads on a Harmonically Oscillating Cylinder, in: American Society of Mechanical Engineers Digital Collection, 2009: pp. 1755–1774. [CrossRef]
- L. Bornmann, L. Leydesdorff, J. Wang, Which percentile-based approach should be preferred for calculating normalized citation impact values? An empirical comparison of five approaches including a newly developed citation-rank approach (P100), Journal of Informetrics 7 (2013) 933–944. [CrossRef]
- O.A. Marzouk, Flow control using bifrequency motion, Theor. Comput. Fluid Dyn. 25 (2011) 381–405. [CrossRef]
- D.P. Bills, R.L. Canosa, Sharing introductory programming curriculum across disciplines, in: Proceedings of the 8th ACM SIGITE Conference on Information Technology Education, Association for Computing Machinery, New York, NY, USA, 2007: pp. 99–106. [CrossRef]
- N.M. Ide, J.C. Hill, Interdisciplinary Majors Involving Computer Science, Computer Science Education 2 (1991) 139–153. [CrossRef]
- E. Anthony, Computing education in academia: toward differentiating the disciplines, in: Proceedings of the 4th Conference on Information Technology Curriculum, Association for Computing Machinery, New York, NY, USA, 2003: pp. 1–8. [CrossRef]
- F.-M.E. Uzoka, R. Connolly, M. Schroeder, N. Khemka, J. Miller, Computing is not a rock band: student understanding of the computing disciplines, in: Proceedings of the 14th Annual ACM SIGITE Conference on Information Technology Education, Association for Computing Machinery, New York, NY, USA, 2013: pp. 115–120. [CrossRef]
- K.R. Demarest, J.R. Miller, J.A. Roberts, C. Tsatsoulis, Electrical engineering vs. computer engineering vs. computer science: developing three distinct but interrelated curricula, in: Proceedings Frontiers in Education 1995 25th Annual Conference. Engineering Education for the 21st Century, 1995: p. 4b2.1-4b2.5 vol.2. [CrossRef]
- J. Courte, C. Bishop-Clark, Do students differentiate between computing disciplines?, SIGCSE Bull. 41 (2009) 29–33. [CrossRef]
- [Accreditation Board for Engineering and Technology] ABET, Program Eligibility Requirements │ ABET, ABET (2024). https://www.abet.org/accreditation/what-is-accreditation/eligibility-requirements (accessed October 15, 2024).
- [Accreditation Board for Engineering and Technology] ABET, Bylaws, Constitution and Rules of Procedure │ ABET, ABET (2024). https://www.abet.org/about-abet/governance/bylaws-constitution-and-rules-of-procedure (accessed October 15, 2024).
- [Accreditation Board for Engineering and Technology] ABET, ABET Constitution, 2015. https://www.abet.org/wp-content/uploads/2020/02/Ratified-ABET-Constitution-2015-Public.pdf (accessed October 15, 2024).
- R. Gouia-Zarrad, R. Gharbi, A. Amdouni, Lessons Learned from a Successful First Time ABET Accreditation of Three Engineering Programs, in: 2024 IEEE World Engineering Education Conference (EDUNINE), 2024: pp. 1–6. [CrossRef]
- N. Juneam, R. Greenlaw, Spawning Four-Year, ABET-Accreditable Programs in Cybersecurity from Existing Computer Science Programs in Thailand, International Journal of Computing Sciences Research 8 (2024) 2612–2634.
- J. DeBello, P. Ghazizadeh, F. Keshtkar, Special Topics Courses in ABET Accredited Computer Science Degree Curriculum: Benefits and Challenges, in: Valencia, Spain, 2024: pp. 7535–7535. [CrossRef]
Figure 1.
Profile of the progression rate adjustment factor ( ) to account for the presence of a foundation year (applicable only to “within-institution/program study advancement” progression rates).
Figure 1.
Profile of the progression rate adjustment factor ( ) to account for the presence of a foundation year (applicable only to “within-institution/program study advancement” progression rates).
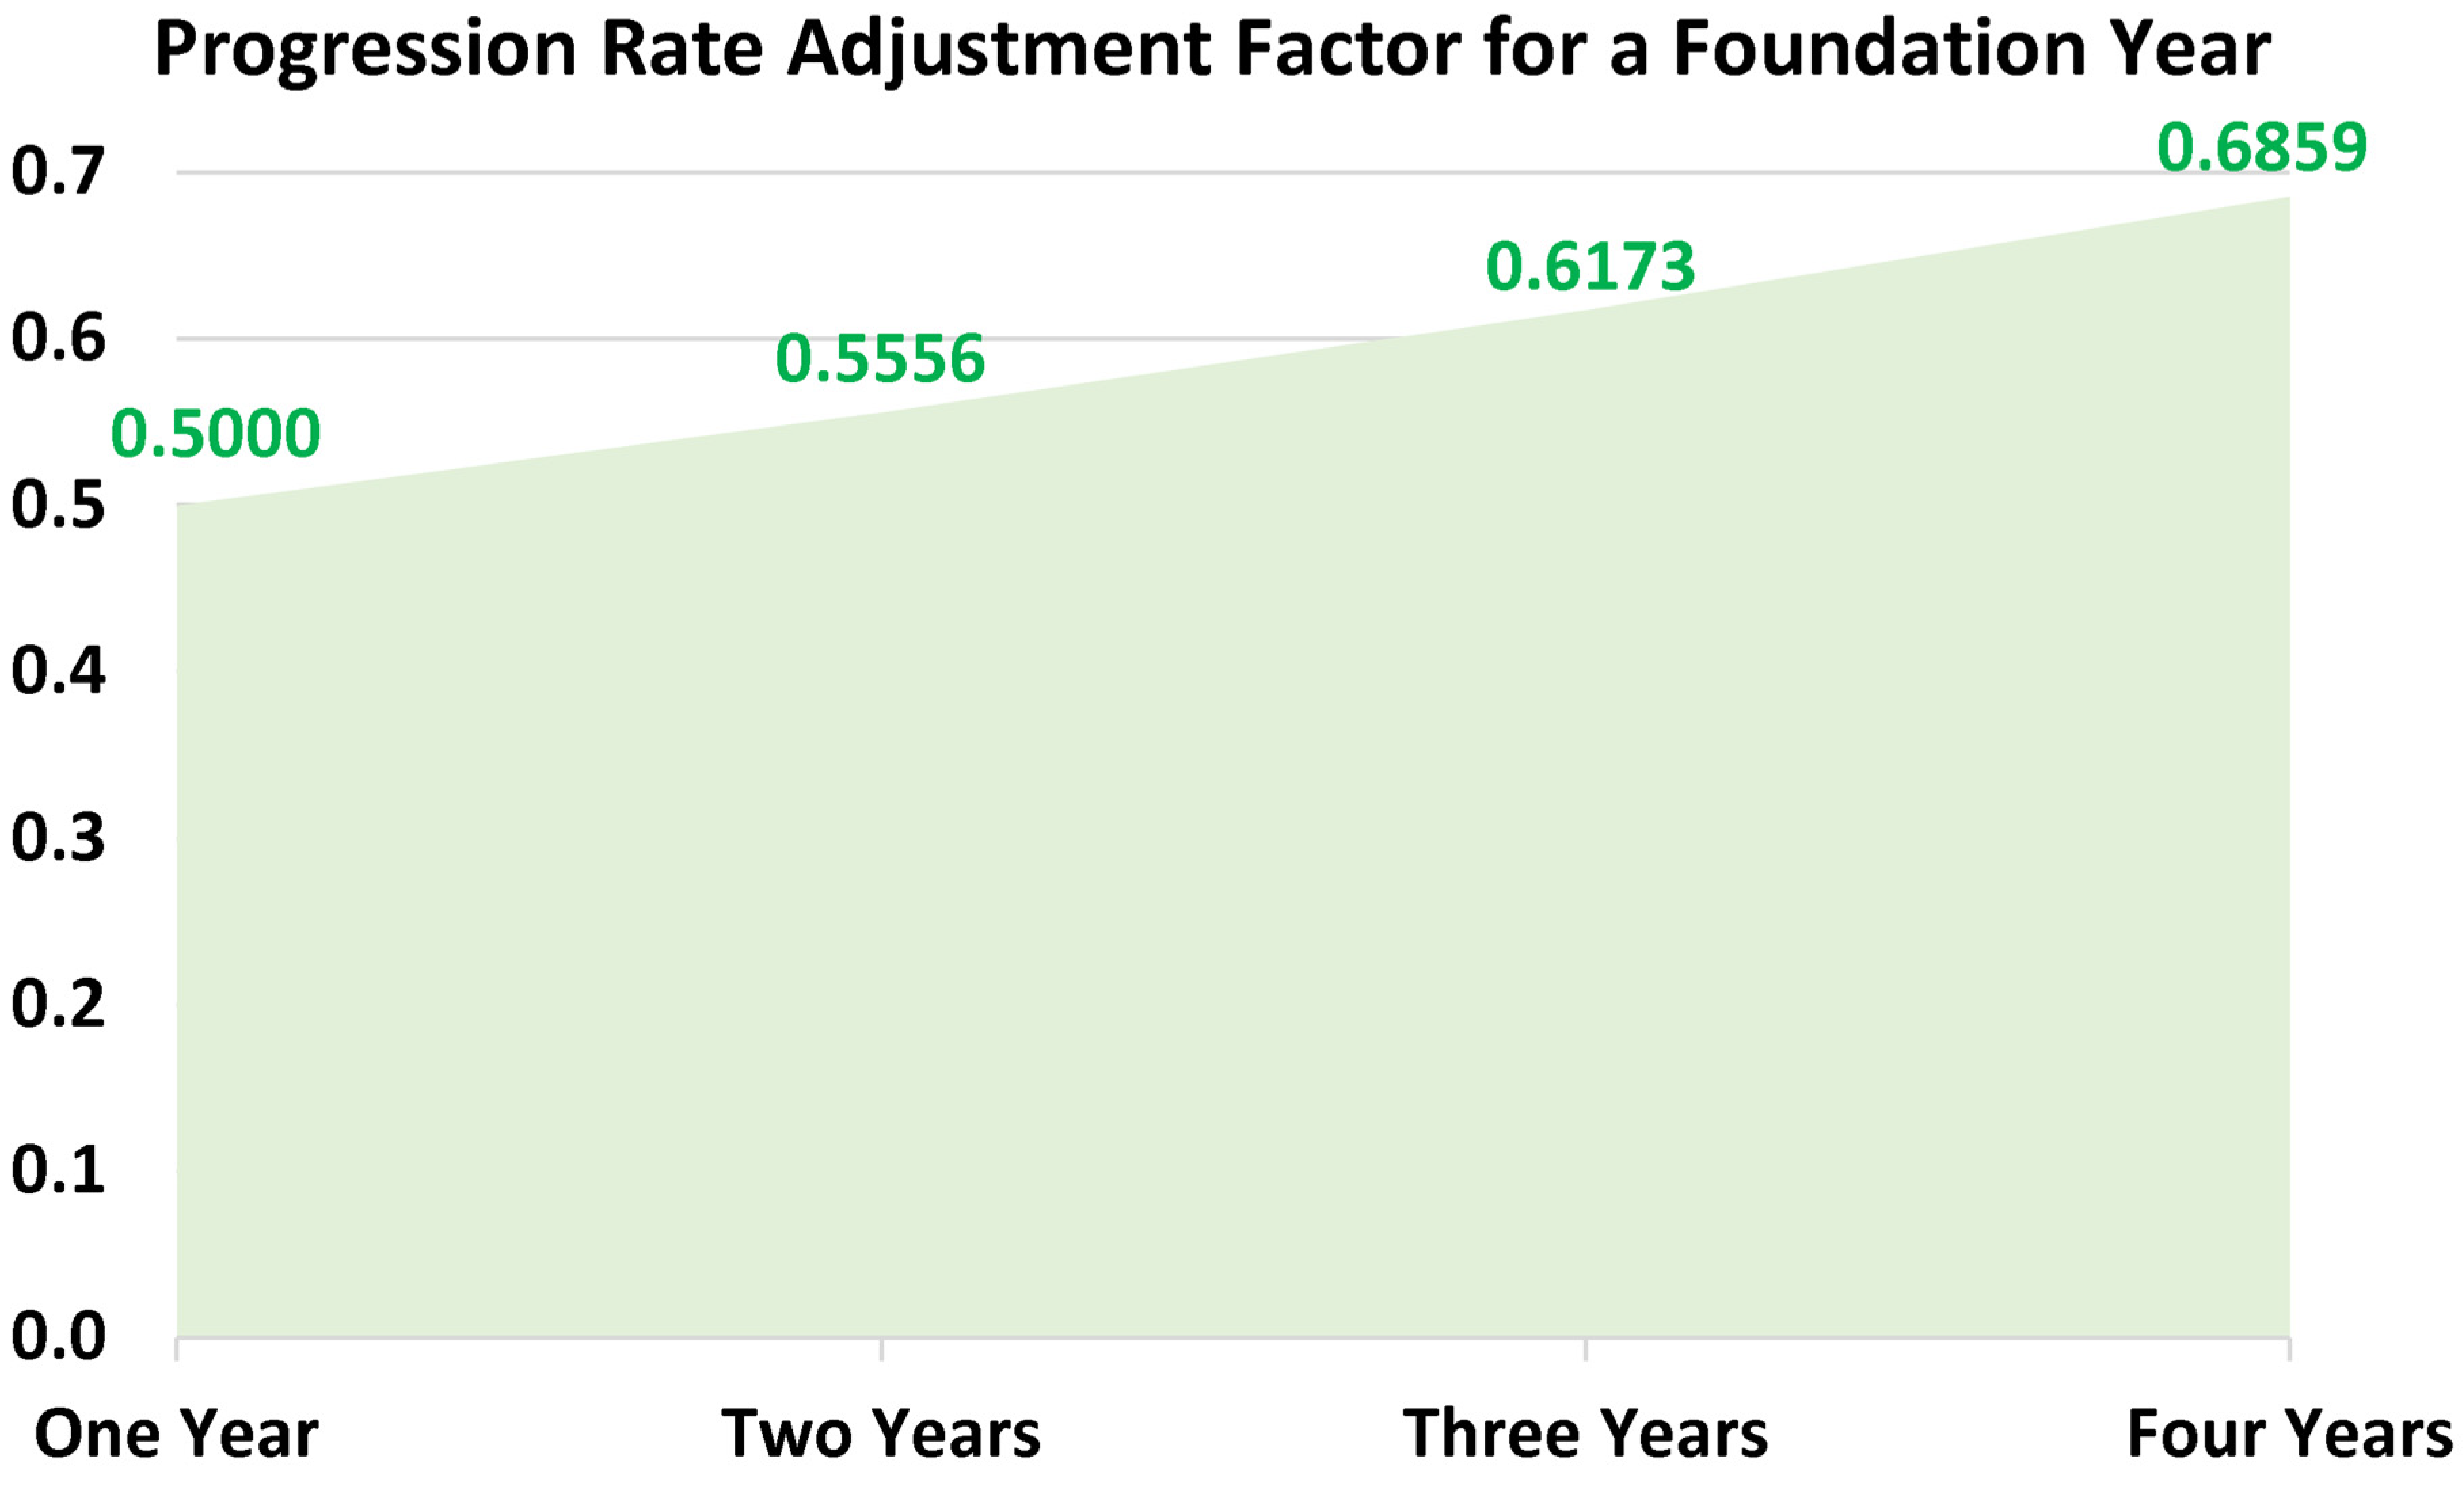
Figure 2.
Suggested overall benchmarking retention rates at five durations (from one year to five years after admission).
Figure 2.
Suggested overall benchmarking retention rates at five durations (from one year to five years after admission).
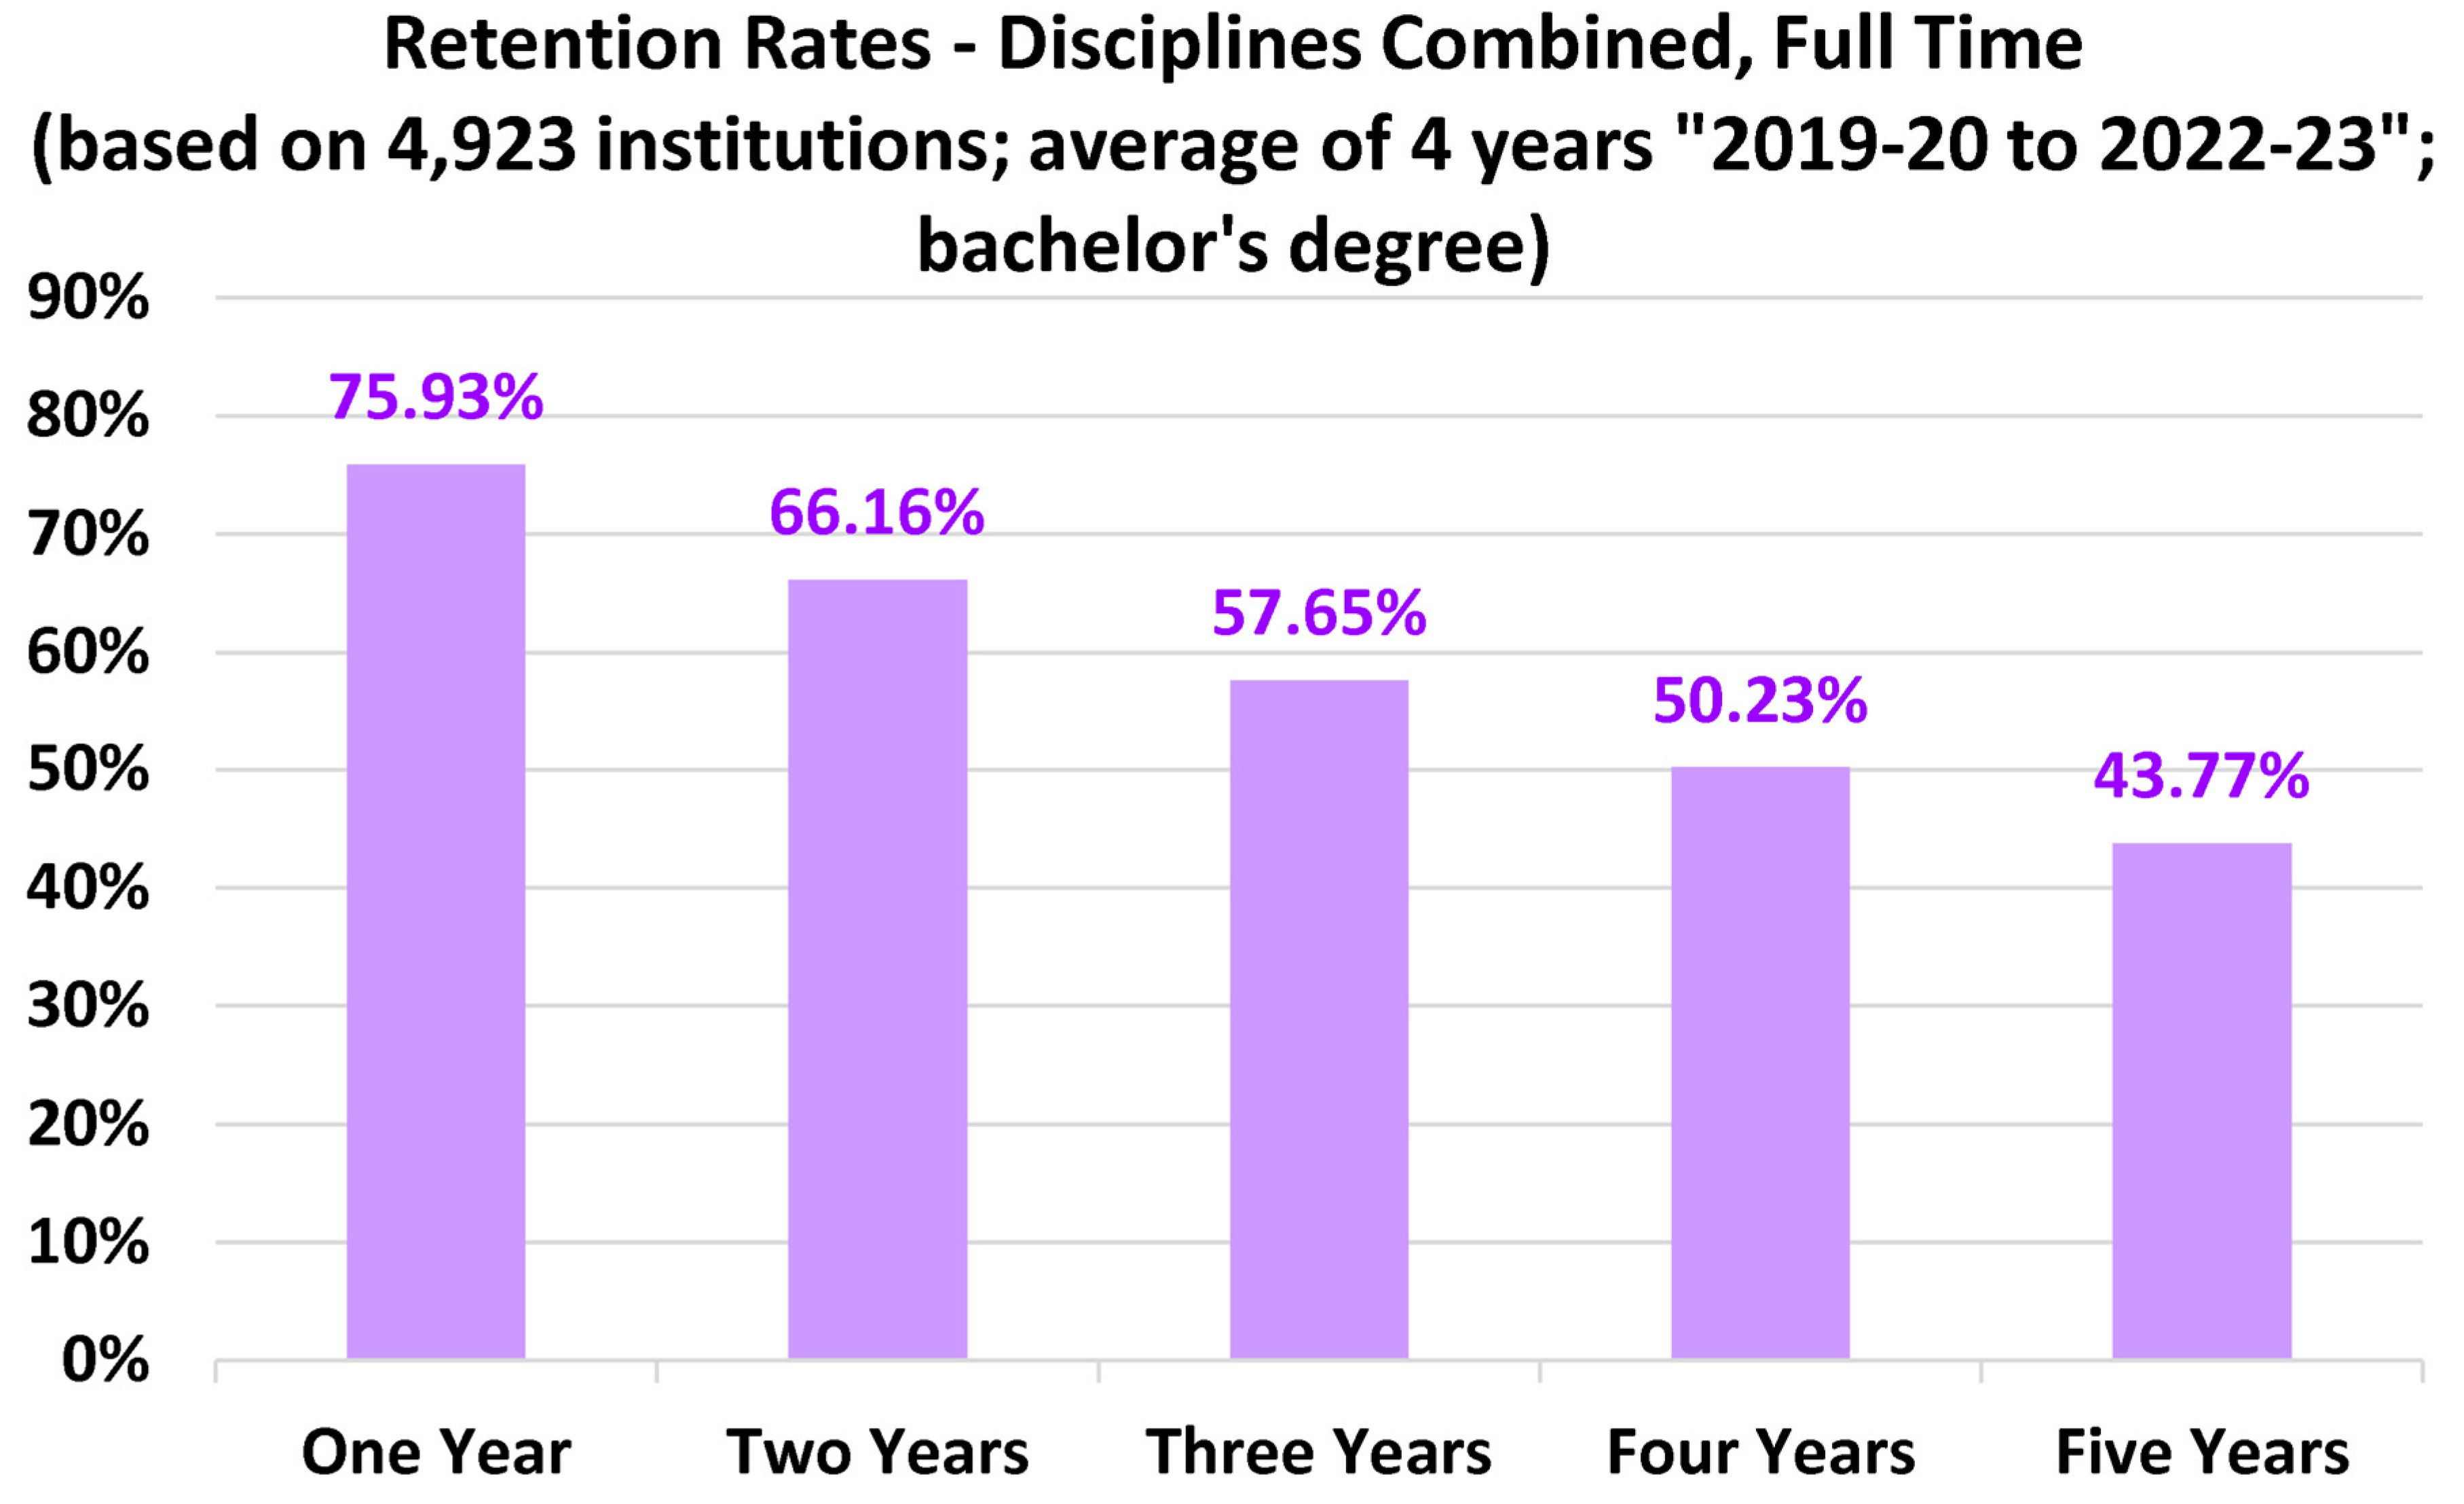
Figure 3.
Suggested architecture benchmarking retention rates at five durations (from one year to five years after admission).
Figure 3.
Suggested architecture benchmarking retention rates at five durations (from one year to five years after admission).
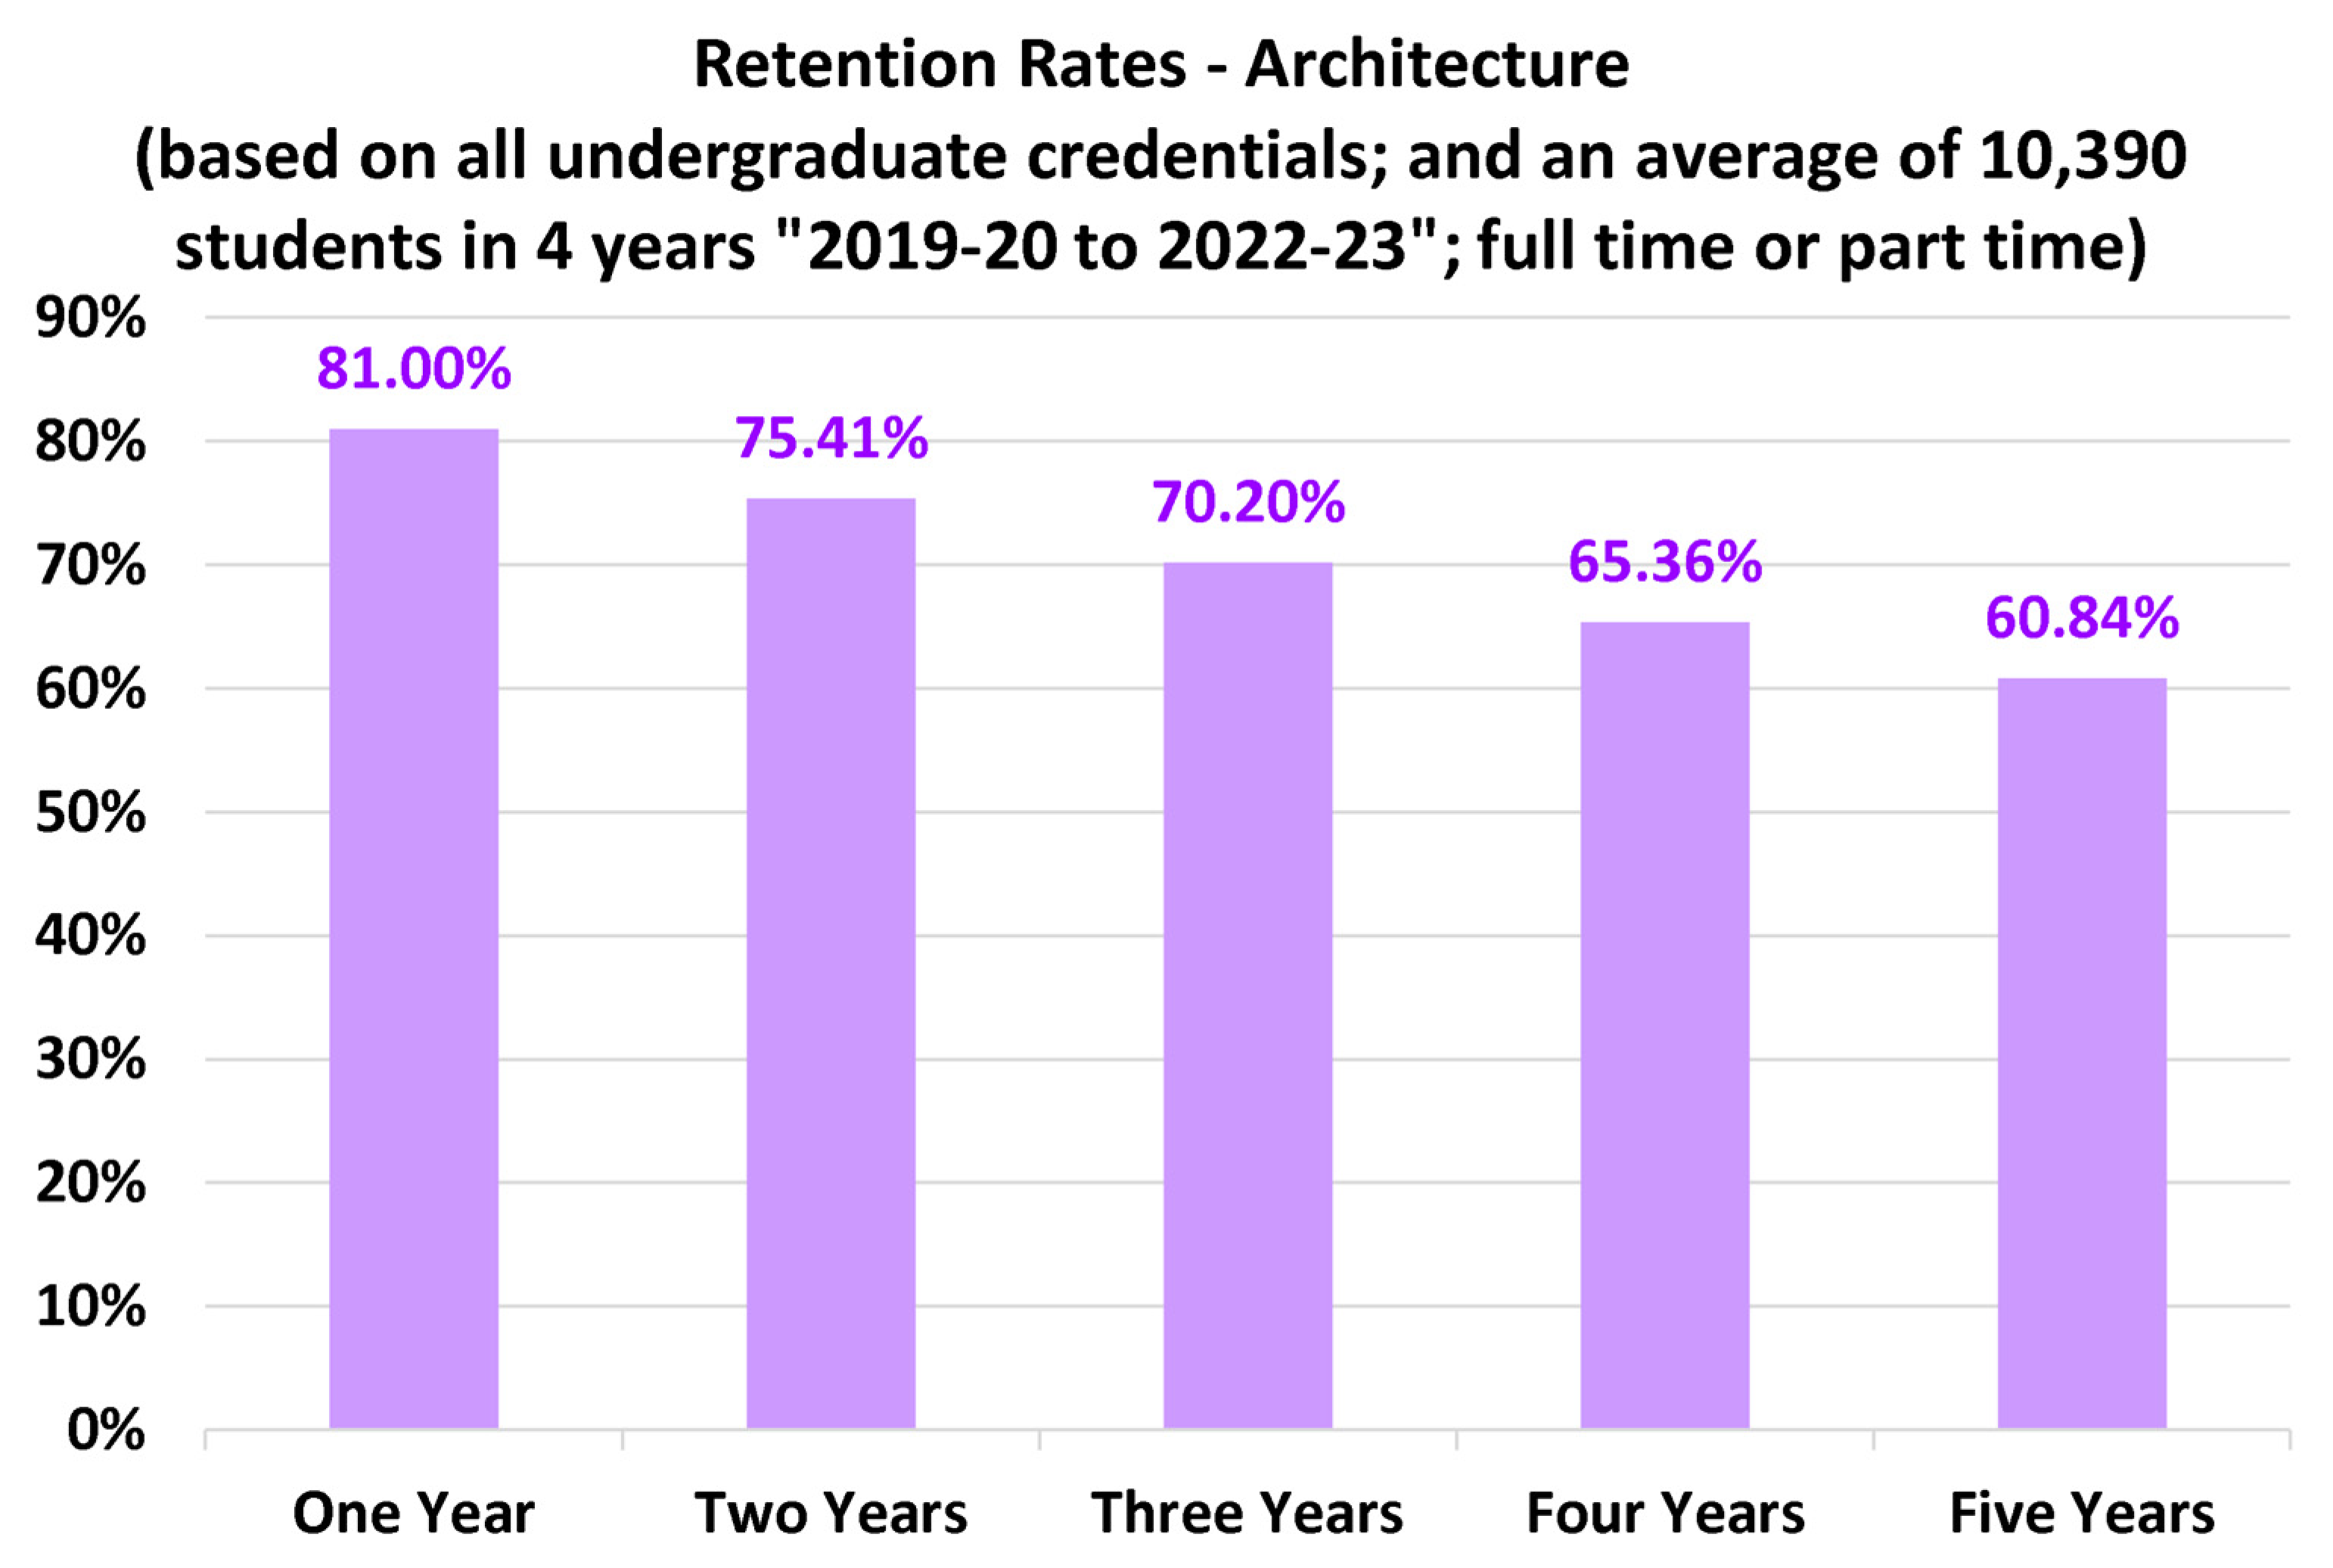
Figure 4.
Suggested business/management benchmarking retention rates at five durations (from one year to five years after admission).
Figure 4.
Suggested business/management benchmarking retention rates at five durations (from one year to five years after admission).
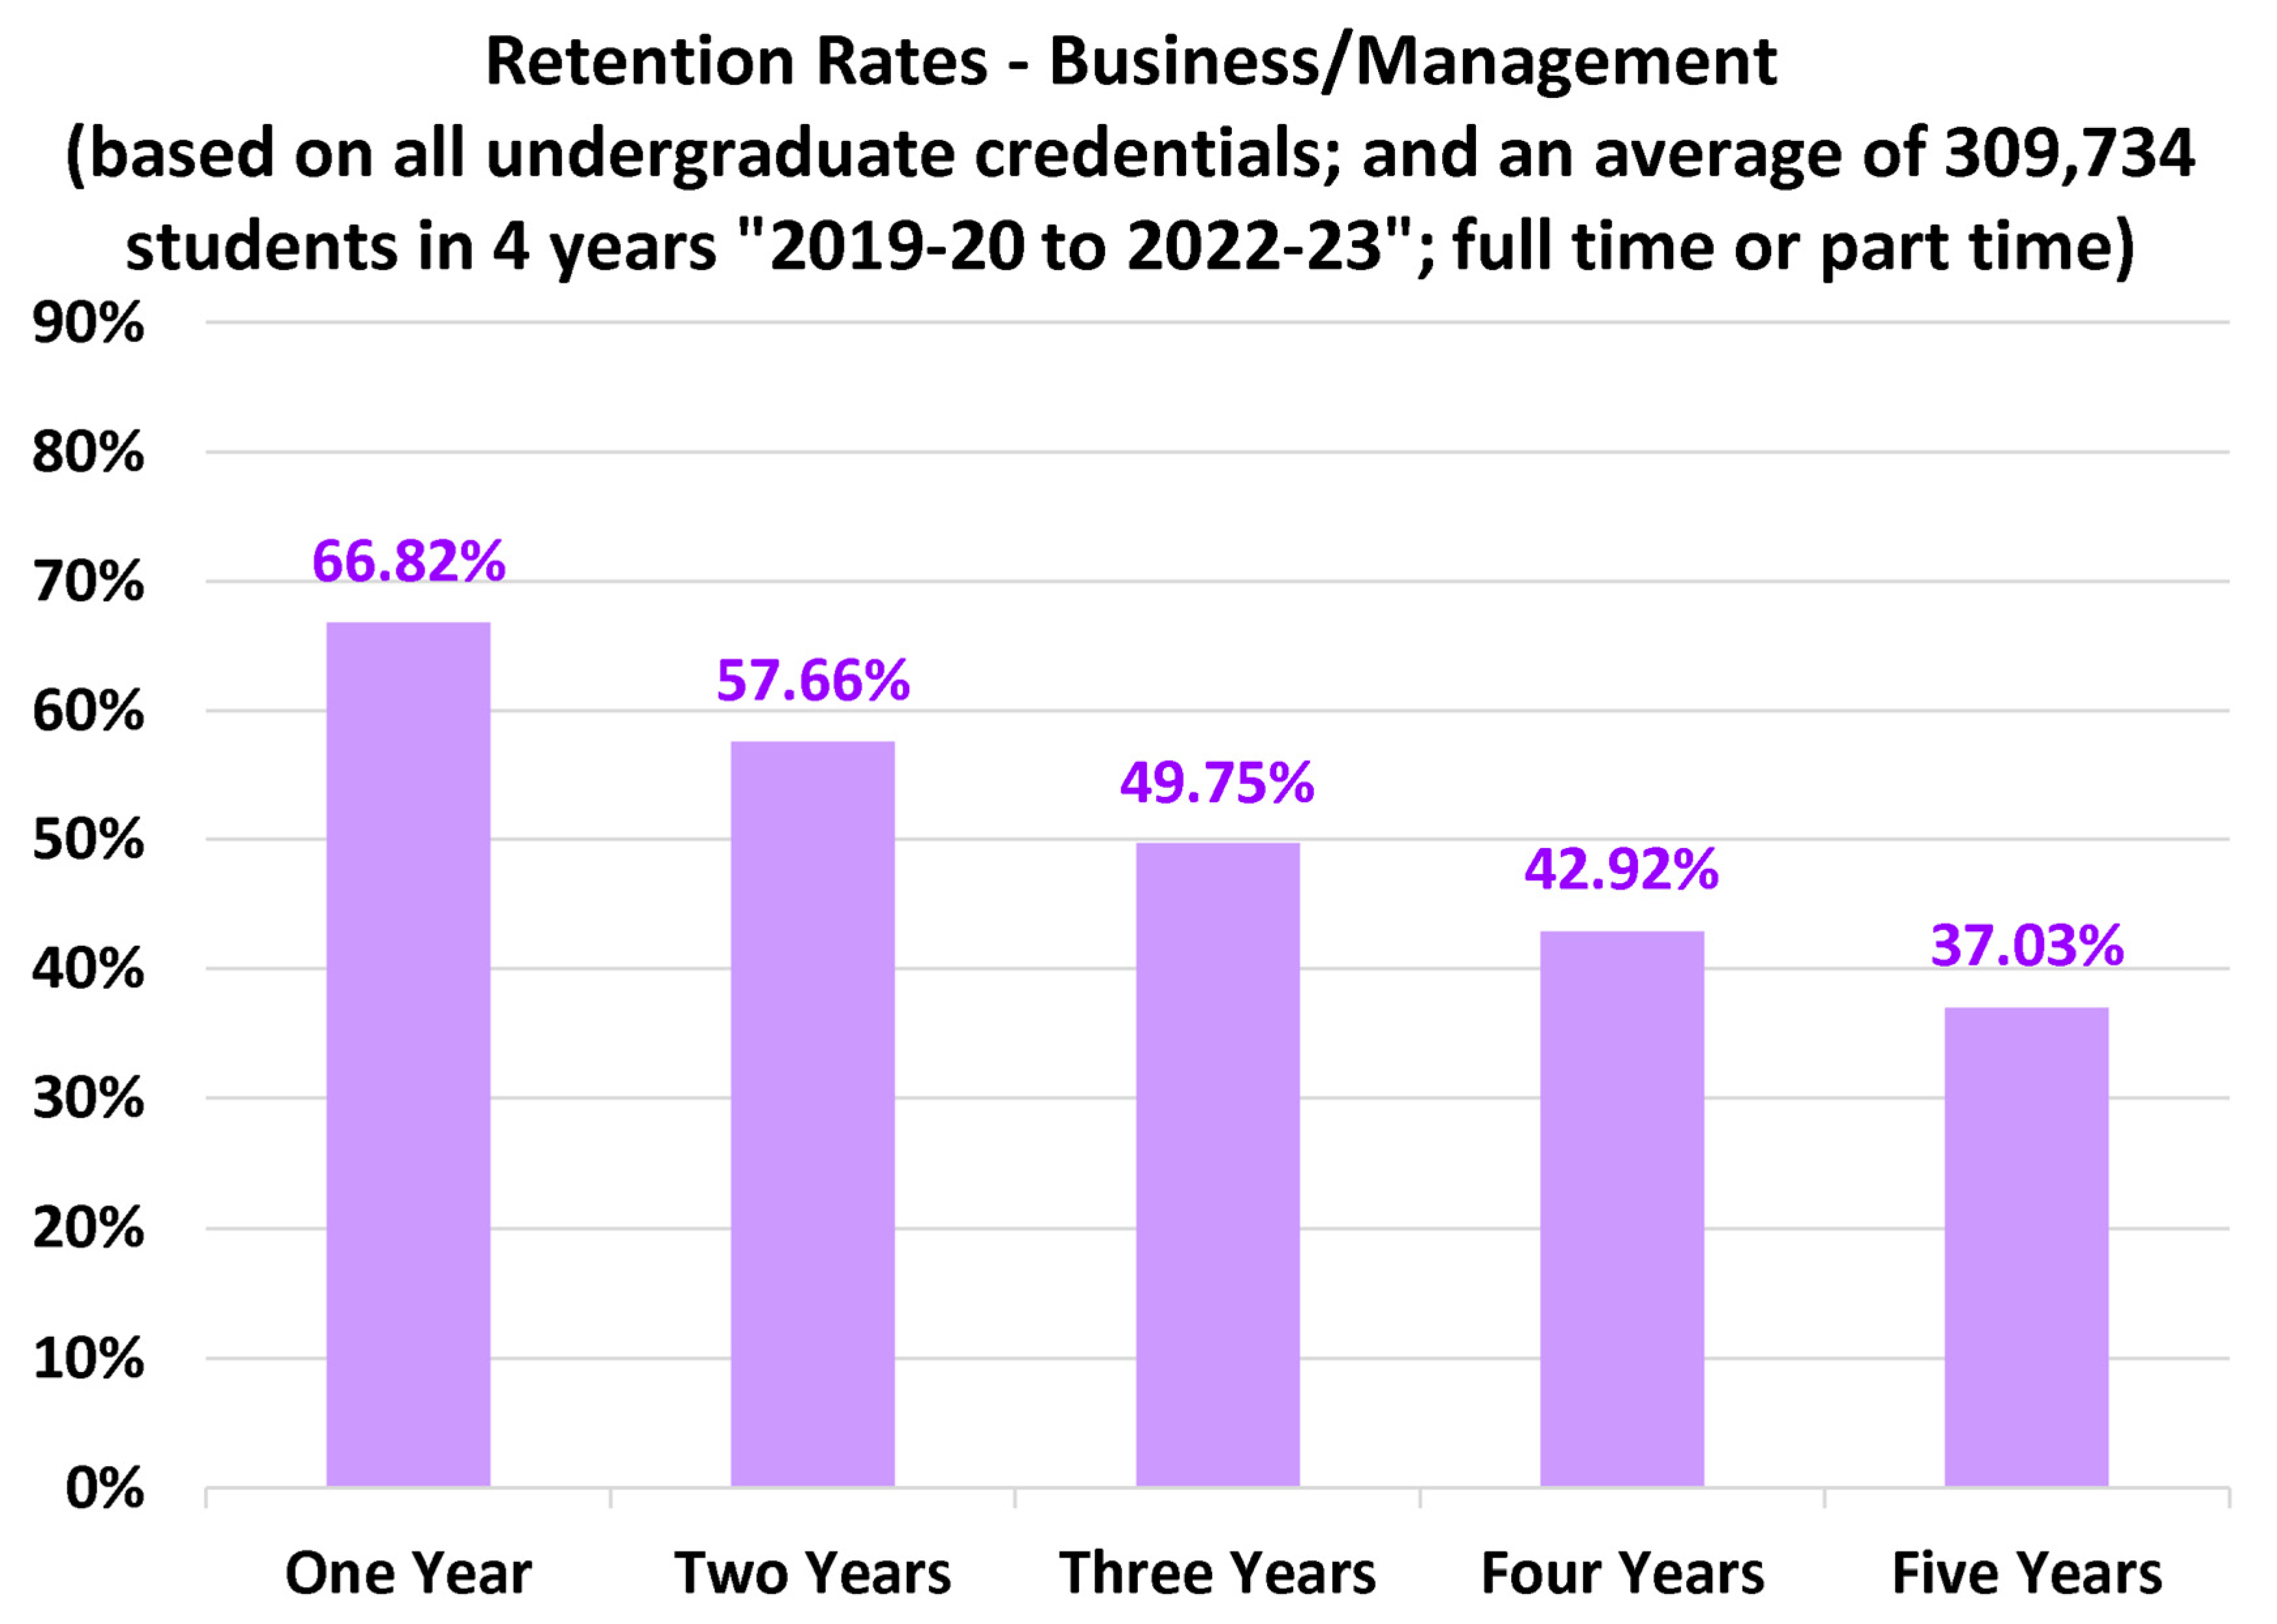
Figure 5.
Suggested computer/information science benchmarking retention rates at five durations (from one year to five years after admission).
Figure 5.
Suggested computer/information science benchmarking retention rates at five durations (from one year to five years after admission).
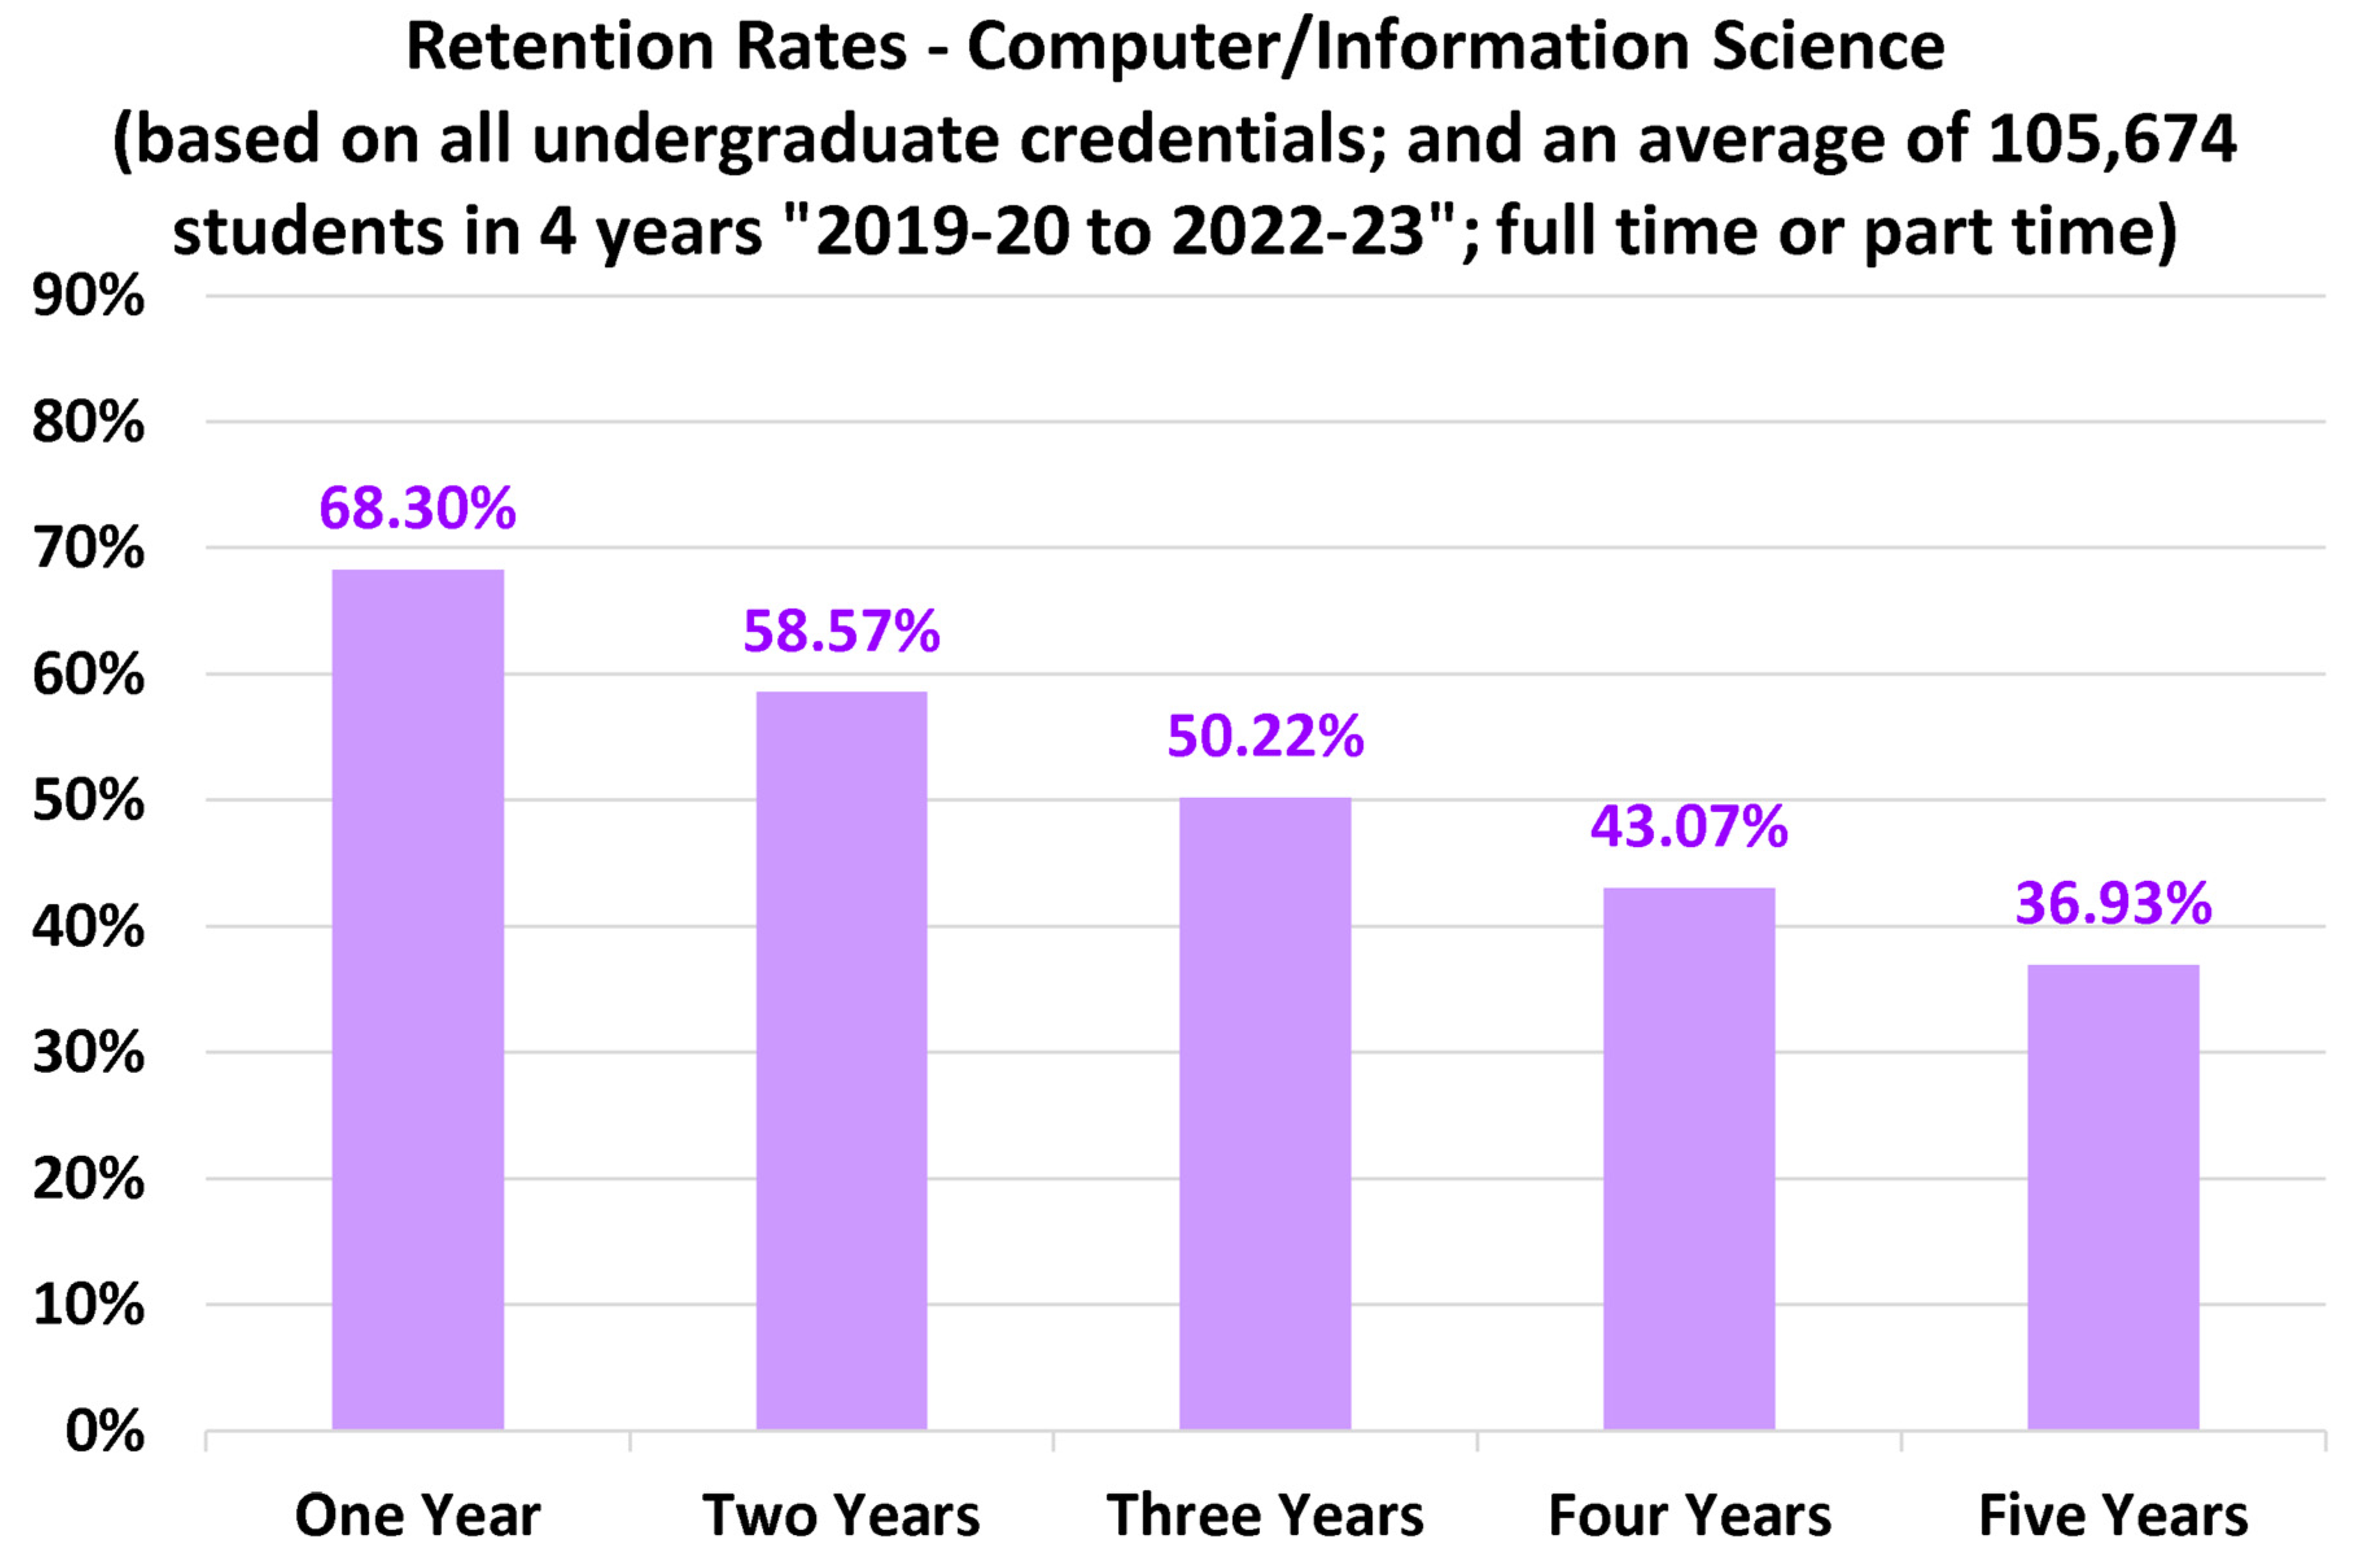
Figure 6.
Suggested engineering benchmarking retention rates at five durations (from one year to five years after admission).
Figure 6.
Suggested engineering benchmarking retention rates at five durations (from one year to five years after admission).
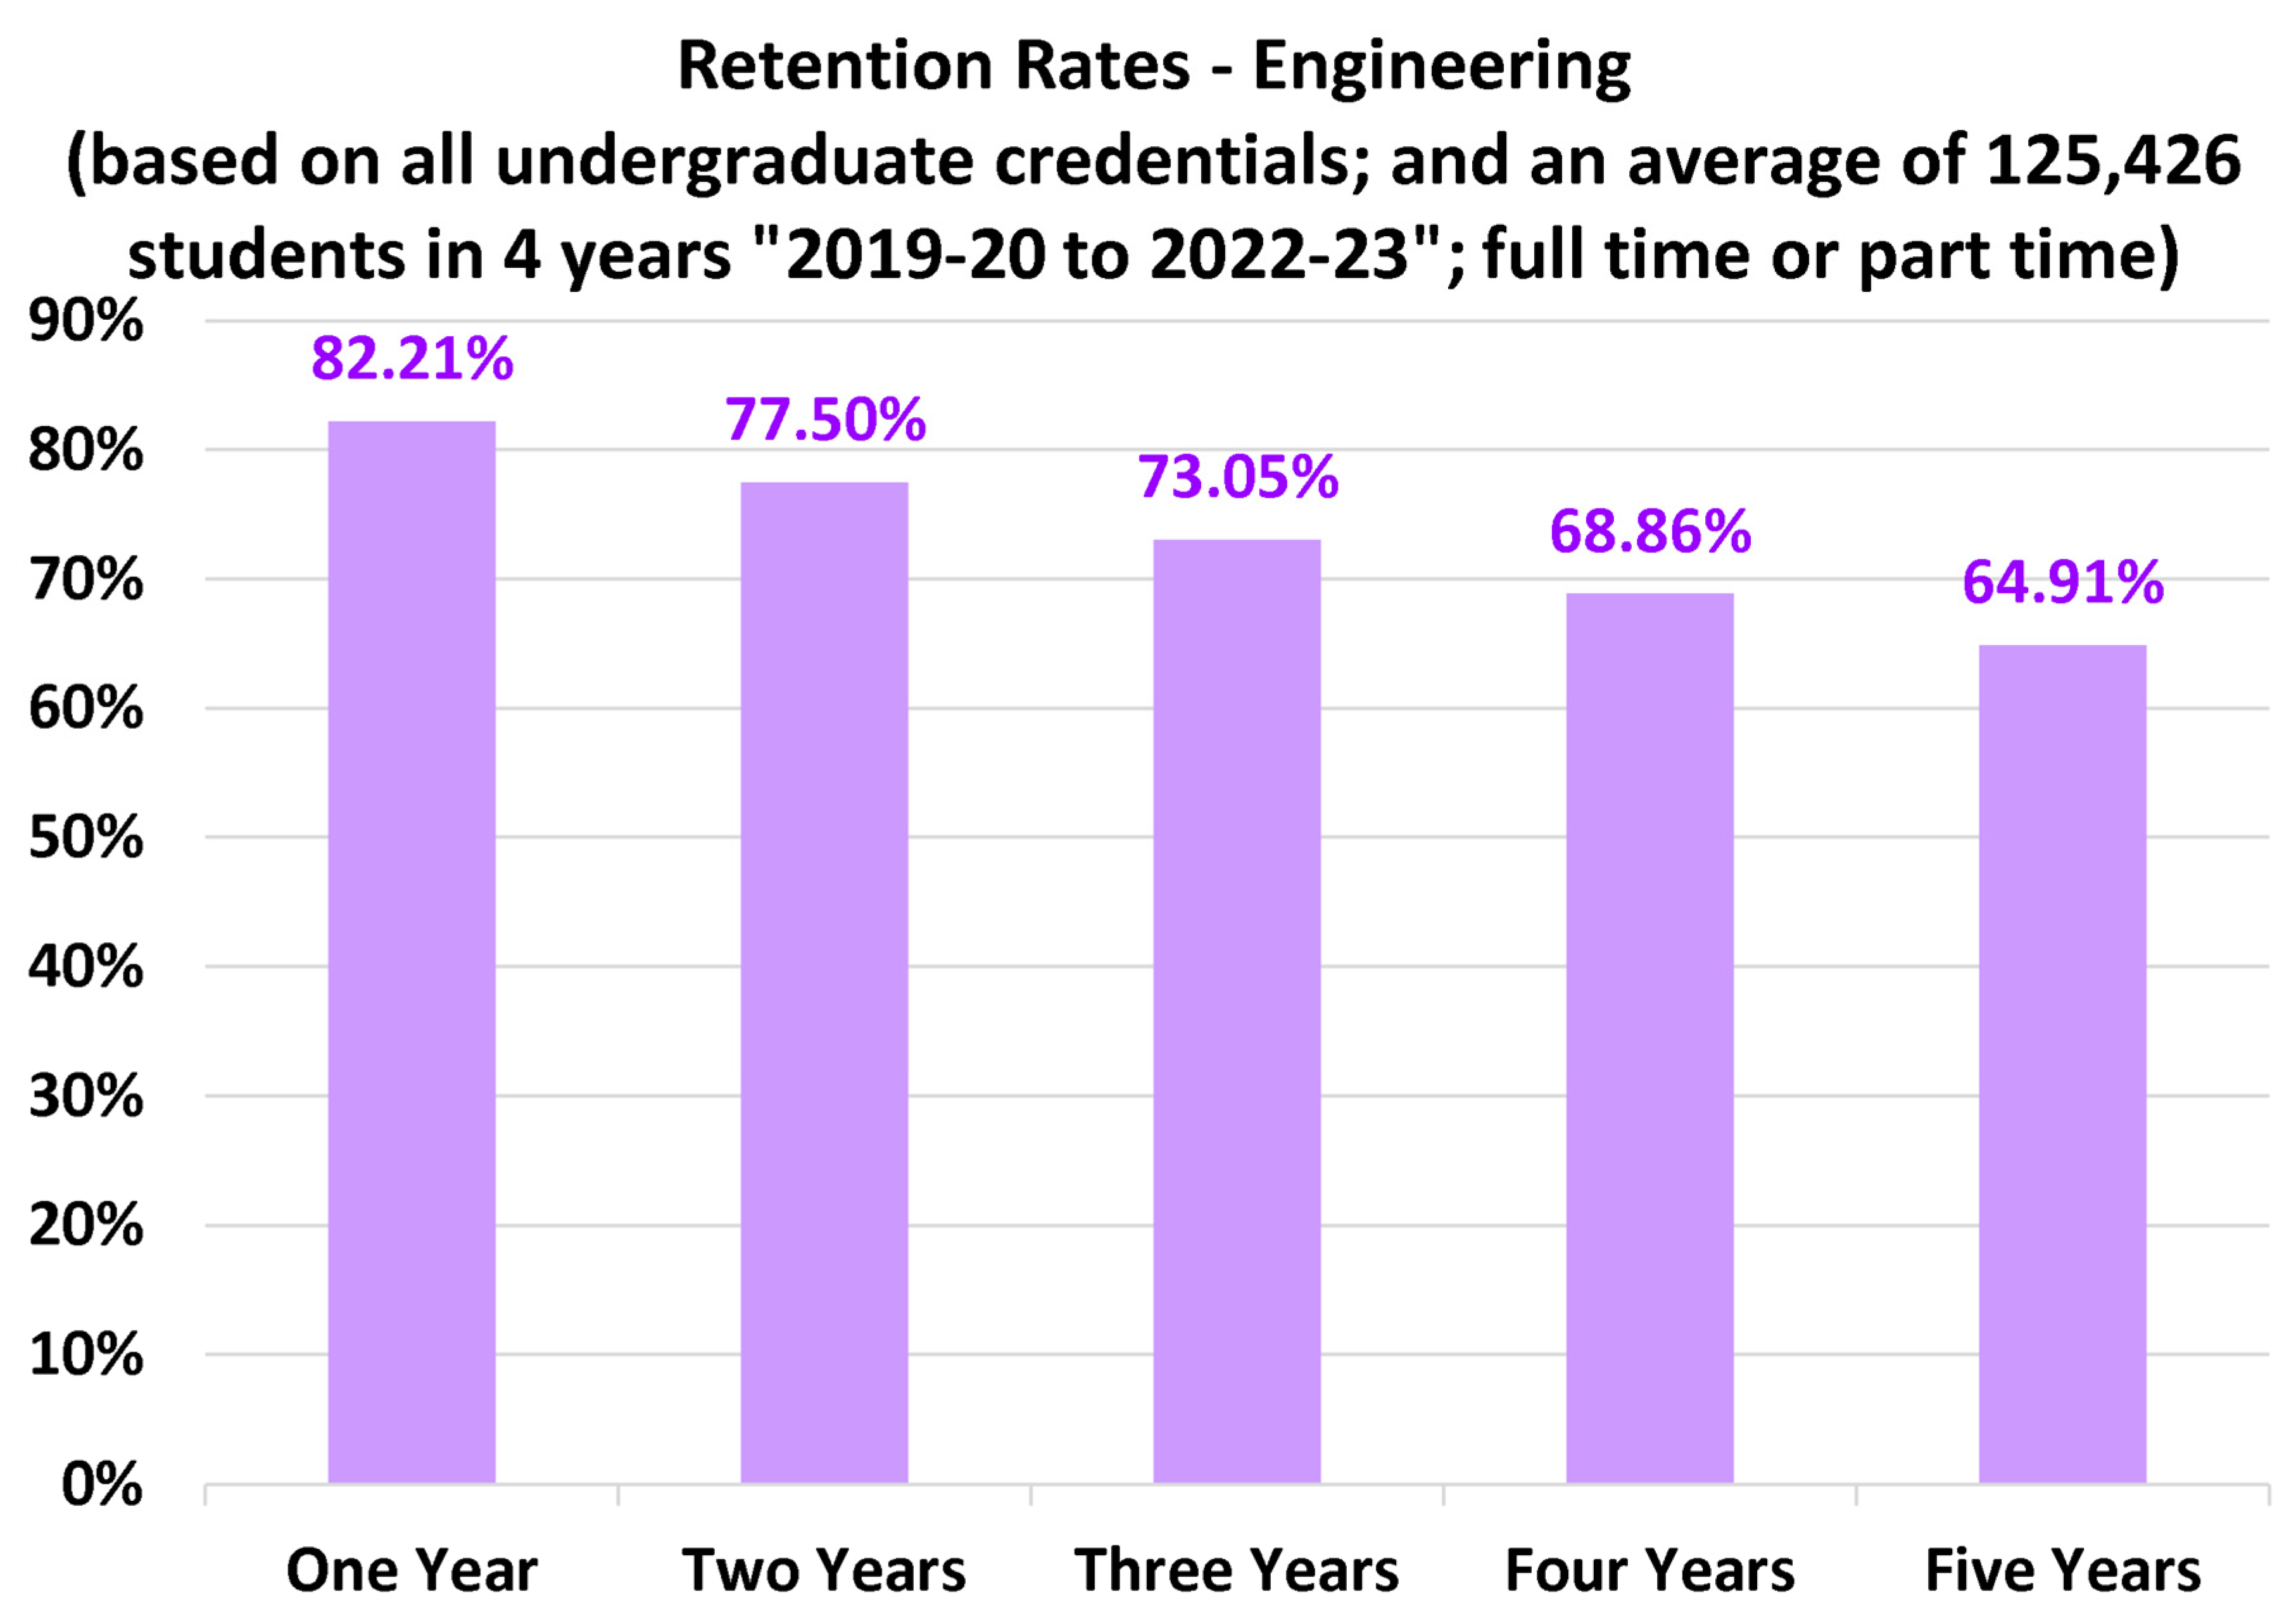
Figure 7.
Suggested engineering technology benchmarking retention rates at five durations (from one year to five years after admission).
Figure 7.
Suggested engineering technology benchmarking retention rates at five durations (from one year to five years after admission).
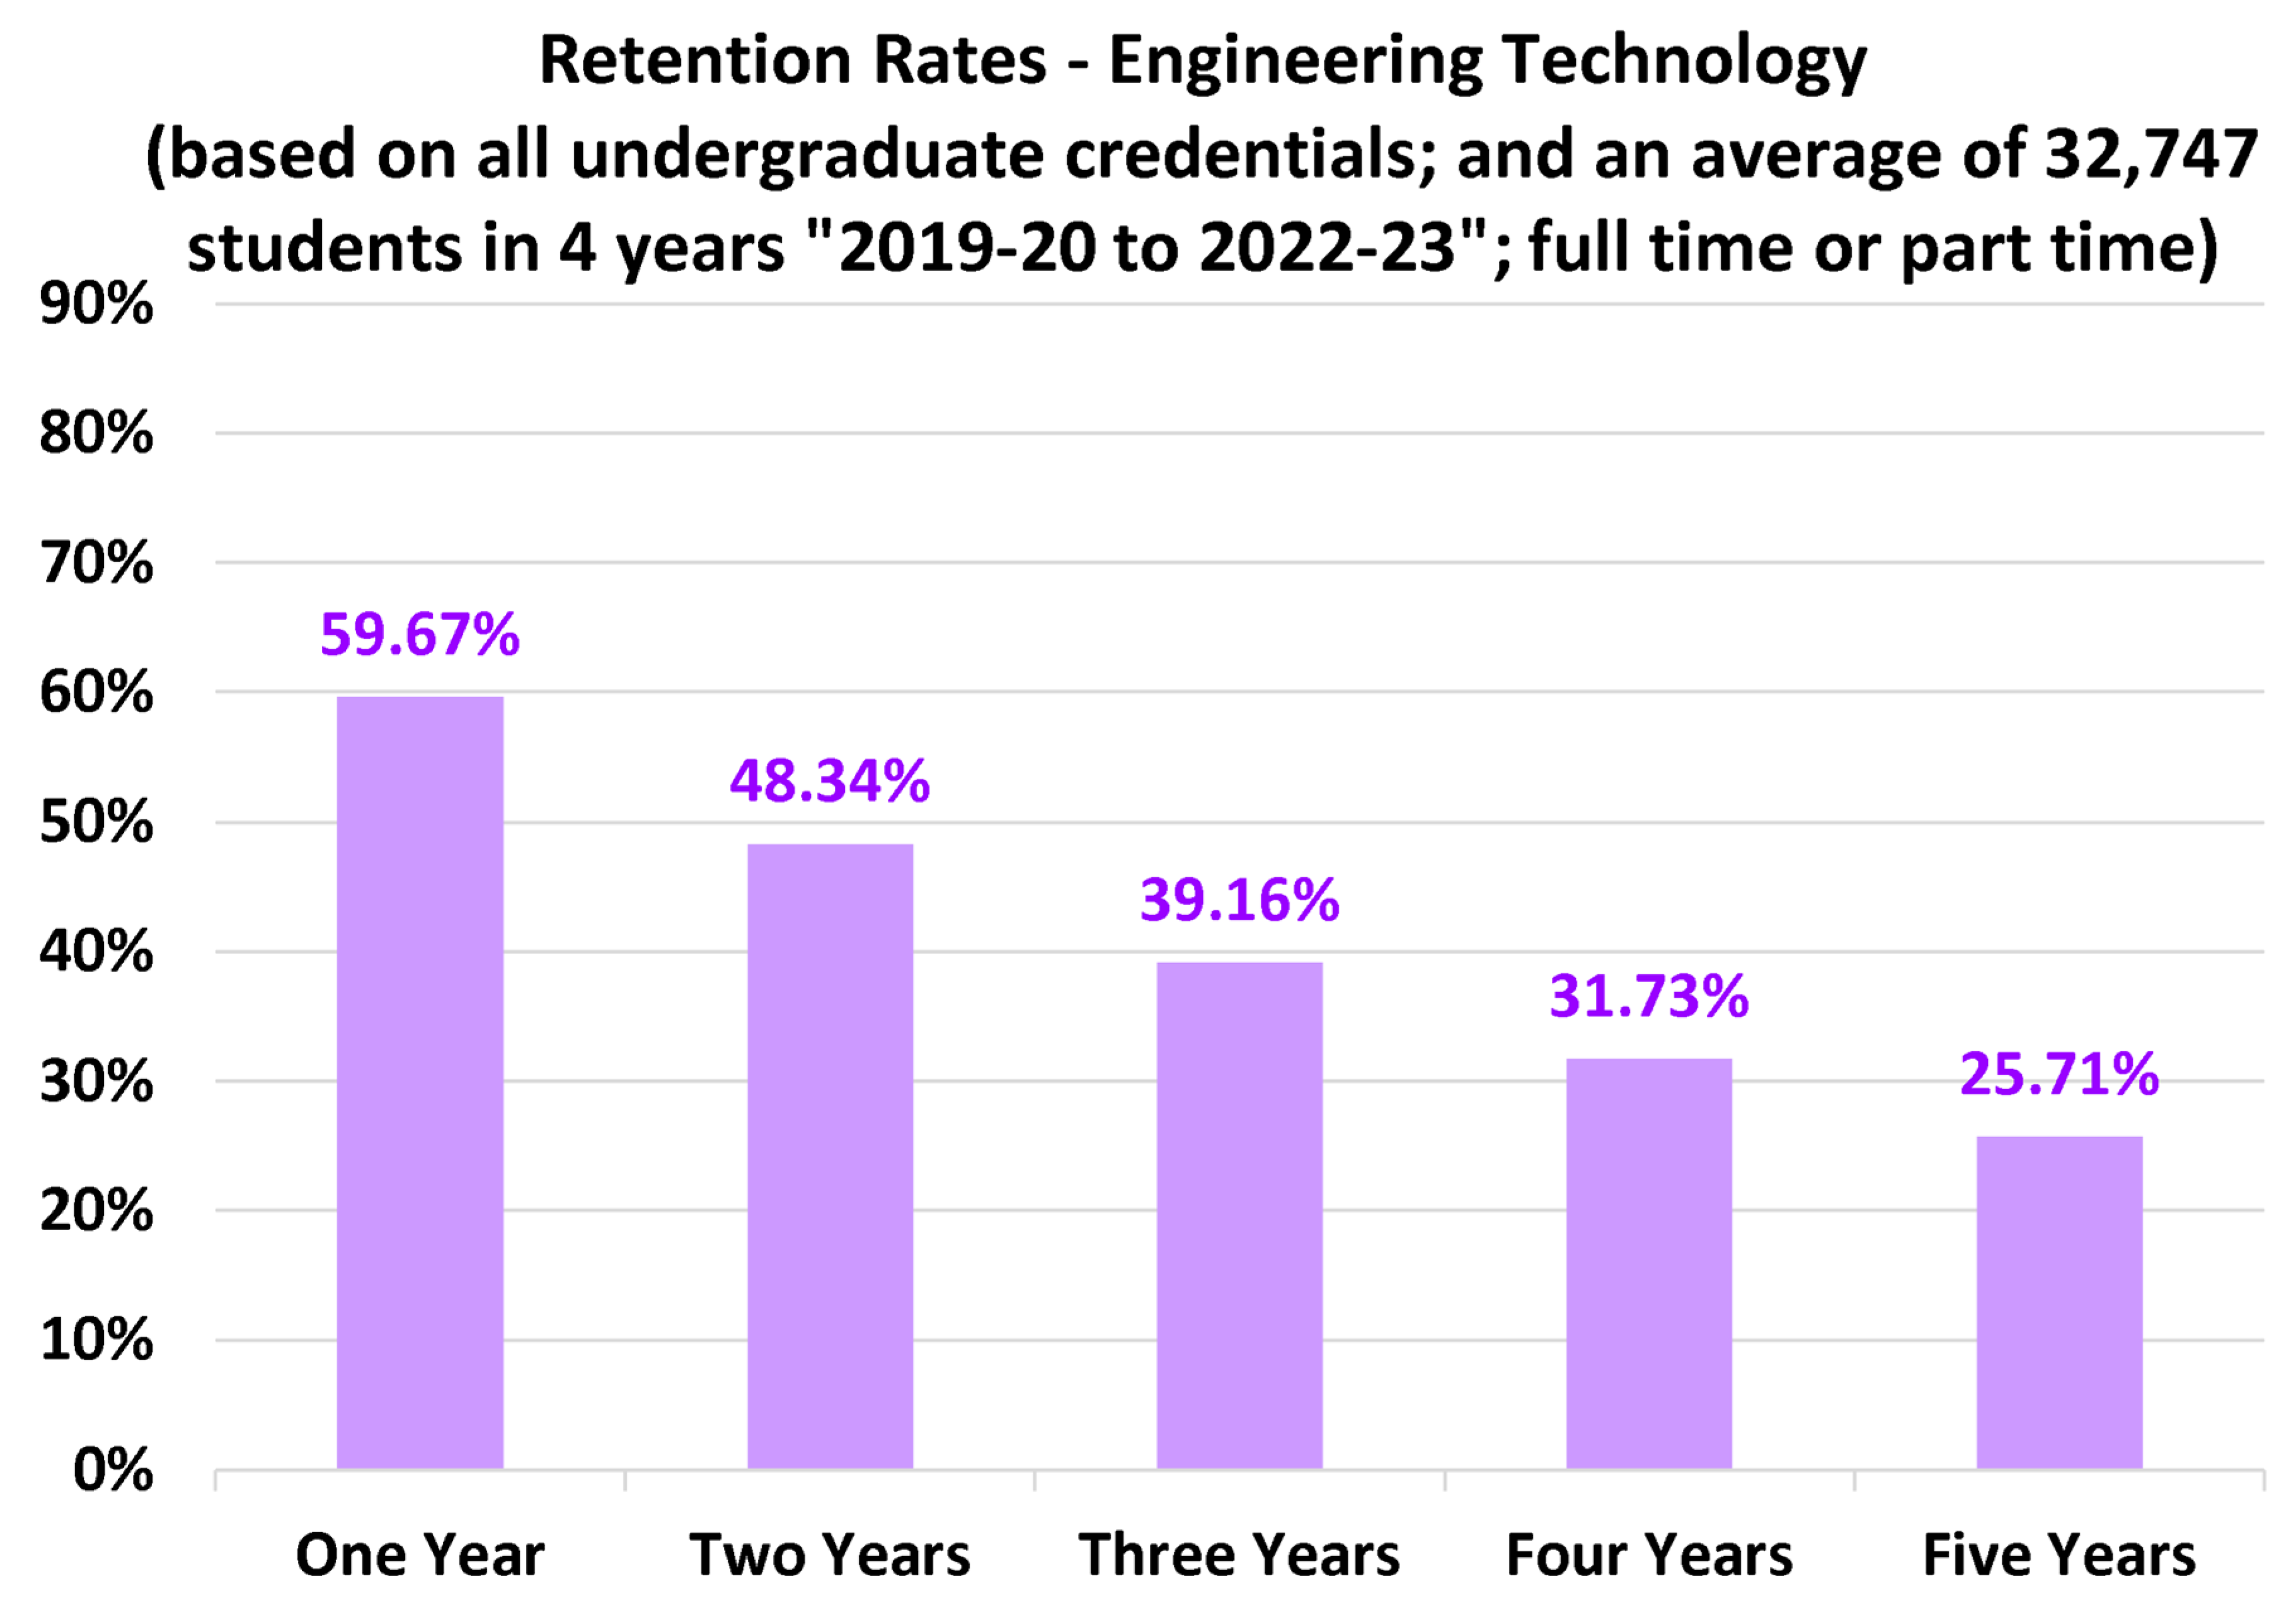
Figure 8.
Suggested health/clinical benchmarking retention rates at five durations (from one year to five years after admission).
Figure 8.
Suggested health/clinical benchmarking retention rates at five durations (from one year to five years after admission).
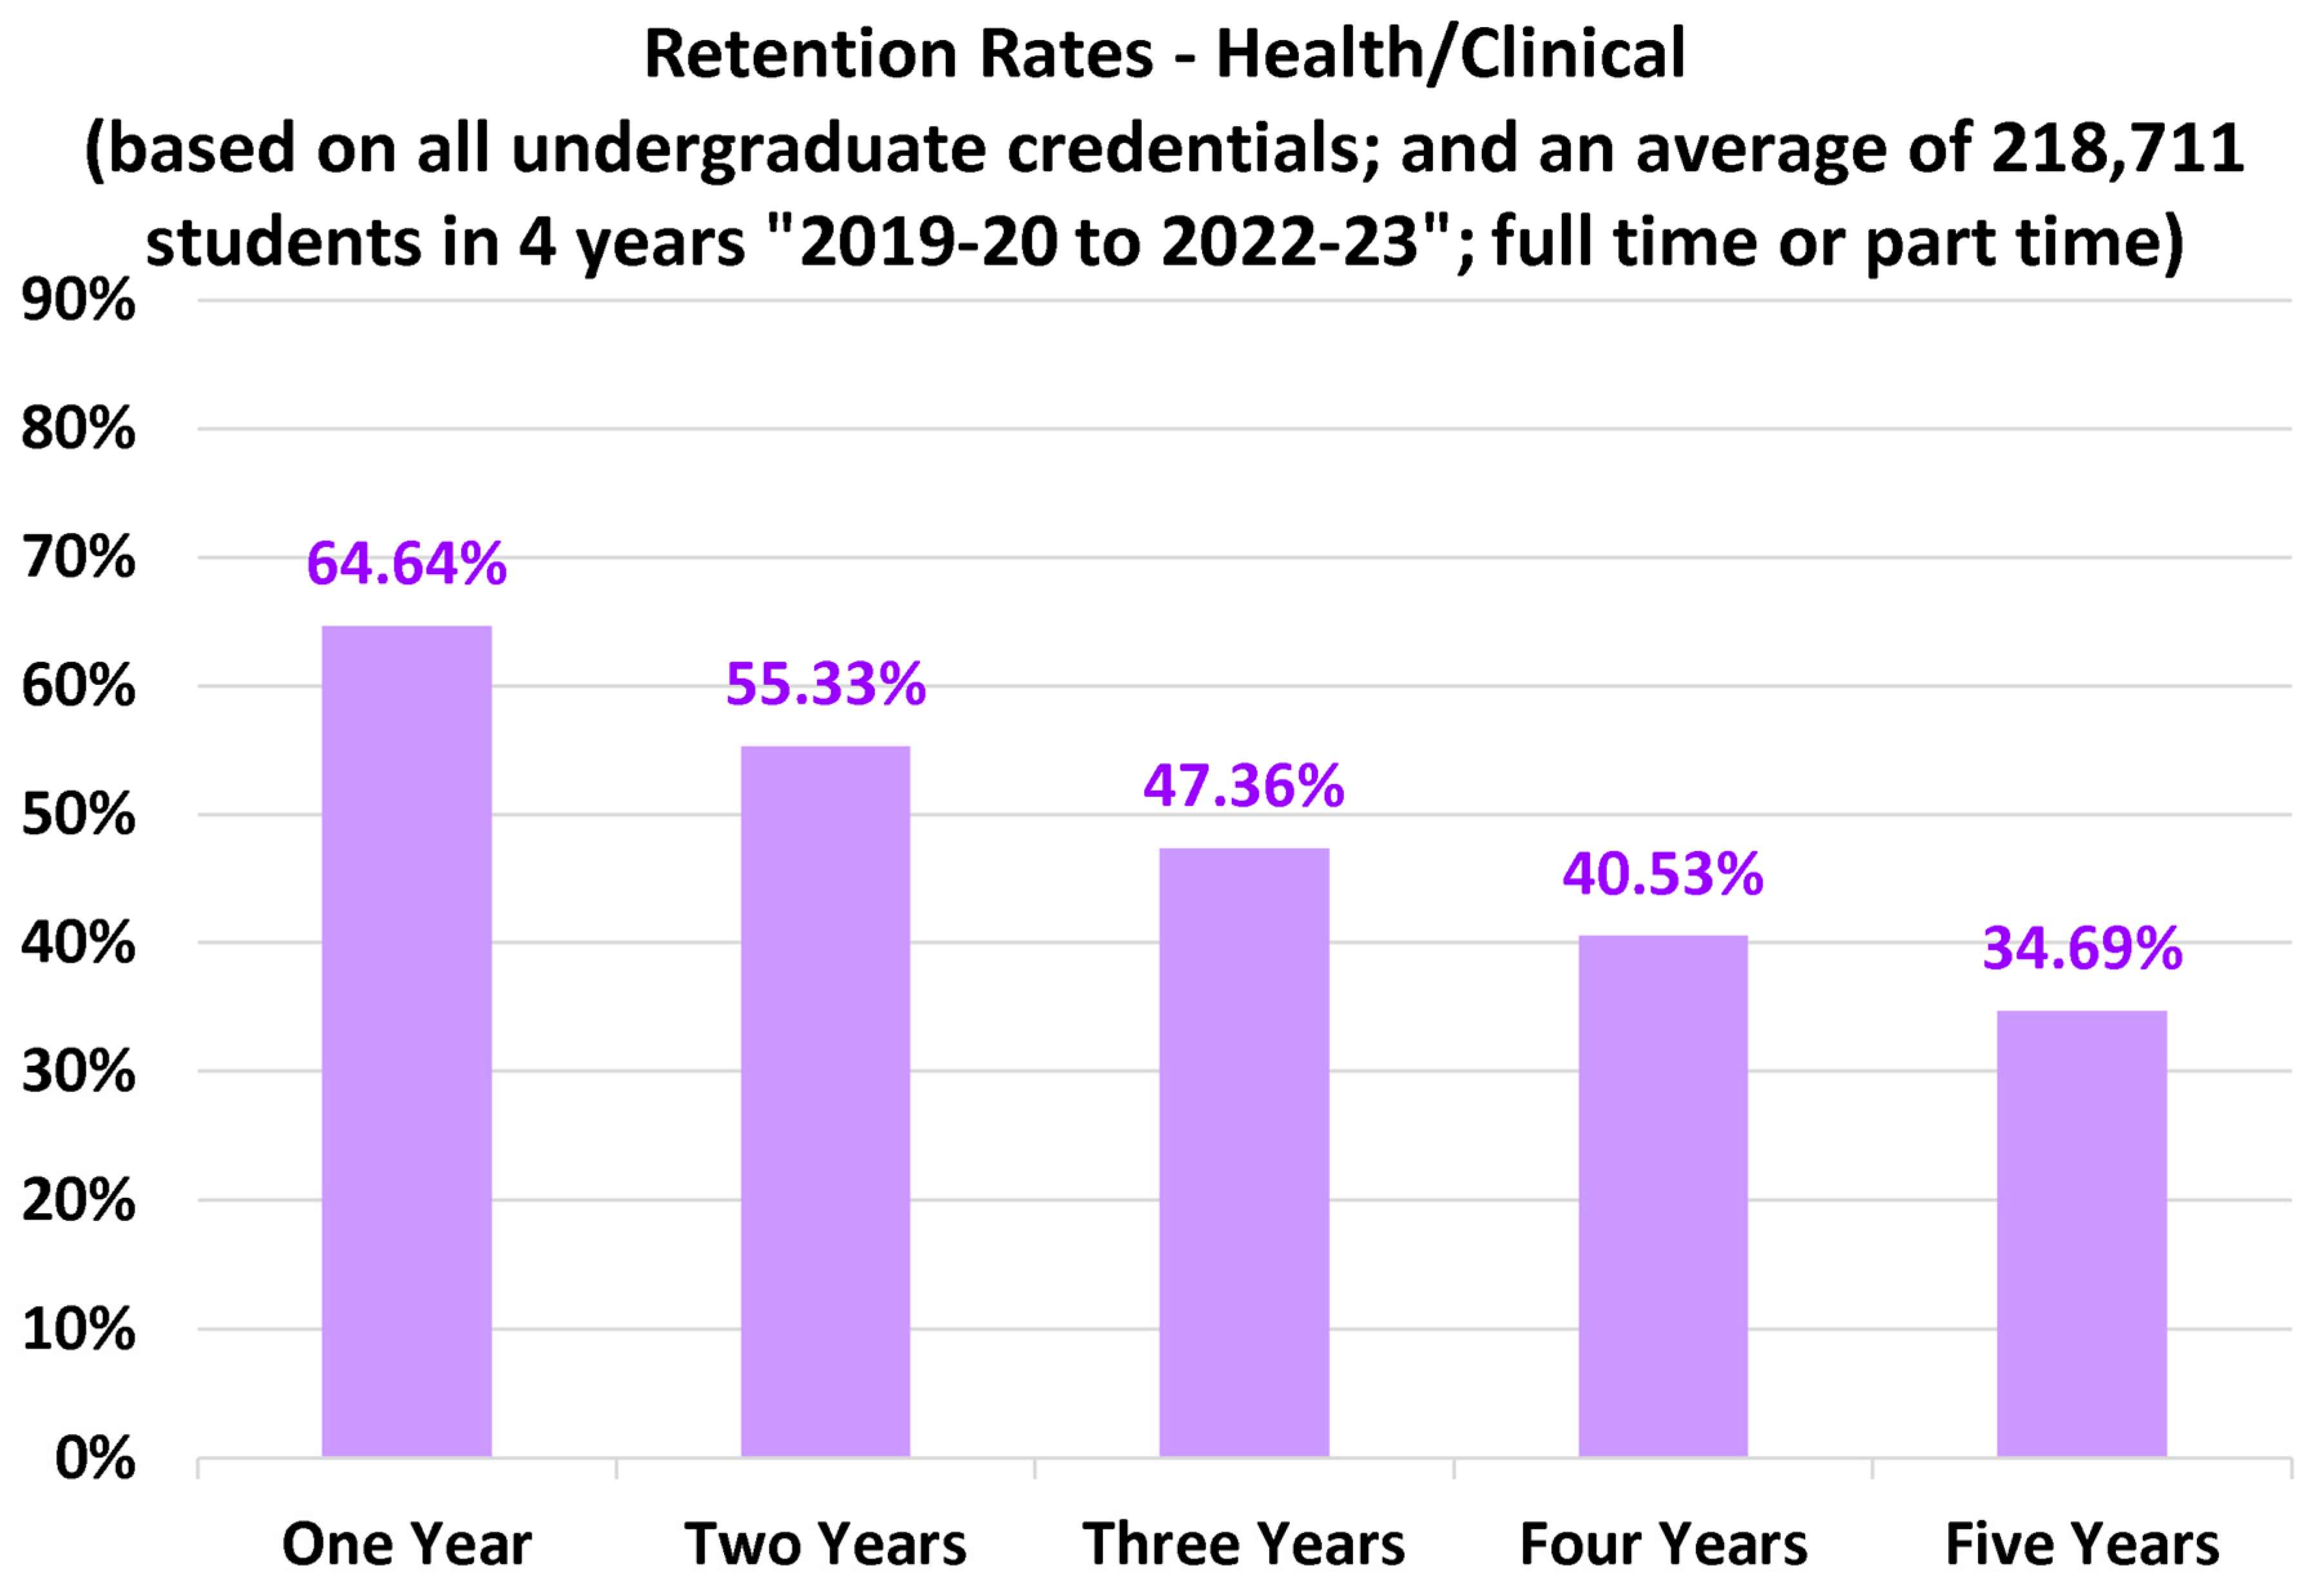
Figure 9.
Suggested law benchmarking retention rates at five durations (from one year to five years after admission).
Figure 9.
Suggested law benchmarking retention rates at five durations (from one year to five years after admission).
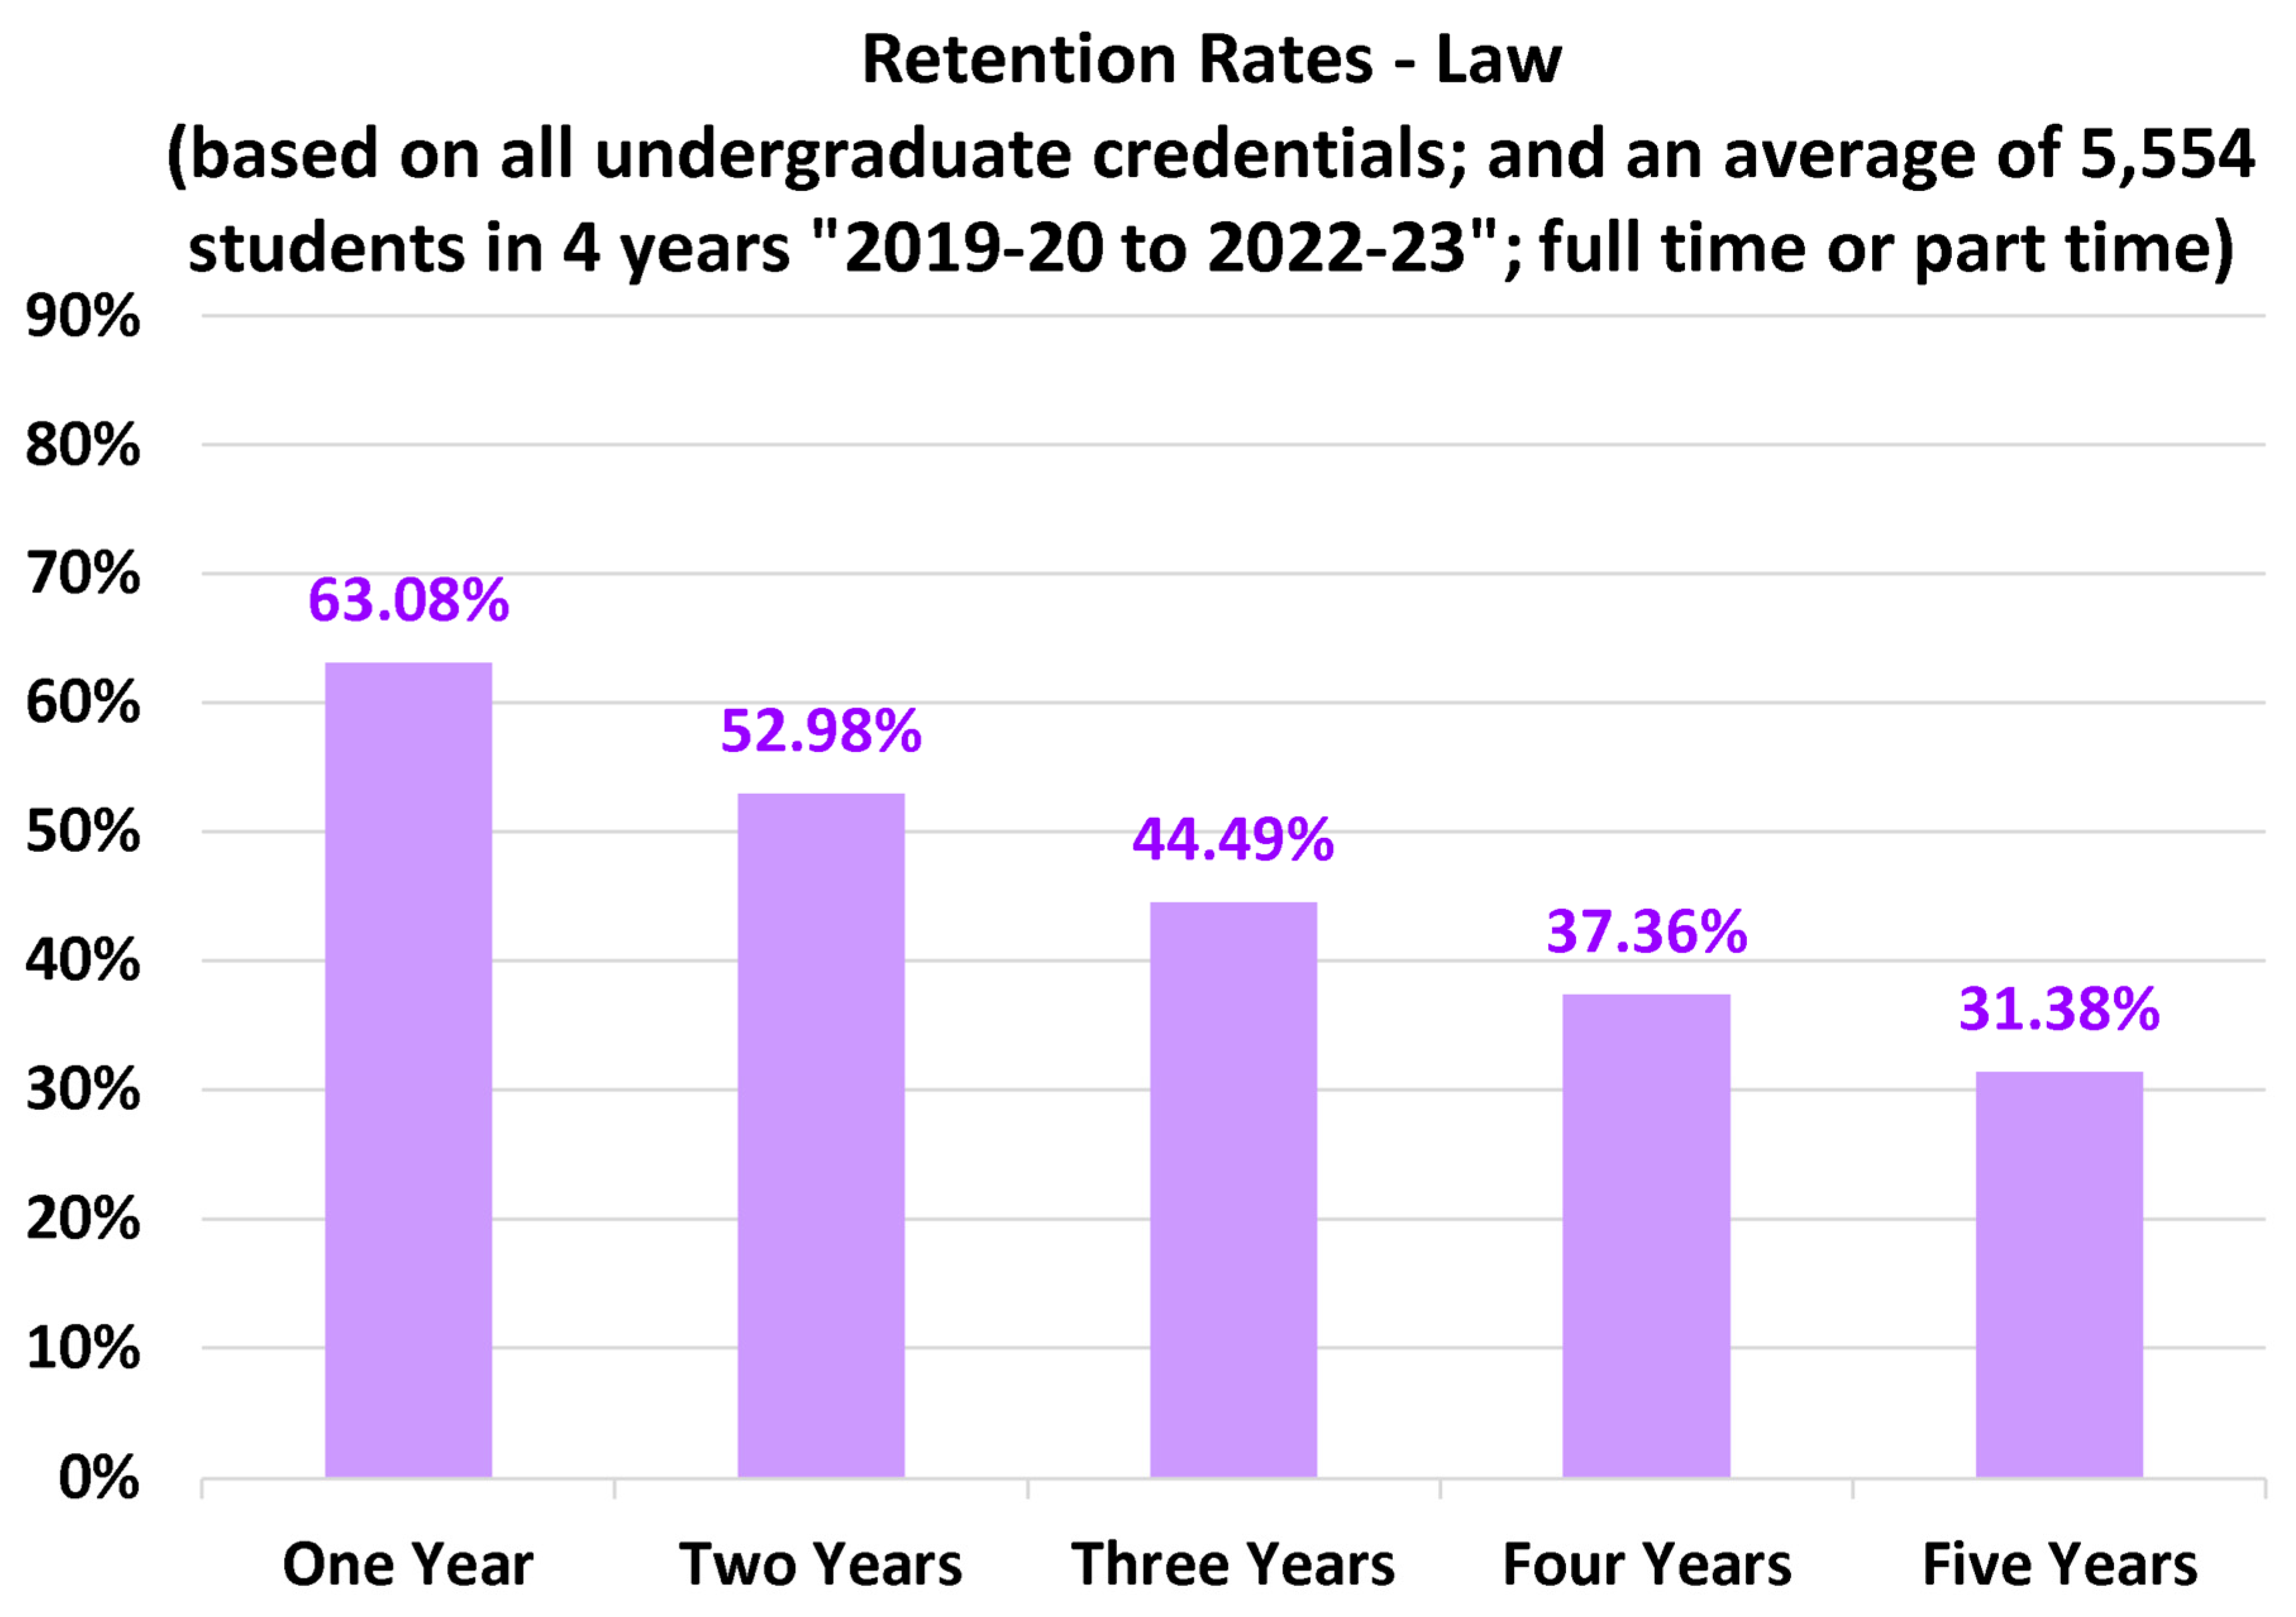
Figure 10.
Suggested overall benchmarking progression rates at four durations (from one year to four years after admission). The foundation-year adjustment is for demonstration only (actually not applicable here).
Figure 10.
Suggested overall benchmarking progression rates at four durations (from one year to four years after admission). The foundation-year adjustment is for demonstration only (actually not applicable here).
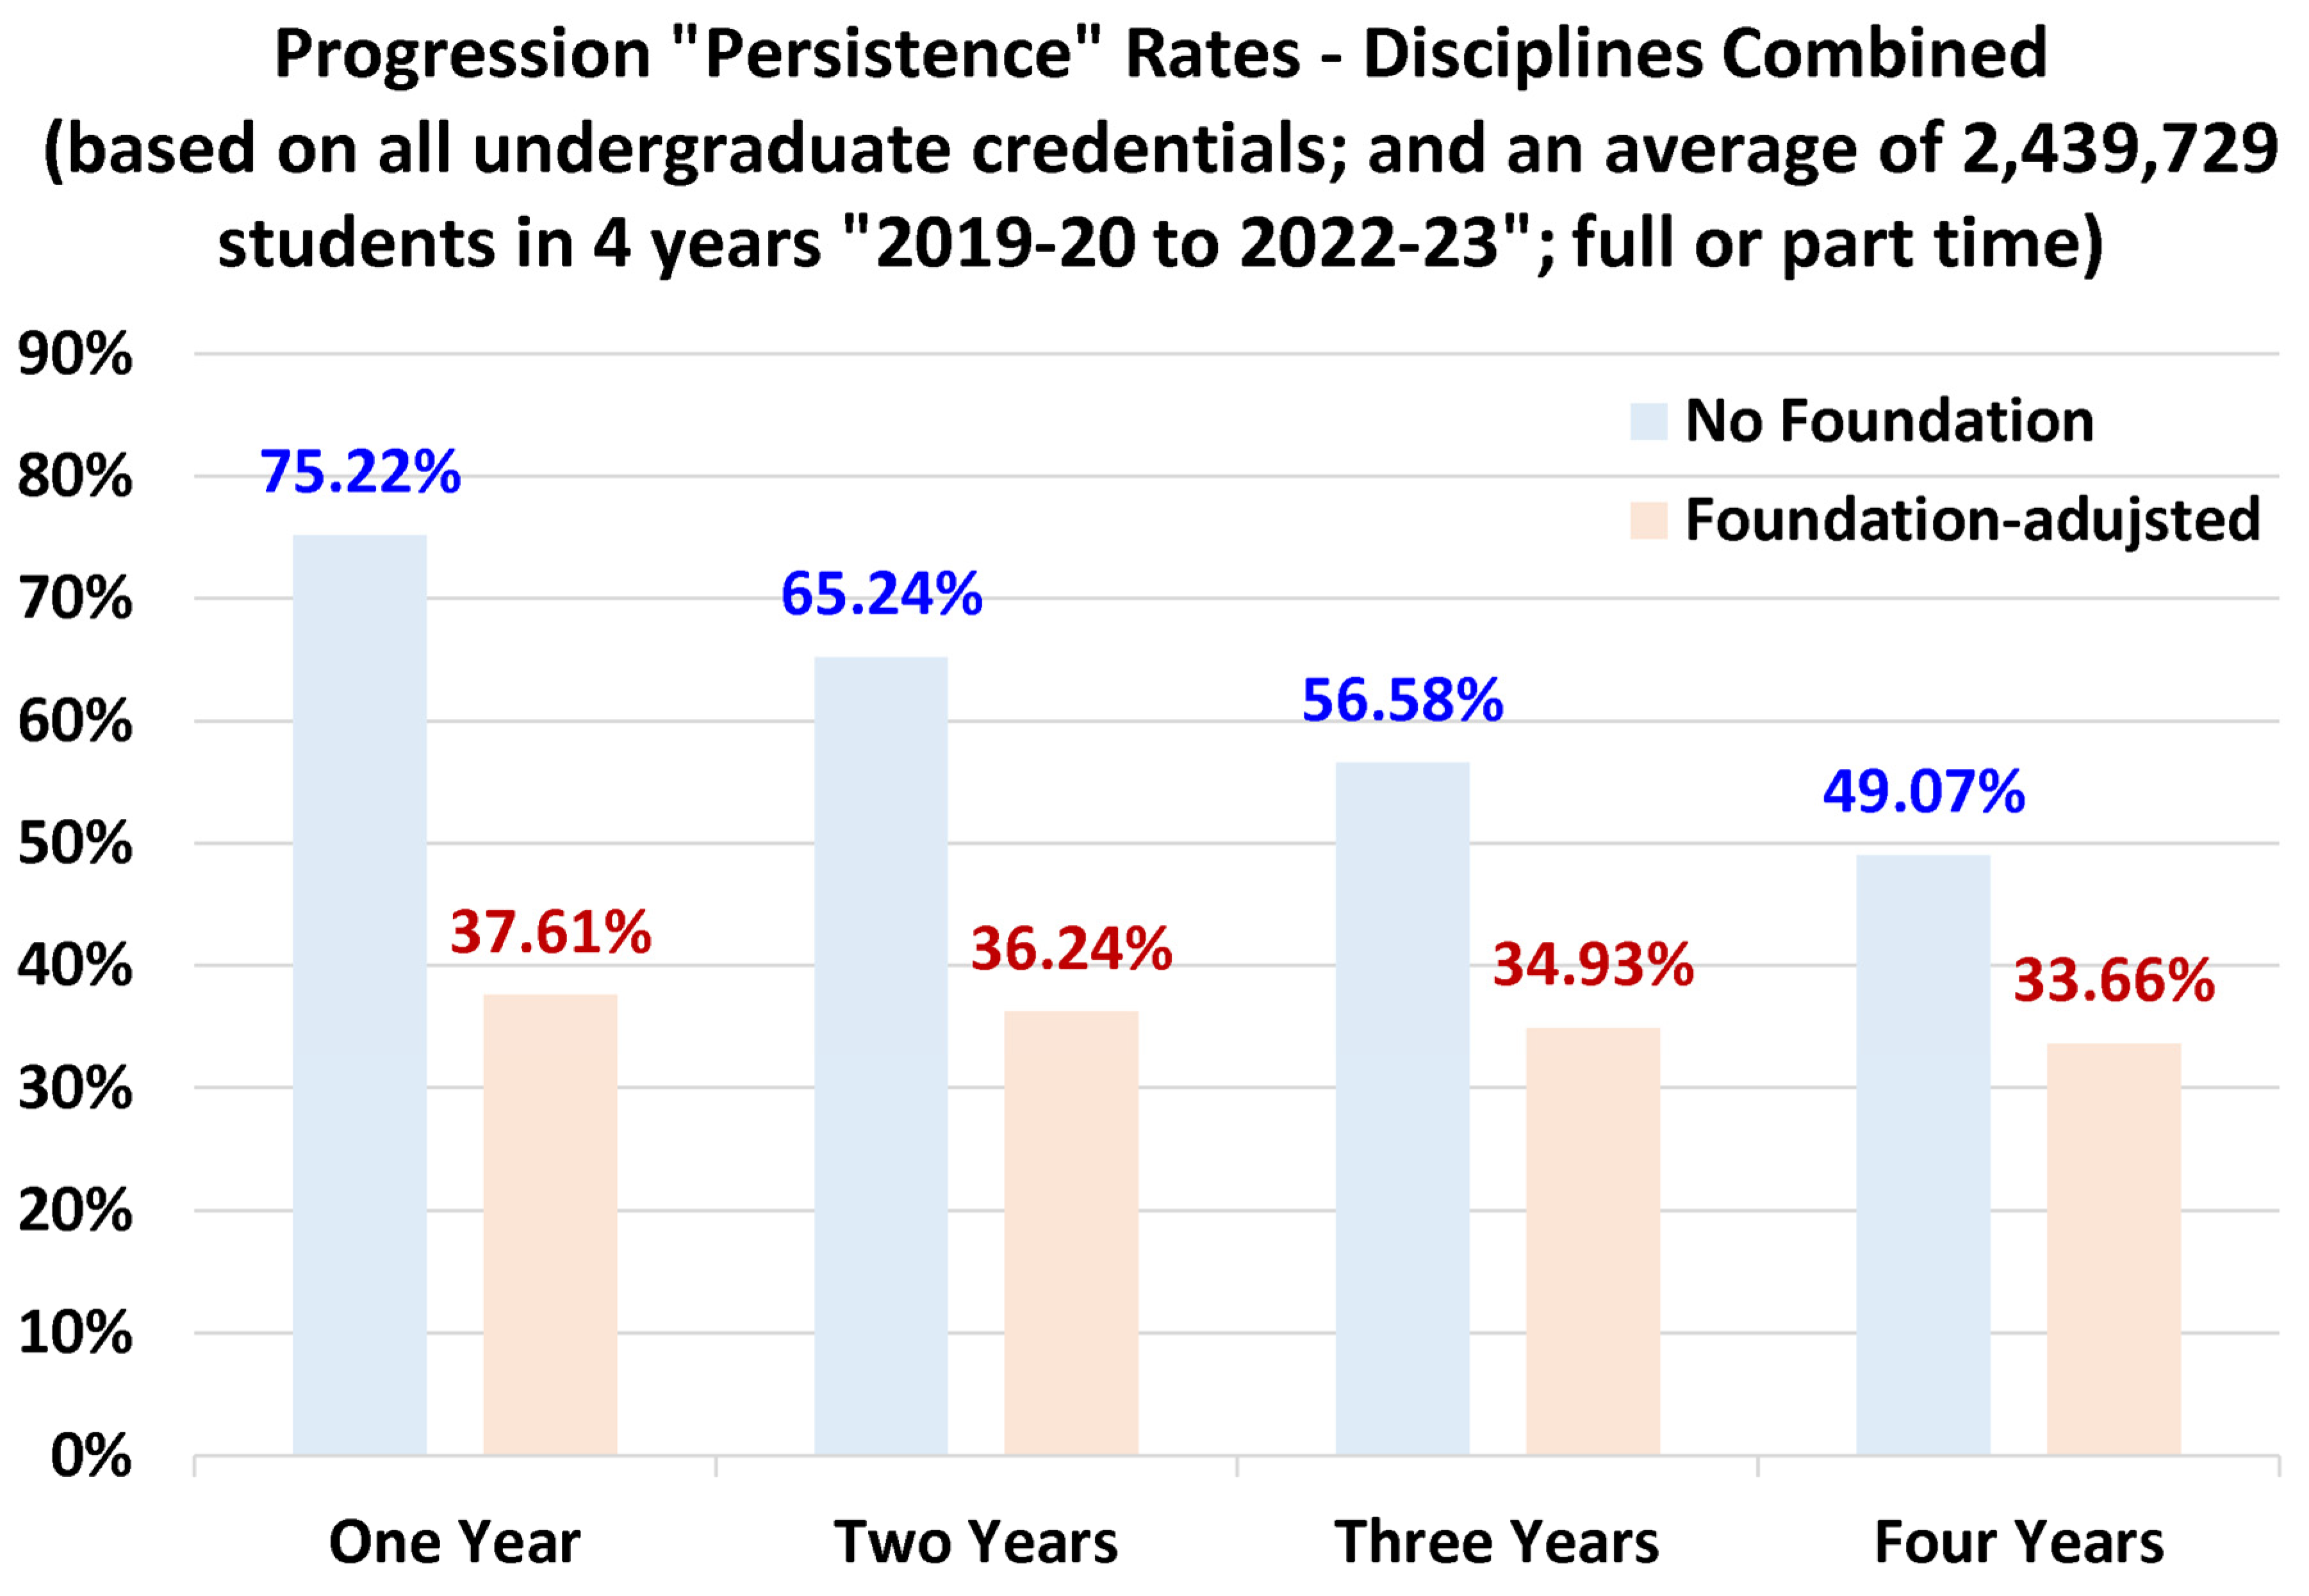
Figure 11.
Suggested architecture benchmarking progression rates at four durations (from one year to four years after admission). The foundation-year adjustment is for demonstration only (actually not applicable here).
Figure 11.
Suggested architecture benchmarking progression rates at four durations (from one year to four years after admission). The foundation-year adjustment is for demonstration only (actually not applicable here).
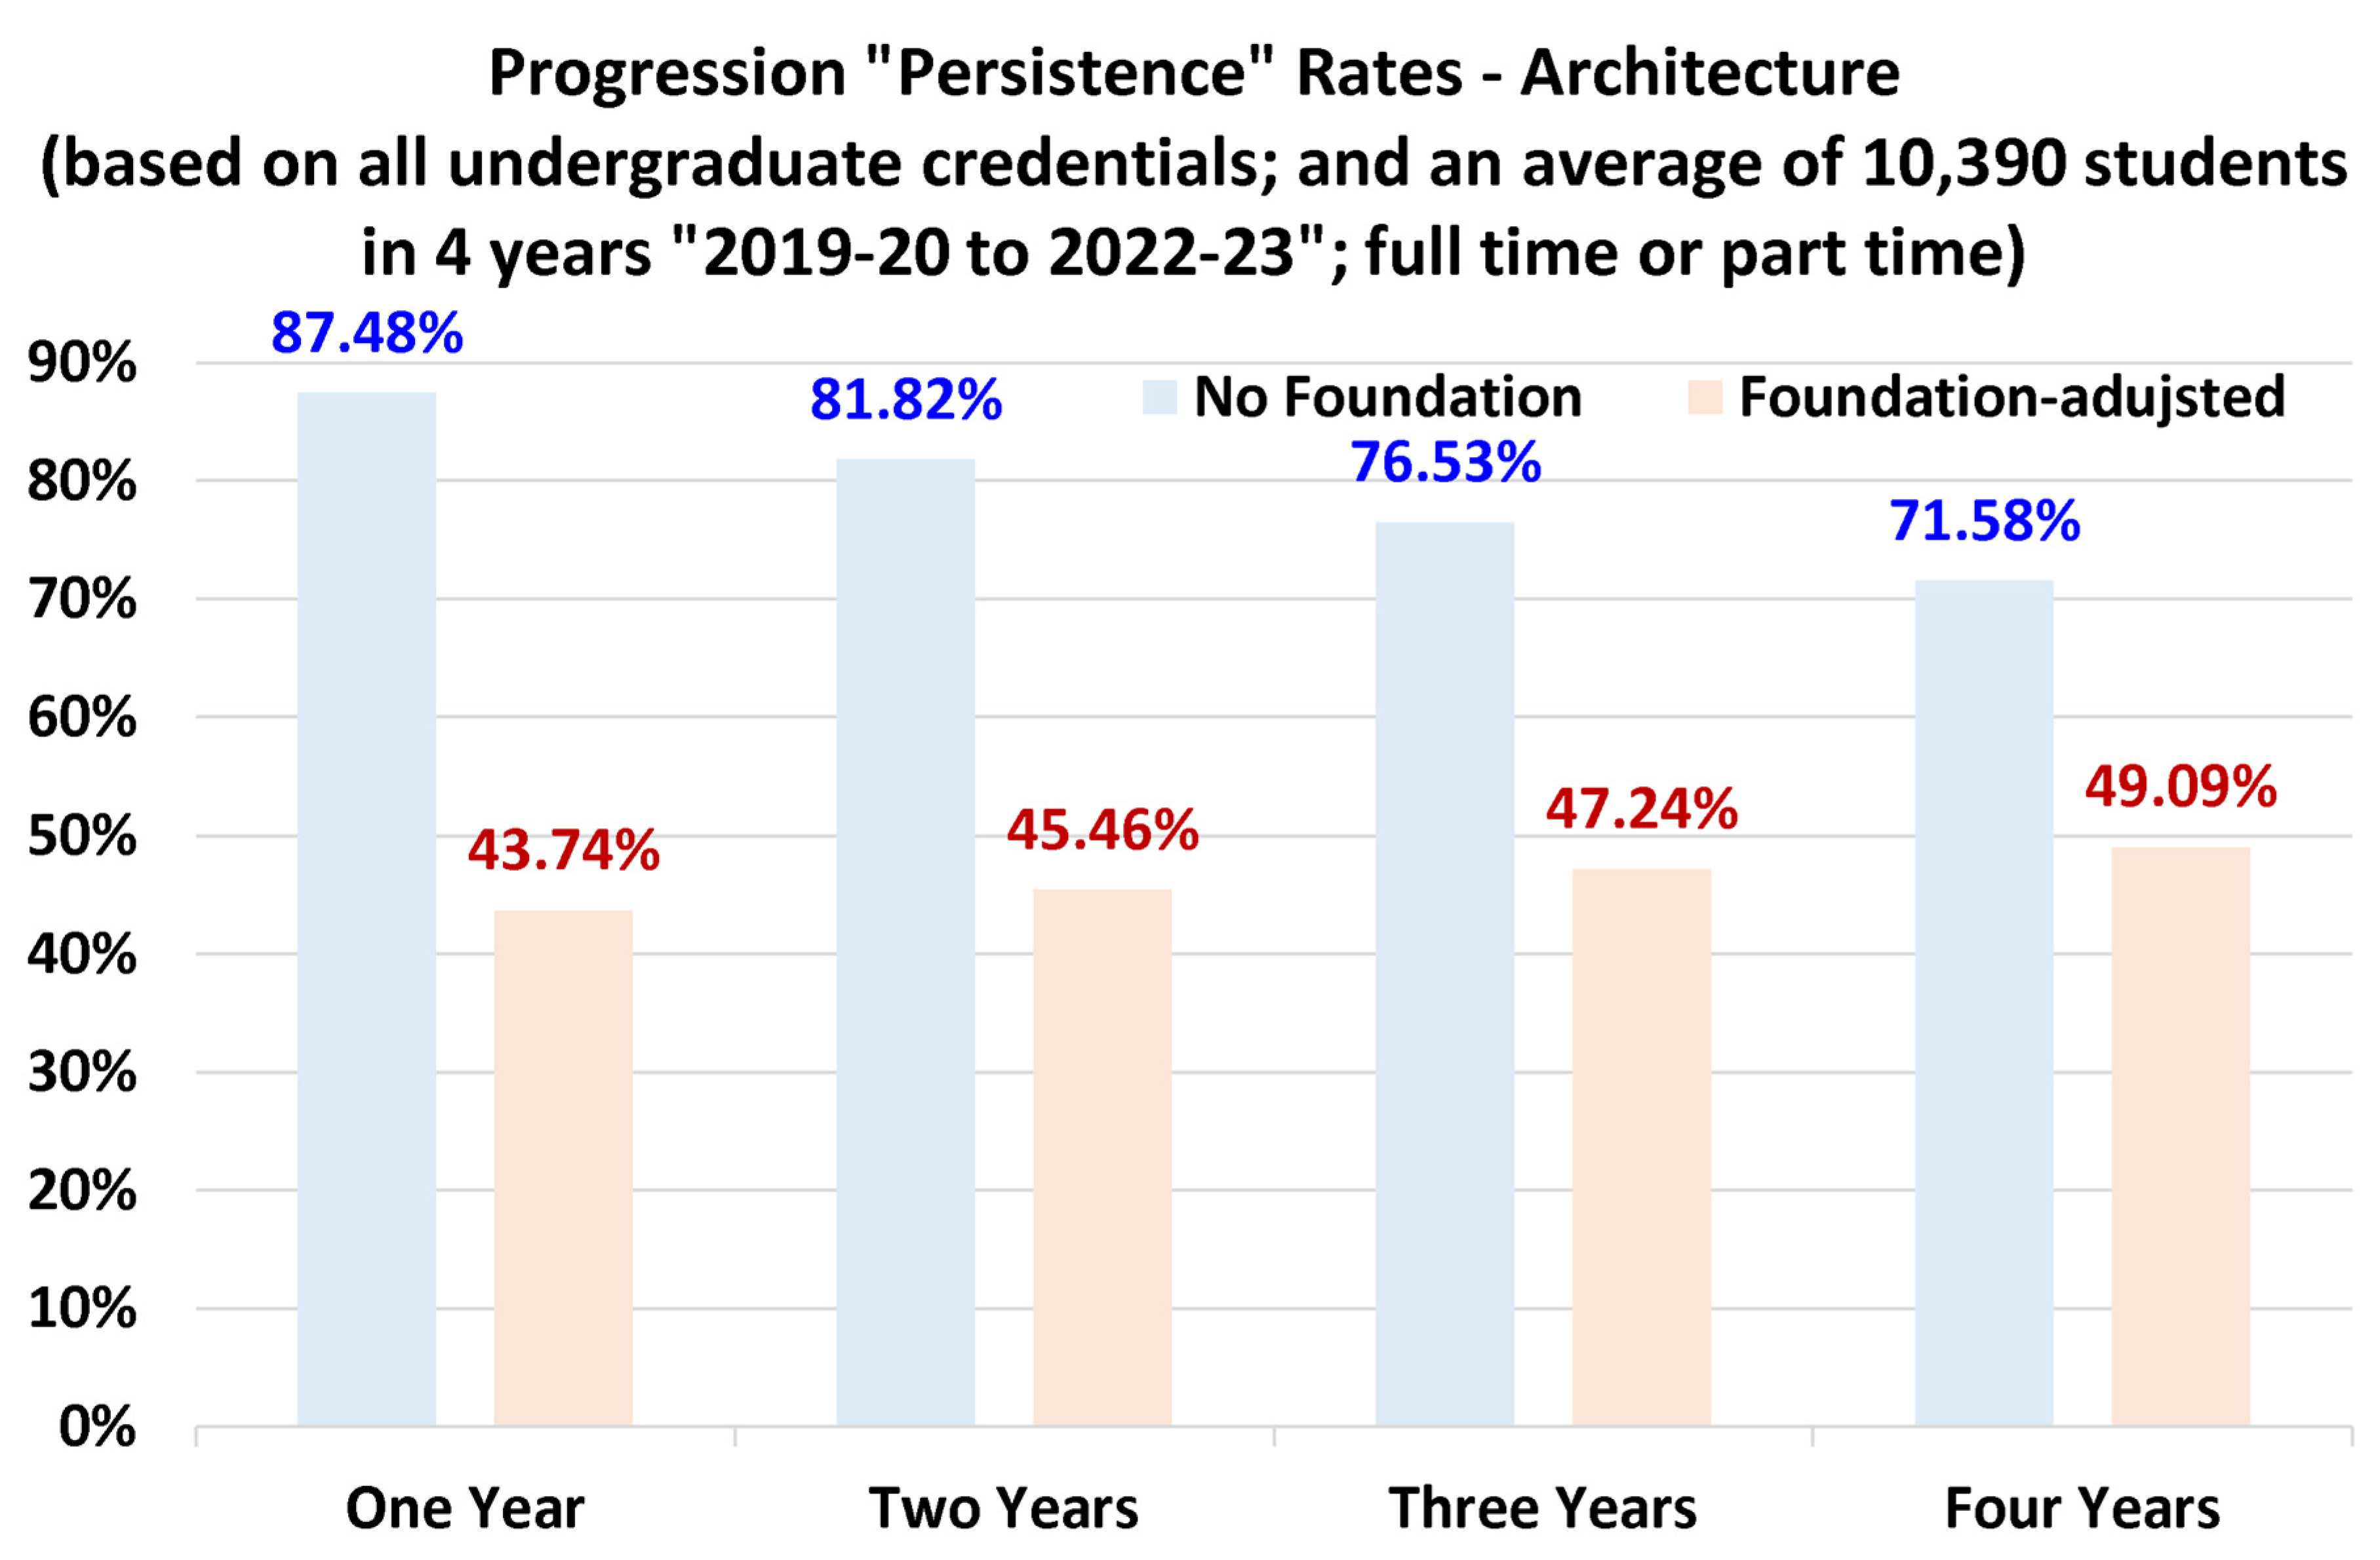
Figure 12.
Suggested business/management benchmarking progression rates at four durations (from one year to four years after admission). The foundation-year adjustment is for demonstration only (actually not applicable here).
Figure 12.
Suggested business/management benchmarking progression rates at four durations (from one year to four years after admission). The foundation-year adjustment is for demonstration only (actually not applicable here).
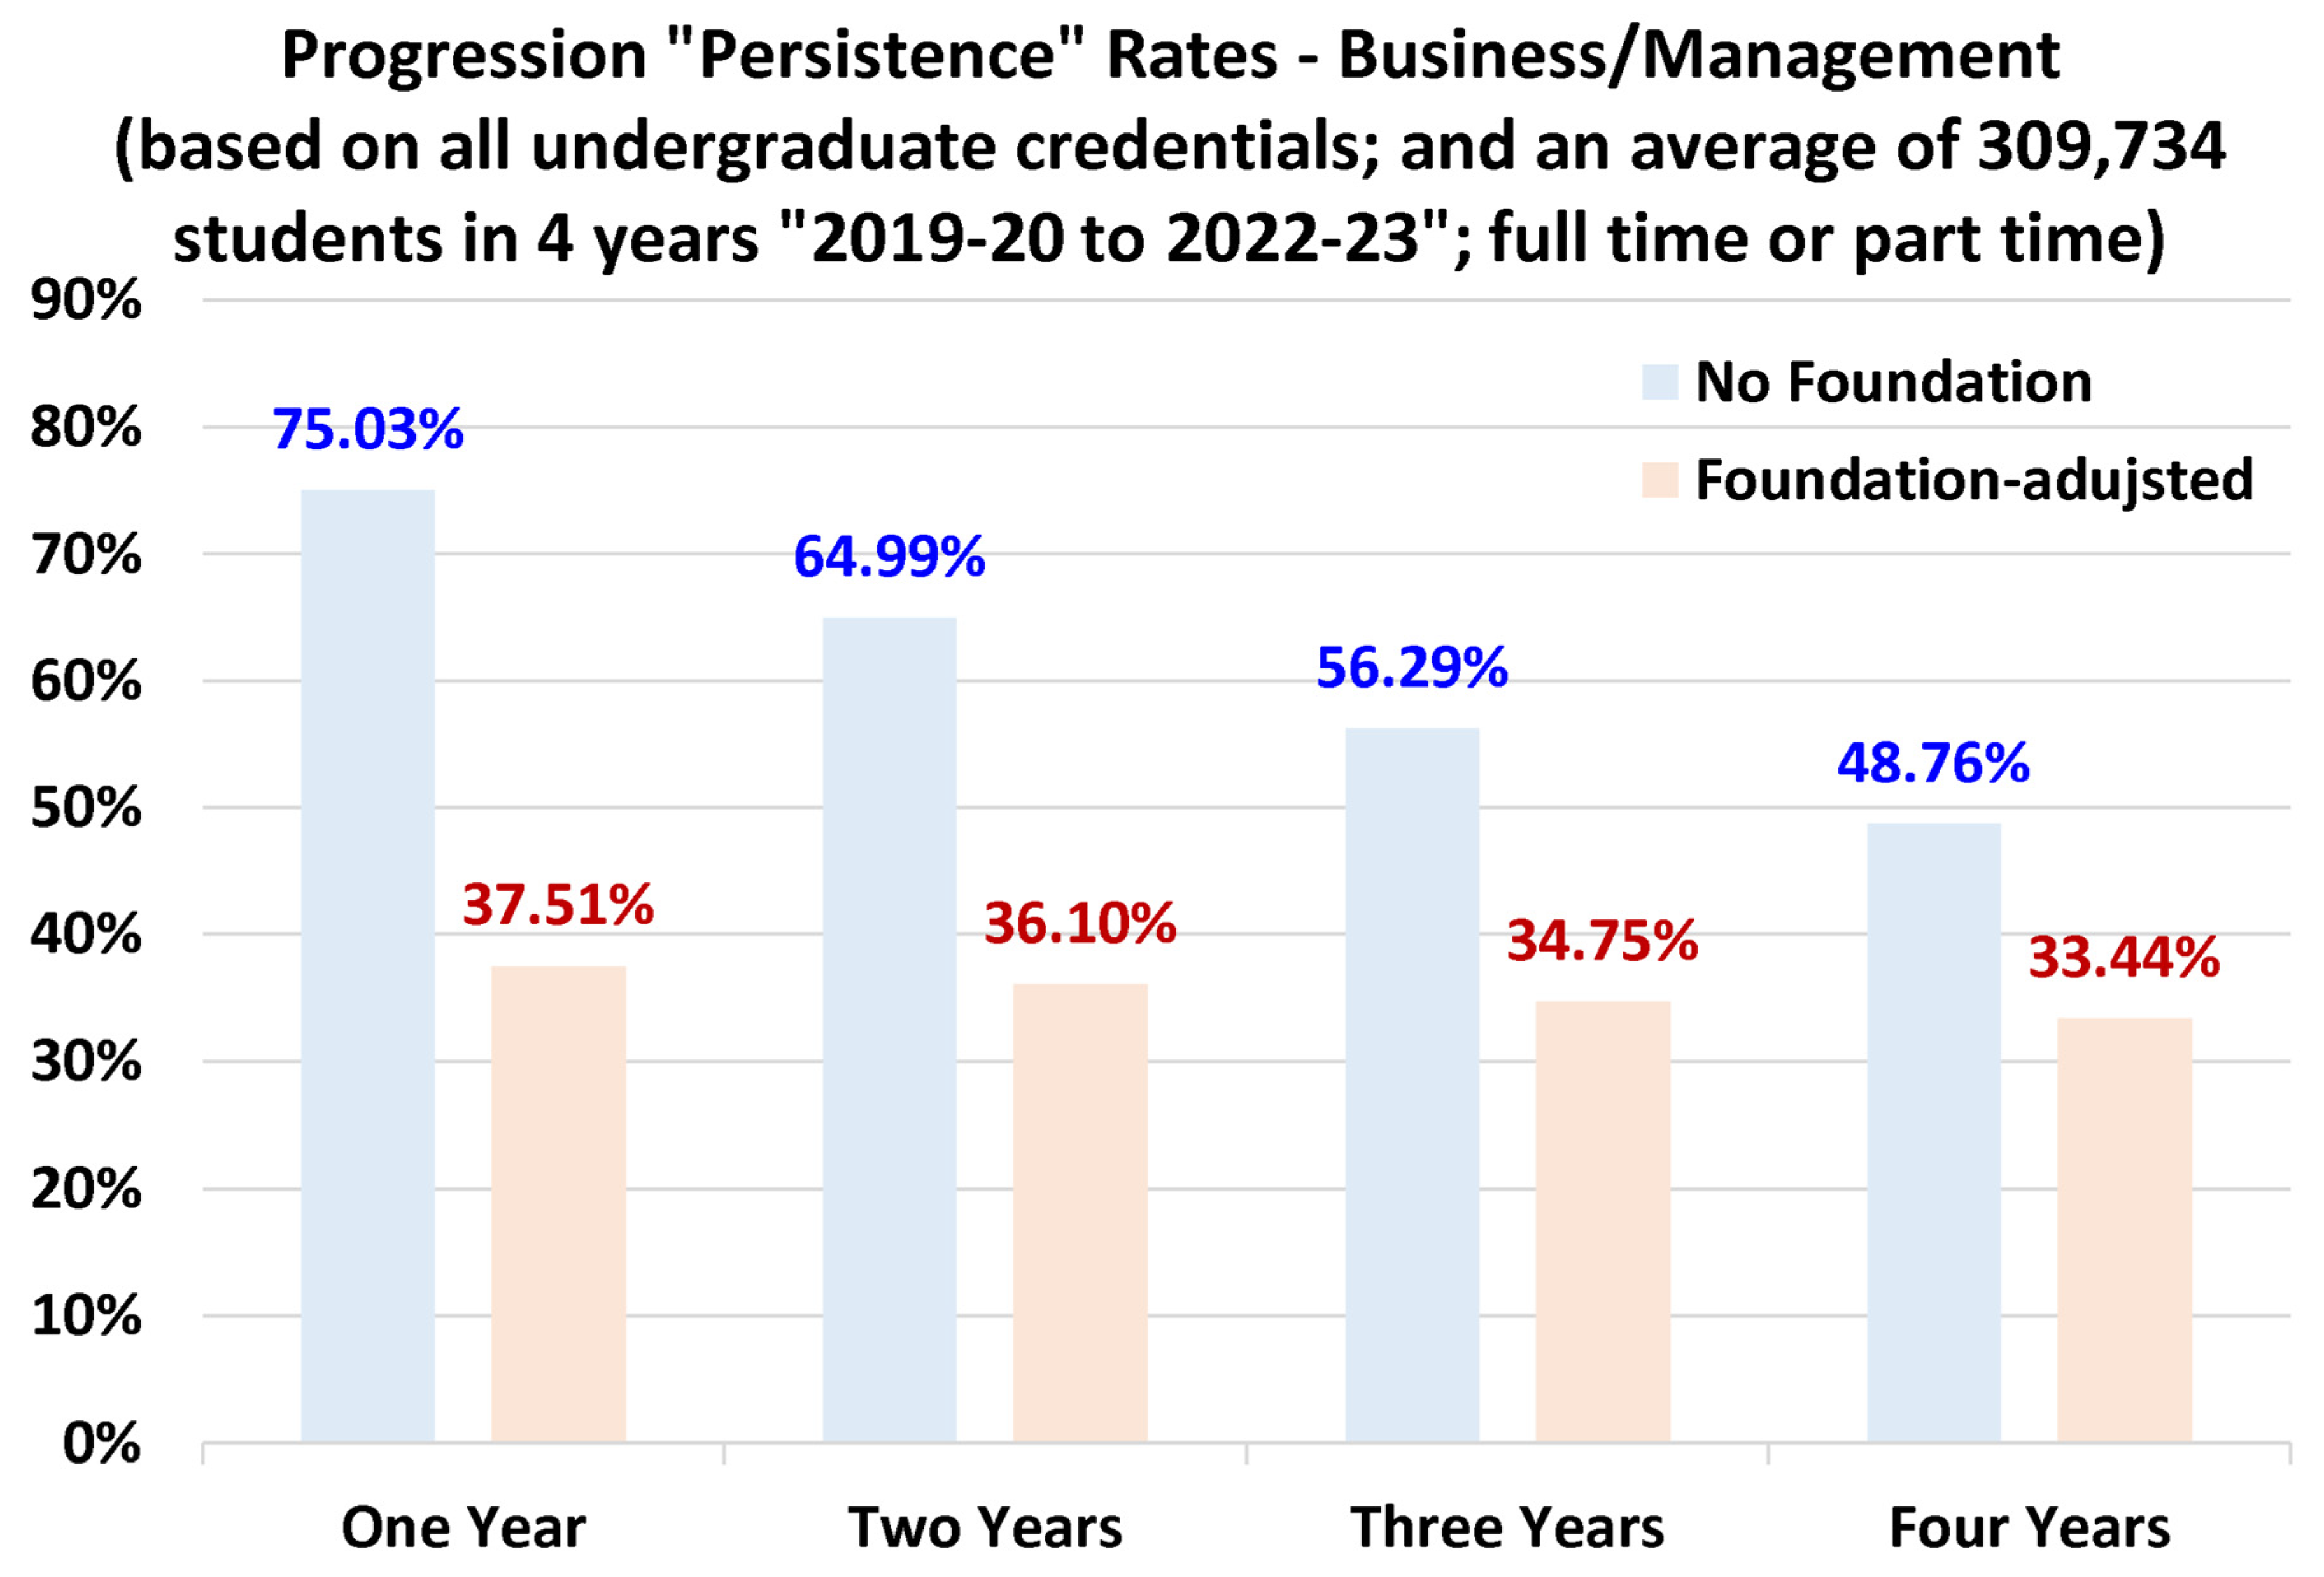
Figure 13.
Suggested computer/information benchmarking progression rates at four durations (from one year to four years after admission). The foundation-year adjustment is for demonstration only (actually not applicable here).
Figure 13.
Suggested computer/information benchmarking progression rates at four durations (from one year to four years after admission). The foundation-year adjustment is for demonstration only (actually not applicable here).
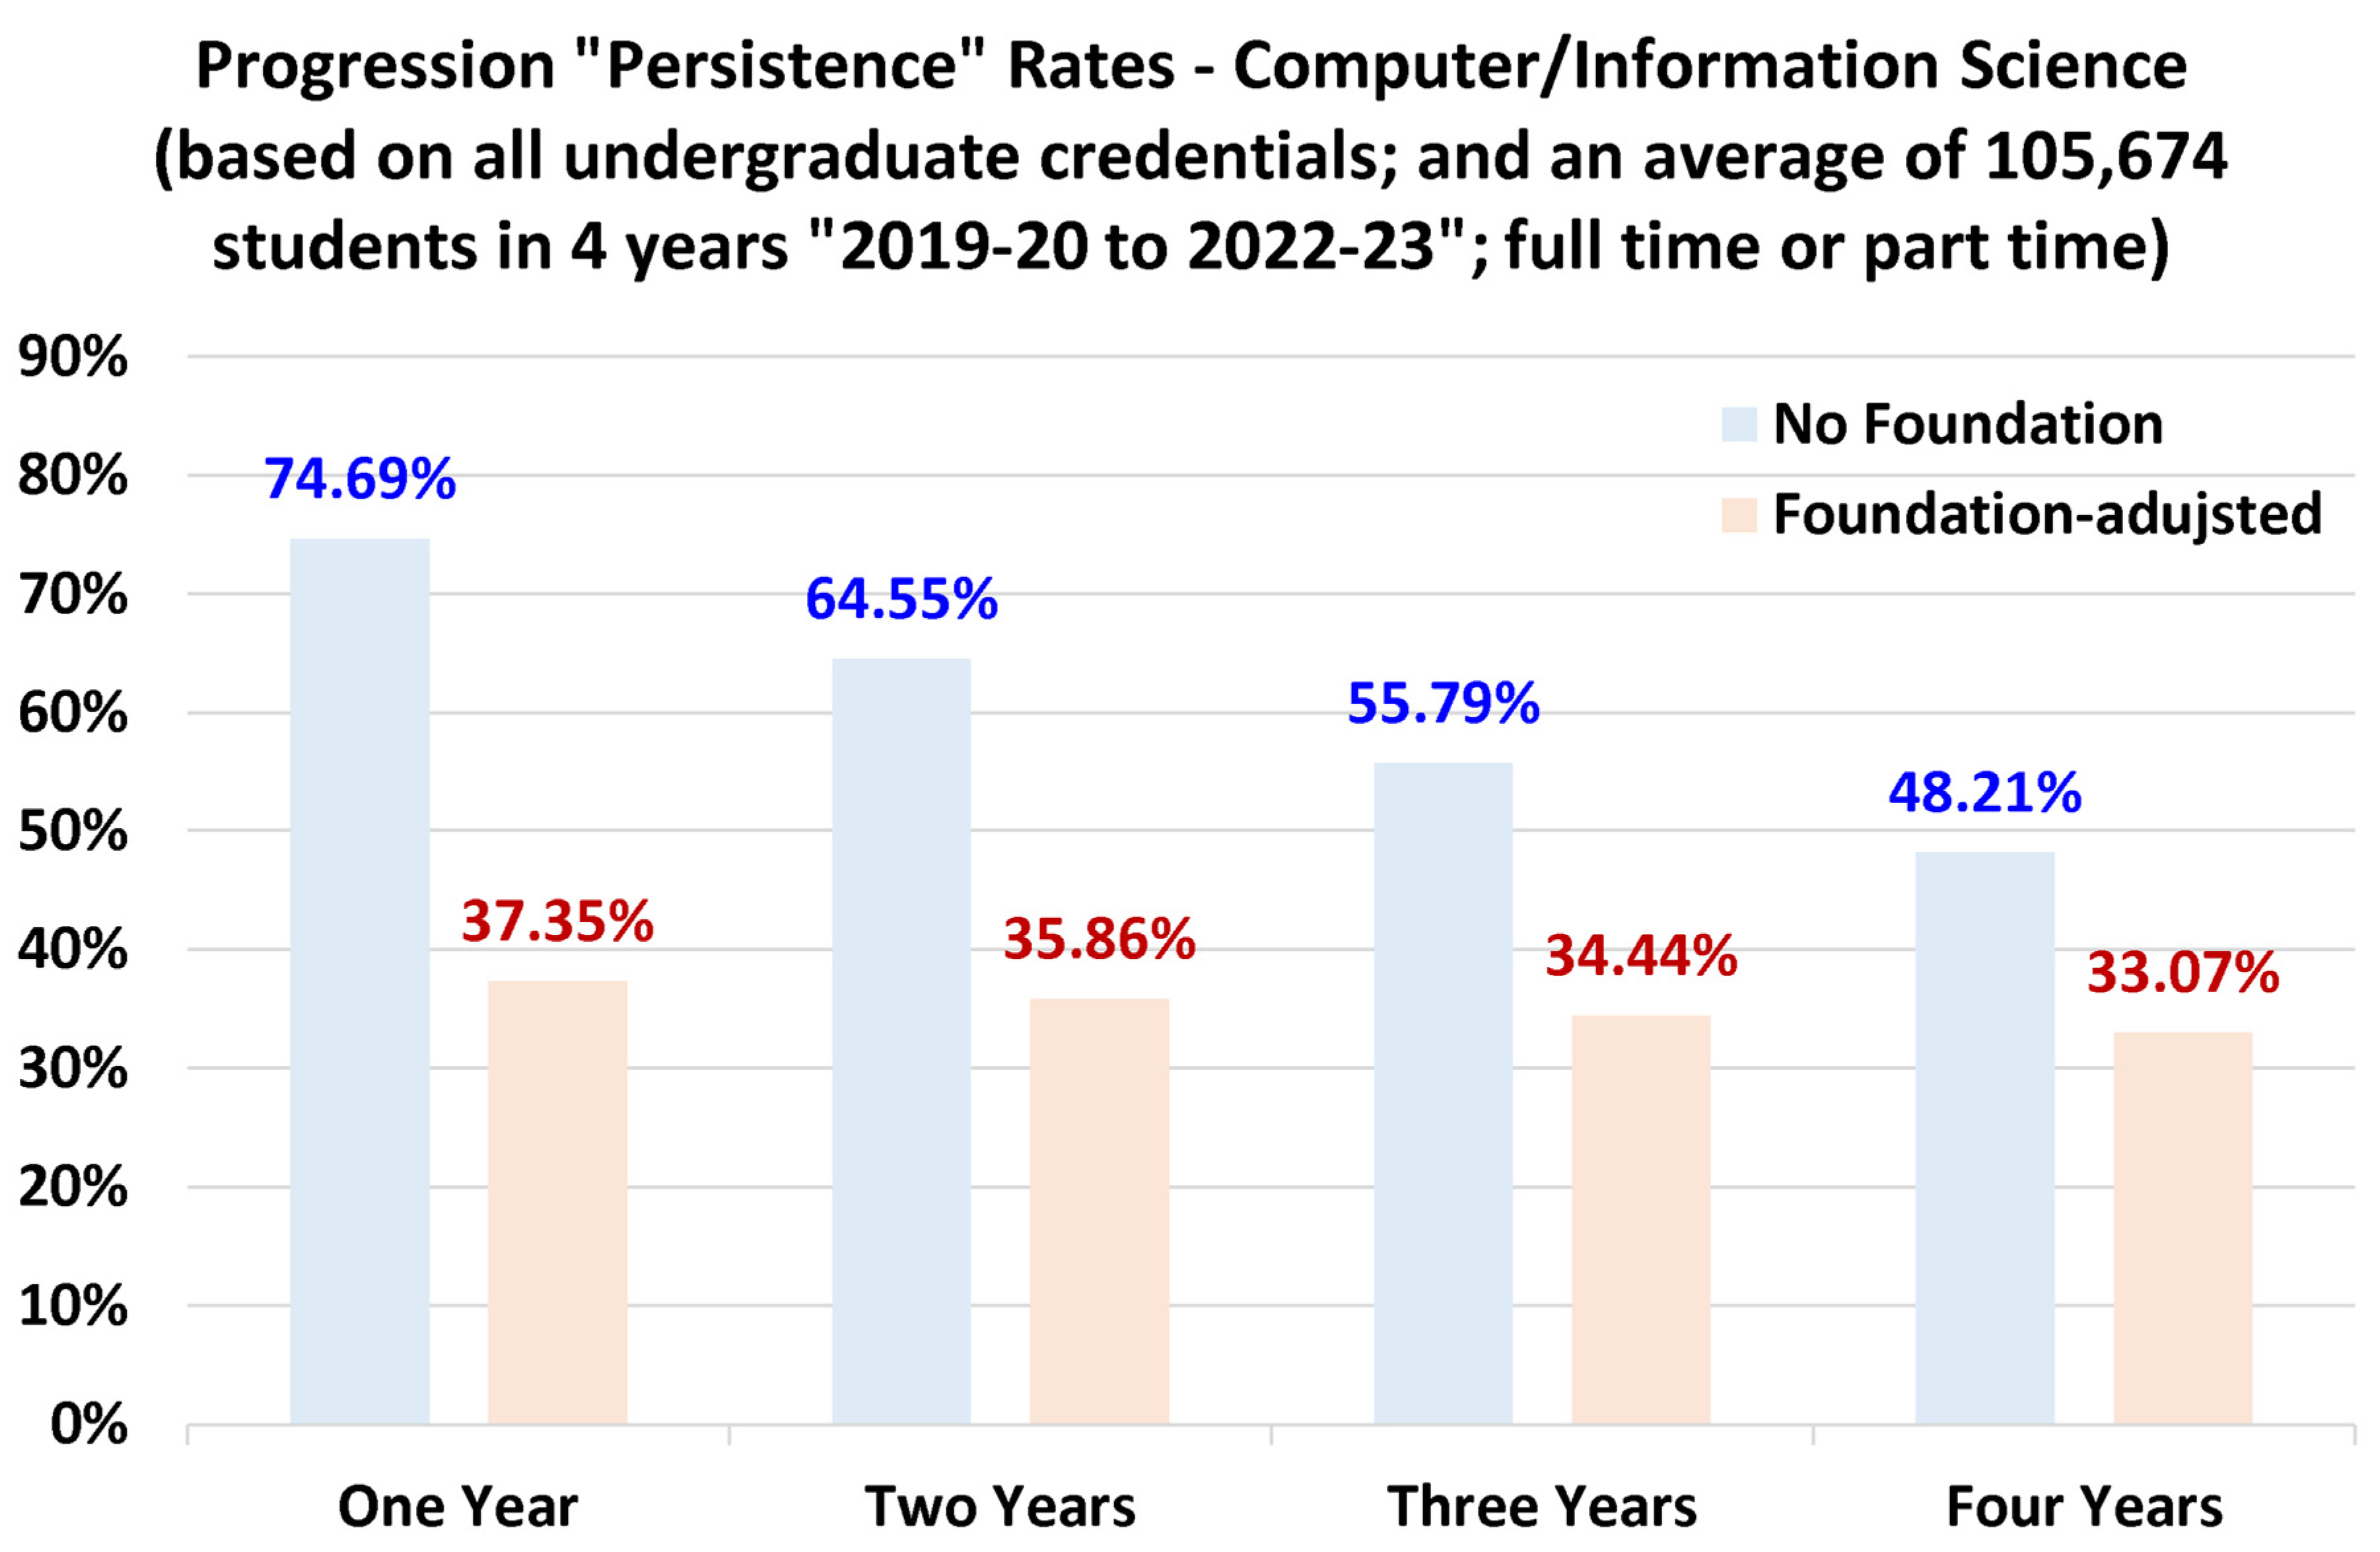
Figure 14.
Suggested engineering benchmarking progression rates at four durations (from one year to four years after admission). The foundation-year adjustment is for demonstration only (actually not applicable here).
Figure 14.
Suggested engineering benchmarking progression rates at four durations (from one year to four years after admission). The foundation-year adjustment is for demonstration only (actually not applicable here).
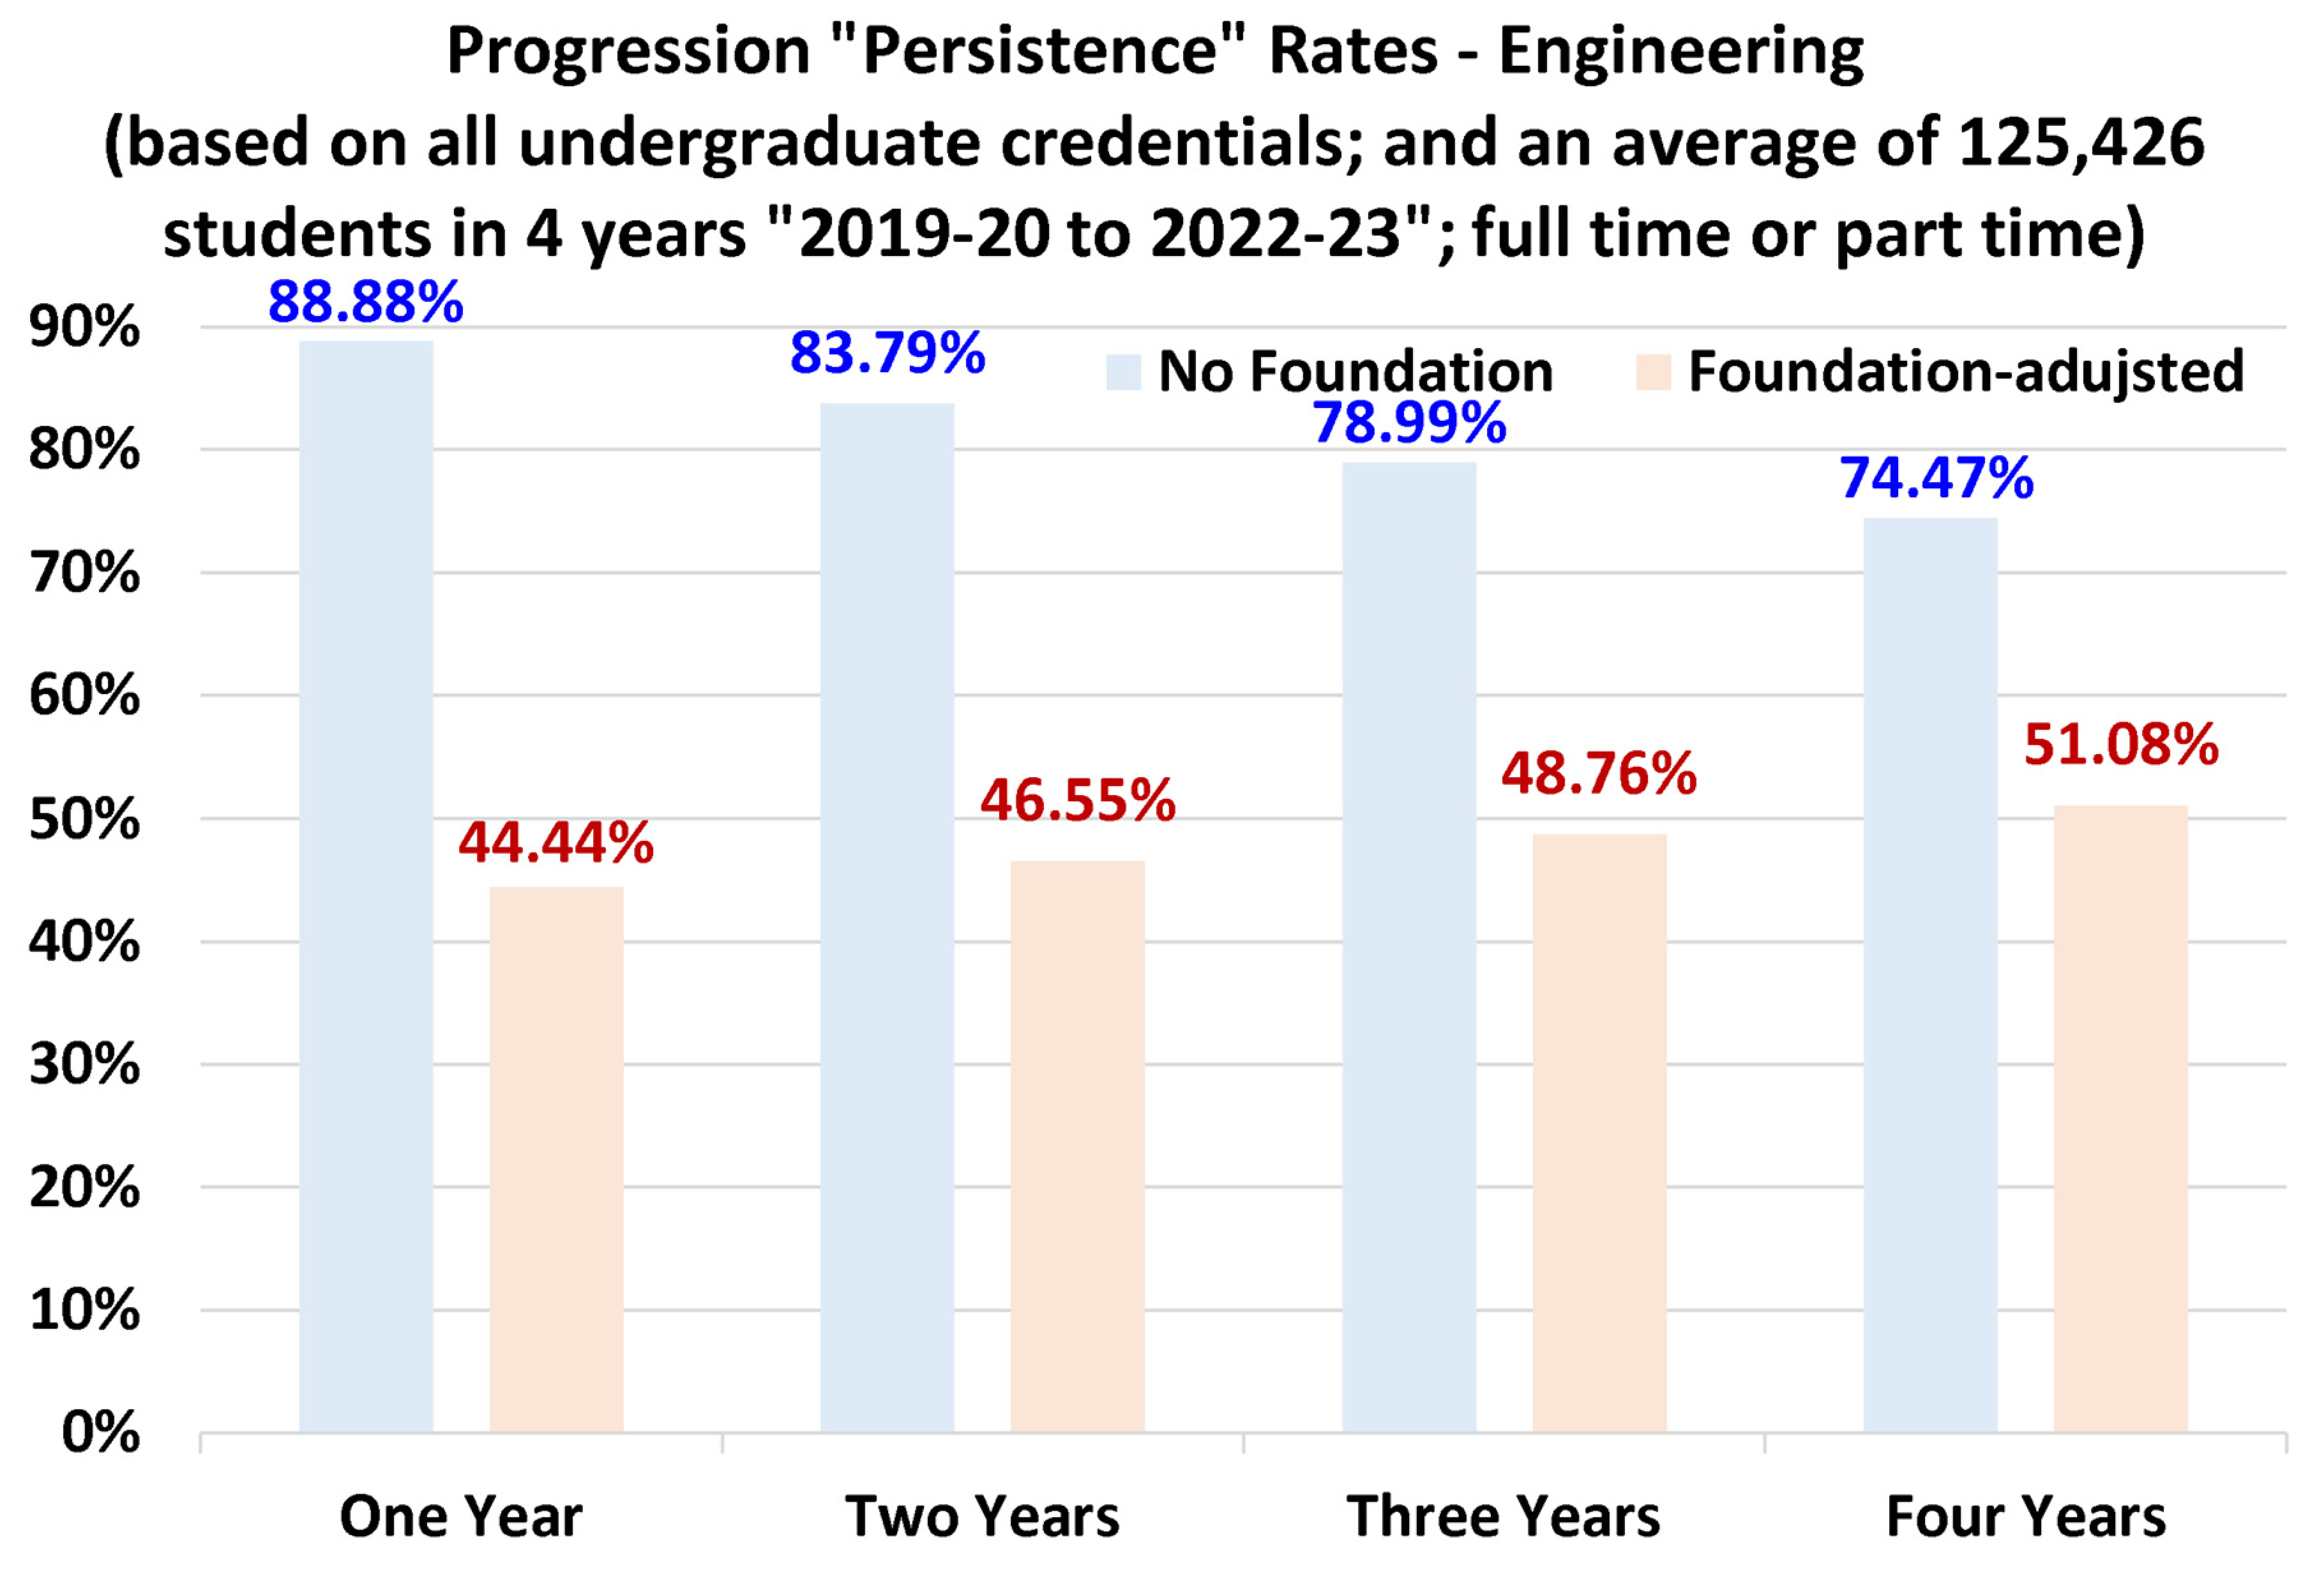
Figure 15.
Suggested engineering technology benchmarking progression rates at four durations (from one year to four years after admission). The foundation-year adjustment is for demonstration only (actually not applicable here).
Figure 15.
Suggested engineering technology benchmarking progression rates at four durations (from one year to four years after admission). The foundation-year adjustment is for demonstration only (actually not applicable here).
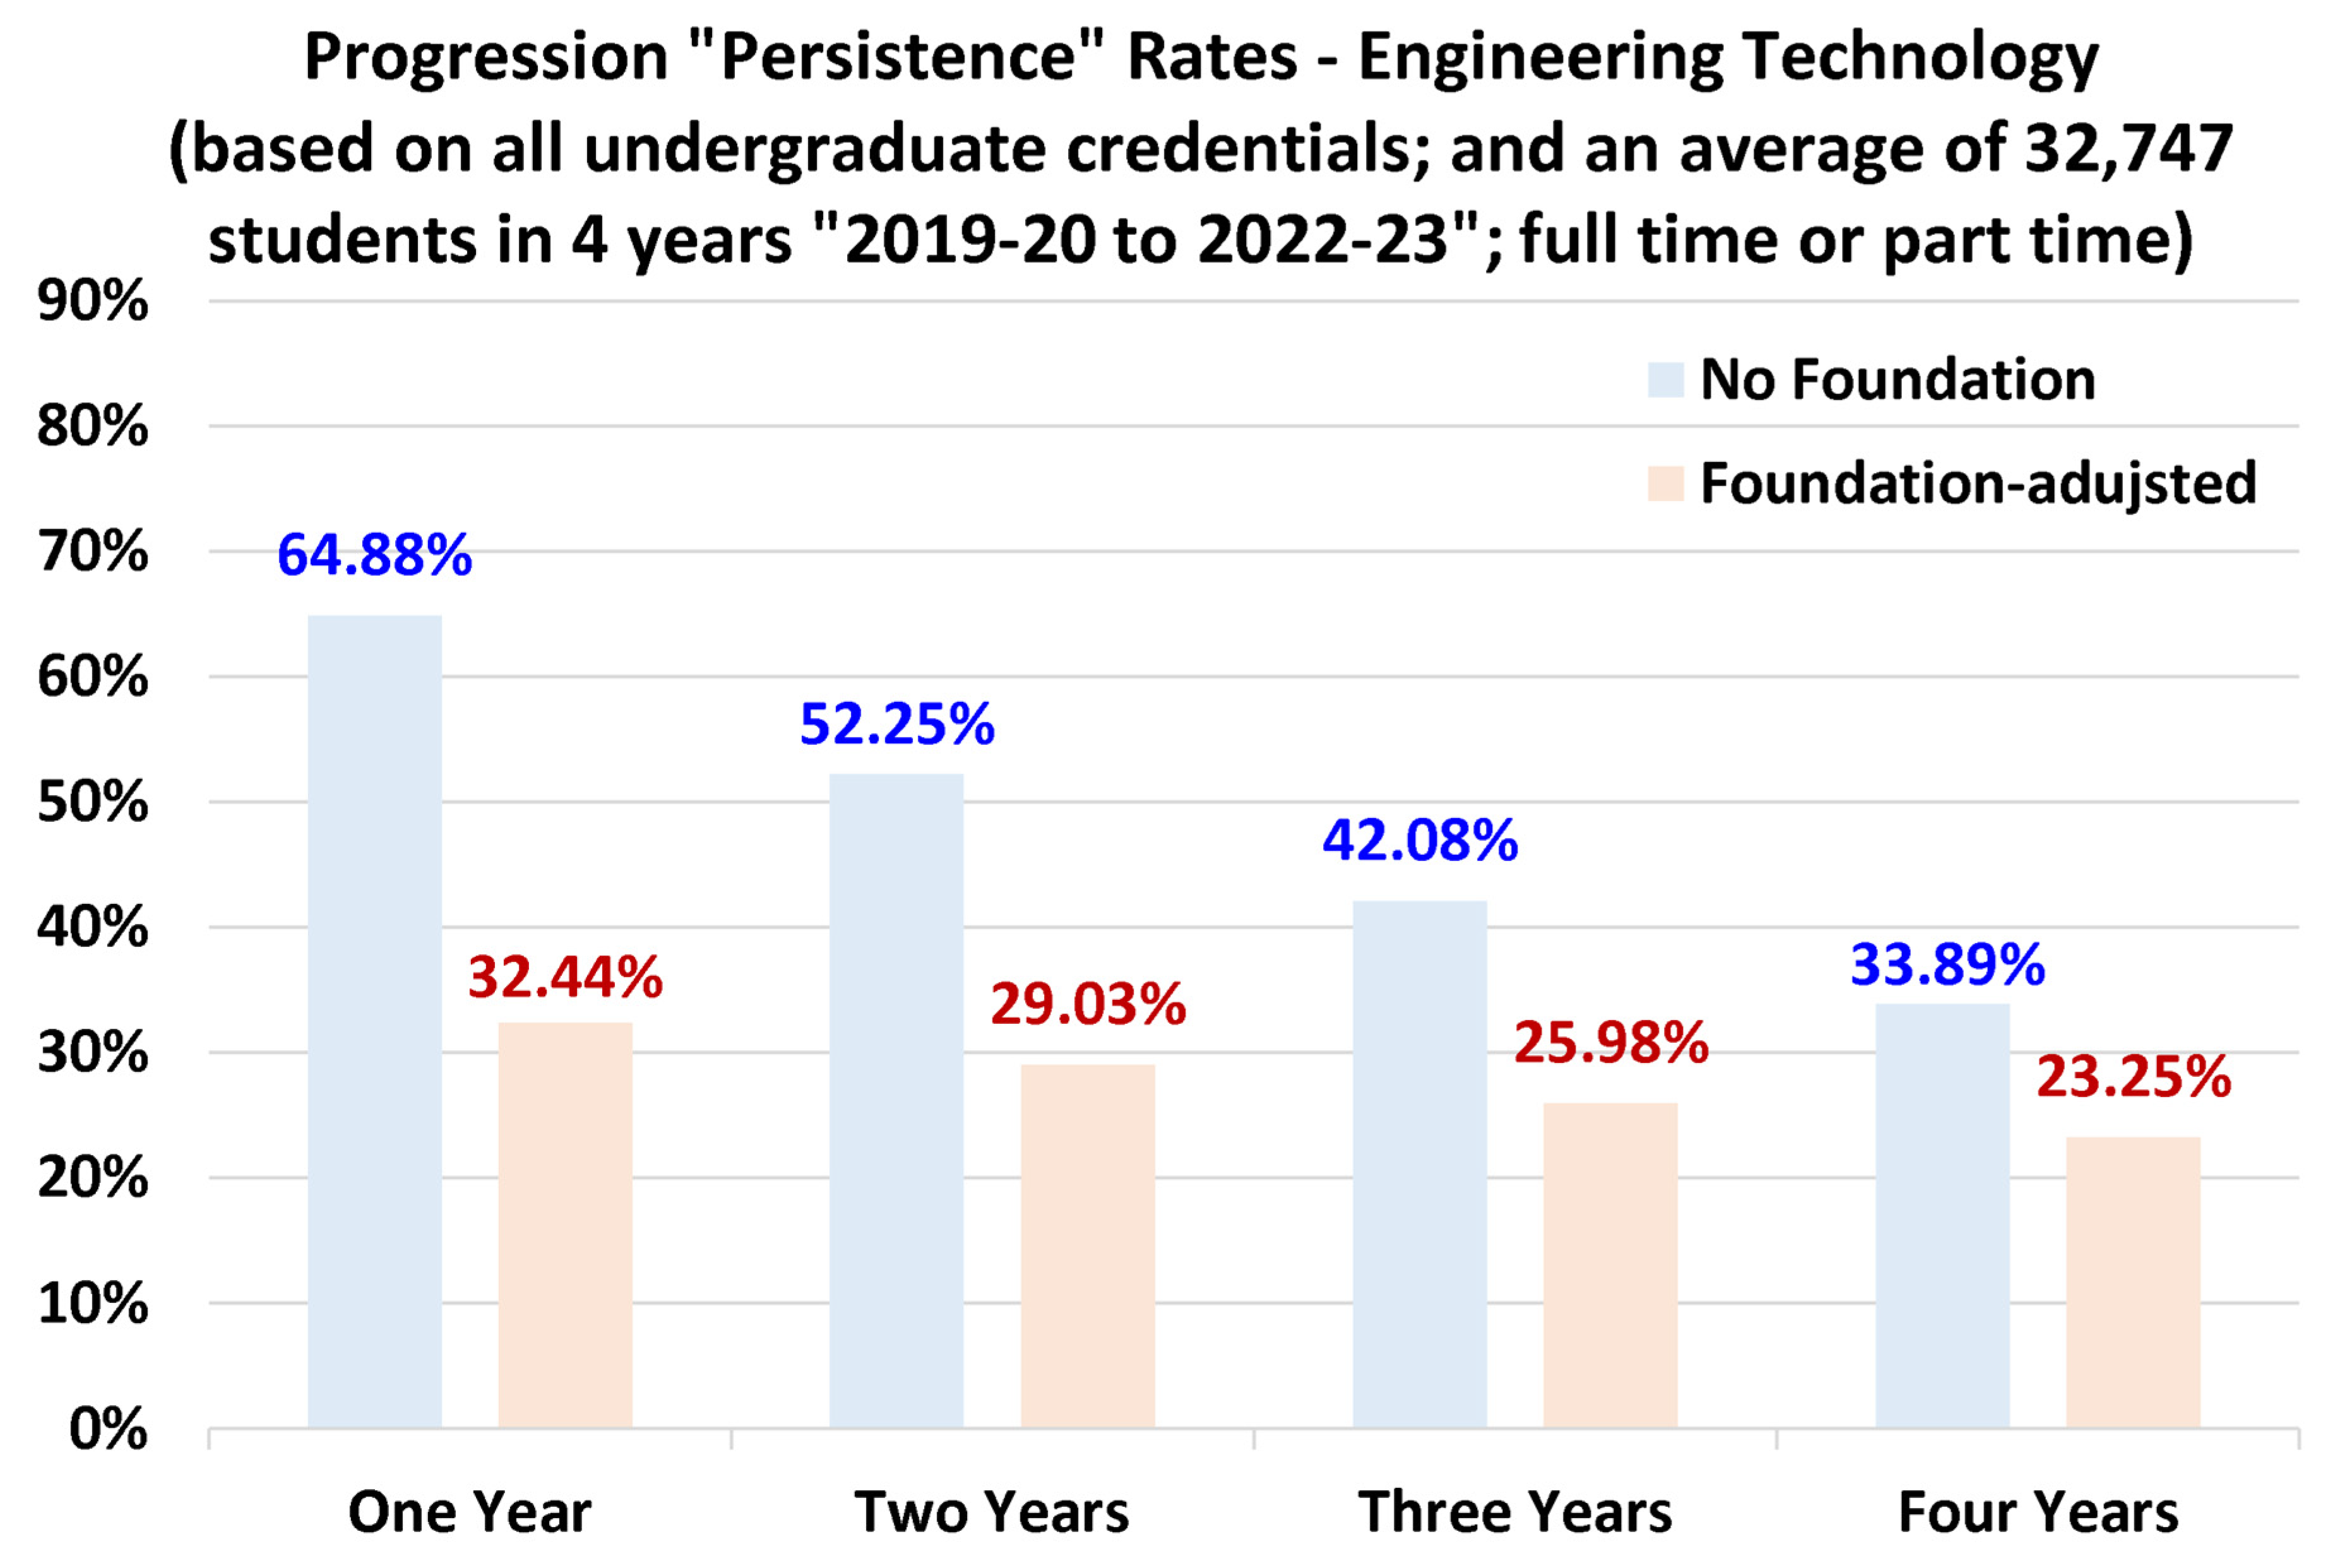
Figure 16.
Suggested health/clinical benchmarking progression rates at four durations (from one year to four years after admission). The foundation-year adjustment is for demonstration only (actually not applicable here).
Figure 16.
Suggested health/clinical benchmarking progression rates at four durations (from one year to four years after admission). The foundation-year adjustment is for demonstration only (actually not applicable here).
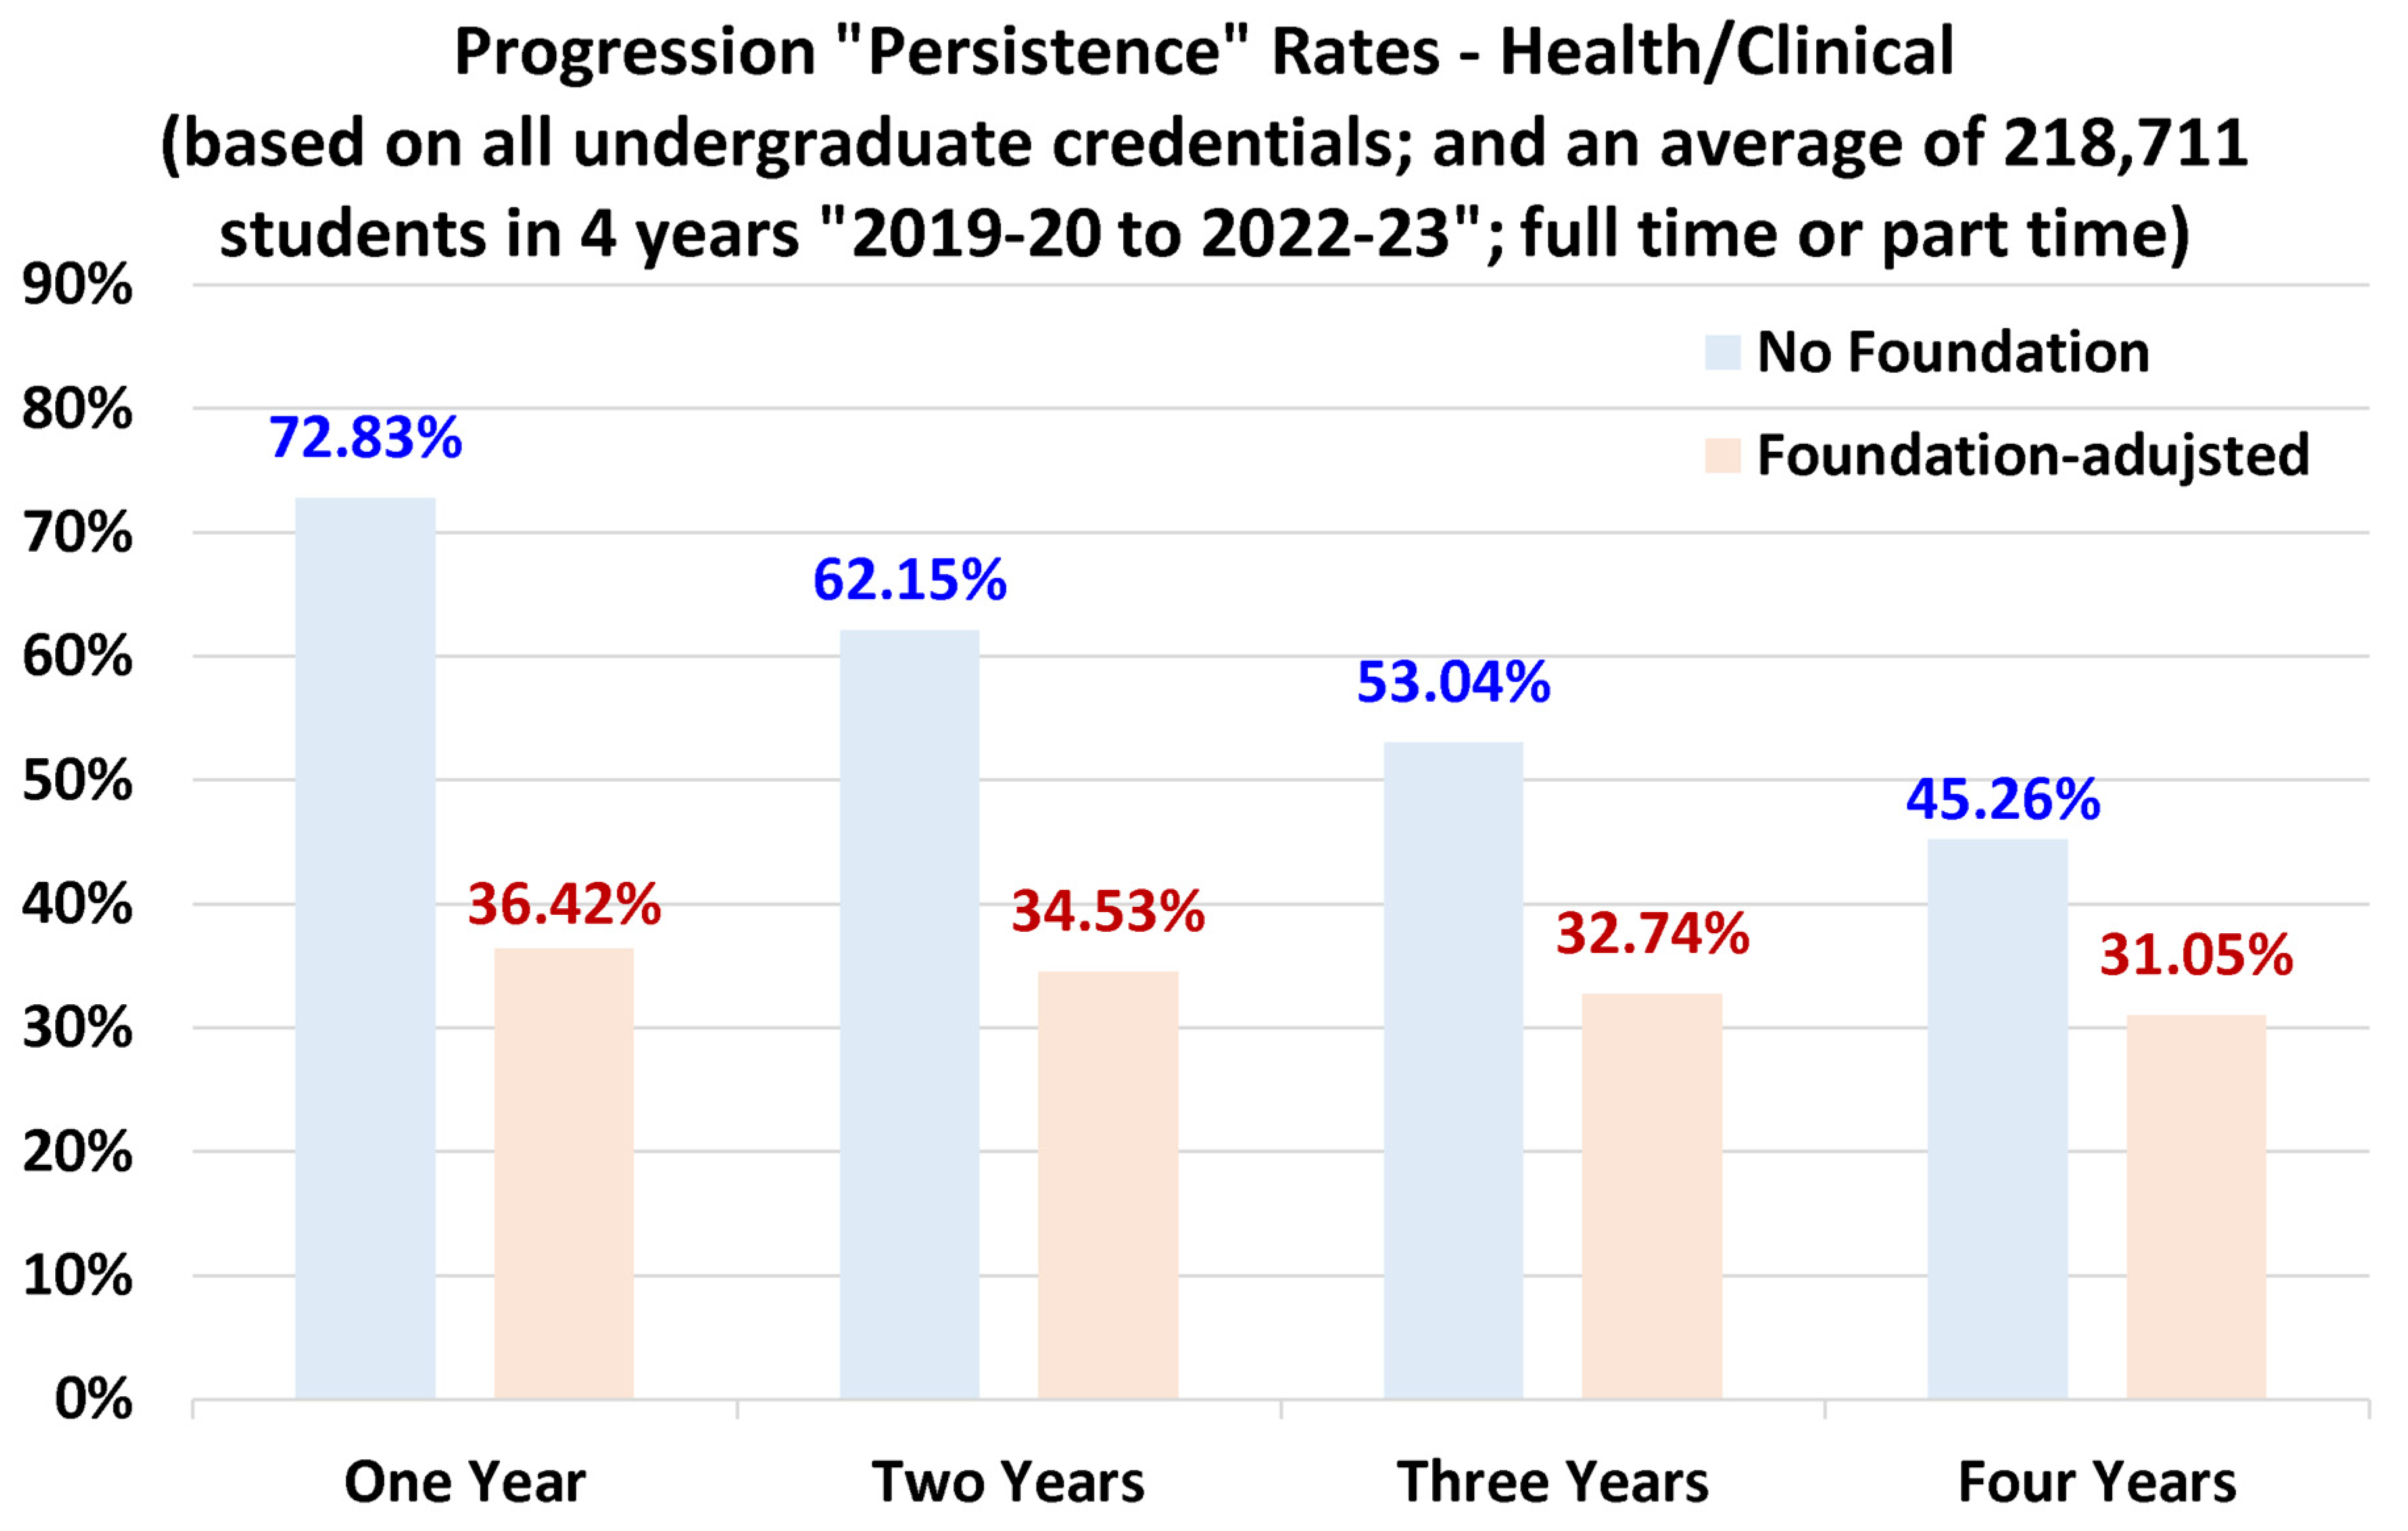
Figure 17.
Suggested law benchmarking progression rates at four durations (from one year to four years after admission). The foundation-year adjustment is for demonstration only (actually not applicable here).
Figure 17.
Suggested law benchmarking progression rates at four durations (from one year to four years after admission). The foundation-year adjustment is for demonstration only (actually not applicable here).
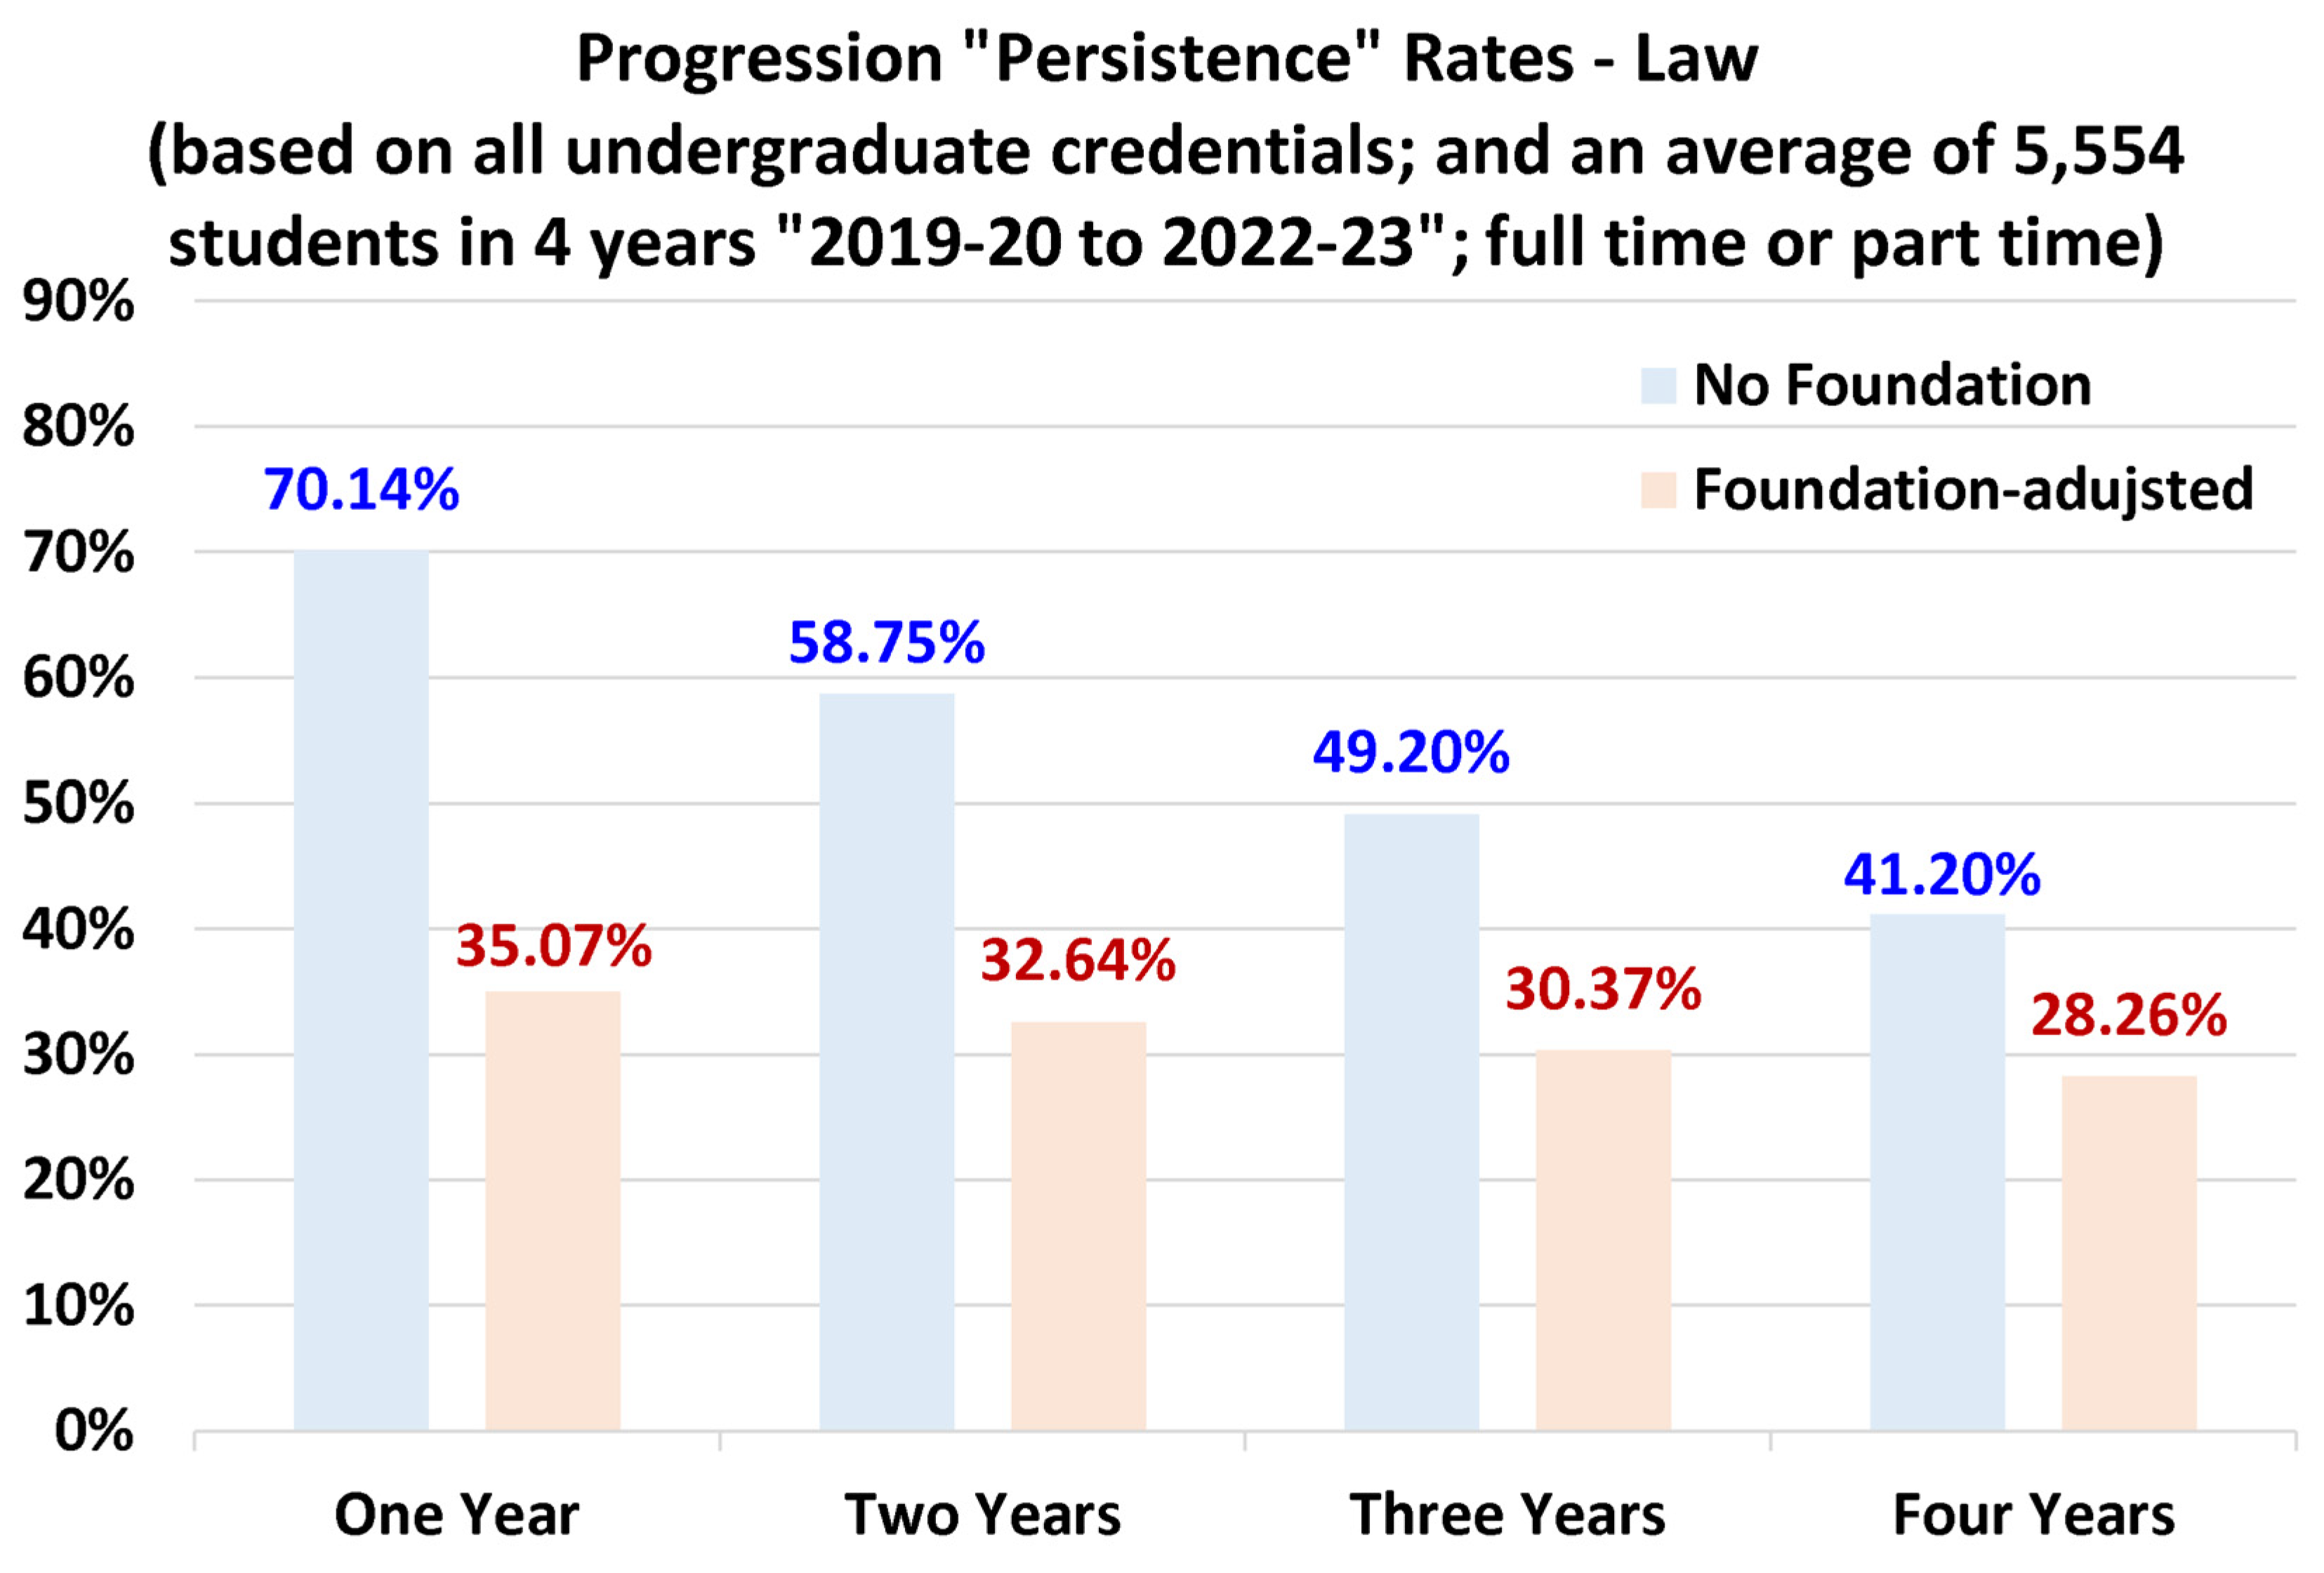
Figure 18.
Overall graduation rates for four consecutive cohorts, and their average (bachelor’s degree).
Figure 18.
Overall graduation rates for four consecutive cohorts, and their average (bachelor’s degree).
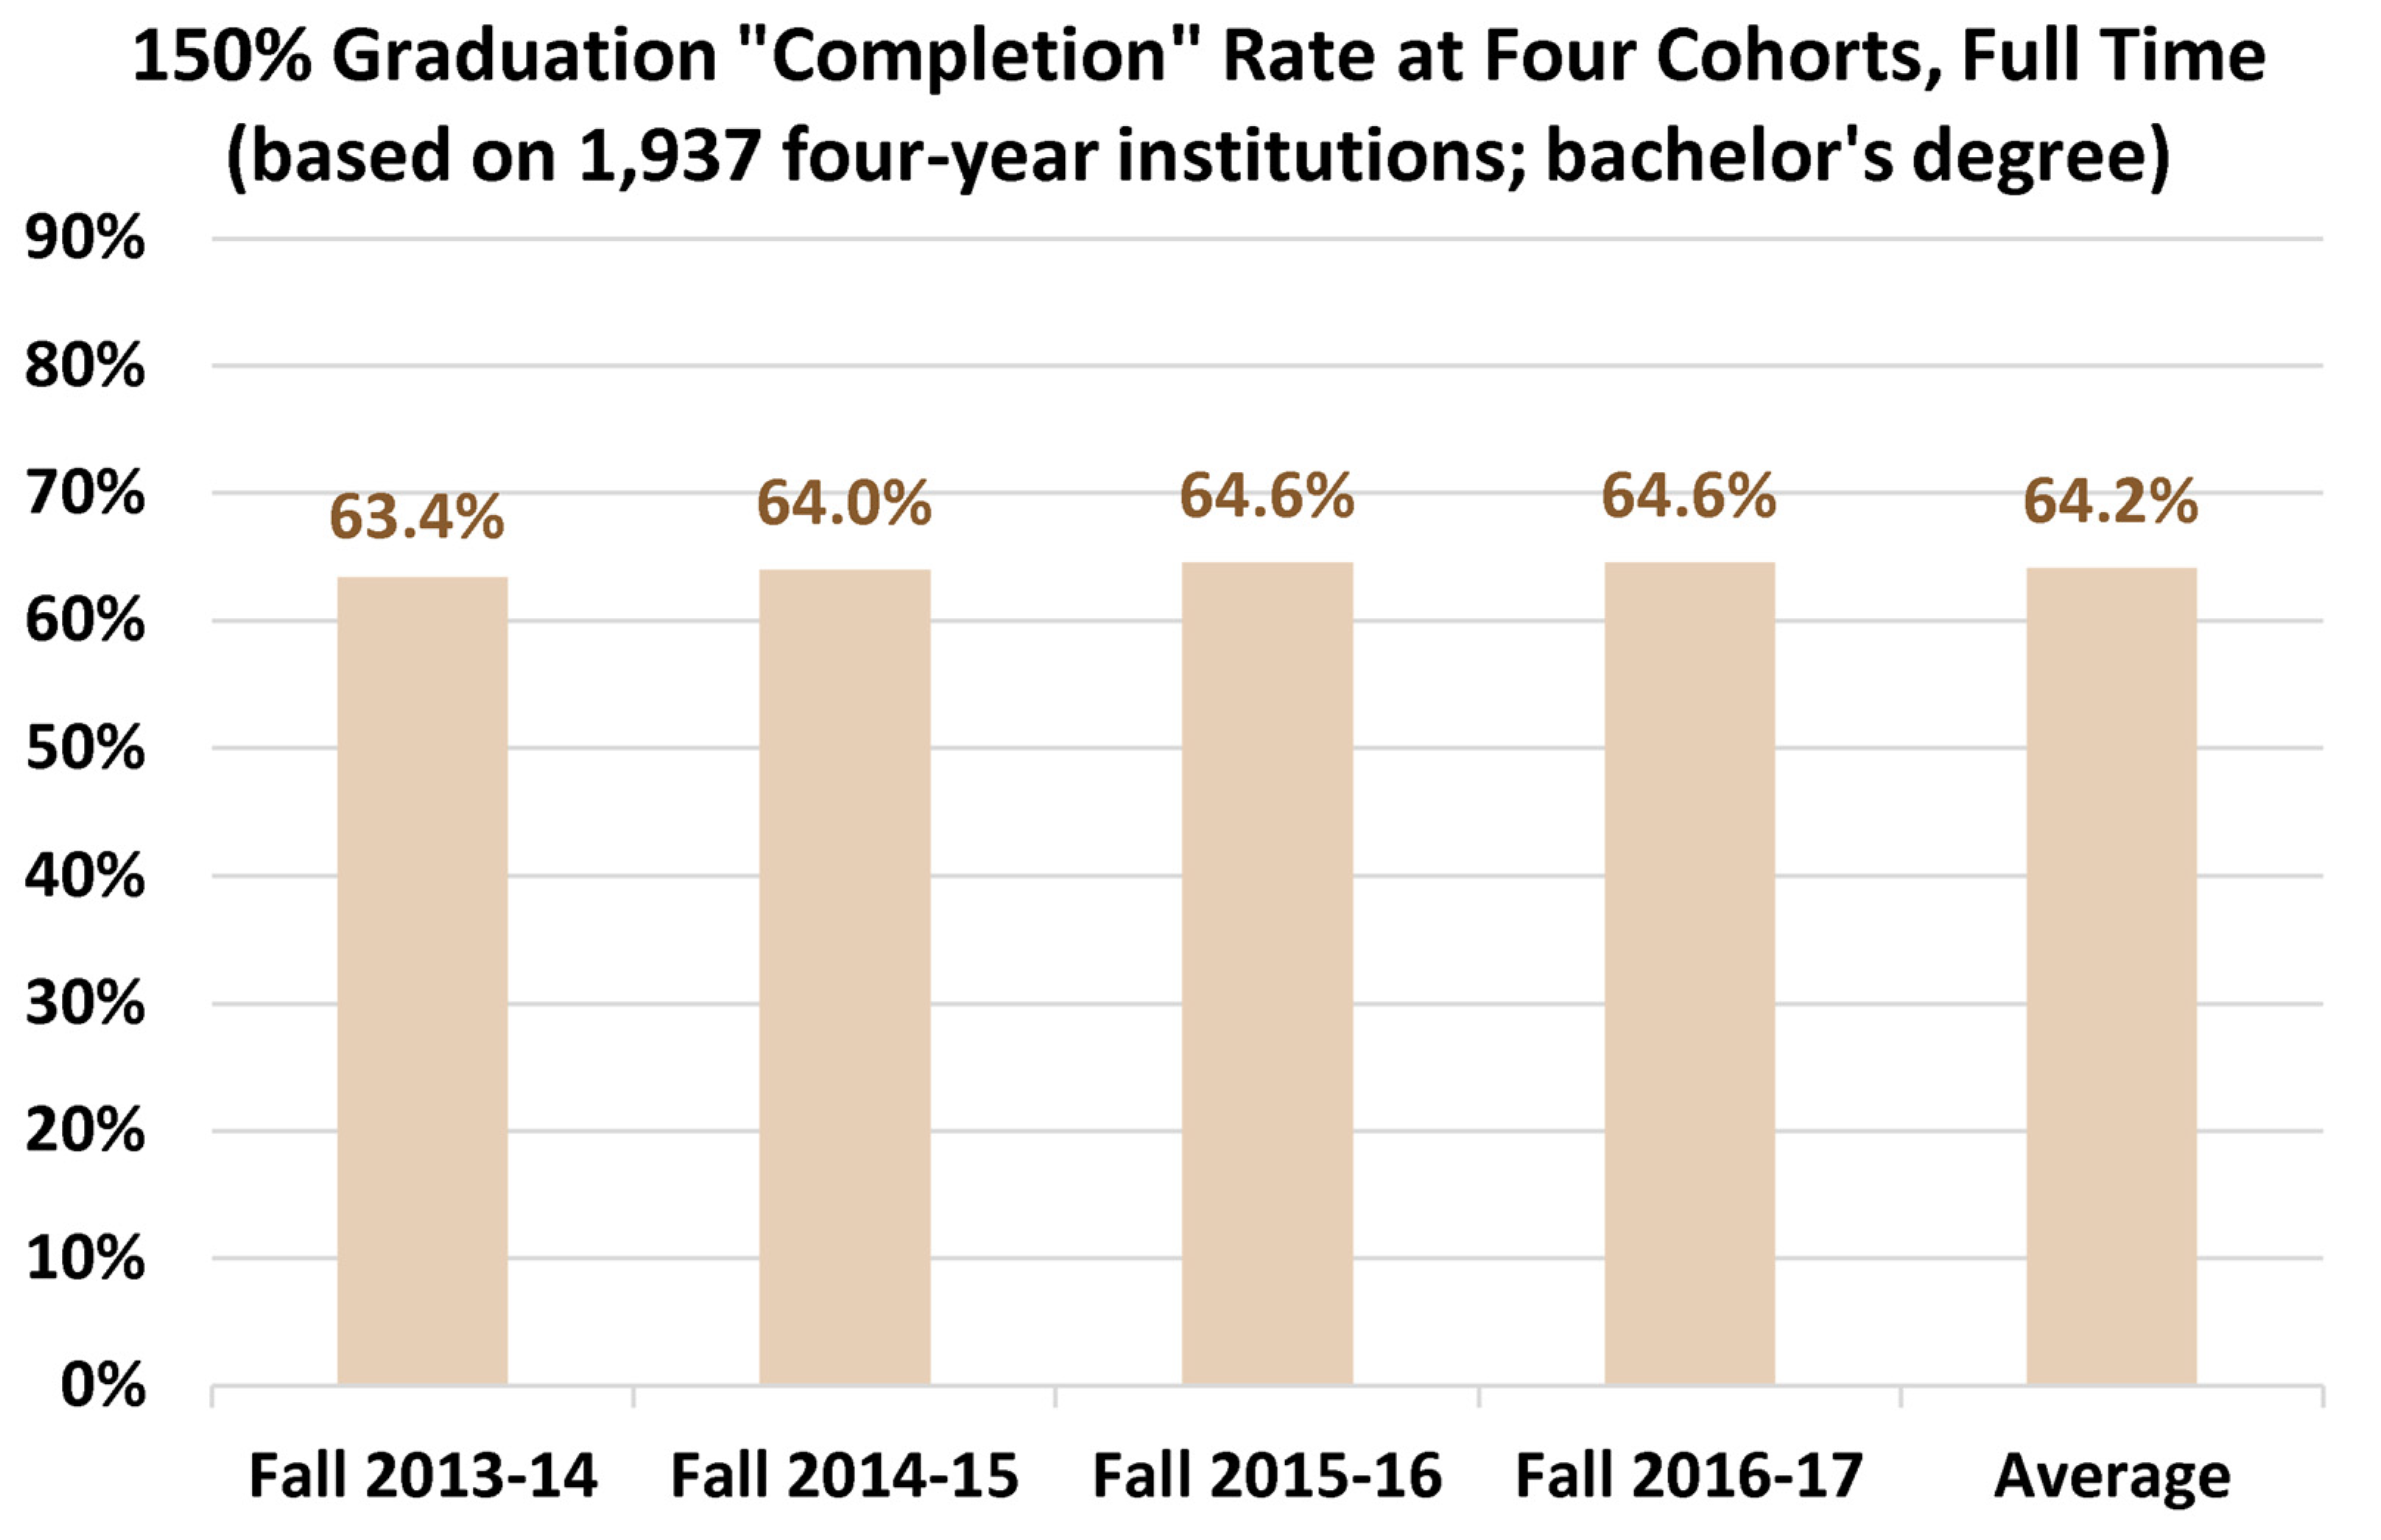
Figure 19.
Relation between retention rates and progression rates for the seven selected disciplines.
Figure 19.
Relation between retention rates and progression rates for the seven selected disciplines.
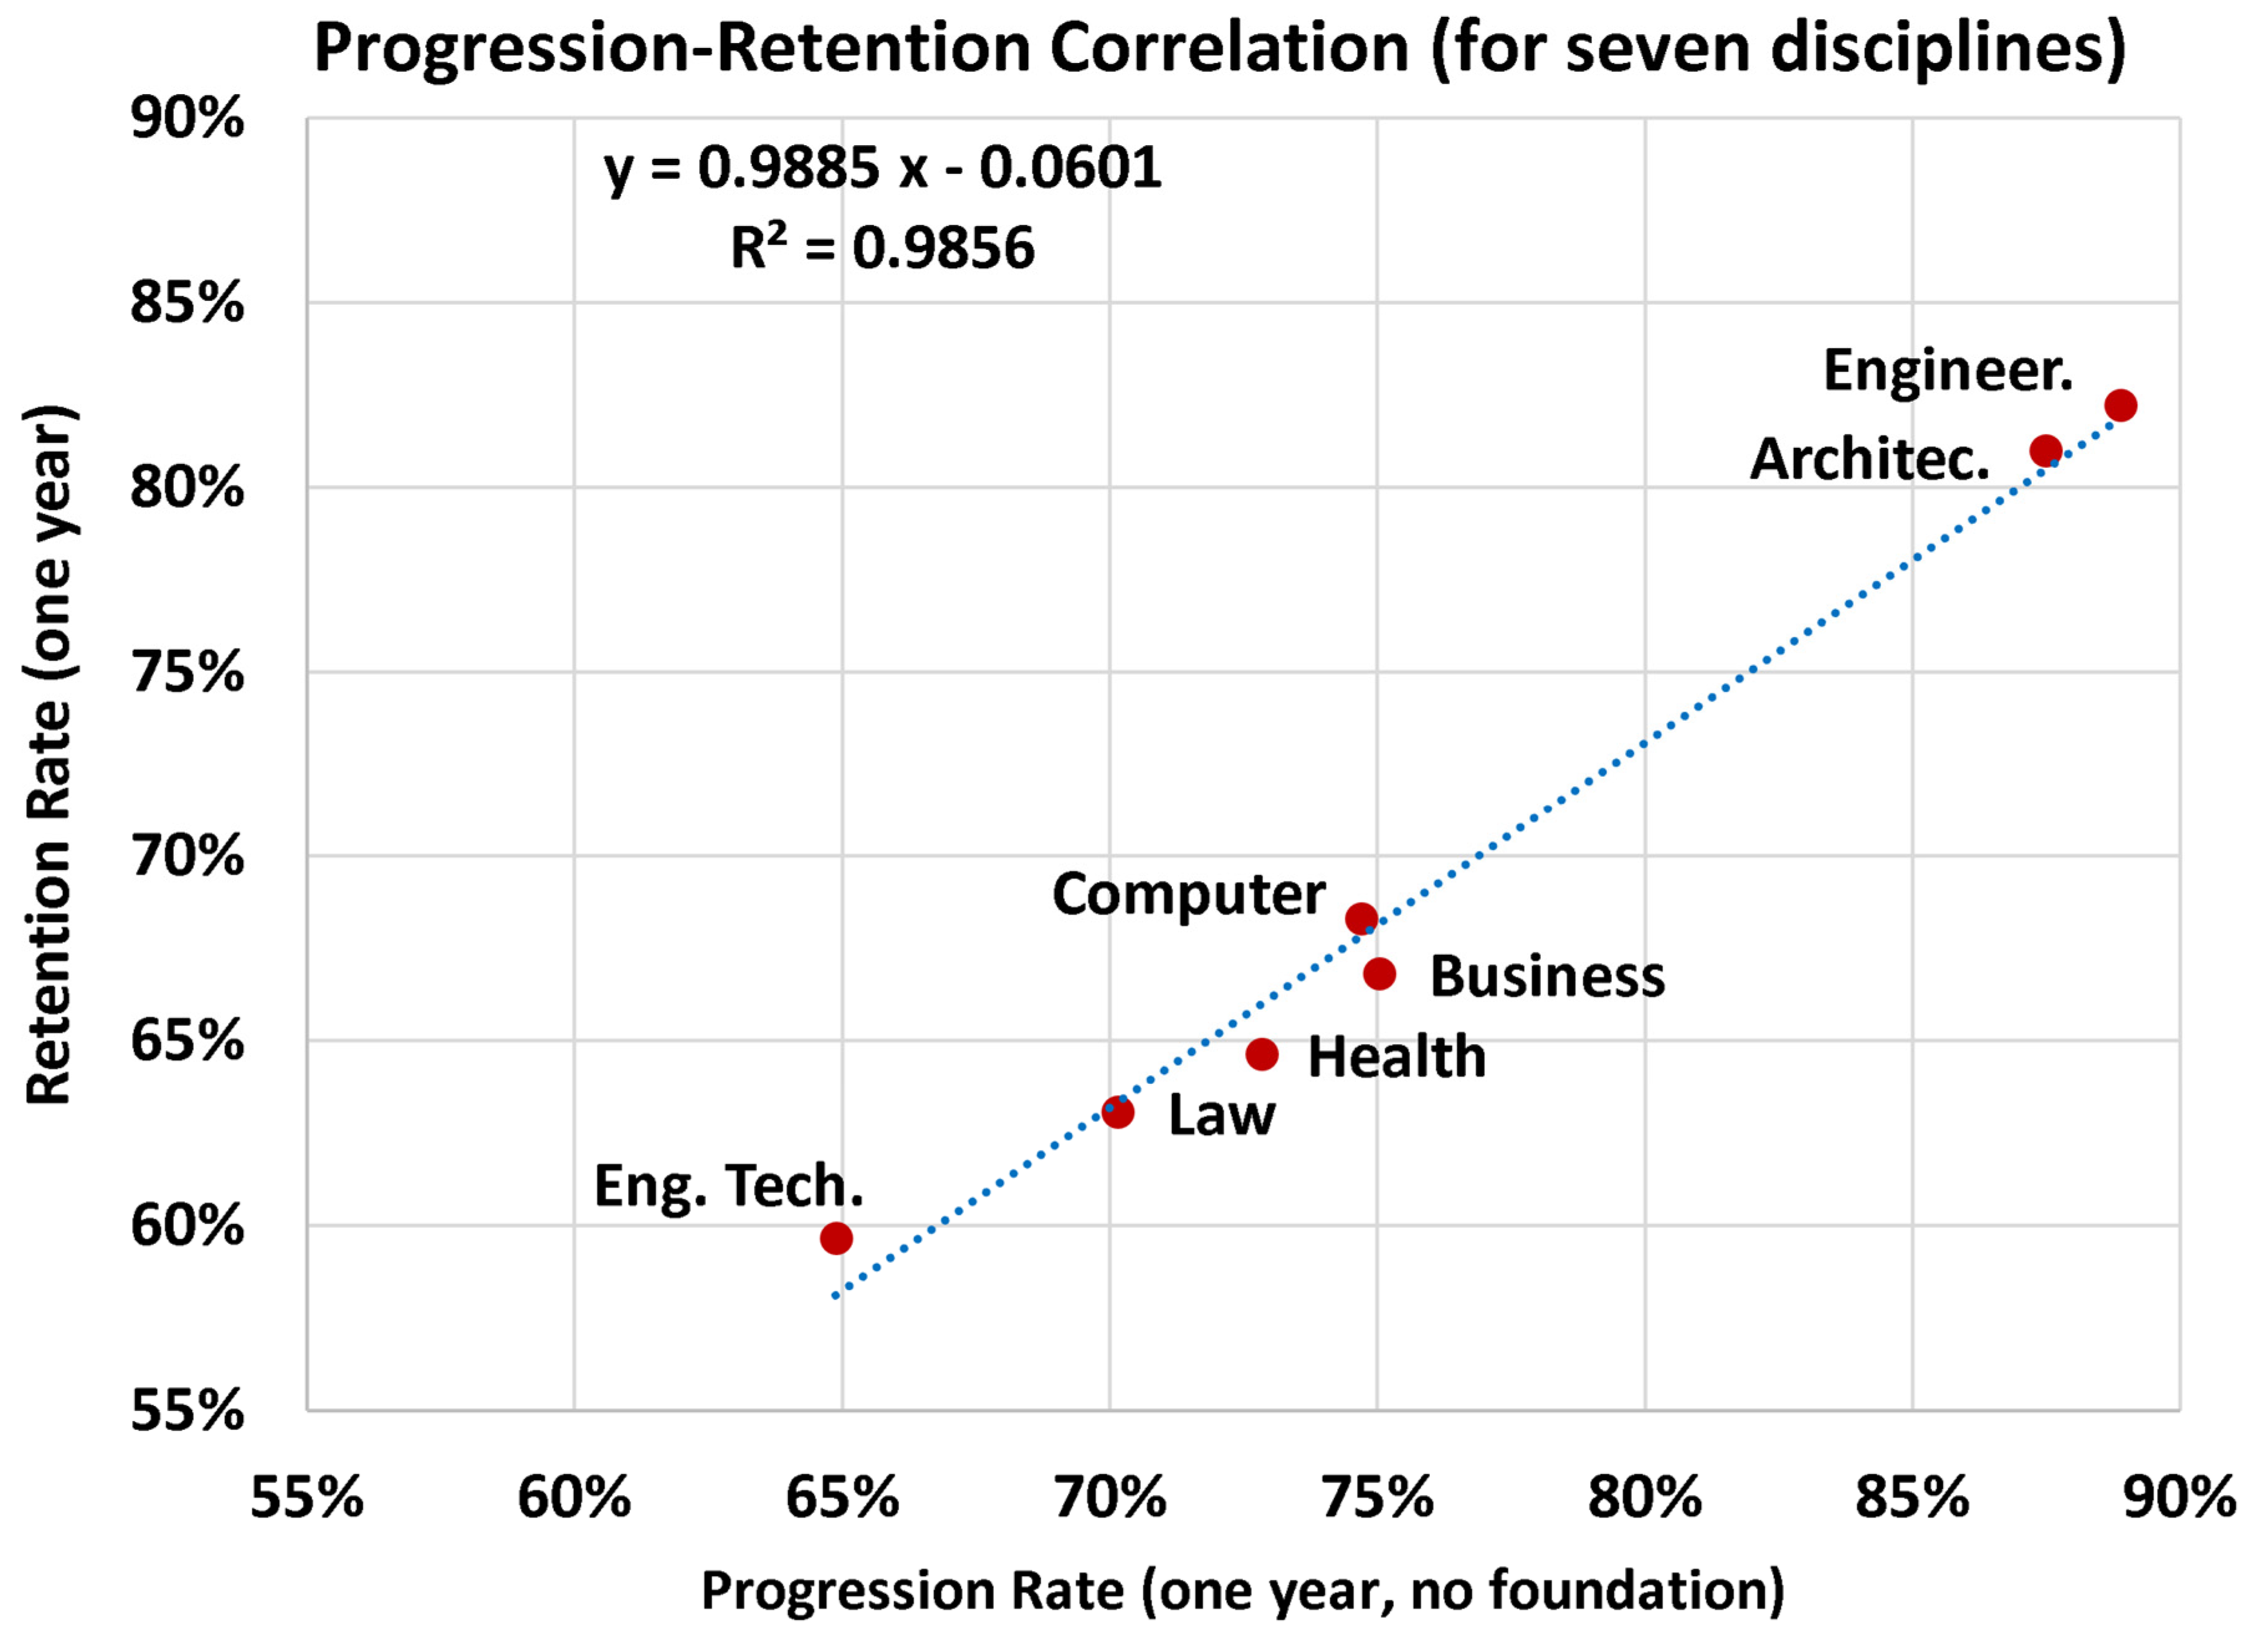

Table 1.
Curated raw data used in the current study.
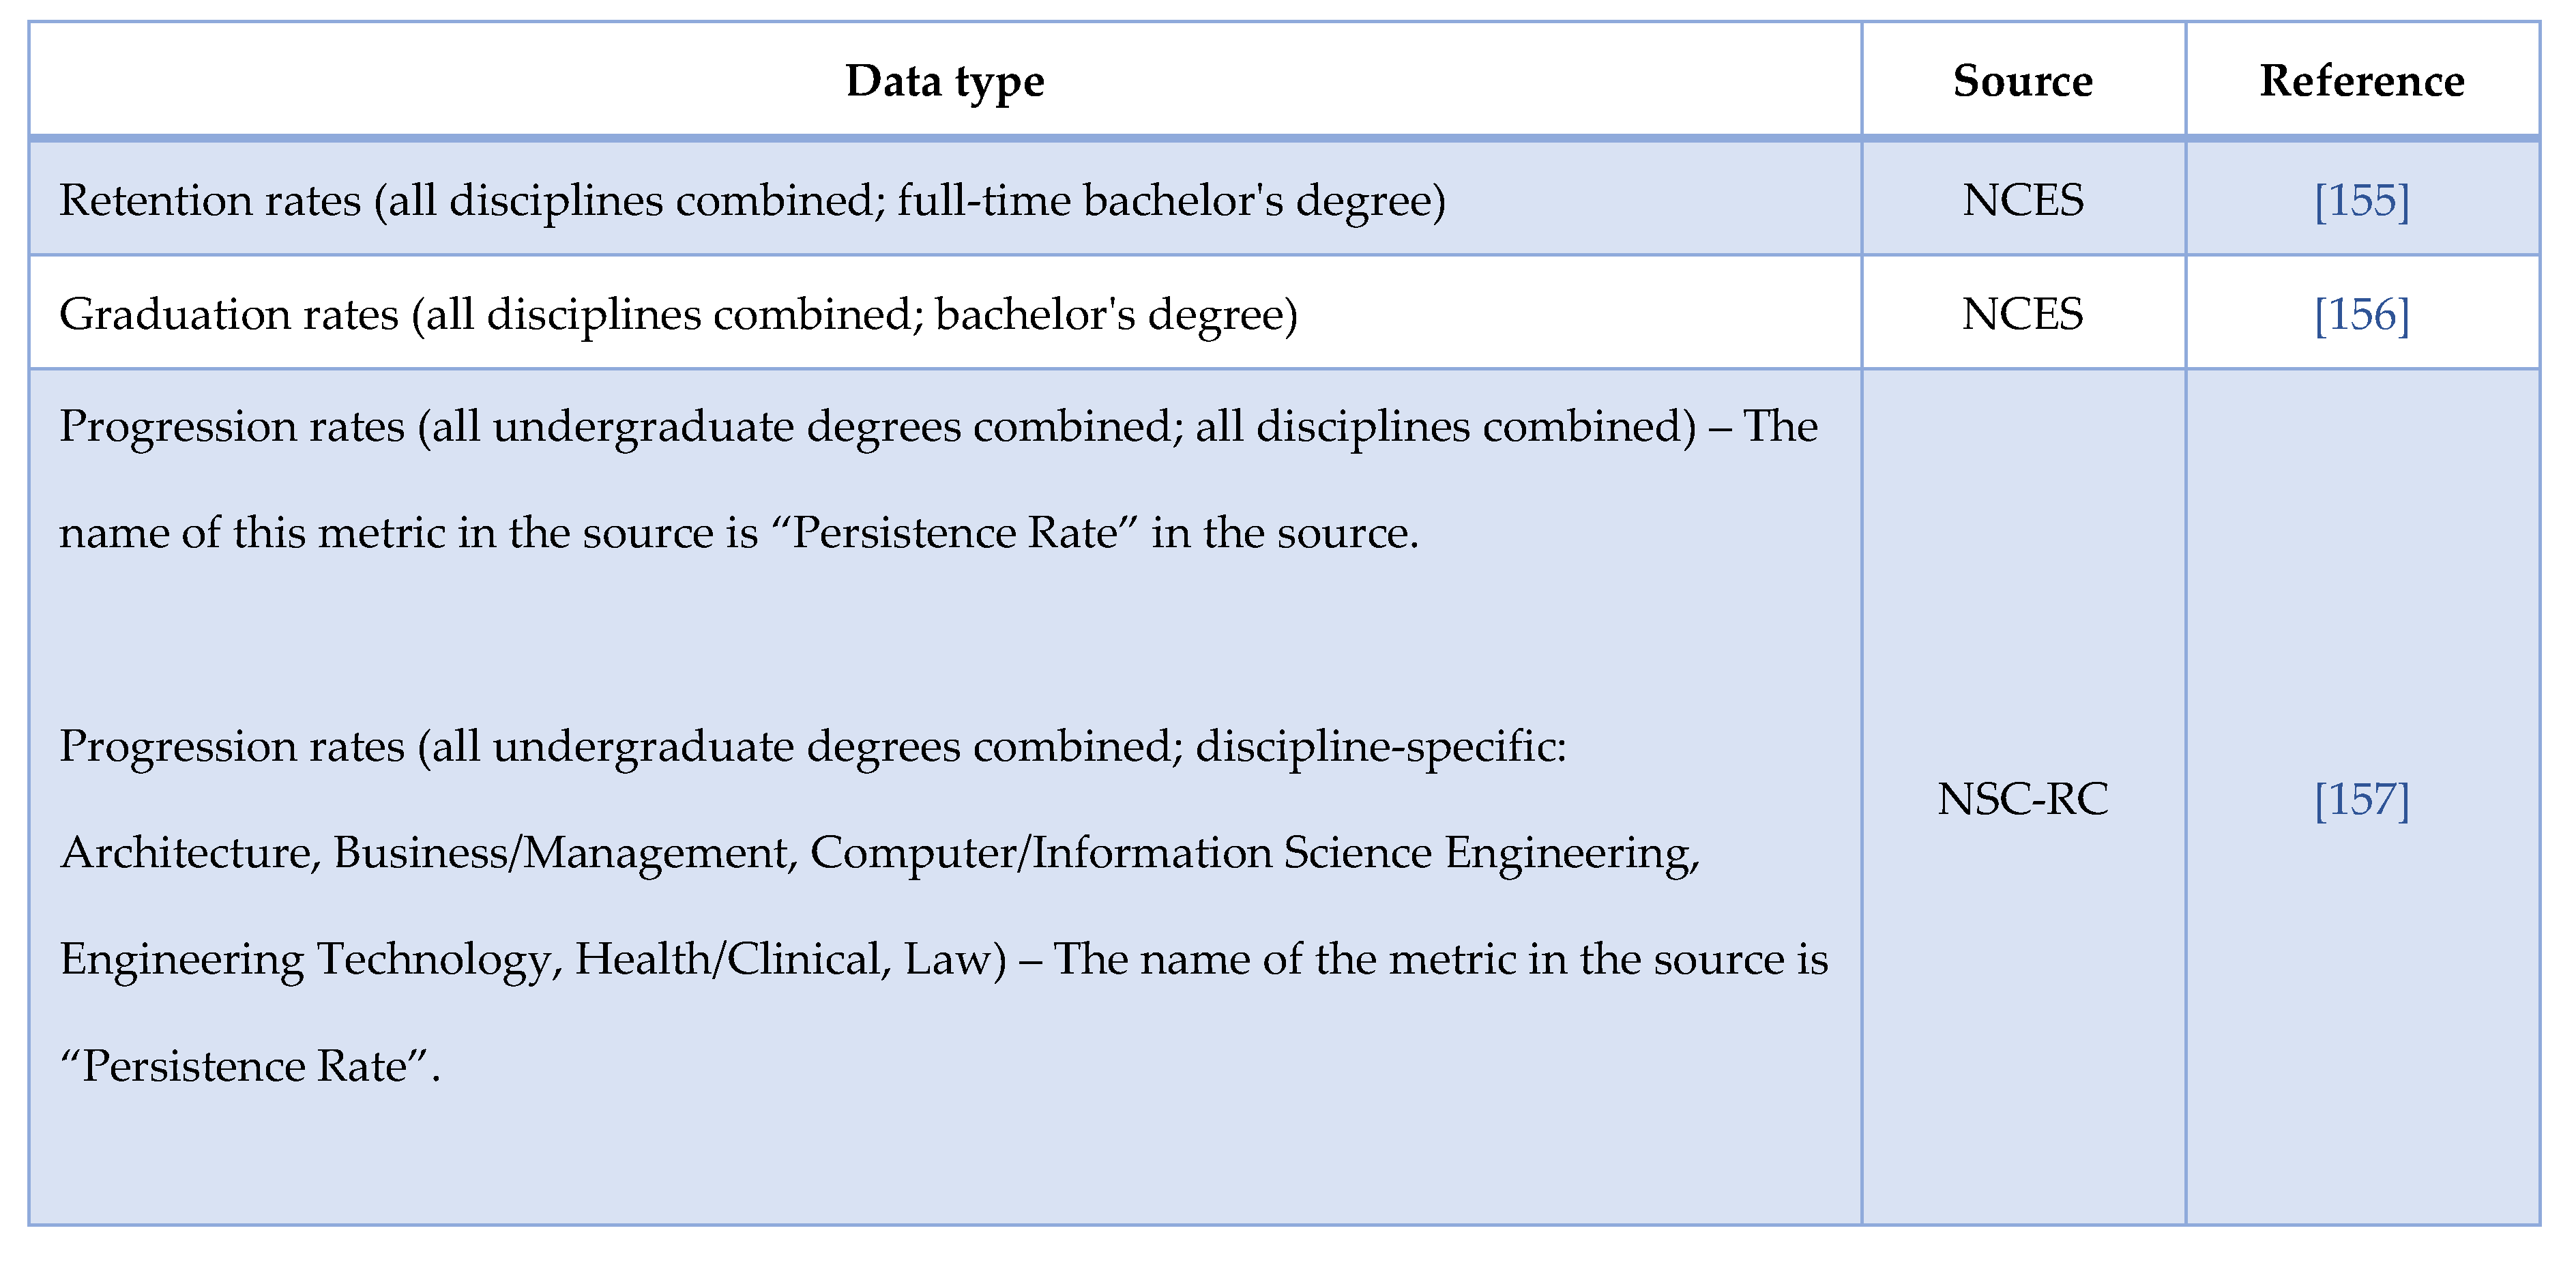 |
 |
Table 2.
Comparison between the seven examined disciplines (average of four annual values).
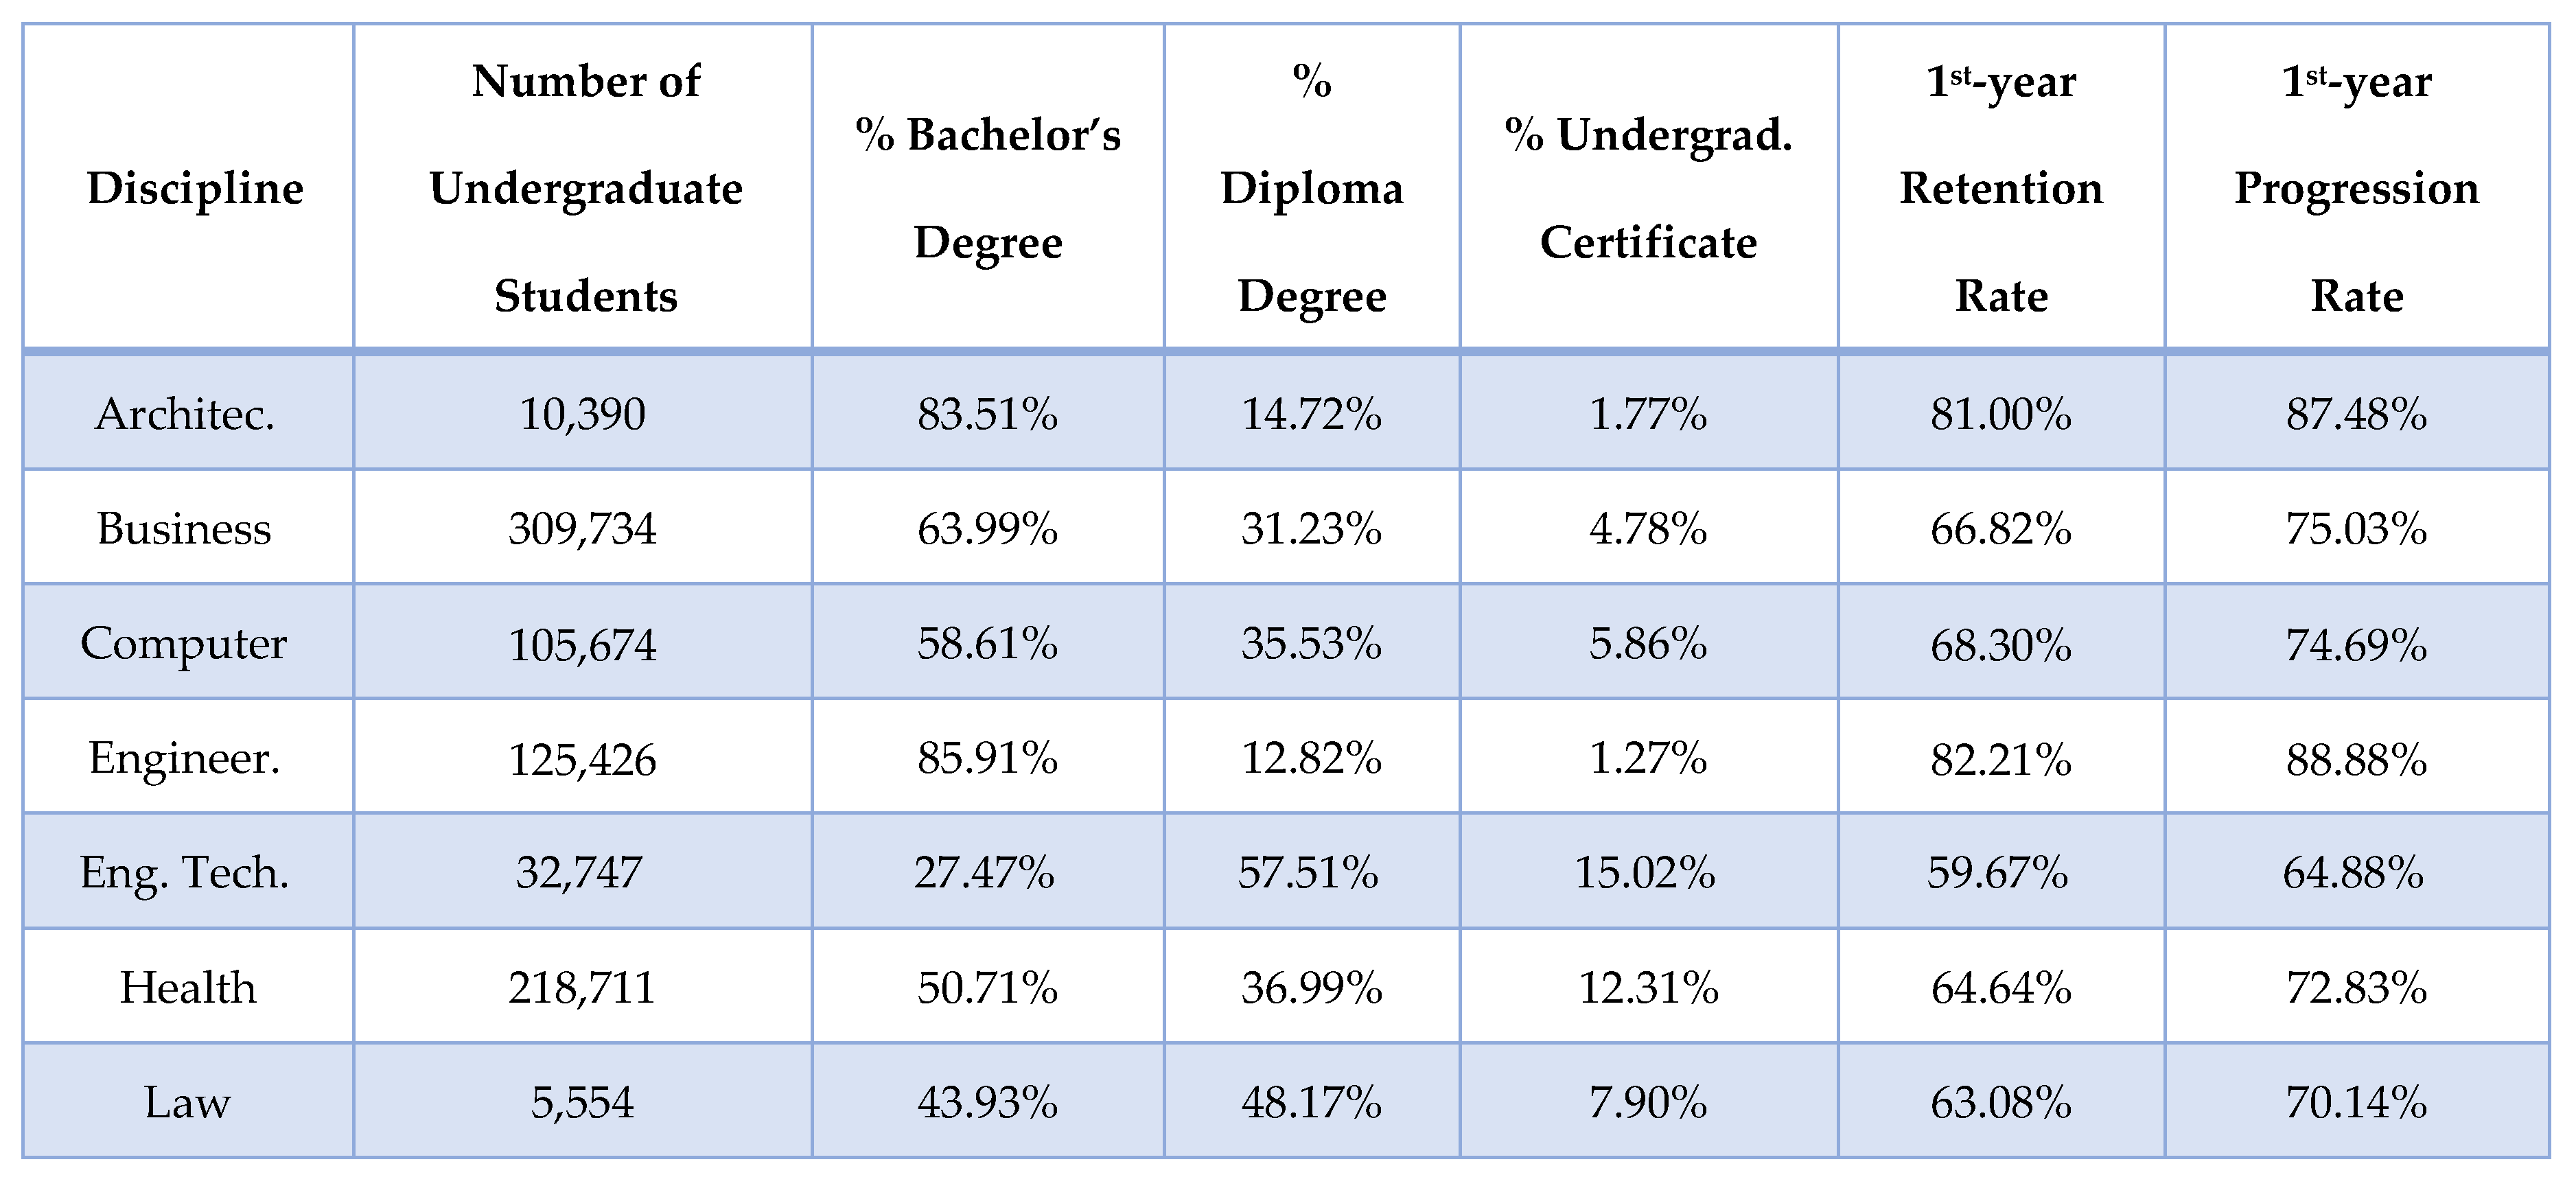 |
Disclaimer/Publisher’s Note: The statements, opinions and data contained in all publications are solely those of the individual author(s) and contributor(s) and not of MDPI and/or the editor(s). MDPI and/or the editor(s) disclaim responsibility for any injury to people or property resulting from any ideas, methods, instructions or products referred to in the content. |
© 2025 by the authors. Licensee MDPI, Basel, Switzerland. This article is an open access article distributed under the terms and conditions of the Creative Commons Attribution (CC BY) license (http://creativecommons.org/licenses/by/4.0/).
Copyright: This open access article is published under a Creative Commons CC BY 4.0 license, which permit the free download, distribution, and reuse, provided that the author and preprint are cited in any reuse.


