Submitted:
24 January 2025
Posted:
24 January 2025
You are already at the latest version
Abstract
A new method of macroevolutionary analysis, high-resolution phylogenetics, using both mor-phological and molecular traits has revealed well-supported evidence of complexity-based pro-cesses generating and controlling biodiversity. A novel technique of using evolutionary rates following a strict morphological clock, at least approximately, may allow detailed information on speciation and extinction events across geologic time. Branching series of minimally mono-phyletic genera are used to characterize in detail the branching lineage of the widely distributed moss family Streptotrichaceae. A strict morphological clock is calibrated by timing of genera new to recently exposed islands, molecular scaling against fossil taxa, and fossil evidence of the origin of the modern bryoflora. The numbers of genera generated in each 22 my interval are similar, while only one genus is inferred as extinct. The general outline of the phylogeny is tadpole-shaped because cumulative extinction is less than cumulative speciation, thus sustaining the family over vast time spans. Extant species per genus increase significantly over time through extinction, not as increased number over the optimal four descendants per ancestor, that is, not as secondarily descendant species. Ancient traits are preserved throughout the lineage. It is hypothesized that descendant species are protected from coeval competition through bursts of speciation. This study supports a complexity-based explanation of the interaction of major evo-lutionary processes resulting in sustainability.
Keywords:
bryophytes
; evolution
; extinction
; high-resolution phylogenetics
; punctuated equilibrium
; resilience
; speciation
1. Introduction
High-resolution phylogenetics is a new field using multi-disciplinary methods possibly unfamiliar to working taxonomists with an interest in evolution. It has been previously named macroevolutionary systematics, but with the added ability to identify the same ancestral taxa using both morphological and molecular data [1], the origin in numerical taxonomy is suitably recognized. Several published papers and books [2,3,4,5,6,7] have explained and provided examples for this set of powerful techniques of analysis of relationships between taxa. Because high-resolution phylogenetic analysis uses taxonomically important morphological (a term including all expressed traits) features, direct inferences of macroevolutionary processes (as trait changes) are possible about potentially adaptive character states. In addition, high Bayesian posterior probability support for inferred evolutionary relationships allows the results of molecular phylogenetics to be placed in perspective as primary data, rather than simply mapping morphological traits to a molecular tree.
The basic unit of evolution is considered to be the minimally monophyletic genus, here referred to as a microgenus. It is basically one ancestral species and a few descendants. The microgenus is identified in two ways: (1) it is the most similar of the ingroup species to an outgroup taxon, and (2) it is least highly modified among ingroup species, i.e., most generalist in the genus. Concatenating microgenera results in an evolutionary diagram of sequential monophyly, a caulogram of structured monophyly. Series of minimally monophyletic genera, deprecated by cladists as paraphyly, actually reflect a genuine process in nature—descent with modification—in this case operating above the level of species.
For context, standard genera in taxonomic literature commonly include more than one ancestral species, and relationships are thus necessarily general, these often large classical heterogeneous groups are here termed mesogenera. The average number of species per genus, for example, of vascular plants is 23, and 15 in the Asteraceae [8]. Average species per genus for several selected angiosperm families ranges from 27 to six [9]. With animals, perhaps more intensive study has revealed fewer species per genus: in 31 British insect orders and suborders, the average species per genus ranges between 7.3 and 1.3 [10]. If the world is split into small and large islands, and portions of continental areas, the average species per genus in floras range from 1.9 to 4.4, 3.0 to 5.4, and 2.2 to 8.9, respectively [12], an indication that speciation is affected, within limits noted, by local competition and much speciation is allopatric.
In molecular phylogenetics, groups are commonly made maximally monophyletic by lumping several mesogenera together under the cladistic principle of holophyly, a nomenclatural rule that reflects no empirically determined process in nature. Such groups are here termed macrogenera and are unwieldy, maximally monophyletic units for detailed analysis of evolutionary relationships. Particularly strong examples of recently minted highly heterogeneous macrogenera in the moss family of this author’s expertise, Pottiaceae, include Chionoloma s.lat. [1,13,14] and an expansive treatment of Syntrichia [15]. Given that cladistics operates by estimation of common ancestry through cluster analysis on a dichotomous dendrogram using synapomorphies, the ancestor-descendant patterns required for modeling evolution by structured monophyly are not and a priori cannot be evident in macrogenera. The only true evidence of descent with modification (ancestral signature} is that of exemplars of the same species occurring at different nodes reflecting mutations accumulated by morphologically static ancestral species between generation of multiple descendant species. This is paraphyly in cladistic studies, and is usually absent or not recognized as evolutionarily informative.
The microgenus, the basic building block of structural monophyly, consists of optimally one ancestral species and four descendant species. This was determined in a cumulative study of 30 genera of Pottiaceae that revealed four as the most common number of immediate descendants. NK analysis using a random Boolean network model [5,16,17] demonstrated that the constant appearance of the most recent traits of the ancestral species in all the descendant species gave the microgenus a fractal nature [18,19] of fractal dimension 1.16 (equivalent to a Pareto distribution of 1:4) that broadened the range of resilience to competition.
The traits of any one species may be divided into three groups that are apparent effective in evolutionary processes. The novon is the set of traits (character states) newly evolved in the descendant species. These traits may be modified during generation of secondary descendants (descendants of descendants). The ancestron is the set of the remaining traits. This is subdivided into two groups: (1) The immediate ancestron is the set of traits identical to the new traits evolved in the ancestral species and is empirically determined as optimally four. The immediate ancestron is the same in each of the immediate descendants. (2) The reserve ancestron is the set of ancient traits that is the source of new traits for the novons of the descendant species. The immediate ancestron is not used as a source of new traits. Another way to look at this is that the immediate ancestron is possibly responsible for stabilizing selection, and the novon versus the reserve ancestron are active in balancing selection and sustainability of the family.
A caulogram is an evolutionary tree with named ancestors at the nodes, i.e., a stem-taxon tree. Because there are optimally four descendant species, a caulogram is not dichotomous as in a cladogram, but may have one or more branches from a node. Character state changes, habitats and geographic range distributions may be mapped to a caulogram as has been done for the taxa (species of Streptotrichaceae worldwide, and Neotrichostomum and related genera in the West Indies) involved in the present study [5,9], and evolutionary changes directly analyzed. Nomenclatural authorities for the taxa named in this study are given in the aforementioned papers and are also available online at the Missouri Botanical Garden’s taxonomic data center Tropicos (https://tropicos.org/home). As the present paper focuses on evolution, nomenclatural authorities are not given.
2. Materials and Methods
The basic method of macroevolutionary systematics using morphological traits and a stem-taxon tree has been detailed at length in the papers by the author listed in the Introduction. The evolution of the Streptotrichaceae [3] is the focus of this study. The time intervals for evolution of the lineage are inferred from calibration with West Indian endemic genera of Pottiaceae [3] of 22 mya (Fig. 1) and from a molecular study of Syntrichia (Pottiaceae) [15] for separation of the worldwide family Streptotrichaceae [3] from Pottiaceae. In the present paper and commonly in the field, “mya” means million years ago. Details of the calibration are given in a different paper, but in short, two genera mostly endemic to the West Indies are considered to have been generated most probably around the middle of the maximum time of emergence of the West Indies as a floristic unit, about 45 mya, the time according to Rodriguez and Strong [20] and Rodriquez-Silva and Schlupp [21]. The estimate of separate generation of these two genera is 22 mya for each, with considerable margin of error. This value is, however, bracketed by the estimate that the modern bryoflora first appeared in mid-Cretaceous times [22,23,24], about 80–100 mya, although originating much earlier in the Permian [25]. The caulogram is four ancestral genera deep. Dividing the existence time of the modern bryoflora into four intervals of 22 million years each ranges rather well across time. In addition, the Jauregui-Lazo et al. [15] study suggested that the Pottiaceae separated from the Streptotrichaceae (as two species of Leptodontium) about 120 mya, perhaps deep in a shared Ur group.
Figure 1.
Calibration caulogram of the “Weissia Probe” showing the widespread Neotrichostomum crispulum as immediate ancestor, with descendant genera Chionoloma and Tainoa as largely West Indian endemics, and Hymenostomum and Weissia as more widespread. Only one species is estimated as extinct “1 spp.” in the two recently evolved endemics, while other genera are estimated as relatively much older. Four estimated time intervals are identified as red or 2–22 mya, green as 22–44 mya, blue as 44–66 mya, and yellow as 66–88 mya. Numbers are those of state changes in speciation (a descendant’s novon).
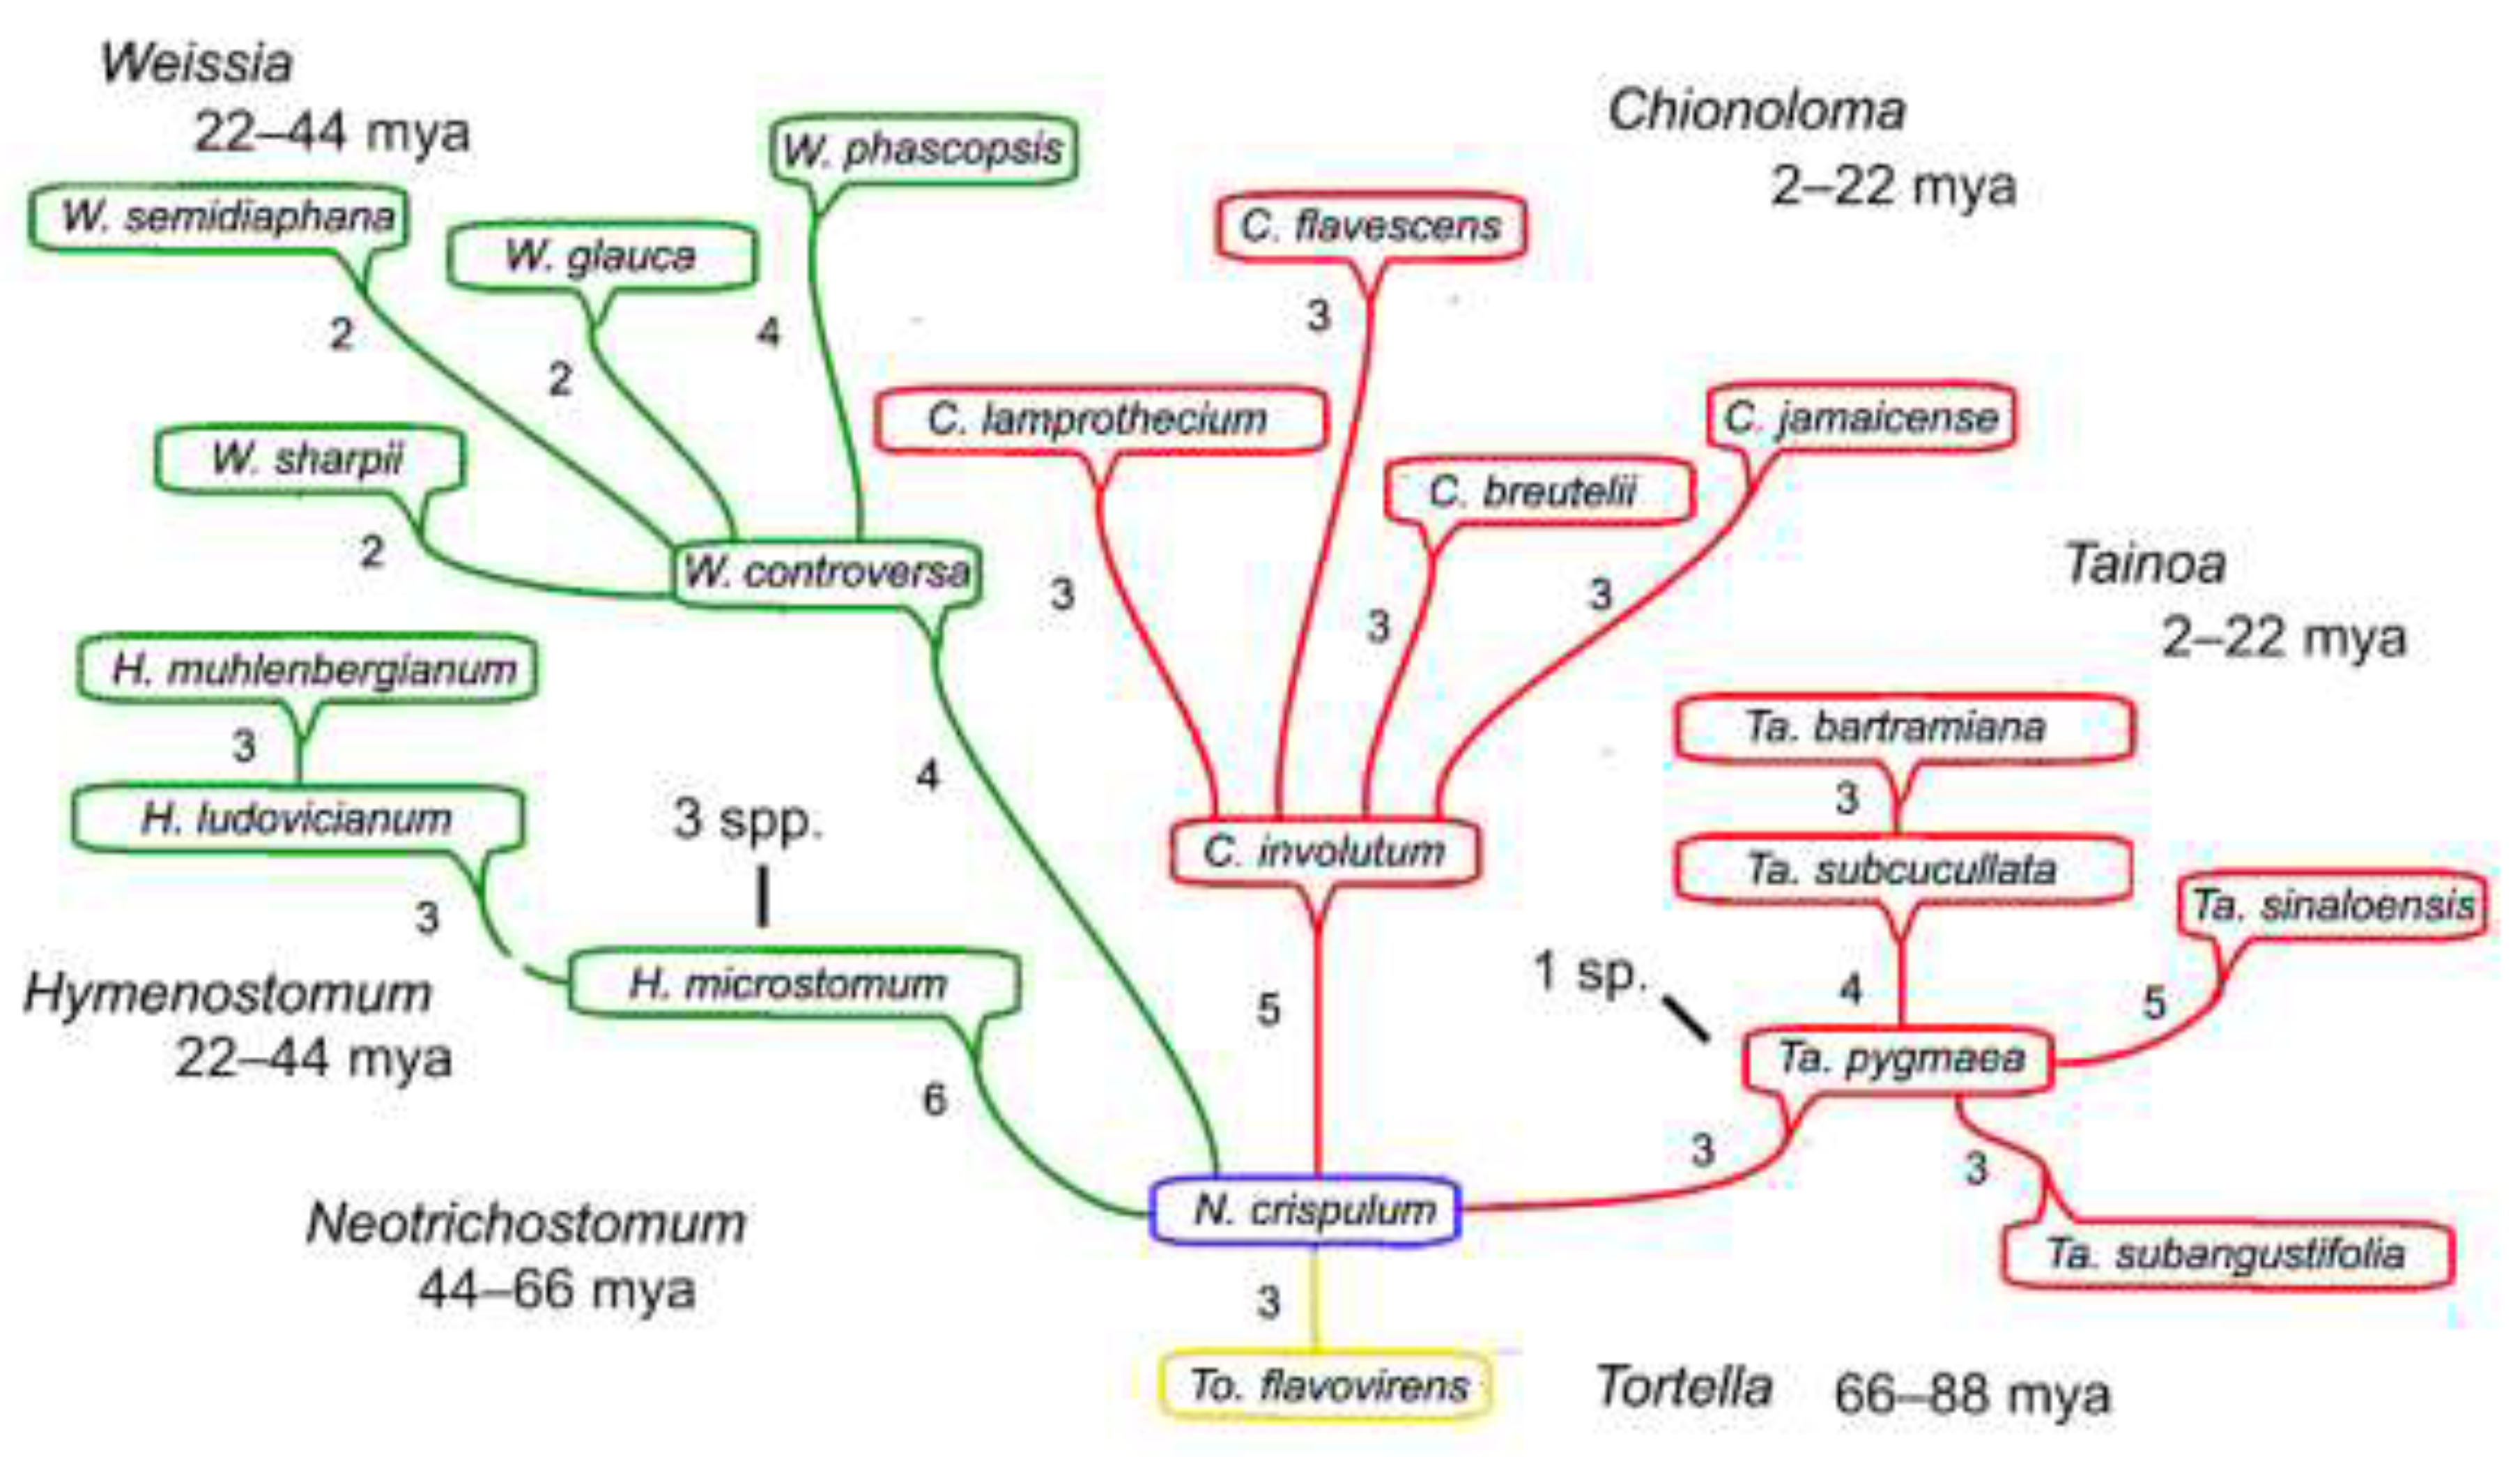
The intervals are as follows: 2–22 mya: Holocene, Pleistocene, Pliocene and Miocene (ice caps, strong cooling); 22–44 mya: Oligocene, mid-Eocene (warm but cooling, no ice caps); 44–66 mya: mid-Eocene, Paleocene (Eocene-Paleocene Thermal Maximum); 66–88 mya: last portion of Late Cretaceous, Mastrichitian through Coniacian epochs (global temperatures nearly those of Eocene-Paleocene Thermal Maximum); and 88–100 mya: early portion of Late Cretaceous, Turonian and Cenomanian epochs (global temperatures warm across a broad latitudinal range).
As previously established [3,4,5], four descendants per ancestral species is assumed to be optimal. Only one complete lineage of several microgenera, that of Streptotrichaceae (Bryophyta) [3], has yet been published. The lineage is here reproduced (Fig. 2) annotated with the number of estimated extinct species. There is one internal branch with a leap of 11 traits between Streptotrichum ramicola (66–88 mya) and Williamsilla araucarieti (44–66 mya). This supports interpolation of an extinct genus of optimally five species, one ancestor and four descendants, a genus here assigned to the more distant time interval of 66–88 mya to allow more time to go extinct, thus joining the single extant genus, Steptotrichum, of that time interval.
Figure 2.
Caulogram or structured monophyly of Streptotrichaceae adapted from Zander [3]. The estimated time intervals are given for the genera, which are colored as in Fig. 1, with squares separating the genera. The number of new traits comprise the novons of each species. A solid yellow square identifies an interpolated genus extinct during 66–88 mya interval because of large novon trait differences between taxa. An unknown ultimate progenitor group, labeled “Streptotrichaceae” is colored purple. Estimated numbers of extinct species are noted with short bars, while the extinct genus is assumed to have five now extinct species. Small genera are mostly ancient and clustered towards the base of the caulogram.
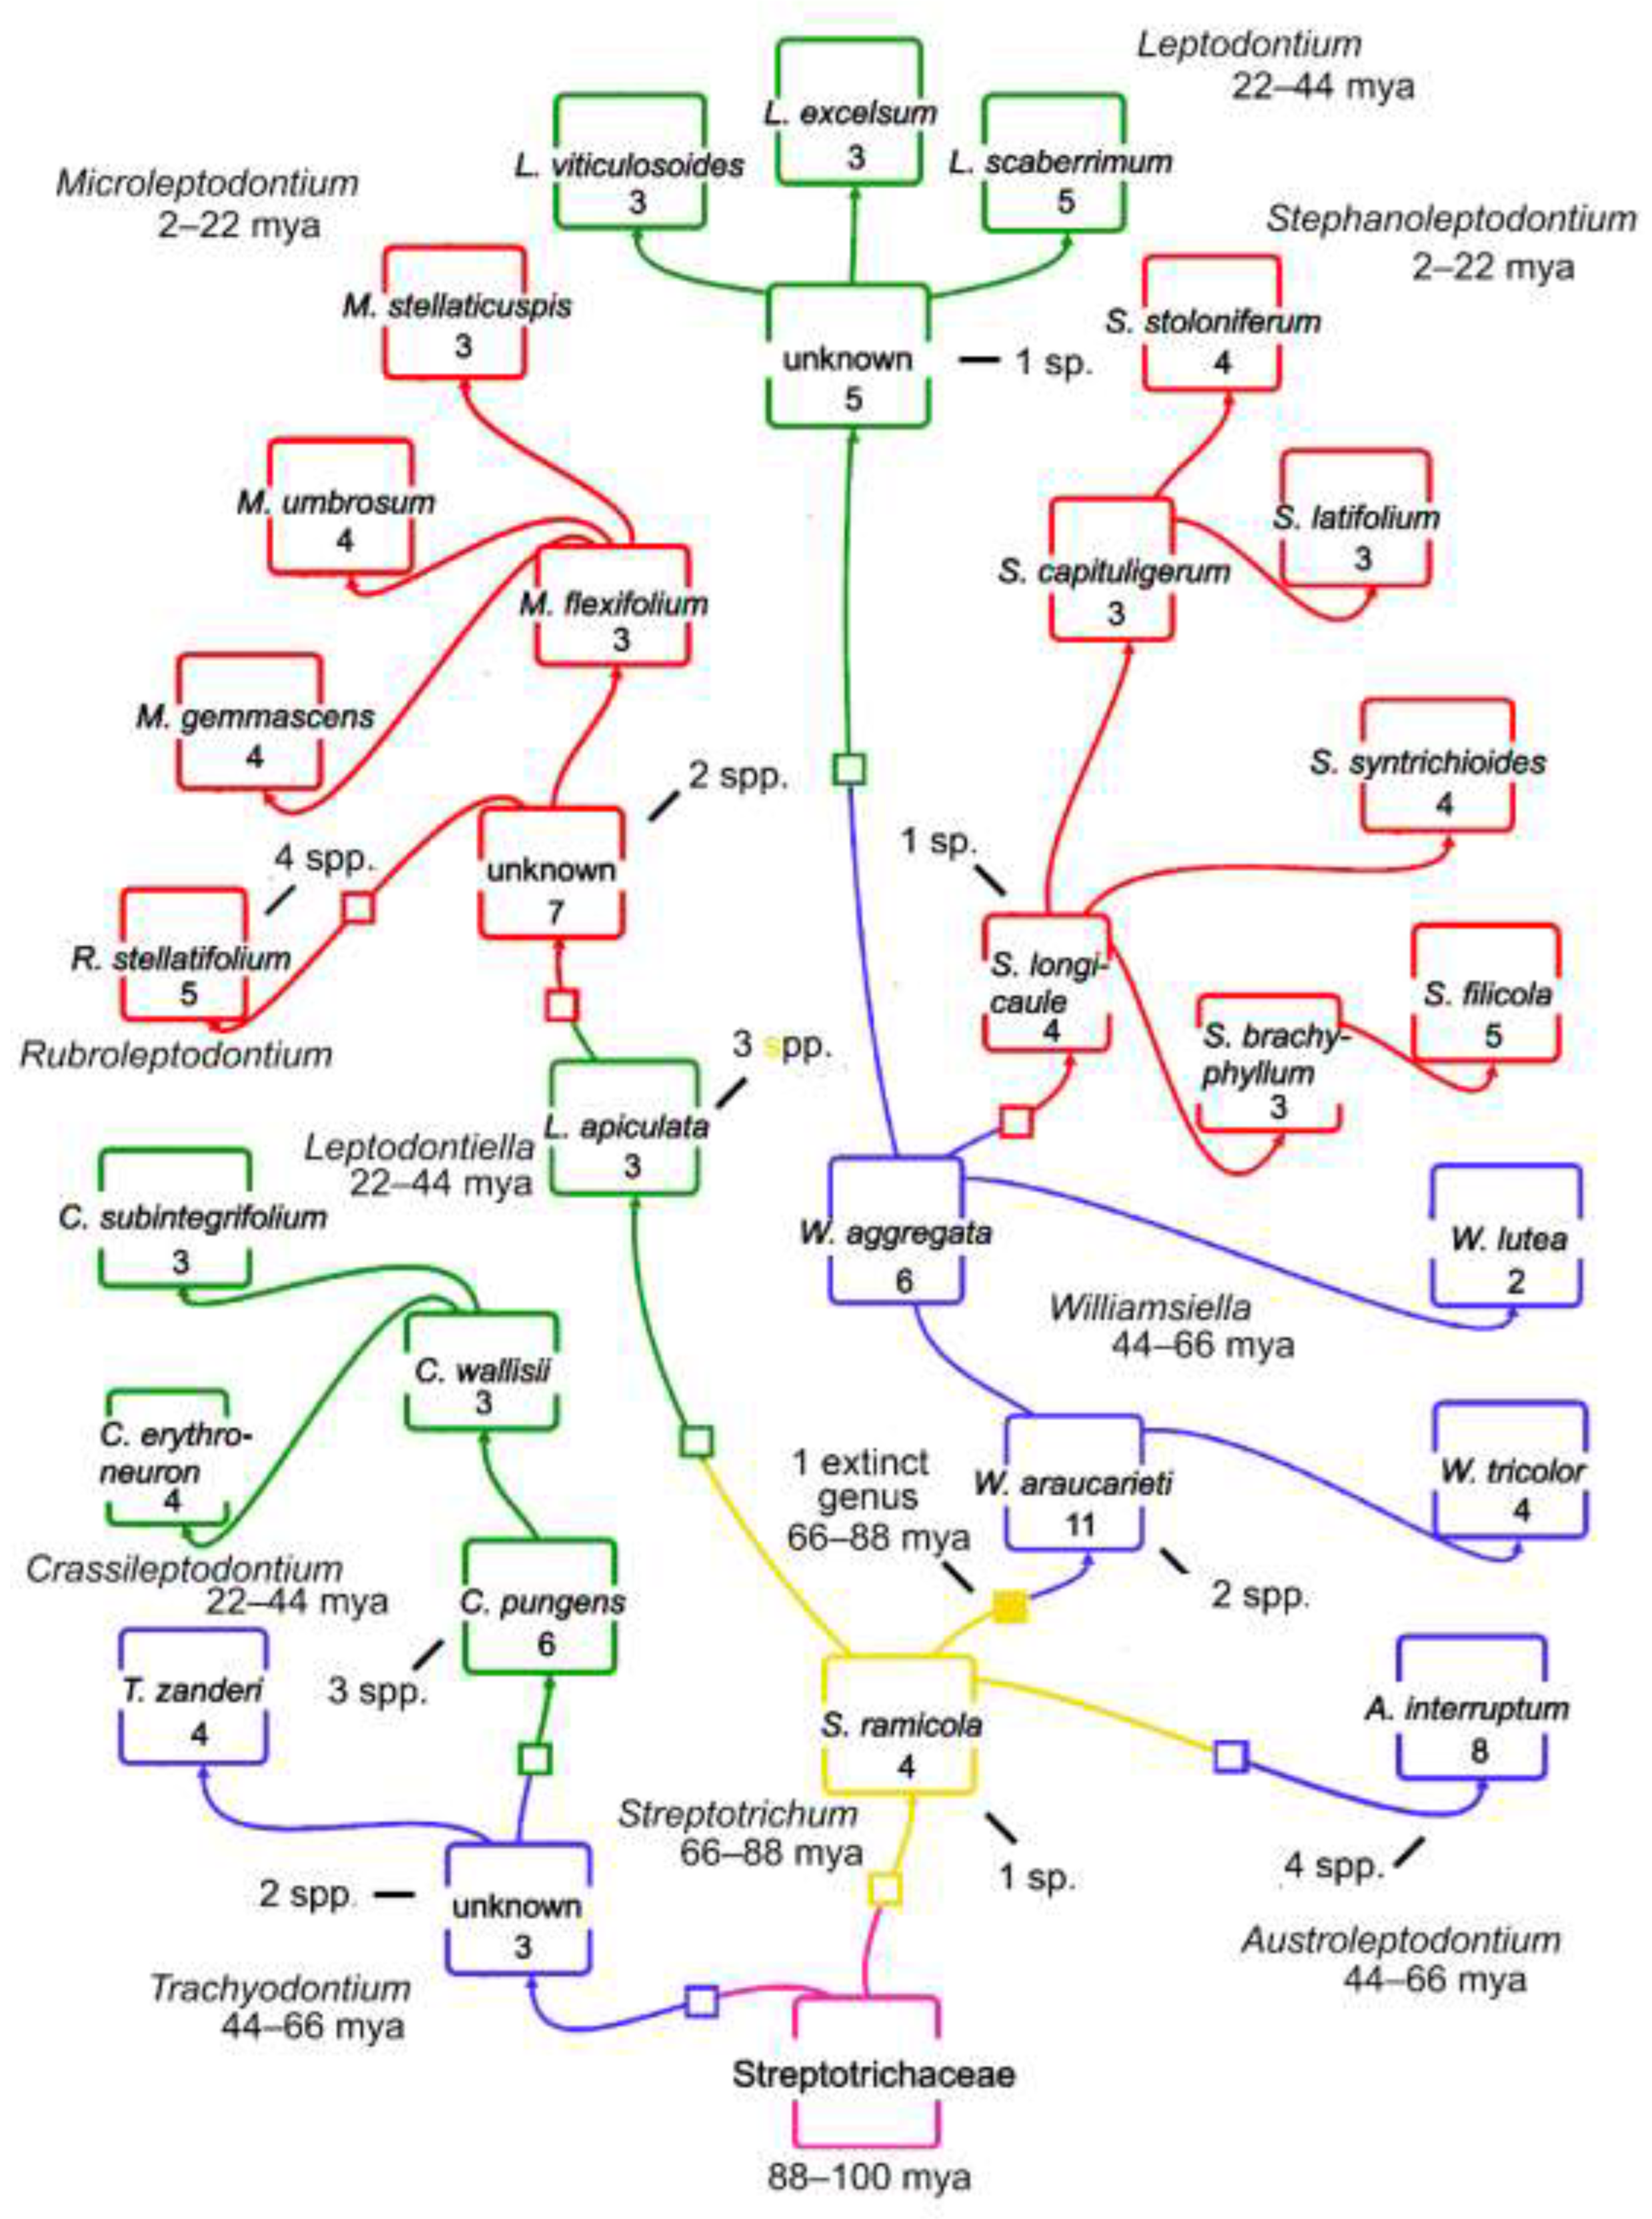
There are three “unknown” ancestral species inferred for the genera Leptodontium, Microleptodontium and Trachyodontium. These are needed as shared ancestors to account for somewhat disparate descendants and are scored as extinct species. The interpolation of an extinct genus and three unknown ancestral species is quite like the familiar technique of phylogenetic bracketing for elucidation of soft tissues in the study of fossils [26]. Terminal genera with less than four descendant species are assumed to be undergoing extinctive reduction in numbers, not being simply young and unfinished in speciation. This is because the two or three extant descendant species are more probably evidence of a past burst of speciation, not that we, at this one moment in geological time, are in any probability in the middle of such a burst.
The number of extinct species in each genus is simply the optimal number four minus the number of extant species that are immediate descendants of the inferred ancestral species. Species that are descended from immediate descendants, by secondary ancestry, are considered potential seeds of new genera, and are generally allopatric. The ancestor in a genus derived from the ancestor of another genus is scored as an immediate descendant of that other genus.
A species extinction is implied when a presumed ancestral species is absent. If too great a number of traits is found between two genera, then an entire extinct genus of five species is interpolated.
3. Results
A caulogram (Fig. 1) of the “Weissia Probe” of Zander [5] emphasizes that two sub-lineages, the genera Chionoloma and Tainoa, follow the rule of one ancestor with optimally four descendant species as established by Zander [5] based on 30 different genera of Pottiaceae. There is only one apparently extinct species among these two small mostly endemic genera. The three species estimated as extinct in the Hymenostomum sub-lineage is doubtless an artifact as that group is more speciose and of worldwide distribution. Self-sustainability of Chionoloma and Tainoa is strong, and estimated at 22 million years.
Evaluation of past extinction rates must reflect the fact that geologic time affects apprehension of geologic space. Over 22 my, for example, the geographic region of distribution of a species may be large, scattered, and variable, and the terms sympatric and allopatric are less distinct.
The results of analysis of extinction in Streptotrichaceae is given in Table 1, which evaluates the annotated caulogram (Fig. 2). This study is based on a world monograph [3] and includes all known species. There are 10 extant genera and 27 extant species. The family lineage extends back to the Late Cretaceous with roots much earlier as implied by the sub-basal connection of the somewhat anomalous genus Trachyodontium.
Interpretations of data in Table 1 details the speciation and extinction rates across geologic time in a large family of bryophytes, and is the first study to do so.
3.1. Cumulative Total Extant Genera, Past To Present
The 10 extant genera have increased by about 3 genera per interval. Only one genus is assumed to have gone extinct, although there are three ancestral species (labeled “unknown”) inferred as probably extinct, leaving descendants with new traits considered advanced.
3.2. Cumulative Extant Species, Past to Present
The 27 extant species accumulate by doubling in each of the last three intervals.
3.3. Cumulative Extant Species/Extant Genera
Extant species per genus increase with recency.
3.4. Total Genera For That Interval, Including 1 Interpolation
Total genera, including an implied genus, are the about same for the last three intervals. If the implied extinct genus of five species is included, then total genera generated per interval is about the same for each interval. The rate of genus generation is about three genera per 22 my intervals, and the only evidence the extinction of an entire genus is one in the 66–88 mya interval, interpolated in Fig. 2.
3.5. Total Extant Species for That Interval, Not Including Unknown Genera
Total extant species increase by two for each of the last three intervals.
3.6. Extant Species/Genera
Extant species per genus increase significantly over time through extinction, not as increased number over the optimal four descendants per ancestor, i.e. not as secondary descendant species.
3.7. Extinct Species Per Interval
This is calculated as the optimal four minus the number of actual descendant species for each genus, including unknown genera, and extinction of numbers of species is about the same during each interval.
3.8. Cumulative Extinct Species
The total estimated extinct species is 31, compared to 27 extant species. These balance in number, but there are more ancient extinct species than there are recent extinct species, and more recent extant species than ancient extant species.
3.9. Immediate Descendants For That Interval, Including Interpolations
Total immediate descendant species are about the same in each interval.
3.10. Immediate Descendants/Genera For That Interval
Immediate descendant species per genus are about the same in each interval.
3.11. Secondary Descendants For That Interval
Total secondary descendant species are most prevalent in the most recent interval. Secondary descendants are scored from species in that genus; the ancestor of a different genus is not considered a secondary descendant. Secondary descendants are here assumed to be the potential beginnings of new genera.
3.12. Secondary Descendants/Immediate Descendant Species For That Interval
Secondary descendant species are more prevalent compared to immediate descendants in the most recent interval. This implies that secondary descendants go extinct more rapidly than immediate descendant species. This may be due to loss of critical traits (partial overwriting of immediate ancestron) or simply pressures of unusual allopatric habitats, or both.
4. Discussion
Why is the number of four descendants to be considered optimal as suggested by NK evaluation with random Boolean network analysis [5,16,17]? Four seems to be a magic number even in inorganic chemistry where many compounds have a multiple of four atoms in their basic unit structure. This has been termed the rule of four, and there is apparently no convincing explanation beyond a correlation with loose packing arrangements maximizing free volume [27]. The appearance of an optimal four descendant species, and four traits per species in evolution, is apparently an emergent process in complexity theory. Perhaps this number is optimum on account of the selective value of punctuated equilibrium? This has been discussed for molecular trees [28,29] where a sequence of molecular lineages leads only to several exemplars of that species, showing molecular differentiation but no evolutionarily important phenotypic differentiation.
Punctuated equilibrium in the usual sense of a burst of fossil evolution [30,31,32] can be invoked because increasing time between speciation events reduces available habitat space logarithmically by competition with other immediate descendants. Of course, at geologic time scales, coeval descendants may be generated over the course of a million years, accumulating DNA mutations, yet still have the same immediate ancestrons. Short branches on a phylogram imply a burst of descendant origination followed by stasis. If the four descendants were generated all at once (“once” being within a short geological time span like a million years), then each would address 25% of available sympatric habitat. On the other hand, if not at once, but generated serially, and each distant in time, then if the first occupied all the habit, there would be no space for the remaining three.
Consider the case of four descendants from a shared ancestral species. If generation occurred at the time the first descendant occupied 1/2 the habitat space, then the second descendant, if there were only two, would occupy 1/4 the space (the first gets 1/2, then after the second is generated, the two split the remaining 1/2). And so on, each successive immediate descendant gets 1/2 of space left. The third gets 1/8, that is, the first gets 1/2, the second gets 1/4, the third gets 1/8. And the fourth gets 1/16. This is the worst case for serial origination. If all four descendants were generated close together but not all at once, then the fourth descendant would get somewhere between 25% and 6.25% of available habitat. The range is logarithmic, by powers of 2.
In the case of five descendants, the range is between 20% and 3.25% (1/32). But this assumes that the ancestor is absent, which it seldom is. In fact, it lingers longest in the tail of a lineage. Thus, optimal sharing of sympatric space for descendant species is when each species has about the same amount of habitat. The fewer the descendants, the more habitat each species has, while a short time between speciation events avoids logarithmic reduction in available habitat for new species. But the fewer the descendants, the greater is the chance that the genus will go extinct.
The rate of extinction, if high, trims species, particularly secondary descendants, from genera over time. Optimum lineage-level selection for survival resulting in long-term sustainability is when a lineage balances the rate of descendant survival with the rate of extinction over geological time such that the lineage retains ancient genetic traits in remnants of ancient genera. It comes down to a high degree of vagility and a low rate of extirpation, operating under natural selection at species, genus and ecosystem levels. Protecting the availability of ancient traits enhances the evolvability of the whole lineage that supports survival during serial repetitions of similar large-scale or global environmental perturbations.
In other words, natural selection occurs at the lineage level affecting ecosystems through time. Examples of ancient trait combinations contributing to lineage survival are the generation of robust genera from antique genera—such as Crassileptodontium from Trachyodontium (its unknown ancestor), Williamsiella from Streptotrichum ramicola, and Microleptodontium from Leptodontiella apiculata.
Lovejoy and Spiridonov [33] evaluated the balance of relative effects on macroevolution biodiversity of the environment (with climate as proxy) and of intrinsic life processes (extinction and speciation) over geologic time. They found that 34 my was a critical crossover time with “Red Queen” life processes operating at shorter intervals and “Court Jester” environmental processes at longer times. These crossover times occurred across 1 to 400 my. Their stochastic model emphasizes a probabilistic expression of changes in biodiversity at geological time levels. Rampino and Caldeira [34] reviewed several reports of environmental oscillations with cycles of around 30 my, including sea-level changes, episodes of volcanism, climate and biological extinctions, occurring over hundreds of millions of years. They suggest a shared modulation in the earth’s mantle as a potential cause. Substituting 30 my for the presently estimated 22 my interval for genus formation would push the origination of the Streptotrichaceae back from 88 mya to 120 mya, still within the envelope of calibration.
François [35] introduced an N-epoch stochastic model of species generation from an ancestor that is like a Yule birth-death model but with unequal diversification rates backward in time such that each ancestral species leaves more descendant species in recent time periods than in ancient time periods. This produces a hollow curve that fits actual data better, with reptiles as examples. Most taxa apparently follow a species per genus hollow curve [36]. According to François, Reptilia consists of about 10,885 species in 1,196 genera, averaging 9.1 species per genus. The hollow curve of frequencies of numbers of species per genus bends most sharply at five species per genus, both with standard modeling and more strongly using the N-epoch model. Thus, although the average number of species per genus is about nine, most genera have one to five species and the fewer genera of greater numbers of species level off as an asymptote. The import of the present study is that the complexity-based evolutionary rule of four descendants per ancestor may have a major probabilistic component [36] that works well with punctuated equilibrium to stabilize the lineage through geologic time. Nottale et al. [38] have shown that evolutionary events mapped to evolutionary trees also follow a power law resulting in a hollow curve, and that logarithmic evolutionary behavior is self-similar across scales of organization.
That this is a process occurring at large scales agrees with the study of Plotnick and Sepkoski [39], which found that the Self-Organized Criticality of chaos theory, which derives large changes from small beginnings, may not be operative. The result of natural selection does not then necessarily depend on cascades of fitness but on feedback at the ecosystem level. Instead, patterns of self-similarity appear to change at periods of about 25 my as a periodic imposition on a random background. Sepkoski’s suggestions is curiously similar to the present model of 22 my intervals for genus generation. Complexity theory, in this case, operates while chaos theory does not or does so in shorter time periods. For the estimated 100 my of the existence of the Streptotrichaceae, biodiversity is apparently governed by Red Queen effects although there may have been two or three major environmental cross-overs imposing changes from environmental perturbations.
5. Conclusions
The main findings are summarized (Fig. 3) as a tadpole-shaped “space-time ship Earth” or at least a large lifeboat of such. It has been suggested that there are no biological laws relevant to evolutionary systematics as reliable as there are in physics, except possibly that of Dollo parsimony [40] p. 101. The present paper presents evidence that the Streptotrichaceae lineage travels through time and space by very gradually losing ancient genera and species and building ordered sets of new genera and species following complexity-based rules, these powered by natural selection [5,41,42,43]. In this case, these minimal rules seem to be (1) an optimum of four immediate descendants, (2) the projection of all the most recently evolved traits of a genus’s immediate ancestor into its immediate descendants (developing a shared novon), (3) descendant species in a genus tending to appear all at the same time (across a geological time scale), and (4) ancient genera both persisting and generating new genera. The resulting lineage maintains an optimal ability to regenerate across time, is, by its very existence, resilient to a series of recurring environmental perturbations, and contributing to differential survival of ecosystems.
Figure 3.
Tadpole-shaped phylogeny outlining cumulative numbers of genera, species, and estimated extinct species for four 22 my intervals. Only one genus is considered extinct, lost 66–88 mya. If preservation of ancient traits is accomplished by balancing speciation and extinction through fractal genus architecture, then this stretched-out branching lineage that is several genera deep may be universal and also extend in a concatenation of tadpoles back in time.
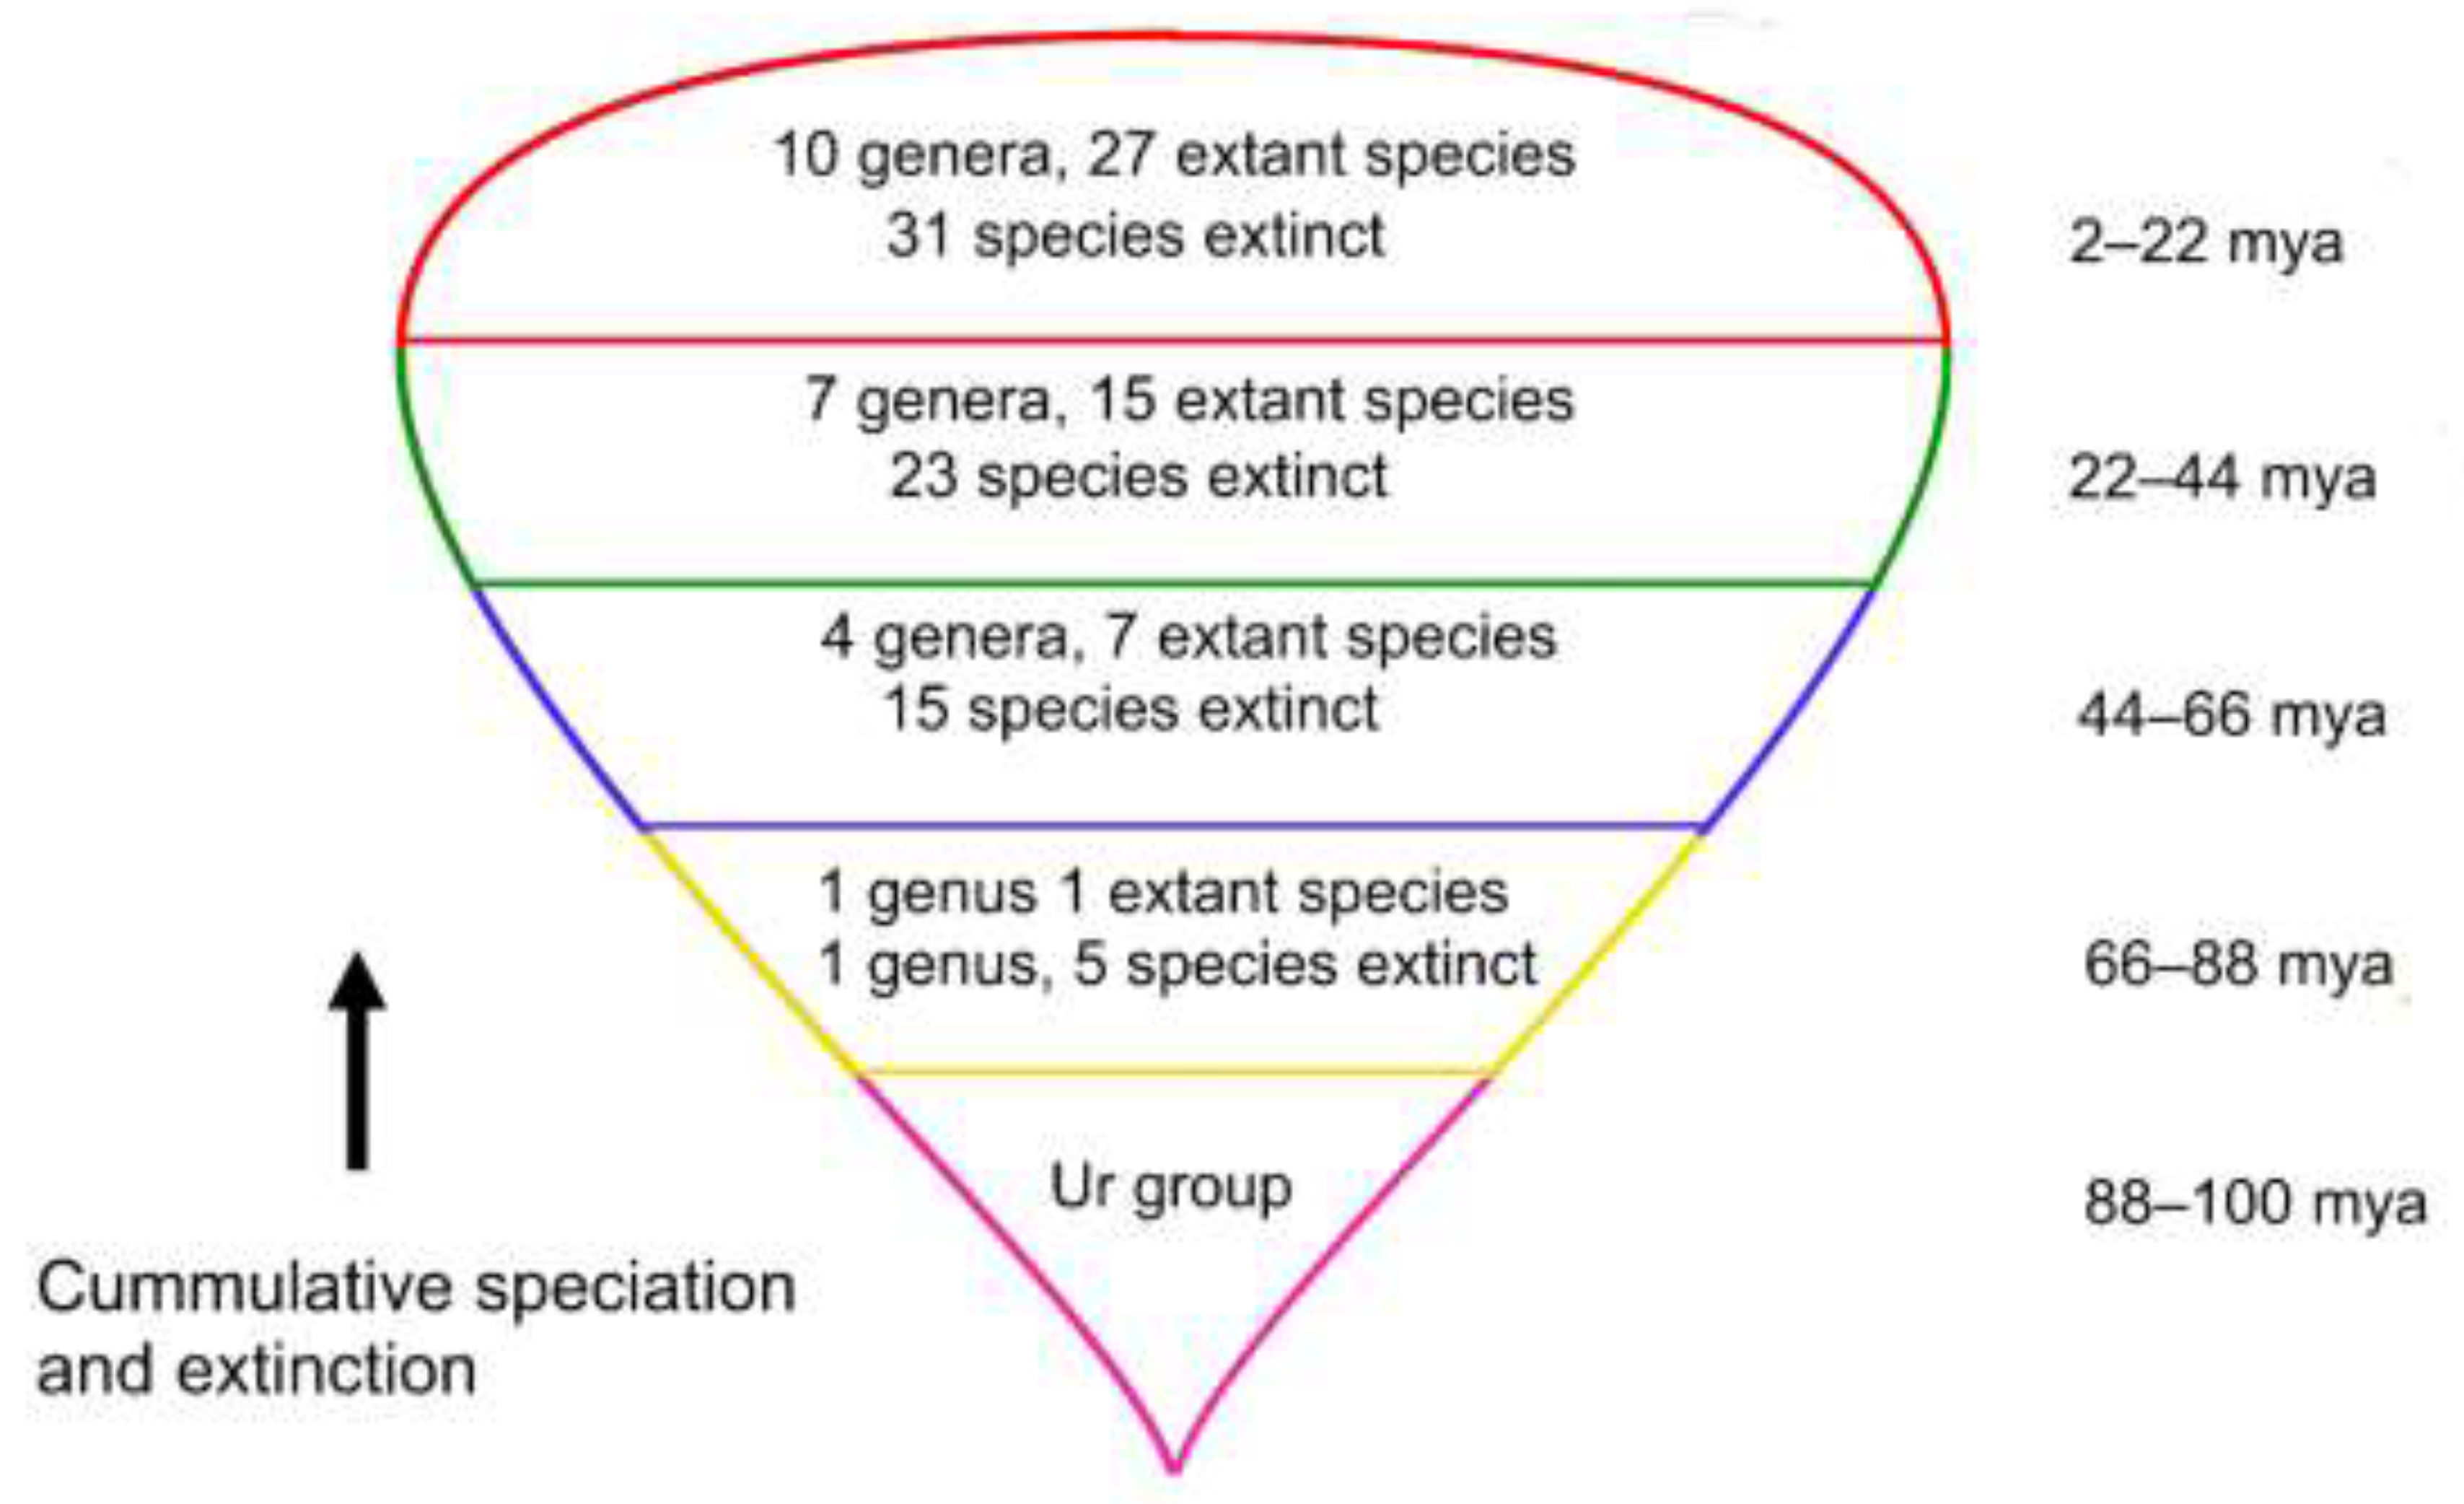
One might speculate that, if complexity-based evolutionary processes are common to all lineages, then those lineages of ancient taxa existing prior to the modern bryoflora throughout the Mesozoic may perhaps concatenate in the same tadpole-like phylogenetic conformation. Evidence of the existence of a tadpole lineage penultimate to Pottiaceae and Streptotrichaceae is the appearance of the apparently ancient genera Luisierella and Timmiella at the very base of the molecular [44] tree somewhat below the insertion of the Pottiaceae although both are clearly pottiaceous in character but either much reduced (the former) or much elaborated morphologically (the latter). Timmiella is also at the base of the morphological cladogram [45] but Luiserella is not, probably because of the extreme reduction in informative morphological traits. Other pre-middle Cretaceous intermediate and possibly more informative taxa in this lineage ancestral to the Pottiaceae, Streptotrichaceae, and perhaps other families, may be assumed extinct.
Survival of a robust lineage will theoretically contribute to the entropic balance (Brooks and Wiley [46] of the inhabited ecosystem—in the present case of the wide-ranging Streptotrichaceae, the páramos and largely montane forests, soils, and lavas of the tropical and sub-tropical ecosphere [3].
The above detailed implementation of a strict morphological evolutionary clock has, to my knowledge, not been done before, but it hangs together well, that is, it integrates to a causal whole as a kind of uniformitarianism. There are distinctive similarities between intervals that imply overarching processes. The evolutionary rule of four (e.g. an optimal four descendants and four traits in the novon) applies to each interval. The 27 extant species accumulate by doubling in each interval, and total new genera are about three per interval. New extant species increase by two during the last three intervals. The number of extinct and extant species nearly balance across the ages. The number of immediate descendants is about the same for each interval. Even with the absence of data on extinct species, it is clear that the groups discussed here are massively self-sustaining. The underlying processes may be the same for all lineages of bryophytes and would support the use of a strict morphological tree. It would be helpful, of course, if in the future one could find geographic regions isolated for intervals longer than that of the West Indies and found additional direct calibrations of the time of evolution of series of morpho-genera.
Funding
This study was not funded by outside sources.
Institutional Review Board Statement
Not applicable.
Acknowledgments
The Missouri Botanical Garden is saluted for its continued support of bryophyte systematics.
Conflicts of Interest
The author reports there are no competing interests to declare.
References
- Zander, R.H. Integrative systematics with structural monophyly and ancestral signatures: Chionoloma (Bryophyta), Acad. Biol. 2024, 2. [Google Scholar] [CrossRef]
- Zander, R. H. Taxon mapping exemplifies punctuated equilibrium and atavistic saltation. Pl. Syst. Evol. 2010, 286, 69–90. [Google Scholar] [CrossRef]
- Zander, R. H. Macroevolutionary Systematics of Streptotrichaceae of the Bryophyta and Application to Ecosystem Thermodynamic Stability. Edition 2; Zetetic Publications: St. Louis, USA, 2018. [Google Scholar]
- Zander, R.H. Macroevolutionary evaluation methods extended, consolidated, and exemplified with Anoectangium (Pottiaceae) in North America and the Himalayas. Ann. Missouri Bot. Gard. 2019, 104, 324–338. [Google Scholar] [CrossRef]
- Zander, R.H. Fractal Evolution, Complexity and Systematics; Zetetic Publications: St. Louis, 2023. [Google Scholar]
- Zander, R.H. Minimally monophyletic genera are the cast-iron building blocks of evolution. Ukrainian Bot. J. 2024, 81, 87–99. [Google Scholar] [CrossRef]
- Zander, R.H. Lineages of fractal genera comprise the 88-million-year steel evolutionary spine of the ecosphere. Plants 2024, 13, 1559. [Google Scholar] [CrossRef]
- Christenhusz, M.J.M.; Byng, J. The number of known plant species in the world and its annual increase. Phytotaxa 2016, 261, 201–217. [Google Scholar] [CrossRef]
- Clayton, W.D. Some aspects of the genus concept. Kew Bull. 1972, 27, 281–287. [Google Scholar] [CrossRef]
- Elton, C. Competition and the structure of ecological communities. J. Animal Ecol. 1946, 15, 54–68. [Google Scholar] [CrossRef]
- Fenner, M.; Lee, W. G.; Wilson, J.B. A comparative study of the distribution of genus size in twenty angiosperm floras. Biol. J. Linn. Soc. 1997, 62, 225–237. [Google Scholar] [CrossRef]
- Alonso, M.; Jiménez, J.A.; Nylinder, S.; Hedenäs, L.; Cano, M.J. Disentangling generic limits in Chionoloma, Oxystegus, Pachyneuropsis and Pseudosymblepharis (Bryophyta: Pottiaceae): An inquiry into their phylogenetic relationships. Taxon 2016, 66, 3–18. [Google Scholar] [CrossRef]
- Alonso, M.; Jiménez, J.A.; Cano, M.J. Taxonomic revision of Chionoloma (Pottiaceae, Bryophyta). Ann. Missouri Bot. Gard. 2019, 104, 563–632. [Google Scholar] [CrossRef]
- Jauregui-Lazo, J.; Brinda, J.C.; GoFlag, C.; Mishler, B.D. The phylogeny of Syntrichia, an ecologically diverse clade of mosses with an origin in South America. Amer. J. Bot. 2023, 110, e16103. [Google Scholar] [CrossRef] [PubMed]
- Kauffman, S.A. The Origins of Order, Self-Organization and Selection in Evolution. Oxford University Press, Oxford, U.K, 1993.
- Kauffman, S.A. Investigations. Oxford University Press Oxford, U.K., 2000.
- Burlando, B. The fractal geometry of evolution. J. Theor. Biol. 1993, 163, 161–172. [Google Scholar] [CrossRef]
- Green, D.M. Chaos, fractals and nonlinear dynamics in evolution and phylogeny. Trends Ecol. Evol. 1993, 10, 333–337. [Google Scholar] [CrossRef] [PubMed]
- Rodríguez, P.; Strong, M.T. Catalogue of the seed plants of the West Indies Website. 2007. https://naturalhistory2.si.edu/botany/WestIndies/acknowledgments.htm Accessed on 26 April 2024. 26 April.
- Rodriquez-Silva, R.; Schlupp, R.I. Biogeography of the West Indies, A complex scenario for species radiations in terrestrial and aquatic habitats. Ecol. Evol. 2021; 11, 2416–2430. [Google Scholar]
- Bechteler, J.; Peñaloza-Bojacá, G.; Bell, D.; Burleigh, J.G.; McDaniel, S.F.; Davis, E.C.; Sessa, E.B.; et al. Comprehensive phylogenomic time tree of bryophytes reveals deep relationships and uncovers gene incongruences in the last 500 million years of diversification. Amer. J. Bot. 2023, e16249. [Google Scholar] [CrossRef] [PubMed]
- Lacey, W.S. Fossil bryophytes. Biological Reviews 2008, 44, 189–205. [Google Scholar] [CrossRef]
- Miller, H.A. Bryophyte evolution and geography. Biol. J. Linn. Biol. J. Linn. So. 1982, 18, 145–196. [Google Scholar] [CrossRef]
- Ignatov, M.S.; Maslova, EV. Fossil mosses, What do they tell us about moss evolution? Bryophyte Divers. Evol. 2021, 043, 072–097. [Google Scholar] [CrossRef]
- Witmer, L.M. The extant phylogenetic bracket and the importance of reconstructing soft tissues in fossils. Functional Morphology in Vertebrate Paleontology 1995, 1, 19–33. [Google Scholar]
- Gazzarrini, E. , Cersonski, R.K.; Bercx, M.; Adorf, C.S.; Marzari, N. The rule of four: Anomalous distributions in the stoichiometries of inorganic compounds. NPJ Computational Materials. [CrossRef]
- Bokma, F. Detection of “punctuated equilibrium” by Bayesian estimation of speciation and extinction rates, ancestral character states, and rates of anagenetic and cladogenetic evolution on a molecular phylogeny. Evolution 2008, 62, 2718–2726. [Google Scholar] [CrossRef] [PubMed]
- Singh, R.S. Toward a unified theory of speciation. In Singh, R.S.; Krimbas, C.B. Evolutionary Genetics, from Molecules to Morphology. Cambridge University Press, Cambridge. U.K., 2000, p. 570–604.
- Eldredge, N. Macroevolutionary dynamics. McGraw-Hill Publishing Company New York, 1989.
- Gould, S.J. The Structure of Evolutionary Theory. Belknap Press of Harvard University Press, Cambridge (USA), 2002.
- Gould, S.J.; Eldredge, N. Punctuated equilibrium comes of age. Nature 1993, 366, 223–227. [Google Scholar] [CrossRef]
- Lovejoy, S.; Spiridonov, A. The fractional macroevolution model, A simple quantitative scaling macroevolution model. Paleobiology 2024, 1–25. [Google Scholar] [CrossRef]
- Rampino, M.R.; Caldeira, K. A 32-million year cycle detected in sea-level fluctuations over the last 545 Myr. Geoscience Frontiers 2020, 11, 2061–2065. [Google Scholar] [CrossRef]
- François, O. A multi-epoch model for the number of species within genera. Theor. Popul. Biol. 2020, 133, .97–103. [CrossRef]
- Krug, A.Z.; Jablonski, D.; Valentine, J.W. Species-genus ratios reflect a global history of diversification and range expansion in marine bivalves. Proc. Roy, Soc. B, 1117. [Google Scholar]
- Raup, D.M.; Sepkoski, J.J., Jr. Periodic extinction of families and genera. Science, 1126. [Google Scholar]
- Nottale, L.; Chaline, J.; Grou, P. On the fractal structure of evolutionary trees. In Losa, G.; Merlini, D.; Nonnenmacher, T.; Weibel, E. (eds). Fractals in Biology and Medicine, Vol. 3, Proceedings of the Third International Symposium, Ascona, Switzerand, March 8–11, Birkhauser Verlag, 2000, p.
- Plotnick, R.E.; Sepkoski, J.J., Jr. A multiplicative multifractal model for originations and extinctions. Paleobiology 2001, 27, 126–139. [Google Scholar] [CrossRef]
- Wheeler, Q. Species, Science and Society; Routledge: London, New York, 2024. [Google Scholar]
- Hilborn, R.C. Chaos and Nonlinear Dynamics. Second Edition; Oxford University Press. Oxford, U.K., 2000.
- Poundstone, W. The Recursive Universe. Cosmic Complexity and the Limits of Scientific Knowledge; William Morrow, New York, 1985.
- Schroeder, M. Fractals, Chaos, Power Laws, Minutes from an Infinite Paradise. W. H. Freeman. New York, 1991.
- Inoue, Y.; Tsubota, H. On the systematic position of the genus Timmiella (Dicranidae, Bryopsida) and its allied genera, with the description of a new family Timmiellaceae. Phytotaxa 2014, 181, 151–162. [Google Scholar] [CrossRef]
- Zander, R.H. Genera of the Pottiaceae, mosses of harsh environments. Bull. Buffalo Soc. Nat. Sci. 1993, 32, 1–378. [Google Scholar]
- Brooks, D.R.; Wiley, E.O. Evolution as Entropy: Toward a Unified Theory of Biology; University of Chicago Press: Chicago, IL, USA, 1988. [Google Scholar]

Table 1.
Comparison of extinction per 22 my intervals for extant taxa in Streptotrichaceae over 88 my. Not included in this table is an Ur group of this family assigned the interval 88–100 mya generating two main lines of genera but of which little else is known.
Table 1.
Comparison of extinction per 22 my intervals for extant taxa in Streptotrichaceae over 88 my. Not included in this table is an Ur group of this family assigned the interval 88–100 mya generating two main lines of genera but of which little else is known.
| Time interval, past to present | 66–88 mya (yellow) | 44–66 (blue) | 22–44 mya (green) | 2–22 mya (red) |
| (1) Cumulative total extant genera | 1 | 4 | 7 | 10 |
| (2) Cumulative extant species | 1 | 7 | 15 | 27 |
| (3) Cumulative extant species per genus | 1 | 1.75 | 2.15 | 2.7 |
| (4) Total genera for that interval | 2 (incl. 1 interp.) | 3 | 3 | 3 |
| (5) Total extant species for that interval | 1 | 6 | 8 | 12 |
| (6) Extant species per genus | 0.5 | 2 | 2.67 | 4 |
| (7) Species extinct in each interval | 6 (incl. 5 interpol.) | 9 | 8 | 8 |
| (8) Cumulative extinct species | 6 | 15 | 23 | 31 |
| (9) Immediate descendant species | 3 (all inerpol.) | 3 | 5 | 5 |
| (10) Immediate descendants per genus | 0.5 | 1 | 1.67 | 1.67 |
| (11) Secondary descendant species | 0 | 1 | 2 | 7 |
| (12) Secondary descendant per immediate descendant species | 0 | 0.33 | 0.4 | 1.4 |
Disclaimer/Publisher’s Note: The statements, opinions and data contained in all publications are solely those of the individual author(s) and contributor(s) and not of MDPI and/or the editor(s). MDPI and/or the editor(s) disclaim responsibility for any injury to people or property resulting from any ideas, methods, instructions or products referred to in the content. |
© 2025 by the authors. Licensee MDPI, Basel, Switzerland. This article is an open access article distributed under the terms and conditions of the Creative Commons Attribution (CC BY) license (http://creativecommons.org/licenses/by/4.0/).
Copyright: This open access article is published under a Creative Commons CC BY 4.0 license, which permit the free download, distribution, and reuse, provided that the author and preprint are cited in any reuse.


