Preprint
Article

This version is not peer-reviewed.

Predominant Pneumococcal Serotypes in Isolates Producing Invasive Disease in a Spanish Region: Study of Their Relationship with Clinical Factors, Antimicrobial Resistance and Vaccination Coverage

A peer-reviewed article of this preprint also exists.

Submitted:

15 January 2025

Posted:

16 January 2025

You are already at the latest version

Abstract

Pneumococcus is a significant pathogen due to its high morbidity and mortality rates, especially among vulnerable populations. This study investigates the epidemiology of Streptococcus pneumoniae serotypes causing invasive pneumococcal disease in the Region of Comunidad Valenciana, analyzing data from 1587 isolates collected between 2014 and 2023. Serotyping and antimicrobial sensitivity were assessed, and whole genome sequencing was conducted on 104 isolates to examine clonal relationships. The study found that serotype 8 was the most common (17.5%), followed by serotype 3 (14.7%). There were significant variations in serotype distribution over the years, with serotype 8 increasing notably from 2019 onwards, while serotype 19A has decreased. Age was a significant factor, with serotype 8 being more prevalent in individuals older than 10 years. The overall patient recovery rate was 72%, with the higher mortality observed in serotypes 3 and 15A. Vaccination rates were higher among children under five, and the study highlighted the necessity for continuous monitoring of vaccine efficacy. Antimicrobial resistance was most significant for erythromycin (20%) and clindamycin (16%), with serotypes 19A and 6C showing the highest resistance rates. Whole genome sequencing revealed that ST53 and ST180 were the predominant sequence types for serotypes 8 and 3, respectively, reflecting global trend. The study underscores the importance of ongoing surveillance to adapt vaccination strategies and antimicrobial treatments, given the dynamic nature of pneumococcal epidemiology and resistance patterns. The findings also emphasize the need for targeted interventions to manage high-risk serotypes and improve patient outcomes.

Keywords: 
;  ;  ;  

1. Introduction

Pneumococcus is an important pathogen for its high morbidity and mortality, especially in patients of extreme ages or with underlying diseases that compromise their immunity. This can lead to invasive pneumococcal disease (IPD) [1,2]. IPD is defined as any isolation of S. pneumoniae in sterile fluids, such as blood, cerebrospinal fluid, synovial fluid, pleural exudate, or pericardial fluid. The risk of developing IPD in a previously colonized patient is related to the serotype [2].
Polysaccharide and conjugate vaccines have been developed based on the most prevalent capsular serotypes in IPD, demonstrating high efficacy in preventing and reducing infection. The introduction of these vaccines has modified the epidemiology of the bacterial population, making continuous surveillance studies necessary [3]. The pneumococcal serotypes causing invasive disease vary between geographical areas, and their distribution depends on the period studied [4]. This is important as current vaccines are based on a selected number of serotypes.
Another aspect that highlights the importance of studying this microorganism is the relationship between serotype and antimicrobial resistance. Certain serotypes show a higher frequency of resistance to penicillin and/or other antibiotics, underscoring the need for resistance surveillance. For many years, penicillin has been the treatment of choice for S. pneumoniae due to its great bactericidal activity and low minimum inhibitory concentrations (MICs). However, the prevalence of penicillin-resistant strains has increased worldwide, with Spain being one of the countries with the highest percentage of resistance, for example, in a study of pneumococcal disease in the Community of Madrid between 2007 and 2022, the percentage of penicillin resistance was 32.3% [5]. Approximately 6% of isolates show resistance to cephalosporins in Europe [
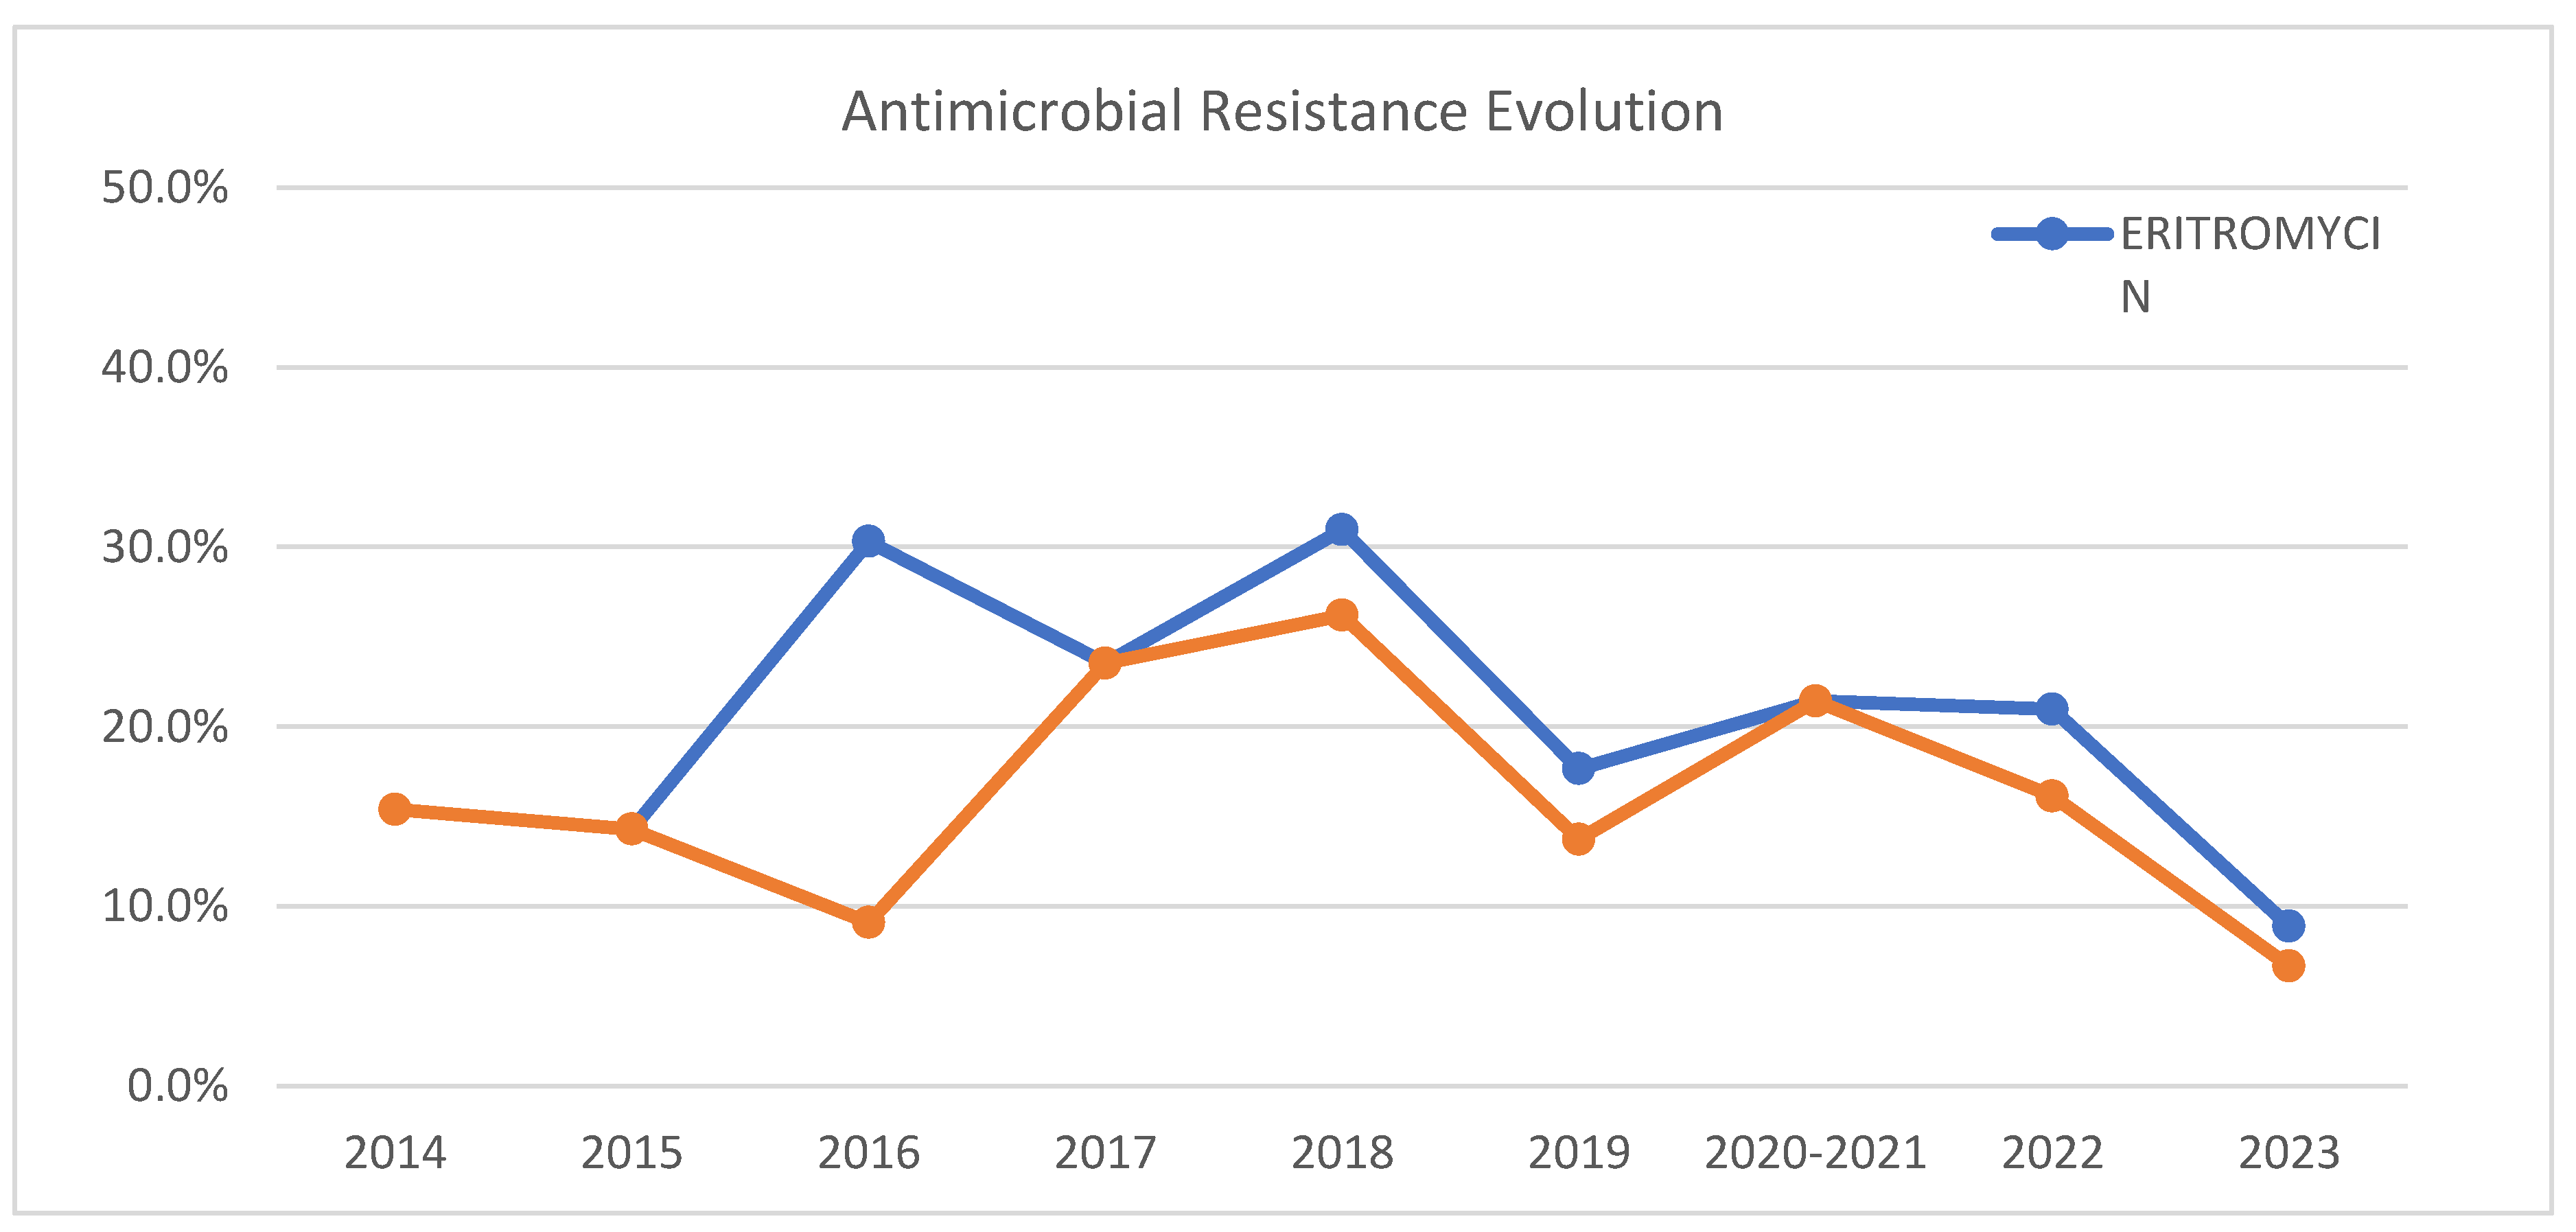
6]. With respect to macrolides, the frequency of resistant strains in Spain has increased over the last two decades, reaching 33.2%-46.8% in non-invasive strains and 20-30% in invasive strains [7,8], mainly due to high consumption. Quinolones, despite being among the treatments of choice for non-severe pneumonia in adults, maintain very low resistance rates, around 3% of isolates in our geographical area [9], probably because their use is not recommended in children, who are the major reservoir of pneumococcus. It is noteworthy that there is a lack of recent studies on pneumococcal antimicrobial susceptibility in our area.
The objective of this study has been to establish the epidemiology of the distribution of different Streptococcus pneumoniae serotypes causing IPD and their prevalence in the Region of Comunidad Valenciana (CV). Additionally, the relationship among serotypes and clinical factors of the patients has been analyzed, differentiating between those with 0 or 1 comorbidity and those with more than 1. The study also examined serotypes that were more or less frequently associated with resistances. Moreover, next-generation sequencing of a representative group of pneumococcal isolates was performed to analyze clonal relationships.

2. Material and Methods

This is a retrospective longitudinal study analyzing 1587 isolates of Streptococcus pneumoniae causing IPD from various hospitals in the CV during the years 2014-2023.

2.1. Sociodemographic and Clinical Factors Associated with Patients

All the cases data come from IPD records reported to an epidemiological surveillance system (called AVE) from three sources: outpatient information systems, hospital preventive medicine services, and the RedMIVA network [10], which incorporates real-time microbiological test results from hospitals in the CV into the AVE system. The following information was collected and analyzed: age, sex, serotype, infection focus, comorbidities, vaccine coverage, antimicrobial resistance and evolution.

2.2. Serotyping and Study of Antimicrobial Sensitivity

Although each laboratory linked to RedMIVA decides the bacteriological procedure to use for detecting the microorganism, the methods used are generally subjected to the same interpretation standards.
The serotyping of each pneumococcal isolate was performed using the Neufeld capsule test at the Microbiology Service of Hospital La Fe in Valencia or the National Microbiology Center from 2014 to 2021. From 2022 onwards, it was performed using PCR followed by reverse hybridization (S.PneumoStrip, Operon, Immuno & Molecular Diagnostics) by the current reference center for pneumococcal serotyping in the CV, the Consorcio Hospital General Universitario de Valencia.
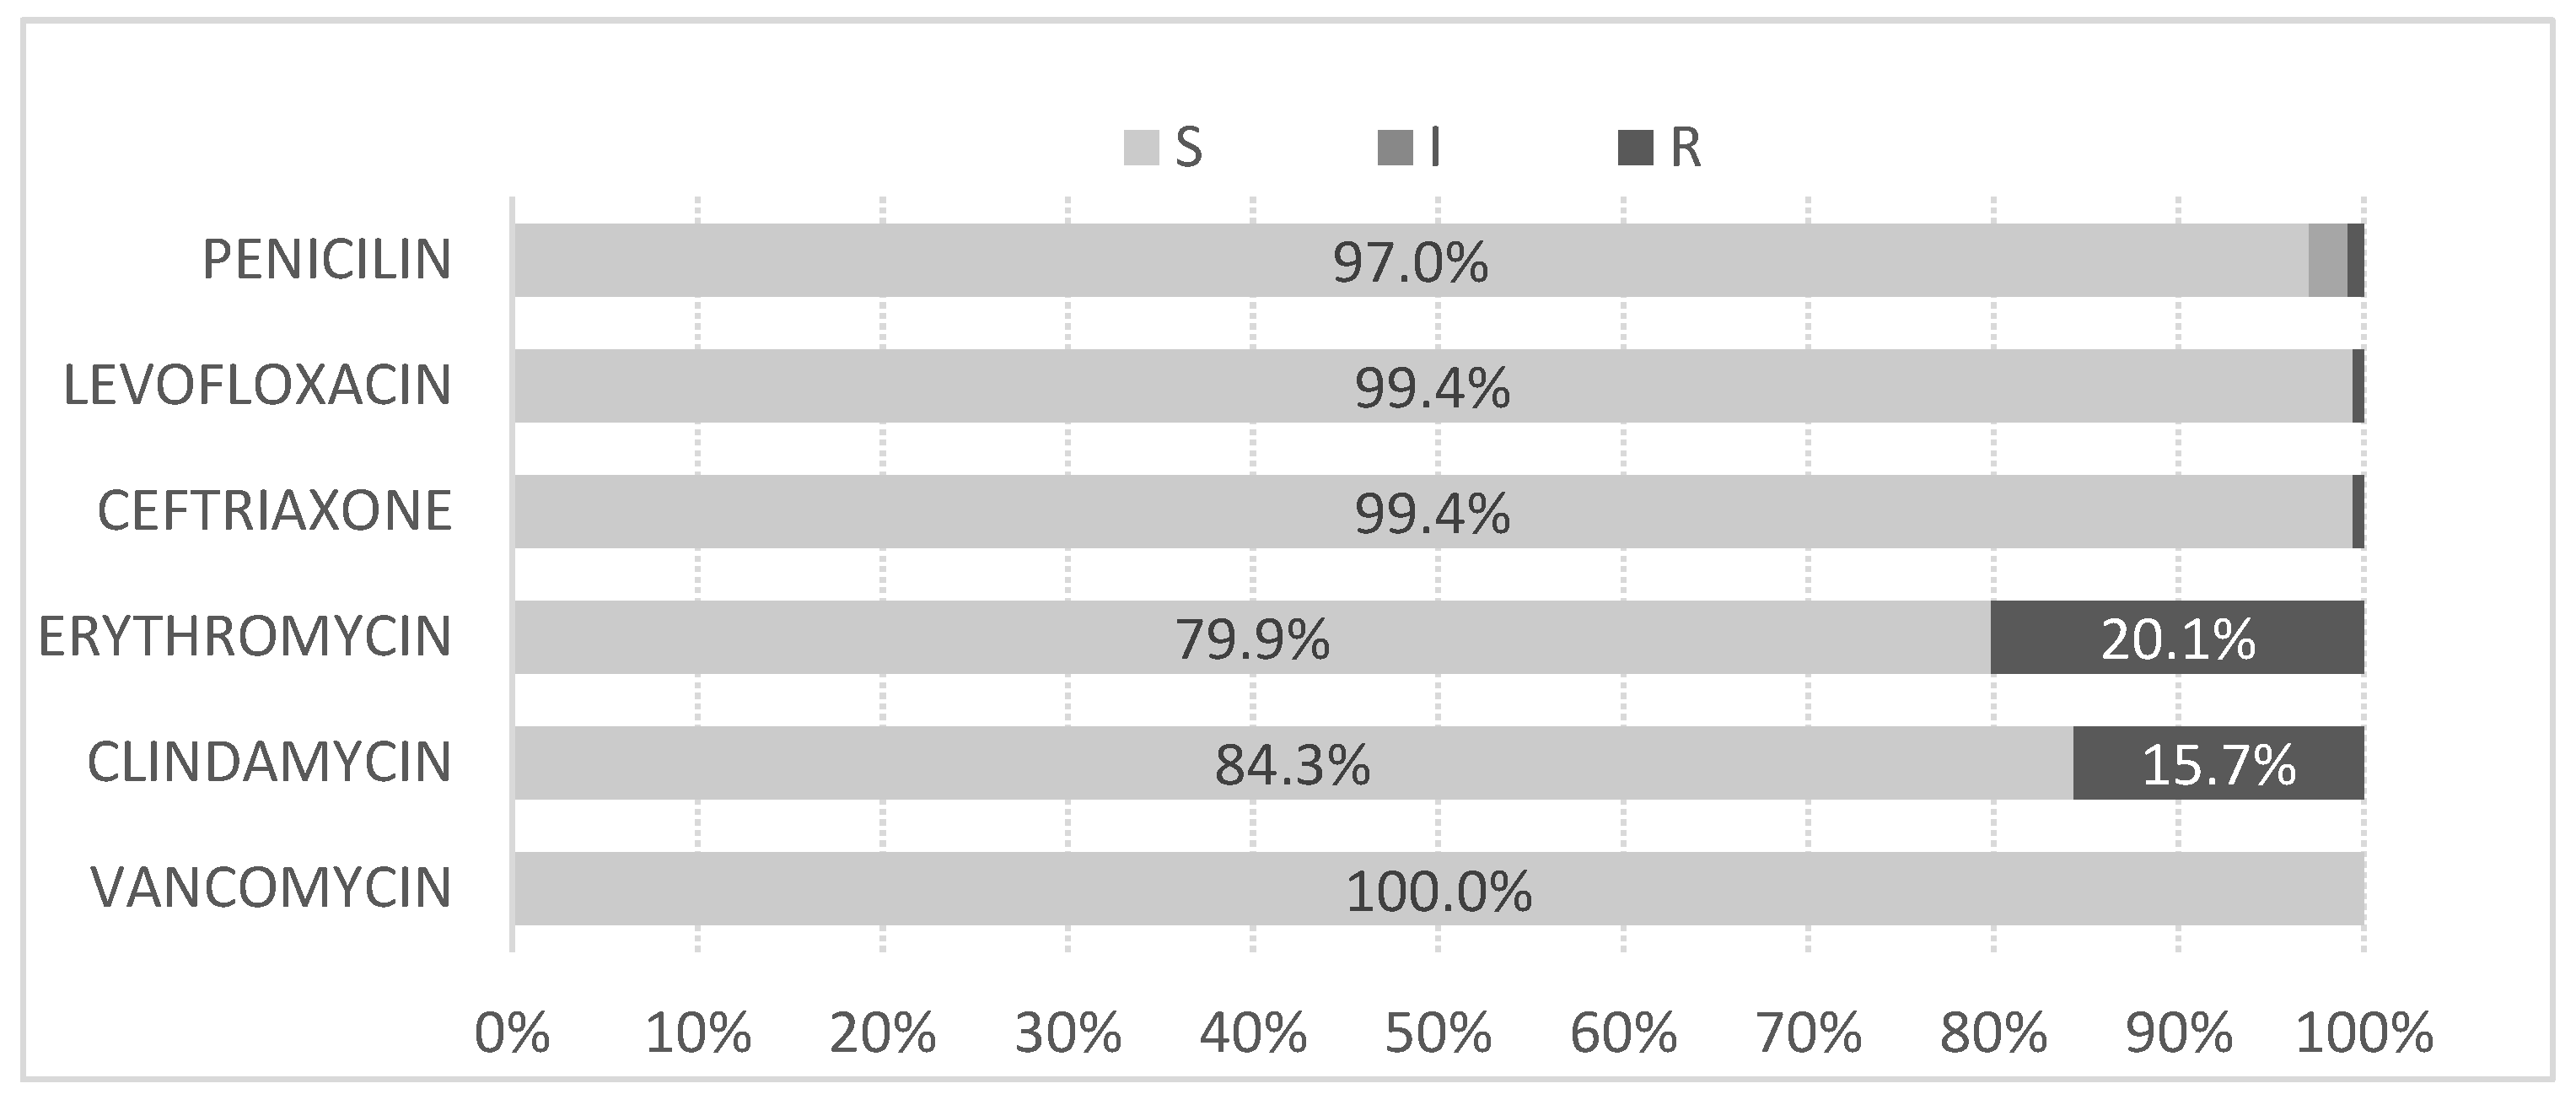
Information on susceptibility to the following antimicrobials was obtained: penicillin, ceftriaxone, vancomycin, linezolid, levofloxacin, erythromycin, and clindamycin. Susceptibility determination followed the values established by the International Clinical and Laboratory Standards Institute (CLSI) and The European Committee on Antimicrobial Susceptibility Testing (EUCAST).

2.3. Whole Genome Sequencing Applied to Clinical Microbiology

Whole genome sequencing was performed on 104 representative pneumococcal isolates. DNA from all strains was purified using the MagCoreR Automated Extraction System DNA extraction kit (RBC Bioscience, New Taipei City, Taipei). DNA libraries were prepared using Nextera XT and sequenced using the NextSeq instrument (Illumina, San Diego, California, United States).

2.4. Bioinformatics Analysis: MLST, Serotype, and Antimicrobial Resistance

INNUca was used for quality assessment of reads, and de novo assembly was performed with SPAdes. The obtained genome sequences were uploaded to Pathogenwatch (https://pathogen.watch/) in FASTA format. This platform was used to obtain the MLST.

2.7. Statistical Analysis

For categorical variables, frequencies and percentages are shown. Differences in parameters between groups were evaluated with Pearson's non-parametric Chi2 test, and only in the case of 2x2 tables, Fisher's exact test was applied. All multiple comparisons were adjusted using Bonferroni correction. All contrasts were accompanied by the effect size estimator to complete the interpretation of the results. For categorical variables, it was Cramer's V. The criteria for the classification of the magnitude of the effect was as follows:
  • Cramer's V1: 0.00-0.09 as negligible, 0.10-0.29 as low, 0.30-0.49 as medium, and 0.50 and above as high. The significance level used in the analyses was 5% (α=0.05)2.
1Diehl, J. M. / Kohr, H.U. (1999). Descriptive Statistics. 12th edition. Klotz Eschborn, p. 161. 2The p-value is, assuming there are no differences between groups, the probability that the obtained results could be due to chance. The smaller the p-value, the lower the probability that the obtained results are due to chance, and the greater the evidence against the null hypothesis (absence of differences). Any p-value less than 0.05 is indicative of a statistically significant relationship. Conversely, a p-value greater than or equal to 0.05 indicates the absence of a relationship.

3. Results

Of all the studied IPD cases, 39.7% were in female, and 60.3% in male. The mean age was 60.63 years (±23.41 years), ranging from 1 to 100 years. When regrouped by age into 5 arms, we observed that 4.03% of IPD cases occurred between 0-4 years, 1.7% between 5-9 years, 14.9% between 10-44 years, 26.4% between 45-64 years, and the majority in the >64 age group, accounting for 52.9%.

3.1. Serotypes

There were 100 different serotypes in the sample. The most common was serotype 8 with 17.5% of cases, followed by serotype 3 (14.7%), and serotypes 22F, 9N, and 19A with percentages between 4-5%; serotypes 14, 6C, and 23A with percentages between 3-4%, and the rest with percentages below 3% (Figure 1). In relation to the distribution of IPD cases by year depicted in Figure 2, it is to notice that in 2020, 2021, and 2022, a decrease in the number of cases was observed, likely related to the COVID-19 pandemic.
The five most represented serotypes in the sample are shown in Figure 3. There was a significant evolution in the incidence of serotypes 8 and 19A (Chi2 (1270.905,909) p<0.001) so that:
  • From 2019 onwards, the presence of serotype 8 increased significantly, with a peak in 2020 at 32%.
  • Serotype 19A has a higher incidence in 2014 compared to 2023 (8% vs. 1%).
Table 1. Distribution of serotypes causing IPD per year.
YEAR
Total 2014 2015 2016 2017 2018
Count Column N % Count Column N % Count Column N % Count Column N % Count Column N % Count Column N %
SEROTYPE Total 1587 100.0% 159 100.0% 162 100.0% 180 100.0% 193 100.0% 283 100.0%
8 277 17.5% 12 7.5% 14 8.6% 26 14.4% 31 16.1% 50 17.7%
3 233 14.7% 20 12.6% 29 17.9% 22 12.2% 32 16.6% 40 14.1%
22F 76 4.8% 11 6.9% 10 6.2% 12 6.7% 12 6.2% 9 3.2%
9N 68 4.3% 7 4.4% 5 3.1% 15 8.3% 9 4.7% 13 4.6%
19A 64 4.0% 13 8.2% 7 4.3% 11 6.1% 9 4.7% 7 2.5%
14 55 3.5% 10 6.3% 10 6.2% 5 2.8% 7 3.6% 8 2.8%
6C 50 3.2% 5 3.1% 8 4.9% 7 3.9% 3 1.6% 11 3.9%
23A 47 3.0% 5 3.1% 3 1.9% 6 3.3% 4 2.1% 8 2.8%
2019 2020 2021 2022 2023
Count Column N % Count Column N % Count Column N % Count Column N % Count Column N %
207 100.0% 34 100.0% 34 100.0% 106 100.0% 229 100.0%
52 25.1% 11 32.4% 9 2.5% 23 21.7% 49 21.4%
21 10.1% 3 8.8% 4 11.8% 21 19.8% 41 17.9%
12 5.8% 1 2.9% 2 5.9% 1 0.9% 6 2.6%
11 5.3% 1 2.9% 1 2.9% 0 0.0% 6 2.6%
6 2.9% 2 5.9% 1 2.9% 6 5.7% 2 0.9%
6 2.9% 1 2.9% 0 0.0% 0 0.0% 8 3.5%
9 4.3% 0 0.0% 0 0.0% 1 0.9% 6 2.6%
4 1.9% 0 0.0% 1 2.9% 4 3.8% 12 5.2%
There were no significant differences between the serotypes found in men and women (Chi2(97.103,101) p 0.594).
However, there were differences by age (Chi2(518.460,404) p<0.001), with serotype 8 being more frequent in people older than 10 years, especially between 10-64 years, and serotype 10A in children aged 5-9 years (Cramer's V=0.286, low effect size). The cross-tabulation with serotypes up to 24B/F (incidences >2%) is shown in Table 2.

3.2. IPD Outcome of the Patients

72.0% of the patients recovered from the IPD episode, 16.6% died, 1.0% had sequelae, and 9.8% had unknown outcomes. There were no differences by sex (Chi2(9.410,4) p 0.052), but differences were found by age (Chi2(70.563,16) p<0.001). People aged 10 to 44 had higher recovery rates than those over 44, and those over 64 had higher mortality rates compared to the rest (23% vs. 5-13%) (Figure 4).
Mortality rates were statistically different among serotypes (Chi2(543.586,404) p<0.001), with higher recovery rates for serotype 8 and higher death rates for serotypes 3 and 15A. For serotypes 22F/A and 7C/40, higher percentage of sequelae (but based on a very small number of cases (n<10)) were observed (Figure 5).
The different clinical forms of IPD in our study were: arthritis, occult bacteremia, pleural empyema, meningitis, pneumonia, and peritonitis. Mortality rates were statistically similar among clinical forms (ranging from 5% for arthritis to 18% for pneumonia) as well as recovery rates (from 63% for meningitis to 83% for peritonitis). The percentage of patients with sequelae was 7% in meningitis compared to 0.4% in pneumonia and 0% in the rest of the clinical forms (Chi2(74.132,20) p<0.001) (Figure 6).
11.4% of the patients were on prior antibiotic treatment, 81.4% did not, and it was unknown for 6.9% of the cohort. There were no differences by sex (Chi2(1.095,3) p 0.778) or by age (Chi2(15.713,12) p 0.205).

3.3. Vaccination Coverage

22.7% of the patients have been vaccinated, whereas 72.9% were not, and in 4.4% it was unknown. There were significant differences by age (Chi2(219.207,8) p<0.001), with vaccination rates being 3-4 times higher in children under 5 years old compared to the 10-44 and >64 age groups, and 8-9 times higher compared to the 45-64 age group (Cramer´s V=0.263) (Table 3).
Among the different vaccination schedules, 55.3% of those vaccinated, received PPV23 (12.5% of the total). The vaccination rate (with any pneumococcal vaccine) was 22% in patients with pneumonia who developed an IPD, with no significant differences compared to other clinical forms (Chi2(8.601,10) p 0.570). The percentage of patients with pneumonia who developed an IPD was 79.1% in the unvaccinated group and 75.4% in the vaccinated group (with no significant differences - Chi2(9.277,14) p 0.813) (Table 4).
The most common serotypes by age group for vaccinated individuals are shown/depicted in Table 5.

3.1. Relationship Between Serotype and Comorbidities

Patients are grouped based on the number of comorbidities (0-1: 74.7% / >1: 25.3%). There is indeed a relationship with the serotype (Chi2(140.589,101) p 0.006) such that serotypes 3 and 6C are more present in patients with more than 1 comorbidity, and serotype 19A is more present in patients with one or no comorbidities (Table 6). The comorbidities analyzed are: cardiovascular disease, chronic respiratory disease, traumatic brain injury, chronic otitis, diabetes, HIV.

3.5. Antibiotic Resistance

The highest percentages of resistance were for erythromycin (20%) and clindamycin (16%); while the rest of antimicrobials displayed resistance percentages below 5% (Figure 7).
Table 7 relates the number of resistant antimicrobials to the serotype: serotype 8 was the most frequent among the 100%-susceptible isolates, serotype 19A was most present among isolates with any resistance (>=1), serotype 6C was most present among isolates with more than one resistance (>=2), serotype 15A was most frequently associated with pneumococcal strains showing one or two antibiotic resistances, while serotype 11A was predominantly found in isolates with single resistance. There were only two serotypes resistant to 3 antibiotics: 19A and 6C.
78.7% of the isolates were susceptible to all 6 studied antimicrobials; while 5.33% presented resistance to 1 antibiotic, 15.4% were resistant to 2 antibiotics, and 0.6% were resistant to 3 antibiotics (Figure 9).
There were no significant differences in resistance percentages over the years for either erythromycin or clindamycin (Chi²(9.886,8) p 0.273, Chi²(9.390,8) 0.310) (Figure 8).
Only the serotypes for the resistant phenotype involving the two antibiotics with a significant resistance rate were analyzed (the rest of the antibiotics had fewer than 5 resistant cases). The serotypes found in the isolates with resistance to macrolides/lincosamides were primarily 19A, 6C, 15A, 33F, 3, 24B/F (percentages between 5-18%). The incidence of the first three serotypes (19A, 6C, 15A) was significantly higher if the isolate was resistant than if it was susceptible to both erythromycin (chi²(205.711,46) p<0.001) and clindamycin (Chi²(185.079,46) p<0.001). Serotypes 3 and 8 were more frequent in patients susceptible to both antibiotics (Table 8).

3.6. Whole Genome Sequencing

The whole genome sequencing of the IPD isolates showed that the predominant MLST in the VC was ST53, followed by ST180 and ST6521. The two most frequently found STs in serotype 8 were ST53 > ST1110, while in serotype 3 they were first ST180 and, secondly, ST15069. The 4 isolates belonging to serotype 12F presented ST3377, while all 17F isolates were ST392 (Table 9 and Figure 10).

4. Discussion

In this study, the incidence of IPD by gender followed the trend observed in previous studies [11], being more frequent in males (60%) compared to females (40%). Additionally, age was found to be a significant risk factor for the development of this disease, with a mean patient age of 60 years, similar to what has been reported in other studies [12], where more than 50% of cases occurred in individuals aged 65 years or older [13]. The correlation between age and the serotype of the disease had also been documented in previous research [14].
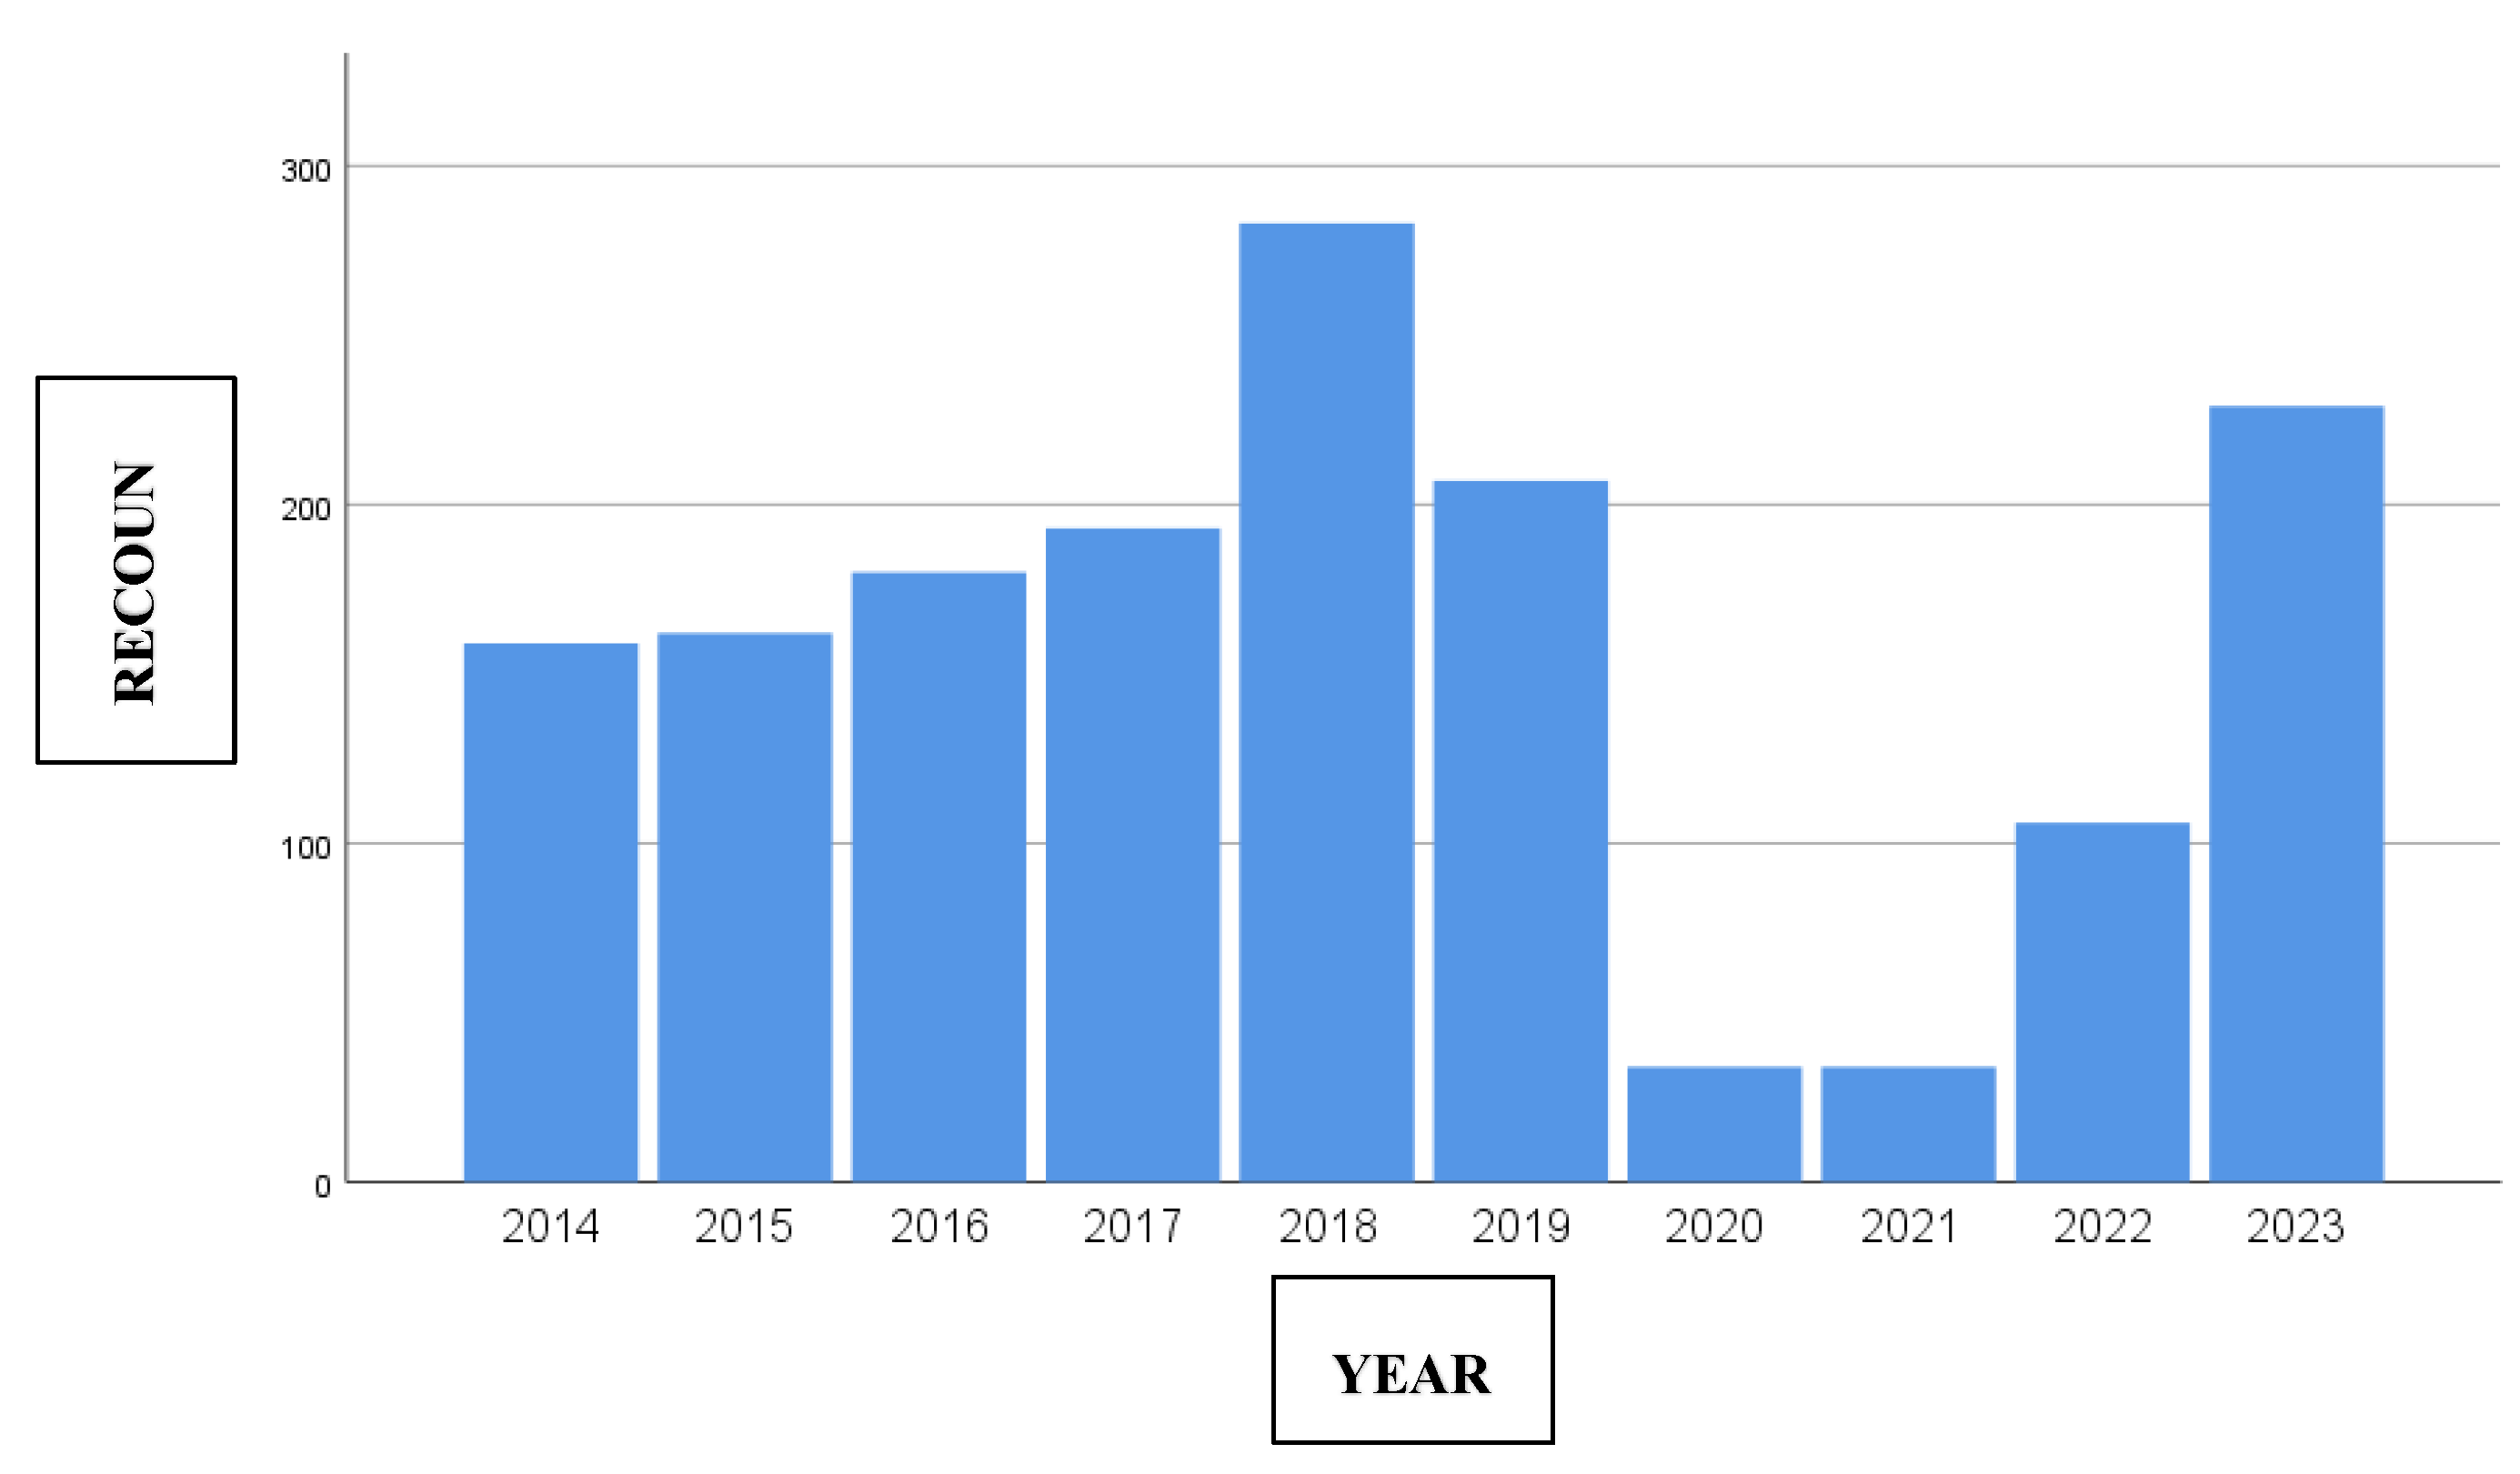
Regarding the incidence of IPD by year, despite the availability of pneumococcal vaccines, a slightly upward trend has been observed since 2014, with a peak in 2018 of 283 cases. During 2020 and 2021, due to the reduction in the number of reported cases and prevention measures implemented by the COVID-19 pandemic, a notable decrease was recorded, with 34 cases per year, representing an 84% decline compared to 2019. Subsequently, an upward trend was observed from 2022, reaching similar figures to those before the pandemic in 2023 (210 cases/year), coinciding with the relaxation of non-pharmacological measures to control the transmission of the virus.
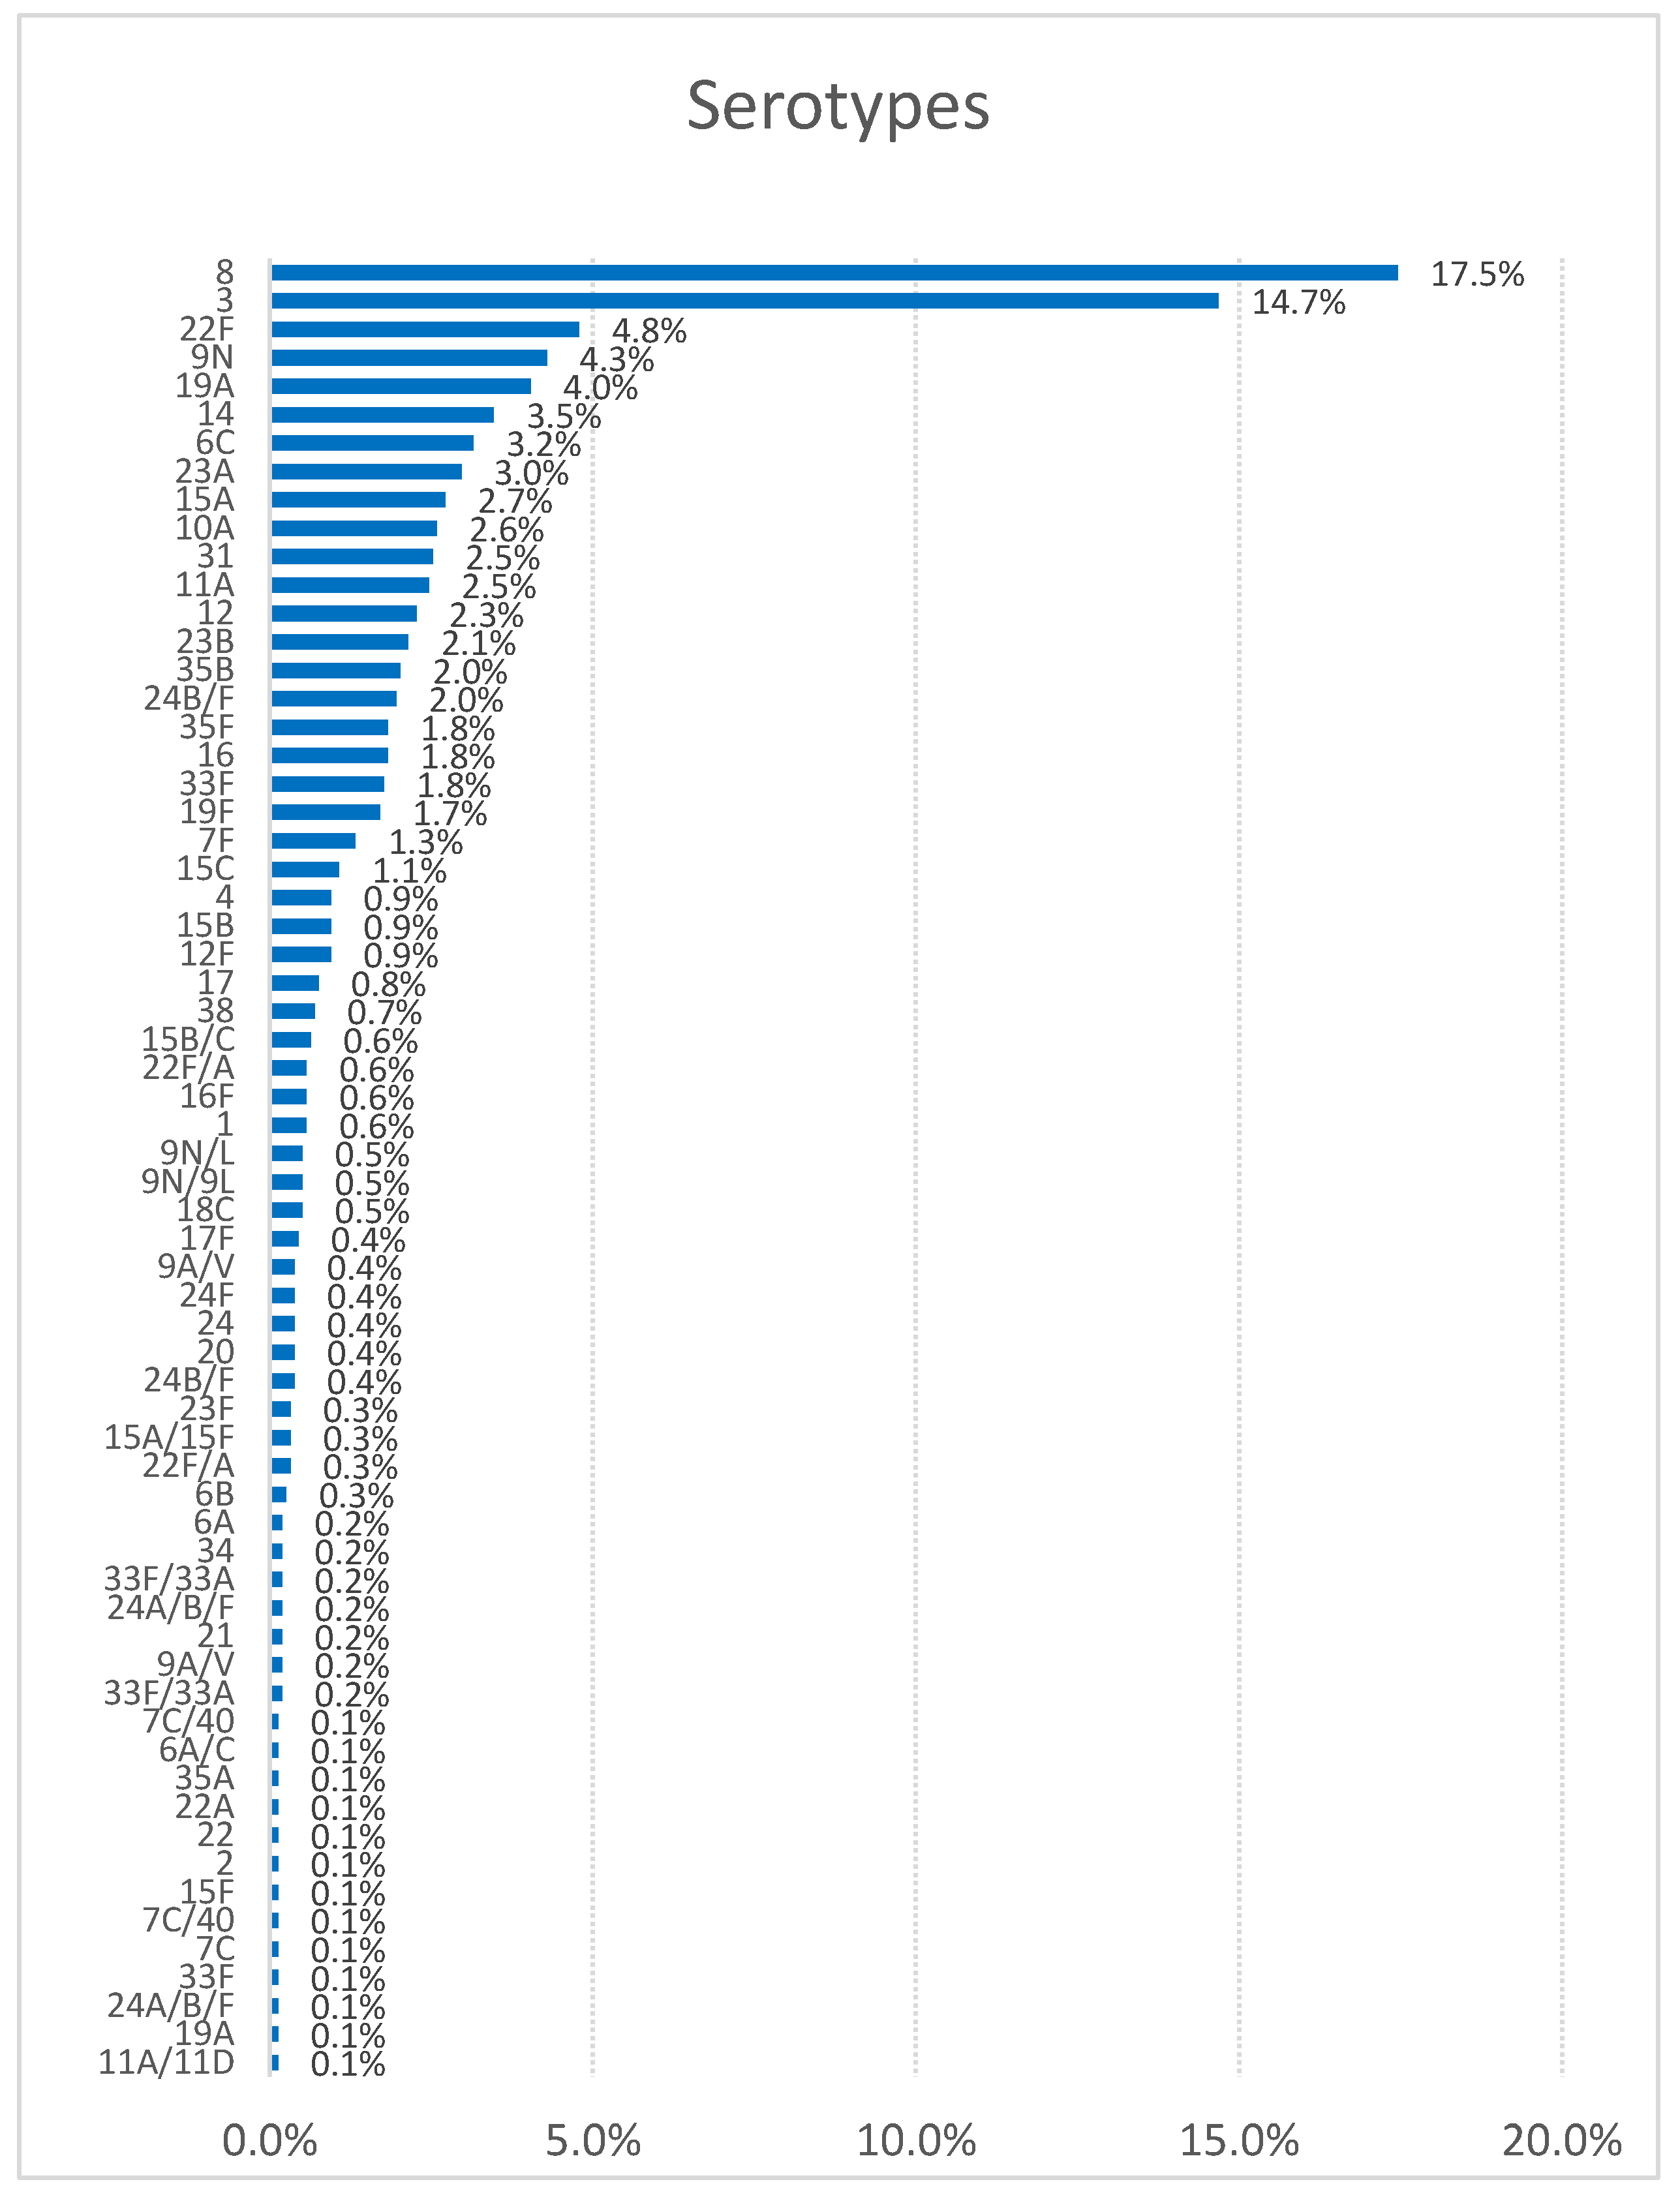
In respect of the distribution by serotypes, there are differences according to the study period and geographic region, underscoring the importance of close monitoring of IPD. Our data are consistent with the annual report of the ECDC [13], where serotype 8 has been the most frequent in the last six years, followed by serotypes 3, 22F, 9N, 19A, 14, 6C, and 23A. In contrast, in other regions like Serbia (2010-2018), the predominant serotypes were 3, 19F, 14, 6B, 6A, 19A, and 23F [15]. In the Canada report of 2021-2022, the most common S. pneumoniae serotypes in cases of invasive disease were varied: in 2021, the predominant serotypes were 22F, 3, 19A, 11A, 6C, and 35B, and in 2022, the distribution changed slightly, with serotypes 22F, 3, 19A, 11A, 6C, and 35B again being prominent, but with some changes in the order of prevalence [16]. Compared to our report, it can be observed that serotype 8 is not among the most prevalent serotypes in Canada in the period 2021-2022, suggesting geographic variability in the prevalence and response to treatment of different Streptococcus pneumoniae serotypes.
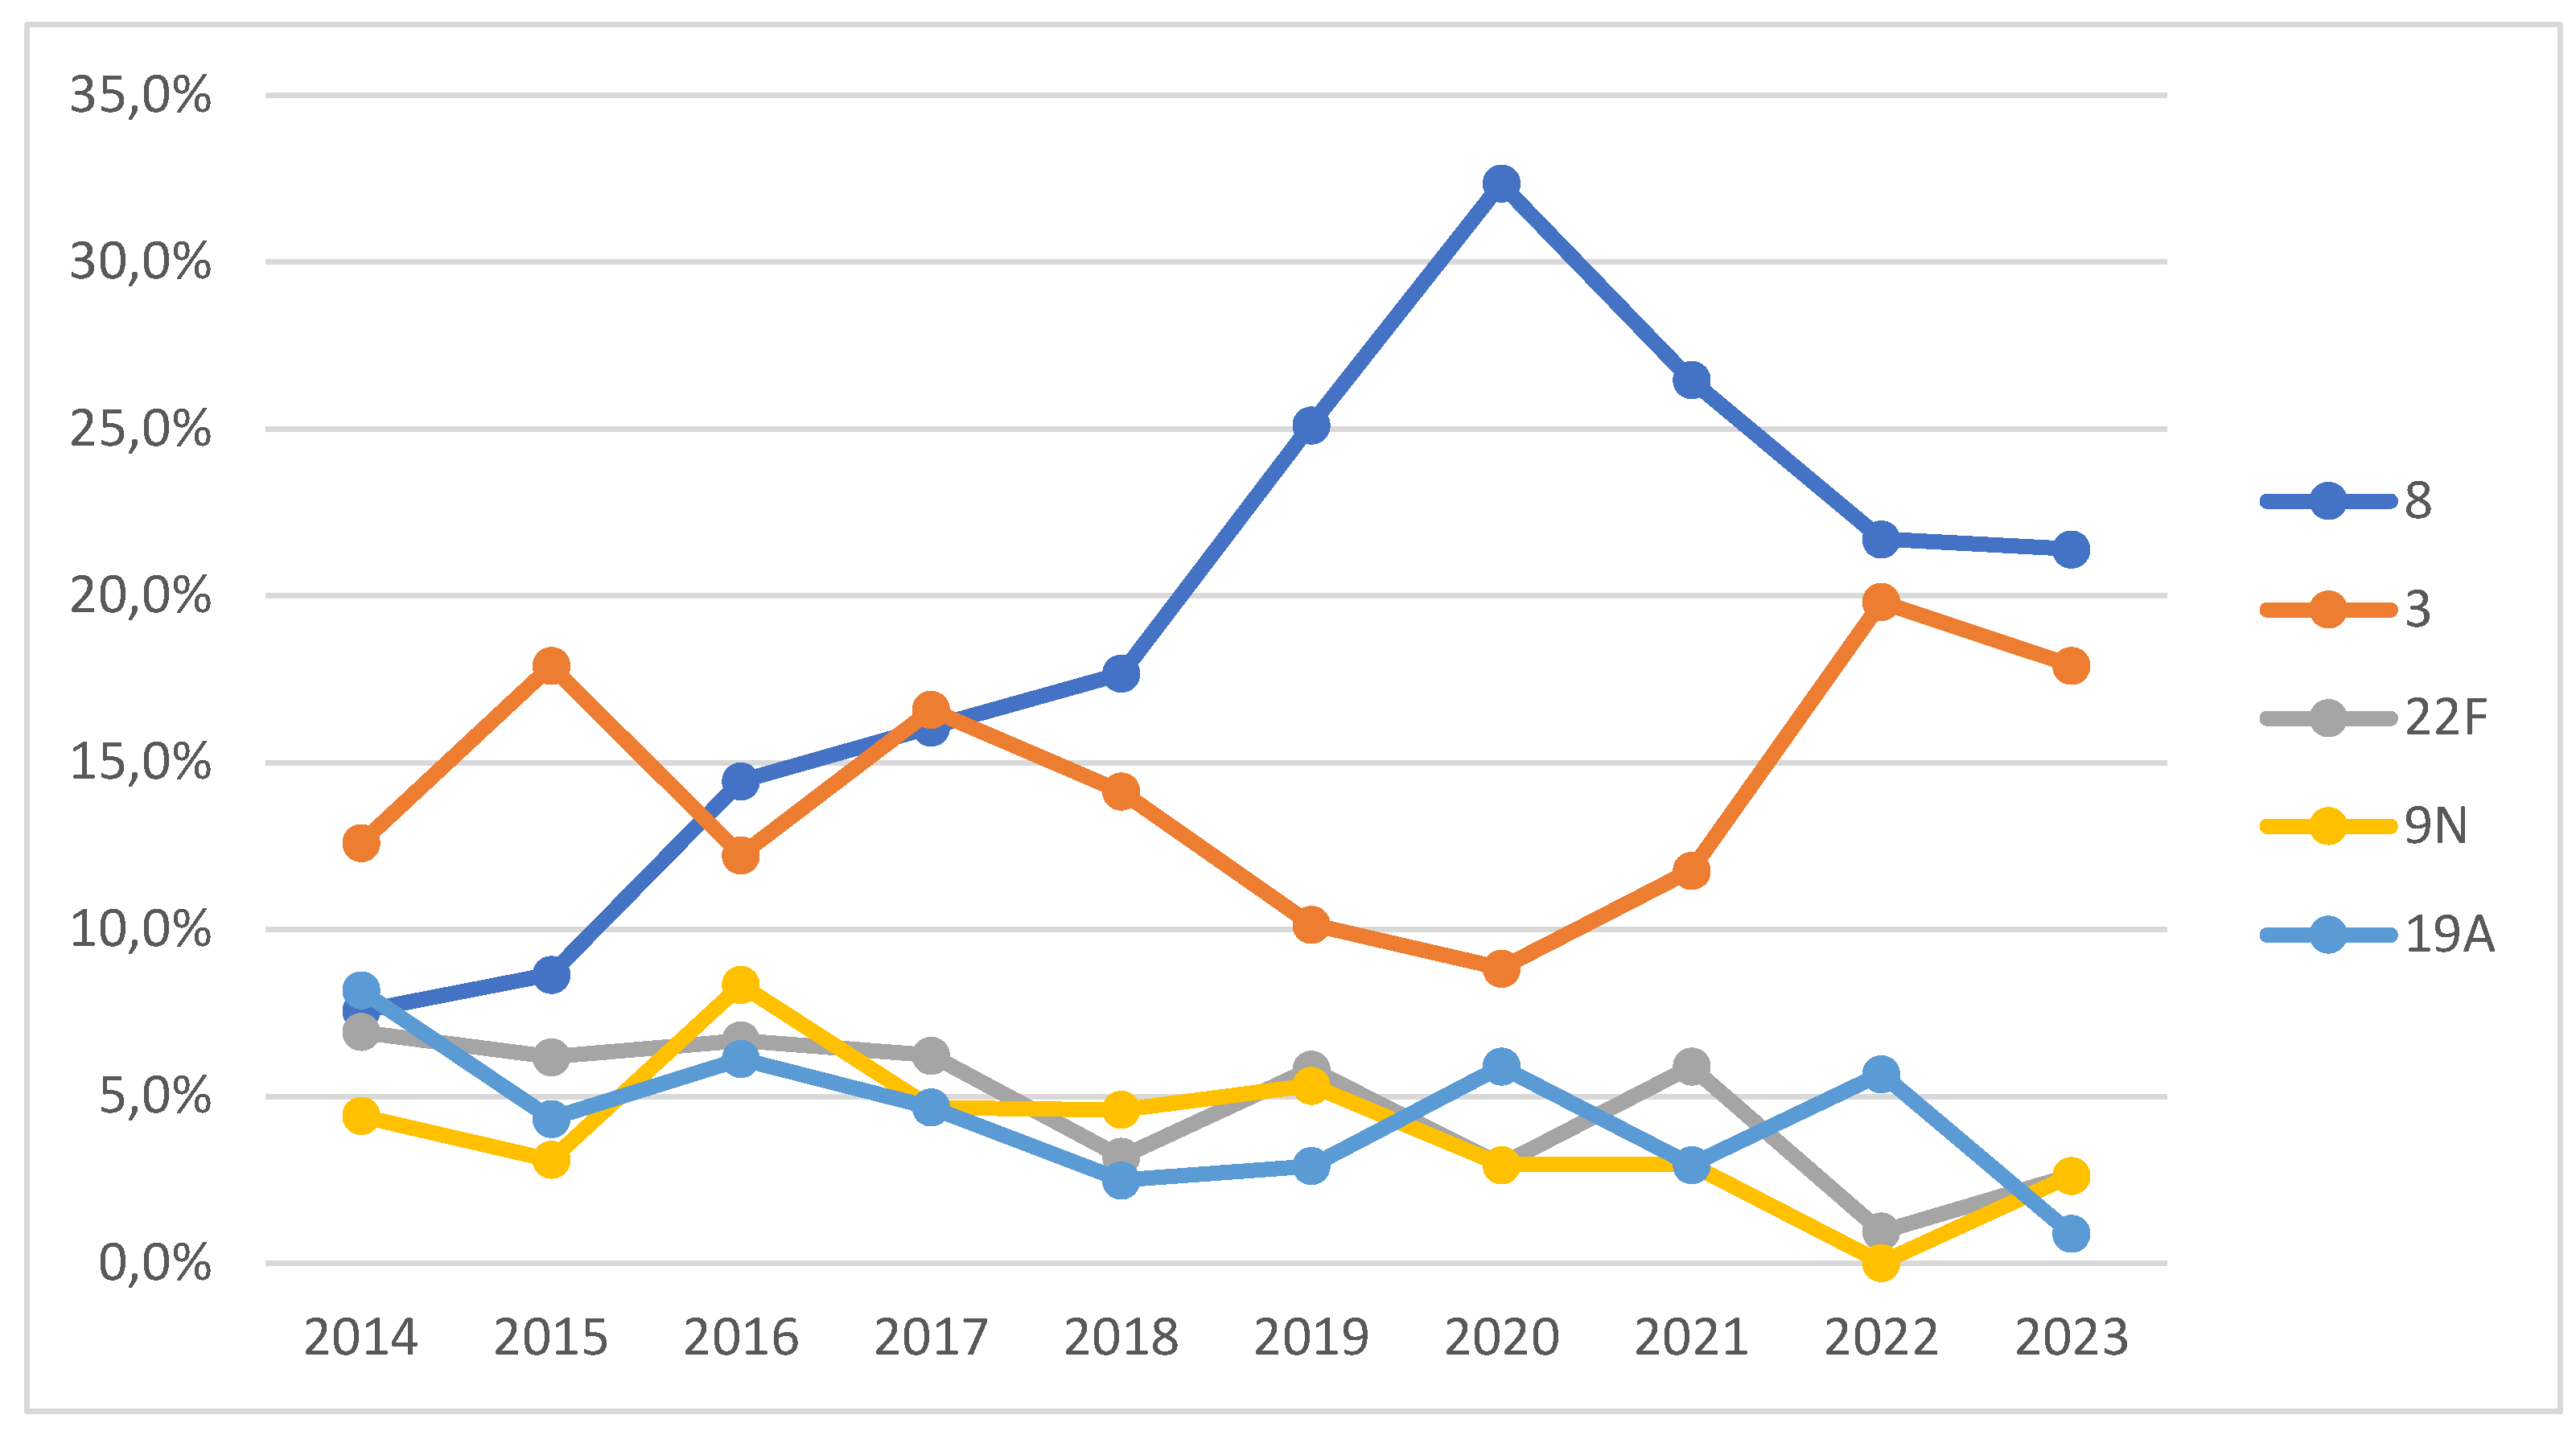
Breaking down by years and analyzing the five most common serotypes in our sample (8, 3, 22F, 9N, and 19A), our results support the phenomenon of indirect immunity following the introduction of the PCV13 vaccine in childhood vaccination in 2015 [17], especially for serotypes 3 and 19A. This explains the decrease in the incidence of serotype 19A from 2014 to 2023 (from 8% to 1%). Serotype 3 was the most common in 2014, 2015, 2017, and 2018, but from that year onwards, serotype 8 became predominant, relegating serotype 3 to second place, reflecting the effect of PCV13. Over the past 10 years, there has been an increase in the prevalence of serotypes 8 and 3, due both to the increase in IPD cases in adults and children and to the reduction of other serotypes such as 22F, 19A, 14, and 6C. Serotype 8, included in the PPSV23 vaccine, has shown a significant increase since 2019, peaking in 2020 (32%). During the COVID-19 pandemic (2020-2021), the serotype distribution was similar to previous years, with an increase in the incidence of serotypes 16F, 20, and 4. Other studies have noted a higher prevalence of serotypes 19A, 3, and 6C in both children and adults during this period [18].
In our study, serotypes 3 and 6C were the most frequently isolated from patients with two or more comorbidities, while serotype 8 was predominant in patients with 0 or 1 comorbidity. When comparing these findings with a study conducted in CV during the period 2007-2012, the order of serotypes associated with the highest percentage of comorbidities was as follows: 22F, 3, 1, 8, 7F, 19A, and 14 [
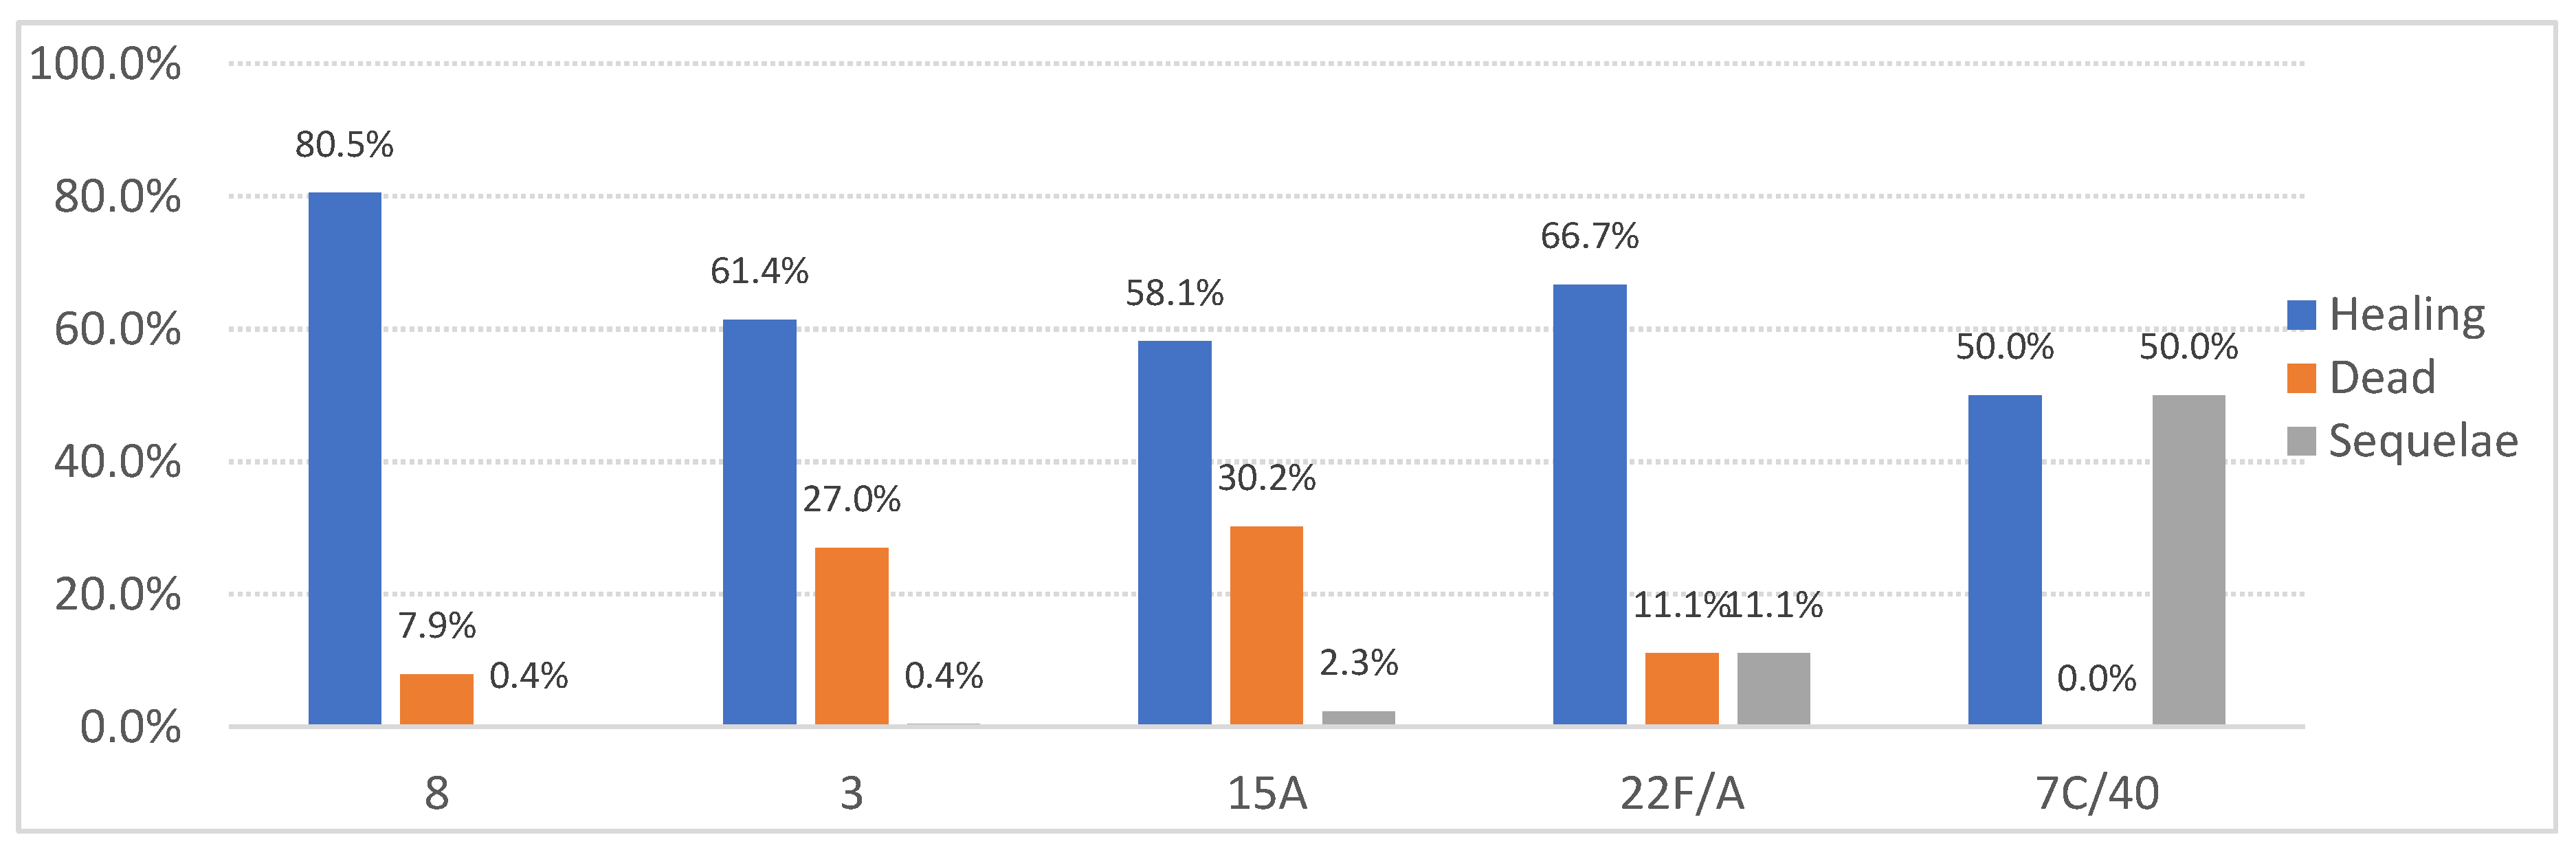
14]. This difference could likely be attributed to the decline in the prevalence of serotypes included in the PCV-13 vaccine, reflecting the impact of its introduction. Regarding mortality by serotype, the highest case-fatality rates in our study were observed for serotypes 3 and 15A. In contrast, the study conducted in the VC during the same period-maintained serotype 3 as one of the most lethal, while serotype 19A was also significant, likely as a secondary effect of the PCV-13 vaccine introduction.
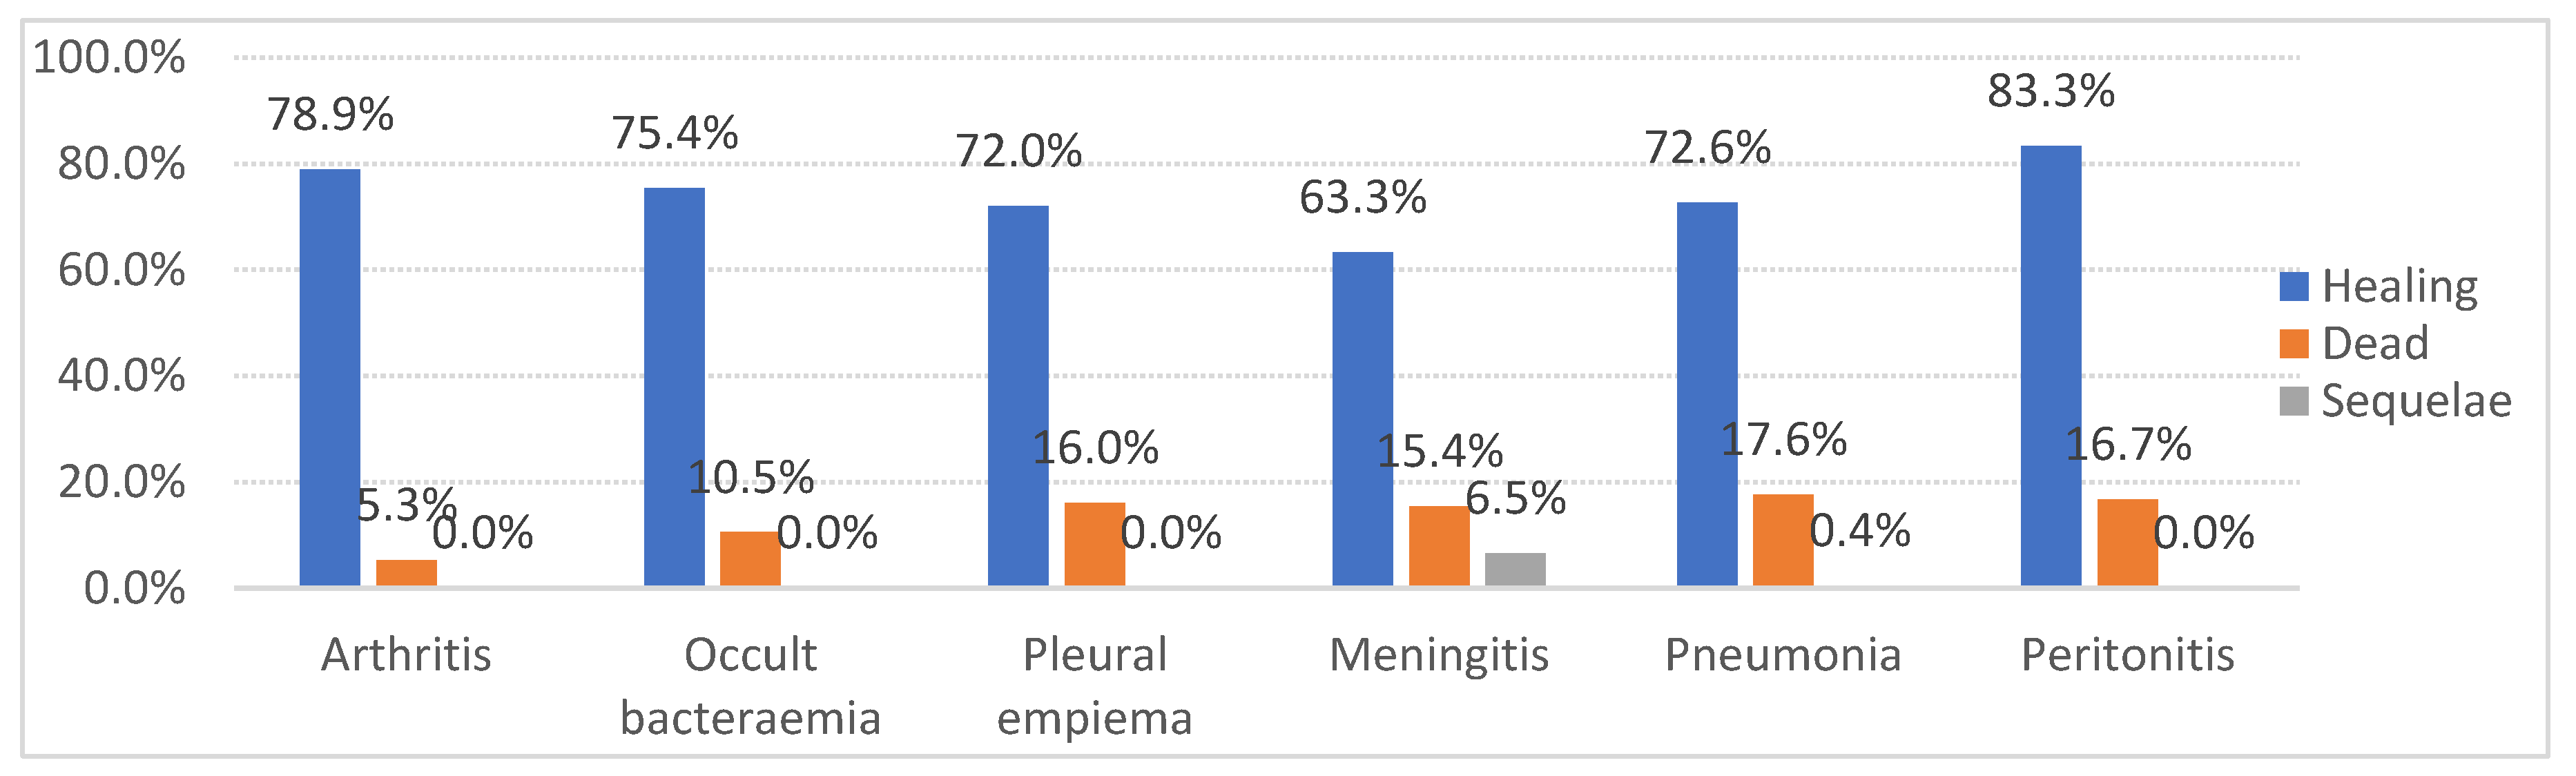
Meanwhile, serotype 8 showed the highest cure rates, consistent with other studies [19,20], attributable to its greater susceptibility to standard antibiotic treatments and a lower association with severe comorbidities. These results are particularly significant, as they indicate that, in addition to being associated with severe comorbidities, these serotypes may also be linked to poorer clinical outcomes. This information is crucial for guiding clinical management and prioritizing interventions in high-risk patients.
Our data showed that 22.7% of the patients had received some form of pneumococcal vaccine, which is comparable to other studies, where vaccination rates generally range from 20-30%, depending on geographic location and health policies [21,22].
The incidence of pneumonia leading to IPD in our study was 79.1% among unvaccinated individuals and 75.4% among vaccinated individuals. In comparison, other studies reported incidences of 65% in unvaccinated individuals and 48% in vaccinated individuals [21]. The smaller difference in IPD incidence between vaccinated and unvaccinated individuals in our study (79.1% vs. 75.4%) may be due to the high percentage of unvaccinated patients and those whose vaccination status is unknown.
A study published by the American Academy of Pediatrics found that pneumococcal conjugate vaccines (PCV-10 and PCV-13) demonstrated high effectiveness against IPD in children under 5 years of age. However, the effectiveness varies depending on the specific serotype and the vaccination schedule, suggesting that the protection provided by these vaccines is not uniform across all serotypes or age groups. The study also emphasizes that significant differences in results can arise depending on the context and population studied, which may introduce potential bias when comparing vaccinated and unvaccinated groups [23].
Additionally, an analysis of the epidemiology of invasive pneumococcal infections suggests that the incidence of IPD across different age groups may be influenced by factors such as comorbidities and vaccination coverage. In some studies, vaccine effectiveness may be overestimated due to serotype replacement, potentially creating a misleading impression of reduced IPD rates in vaccinated populations [43].
Concerning antimicrobial susceptibility all tested antibiotics showed less than 5% resistance, except erythromycin (20%) and clindamycin (16%). Other studies report lower resistance percentages in Morocco (2.5% for both antibiotics) [25], and higher percentages for erythromycin in Oman (28.1%) [26], Iran (71.4%) [27], and Taiwan (80%) [
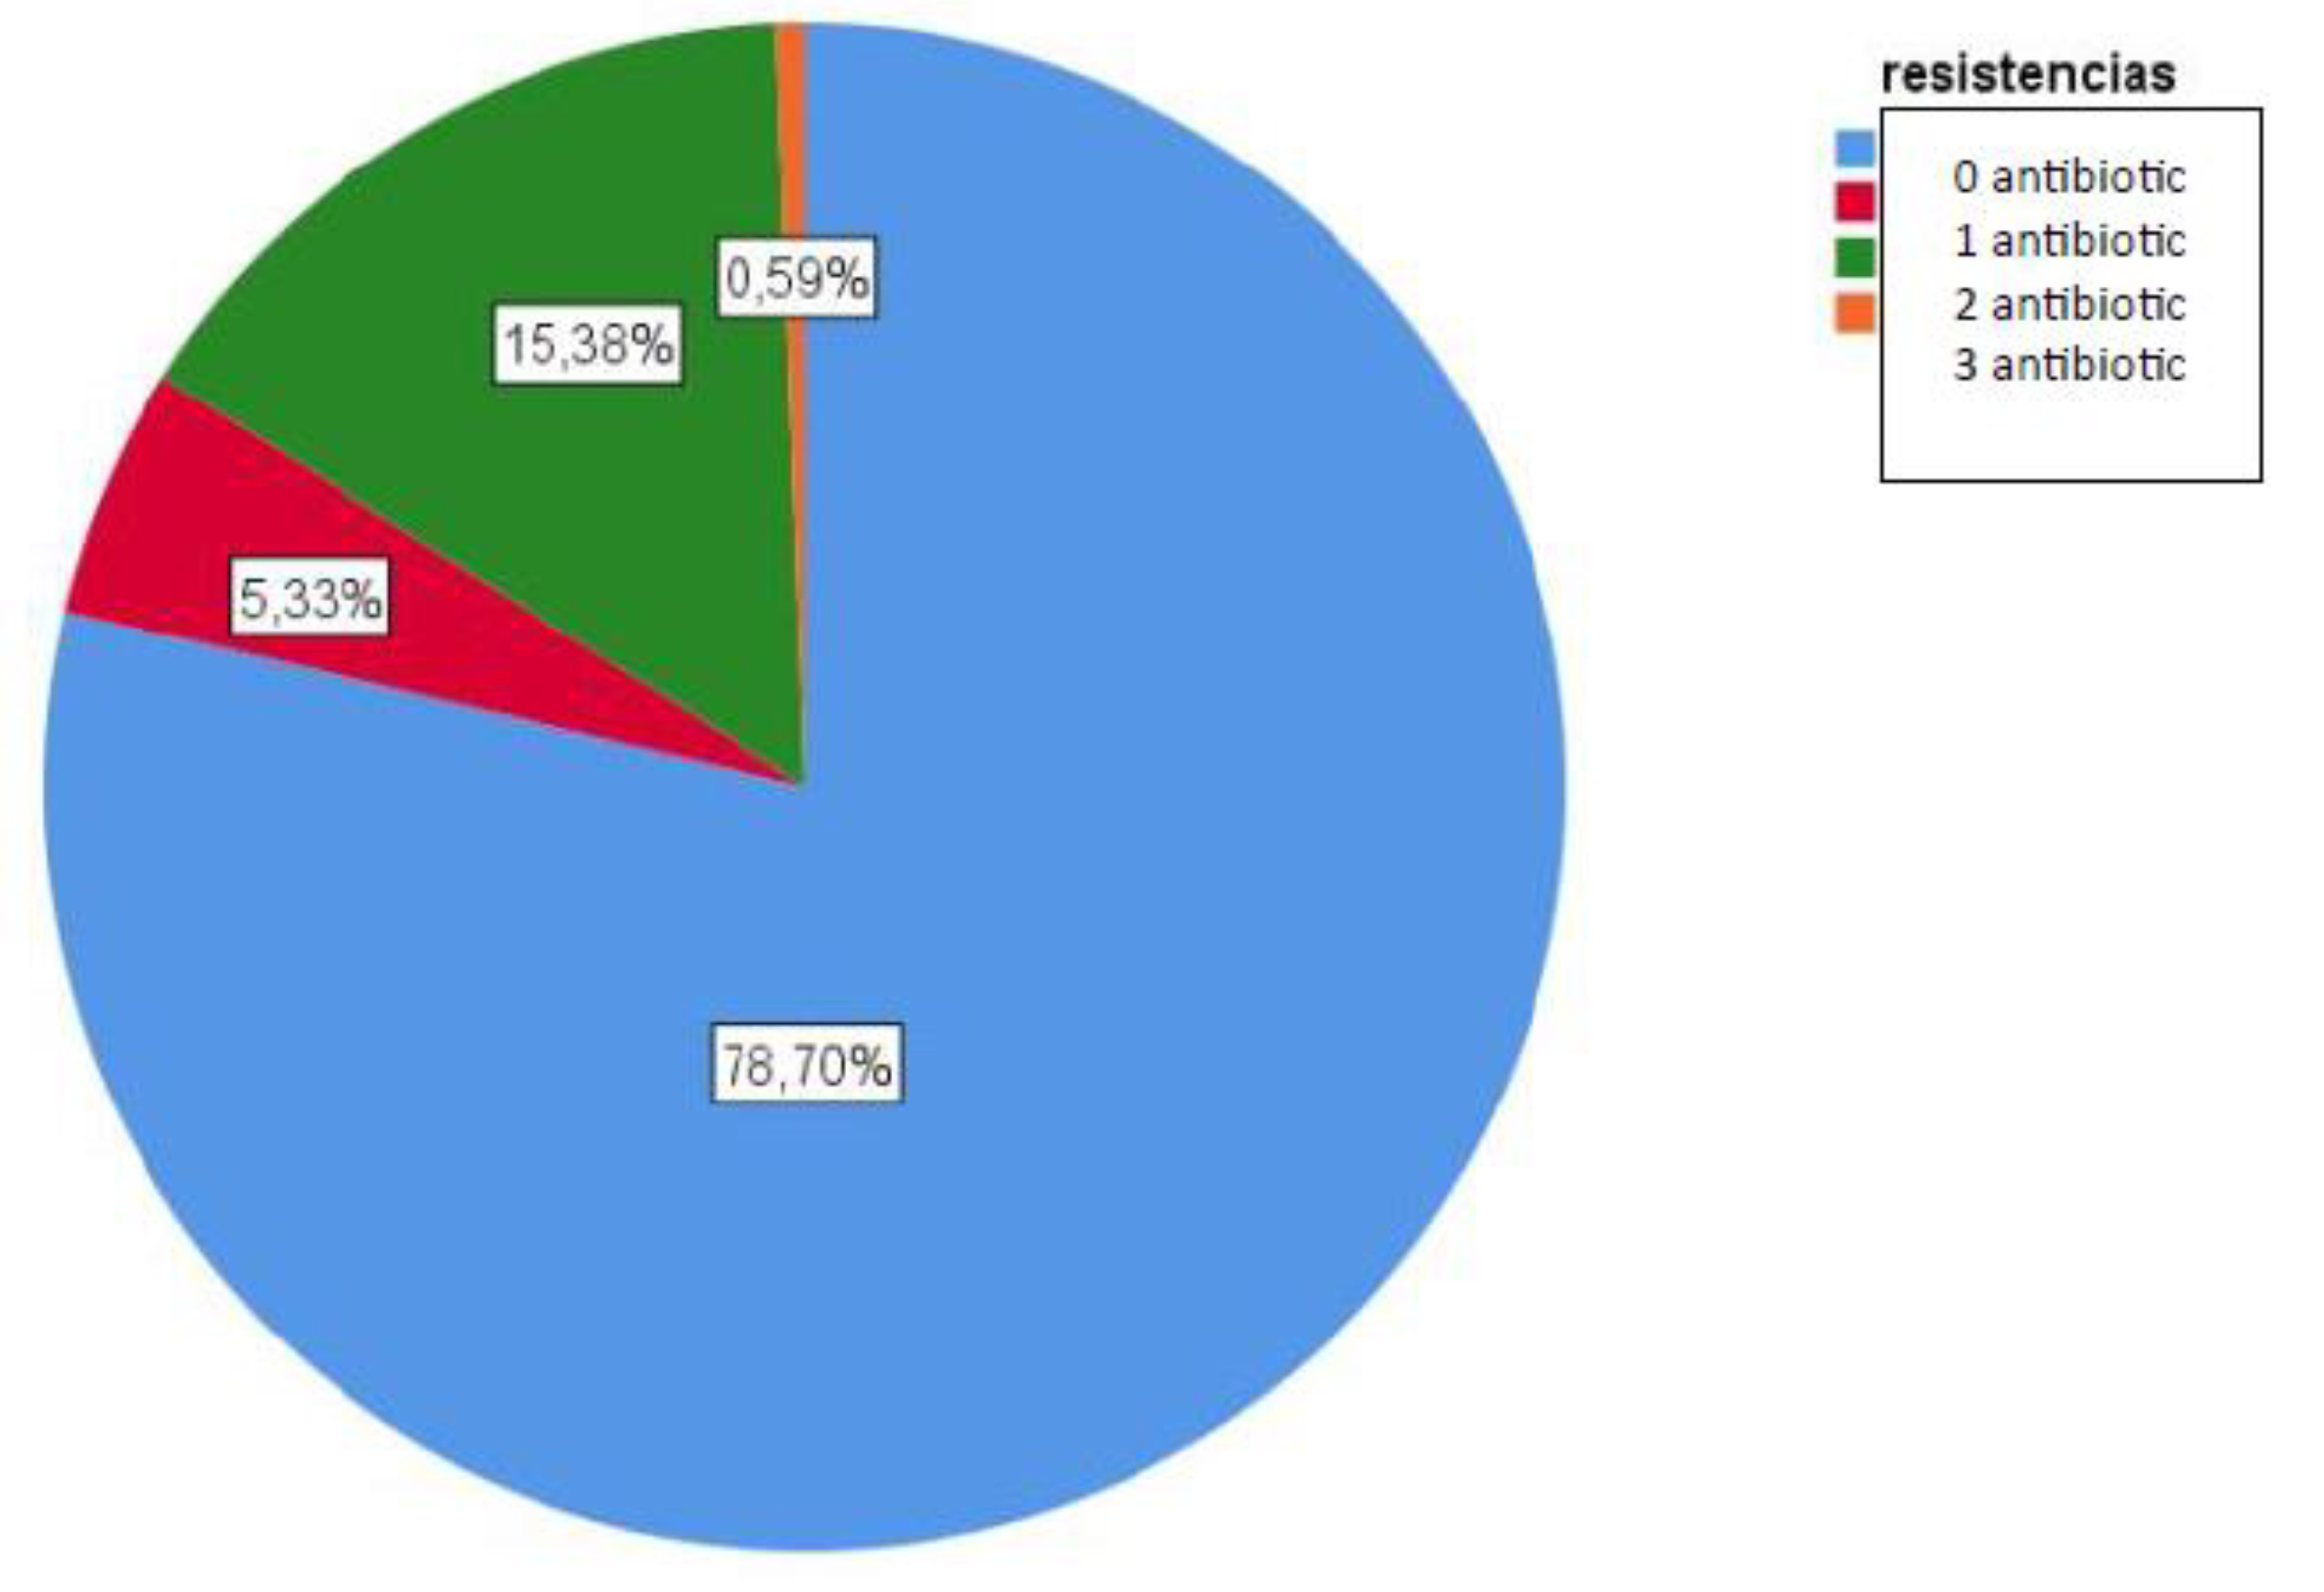
28]. Two of the serotypes with the highest resistance rates were 19A and 6C, possibly due to their less metabolic cost of their polysaccharide structure, allowing them to be more capsulated and evade the immune system, persisting as nasopharyngeal carriers [29]. This behavior could explain the higher prevalence of multidrug-resistant (MDR) lineages of serotypes 19A and 6C [18,30]. In our study, they are the only MDR serotypes detected. The serotypes most frequently isolated as susceptible to erythromycin and clindamycin were 3 and 8, with serotype 8 being the most commonly isolated among isolates susceptible to all the tested antimicrobials.
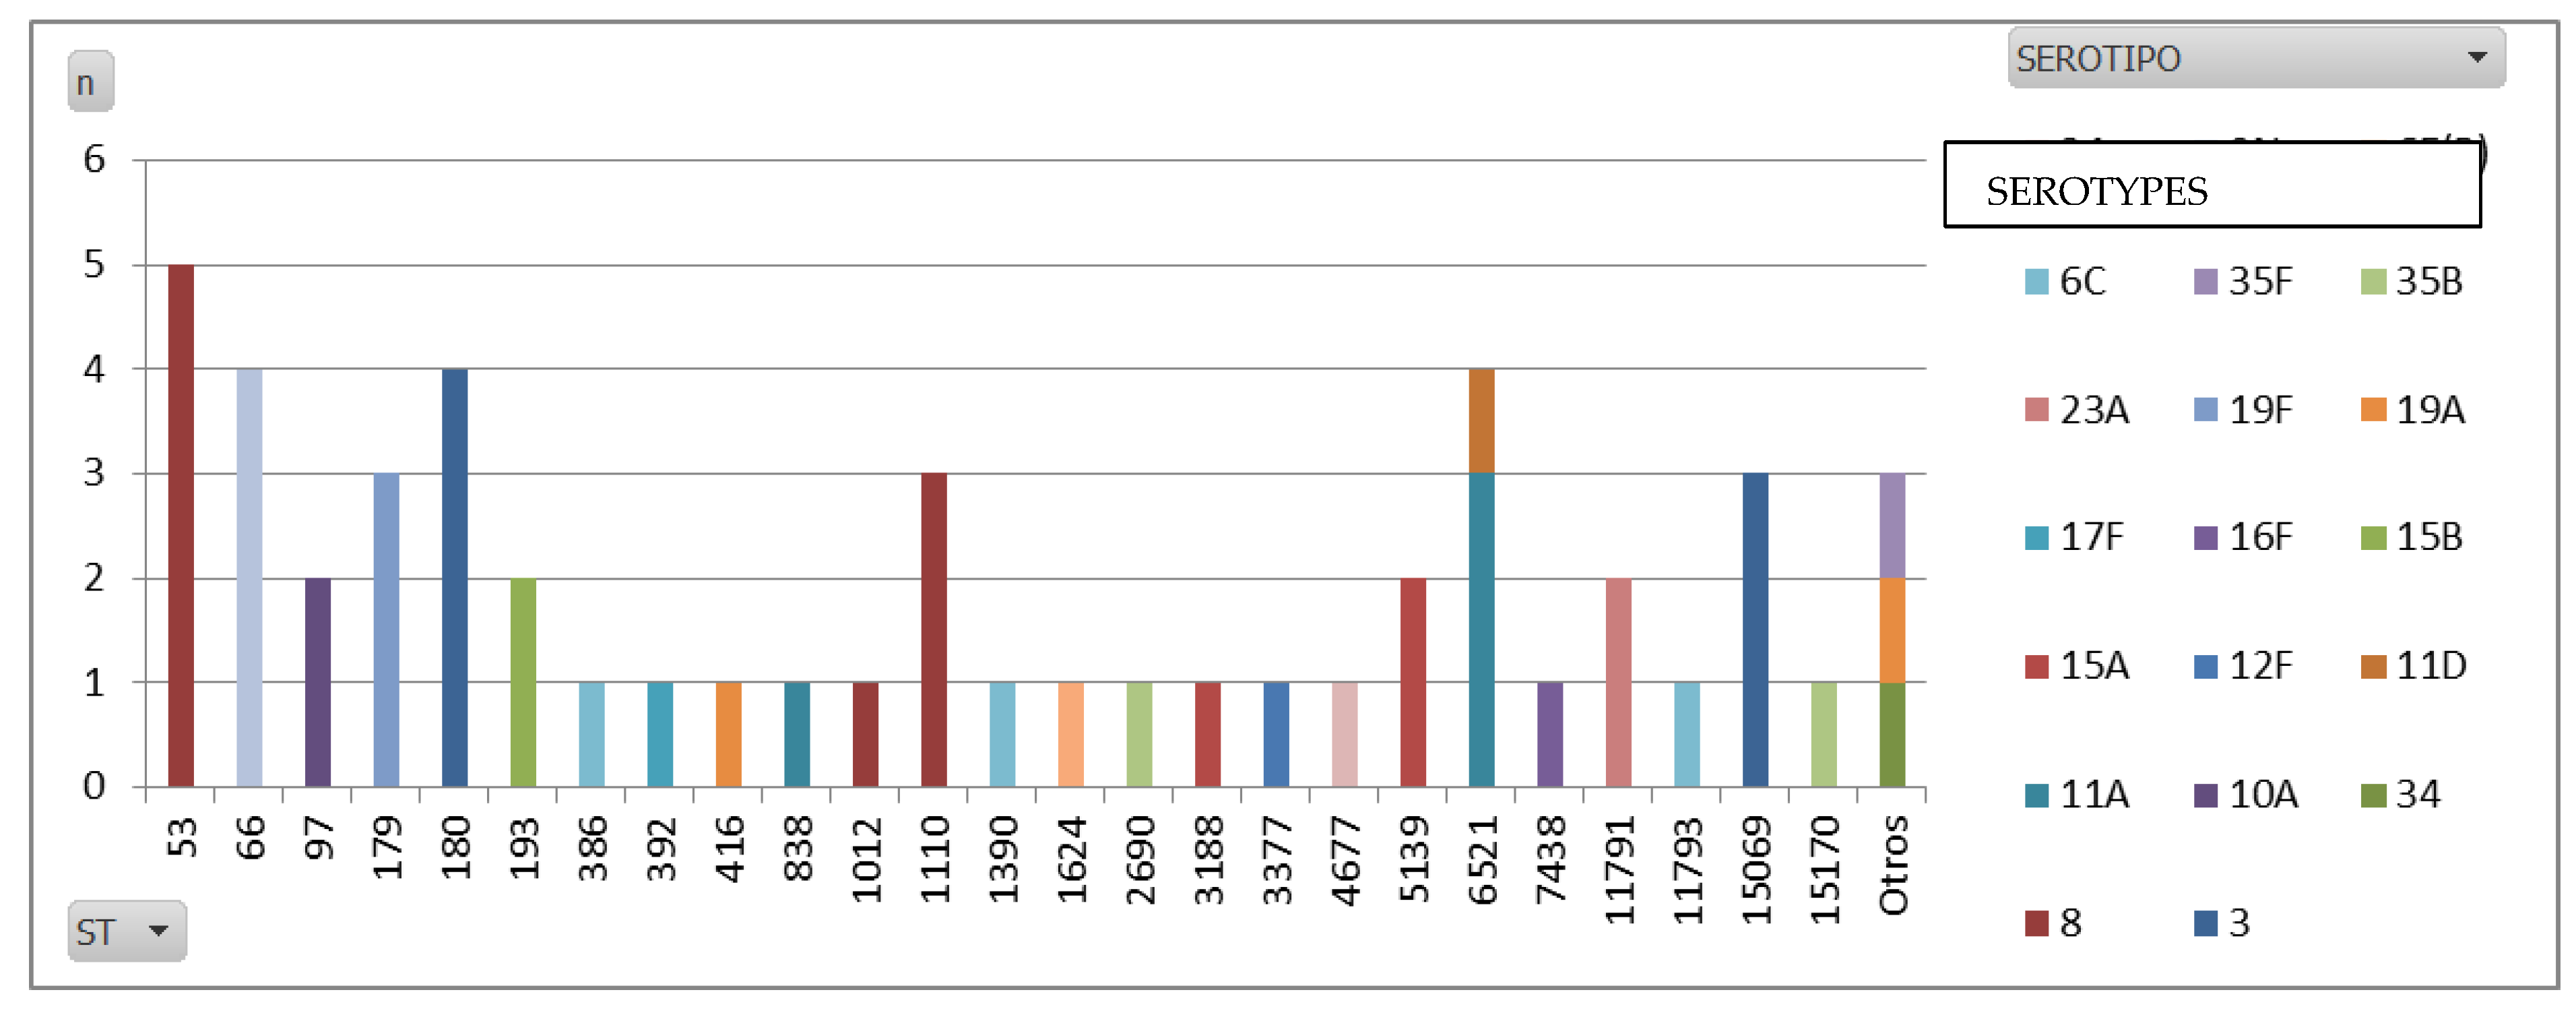
Regarding the whole genome sequencing (WGS) data, ST53 emerged as the predominant MLST in our study, mainly because it is the sequence type (ST) most commonly linked to serotype 8. This finding is in line with global data, as ST53 has consistently been associated with serotype 8, particularly across Europe. Known as the Netherlands8-33 clone, ST53 has been one of the dominant global pneumococcal clones. Additionally, ST1110, another frequent ST found in our serotype 8 isolates, is less reported in the literature. However, emerging regional studies suggest that ST1110 may be locally significant.
As for serotype 3, our data revealed that ST180 was the most prevalent ST, which is consistent with global trends. ST180 is widely recognized as the primary sequence type for serotype 3 [32], and is also known as the Netherlands3-31 clone.
Differences in the prevalence of these STs could be influenced by local factors such as vaccine use, changes in public health policies, and local genetic diversity. The consistency in the results suggests that the molecular epidemiology of Streptococcus pneumoniae, in terms of serotypes and sequence types, follows global patterns with specific regional variations. The findings underscore the importance of continuous surveillance to adapt vaccination strategies and disease control.
It is important to note that, although our findings are preliminary and have not been previously corroborated by other studies, they provide a valuable starting point for future research. Additional studies examining these associations in different populations and contexts are needed to validate our results and better understand the dynamics between specific serotypes, comorbidities, and clinical outcomes.

5. Conclusions

The results obtained in this study have led to the following conclusions: age is a factor related to the serotype as well as to the evolution of the disease and the vaccination rate. Serotype 8 is the most frequent, predominant in people over 10 years old, is associated with higher cure rates, and is more susceptible to antibiotics. Serotype 3 has been the second most common in our study; despite being included in PCV13, it remains one of the most frequent, is associated with higher mortality rates, is mostly found in patients with more than one comorbidity, and is more susceptible to erythromycin and clindamycin. Of the 6 antibiotics, only erythromycin and clindamycin had resistance rates around 15-20%. Only two serotypes were resistant to 3 antibiotics: 19A and 6C. Sequencing showed that the isolates belonging to serotype 8 and 3 presented low clonal diversity, as the former mostly corresponded to ST180, while the latter to ST53, similarly to 12F and 17F, with only one ST each.
Finally, from now on, further studies would be necessary to evaluate the percentage of vaccination in both the child and adult population, and the correlation with the prevalence of certain serotypes, without the bias caused by the COVID-19 pandemic.

Author Contributions

Laura Diab: conceptualization, design, methodology, analysis plan, data plan, resources, writing original draft, writing review and editing, visualization. Reme Guna: design, methodology, resources, draft revision, writing review and editing. Nuria Tormo: design, methodology, resources, draft revision, writing review and editing. Concepción Gimeno: design, methodology, resources, draft revision, writing review and editing.

Funding

Not applicable.

Acknowledgements

The authors gratefully acknowledge the Pneumococcus Working Group of Public Health of the Comunidad Valenciana for their efforts. Additionally, they extend their gratitude to David Navarro, JC Rodríguez, JJ Camarena, Victoria Domínguez, Mª Dolores Tirado, Nieves Orta, Nieves Aparisi, Nieves González, and Mª Victoria de la Tabla for their participation in this study by sending pneumococcus strains. Finally, special thanks to Laura Descalzo for her assistance with the statistical analysis of this work.

Conflicts of Interest

No potential conflict of interest was reported by the authors.
Ethical Approval: Not applicable.

References

  1. Wang H, Naghavi M, Allen C, Barber RM, Bhutta ZA, Carter A, et al. Global, regional, and national life expectancy, all-cause mortality, and cause-specific mortality for 249 causes of death, 1980–2015: a systematic analysis for the Global Burden of Disease Study 2015. The Lancet. octubre de 2016, 388, 1459–1544.
  2. Serrano-Heranz R, Sicilia-Urbán JJ, Sanz-Rojas P. Infecciones por neumococo. Clasificación. Factores predisponentes. Aspectos patogénicos de relevancia clínica o diagnóstica. Manifestaciones clínicas. Formas de comienzo. Medicine (Madr). marzo de 2010, 10, 3352–3359.
  3. Moraga-Llop FA.Enfermedad neumocócica en la era vacunal y emergencia de serotipos. ¿Tendencias temporales y reemplazo de serotipos? Pneumococcal disease and emergence of serotypes in the vaccine era. Transient trends and serotype replacement?.Enferm Infecc Microbiol Clin. 2009, 27, 1–4.
  4. Grant LR, Slack MPE, Theilacker C, Vojicic J, Dion S, Reinert RR, et al. Distribution of Serotypes Causing Invasive Pneumococcal Disease in Children from High-Income Countries and the Impact of Pediatric Pneumococcal Vaccination. Clin Infect Dis. 5 de julio de 2022, 76, e1062-70. [CrossRef]
  5. SG Vigilancia en Salud Pública, Dirección General de Salud Pública, Consejería de Sanidad – Comunidad de Madrid.Enfermedad Neumocócica Invasiva en la Comunidad de Madrid: Evolución 2007-2022. Madrid: Consejería de Sanidad; 2022. (informe_eni_2007-2022_cm).
  6. European Centre for Disease Prevention and Control. Antimicrobial resistance surveillance in Europe 2023 – 2021 data. Stockholm: ECDC; 2023.
  7. Garau J. Impacto de la resistencia a los macrólidos en la infección neumocócica. 2002, 56, 5.
  8. Cillóniz C, Ardanuy C, Vila J, Torres A. What is the clinical relevance of drug-resistant pneumococcus?: Current Opinion in Pulmonary Medicine. maig 2016, 22, 227–234.
  9. Tubau F, Liñares J, Martín R. Resistencia antibiótica en Streptococcus pneumoniae.
  10. Muñoz,Isabel- Vanaclocha,Hermelinda- Martín-Sierra,Miguel y González,Francisco. Red de Vigilancia Microbiológica de la Comunidad Valenciana (RedMIVA). Enfermedades Infecciosas y Microbiología Clínica. 2008, 26, 77–81. [CrossRef]
  11. Rodríguez MAG, González AV, Gavín MAO, Martínez FM, Marín NG, Blázquez BR, et al. Invasive pneumococcal disease: Association between serotype, clinical presentation and lethality. Vaccine ;29, 5740–5746. [CrossRef]
  12. Lujan M, Burgos J, Gallego M, Falco V, Bermudo G, Planes A, et al. Effects of Immunocompromise and Comorbidities on Pneumococcal Serotypes Causing Invasive Respiratory Infection in Adults: Implications for Vaccine Strategies. Clinical Infectious Diseases 2013, 57, 1722–1730. [CrossRef]
  13. ECDC (2018). Invasive pneumococcal disease – Annual Epidemiological Report for 2018. Available at: https://www.ecdc.europa.eu/en/publications-data/invasive- pneumococcal-disease-annual-epidemiological-report-2018 (Accessed June 1, 2023).
  14. Ciancotti Oliver LR, Huertas Zarco I, Pérez Pérez E, Carmona Martí E, Carbó Malonda R, Gil Bru A, et al. Enfermedad neumocócica invasiva en la Comunitat Valenciana. Seis años de vigilancia (2007-2012). Enfermedades Infecciosas y Microbiología Clínica 2015, 33, 149–155.
  15. Opavski N, Jovicevic M, Kabic J, Kekic D, Vasiljevic Z, Tosic T, et al. Serotype distribution, antimicrobial susceptibility and molecular epidemiology of invasive Streptococcus pneumoniae in the nine-year period in Serbia. Front Microbiol 2023, 14:1244366. [CrossRef]
  16. Griffith A, Golden AR, Lefebvre B, McGeer A, Tyrrell GJ, Zhanel GG, et al. Invasive pneumococcal disease surveillance in Canada, 2021–2022. CCDR. 24 de mayo de 2024, 50, 121–134. [CrossRef]
  17. Evolución de la Enfermedad Neumocócica Invasiva en España. [Internet]. 2019 [citado 24 de junio de 2024]. Disponible en: https://neumoexpertos.org/2019/07/16/evolucion-de-la-enfermedad-neumococica-invasiva-en-espana/.
  18. Shaw D, Abad R, Amin-Chowdhury Z, Bautista A, Bennett D, Broughton K, et al. Trends in invasive bacterial diseases during the first 2 years of the COVID-19 pandemic: analyses of prospective surveillance data from 30 countries and territories in the IRIS Consortium. The Lancet Digital Health. septiembre de 2023, 5, e582–e593. [CrossRef]
  19. Wasserman M, Chapman R, Lapidot R, et al. Twenty-Year Public Health Impact of 7-Valent and 13-Valent Pneumococcal Conjugate Vaccines in US Children. Emerg Infect Dis. 2021, 27, 1627–1636. doi:10.3201/eid2706.204577. [CrossRef]
  20. Hausdorff WP, Hanage WP. Interim results of an ecological experiment – conjugate vaccination against the pneumococcus and serotype replacement. Hum Vaccin Immunother 2016, 12, 358–374. doi:10.1080/21645515.2015.1118593.
  21. Jackson LA, Neuzil KM, Yu O, Benson P, Barlow WE, Adams A, et al. Effectiveness of the 23-valent pneumococcal polysaccharide vaccine in preventing pneumonia and invasive pneumococcal disease in the elderly. J Infect Dis 2003, 188, 377–386.
  22. Maruyama T, Taguchi O, Niederman MS, Morser J, Kobayashi H, Kobayashi T et al. Efficacy of pneumococcal polysaccharide vaccine in adults with chronic illness. Clin Infect Dis 2010, 51, 313–321.
  23. Berman-Rosa M, O’Donnell S, Barker M, Quach C. Efficacy and Effectiveness of the PCV-10 and PCV-13 Vaccines Against Invasive Pneumococcal Disease. Pediatrics 2020, 145, e20190377. [CrossRef]
  24. Grant LR, Slack MPE, Theilacker C, Vojicic J, Dion S, Reinert RR et al. Distribution of Serotypes Causing Invasive Pneumococcal Disease in Children From High-Income Countries and the Impact of Pediatric Pneumococcal Vaccination. Clin Infect Dis. 5 de julio de 2022, 76, e1062–e1070. [CrossRef]
  25. Amari S, Warda K, Elkamouni Y, Arsalane L, Bouskraoui M, Zouhair S. Serotype distribution and antimicrobial resistance of Streptococcus pneumoniae among children with acute otitis media in Marrakech, Morocco. Iran J Microbiol 2022, 14, 47–55. [CrossRef]
  26. Al-Jardani A, Al Rashdi A, Al Jaaidi A, Al Bulushi M, Al Mahrouqi S, Al-Abri S, et al. Serotype distribution and antibiotic resistance among invasive Streptococcus pneumoniae from Oman post 13-valent vaccine introduction. Int J Infect Dis 2019, 85, 135–140. [CrossRef]
  27. Houri H, Tabatabaei SR, Saee Y, Fallah F, Rahbar M, Karimi A. Distribution of capsular types and drug resistance patterns of invasive pediatric Streptococcus pneumoniae isolates in Teheran, Iran. Int J Infect Dis 2017, 57, 21–26.
  28. Tsai YT, Lee YL, Lu MC, Shao PL, Lu PL, Cheng SH, et al. Nationwide surveillance of antimicrobial resistance in invasive isolates of Streptococcus pneumoniae in Taiwan from 2017 to 2019. J Microbiol Immunol Infect 2022, 55:215-224. [CrossRef]
  29. Weinberger, D.M.; Trzci´nski, K.; Lu, Y.-J.; Bogaert, D.; Brandes, A.; Galagan, J.; Anderson, P.W.; Malley, R.; Lipsitch, M. Pneumococcal capsular polysaccharide structure predicts serotype prevalence. PLoS Pathog. 2009, 5, e1000476.
  30. Almeida SCG, Lemos APSD, Bierrenbach AL, Moraes JCD, Brandileone MCDC. Serotype Distribution and Antimicrobial Susceptibility Pattern of Streptococcus pneumoniae in COVID-19 Pandemic Era in Brazil. Microorganisms 2024, 12, 401. [CrossRef]
  31. Brueggemann AB, Griffiths DT, Meats E, Peto T, Crook DW, Spratt BG. Clonal Relationships between Invasive and Carriage Streptococcus pneumoniae and Serotype- and Clone-Specific Differences in Invasive Disease Potential. J Infect Dis 2003, 187, 1424–1432.
  32. Azarian T, Mitchell PK, Georgieva M, Thompson CM, Ghouila A, Pollard A et al. Global emergence and population dynamics of divergent serotype 3 CC180 pneumococci. PLoS Pathog 2018, 14, e1007438. [CrossRef]
Figure 1. Incidence of different pneumococcal serotypes causing IPD in the CV (Spain).
Preprints 146282 g001
Figure 2. Distribution of IPD cases by year.
Preprints 146282 g002
Figure 3. Yearly evolution of the most frequent serotypes found in the study. Each serotype is represented as a percentage (y-axis) of the total annual isolates (x-axis).
Preprints 146282 g003
Figure 4. Age-related with final state of the patient.
Preprints 146282 g004
Figure 5. Serotype-related with final IPD outcome of the patient.
Preprints 146282 g005
Figure 6. Outcome of patients by clinical form of IPD.
Preprints 146282 g006
Figure 7. Shows the percentage of antimicrobial resistance of the IPD-producing isolates.
Preprints 146282 g007
Figure 9. Graphical representation of resistance to none, 1 or 2 or more antimicrobials.
Preprints 146282 g009
Figure 8. Evolution of erythromycin and clindamycin resistance of IPD-producing isolates from 2014 to 2023.
Preprints 146282 g008
Figure 10. Image showing ST linked to serotypes.
Preprints 146282 g010
Table 2. Age-related distribution of serotypes causing ENI.
AGE
Total 0-4 years 5-9 years 10-44 years 45-64 years >64 years
Count % Count % Count % Count % Count % Count %
SEROTYPE Total 1587 100.0% 64 100.0% 27 100.0% 237 100.0% 419 100.0% 840 100.0%
8 277 17.5% 3 4.7% 1 3.7% 53 22.4% 96 22.9% 124 14.8%
3 233 14.7% 5 7.8% 6 22.2% 24 10.1% 55 13.1% 143 17.0%
22F 76 4.8% 3 4.7% 2 7.4% 10 4.2% 20 4.8% 41 4.9%
9N 68 4.3% 0 0.0% 0 0.0% 9 3.8% 23 5.5% 36 4.3%
19A 64 4.0% 4 6.3% 1 3.7% 10 4.2% 11 2.6% 38 4.5%
14 55 3.5% 3 4.7% 2 7.4% 5 2.1% 10 2.4% 35 4.2%
6C 50 3.2% 1 1.6% 0 0.0% 2 0.8% 14 3.3% 33 3.9%
23A 47 3.0% 3 4.7% 0 0.0% 6 2.5% 7 1.7% 31 3.7%
15A 43 2.7% 2 3.1% 1 3.7% 8 3.4% 10 2.4% 22 2.6%
10A 41 2.6% 2 3.1% 4 14.8% 10 4.2% 12 2.9% 13 1.5%
31 40 2.5% 0 0.0% 0 0.0% 3 1.3% 11 2.6% 26 3.1%
11A 39 2.5% 1 1.6% 1 3.7% 4 1.7% 9 2.1% 24 2.9%
12 36 2.3% 0 0.0% 0 0.0% 7 3.0% 13 3.1% 16 1.9%
23B 34 2.1% 4 6.3% 1 3.7% 5 2.1% 10 2.4% 14 1.7%
35B 32 2.0% 2 3.1% 1 3.7% 3 1.3% 8 1.9% 18 2.1%
24B/F 31 2.0% 4 6.3% 0 0.0% 8 3.4% 3 0.7% 16 1.9%
Table 3. Percentage of known vaccination according to age range.
AGE
Total <=4 years 5-9 years 10-44 years 45-64 years >64 years
N % N % N % N % N % N %
Pneumococcal vaccination Total 1587 100.0% 64 100.0% 27 100.0% 237 100.0% 419 100.0% 840 100.0%
Unknown 70 4.4% 2 3.1% 0 0.0% 7 3.0% 28 6.7% 33 3.9%
No 1157 72.9% 11 17.2% 6 22.2% 162 68.4% 353 84.2% 625 74.4%
Yes 360 22.7% 51 79.7% 21 77.8% 68 28.7% 38 9.1% 182 21.7%
Table 4. Percentage of known vaccination according to the clinical form.
ANTIPNEUMOCOCCAL VACCINE
Total Unknown No Yes
Count Column N % Count Column N % Count Column N % Count Column N %
Clinical form infection Total 1585 100.0% 70 100.0% 1157 100.0% 358 100.0%
Pneumonia 1242 78.4% 57 8.,4% 915 79.1% 270 75.4%
Meningitis 169 10.7% 6 8.6% 122 10.5% 41 11.5%
Occult bacteraemia 114 7.2% 4 5.7% 75 6.5% 35 9.8%
Pleural empyema 25 1.6% 2 2.9% 18 1.6% 5 1.4%
Arthritis 19 1.2% 1 1.4% 13 1.1% 5 1.4%
Peritonitis 12 0.8% 0 0.0% 11 1.0% 1 0.3%
Endocarditis 3 0.2% 0 0.0% 2 0.2% 1 0.3%
Pericarditis 1 0.1% 0 0.0% 1 0.1% 0 0.0%
Table 5. Serotypes found by vaccinated age group.
0-4 5-9 10-44 45-64 >64
Count Column N % Count Column N % Count Column N % Count Column N % Count Column N %
SEROTYPE Total 51 100.0% Total 21 100.0% Total 68 100.0% Total 38 100.0% Total 182 100.0%
33F 4 7.8% 3 5 23.8% 24B/F 7 10.3% 8 4 10.5% 3 24 13.2%
24B/F 4 7.8% 10A 4 19.0% 10A 6 8.8% 3 4 10.5% 8 23 12.6%
3 3 5.9% 24B/F 2 9.5% 15A 6 8.8% 15A 3 7.9% 11A 12 6.6%
19F 3 5.9% 22F 1 4.8% 3 4 5.9% 22F 2 5.3% 35F 9 4.9%
19A 3 5.9% 14 1 4.8% 19A 4 5.9% 10A 2 5.3% 9N 8 4.4%
8 3 5.9% 8 1 4.8% 8 3 4.4% 31 2 5.3% 6C 8 4.4%
22F 3 5.9% 35B 1 4.8% 23A 3 4.4% 19F 2 5.3% 23A 8 4.4%
23A 2 3.9% 33F 1 4.8% 15C 3 4.4% 9N/L 2 5.3% 19A 7 3.8%
14 2 3.9% 24A/B/F 1 4.8% 33F 3 4.4% 6C 1 2.6% 14 7 3.8%
35B 2 3.9% 23B 1 4.8% 16 3 4.4% 23B 1 2.6% 35B 6 3.3%
22F/A 2 3.9% 19A 1 4.8% 38 3 4.4% 35B 1 2.6% 24B/F 6 3.3%
15B/C 2 3.9% 17F 1 4.8% 24 3 4.4% 16 1 2.6% 22F 5 2.7%
15A 2 3.9% 15A 1 4.8% 23B 2 2.9% 7F 1 2.6% 31 5 2.7%
10A 2 3.9% 23F 0 0.0% 31 2 2.9% 35F 1 2.6% 15A 4 2.2%
23B 1 2.0% 11A 0 0.0% 15B/C 2 2.9% 33F 1 2.6% 16 4 2.2%
15B 1 2.0% 1 0 0.0% 22F 1 1.5% 24B/F 1 2.6% 23B 4 2.2%
Table 6. Relationship with the number of comorbidities and serotype.
COMORBIDITIES
Total 0-1 >1
Count % Count % Count %
SEROTYPE Total 1587 100.0% 1185 100.0% 402 100.0%
8 277 17.5% 211 17.8% 66 16.4%
3 233 14.7% 160 13.5% 73 18.2%
22F 76 4.8% 55 4.6% 21 5.2%
9N 68 4.3% 53 4.5% 15 3.7%
19A 64 4.0% 57 4.8% 7 1.7%
14 55 3.5% 45 3.8% 10 2.5%
6C 50 3.2% 31 2.6% 19 4.7%
23A 47 3.0% 32 2.7% 15 3.7%
15A 43 2.7% 32 2.7% 11 2.7%
10A 41 2.6% 32 2.7% 9 2.2%
31 40 2.5% 30 2.5% 10 2.5%
11A 39 2.5% 24 2.0% 15 3.7%
12 36 2.3% 30 2.5% 6 1.5%
23B 34 2.1% 28 2.4% 6 1.5%
35B 32 2.0% 25 2.1% 7 1.7%
24B/F 31 2.0% 22 1.9% 9 2.2%
Table 7. Relationship between serotype and number of antimicrobial resistances.
ANTIMICROBIAL RESISTANCE
Total 0 antibotics 1 antibiotics 2 antibiotics 3 antibotics
Count Column N % Count Column N % Count Column N % Count Column N % Count Column N %
SEROTYPES Total 338 100.0% 266 100.0% 18 100.0% 52 100.0% 2 100.0%
8 79 23.4% 77 28.9% 0 0.0% 2 3.8% 0 0.0%
3 49 14.5% 44 16.5% 2 11.1% 3 5.8% 0 0.0%
19A 16 4.7% 4 1.5% 3 16.7% 8 15.4% 1 50.0%
9N 15 4.4% 15 5.6% 0 0.0% 0 0.0% 0 0.0%
22F 14 4.1% 14 5.3% 0 0.0% 0 0.0% 0 0.0%
14 13 3.8% 8 3.0% 2 11.1% 3 5.8% 0 0.0%
6C 10 3.0% 1 0.4% 1 5.6% 7 13.5% 1 50.0%
9N/9L 8 2.4% 6 2.3% 0 0.0% 2 3.8% 0 0.0%
31 8 2.4% 8 3.0% 0 0.0% 0 0.0% 0 0.0%
23B 8 2.4% 8 3.0% 0 0.0% 0 0.0% 0 0.0%
15A 8 2.4% 1 0.4% 2 11.1% 5 9.6% 0 0.0%
16 7 2.1% 6 2.3% 0 0.0% 1 1.9% 0 0.0%
11A 7 2.1% 3 1.1% 3 16.7% 1 1.9% 0 0.0%
33F 6 1.8% 0 0.0% 0 0.0% 6 11.5% 0 0.0%
22F/A 6 1.8% 6 2.3% 0 0.0% 0 0.0% 0 0.0%
12F 6 1.8% 4 1.5% 0 0.0% 2 3.8% 0 0.0%
10A 6 1.8% 6 2.3% 0 0.0% 0 0.0% 0 0.0%
35F 5 1.5% 5 1.9% 0 0.0% 0 0.0% 0 0.0%
35B 5 1.5% 4 1.5% 1 5.6% 0 0.0% 0 0.0%
23A 5 1.5% 5 1.9% 0 0.0% 0 0.0% 0 0.0%
9A/V 4 1.2% 4 1.5% 0 0.0% 0 0.0% 0 0.0%
24B/F 4 1.2% 0 0.0% 0 0.0% 4 7.7% 0 0.0%
15B/C 4 1.2% 4 1.5% 0 0.0% 0 0.0% 0 0.0%
7F 3 0.9% 3 1.1% 0 0.0% 0 0.0% 0 0.0%
7C/40 3 0.9% 3 1.1% 0 0.0% 0 0.0% 0 0.0%
4 3 0.9% 2 0.8% 1 5.6% 0 0.0% 0 0.0%
24F 3 0.9% 0 0.0% 0 0.0% 3 5.8% 0 0.0%
19F 3 0.9% 2 0.8% 0 0.0% 1 1.9% 0 0.0%
16F 3 0.9% 3 1.1% 0 0.0% 0 0.0% 0 0.0%
38 2 0.6% 2 0.8% 0 0.0% 0 0.0% 0 0.0%
33F/33A 2 0.6% 0 0.0% 0 0.0% 2 3.8% 0 0.0%
24A/B/F 2 0.6% 1 0.4% 0 0.0% 1 1.9% 0 0.0%
18C 2 0.6% 1 0.4% 1 5.6% 0 0.0% 0 0.0%
17F 2 0.6% 2 0.8% 0 0.0% 0 0.0% 0 0.0%
15B 2 0.6% 2 0.8% 0 0.0% 0 0.0% 0 0.0%
12 2 0.6% 2 0.8% 0 0.0% 0 0.0% 0 0.0%
11A/11D 2 0.6% 2 0.8% 0 0.0% 0 0.0% 0 0.0%
1 2 0.6% 2 0.8% 0 0.0% 0 0.0% 0 0.0%
6A/C 1 0.3% 0 0.0% 1 5.6% 0 0.0% 0 0.0%
35A 1 0.3% 1 0.4% 0 0.0% 0 0.0% 0 0.0%
27 1 0.3% 1 0.4% 0 0.0% 0 0.0% 0 0.0%
24A 1 0.3% 1 0.4% 0 0.0% 0 0.0% 0 0.0%
21 1 0.3% 1 0.4% 0 0.0% 0 0.0% 0 0.0%
18B/C 1 0.3% 1 0.4% 0 0.0% 0 0.0% 0 0.0%
17 1 0.3% 1 0.4% 0 0.0% 0 0.0% 0 0.0%
15C 1 0.3% 0 0.0% 1 5.6% 0 0.0% 0 0.0%
10A/10D 1 0.3% 0 0.0% 0 0.0% 1 1.9% 0 0.0%
Table 8. Relation serotype-resistance to erythromycin and clindamycin.
% of RESISTANT serotypes out of the total number of resistant cases ERITHROMYCIN_RESISTANCE CLINDAMYCIN_RESISTANCE
Count Column N % Count Column N %
SEROTYPE Total 68 100.0% 53 100.0%
19A 12 17.6% 8 15.1%
6C 9 13.2% 8 15.1%
15A 7 10.3% 5 9.4%
33F 6 8.8% 6 11.3%
3 5 7.4% 3 5.7%
24B/F 4 5.9% 4 7.5%
11A 3 4.4% 2 3.8%
14 3 4.4% 2 3.8%
24F 3 4.4% 3 5.7%
12F 2 2.9% 2 3.8%
33F/33A 2 2.9% 2 3.8%
8 2 2.9% 2 3.8%
9N/9L 2 2.9% 2 3.8%
10A/10D 1 1.5% 1 1.9%
15C 1 1.5% 0 0.0%
16 1 1.5% 1 1.9%
18C 1 1.5% 0 0.0%
19F 1 1.5% 1 1.9%
24A/B/F 1 1.5% 1 1.9%
4 1 1.5% 0 0.0%
6A/C 1 1.5% 0 0.0%
Table 9. ST linked to serotypes.
Serotypes N.º ST N.º ST N.º ST
3 4 180 3 15069
6C 1 386 1 1390 1 11793
6E(B) 1 1624
8 5 53 1 1012 3 1110
10A 2 97
11A 1 838 3 6521
11D 1 6521
12F 1 3377
15A 1 3188 2 5139
16F 1 7438
17F 1 392
19A 1 416 1 NC
19F 3 179
23A 2 11791
35B 1 2690 1 15170
35F
Disclaimer/Publisher’s Note: The statements, opinions and data contained in all publications are solely those of the individual author(s) and contributor(s) and not of MDPI and/or the editor(s). MDPI and/or the editor(s) disclaim responsibility for any injury to people or property resulting from any ideas, methods, instructions or products referred to in the content.
Copyright: This open access article is published under a Creative Commons CC BY 4.0 license, which permit the free download, distribution, and reuse, provided that the author and preprint are cited in any reuse.
Prerpints.org logo

Preprints.org is a free preprint server supported by MDPI in Basel, Switzerland.

Subscribe

Disclaimer

Terms of Use

Privacy Policy

Privacy Settings

© 2026 MDPI (Basel, Switzerland) unless otherwise stated