1. Introduction
Biomass burning from agricultural residues, wildfires, and organic waste is a significant source of air pollution with substantial consequences for human health and the environment [
1,
2]. Crop waste residues, mainly rice straw, sugarcane leaves, and corn stems, are the most burned items [
3], and their combustion markedly degrades air quality, increasing the risk of respiratory and cardiovascular diseases [
4,
5]. Wildfires occurring in forests and grasslands have become increasingly frequent in northern of Thailand, primarily driven by soil moisture shortages [
6]. Emissions of particles and greenhouse gases from forest fires exert a critical influence on the Earth’s climate system [
7], underscoring the necessity of adaptive strategies such as sustainable land use, improved forest management, and effective fire control to mitigate their impacts [
8]. In parallel, organic waste from household and garden sources is increasingly managed through integrated approaches, including waste-to-energy incineration [
9].
Uncertainty in pollutant emission estimates arises from various factors, including the spatial extent of burned areas. Satellite-based burned area products, such as those from the Moderate Resolution Imaging Spectroradiometer (MODIS), often underestimate agricultural burning due to their relatively coarse spatial resolution [
17,
18]. This limitation is particularly pronounced in regions such as Thailand, where rice fields and crop plots are typically small and highly fragmented [
8,
16]. The Visible Infrared Imaging Radiometer Suite (VIIRS), developed as the successor to MODIS, overcomes several of these constraints while preserving its core capabilities. With enhanced spatial resolutions of 375 m and 750 m, VIIRS enables more accurate detection of small-scale fire activity [
19,
20]. Although most previous studies have used MODIS data to investigate the spatiotemporal dynamics of specific fire types, such as crop residue burning and forest fires, these analyses have focused mainly on high-intensity fire regions, particularly northeastern Thailand. In contrast, despite its importance, research on open biomass burning in Chiang Mai Province remains scarce. Located in northern Thailand, Chiang Mai is characterized by extensive forest cover and numerous nationally protected areas, underscoring the critical need for effective forest fire prevention [
3,
11,
21]. Moreover, Chiang Mai is a major agricultural region that generates substantial crop residues from rice and corn cultivation. Post-harvest burning of agricultural fields, especially in highland areas, is widespread and occurs annually. This recurring practice significantly contributes to particulate pollution and raises serious concerns regarding regional air quality [
21,
22].
Open biomass fires, such as wildfires and crop burning, significantly contribute to air pollution in numerous countries [
23]. Biomass fires emit large quantities of particulate matter (PM), polycyclic aromatic hydrocarbons (PAHs), and harmful gases, including sulfur dioxide (SO
2), carbon monoxide (CO), and nitrogen oxides (NOx), into the air [
24,
25,
26,
27]. PM emissions were affected by biomass types and combustion phases. Data were acquired during a forest fire experiment in Candeias do Jamari, Rondônia, where samples were taken straight from the smoke plume, revealing that particle concentration and diameter changed dramatically. It ranged from 0.066 to 0.275 µm in particle size [
28]. Nevertheless, size-segregated PM data are essential for comprehending its formation, size distribution, sources, deposition in the human respiratory tract, and health impacts, especially during heavy biomass fire episodes [
29,
30]. Size-segregated PM refers to the concurrent monitoring of PM across various size ranges using cascade impactors or aerosol monitors [
31]. A recent study by Phairuang et al. (2024) [
30] reported that size-specific PMs, small to nanoscale (PM0.1), influence PM-stimulated subcellular physical characteristics in cell lines. They were collected during a biomass fire episode in Chiang Mai, north of Thailand, and PM size distributions included PM
0.1, PM
0.5–0.1, PM
1.0–0.5, and PM
2.5–1.0, which displayed distinct features across different PM sizes. Size-fractionated PMs are therefore significant because of their varying degrees of detrimental effects on human organ systems and respiratory tracts, which can result in serious illnesses.
During open burning seasons, forest fires and agricultural waste have caused regional air pollution in Chiang Mai Province and other parts of Northern Thailand. This study aims to examine open biomass fire point data collected during intense biomass haze episodes in Chiang Mai province from March to April 2020 using VIIRS 375 m active fire products and land cover data. It provides a scientific foundation for regulating open biomass burning and managing Chiang Mai’s air quality by exposing the spatiotemporal evolution processes and influencing elements of forestry fires and crop residue burning, the two primary forms of open biomass burning. Moreover, the patterns of size-fractionated PM down to PM0.1, considering both daytime and nighttime spatial fluctuations, were investigated.
2. Materials and Methods
2.1. Study Area
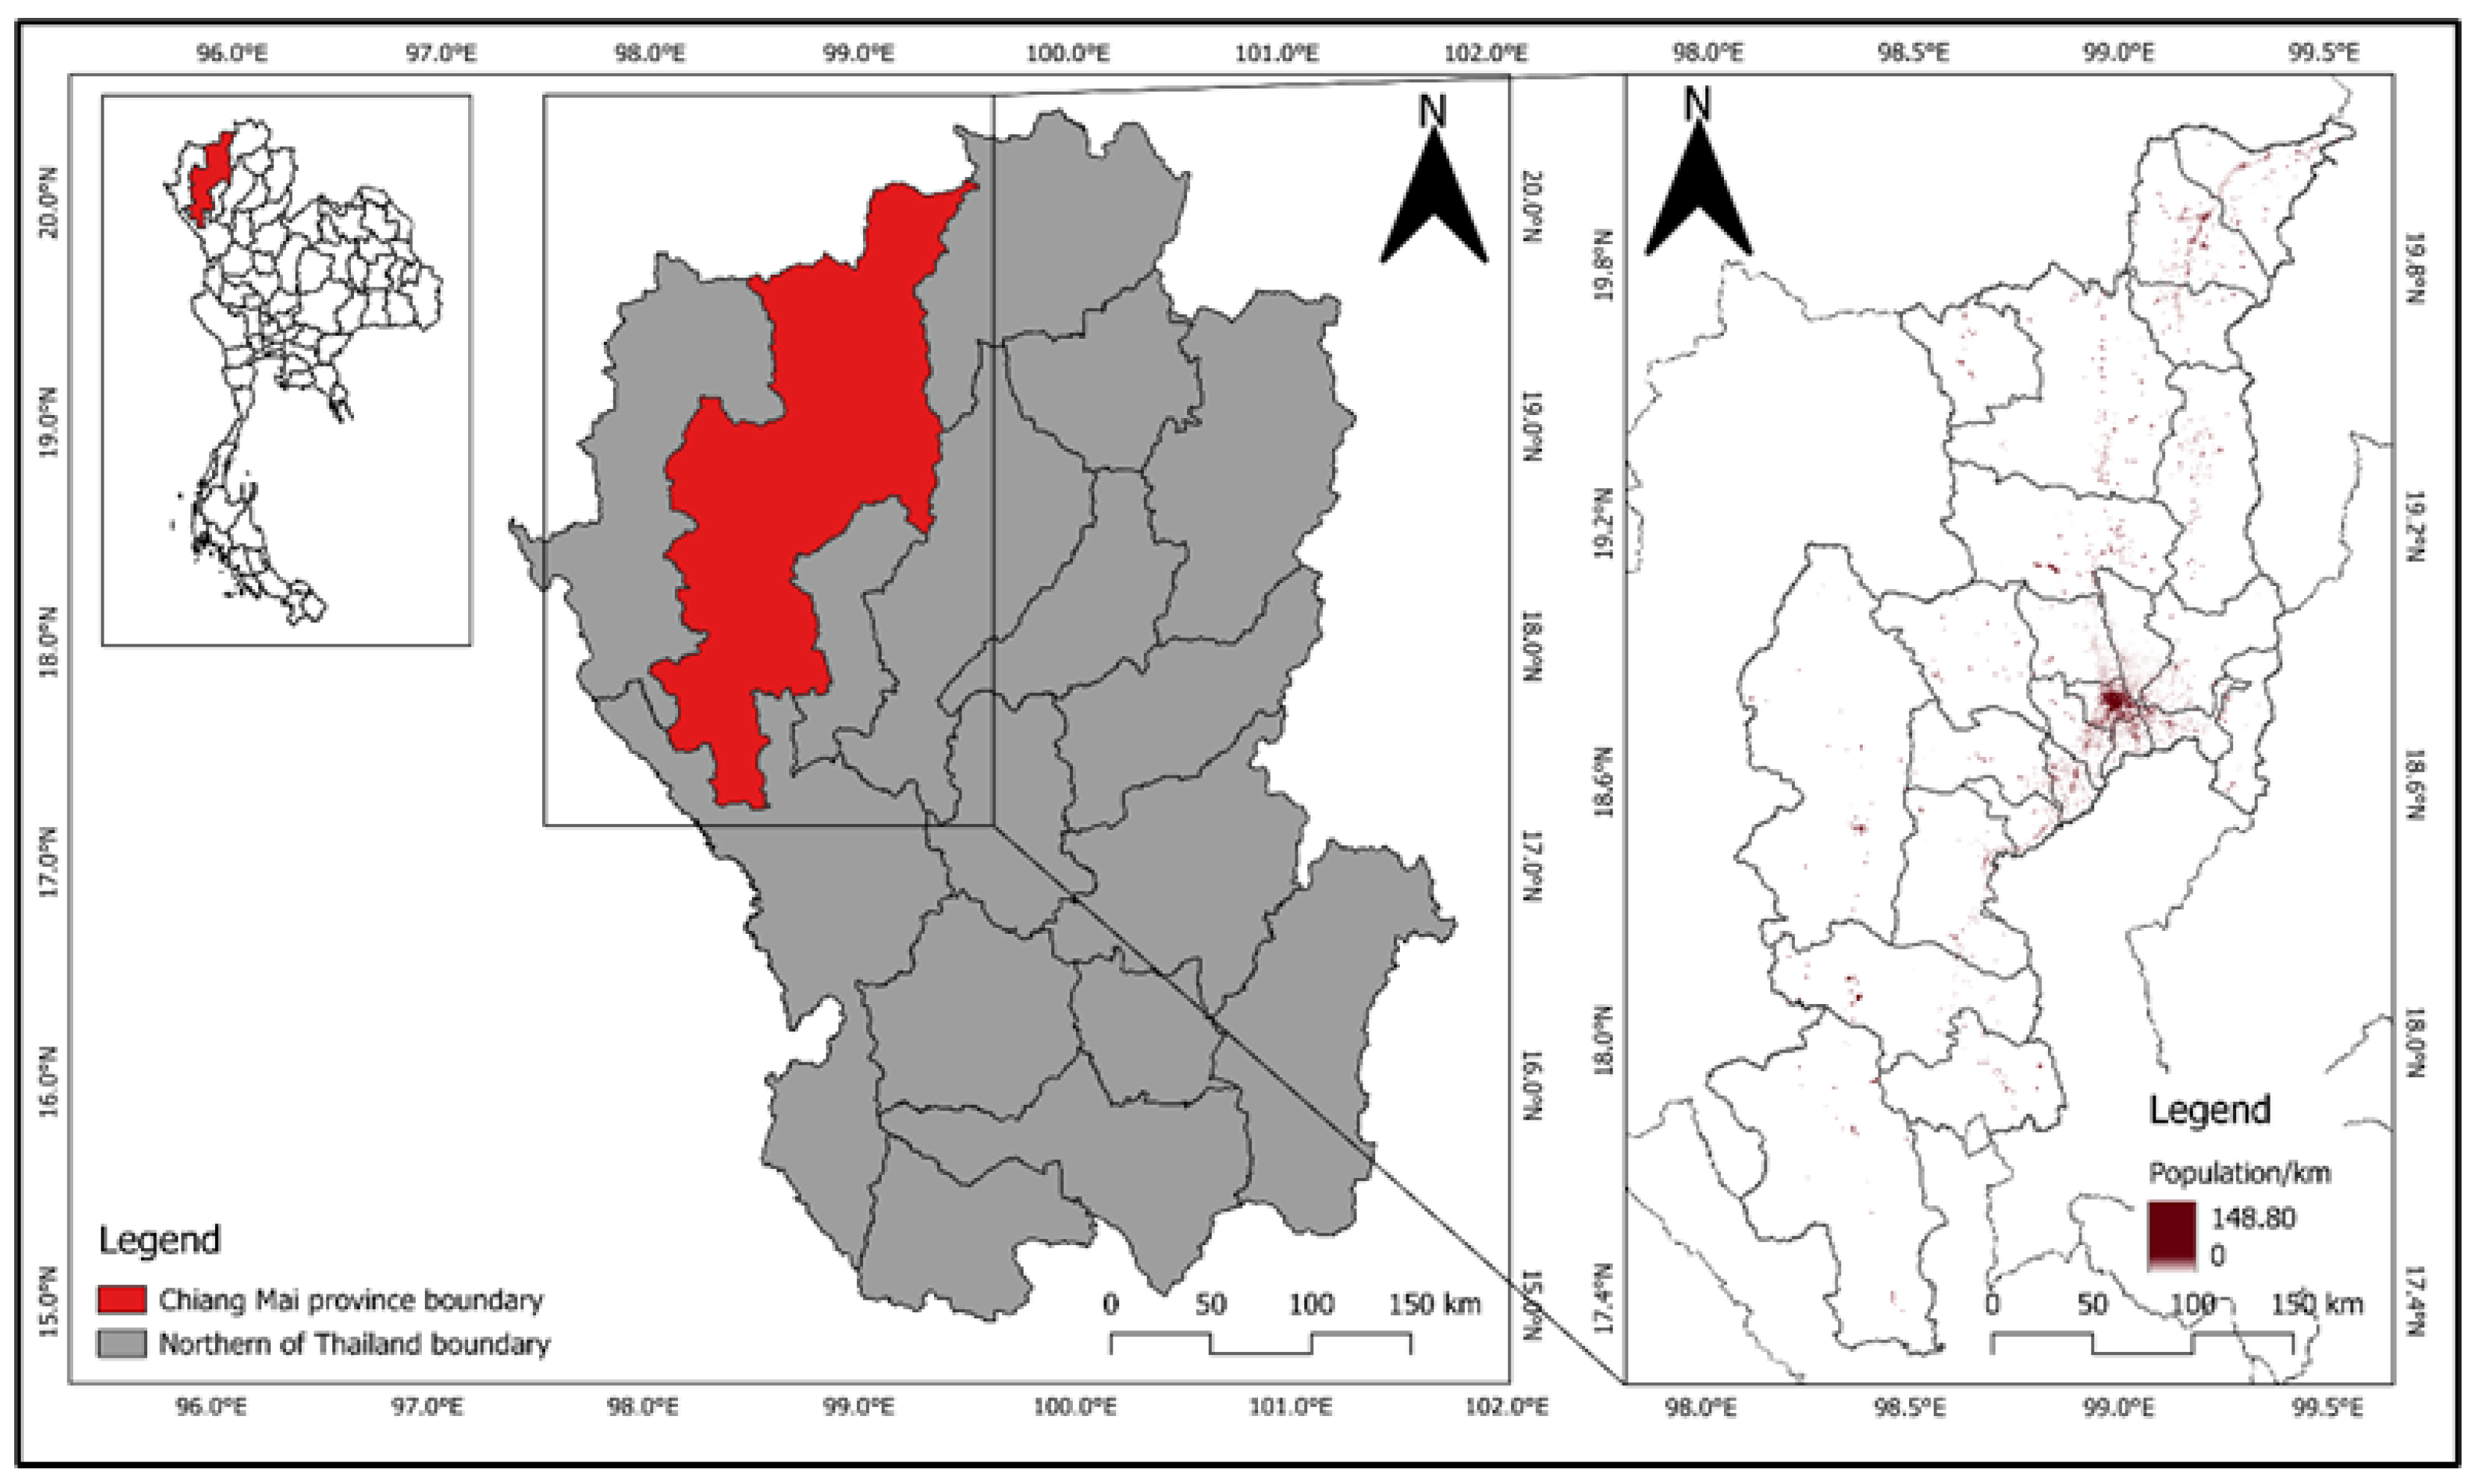
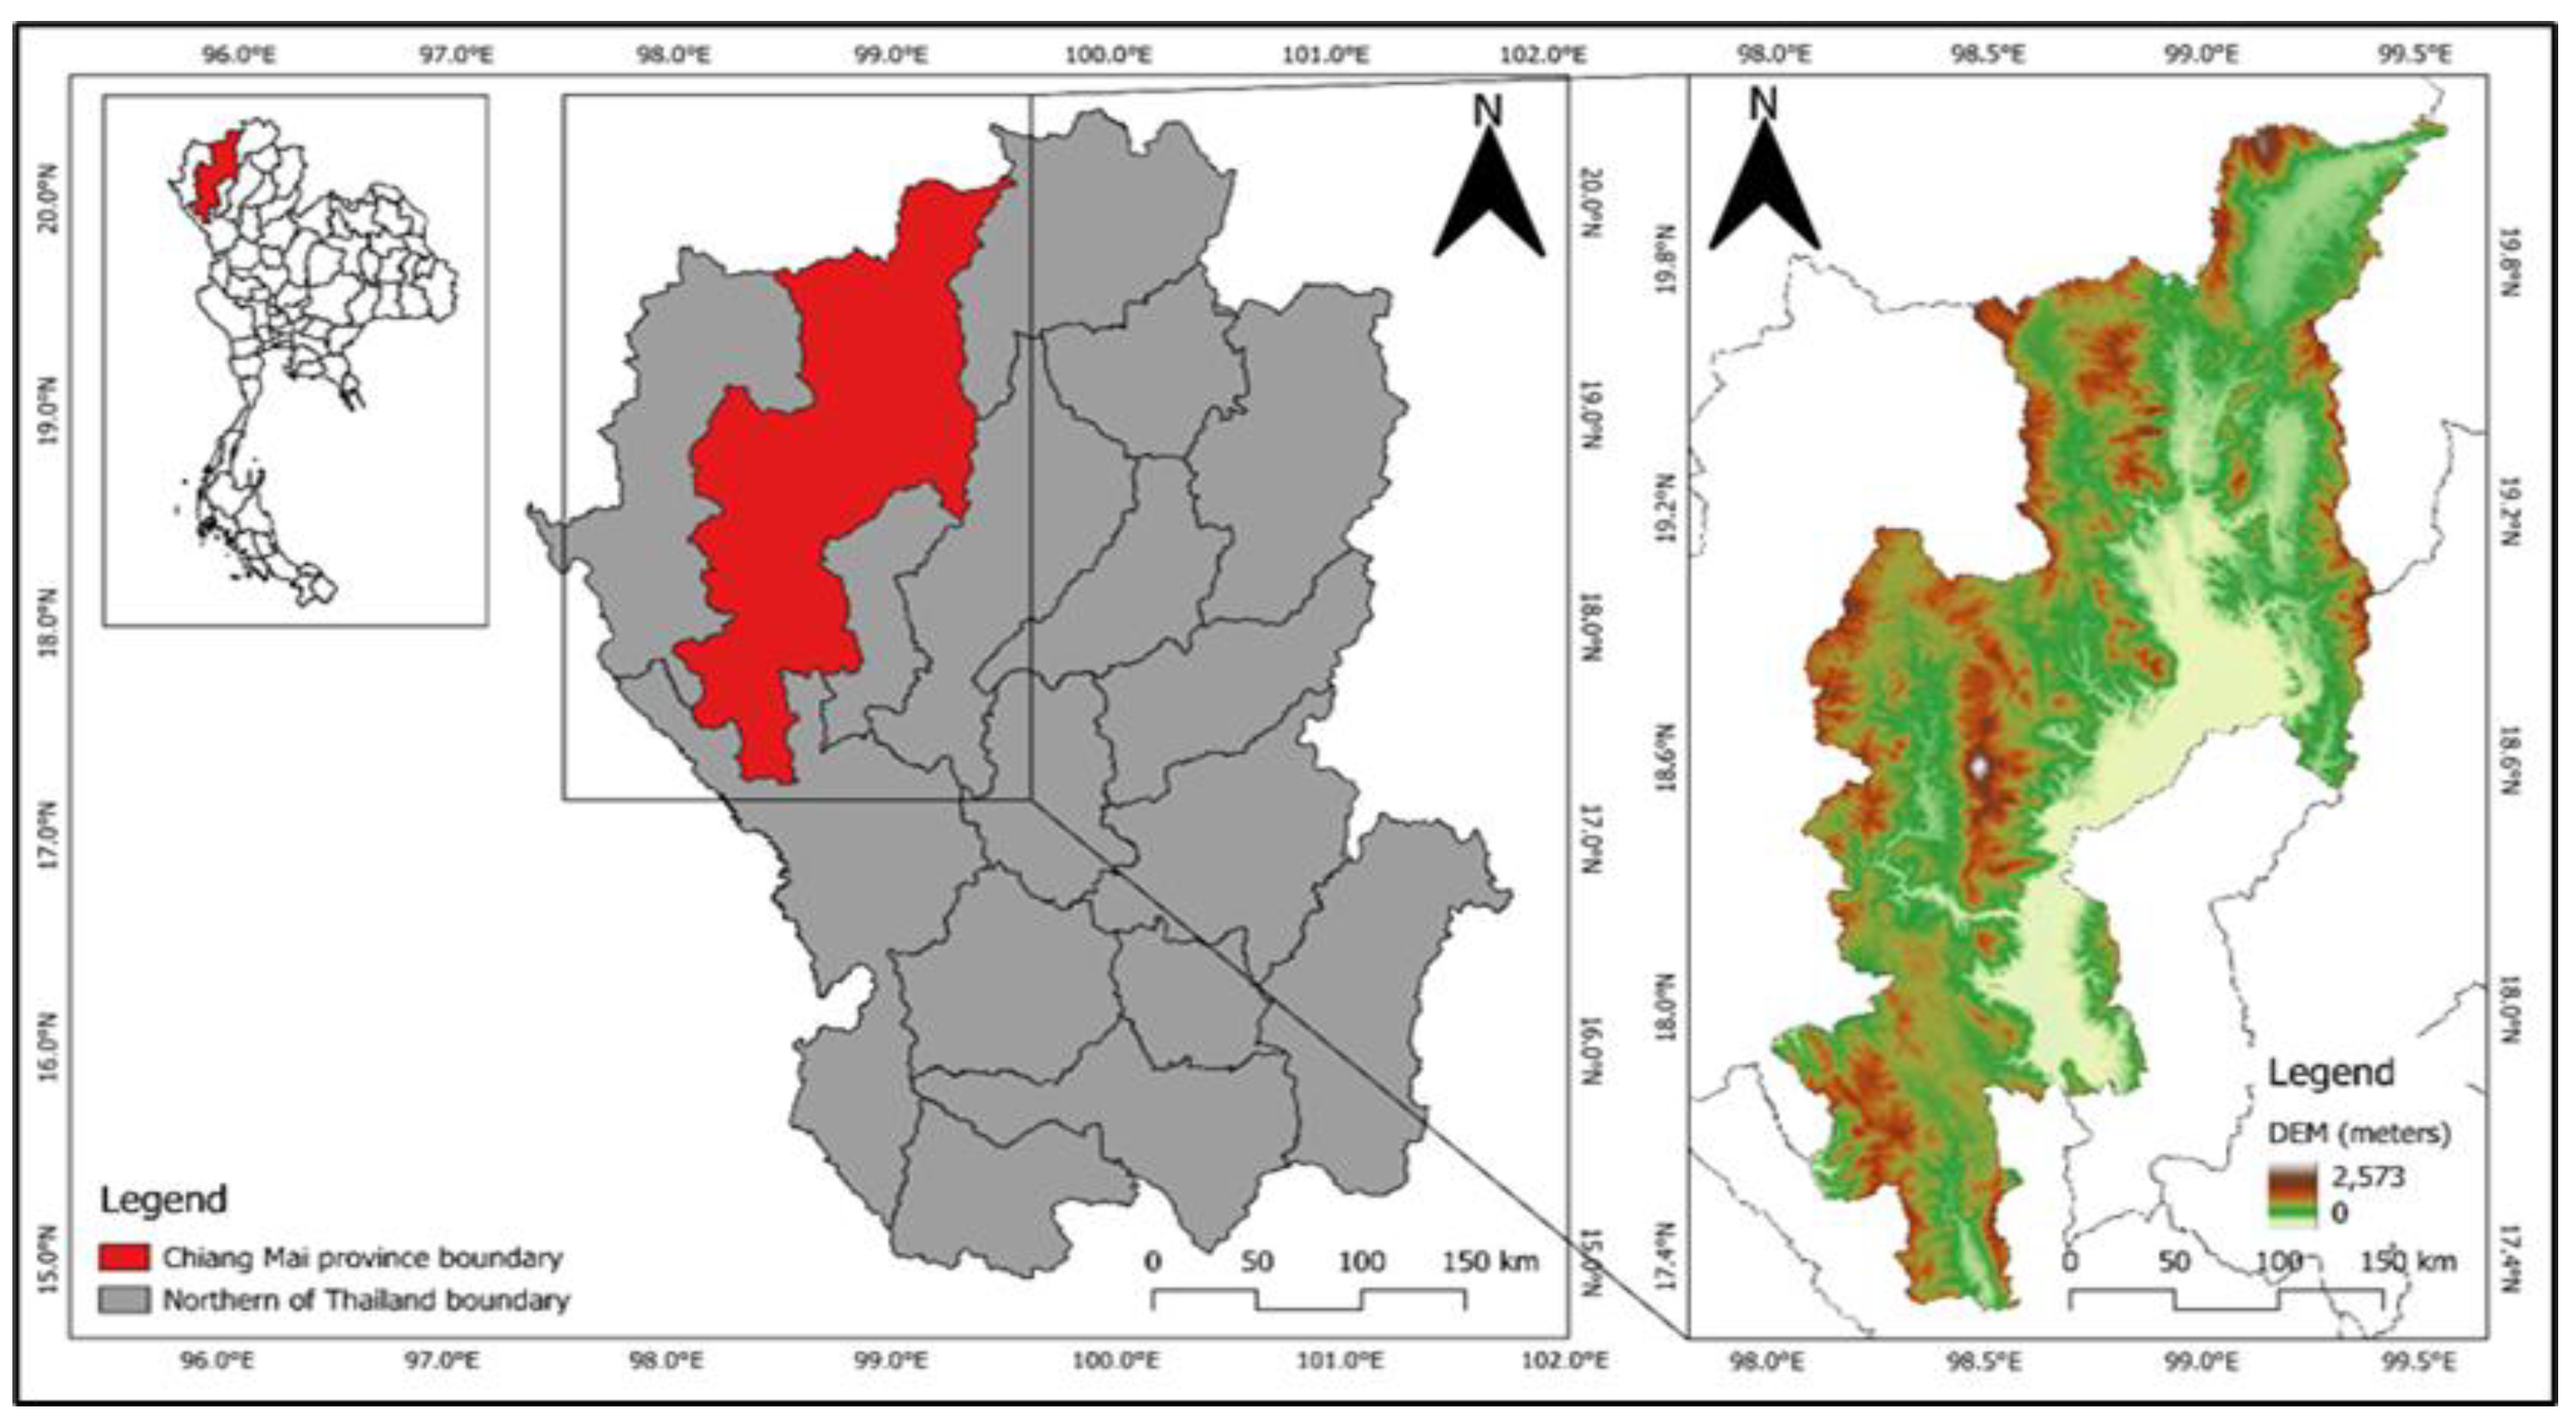
The authors selected Chiang Mai province as our study area in northern Thailand. The study region spans 17°-21° N and 98°-99° E. Chiang Mai includes 24 districts. Central and western Chiang Mai have higher population densities (
Figure 1). Chiang Mai’s elevation and geographical distribution are shown in
Figure 2, with higher topography in the northwest and lower terrain in the central and southeast. Chiang Mai has around 70% forest cover and many nationally protected species [
32]. Chiang Mai has high agricultural and forest yields, making it a viable source of open biomass for burning. Open burning monitoring needs to improve to prevent crop residue burning, conserve forests, and reduce air pollution.
2.2. Datasets
2.2.1. Visible Infrared Imaging Radiometer Suite (VIIRS) Data
Visible Infrared Imaging Radiometer Suite (VIIRS) fire spots are fire hotspots detected by the VIIRS sensor on the Suomi-National Polar-Orbiting (Suomi NPP) satellite. This satellite was launched on October 28, 2011, and is primarily designed to detect and measure infrared radiation (heat) emitted by fires (temperatures above 800 degrees Celsius) [
33,
34], which are displayed as points. Furthermore, the VIIRS fire spot system includes a multi-spectral sensor with spatial resolutions of 375 m and 750 m, respectively. The data recording frequency is every 12 hours, allowing data collection in any given area up to four times per day (twice during the daytime and twice at night) [
35,
36]. This ensures accurate measurements and provides officials with sufficient information for fire management. However, in this study, we chose to use VIIRS hotspots measured between March 28 and April 24, 2020, covering Chiang Mai province in Thailand (data available free of charge at
https://firms.modaps.eosdis.nasa.gov/download/). This period was marked by severe air pollution that significantly affected the area. Additionally, this study selected only fire spots with moderate to high confidence values, as these intervals indicate that the measurements represent actual burning in the areas [
37]. Compared to MODIS, 375 m satellite fire detection data provides better response to small fires and better mapping of extensive fire perimeters [
38]. The data are suitable for fire management and other scientific applications.
2.2.2. Land Use and Land Cover
The land use and land cover data for this study were obtained from the Land Development Department (LDD) in Thailand, which can access the data free of charge at
https://tswc.ldd.go.th/DownloadGIS/Index_Lu.html. This product was derived from two types of satellite imagery: Landsat-8 OLI and Sentinel-2. The Landsat-8 OLI satellite images use a combination of bands 5 (red), 6 (green), and 4 (blue), with the Near Infrared (NIR) band 5 (0.85–0.88 micrometers). Similarly, the Sentinel-2 satellite images use a combination of bands 8 (red), 11 (green), and 4 (blue), with the Near Infrared (NIR) band 8 (0.833-0.835 micrometers) [
39]. The resulting images suit sugarcane, cassava, and rubber plants. Additionally, the validation process incorporates field surveys and various coefficients to confirm the accuracy of the assessment results. The dataset also provides detailed land cover classifications, including cropland, forest, grassland, shrubland, and water bodies, along with symbols specific to each land use category [
40]. Given the air pollution situation in the study area, this study focused on only five land-use and land-cover types: deciduous forest (F201), evergreen forest (F101), rice plantation (A1), maize plantation (A202), and sugarcane plantation (A203). These areas are long-standing sources of air pollution that significantly affect air quality in the study area, especially forest areas, where the percentage of forest fires can reach 100%. Implementing corrective measures becomes highly challenging when burning occurs in forest areas, dense forests, or steep slopes. This leads to severe air pollution, which harms the environment.
2.2.3. Meteorological Data and Air Mass Movement
The meteorological data used in this study include maximum and minimum temperatures, wind speed, wind direction, relative humidity, and air pressure. The Northern Meteorological Center provided this data. Meteorological factors are significant drivers of air pollution. Specifically, they can influence the severity of air pollution or alleviate it. Furthermore, meteorological conditions are considered uncontrollable, meaning no measures can be implemented to lower temperatures or increase wind speed [
41]. The Air Resources Laboratory (ALR) [
42] of the National Oceanic and Atmospheric Administration (NOAA) generated the HYbrid Single-Particle Lagrangian Integrated Trajectory Model version 4 (HYSPLIT-4) in 2020 to calculate a 12-hour backward trajectory to the sampling sites. The researchers set the sample location’s arrival height at 2,500 meters above ground level to match the model’s limits and surface data [
3,
4].
2.3. Sampling Description
In this study, the cascade size-segregated air sampler collected particles down to the nanoparticle size range (PM
0.1) during intense biomass fire episodes. This sampler involved four stages: PM
1.0-0.5, PM
2.5-1.0, PM
10-2.5, and PM
>10 reflected to collect particle size of 1.0-0-5, 2.5-1.0, 10-2.5 and >10 μm, respectively, and an inertial filter stage (PM
0.5-0.1) and, in addition to a backup filter stage (< 0.1 μm, PM
0.1). The sampler was performed at a flow rate of 40 L/min for 11.5 h during daytime and nighttime, retrieved from a 55 mm quartz fibrous filter (Pallflex 2500QAT-UP), and PM
0.5-0.1 collected from an inertial filter containing stainless steel wool (9.8 ± 0.03 mg) (Nippon Seisen Co. Ltd., felt form, SUS) [
43]. Before sampling, the quartz filter paper and inertial filter underwent several quality assurance measures, including pre-baking, aluminum foil wrapping, conditioning, and preservation [
44]. Sampling occurred during the hot dry season.
3. Results and Discussion
3.1. Fire Hotspots in Chiang Mai, Thailand
Chiang Mai experiences biomass burning during the dry season, both during the day and at night.
Figure 3 shows the open wildfire in Chiang Mai, approximately 2 km
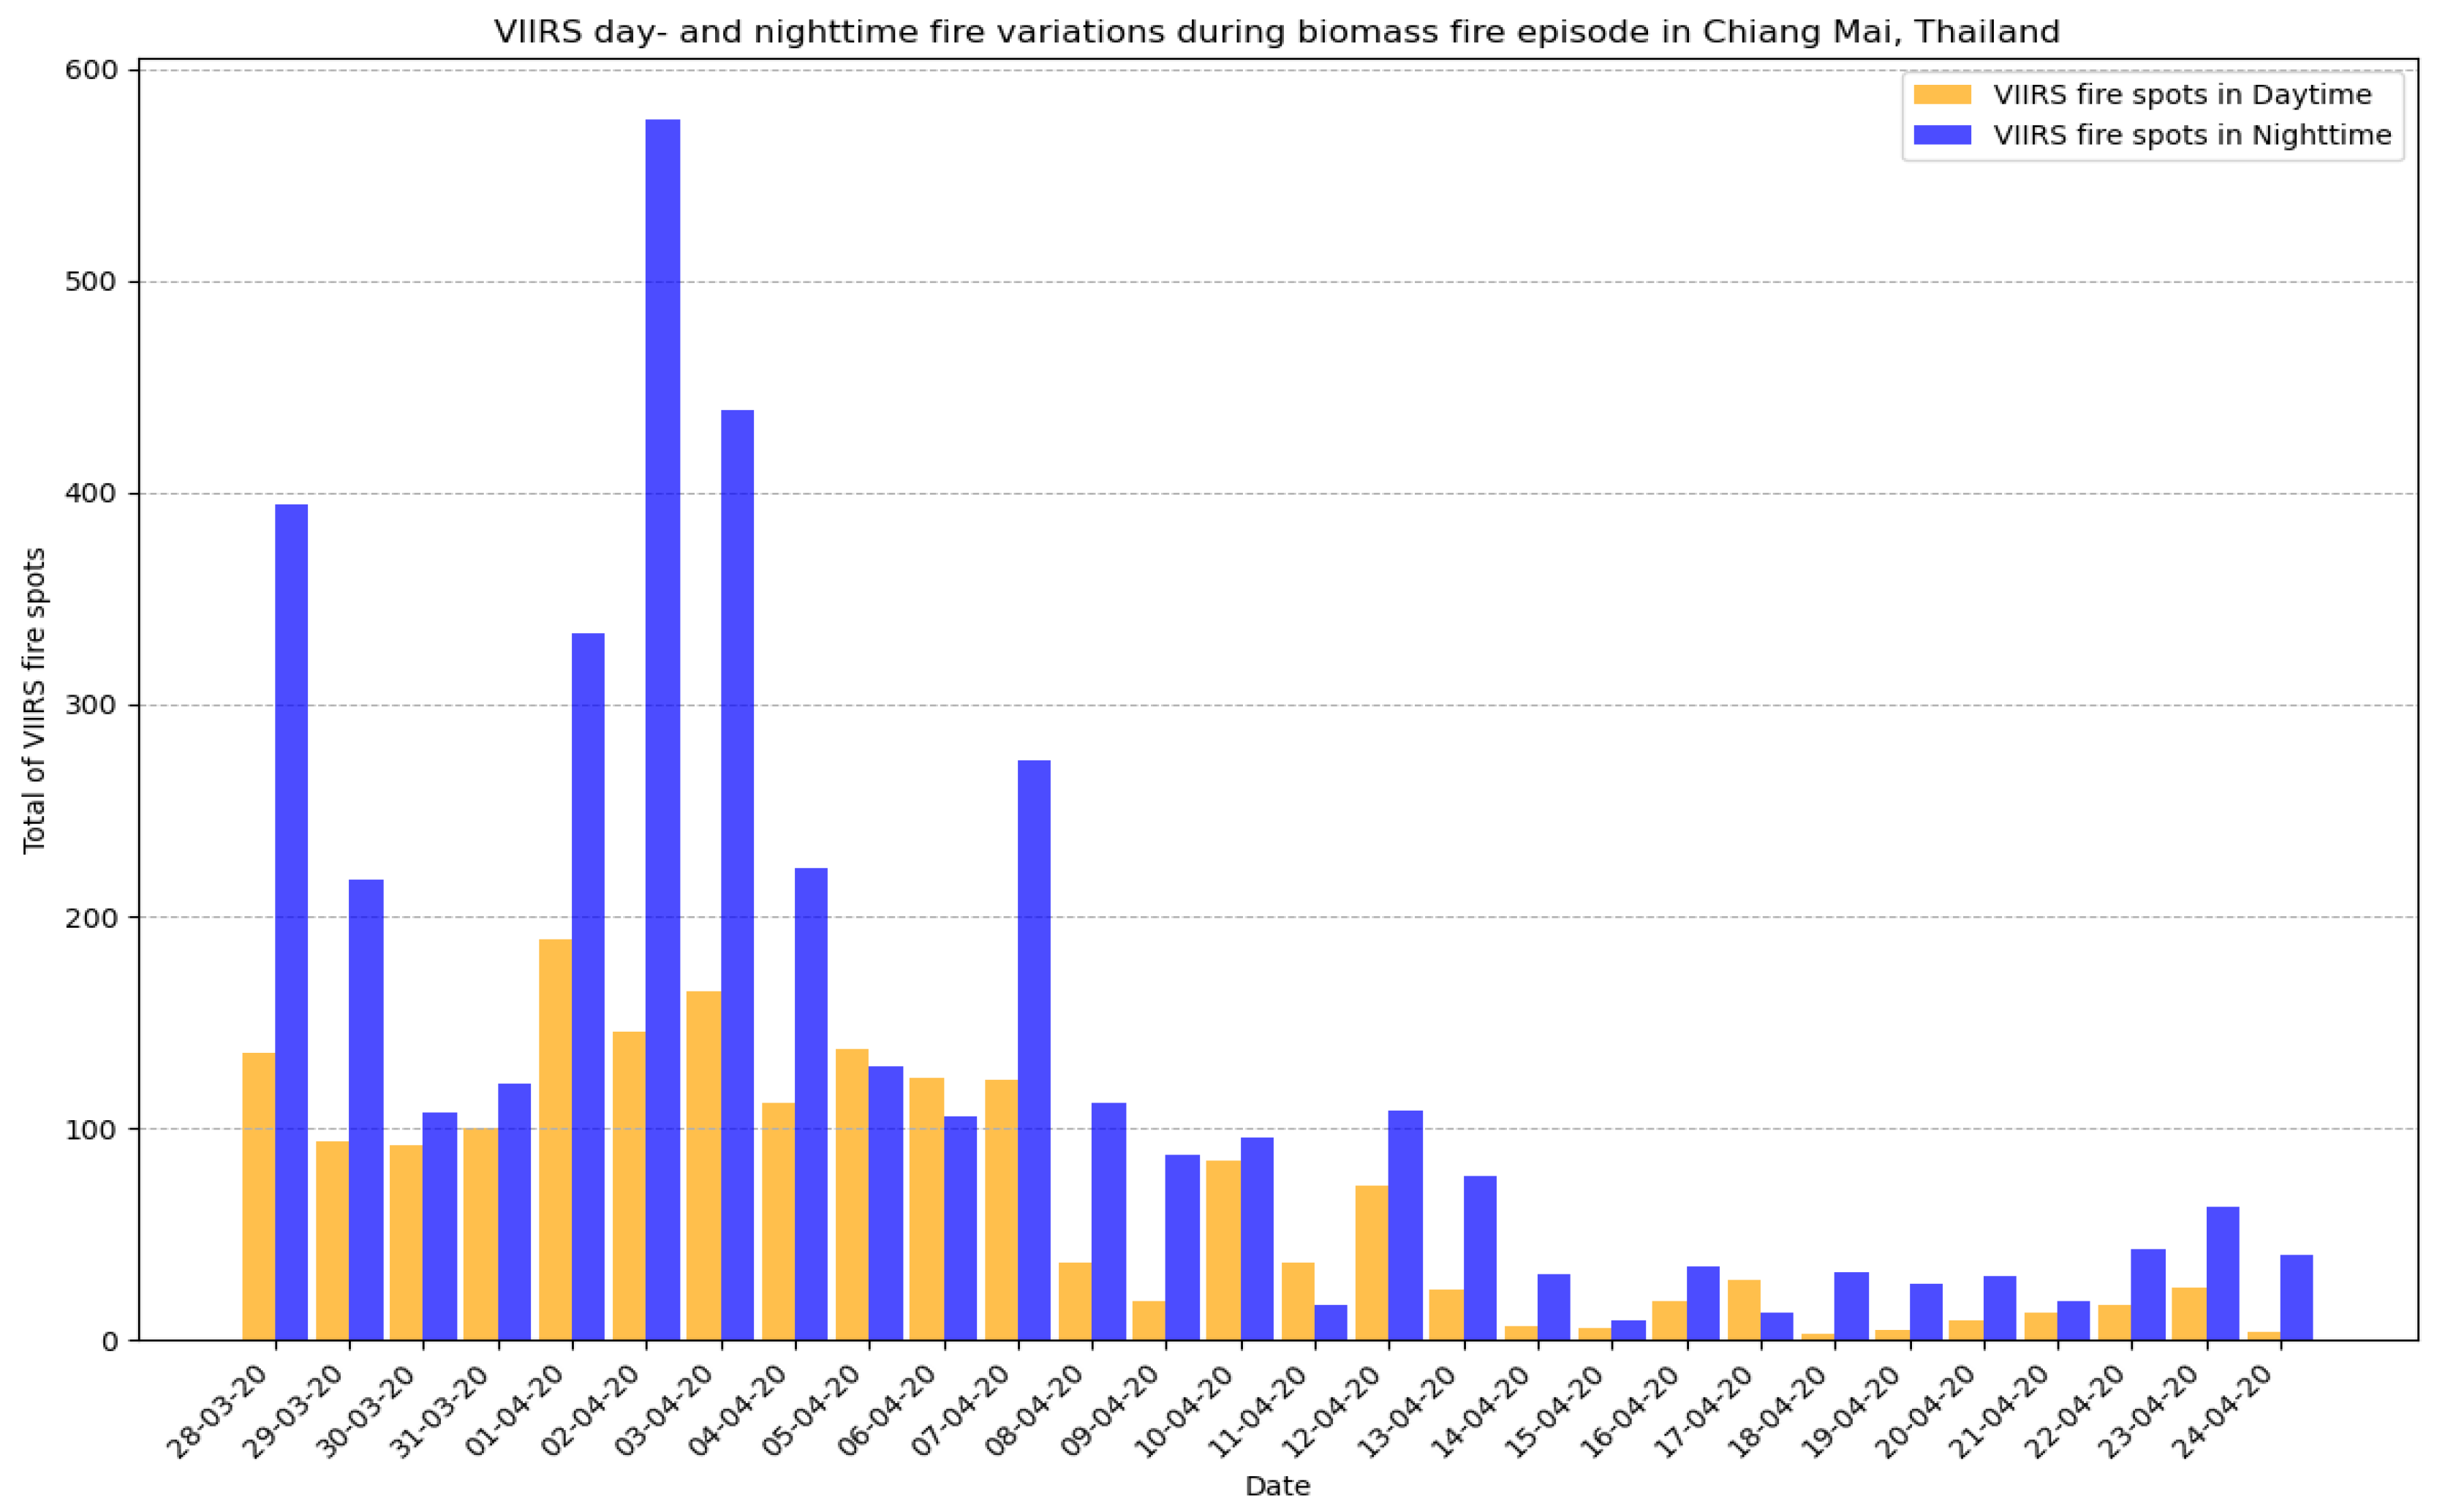
² from the PM sampling site. This difference between day and night fires can be further explained by VIIRS satellite data, which detected significantly more hot spots at night than during the day. During the study period, a total of 5,585 VIIRS fire spots were detected, of which 1,827 (32.71% of the total) were detected during the daytime and 3,758 (67.29% of the total) were detected during the nighttime. The time series of VIIRS fire spots is shown in
Figure 4. The time series indicates that during this period, the number of fire spots peaked significantly between March 28 and April 10, 2020, then declined continuously. The meteorological conditions during the early part of the fire period were characterized by dry weather. Dry meteorological conditions substantially affect biomass in the region, including dry leaves and branches, which become highly flammable and easy to burn. This condition increases combustion efficiency, leading to greater pollutant emissions into the atmosphere [
45,
46]. In contrast, the meteorological conditions after 10 April 2020 were directly influenced by high-pressure systems or warm air masses from China, which typically cover Thailand’s northeastern and northern regions around mid-April each year [
47]. When these air masses collide with low-pressure systems or warm air masses in the area, they trigger summer thunderstorms. This phenomenon is a crucial factor contributing to the continuous decline in detectable hot spots after April 10.
Figure 4 displayed that fire spots were consistently higher at night, likely due to cooler temperatures, which may create more favorable conditions for satellite detection [
48]. In contrast, daytime fire detections, although present, were substantially fewer, likely due to stronger atmospheric interference that can prohibit combustion. After 10 April, a sharp decline in fire activity coincided with the onset of early summer storms, which increased regional precipitation and humidity, effectively suppressing fire activity across the area. This pronounced seasonal transition highlights the dominant influence of meteorological conditions on fire dynamics in Chiang Mai Province during the dry season [
49,
50].
Figure 4.
VIIRS day- and nighttime fire variations during biomass fire episode in Chiang Mai, Thailand.
Figure 4.
VIIRS day- and nighttime fire variations during biomass fire episode in Chiang Mai, Thailand.
Figure 5.
VIIRs hotspots fire distribution map during daytime and nighttime in Chiang Mai, Thailand.
Figure 5.
VIIRs hotspots fire distribution map during daytime and nighttime in Chiang Mai, Thailand.
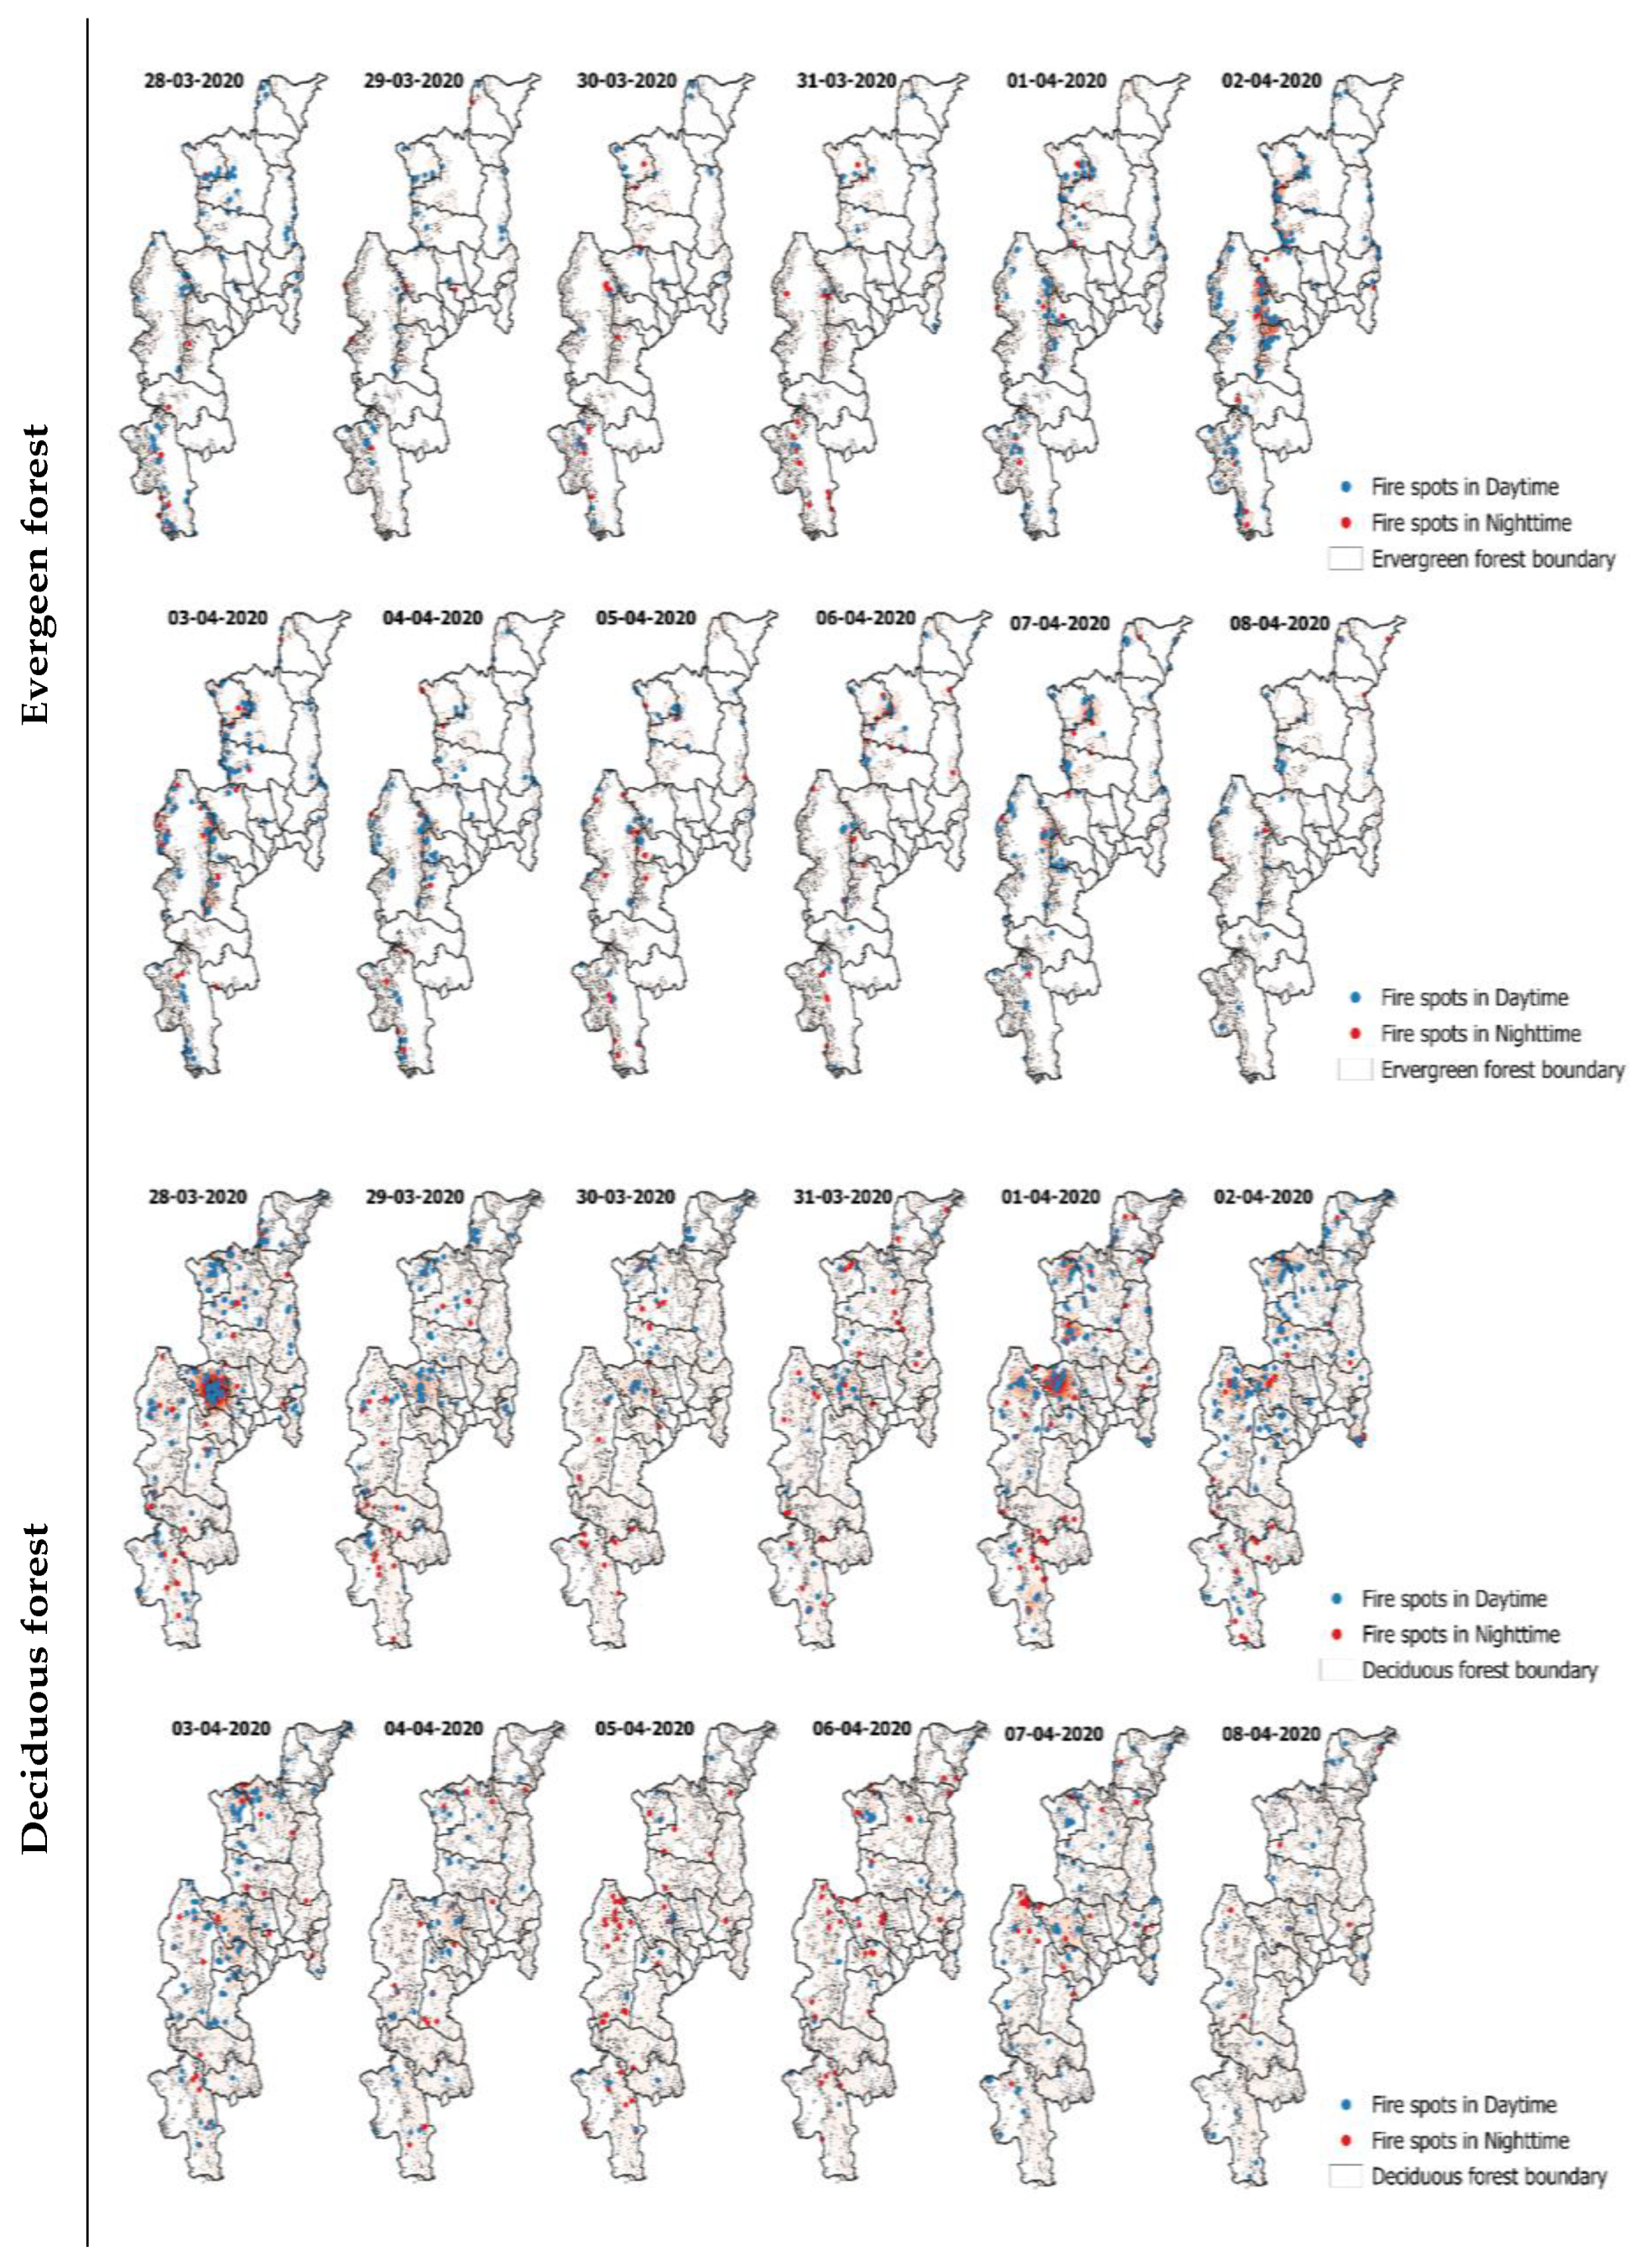
Furthermore, the peak in fire spots, particularly between March 28 and April 10, aligns with the annual dry season forest fires. This corresponds to the topography of Chiang Mai province, where most of the area, covering 12,480 km2 or 70% of the province’s area, is forested [
13,
32]. Specifically, deciduous forests account for 9,464.51 km2, or 75.83% of the forested area, while evergreen forests cover 3,016.01 km2, or 24.16% of the forested area. Corn plantations had the highest number of fire spots in agricultural regions, with 102 points. This pattern is likely due to corn’s greater economic and agronomic advantages, which allow it to be cultivated without irrigation, facilitating its expansion into forested areas. Rice cultivation ranked second, with 45 detected hotspots. Although rice is a crucial economic crop essential for livelihoods, the study period did not coincide with the rice harvest season, which typically occurs between November and December each year. Lastly, no fire spots were detected in sugarcane plantations, as sugarcane farming is limited in Chiang Mai. Because 90% of harvested sugarcane is sent to sugar mills for processing sugar, Chiang Mai lacks such facilities. The only sugar factory in the upper north is in Uttaradit province, making sugarcane cultivation economically unfeasible in Chiang Mai [
13]. This pattern is depicted in the density map of fire spots categorized by land use, as shown in
Figure 6.
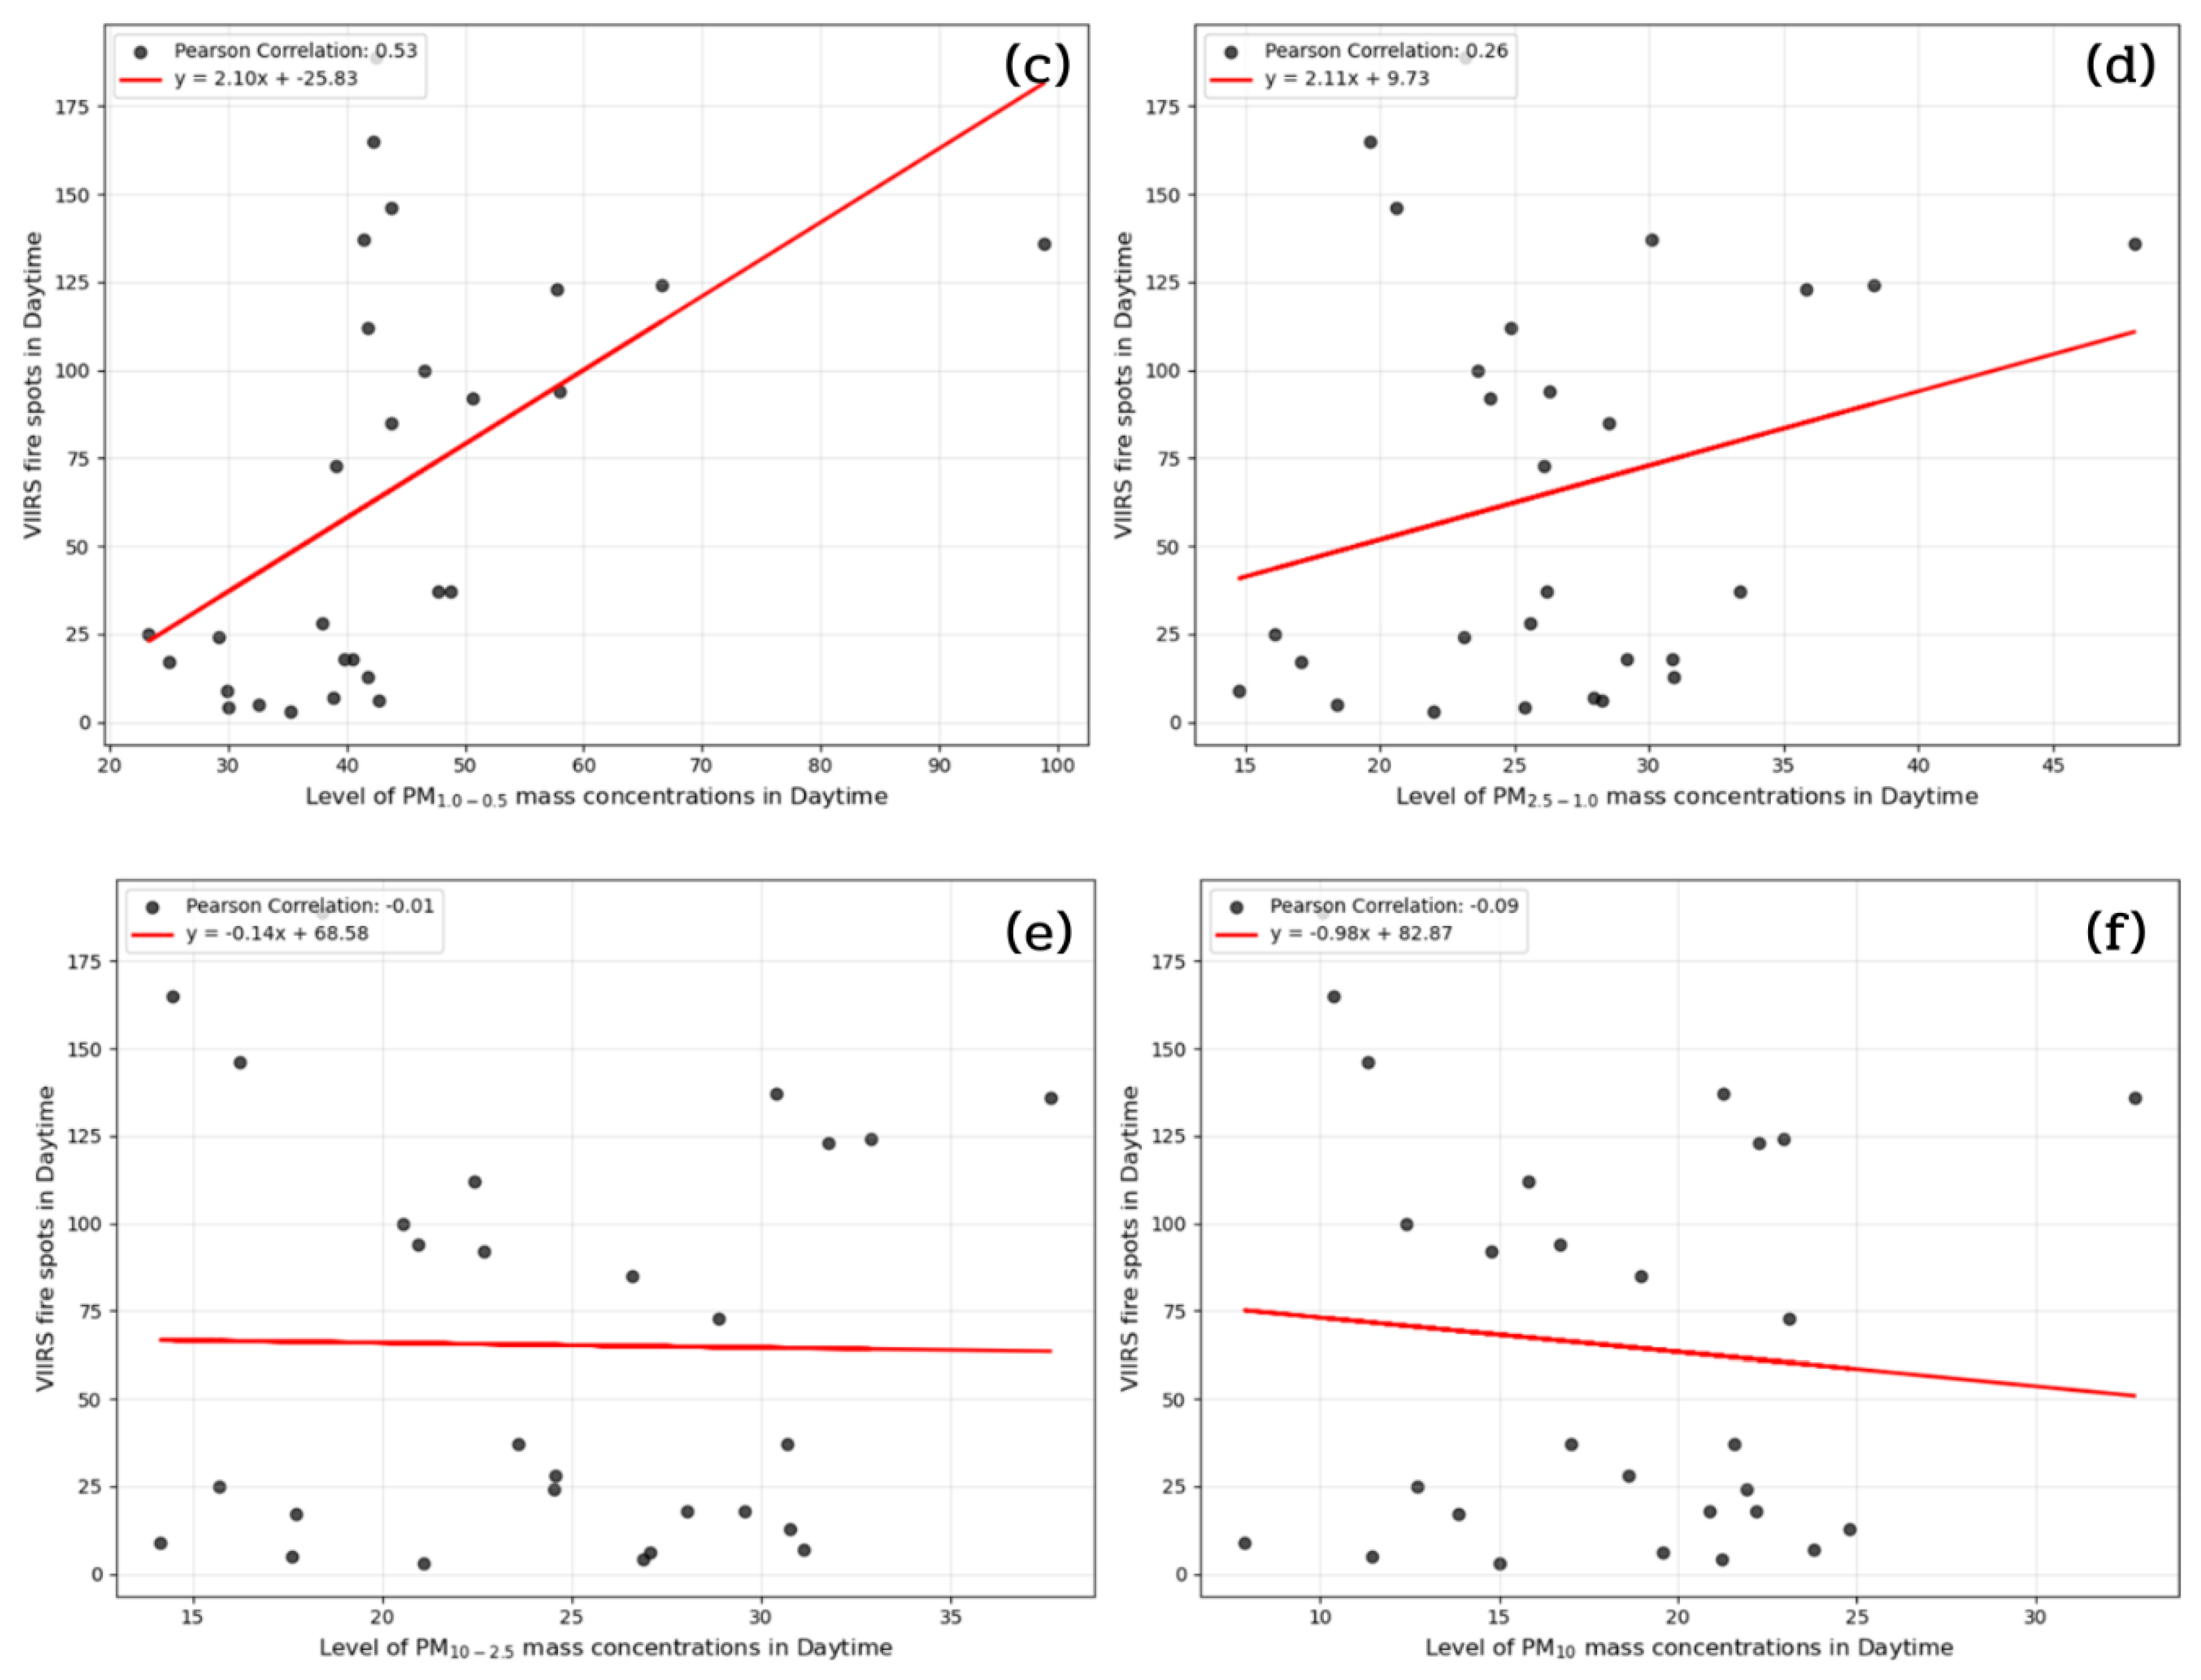
3.2. Particulate Matter and Fire Hotspots
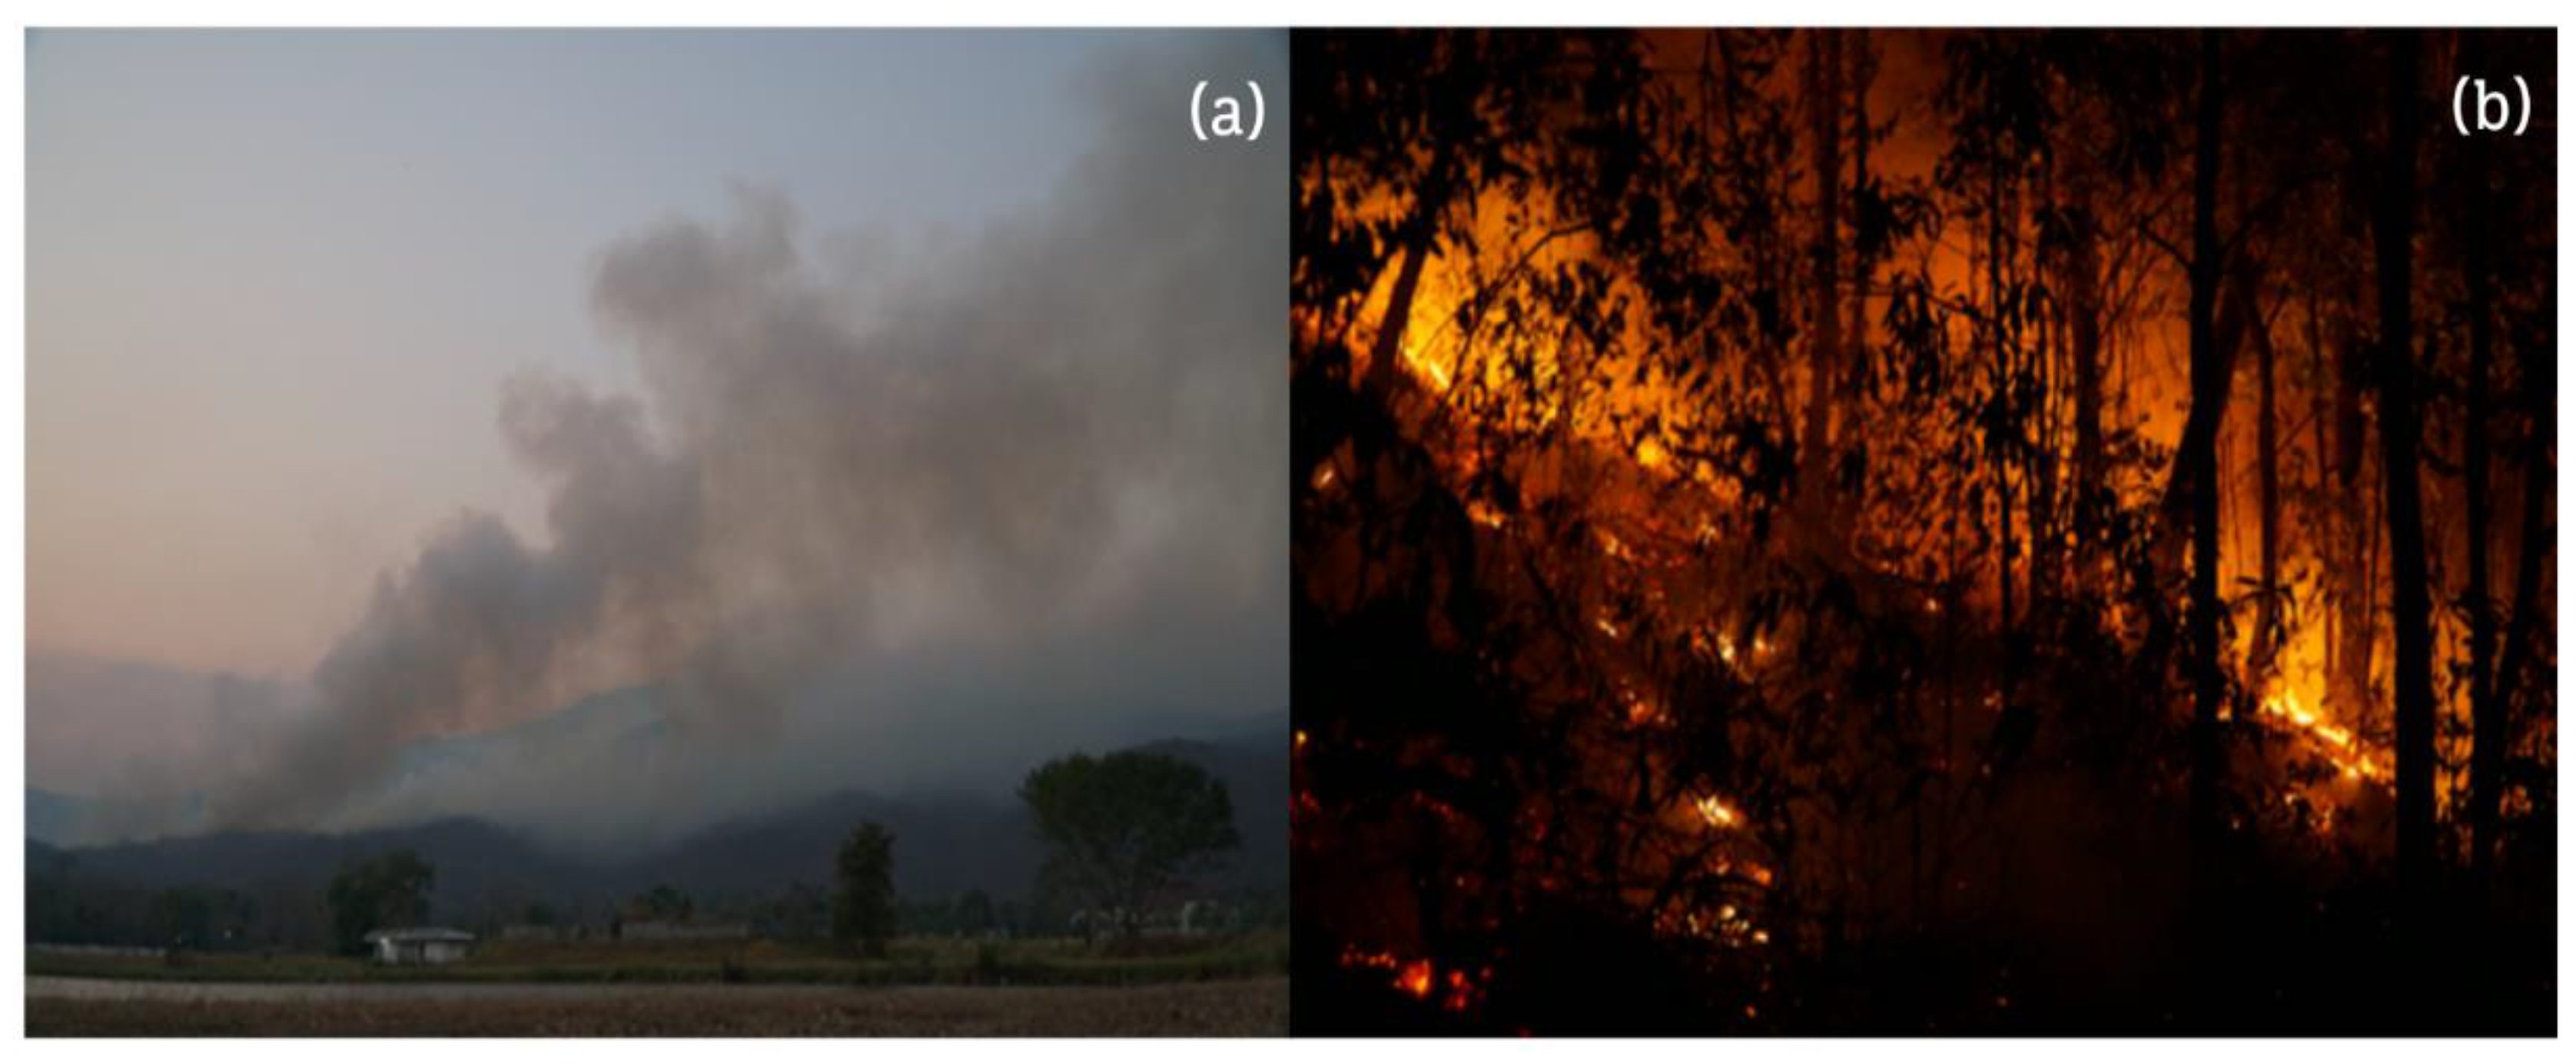
The mass concentration of PM was higher at night than during the day from the start of the severe biomass burning in Chiang Mai. The numerous forest fires near Doi Suthep mountain, approximately 2 km from the sampling site, may contribute to the significant smoke in the Chiang Mai area.
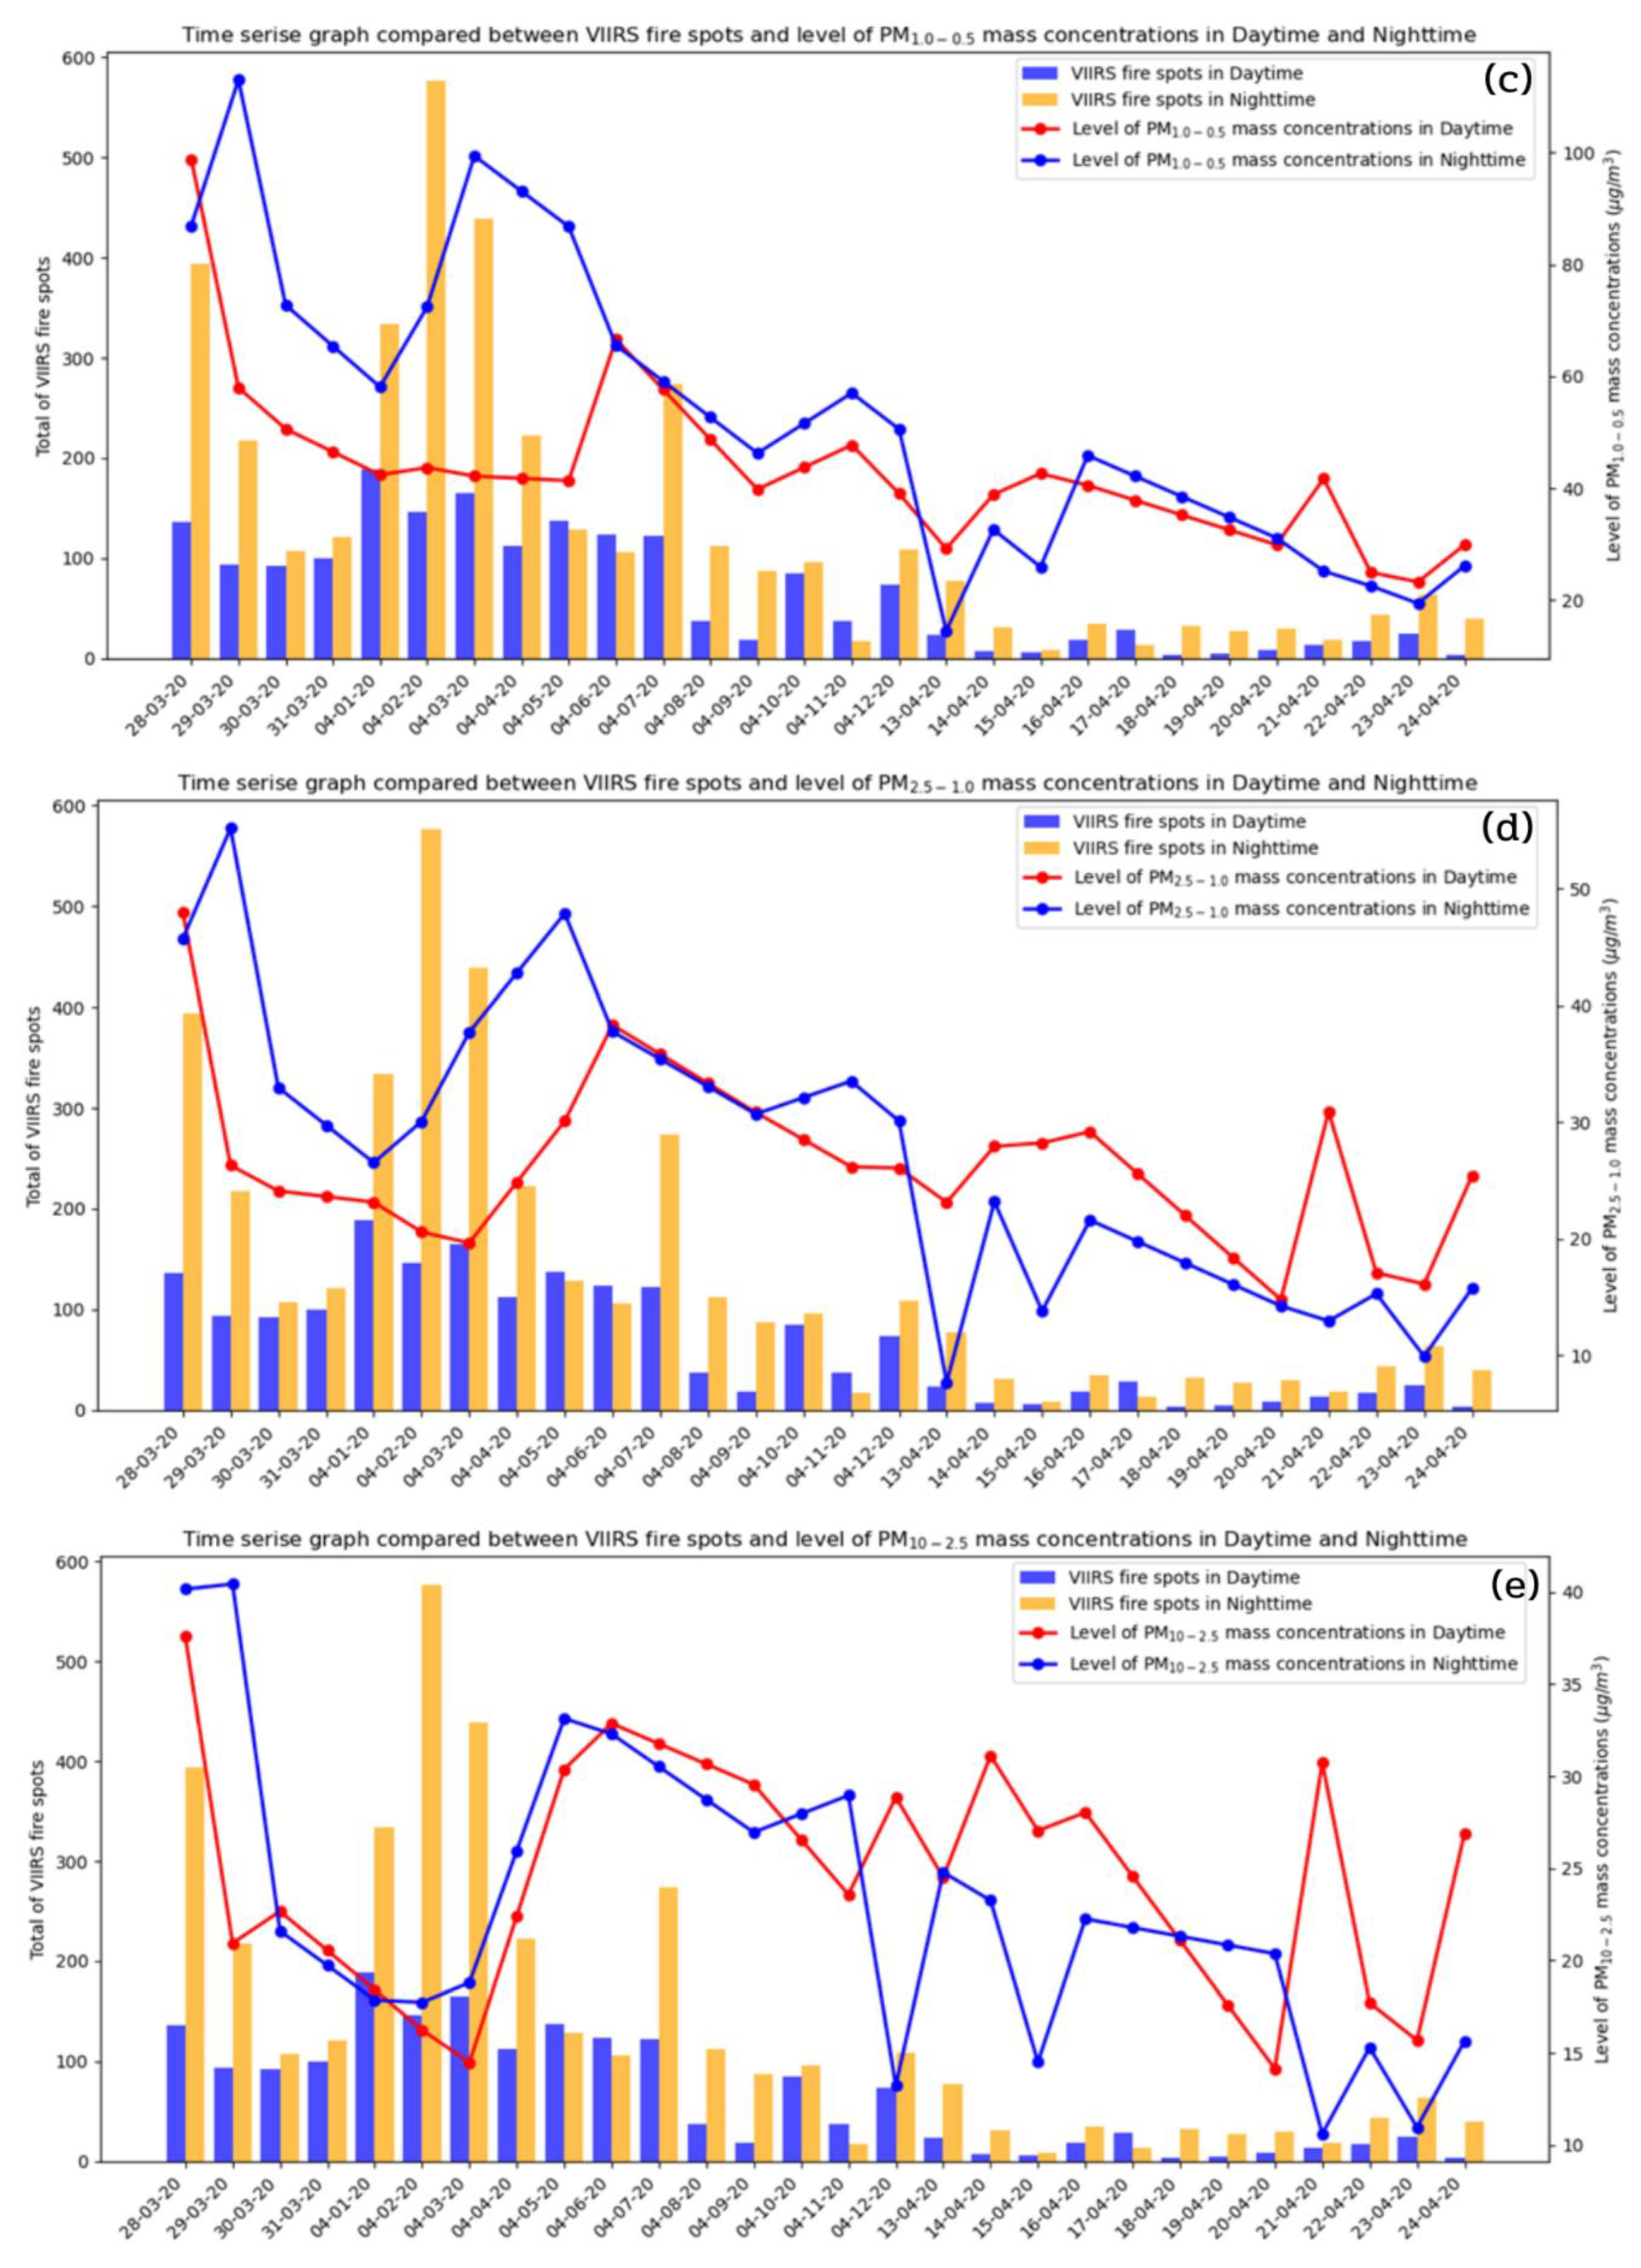
Figure 7(a-f) showed size-fractionated PMs down to PM
0.1, and hot spot counts from VIIRS. The peak of PM mass concentration was in the PM
1.0-0.5 size fraction. After mid-April, the mass concentration during daylight hours exceeds that at night, as unstable atmospheric conditions tend to be more pronounced during the day, leading to higher particle levels and elevated airborne size-fractionated PM concentrations. The finer particle size, including PM
0.5-1.0 and PM
1.0-0.5, corresponds to high active fires. These results implied that the smoke haze during the Chiang Mai, Thailand, biomass fire episode produced mainly submicron particles (< 1 micron). This information agrees with Phairuang et al. (2019) [
21], who reported that the particles released from biomass fires were in the 1.0-0.5 µm size range during biomass fire episodes in Chiang Mai, based on the year 2014-2015.
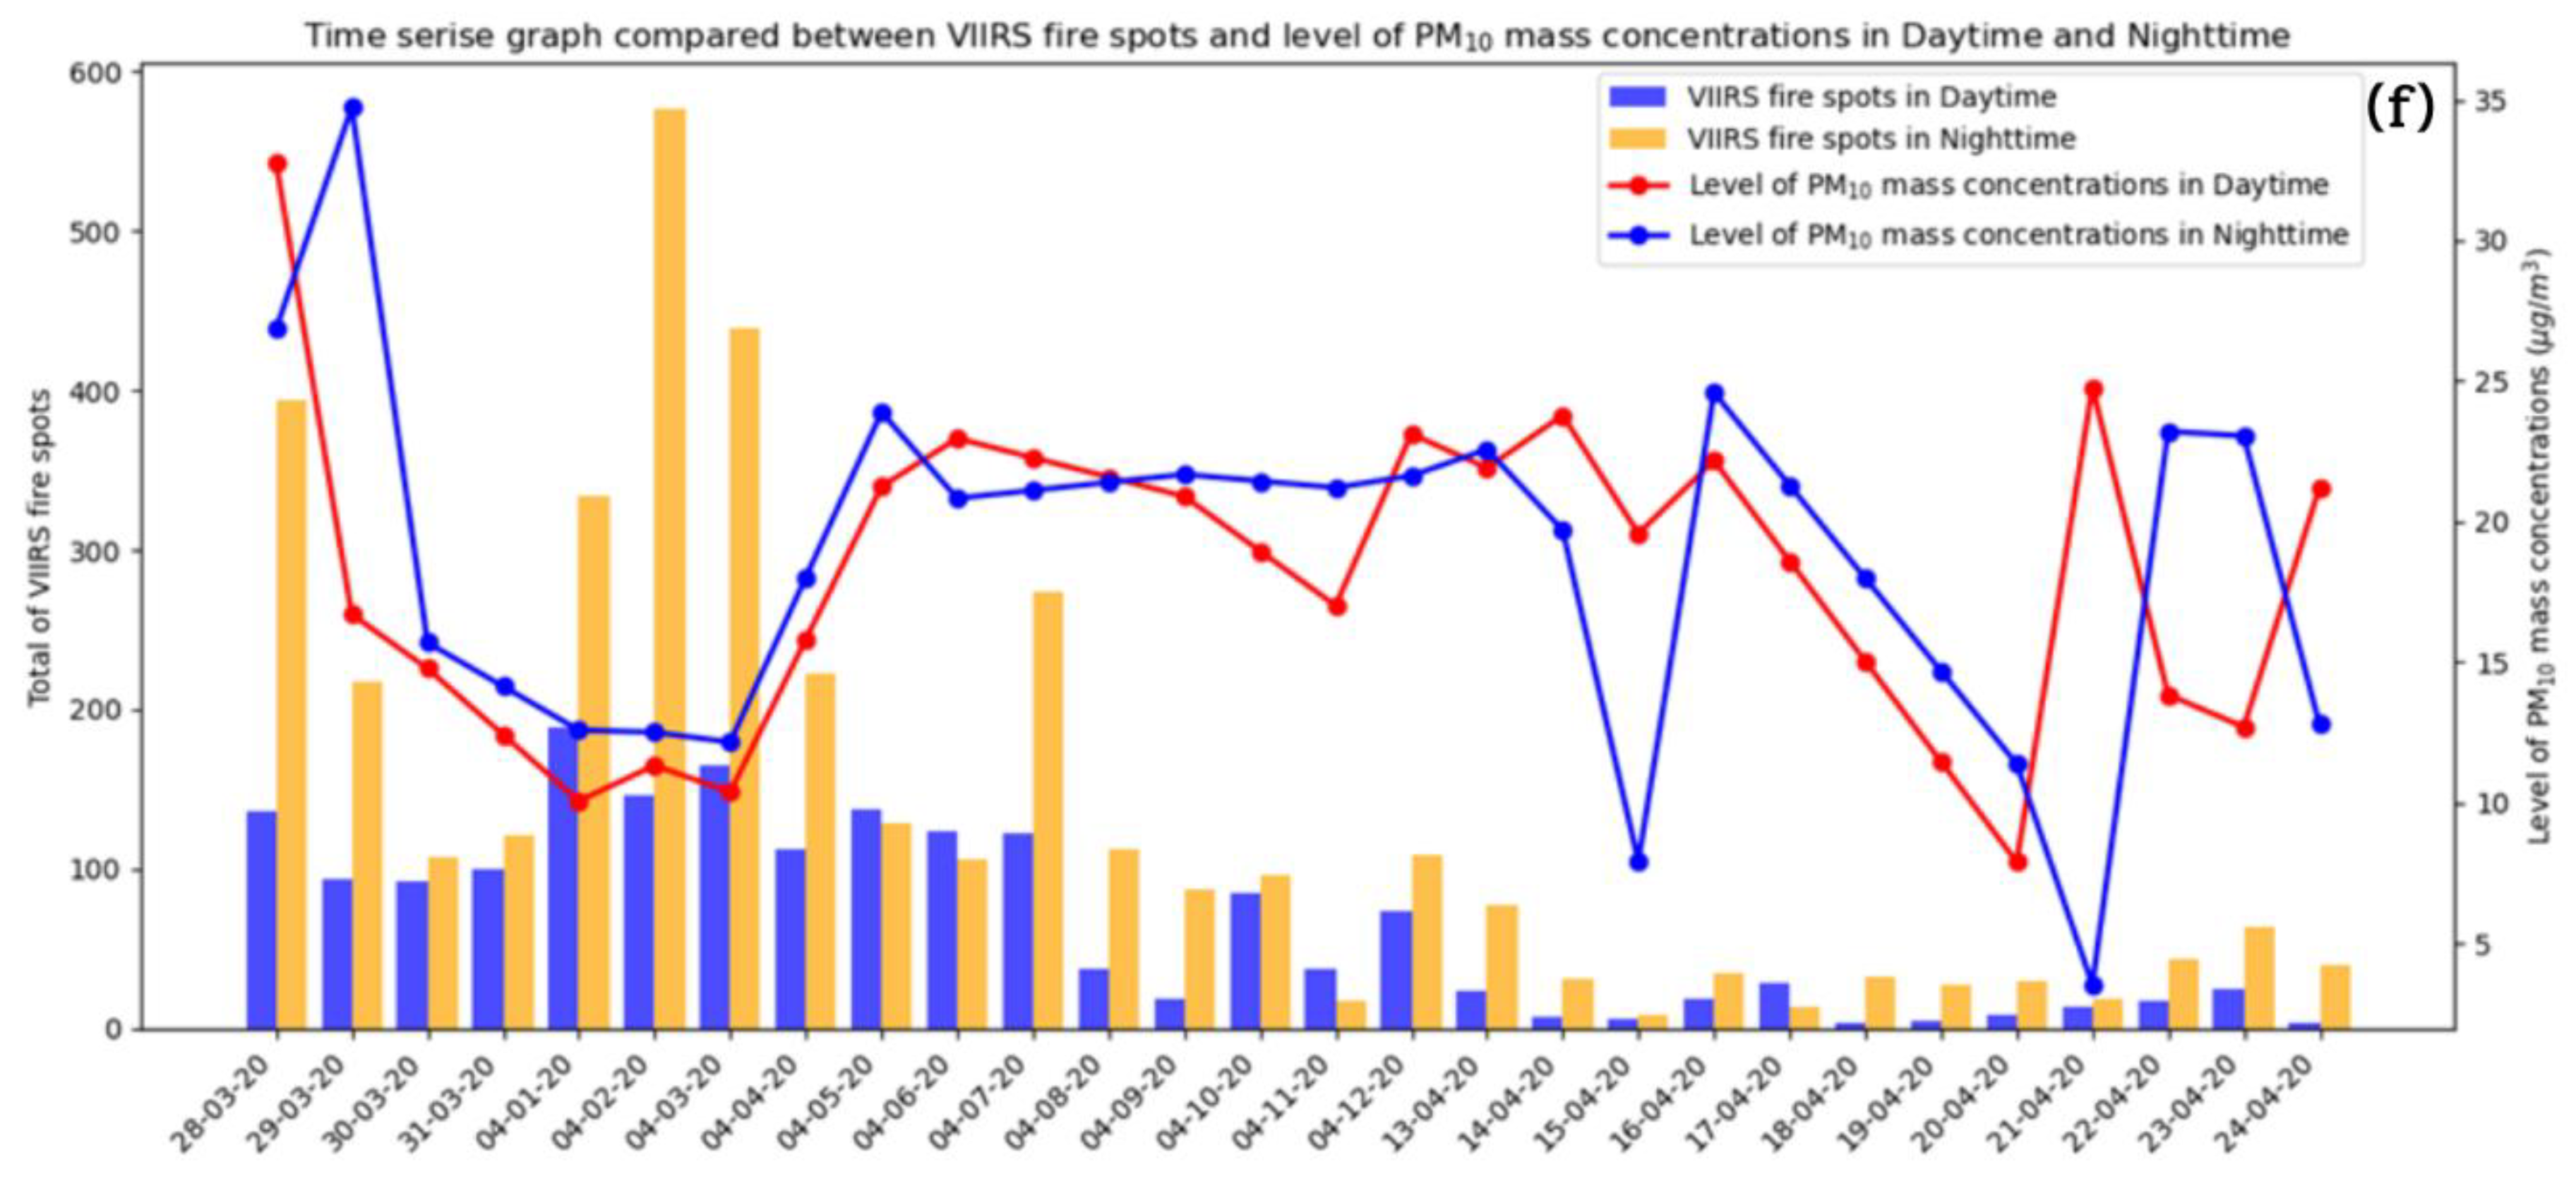
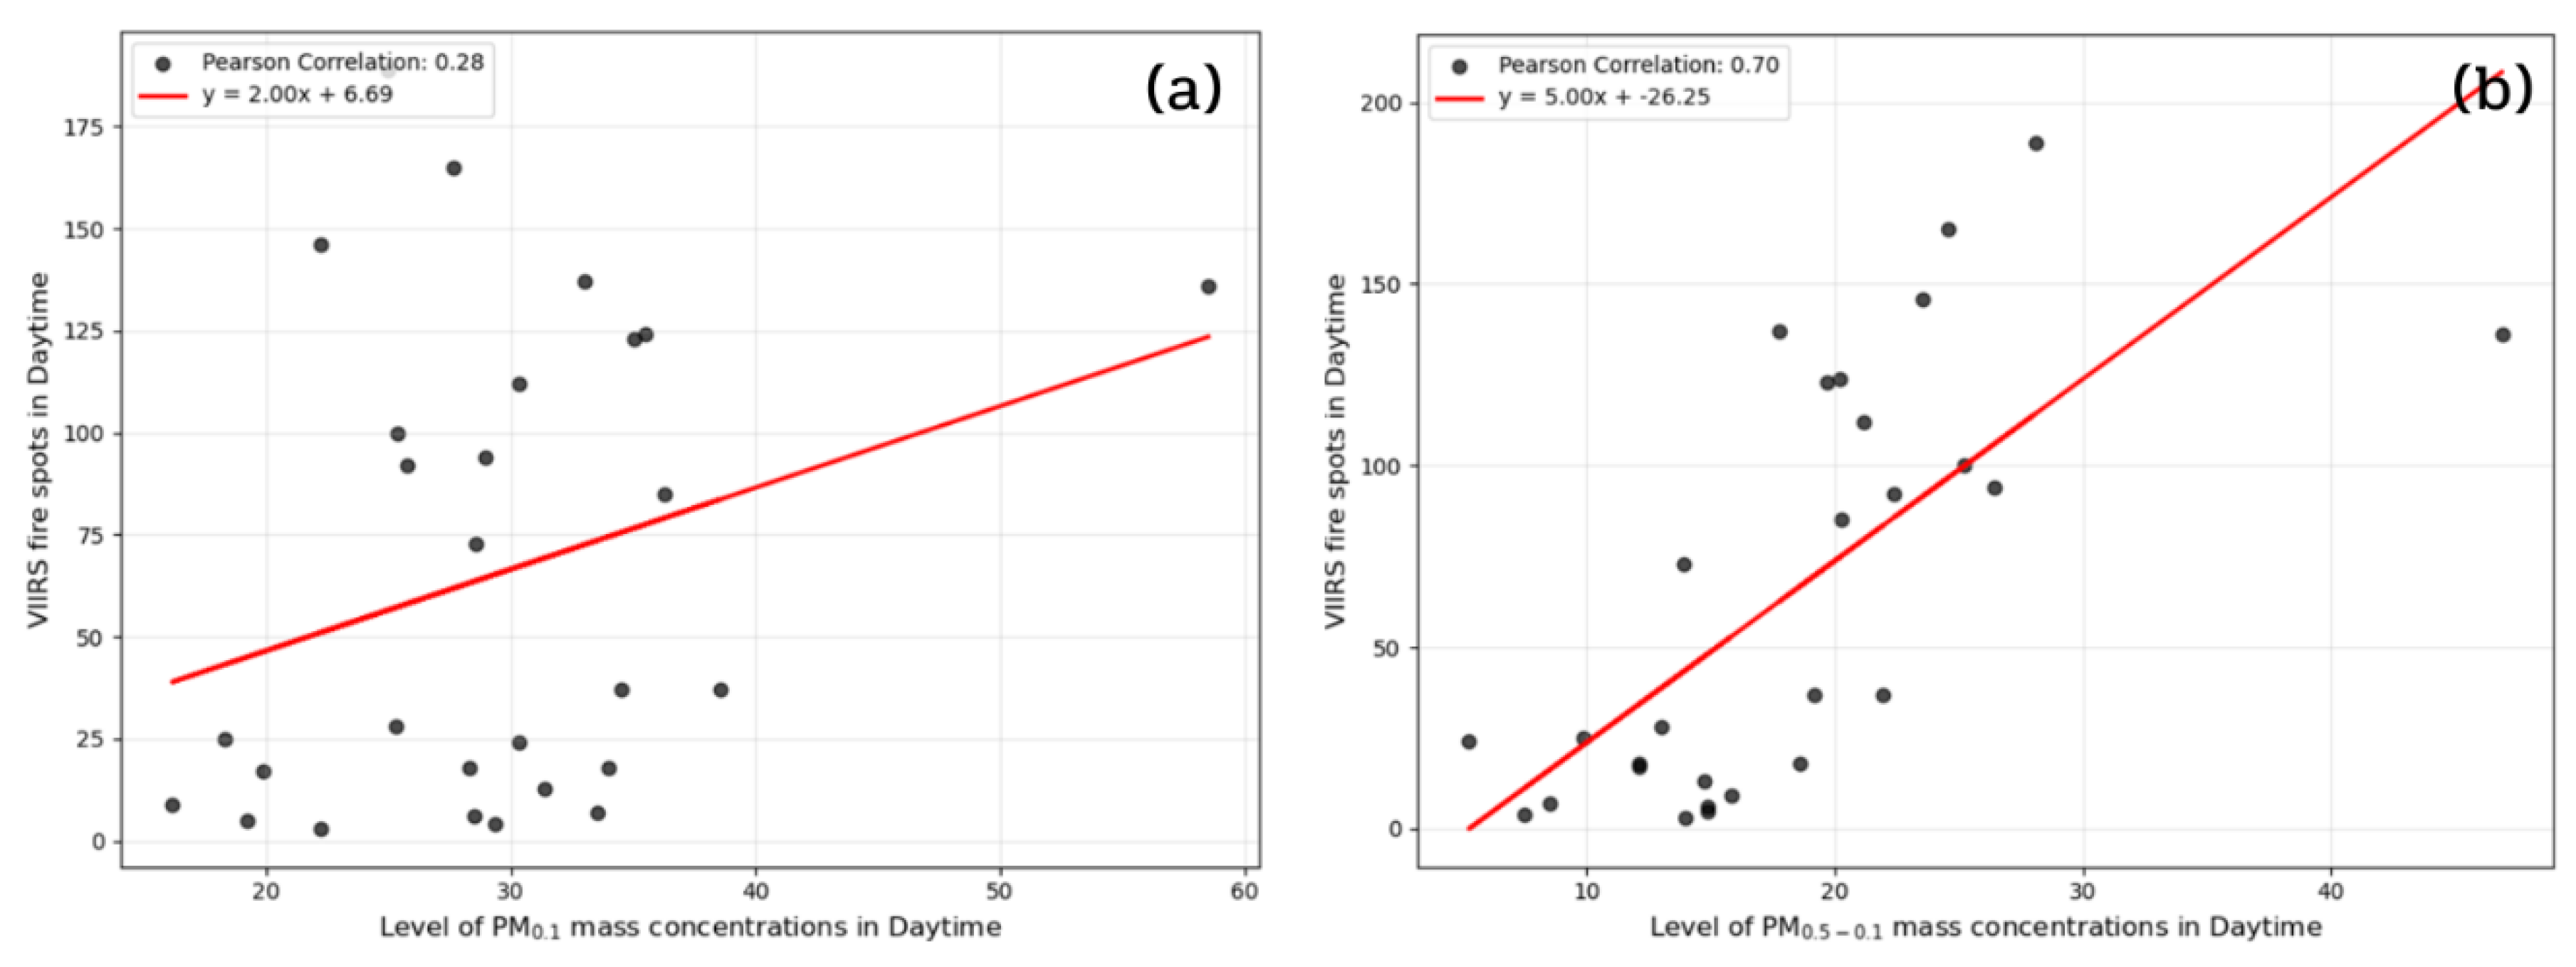
Figure 8(a-f) shows the correlations between VIIRS hotspots and PM mass concentrations in the size-specific PM over Chiang Mai, northern Thailand, plotted during the daytime. The highest correlation is found in particle size 0.5-0.1 microns, followed by 1.0-0.5, < 0.1, 2.5-1.0, 10-2.5, and > 10 microns, respectively. These results implied that OBB, especially wildfires in the Chiang Mai area, releases significant amounts of particles into the atmosphere. Small particles dominate the dry season, notably fine particles in the 1.0-0.5 and 0.5-1.0 µm size ranges.
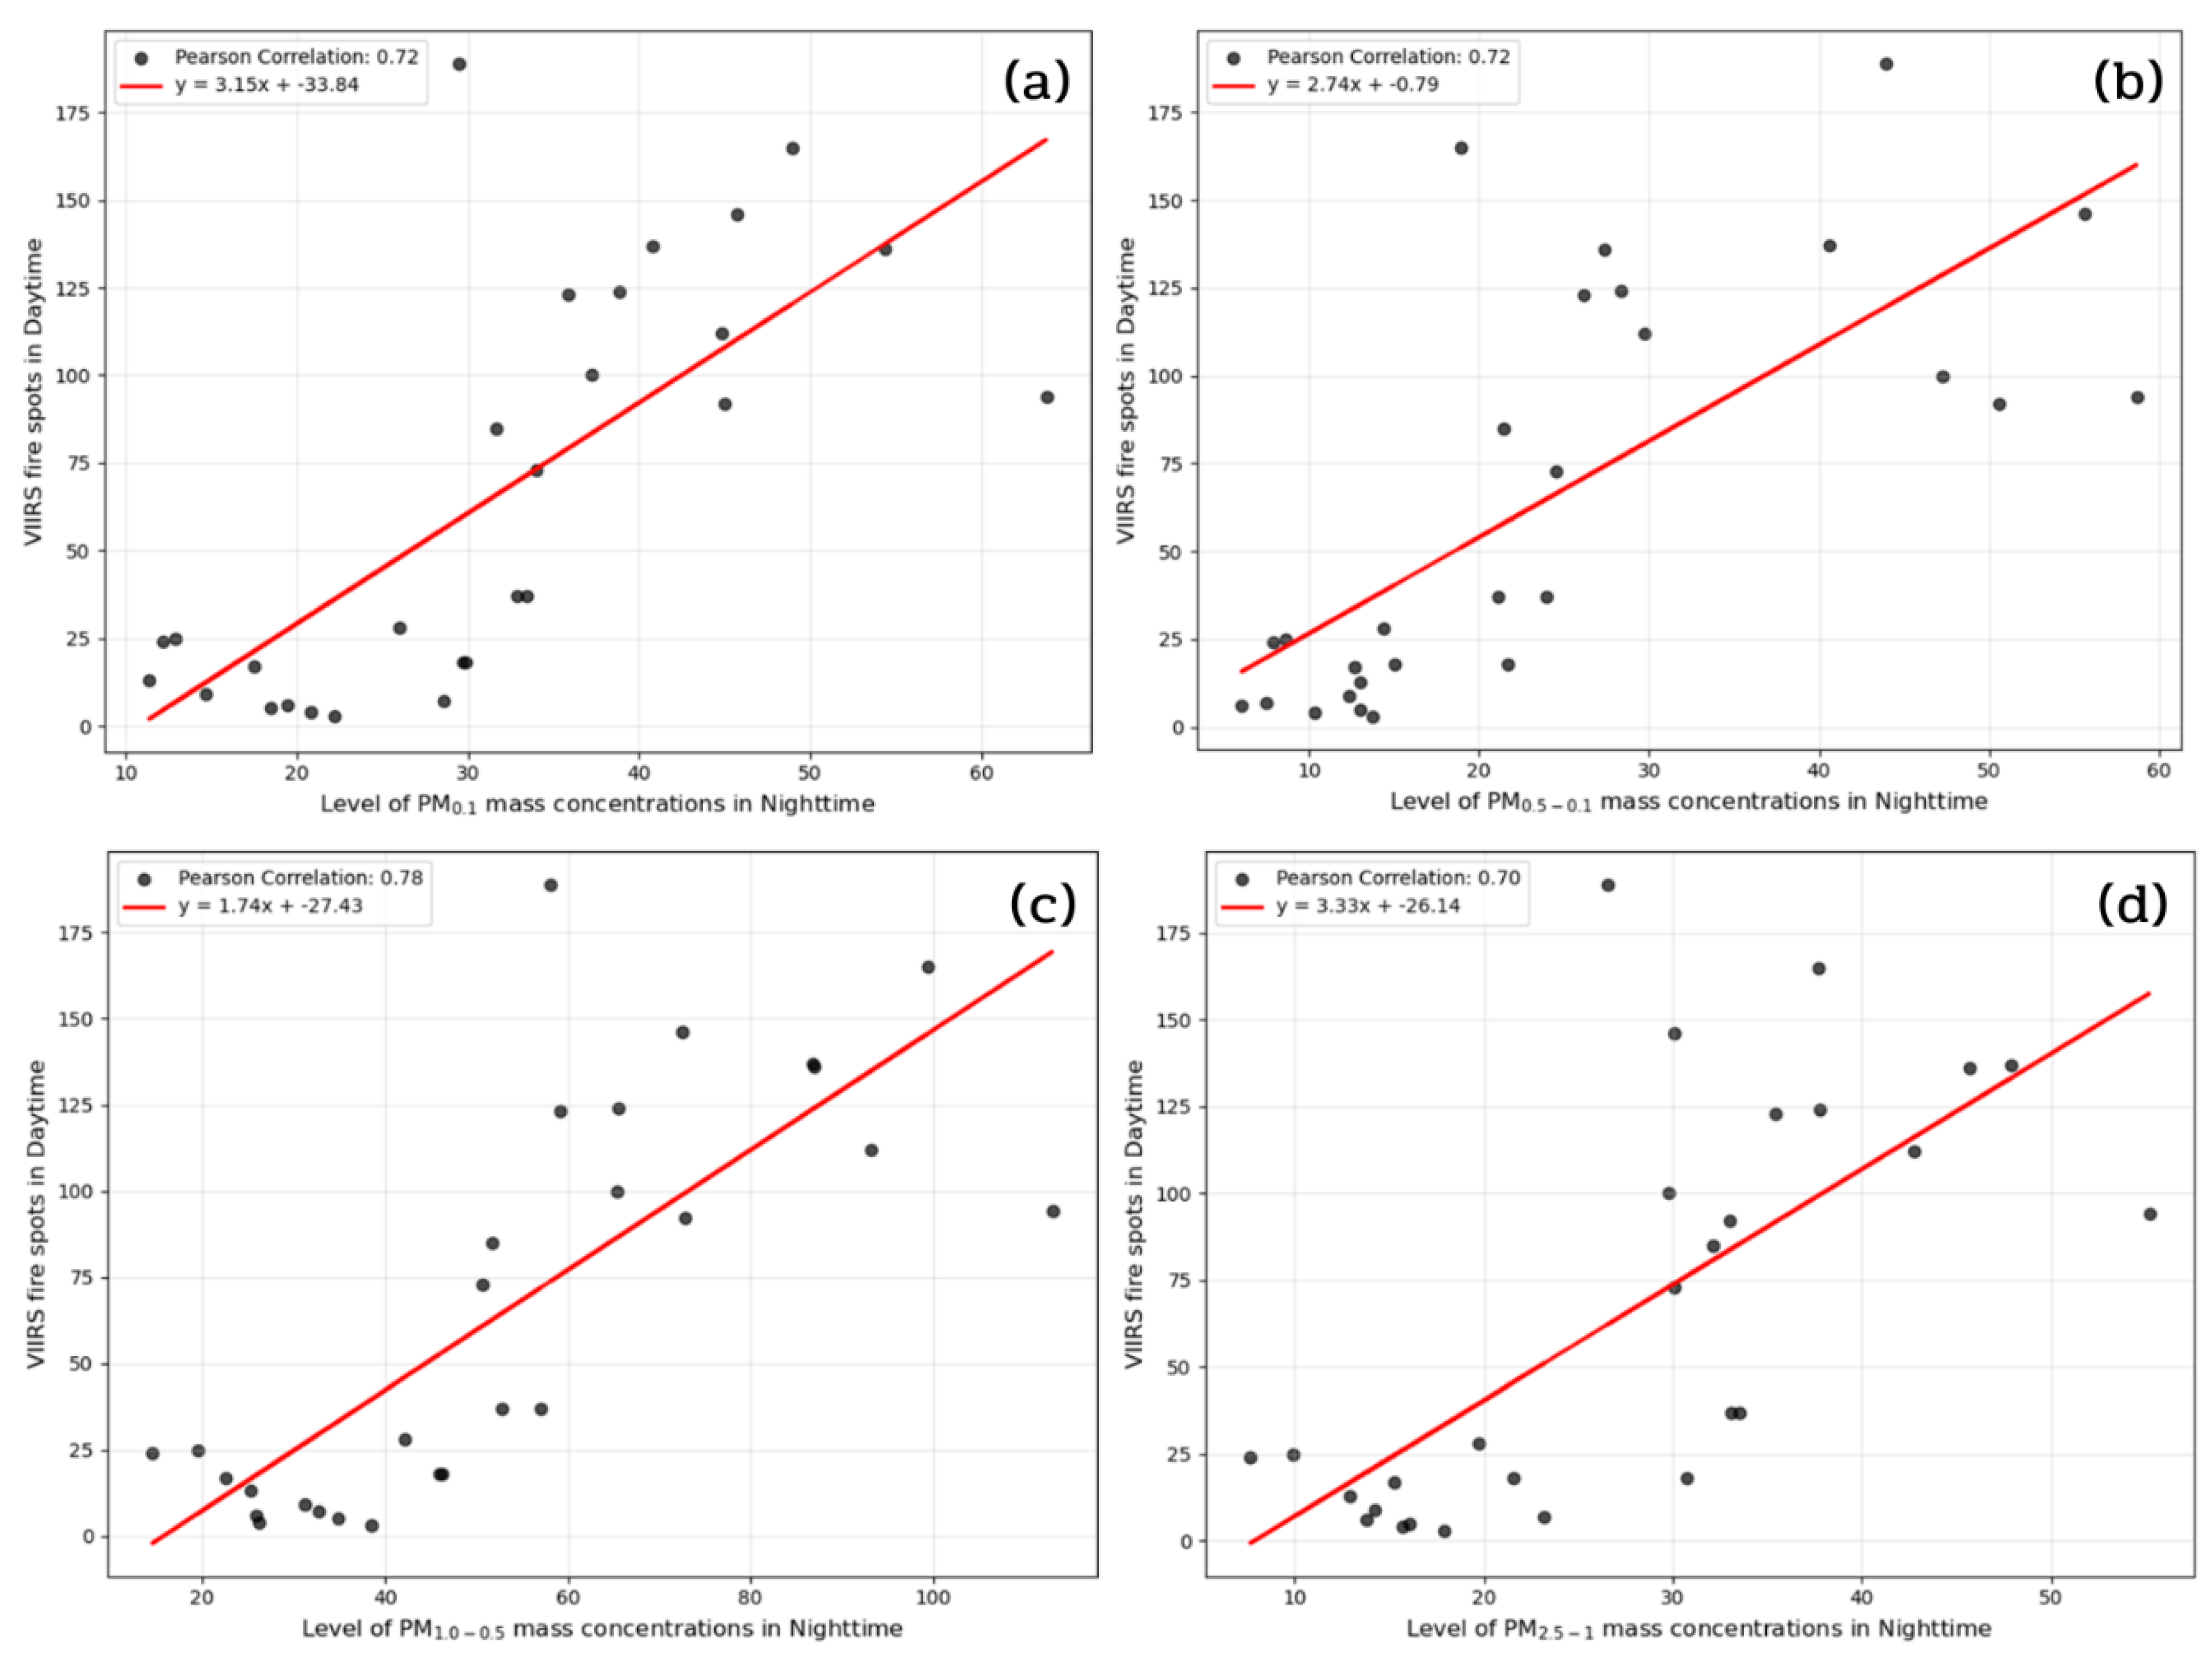
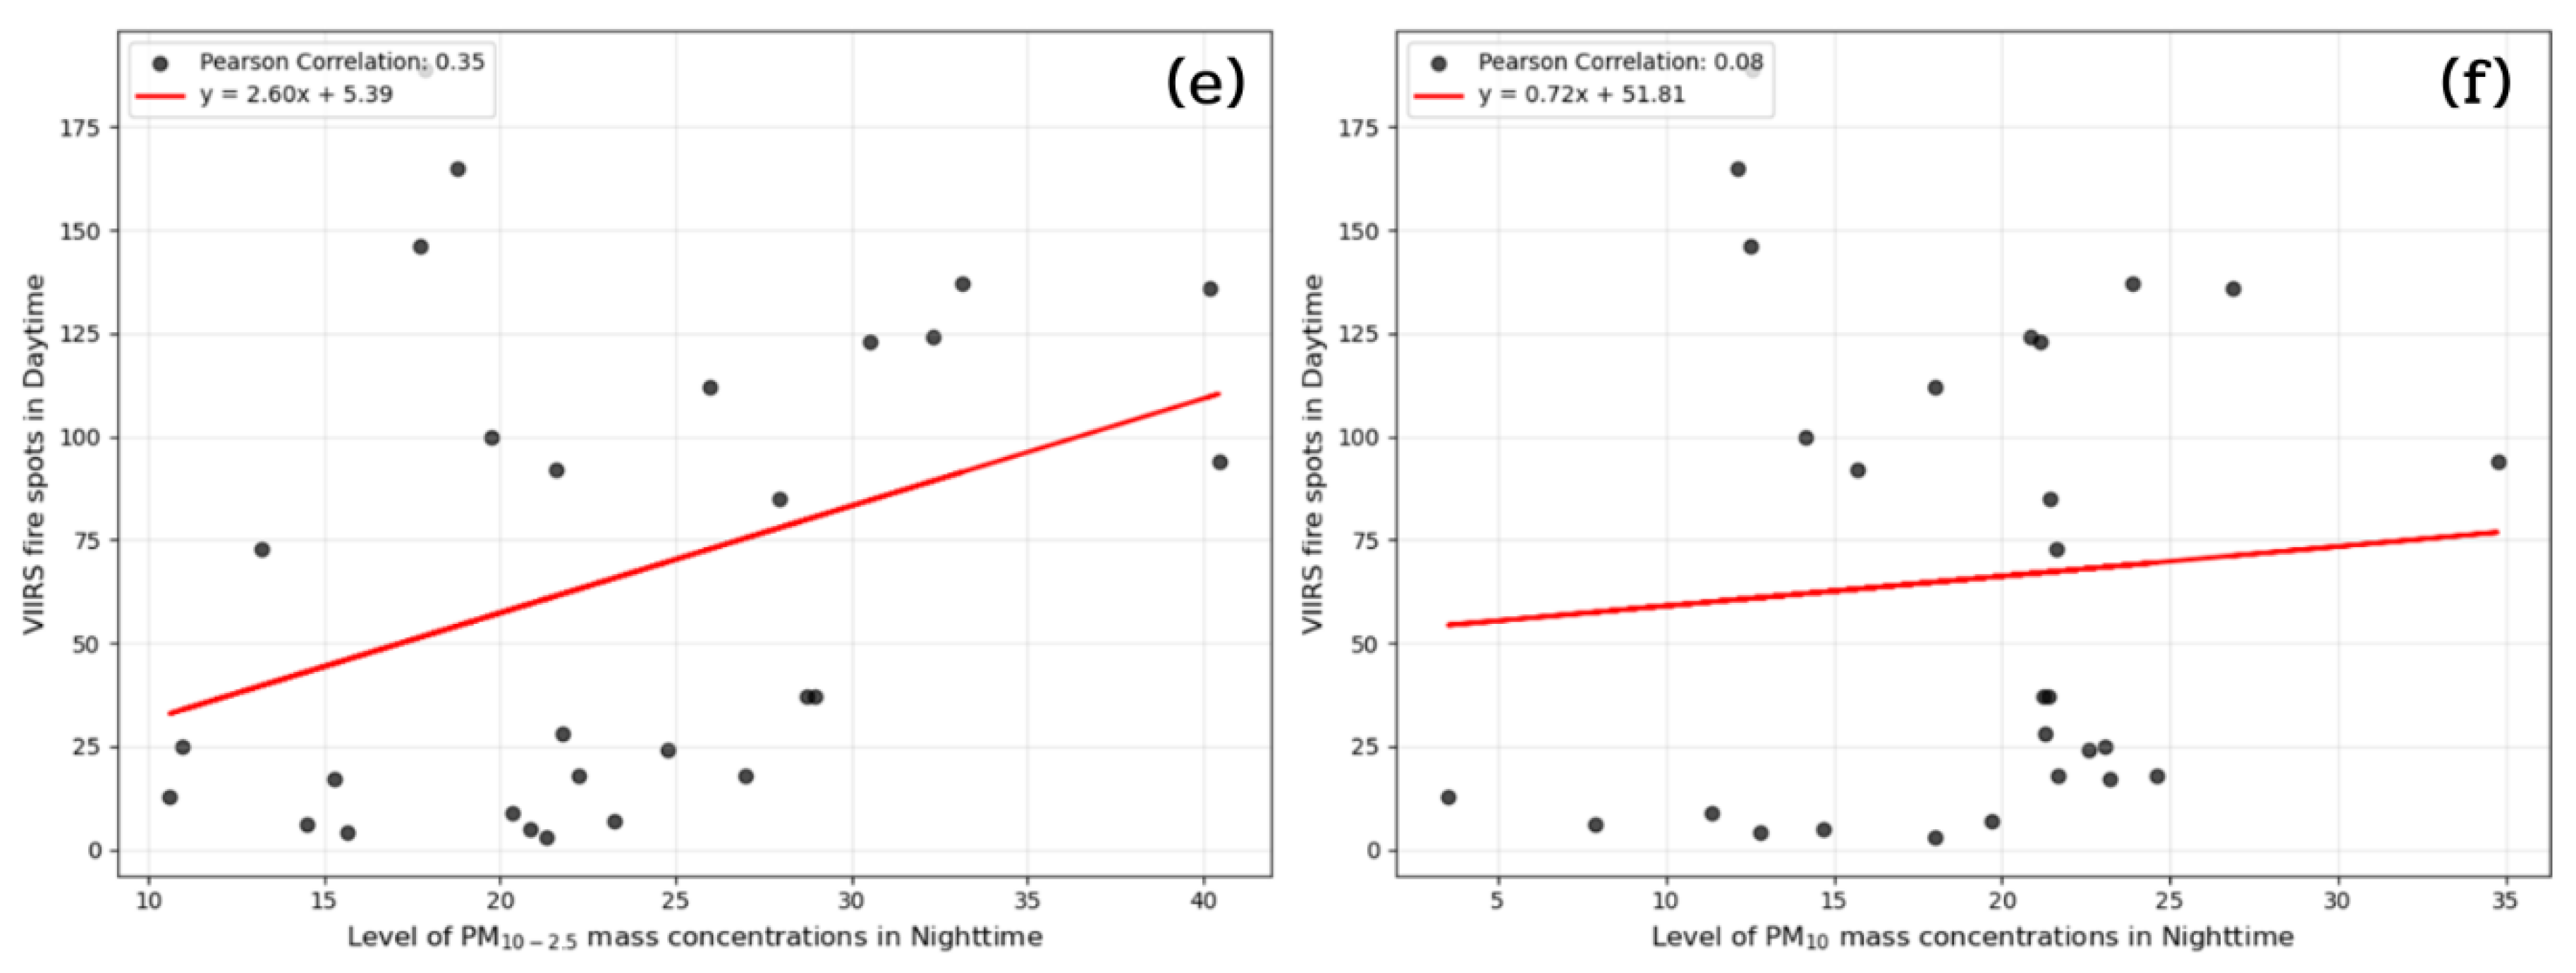
Figure 9(a-f) also shows the correlations between VIIRS hotspots and PM mass concentrations in the size-specific PM during nighttime. The plots show that the highest correlation is found in the particle size range 1.0-0.5 microns, followed by 0.5-0.1, < 0.1, 2.5-1.0, 10-2.5, and > 10 microns, respectively. Interestingly, nighttime is better correlated than daytime for the same PM size. The findings of this study indicate that local emissions play a vital role and may have an impact equivalent to that of transporting air masses from regions with high pollution levels. However, it is worth noting that ambient particle mass concentrations in upper Southeast Asia (Thailand, Myanmar, Laos, Vietnam, and Cambodia) are higher than in continental Southeast Asia (Malaysia, Singapore, Brunei, and Indonesia), except in specific areas, such as industrial areas. The mass of PM concentrations in this study was higher than normal ambient conditions by around 2-10 times [
1,
8].
3.3. Influence of Wind and Air Mass Movement
3.3.1. Influence of Wind
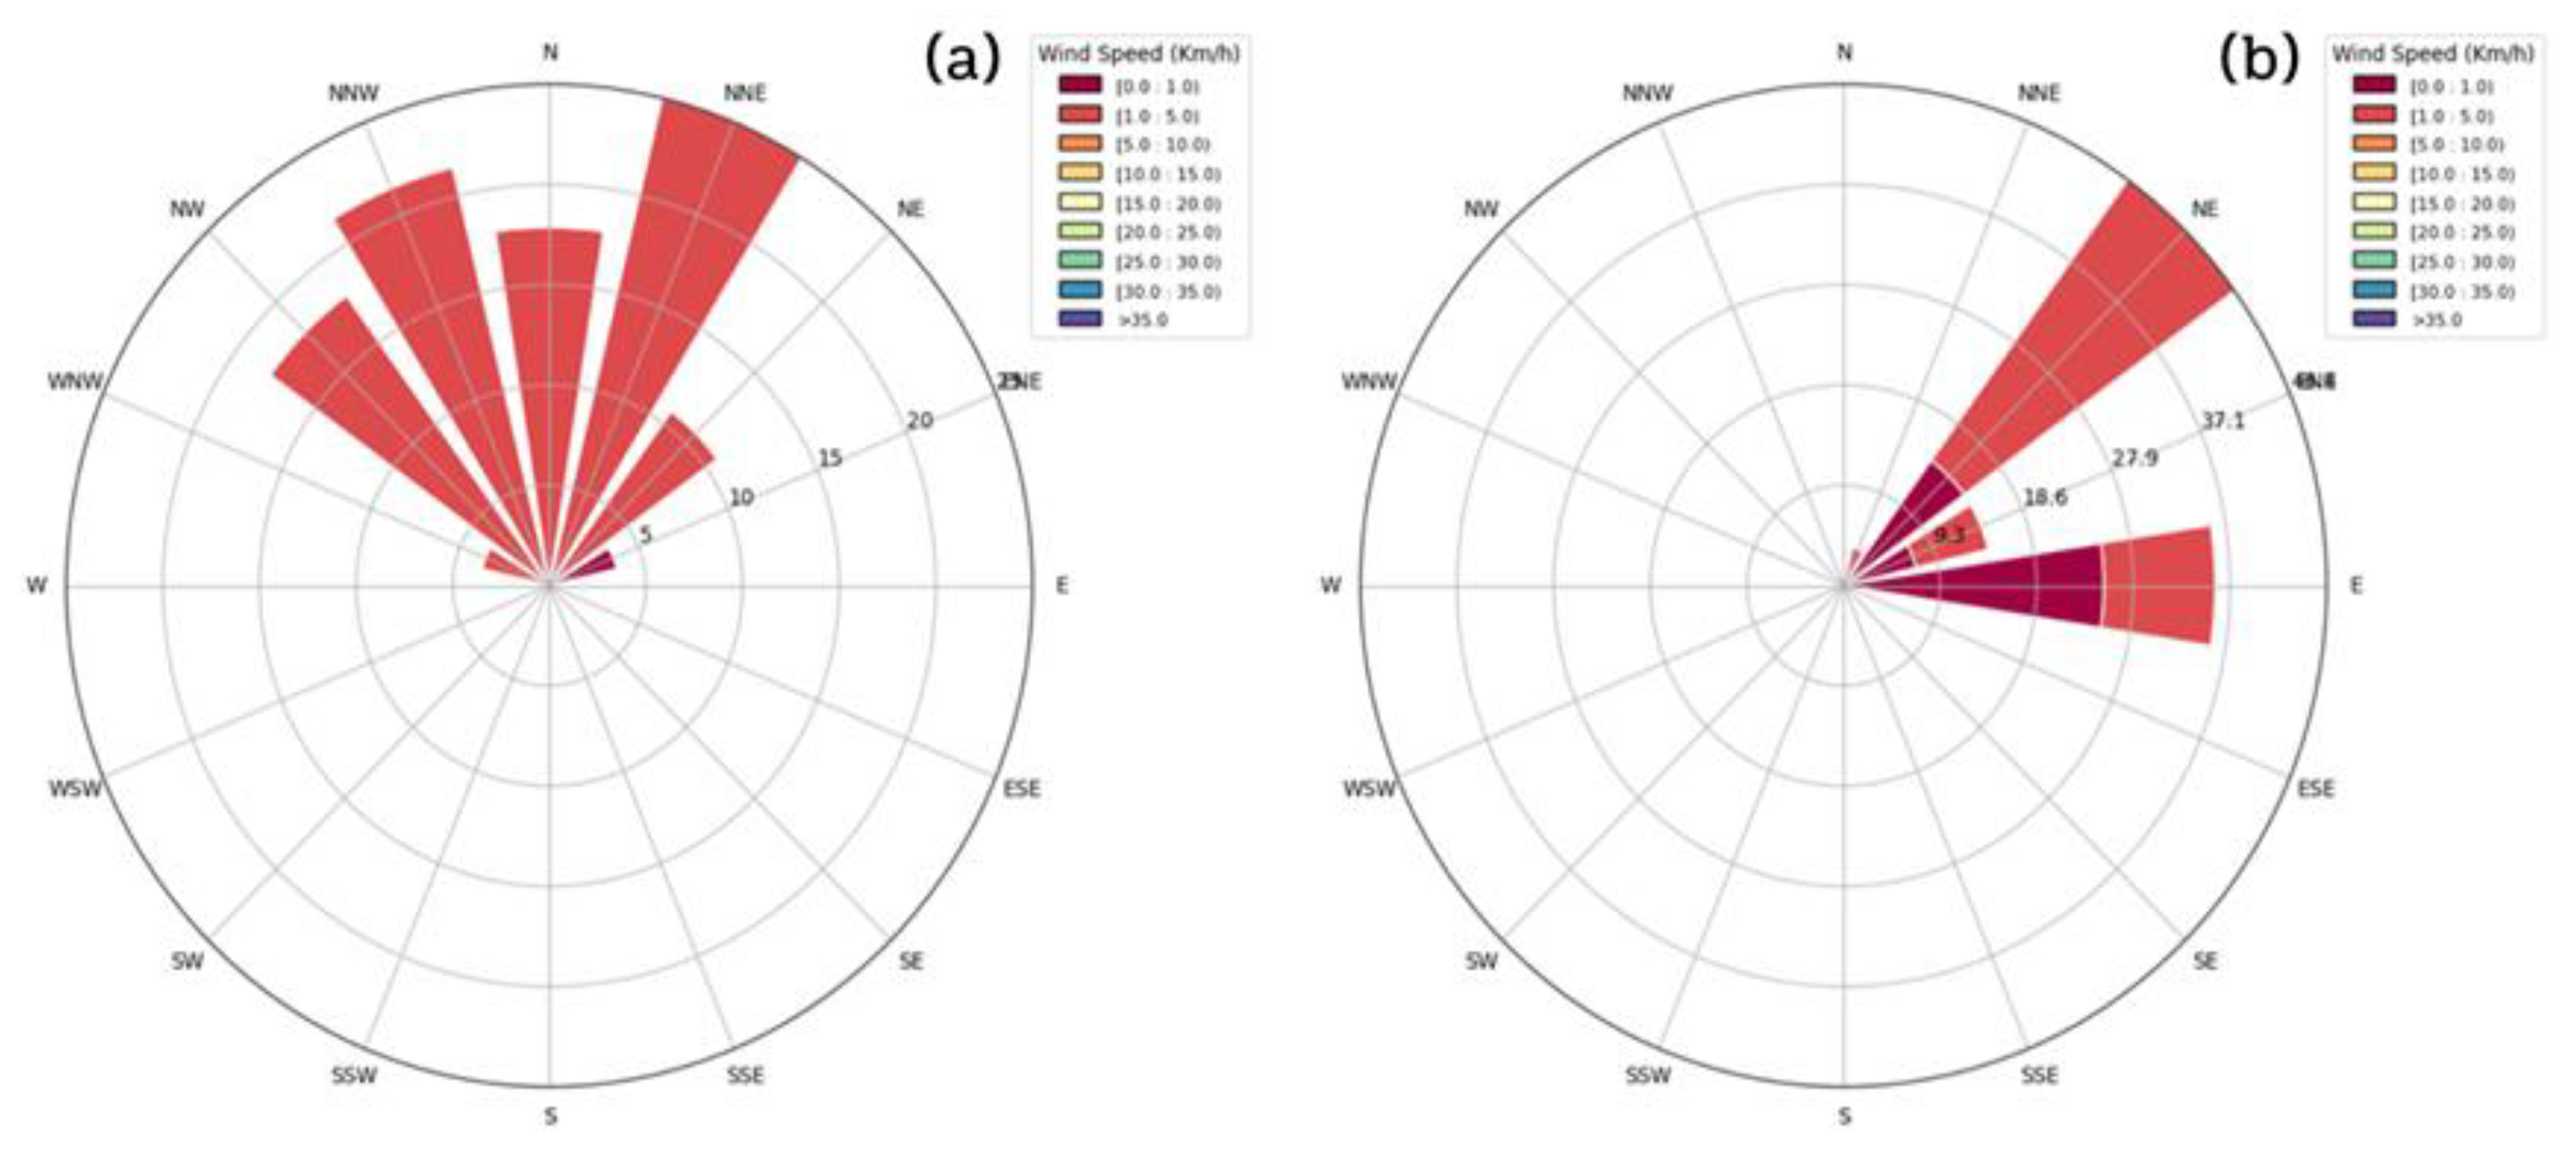
Temperature, relative humidity (RH), wind direction (WD), wind speed (WS), rainfall, and other meteorological data were collected at the Thailand Air Quality and Noise Management Bureau’s PCD monitoring station in Chiang Mai. The rainfall during the haze season is zero millimeters (no rain in Chiang Mai from March 28 to April 24, 2020). Daytime temperatures were 34.4 ± 2.9 °C and nighttime temperatures were 23.9 ± 1.8 °C, while relative humidity was 35.5 ± 7.3% and 64.1 ± 7.5%.
The study revealed that the average wind speed during the observation period was 20.96 km/h, which is classified as moderate. The highest wind speed was recorded on April 19, 2020, at 29.63 km/h, which falls under the strong wind category. This coincided with the onset of summer storms’ annual influence. The lowest wind speed, 16.67 km/h, was observed as a light breeze on March 28-29, 2020. This condition contributed to increased retention of air pollutants and particulate matter near the ground level, aligning with the period of the highest air pollution, which occurred between March 28 and April 10, 2020. During this period, the average wind speed was 20.76 km/h, also in the moderate wind speed category. Throughout the study, wind speed fluctuations were inconsistent, as shown in
Figure 10. Moreover, wind analysis indicated that most winds originated in the northern parts of Chiang Mai province and moved southward. These wind directions represent surface winds measured 10 meters above ground level.
Analysis of wind direction in conjunction with hotspot density maps for the same timeframe revealed that the dominant wind direction originated from the north and northwest, moving toward the south and southeast. These winds consistently traversed areas with high hotspot density. They played a critical role in transporting smoke and fine PM from source regions to downwind areas, particularly the southern parts of Chiang Mai Province. Near-surface winds were the dominant mechanism governing pollutant dispersion. Beyond meteorological influences, the topography of Chiang Mai—characterized by steep, mountainous terrain enclosing the basin—substantially enhances the trapping of pollutants near the surface [
41,
51]. This geographic setting further intensifies the accumulation of air pollution at ground level.
3.3.2. Influence of Air Mass Movement
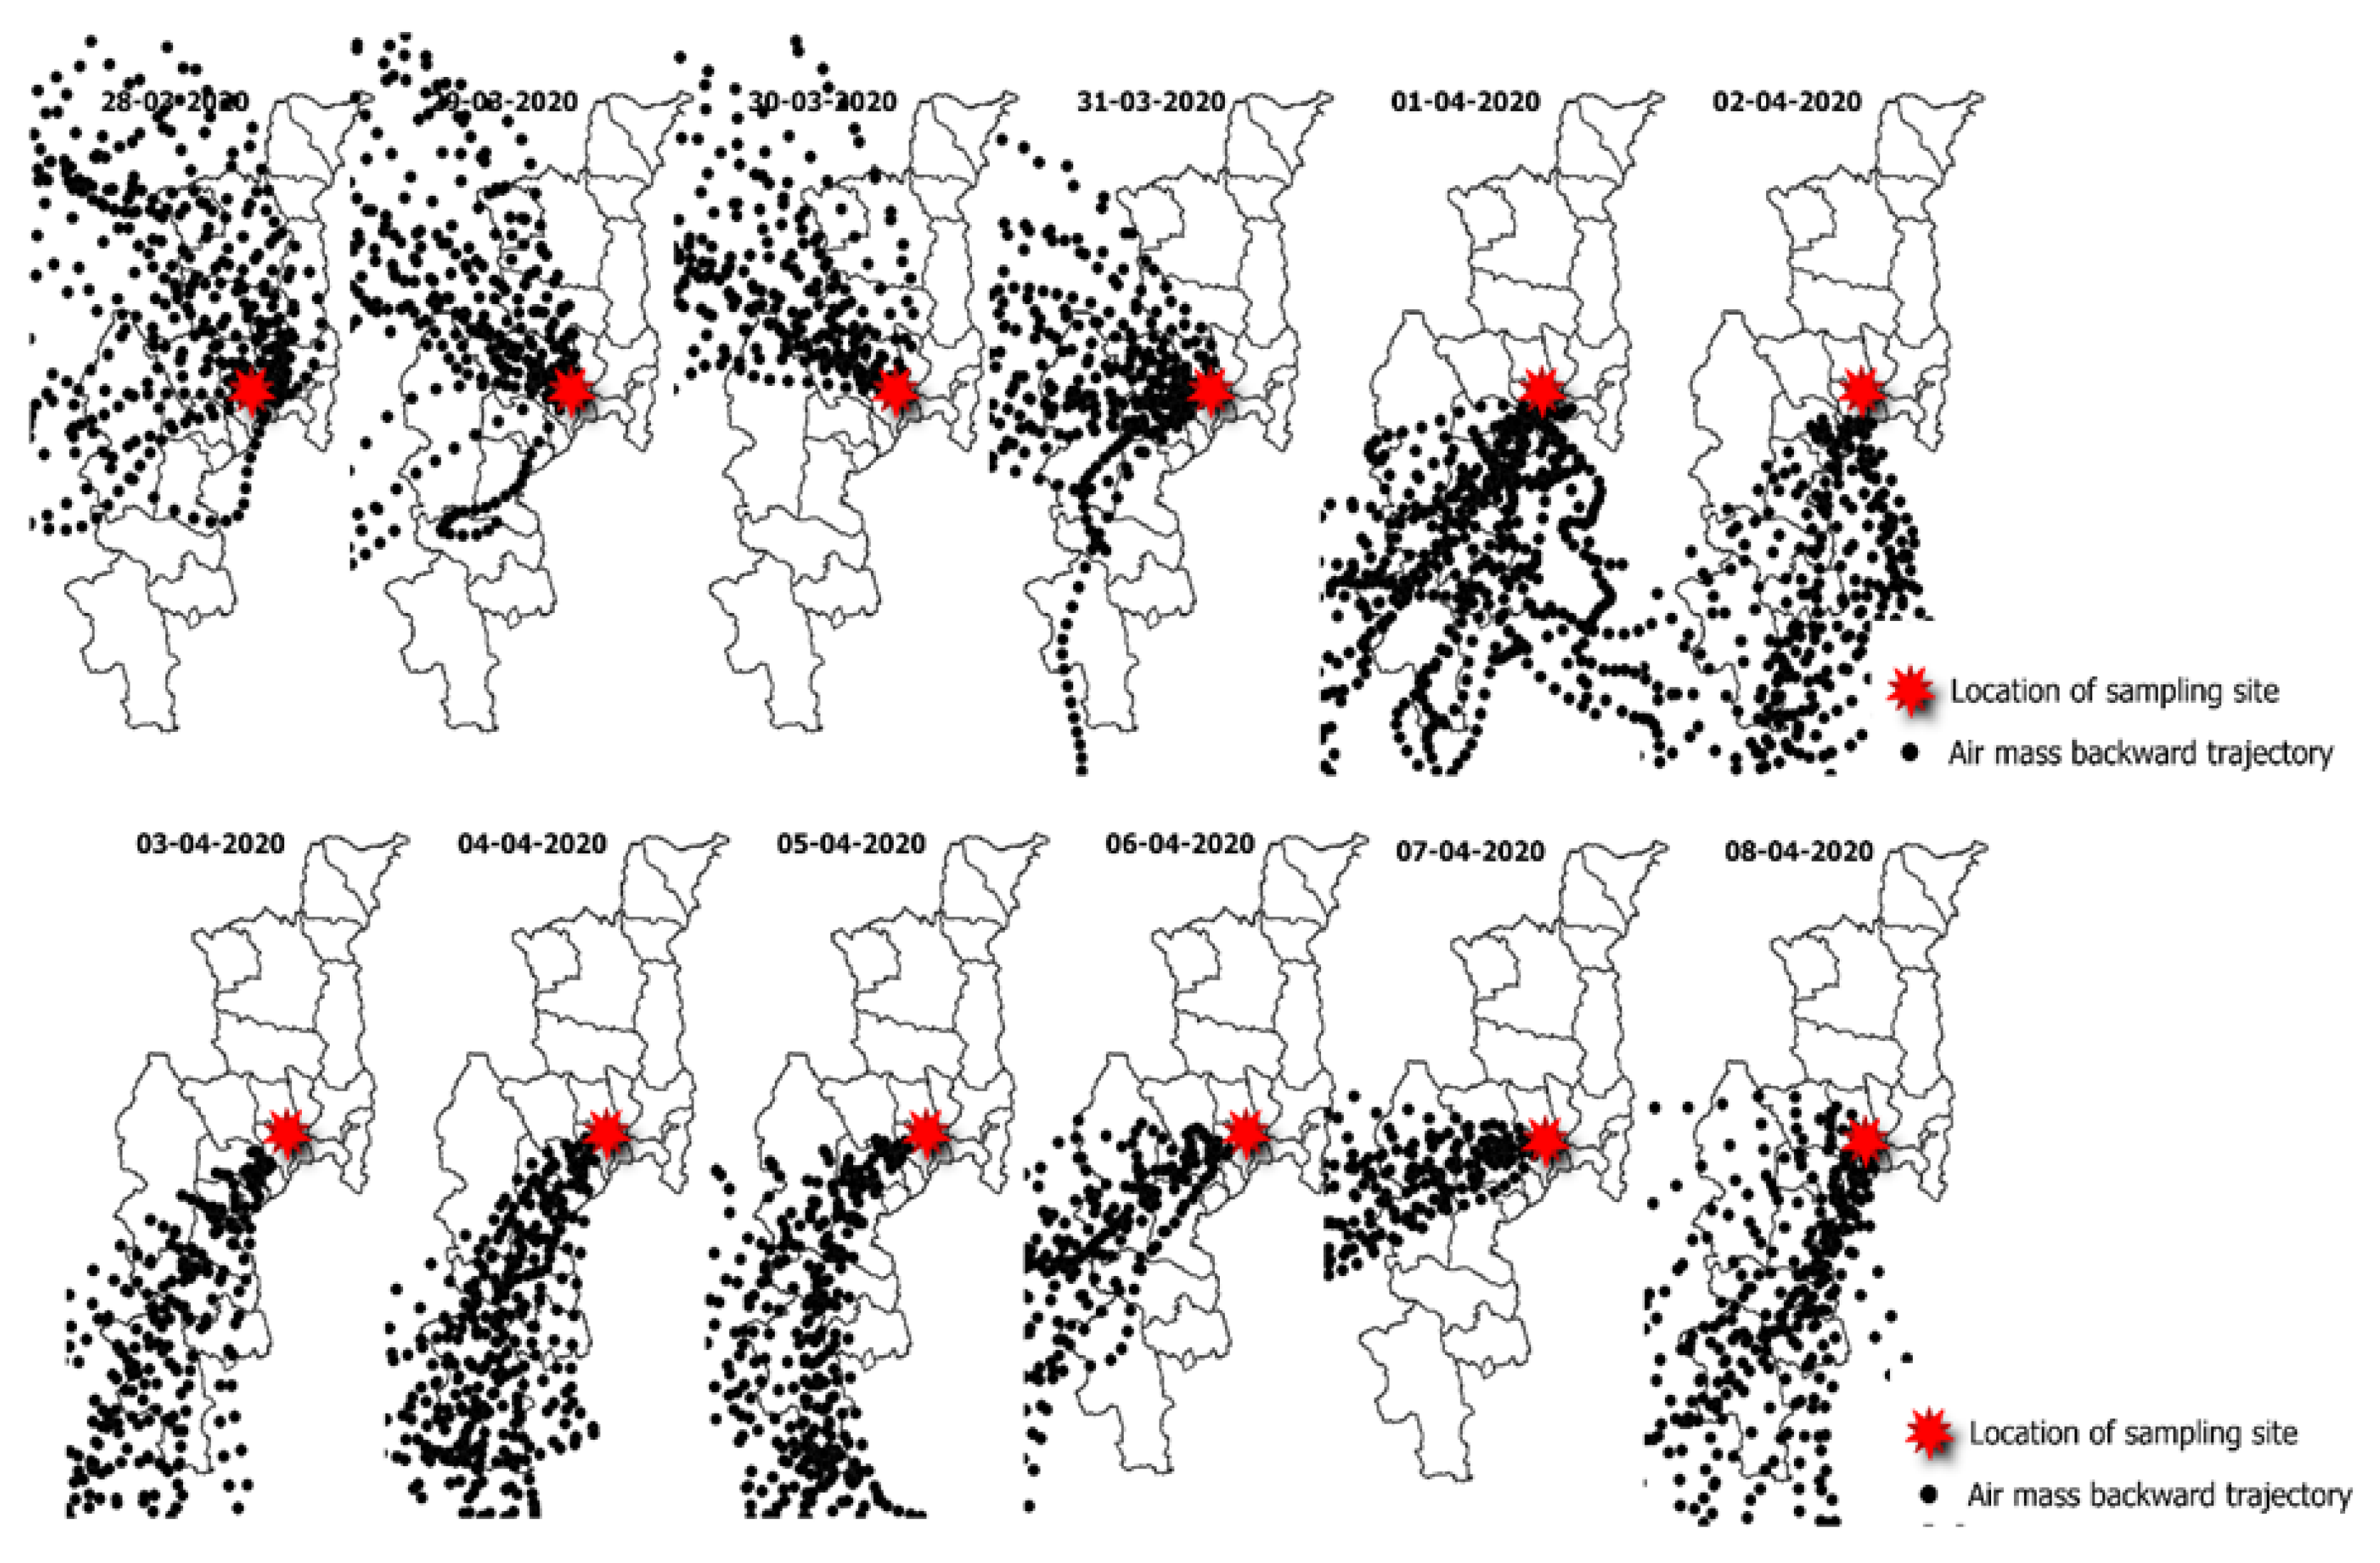
The results of the air-mass backward trajectory analysis showed that high-altitude winds influenced particulate matter levels. The results found that air masses reaching the PM monitoring sites originated from the south and southwest of Chiang Mai province. These air masses predominantly originated from the Thailand-Myanmar border. The backward trajectory of the air mass is shown in
Figure 11.
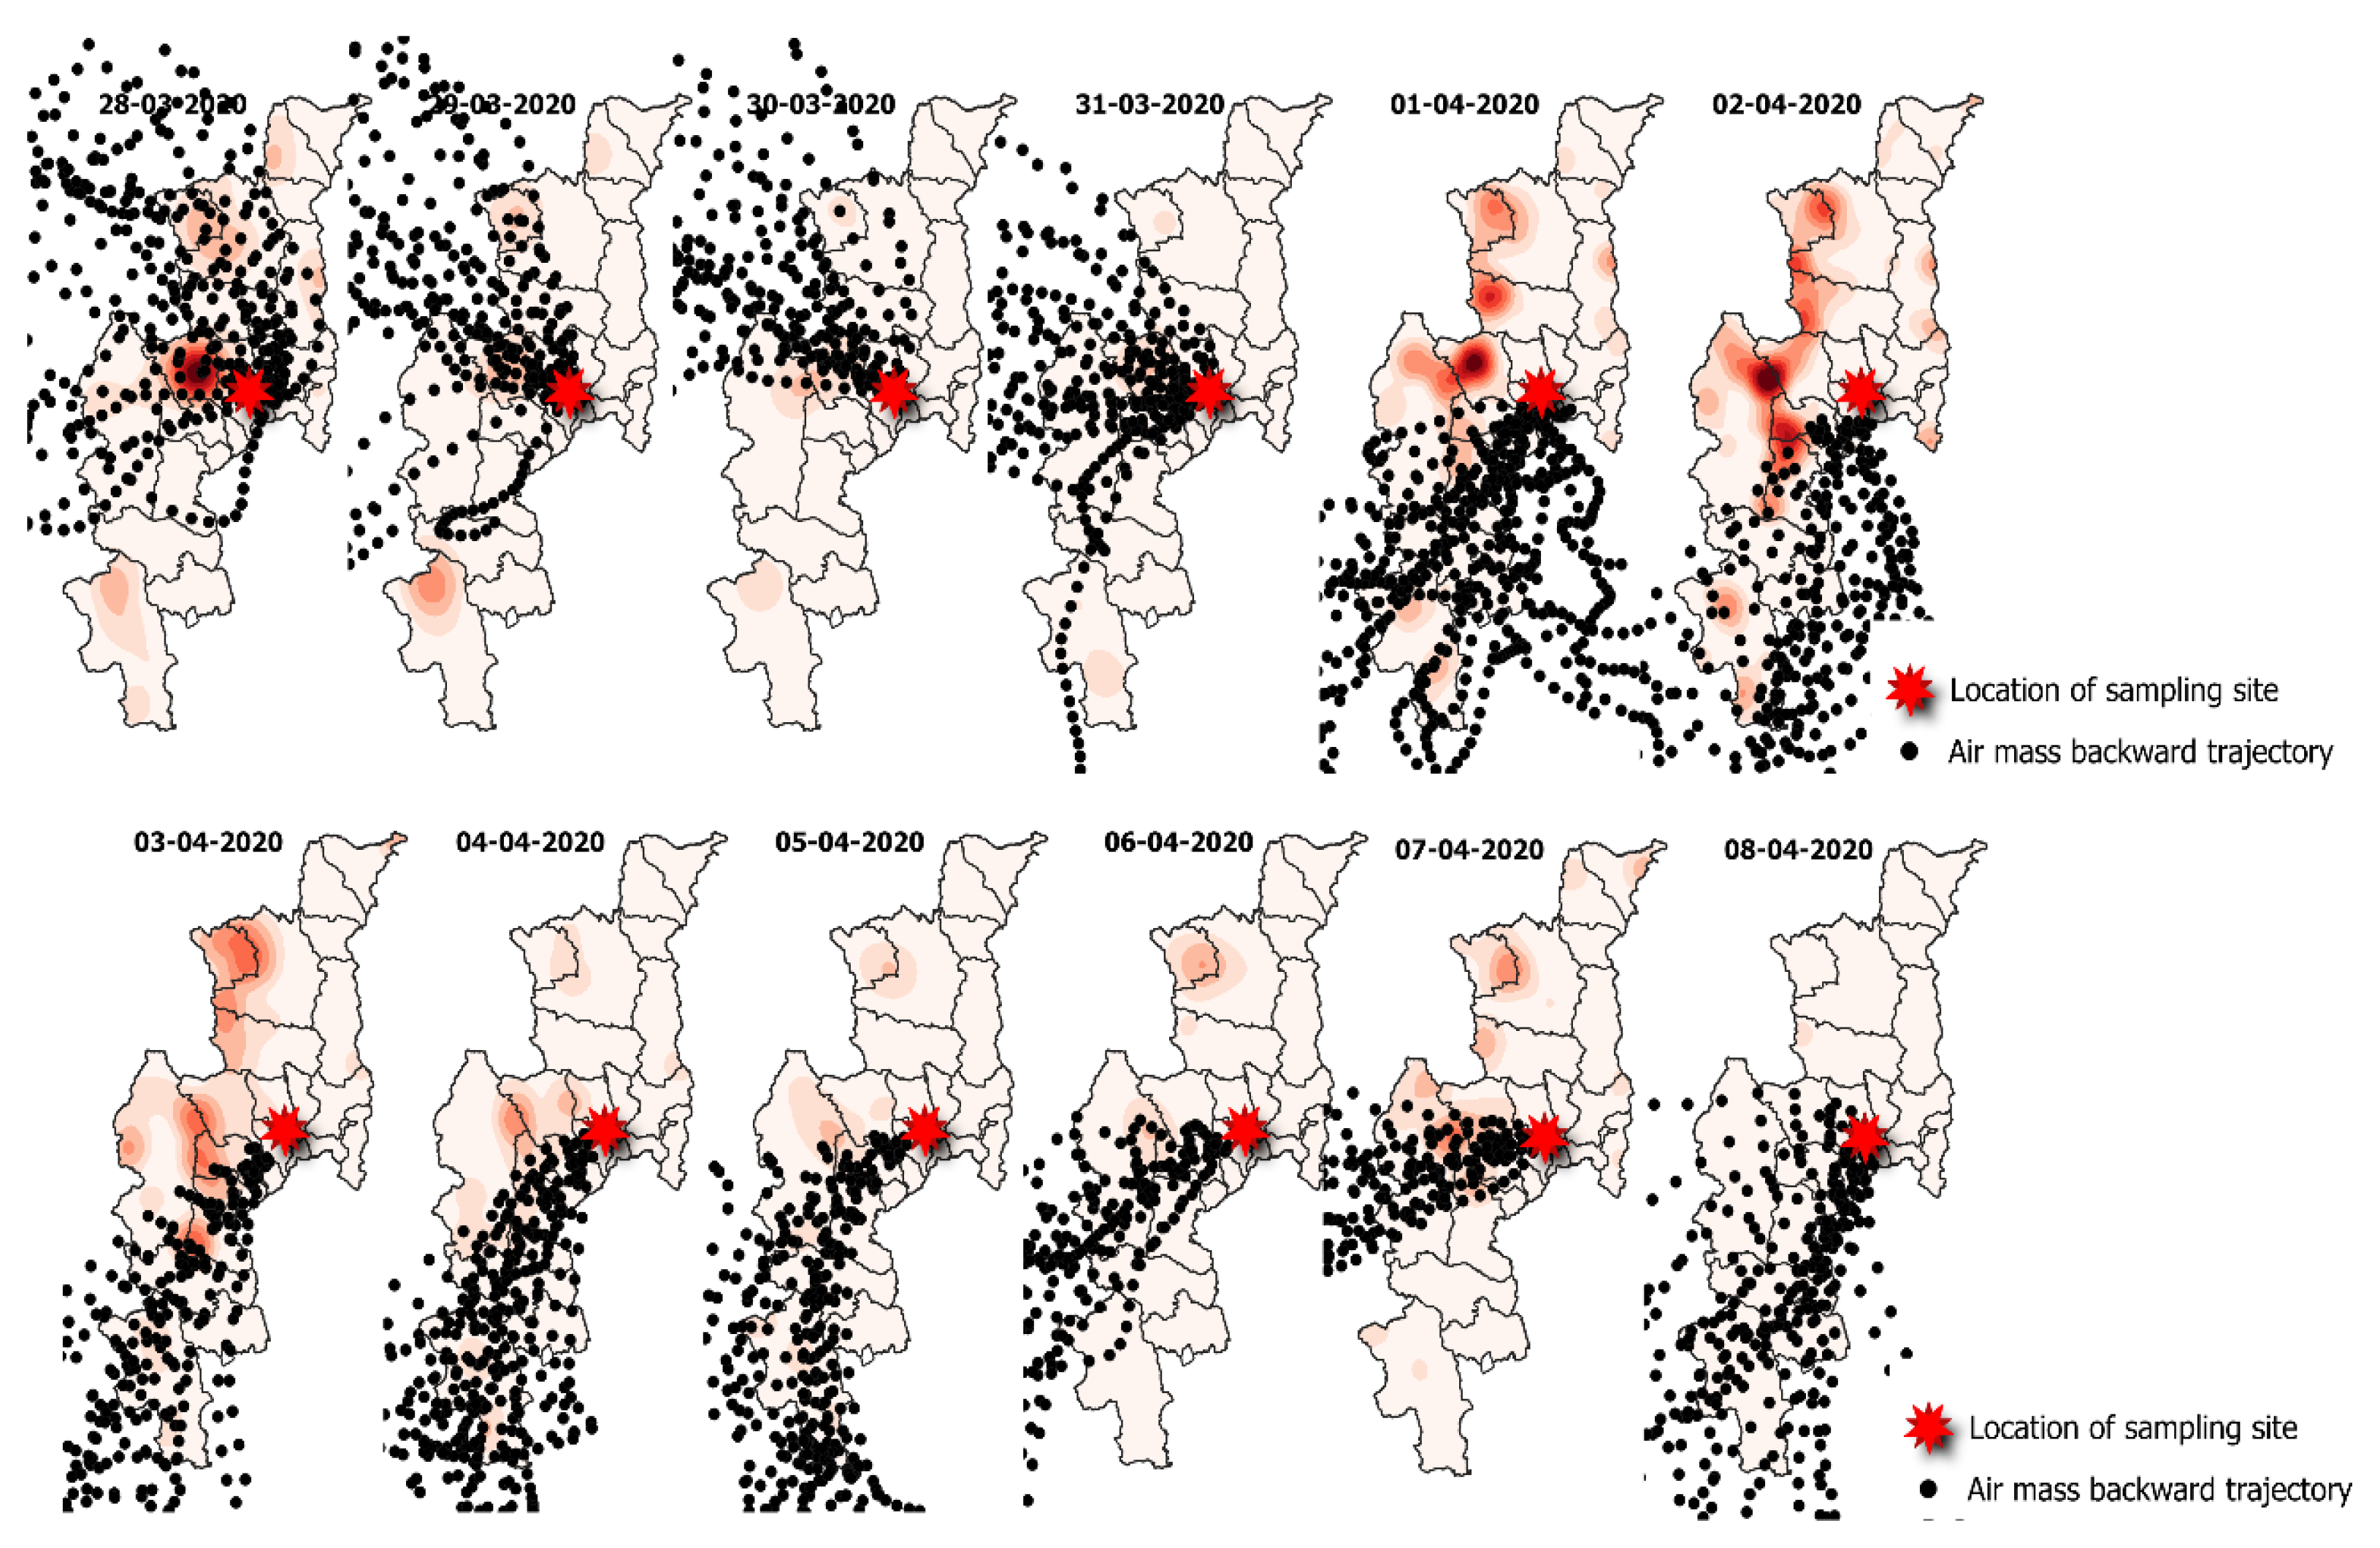
Additionally, when overlaying trajectories with fire-spot density, it was found that air masses reached regions with high hotspot density before arriving at the monitoring sites (
Figure 12). This situation highlights the influence of cross-core pollution sources on air quality in the study area and other areas of Thailand [
21]. This is particularly significant during periods when southwesterly winds are strong, which enhances the efficiency of transboundary pollution transport, enabling pollutants to spread across borders more effectively.
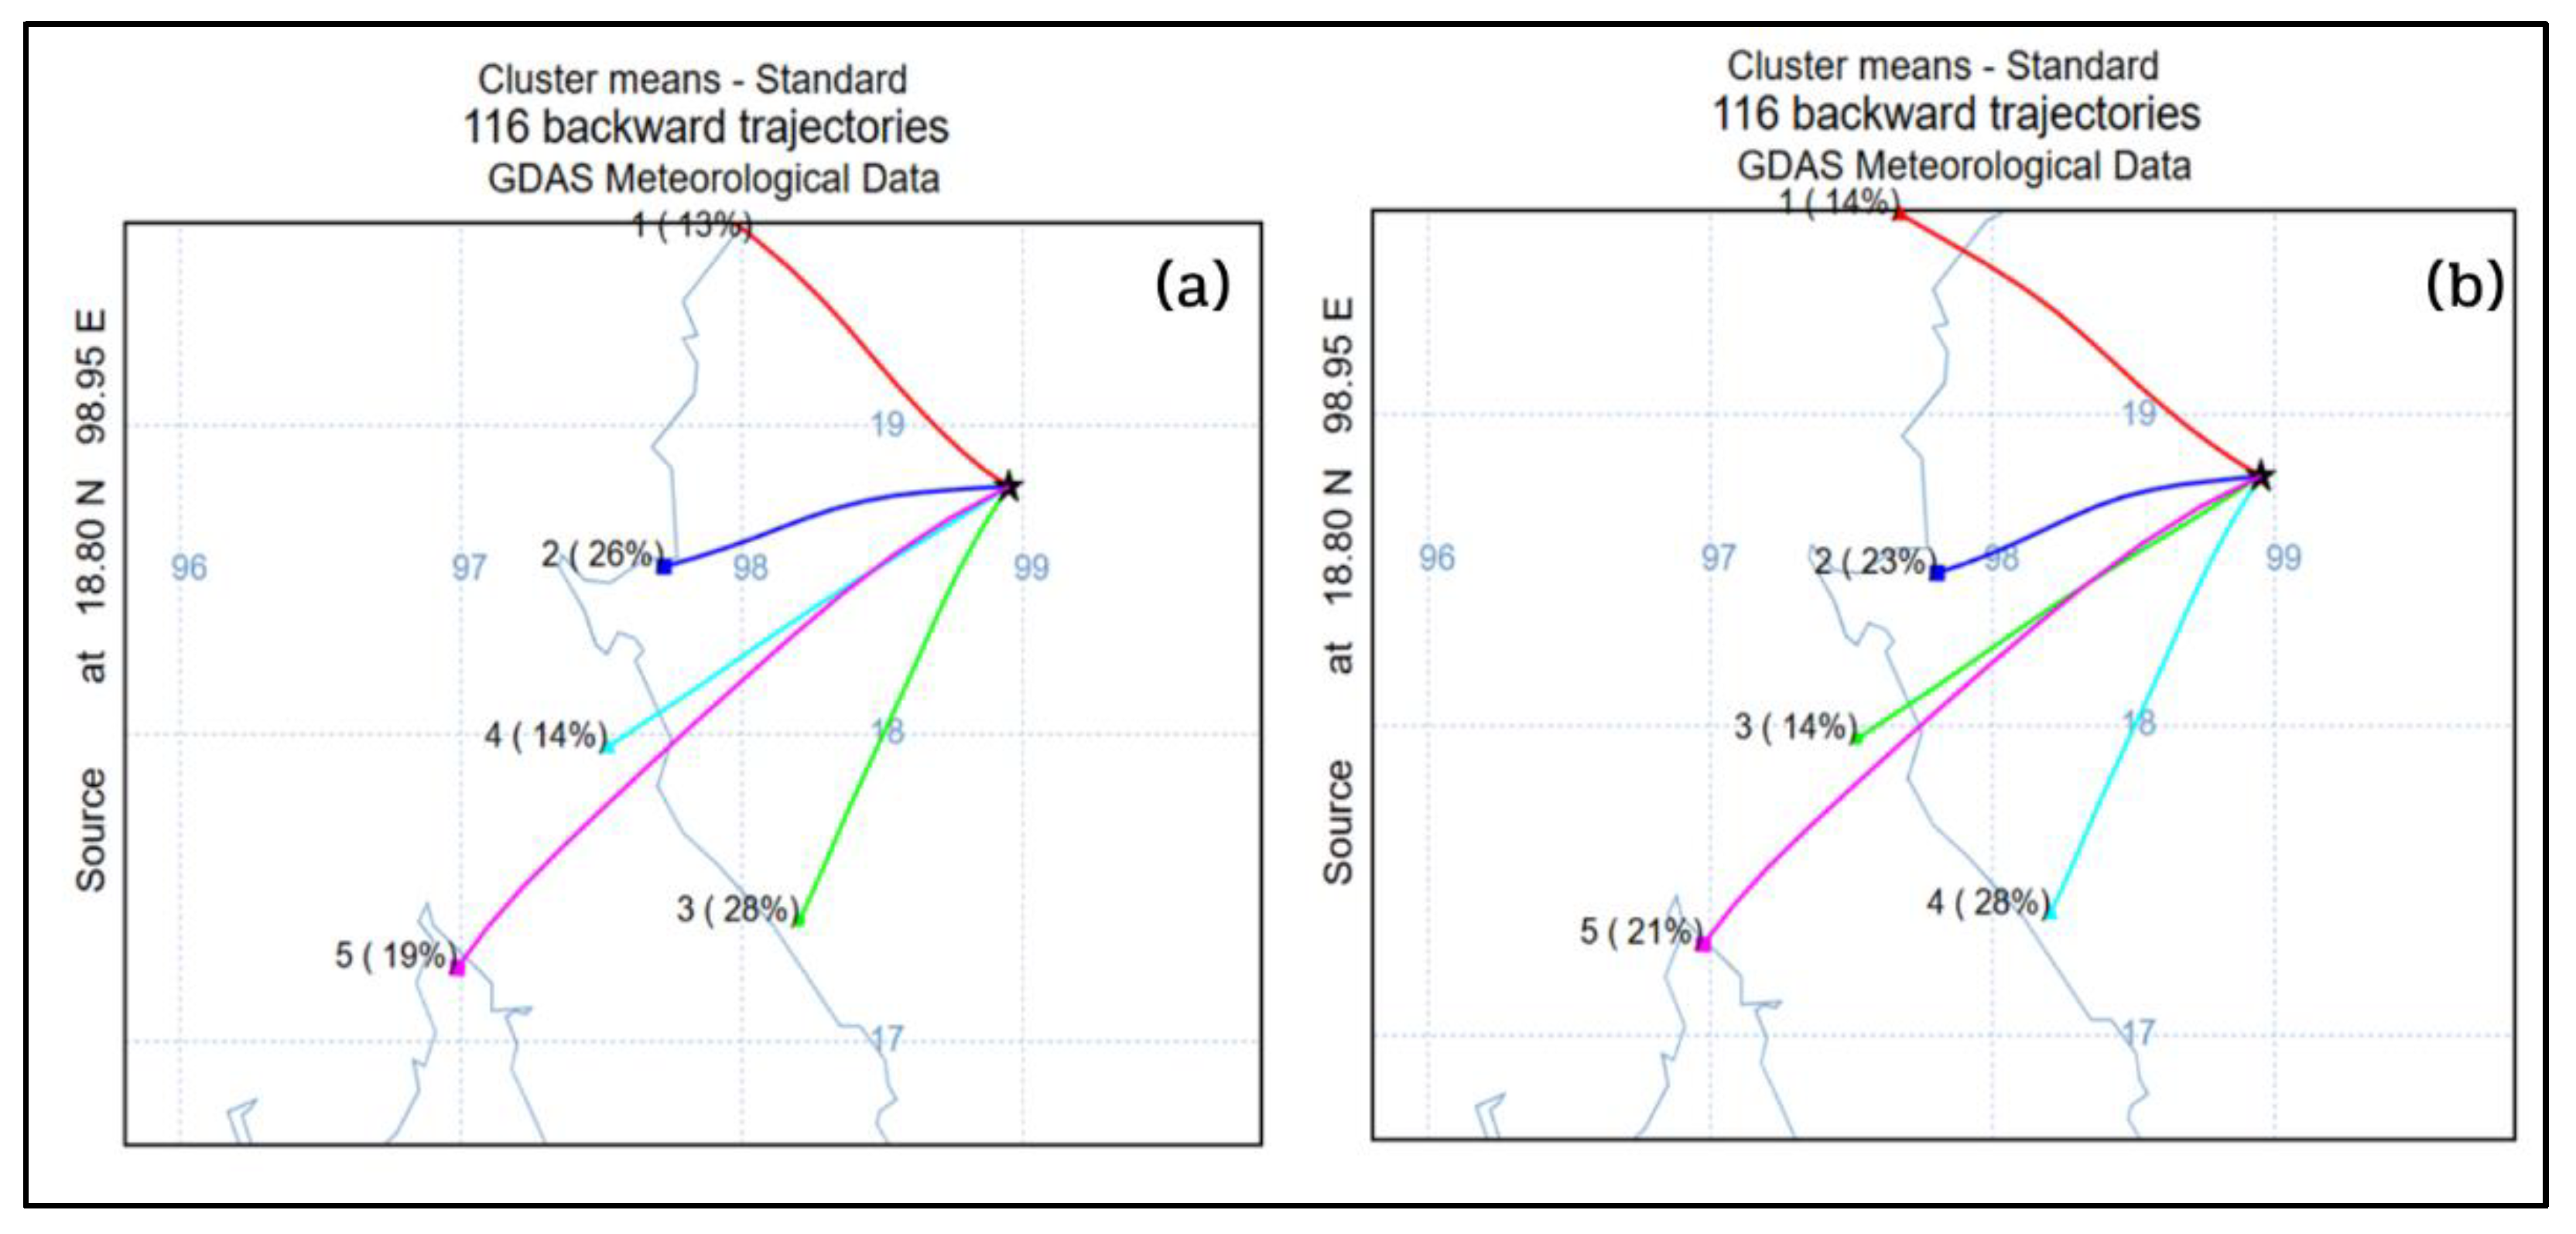
The 12-hr backward trajectories (daytime and nighttime) can be clustered into five groups, each with distinct directions and movement frequencies, as illustrated in
Figure 13 (a-b). The analysis revealed that most air mass movement is from the southwest of Chiang Mai city. It is essential on a multi-provincial scale, approximately 100-200 km [
21]. When considering the overall direction of air mass movement, 47% of the air masses originated from the south of Chiang Mai, primarily from the Thailand-Myanmar border, before reaching the target area. This was followed by 40% from the southwest and 13% from the northwest. However, the trajectories of their sources’ air masses may not directly influence the target area. Factors such as topography-e.g., the height of mountain ranges acting as natural barriers lead to the accumulation or deflection of air flows in certain regions. Additionally, chemical and physical processes occurring during transit, such as reactions involving atmospheric pollutants or the formation of secondary pollutants, are significant contributors [
13,
21,
22]. These processes can alter the properties of air masses by the time they reach the target area, making them inherently different from their initial state at the source, which is mainly beyond direct control.
4. Conclusions
In this study, size-fractionated PM down to PM0.1 was collected in 2020 during periods of intense hazy biomass fires in Chiang Mai, northern Thailand. During the day and at night, VIIRS fire hotspots were examined. Since most biomass fires near the sample location occurred at night, more particles could have been released, increasing size-fractionated PM concentrations, especially PM0.5-1.0 and PM1.0-0.5. In Chiang Mai, northern Thailand, local emission sources appear to be the primary producers of smaller particles (< 1 micron). These findings highlight the importance of focusing on emission control methods for submicron particle sizes in Chiang Mai, Thailand. However, cross-border PMs between the countries in this region may potentially be an essential source; as such, this should be the subject of a subsequent study that uses satellite remote sensing to perform a more thorough assessment.
Author Contributions
P.P., conceptualization, data collection, investigation, methodology, formal analysis, visualization, writing-original draft; T.C., methodology, visualization; writing-review and editing; P.S., investigation, visualization, writing-review and editing; M.F., supervision; funding acquisition; writing—review and editing; W.P., data curation, formal analysis, writing-review and editing; All authors have read and agreed to the published version of the manuscript.
Funding
This research was financially supported by JICA-JST SATREPS (grant no. JPMJSA2102). Moreover, this work was financially supported by the Office of the Permanent Secretary, Ministry of Higher Education, Science, Research and Innovation in Thailand (Grant No. RGNS 63-253).
Institutional Review Board Statement
Not applicable.
Informed Consent Statement
Not applicable.
Data Availability Statement
The original contributions presented in this study are included in the article. Further inquiries can be directed to the corresponding authors.
Acknowledgments
The authors are grateful to East-Asia Nanoparticle Monitoring Network (EA-NanoNet) members for their generous support in particle sampling. During the preparation of this work, the authors used ChatGPT 4.0 to check grammar errors. After using this tool, the authors reviewed and edited the content as needed and took full responsibility for the content of the publication.
Conflicts of Interest
The authors declare no conflicts of interest.
References
- Adam, M. G.; Tran, P. T.; Bolan, N.; Balasubramanian, R. Biomass burning-derived airborne particulate matter in Southeast Asia: A critical review. Journal of Hazardous Materials 2021, 407, 124760. [Google Scholar] [CrossRef] [PubMed]
- Song, W.; Hong, Y.; Zhang, Y.; Cao, F.; Rauber, M.; Santijitpakdee, T.; Kawichai, S.; Prapamontol, T.; Szidat, S.; Zhang, L. Biomass Burning Greatly Enhances the Concentration of Fine Carbonaceous Aerosols at an Urban Area in Upper Northern Thailand: Evidence From the Radiocarbon-Based Source Apportionment on Size-Resolved Aerosols. Journal of Geophysical Research: Atmospheres 2024, 129(10), e2023JD040692. [Google Scholar] [CrossRef]
- Punsompong, P.; Pani, S.K.; Wang, S.; Bich Pham, T.T. Assessment of biomass-burning types and transport over Thailand and the associated health risks. Atmospheric Environment 2021, 247, 118176. [Google Scholar] [CrossRef]
- Othman, M.; Latif, M. T.; Hamid, H. H.; Uning, R.; Khumsaeng, T.; Phairuang, W.; Daud, Z.; Idris, J.; Sofwan, N. M.; Lung, S. Spatial–temporal variability and health impact of particulate matter during a 2019–2020 biomass burning event in Southeast Asia. Scientific Reports 2022, 12(1), 1–11. [Google Scholar] [CrossRef]
- Thao, N.N.L.; Pimonsree, S.; Prueksakorn, K.; Bich Thao, P. T.; Vongruang, P. Public health and economic impact assessment of PM2.5 from open biomass burning over countries in mainland Southeast Asia during the smog episode. Atmospheric Pollution Research 2022, 13(6), 101418. [Google Scholar] [CrossRef]
- Stavi, I. Wildfires in grasslands and shrublands: A review of impacts on vegetation, soil, hydrology, and geomorphology. Water 2019, 11(5), 1042. [Google Scholar] [CrossRef]
- Jacobson, M. Z. Air pollution and global warming: history, science, and solutions; Cambridge University Press, 2012. [Google Scholar]
- Suriyawong, P.; Chuetor, S.; Samae, H.; Piriyakarnsakul, S.; Amin, M.; Furuuchi, M.; Hata, M.; Inerb, M.; Phairuang, W. Airborne particulate matter from biomass burning in Thailand: Recent issues, challenges, and options. Heliyon 2023, 9(3), e14261. [Google Scholar] [CrossRef]
- Niyommaneerat, W. (2022). Enhancing Local Capability toward Sustainable Municipal Solid Waste Management: Case Study of Nan Municipality, Thailand. Report of Grant-Supported Research The Asahi Glass Foundation, 91.
- Kumar, I.; Bandaru, V.; Yampracha, S.; Sun, L.; Fungtammasan, B. Limiting rice and sugarcane residue burning in Thailand: Current status, challenges and strategies. Journal of Environmental Management 2020, 276, 111228. [Google Scholar] [CrossRef]
- Talukdar, N. R.; Ahmad, F.; Goparaju, L.; Choudhury, P.; Qayum, A.; Rizvi, J. Forest fire in Thailand: Spatio-temporal distribution and future risk assessment. Natural Hazards Research 2024, 4(1), 87–96. [Google Scholar] [CrossRef]
- Janta, R.; Sekiguchi, K.; Yamaguchi, R.; Sopajaree, K.; Plubin, B.; Chetiyanukornkul, T. Spatial and temporal variations of atmospheric PM10 and air pollutants concentration in upper Northern Thailand during 2006–2016. Applied Science and Engineering Progress 2020, 13(3), 256–267. [Google Scholar] [CrossRef]
- Paluang, P.; Thavorntam, W.; Phairuang, W. The Spatial–Temporal Emission of Air Pollutants from Biomass Burning during Haze Episodes in Northern Thailand. Fire 2024, 7(4), 122. [Google Scholar] [CrossRef]
- Tanpipat, V.; Honda, K.; Nuchaiya, P. MODIS hotspot validation over Thailand. Remote Sensing 2009, 1(4), 1043–1054. [Google Scholar] [CrossRef]
- Junpen, A.; Garivait, S.; Bonnet, S.; Pongpullponsak, A. Estimating the PM10 Emissions from Forest Fire in Thailand by using Satellite Information. forest 2011, 214(150.2), 364–365. [Google Scholar]
- Phairuang, W.; Hata, M.; Furuuchi, M. Influence of agricultural activities, forest fires and agro-industries on air quality in Thailand. Journal of Environmental Sciences 2017, 52, 85–97. [Google Scholar] [CrossRef]
- Lasko, K.; Vadrevu, K. P.; Tran, V. T.; Ellicott, E.; Nguyen, T. T.; Bui, H. Q.; Justice, C. Satellites may underestimate rice residue and associated burning emissions in Vietnam. Environmental Research Letters 2017, 12(8), 085006. [Google Scholar] [CrossRef]
- Kanabkaew, T.; Kim Oanh, N. T. Development of spatial and temporal emission inventory for crop residue field burning. Environmental Modeling & Assessment 2011, 16, 453–464. [Google Scholar]
- He, X., Huang, Q., Yang, D., Yang, Y., Xie, G., Yang, S., ... & Qin, Z. Spatiotemporal Analysis of Open Biomass Burning in Guangxi Province, China, from 2012 to 2023 Based on VIIRS. Fire 2024, 7(10), 370.
- Frappier-Brinton, T.; Lehman, S.M. The burning island: Spatiotemporal patterns of fire occurrence in Madagascar. PLoS one 2022, 17(3), e0263313. [Google Scholar] [CrossRef]
- Phairuang, W.; Suwattiga, P.; Chetiyanukornkul, T.; Hongtieab, S.; Limpaseni, W.; Ikemori, F.; Hata, M.; Furuuchi, M. The influence of the open burning of agricultural biomass and forest fires in Thailand on the carbonaceous components in size-fractionated particles. Environmental Pollution 2019, 247, 238–247. [Google Scholar] [CrossRef]
- Vongruang, P.; Pimonsree, S. Biomass burning sources and their contributions to PM10 concentrations over countries in mainland Southeast Asia during a smog episode. Atmospheric Environment 2020, 228, 117414. [Google Scholar] [CrossRef]
- Jiang, K., Xing, R., Luo, Z., Huang, W., Yi, F., Men, Y., ... & Shen, G. Pollutant emissions from biomass burning: A review on emission characteristics, environmental impacts, and research perspectives. Particuology 2024, 85, 296–309.
- Phairuang, W.; Chetiyanukornkul, T.; Suriyawong, P.; Ho, S.; Paluang, P.; Furuuchi, M.; Amin, M.; Hata, M. Daytime-nighttime variations in the concentration of PM0.1 carbonaceous particles during a biomass fire episode in Chiang Mai, Thailand. Particuology 2024, 87, 316–324. [Google Scholar] [CrossRef]
- Pinakana, S. D., Raysoni, A. U., Sayeed, A., Gonzalez, J. L., Temby, O., Wladyka, D., ... & Gupta, P. Review of Agricultural Biomass Burning and its Impact on Air Quality in the Continental United States of America. Environmental Advances 2024, 100546.
- Yin, S.; Wang, X.; Zhang, X.; Guo, M.; Miura, M.; Xiao, Y. Influence of biomass burning on local air pollution in mainland Southeast Asia from 2001 to 2016. Environmental Pollution 2019, 254, 112949. [Google Scholar] [CrossRef]
- Nuthammachot, N.; Phairuang, W.; Stratoulias, D. Estimation of carbon emission in the ex-Mega Rice Project, Indonesia based on SAR satellite images. Applied Ecology & Environmental Research 2019, 17(2). [Google Scholar]
- Costa, M. A. M.; Amaral, S. S.; Soares Neto, T. G.; Cardoso, A. A.; Santos, J. C.; Souza, M. L.; Carvalho, J. A., Jr. Forest fires in the Brazilian Amazon and their effects on particulate matter concentration, size distribution, and chemical composition. Combustion Science and Technology 2023, 195(13), 3045–3071. [Google Scholar] [CrossRef]
- Fang, Z., Lai, A., Cai, D., Li, C., Carmieli, R., Chen, J., ... & Rudich, Y. Secondary Organic Aerosol Generated from Biomass Burning Emitted Phenolic Compounds: Oxidative Potential, Reactive Oxygen Species, and Cytotoxicity. Environmental Science & Technology 2024, 58(19), 8194–8206.
- Phairuang, W., Chetiyanukornkul, T., Suriyawong, P., Amin, M., Hata, M., Furuuchi, M., ... & Sun, L. Characterizing chemical, environmental, and stimulated subcellular physical characteristics of size-fractionated PMs down to PM0.1. Environmental Science & Technology 2024, 58(28), 12368–12378.
- Amin, M.; Prajati, G.; Humairoh, G. P.; Putri, R. M.; Phairuang, W.; Hata, M.; Furuuchi, M. Characterization of size-fractionated carbonaceous particles in the small to nano-size range in Batam city, Indonesia. Heliyon 2023, 9(5), e15936. [Google Scholar] [CrossRef]
- Pardthaisong, L.; Sin-Ampol, P.; Suwanprasit, C.; Charoenpanyanet, A. Haze pollution in Chiang Mai, Thailand: a road to resilience. Procedia engineering 2018, 212, 85–92. [Google Scholar] [CrossRef]
- Miller, S. D., Straka III, W., Mills, S. P., Elvidge, C. D., Lee, T. F., Solbrig, J., ... & Weiss, S. C. Illuminating the capabilities of the suomi national polar-orbiting partnership (NPP) visible infrared imaging radiometer suite (VIIRS) day/night band. Remote Sensing 2013, 5(12), 6717–6766.
- Coskuner, K. A. Assessing the performance of MODIS and VIIRS active fire products in the monitoring of wildfires: a case study in Turkey. iForest-Biogeosciences and Forestry 2022, 15(2), 85. [Google Scholar] [CrossRef]
- Elvidge, C. D.; Zhizhin, M.; Hsu, F. C.; Baugh, K. E. VIIRS nightfire: Satellite pyrometry at night. Remote Sensing 2013, 5(9), 4423–4449. [Google Scholar] [CrossRef]
- Schroeder, W.; Oliva, P.; Giglio, L.; Csiszar, I. A. The New VIIRS 375 m active fire detection data product: Algorithm description and initial assessment. Remote Sensing of Environment 2014, 143, 85–96. [Google Scholar] [CrossRef]
- Fu, Y., Li, R., Wang, X., Bergeron, Y., Valeria, O., Chavardès, R. D., ... & Hu, J. Fire detection and fire radiative power in forests and low-biomass lands in Northeast Asia: MODIS versus VIIRS Fire Products. Remote Sensing 2020, 12(18), 2870.
- Li, F.; Zhang, X.; Kondragunta, S.; Csiszar, I. Comparison of fire radiative power estimates from VIIRS and MODIS observations. Journal of Geophysical Research: Atmospheres 2018, 123(9), 4545–4563. [Google Scholar] [CrossRef]
- Wang, Q.; Blackburn, G. A.; Onojeghuo, A. O.; Dash, J.; Zhou, L.; Zhang, Y.; Atkinson, P. M. Fusion of Landsat 8 OLI and Sentinel-2 MSI data. IEEE Transactions on Geoscience and Remote Sensing 2017, 55(7), 3885–3899. [Google Scholar] [CrossRef]
- ED Chaves, M.; CA Picoli, M.; Sanches, D.I. Recent applications of Landsat 8/OLI and Sentinel-2/MSI for land use and land cover mapping: A systematic review. Remote Sensing 2020, 12(18), 3062. [Google Scholar] [CrossRef]
- Inlaung, K.; Chotamonsak, C.; Macatangay, R.; Surapipith, V. Assessment of Transboundary PM2.5 from Biomass Burning in Northern Thailand Using the WRF-Chem Model. Toxics 2024, 12(7), 462. [Google Scholar] [CrossRef]
- Air Resource Laboratory (ALR), 2024. The Air Resource Laboratory (HYSPLIP-4).
- Available online: http://ready.arl.noaa.gov/HYSPLIT.php (accessed on 20 November 2024).
- Furuuchi, M., Eryu, K., Nagura, M., Hata, M., Kato, T., Tajima, N., ... & Otani, Y. Development and performance evaluation of air sampler with inertial filter for nanoparticle sampling. Aerosol and Air Quality Research 2010, 10(2), 185–192.
- Amin, M.; Putri, R. M.; Handika, R. A.; Ullah, A.; Goembira, F.; Phairuang, W.; Ikemori, F.; Hata, M.; Tekasakul, P.; Furuuchi, M. Size-Segregated Particulate Matter Down to PM0.1 and Carbon Content during the Rainy and Dry Seasons in Sumatra Island, Indonesia. Atmosphere 2021, 12(11), 1441. [Google Scholar] [CrossRef]
- Boongla, Y.; Chanonmuang, P.; Hata, M.; Furuuchi, M.; Phairuang, W. The characteristics of carbonaceous particles down to the nanoparticle range in Rangsit city in the Bangkok Metropolitan Region, Thailand. Environmental Pollution 2021, 272, 115940. [Google Scholar] [CrossRef]
- Monteiro dos Santos, D., de Oliveira, A. M., Duarte, E. S., Rodrigues, J. A., Menezes, L. S., Albuquerque, R., ... & Libonati, R. Compound dry-hot-fire events connecting Central and Southeastern South America: an unapparent and deadly ripple effect. npj Natural Hazards 2024, 1(1), 32.
- Aman, N.; Manomaiphiboon, K.; Pala-En, N.; Devkota, B.; Inerb, M.; Kokkaew, E. A study of urban haze and its association with cold surge and sea breeze for Greater Bangkok. International Journal of Environmental Research and Public Health 2023, 20(4), 3482. [Google Scholar] [CrossRef]
- Barmpoutis, P.; Papaioannou, P.; Dimitropoulos, K.; Grammalidis, N. A review on early forest fire detection systems using optical remote sensing. Sensors 2020, 20(22), 6442. [Google Scholar] [CrossRef]
- Phoo, W. W., Manomaiphiboon, K., Jaroonrattanapak, N., Yodcum, J., Sarinnapakorn, K., Bonnet, S., ... & Wilasang, C. (2024). Fire activity and fire weather in a Lower Mekong subregion: association, regional calibration, weather–adjusted trends, and policy implications. Natural Hazards, 1-30.
- Sritong-aon, C.; Thomya, J.; Kertpromphan, C.; Phosri, A. Estimated effects of meteorological factors and fire hotspots on ambient particulate matter in the northern region of Thailand. Air Quality, Atmosphere & Health 2021, 14, 1857–1868. [Google Scholar] [CrossRef]
- Moran, J.; NaSuwan, C.; Poocharoen, O. O. The haze problem in Northern Thailand and policies to combat it: a review. Environmental Science & Policy 2019, 97, 1–15. [Google Scholar] [CrossRef]
Figure 1.
The density distribution of the population in Chiang Mai province.
Figure 1.
The density distribution of the population in Chiang Mai province.
Figure 2.
The distribution of elevation and location in Chiang Mai province.
Figure 2.
The distribution of elevation and location in Chiang Mai province.
Figure 3.
Forest Fire during (a) daytime and (b) nighttime in Chiang Mai, Thailand.
Figure 3.
Forest Fire during (a) daytime and (b) nighttime in Chiang Mai, Thailand.
Figure 6.
Sample of VIIRs hotspots fire distribution map in each land use and land cover.
Figure 6.
Sample of VIIRs hotspots fire distribution map in each land use and land cover.
Figure 7.
Time series graph between VIIRS fire spots and size-fractionated PMs in the daytime. (a) VIIRS hotspots and PM0.1, (b) VIIRS hotspots and PM0.5-1.0, (c) VIIRS hotspots and PM1.0-0.5, (d) VIIRS hotspots and PM2.5-1.0, (e) VIIRS hotspots and PM10-2.5, (f) VIIRS hotspots and PM>10.
Figure 7.
Time series graph between VIIRS fire spots and size-fractionated PMs in the daytime. (a) VIIRS hotspots and PM0.1, (b) VIIRS hotspots and PM0.5-1.0, (c) VIIRS hotspots and PM1.0-0.5, (d) VIIRS hotspots and PM2.5-1.0, (e) VIIRS hotspots and PM10-2.5, (f) VIIRS hotspots and PM>10.
Figure 8.
Scatter plot and Pearson correlation between VIIRS fire spots and size-fractionated PMs in the daytime. (a) VIIRS hotspots and PM0.1, (b) VIIRS hotspots and PM0.5-1.0, (c) VIIRS hotspots and PM1.0-0.5, (d) VIIRS hotspots and PM2.5-1.0, (e) VIIRS hotspots and PM10-2.5, (f) VIIRS hotspots and PM>10.
Figure 9.
Scatter plot and Pearson correlation between VIIRS fire spots and size-fractionated PMs in the nighttime. (a) VIIRS hotspots and PM0.1, (b) VIIRS hotspots and PM0.5-1.0, (c) VIIRS hotspots and PM1.0-0.5, (d) VIIRS hotspots and PM2.5-1.0, (e) VIIRS hotspots and PM10-2.5, (f) VIIRS hotspots and PM>10.
Figure 10.
Wind rose diagram in (a) daytime and (b) nighttime during the biomass fire episode in Chiang Mai, Thailand.
Figure 10.
Wind rose diagram in (a) daytime and (b) nighttime during the biomass fire episode in Chiang Mai, Thailand.
Figure 11.
Sample of mapping of a 24 h air mass backward trajectory.
Figure 11.
Sample of mapping of a 24 h air mass backward trajectory.
Figure 12.
Sample of mapping of 24 h air mass backward trajectory and density of VIIRS fire spots.
Figure 12.
Sample of mapping of 24 h air mass backward trajectory and density of VIIRS fire spots.
Figure 13.
Clustering of backward trajectory. (a) Clustering of backward trajectory in daytime, (b) Clustering of backward trajectories at nighttime.
Figure 13.
Clustering of backward trajectory. (a) Clustering of backward trajectory in daytime, (b) Clustering of backward trajectories at nighttime.
|
Disclaimer/Publisher’s Note: The statements, opinions and data contained in all publications are solely those of the individual author(s) and contributor(s) and not of MDPI and/or the editor(s). MDPI and/or the editor(s) disclaim responsibility for any injury to people or property resulting from any ideas, methods, instructions or products referred to in the content. |
© 2025 by the authors. Licensee MDPI, Basel, Switzerland. This article is an open access article distributed under the terms and conditions of the Creative Commons Attribution (CC BY) license (http://creativecommons.org/licenses/by/4.0/).