
Submitted:
11 December 2025
Posted:
12 December 2025
You are already at the latest version
Abstract
Fusarium head blight (FHB) is a serious concern for wheat production worldwide. The current study was conducted to identify morpho-phenological traits that contribute to passive resistance against FHB. For this purpose, a set of 332 spring wheat genotypes from different origins was used. Eight morpho-phenological traits and FHB severity were evaluated using spray inoculation under field conditions in 2022 and 2023. A non-parametric test was performed to evaluate genotypic variation for all studied traits, revealing significant differences among genotypes across the three years. Correlation analysis demonstrated a strong negative association between phenological traits and FHB severity and a low to medium negative correlation between spike length, spikelets per spike, and FHB resistance. Furthermore, there was a significant negative but weak association between anther extrusion and FHB severity. Random forest regression analysis demonstrated that a complex of eight morpho-phenological traits predicted FHB severity with an accuracy of 65% in 2023 and 57% across two years. According to permutation importance analysis, days to flowering, heading, and anther extrusion had the highest contribution to FHB severity, and all three traits had a significant effect on FHB prediction.
Keywords:
fusarium head blight
; wheat genotypes
; field inoculation
; disease resistance
1. Introduction
Fusarium head blight (FHB) is one of the most damaging diseases of small grains (such as wheat and barley) in Europe, significantly reducing the yield and quality of cereals [1]. FHB is a serious threat to the economy and food safety, especially in areas with warm and humid climatic conditions during flowering time. It has been documented that in the 1970s and 1980s, Europe faced FHB epidemics, which resulted in 40–50% wheat yield losses [2], and up to 100% during severe epidemics [3]. Besides yield losses, FHB leads to mycotoxin accumulation in seeds, such as deoxynivalenol (DON), nivalenol, and zearalenone [4,5], which jeopardize human and animal health [6,7,8,9]. The main causes of FHB are considered F. graminearum, F. culmorum, and F. avenaceum in wheat [1,4]. F. culmorum is more common in cooler climates, such as Western Europe, while F. graminearum prefers warmer and wetter climates [1,2,10,11]. The symptoms of FHB include premature senescence, chalky white spikelets, and discolored, shriveled, or damaged grains [4,5]. Wegulo et al. (2015) reported that the frequency and severity of FHB epidemics are rising globally due to climate change, which promotes disease development [9]. In addition, certain agronomic practices (i.e., low tillage or zero tillage, inadequate crop rotation, and use of susceptible cultivars) also increase disease severity [12]. These factors, together with warm and humid weather, have led to severe epidemics [13]. The impact of FHB on yield and food security highlights the importance of breeding resistant cultivars as a vital approach for effective disease management.
Wheat resistance to FHB is a complex quantitative trait influenced by both genetic and environmental factors. It is quantitatively inherited and controlled by multiple genes [14,15,16,17]. FHB resistance consists of five components i.e., Type I, which is considered as resistance to initial infection, Type II corresponds to the spread of infection, Type III and IV are associated with mycotoxin accumulation and kernel infection, and Type V, which is related to yield loss [18,19]. To evaluate different kinds of FHB resistance, spray, spawn-grain, and point methods of inoculation are generally used to create artificial infection conditions. Among them, spray inoculation is considered an efficient way to evaluate type I and overall resistance because it includes both stages when Fusarium spores enter and spread to the ovary, representing resistance to initial and further disease spread. Therefore, the overall resistance to FHB, which incorporates both Type I and Type II resistance, is preferable in practical breeding [20]. Hundreds of QTL associated with different types of FHB resistance have been identified. However, QTL associated with FHB resistance usually provides only minor effects, whereas to attain an adequate level of resistance, numerous QTL should be pyramided. This limitation highlights the importance of integrating morphological and phenological traits in breeding programs to develop cultivars with improved resistance.
In wheat, resistance can be either active or passive. Active resistance refers to a plant’s capacity to identify pathogen attacks and initiate physiological and molecular defense mechanisms [18]. In contrast, passive resistance in wheat usually appears as disease avoidance, which is structure-based and refers to the plant’s intrinsic ability to reduce the chances of infection at its most vulnerable stage. These built-in barriers are regulated through morpho-phenological traits that inhibit pathogen invasion and are known as passive resistance. Traits such as plant height, spike architecture, anther extrusion, heading date, flowering window, and presence or absence of awns play a vital role in preventing plants from Fusarium pathogen invasion and the spread of infection [13,20,21,22,23,24,25]. Morpho-phenological traits contribute to establishing physical barriers against infection, either by escaping or avoiding the disease. Utilization of these traits for FHB resistance can assist in the selection of genotypes directly on the basis of phenotypic traits, which correlate with FHB resistance.
The significant role of plant height in escaping FHB infection was first noticed in 1982 [26]. Subsequently, Mesterhazy (1995) confirmed that short-stature genotypes showed FHB susceptibility compared to taller genotypes under naturally infected field conditions [18]. This can be explained by less favorable conditions for taller genotypes, which have lower exposure to the inoculum source, and their spikes experience better airflow and maintain a larger distance from the soil surface compared to the shorter genotypes [27]. During the Green Revolution, Rht genes (such as Rht-B1b and Rht-D1b, formerly known as Rht1 and Rht2, respectively) contributed prominently to lodging resistance and enhanced yield potential in wheat; however, the findings demonstrated that some semi-dwarfing alleles associated with increased susceptibility to FHB. The influence of semi-dwarfing Rht genes on the increased susceptibility to FHB in wheat is well documented [6,10,28,29,30,31,32].
Additionally, the influence of spike architecture in providing resistance to wheat plants has also been discussed. Spike architecture, comprised of spike length, number of spikelets per spike, and spike density, can play a significant supportive role in helping plants avoid FHB. The compact spike architecture supports the growth of Fusarium spores by offering a conducive environment [23,33]. On the other hand, long and lax spikes, with considerable space between spikelets, do not provide suitable conditions for FHB pathogens growth. Anther extrusion is another morphological trait, which is relatively high associated with type I FHB resistance. Several studies have confirmed that anther retention within the glumes can increase the chances of FHB infection in wheat [6,21,35,36,37].
Phenological traits, such as days to heading and flowering, are other key traits that help in escaping FHB infection during the crucial period of disease progression. Specifically, the period from anthesis to kernel development is considered the most vulnerable stage for wheat plants [38]. In addition, the weather conditions provide extra variation, occasionally providing more favorable conditions for disease development in late-maturing or early maturing genotypes.
Research outcomes have indicated that although morpho-phenological traits cannot replace active resistance or provide strong resistance, they can serve as significant support through escape and avoidance mechanisms and create less favorable conditions for pathogens [39,40].
Till now, many studies have been conducted to evaluate Type I and Type II resistance individually, which focus on individual morpho-phenological traits or a combination of a few morpho-phenological traits [23,30,31,32,33,34,35,36,41]. However, in this study, a complex of eight morpho-phenological traits and their association with overall FHB resistance was investigated. The aims of this study were as follows: 1) to evaluate the variation in the morpho-phenological traits in a spring wheat set of 322 cultivars across two years; 2) to evaluate FHB severity under artificial inoculation in two-year field trials; 3) to conduct Spearman correlation analysis among morpho-phenological traits and FHB severity; and 4) to apply random forest regression (RFR) analysis to determine the contribution of the morpho-phenological traits for FHB resistance, measuring prediction accuracy between RFR-predicted and observed FHB severity scores and the relevant importance of the traits.
2. Materials and Methods
2.1. Field Trial
The group of 332 genotypes, originated from Baltic (181), Central, and Western Europe (76), Nordic (65), and 10 non-European origin was used for this study [42,43]. Field trials were conducted in 2022, 2023, and additionally, anther extrusion was measured in 2025 at the Institute of Agriculture, Lithuanian Research Centre for Agriculture and Forestry (LAMMC). An Alpha experimental design (1.5 m2 plot) with two replicates was used to grow genotypes each year. From each replicate, 12 spikes were selected and tied in bunches for inoculation with F. culmorum suspension (2 × 10⁵ spores/mL). Each genotype was spray-inoculated when it reached the middle of anthesis. A spray atomizer was used to spray each and every spike of the bunch to ensure uniform distribution of the inoculum. Furthermore, to maintain humidity, each bunch was covered with plastic bags for 48 h. Insecticides and herbicides were used when necessary. No spike diseases other than FHB were observed in the region; therefore, fungicides were not applied to prevent any potential influence on Fusarium fungus growth. The genotypes were assessed for overall resistance under field conditions. The genotypes Sumai-3 and Wangshuibai served as reference standards for FHB resistance, while Gamenya was used as a baseline for FHB susceptibility. The details of inoculum preparation, inoculation procedure, and evaluation of resistance under field conditions are described in our previously published articles Syed et al. (2024; 2025) [42,43].
2.2. Meteorological Data
The meteorological data during the wheat growing season for the years 2022 and 2023 were collected from the nearest Dotnuva meteorological station, which is located at the same location as the institution fields. Daily temperature (°C) and precipitation (mm) data were recorded from April to August of each year. Day-to-day changes in weather conditions are illustrated during the heading and flowering periods (Figure 1).
The day-by-day precipitation (mm) and temperature trends during the heading and flowering stages of 332 genotypes in 2022 and 2023 are illustrated in Figure 1 a, and b, respectively. In these graphs, the primary y-axis represents both the average temperature and the rate of precipitation, while the secondary y-axis illustrates the number of genotypes. Additionally, the x-axis indicates the daily dates throughout the observation period, and each bar corresponding to heading and flowering shows the number of genotypes that reached these stages on the respective days.
Frequent fluctuations in temperature and precipitation were observed in both years during the developmental stages. A strong environmental effect was noticed for Fusarium fungus development between the two studied years. In 2022, the weather conditions were warm and extremely humid during anthesis, whereas the lack of precipitation in 2023 provided much less favorable conditions for fungal development. A record-breaking amount of 150 mm of precipitation was recorded in June 2022. Moreover, warm temperatures were observed at 22.5°C on average during the entire heading and flowering phases (Figure 1a). On top of that, peaks in precipitation were observed at the beginning and end of these developmental stages, which escalated the disease pressure. Approximately 40 mm of rainfall was recorded a few days prior to heading. Furthermore, during the short dry window, genotypes started heading; however, at the peak of anthesis, an increase in precipitation (5 mm) was observed again, providing favorable conditions for the spread of FHB spores.
In 2023, the weather dynamics were completely different from those of 2022. The year 2023 was comparatively drier than 2022. The average temperature recorded for the year 2023 was approximately 19 °C (ranged between 16–22 °C) in June. The recorded precipitation was also comparatively lower (i.e., <10 mm) than that of June 2022. Besides, more than 8 mm of precipitation was recorded at the start of heading; however, a drop in precipitation was recorded for a short time period during the peak of the heading and flowering stages (Figure 1b). Most genotypes flowered during the no-precipitation window when the rate of precipitation was 0 mm and temperature was between 15–20 °C, while a sudden increase in precipitation for late-flowering genotypes was also observed (Figure 1b).
2.3. Evaluation of Morphological and Phenological Traits
For this study, several key morphological traits were evaluated during different years, including plant height, spike length, number of spikelets per spike, spike density, days to heading and flowering, awn length, and anther extrusion. For morphological data, three readings per genotype were taken from each replicate to get reliable data. Plant height (cm) was measured at maturity from the base of the plant (soil surface) to the end of the spike (excluding awns). Awn length was measured when the spikes were fully mature using a visual assessment of three spikes per genotype from each replication on a 0–9 scale. Where zero is completely awnless genotypes and 9 is for those with long and dense awns. For spike data, plants were harvested and then measured in the laboratory. Spike length was measured manually from the base of the spike to the last spikelet. The number of spikelets per spike was counted as the total number of fertile spikelets per spike. For calculating spike density, we used this formula:
Anther extrusion was evaluated three days after anthesis based on visual assessment. For this purpose, we used a 0–5 scale to visually evaluate each genotype, ranging from “0” for anther retention to “5” for complete anther extrusion, similar to the scale used by Skinnes et al. (2010) [41].
To record phenological data, each trait was evaluated at the appropriate growth stage. Days to heading were recorded when 75% of the spikes emerged from the booting stage. Flowering time was recorded when 75% of the plants in a genotype showed anthesis. The days to heading and flowering were counted from the date of sowing to the day on which the plants headed or flowered.
2.4. Evaluation of FHB Severity
To assess FHB severity, a 0–100% scale was used based on the proportion of spikes showing visible symptoms of FHB spread.
2.5. Genotyping for Rht Alleles Identification
The set of 332 genotypes was genotyped using a 25 K SNP chip array as part of the NOBALwheat project (Project# LT08-1-ŠMSM-K01-007). Markers “TG0010a” at chromosome 4B and “TG0011a” on chromosome 4D, which are located within the alleles Rht-B1b and Rht-D1b, were used for identification. Genotypes were grouped on the basis of the presence of Rht allele (semi-dwarfing, i.e., Rht-B1b and Rht-D1b) and non-Rht alleles (wild type, i.e., Rht-B1a and Rht-D1a). The details of genotyping were published in previous articles [42,43].
2.6. Statistical Analysis
The normality of the data was checked using the Shapiro-Wilk test in R. Since the data was not normally distributed, non-parametric tests were performed in R (R-4.2.2). The Kruskal-Wallis test was used to assess the chi-square values of different traits using the “kruskal.test()” function. The strength of each factor (size effect) was determined using Epsilon-squared (ε2), which was calculated in R using this formula:
where “H” is the Kruskal–Wallis chi-squared test statistic, “k” is the number of groups, and “n” is the total number of observations [46].
Epsilon square (ε2) was used to estimate the residual proportion of variance explained by independent variables (genotype, year, and their interaction), which ranged between 0 and 1. Here, “0” indicates no variance explained and “1” indicates complete variance explained. To express the size effect in percentage, we multiplied the ε2 values by 100. A rank-based non-parametric mixed model was fitted to determine the genotype × year effects. Genotype and year were treated as fixed effects, and replication was set as a random factor using “lmer()” function in R.
The Best Linear Unbiased Estimators (BLUEs) were derived using META-R v.6.04, a multi-environment trial analysis in R [47]. Violin plots were created to show the association between Rht genes with plant height and FHB severity using the “geom_violin()” function in R. To display the influence of temperature and precipitation on FHB development during phenological stages (Figure 1), the “ggplot2” package with “geom_bar()” was used. Spearman’s correlation was calculated to evaluate the association between morpho-phenological and FHB severity by using the “corr_coef” function from the METAN package [48].
Random Forest regression (RFR) analysis was performed in R using the mlr3, ranger, and “dplyr” packages to predict FHB severity from eight morpho-phenological traits. Fine-tuning of hyperparameters was conducted using 5-fold cross-validation in 80/20 train-validation splits and with root mean squared error (RMSE) as the optimization criterion in 100 random combinations. Each of the 2000 trees contained random subsets of observations and a random subset of predictors (morpho-phenological traits) for fine-tuning the hyperparameters. The final model with the best hyperparameters was repeated 100 times with independent 80/20 random splits of observations. In each run, 20% of the observations were randomly selected and excluded from the training for validation. The predicted values for each genotype were averaged across all 100 validated splits and across all replicates. Scatterplots with a fitted linear trend were built to illustrate the relationship between predicted and observed genotype average means using the R package “ggplot2”. The scatterplots were annotated with the main statistics, such as Pearson coefficient, p-value, RMSE, optimal number of predictive traits (mtry value), and standard deviations of predicted and observed values using base R functions.
To evaluate the relative importance of morpho-phenological traits in the prediction of FHB severity, a random forest regression model was fitted using the “ranger” package in R. The model was built using 2000 trees and permutation importance [49,50]. The statistical significance of each trait’s importance was measured using Altmann permutation tests with 200 permutations [51]. Significance levels of the Altmann test were indicated as *p < 0.05, **p < 0.01, and ***p < 0.001. The importance of the traits was visualized using the “ggplot2” R package. Bars represent the average permutation importance scores, and the whiskers near the bars indicate the standard errors calculated from 30 independent RF runs.
3. Results
3.1. Genotypic Effect on Morpho-Phenological and FHB Severity
Traits variation was analyzed using the chi-square test individually in three years to measure the genotype effect within different years. Epsilon-square (ε2) was calculated to demonstrate the effect size of genotypes for each trait. Highly significant (p < 0.001) differences were found among genotypes for all traits in all three years. The strongest genotype effect on morpho-phenological traits was observed for anther extrusion in 2023 (i.e., 92%), followed by plant height in the year 2022 (approximately 89%) and days to heading in 2023 (i.e., 82%). The lowest genotype effects were observed for spike density in 2023 (i.e., 24%). However, epsilon-square values revealed different genotypic effects on FHB severity across years (Table 1).
3.2. Phenotypic Variability and Genotypic/Year Effects on Morpho-Phenological and FHB Severity
To assess the variation in morpho-phenological traits among genotypes, the standard deviation (SD) and the coefficient of variation (CV) were calculated for the 332 genotypes over three years. The standard deviation (SD) was calculated to measure the variation in each morpho-phenological trait. The coefficient of variation (CV) was used to demonstrate the deviation of each trait relative to its mean value, in percentage (%), for each year (Supplementary Table S1).
The trait plant height showed an average height of 94.6 cm (CV = 8.87%) in 2022, while a significant decrease in plant height was noticed in 2023, that is, 70.17 cm (CV = 9.32%). The mean values for FHB severity were 77.93 and 48.37 in 2022 and 2023, respectively, with 30.31% and 63.95% variation from the mean. Awn length in 2022 and 2023 exhibited a very high CV of 66.6% and 82.94%, respectively, suggesting high variability among genotypes. Anther extrusion was measured in 2023, and additionally in 2025 (Table 2).
Highly significant effects provided genotype, years and their interaction on trait variation (Table 2). The highest genotypic effect was observed for the trait awn length (ε2 = 0.53), followed by spike length (ε2 = 0.42) and anther extrusion (ε2 = 0.30). The strongest genotype × year interaction was noticed for FHB severity (ε2 = 0.19).
The traits days to heading and flowering showed non-significant genotypic effect (i.e., ε2 = −0.07 and ε2 = −0.10, respectively) and strong year effect (ε2 =0.75). The difference in days to heading between years was much greater than the difference between genotypes. Only 2–3 days difference was observed from heading to flowering between the genotypes within year, while the difference in days to heading and flowering between the genotypes was 5–15 days later in 2022 than in 2023.
Large Year and G × E effects were noticed for FHB severity, ε2 = 0.21 and ε2 = 0.19, respectively (Table 3). Genotype responses varied across years; some genotypes performed well in one specific year but poorly in another. Relatively strong Year and G × E interaction effects for FHB severity demonstrate that environmental conditions contributed strongly to variation, and some genotypes had different patterns of responses between years that caused some inconsistency in genotype performance across years.
3.3. Year-Wise Association Between Phenological Traits and Plant Height with FHB Severity
To assess the year effect on the association between morpho-phenological traits and FHB severity, the correlation analysis was performed individually for separate years . In the Table 4 presented the results of FHB resistance individually by year and BLUEs values of morpho-phenological traits across two years. Plant height was significantly correlated with FHB severity (r = −0.12, p < 0.01) in 2023. Heading and flowering were more stable, showing negative low (r = −0.14, p < 0.01) to medium (r = −0.51, p < 0.001) significant correlations with FHB severity across two years (Table 4).
3.4. Correlation Analysis Between Morpho-Phenological and FHB Traits over Two Years
The Spearman correlation method was used to assess the association between morpho-phenological traits and FHB resistance (Figure 2). The combined BLUEs values of morpho-phenological traits across three years were calculated to demonstrate their association with FHB severity in 2022 and 2023, with an exception of anther extrusion, which was recorded in 2023 and 2025. The positive associations between morpho-phenological traits ranged from r = 0.03 to r = 0.87 (p < 0.001), while the negative correlations between morpho-phenological traits ranged from r = −0.02 to r = −0.54 (Figure 2).
3.4.1. Association Between Morphological Traits and Phenological Traits
A strong positive correlation was recorded for phenological traits, days to flowering with the number of spikelets per spike (r = 0.54, p < 0.001), followed by the association between the number of spikelets per spike with days to heading (r = 0.53, p < 0.001) and spikelets per spike with spike density (r = 0.53, p < 0.001). Additionally, a strong negative correlation for morphological traits was observed between spike length and spike density (r = −0.51, p < 0.001). Furthermore, awn length showed a significant negative association with merely a few spike traits and phenological traits. Awn length had a statistically low but highly significant negative correlation of was observed with spike density (r = −0.28, p < 0.001), number of spikelets per spike (r = −0.27, p < 0.001), days to heading (r = −0.24, p < 0.001), and flowering (r = −0.23, p < 0.001). Non-significant associations were observed between anther extrusion and the other morphological traits. However, a significant negative correlation was observed with phenological traits, that is, days to flowering (r = −0.35, p < 0.001) and heading (r = −0.25, p < 0.001). The correlation results further revealed that plant height had a non-significant association with other evaluated morphological traits, except for spike length and number of spikelets (r = 0.30 and 0.23, respectively; p < 0.001).
3.4.2. Association Between Morpho-Phenological and FHB Traits
A moderately strong negative correlation was recorded between days to heading and FHB severity (r = −0.43, p < 0.001), followed by days to flowering (r = −0.39, p < 0.001). Moreover, other morphological traits, such as anther extrusion, showed a low but significant negative correlation with FHB severity (r = −0.21, p < 0.001). Spike length and spikelets per spike were negatively correlated with FHB severity. However, non-significant associations were observed between spike density and FHB severity.
3.5. Influence of Rht Genes on Plant Height and Its Association with FHB Susceptibility
Based on the presence and absence of Rht alleles, the genotypes were grouped into three groups: Non-Rht, Rht-B1b, and Rht-D1b. In total, 41 genotypes carried Rht-B1b and Rht-D1b, while 292 genotypes were non-Rht (wild type). To analyze the effects of Rht alleles on plant height and FHB severity, pairwise comparisons between these three groups were calculated using the Kruskal-Wallis test (Figure 3 a,b). In our population, 19 genotypes had the Rht-B1b allele and 22 had the Rht-D1b allele, and none of the genotypes showed the presence of both alleles simultaneously.
The distribution and effect of semi-dwarfing (Rht) alleles on plant height and FHB severity in the set of 332 genotypes across 3 years are displayed in violin plots (Figure 3). The results illustrated significant differences in plant height between the groups in all two years (Figure 3a). Genotypes with semi-dwarfing Rht alleles showed reduced height compared to those without Rht alleles. The genotypes without the Rht alleles (wild type) displayed taller plant height on average in comparison to the group with Rht genes.
Furthermore, Figure 3b shows that the violin plots demonstrate the association between FHB severity and the presence of semi-dwarfing alleles. In 2023, genotypes with Rht-B1b or Rht-D1b alleles had higher FHB severity than those without semi-dwarfing (Rht) alleles. However, the results were not significant in 2022.
3.6. Prediction of Resistance on the Basis of Morpho-Phenological Traits
FHB severity was predicted on the basis of eight morpho-phenological traits using a Random Forest regression (RFR) model with 2000 trees. Predictive accuracy was measured using the Pearson correlation coefficients between the mean predicted and mean observed FHB severity values.
In 2022, anther extrusion was not evaluated, and extremely favorable conditions for FHB development were observed (see Materials and Methods: Meteorological Data). The predicted RFR values were calculated using mean values averaged from the validation split, which was repeated 100 times (80/20 training-validation splits). According to the Pearson correlation between the RFR predicted and actual observed values, the prediction accuracy between seven morpho-phenological traits and FHB severity was only 28% (r=0.28, p<0.001) in 2022. However, in 2023, the prediction accuracy between the eight morpho-phenological traits and severity was 65% (r=0.65, p<0.001), and between two-years average phenotypic traits it was 57% (r=0.57, p<0.001) (Figure 4 a,b).
3.7. Ranking of Morpho-Phenological Traits by Their Importance
Morpho-phenological traits were ranked according to their importance in predicting FHB severity. Importance was determined using Random Forest regression (2000 trees) trained on FHB severity data with permutation-based importance measures. The basic principle of this method is to measure the increase in the mean squared error (MSE) after randomly reordering the values of each trait individually for all 2000 trees. Consequently, the permutation importance of the traits was defined as the average MSE increase across all trees. Larger values demonstrate greater predictive importance. Error bars represent the standard error of the importance scores across 30 independent random forest runs, showing that the trait ranking was stable (Figure 5 a,b).
In 2022, the importance of morpho-phenological traits for prediction was negligible; all traits (days to heading, flowering, spikelets per spike, spike length and density, awn length, and plant height) had no significant effect and an importance score of up to 20. Spike length and days to flowering had importance within 10-20 points of importance, spikelets per spike 10 points, spike density, awn length, days to heading about 5 points, and plant height 3 points. However, in 2023, the importance of morpho-phenological traits essentially increased. Days to heading, flowering, and anther extrusion had significant effects on FHB severity prediction, with importance ranging between 90 and 100 (Figure 5a). On average, across two years, the importance was significantly reduced, and the ranking slightly changed compared to 2023. The ranking of days to heading and flowering was reversed and the importance of spike density was increased across two years (Figure 5b). When BLUEs values across two years were used, importance was reduced; however, the same three traits, days to flowering, heading, and anther extrusion, had significant effects on the prediction of FHB severity (Figure 5b).
4. Discussion
Passive resistance in wheat is related to innate morphological and phenological traits, which can indirectly influence the infection process and the spread of FHB infection [34]. Traits such as plant height, spike length, spikelet number, spike density, heading date, flowering date, awn length, and anther extrusion create passive resistance by escaping or avoiding interaction with pathogens or providing less favorable conditions for disease spread [31,52]. Our results were consistent with earlier findings regarding phenological traits that consistently affect disease escape [39,53,54,55,56].
Spikes are considered a significant part of the wheat plant, where reproduction takes place, and grains are stored until harvest [62]. Spike length was positively correlated with spikelets number in this study, and similar results were reported by Xu et al. (2023) [63]. Furthermore, the trait spike density is also one of the most important agronomic traits, being determined by spike length and the number of spikelets per spike. Spike having a greater number of spikelets per spike create a compact arrangement which does not allow better airflow, ensuring a conducive environment for Fusarium pathogens to grow easily [37,64]. Additionally, lax or loose spike arrangements provide a less favorable environment for FHB growth [23]. Although, the spike density is often hypothesized to influence FHB by creating microclimatic conditions [65,66], but in our study, we found a bit of contradictory results, which are consistent with the findings of Franco et al. (2021) [34]. A non-significant association between spike density and FHB severity was observed, except for incidence, which was significantly and negatively correlated with the number of spikelets per spike and spike length, which suggests that alone spike density alone does not provide significant effect on FHB spread. Tessmann and Van Sanford (2019) also reported similar results to our findings [31].
Furthermore, awns contribute to plant photosynthetic activities and may influence FHB by holding moisture and providing space for the fungus to stay and grow. However, in our study, awn length was not significantly associated with FHB severity. Significant associations could not be detected because of the strong imbalance of the awned and awnless genotype groups. Approximately 9.8% of genotypes exhibited long and dense awns, whereas about 90% were awnletted and awnless types. Moreover, the influence of awns on FHB resistance is quite ambiguous. Studies showed contradictory results about awn length’s role in passive resistance. Mesterházy (1995) revealed that the awned genotypes were more susceptible under natural disease conditions [18]. However, under artificial inoculation, awned genotypes showed no differences in FHB severity [18]. In addition to this, Giancaspro et al. (2016) noticed less FHB severity in genotypes having long awns [67]. In contrast, some researchers found no association between awn presence and FHB resistance [23,55].
Anther extrusion also plays a key role in passive resistance to FHB. Anthers most likely provide nutrition and moisture to Fusarium pathogens and the space to colonize. Extensive studies have been done till now, which have proved that the anther trapped between glumes facilitates the spread of FHB infection. In contrast, genotypes that fully extruded their anthers showed a tendency to resist FHB infection [35]. In this study, we found a weak but significant negative correlation between FHB severity and anther extrusion, which indicated that higher anther extrusion is associated with better FHB resistance. Other researchers have also observed a strong negative correlation between AE and FHB resistance [6,21,37]. Anther extrusion showed negative associations with FHB [31], which points out the potential of the trait, which may aid in reducing disease severity.
Another trait that is considered to assist plants in avoiding FHB infection is plant height. During the Green Revolution, semi-dwarfing alleles, such as Rht-B1b and Rht-D1b, were utilized to restrict the height of wheat plants and prevent lodging. This modification made dwarf genotypes superior to wild-type (Rht-B1a and Rht-D1a) wheat varieties, with taller plant height and weak stems, which are unable to hold heavy spikes [68]. However, over time, researchers have reported that these Rht alleles are also associated with FHB susceptibility. To illustrate, Xu et al. (2020) and He et al. (2016) reported an association between semi-dwarfing Rht alleles (Rht-B1b and Rht-D1b) and increased FHB susceptibility [10,37]. Additionally, Srinivasachary et al. (2009) reported that both Rht-B1b and Rht-D1b alleles significantly decreased Type I resistance against FHB under severe disease pressure [30]. Tessmann & Van Sanford (2019) announced that the frequencies of Rht-B1b and Rht-D1b alleles were 52% and 37%, respectively [31]. Correspondingly, Zanke et al. (2014) reported 7% and 58% of Rht-B1b and Rht-D1b mutant alleles, respectively, in European cultivars [69]. In contrast, in our collection, only 6% and 7% of the genotypes carried Rht-B1b and Rht-D1b alleles, respectively, and none of them had both semi-dwarfing (Rht) alleles simultaneously (Figure 3b). The effect of semi-dwarfing alleles could be negligible because of the imbalanced group sizes in our study. The ratios between the non-Rht and Rht-B1b and non-Rht and Rht-D1b groups were 1:13 and 1:15, respectively. This imbalance between the wild type and semi-dwarfing allele groups increased the risk of failing to detect a true effect (Type II error).
According to our results, plant height in 2022 was not significantly correlated with FHB severity. In addition, it showed a non-significant association with all other morpho-phenological traits. This may be due to the high rate of precipitation that year, which created strong disease pressure and favorable conditions for the spread of FHB infection. Undoubtedly, morpho-phenological traits facilitate plants to cope with disease stress to some extent through a passive resistance mechanism; moreover, resistance based on avoidance is effective under some level of disease pressure. Under high disease pressure, passive resistance can be overcome by Fusarium pathogens. The dependence of passive resistance on disease pressure was noticed by Mesterhazy (1995), who reported that under a strong artificial disease background, non-significant differences in plant resistance to Fusarium head blight (FHB) were observed among various plant height classes [18]. Buerstmayr and Buerstmayr (2022) also reported the minimal effect of plant height on FHB under greenhouse conditions [70]. In contrast to 2022, plant height showed a negative correlation with FHB severity in 2023, indicating that long-stature plants have a greater chance of avoiding initial FHB infection under low disease pressure. Similar conclusions have been drawn by other researchers [27,28,29,30,31,37,64,71].
The findings revealed that the late-headed genotypes with taller stature and lax spikes having considerable space between spikelets showed significantly less FHB symptoms, indicating that they are desirable morphological traits when selecting genotypes for resistance breeding against FHB. These morphological and phenological traits can be utilized as phenotypic markers through the visual selection of genotypes with desirable traits, such as fully extruded anthers, taller plant height, or spike architecture.
During the flowering period, temperature and humidity have a significant impact on the intensity of FHB infection and genotype-environment interaction [52,72]. In 2022, the weather conditions were more favorable for Fusarium development, and disease pressure was higher because of warm temperatures and frequent rainfall. The genotypes started heading and flowering under volatile conditions and faced intense FHB infection. However, a different scenario was observed in 2023, when the genotypes experienced dry weather conditions from the start of the cropping season, with lower precipitation rates than in 2022 (Figure 1b). In both years, the late-maturing genotypes experienced less precipitation and decreased temperatures during heading and flowering compared with the early-maturing ones. This shift in weather conditions reduces the risk of late-maturing genotypes being exposed to the peak infection period, contributing to lower FHB severity. Furthermore, Reis et al. (2023) indicated that the longer periods of moisture at temperatures close to 25 °C increase the risk of infection, and almost 50% of spikelets may become infected during wet periods over 40 h [73]. However, phenological differences between genotypes may play an important role in resistance, especially if weather conditions are significantly different during the flowering period for early and late-maturing genotypes. In our results, we observed that the late-maturing genotypes showed lower severity than the early maturing genotypes. This might be because the late genotypes, compared to the early maturing genotypes, escaped the peak infection period. Weather conditions at the time of inoculation significantly affect the spread of fungal infection, which may increase severity and promote the accumulation of mycotoxins [34]. However, Xu et al. (2020) found no significant association between days to flowering and FHB severity [37]. Steiner et al. (2004) reported that early headed genotypes exhibit lower FHB symptoms than late genotypes [65]. On the other hand, some research studies strengthen our findings and have indicated that late-headed and late-flowering genotypes perform better in combating FHB [39,40,53,54,55,56]. In this study, genotypes showed a negative correlation with FHB severity, indicating that the genotypes that headed and flowered late showed higher resistance against FHB than the early-maturing genotypes (Figure 2).
To measure the effect of morpho-phenological traits on FHB severity, two approaches were used: Spearman correlation analysis and the Random Forest method in this study. Random forest regression is a machine learning approach based on creating multiple decision trees to find complex interaction patterns between the predictors and predicted traits. It is well documented that random forest can produce better accuracy in prediction than linear methods for complex traits such as resistance to FHB [50,74].
A comparison of the Spearman correlation coefficients and relative importance scores from the random forest regression analysis showed that the ranking of morpho-phenological traits changed according to their contribution to FHB resistance (Figure 2 and Figure 5). For example, according to the RFR importance score, the first rank had the trait days to flowering, while the correlation was stronger with days to heading. Anther extrusion had a third rank, while according to the correlation coefficients, it had only a fifth rank across two years. Spike density had a correlation close to zero, but according to RFR analysis, it has a fourth rank (Figure 5, b). Random forest has the advantage of capturing non-linear effects and can detect not only straight-line relationships but also reveal complex patterns of interaction. This allows the detection of threshold effects, non-monotonic patterns (e.g., U-shaped), and complex interactions among traits. If the relationship between traits is observed only within a specific range, random forest can consider not the whole range, but the separate effect of the trait at different ranges. In the case of the U-shape scenario, if both small and large values have no association with resistance to FHB, for example, because of rain at the beginning and end of anthesis, it might mask the effects in the correlation analysis, while RFR might detect high importance. Sometimes, resistance can be a result of the interaction of two or several traits, which alone show little or no effect. Random forest can detect such scenarios, including cases when interaction occurs only between specific traits and within a particular range of their values [50,74,75,76].
Many studies have been conducted to measure the predictive accuracy between genetic markers and FHB severity, as well as between morpho-phenological trait parameters and FHB severity [23,77]. However, FHB is a complex genetic trait with a strong G × E interaction and relatively low prediction accuracy [78]. For example, Liu et al. (2019) found that the prediction accuracy was 0.35 between rrBLUP-predicted GEBVs and phenotypic BLUEs, using 102147 SNP markers and fivefold cross-validation [79]. Zhang et al. (2022) found 0.38 and 0.41 prediction accuracies between predicted values and observed for Fusarium disease index and Fusarium damaged kernels, respectively [80]. Some studies have demonstrated that including morpho-phenological traits in multivariate models can improve genomic prediction accuracy [54,81,82,83]. Morales et al. (2024) reported that including morpho-phenological traits and the Rht-D1 allele as covariates in a GBLUP model improved prediction accuracy for FHB severity by 7–25% compared to the standard GBLUP [82].
The results of this study demonstrate that a complex of morpho-phenological traits contributes to passive resistance, and eight to seven traits represented a substantial portion of FHB variation. These traits can be used for indirect breeding, supplement active resistance, or be included in genomic prediction models to enhance the overall prediction of FHB severity.
5. Conclusions
The results of this study suggest that morpho-phenological traits play a vital role in FHB resistance. Phenological traits (days to heading and flowering) displayed a strong negative association with FHB severity. Morphological traits such as anther extrusion, spike length, and spikelet number also showed weak but negative correlations with FHB. The contribution of passive resistance dependent significantly on weather conditions; under high disease pressure, the influence of morpho-phenological traits was significantly reduced. Random forest regression analysis demonstrated that eight to seven morpho-phenological traits predicted FHB severity with an accuracy of 65% in 2023, 28% under high disease pressure in 2022, and 57% across two years. Our results demonstrate that the passive resistance provided by a complex of morpho-phenological traits explains a significant part of FHB variation and can assist wheat breeding for FHB resistance.
Author Contributions
S.S.: writing- review of original draft, investigation, formal analysis visualization and data curation. Ž.L.: review. A.G.: writing, review and editing of original draft, investigation, formal analysis, supervision and conceptualization. All authors have read and agreed to the published version of the manuscript.
Funding
This study was carried out within the framework of the LAMMC long-term research program “Genetics, biotechnology and breeding for plant biodiversity and innovative technologies”. The study was partially funded as a part of the project “NOBAL Wheat—Breeding Toolbox for a Sustainable Food System in the Nordic-Baltic Region”, which received funding from Iceland, Liechtenstein, and Norway through the EEA Grants, with the Research Council of Lithuania (LMTLT) contract no. S-BMT-21–3 (LT08–2-LMT-K-01–032).
Data Availability Statement
The data presented in this study are available on request from the corresponding author.
Conflicts of Interest
The authors declare no conflicts of interest.
References
- Bottalico, A.; Perrone, G. Toxigenic Fusarium Species and Mycotoxins Associated with Head Blight in Small-Grain Cereals in Europe. European Journal of Plant Pathology 2002, 108, 611–624. [Google Scholar] [CrossRef]
- Parry, D.W.; Jenkinson, P.; McLEOD, L. Fusarium Ear Blight (Scab) in Small Grain Cereals—a Review. Plant Pathology 1995, 44, 207–238. [Google Scholar] [CrossRef]
- Petronaitis, T.; Simpfendorfer, S.; Hüberli, D. Importance of Fusarium Spp. in Wheat to Food Security: A Global Perspective. In Plant Diseases and Food Security in the 21st Century; Scott, P., Strange, R., Korsten, L., Gullino, M.L., Eds.; Springer International Publishing: Cham, 2021; pp. 127–159. ISBN 978-3-030-57899-2. [Google Scholar]
- Edwards, S.G. Influence of Agricultural Practices on Fusarium Infection of Cereals and Subsequent Contamination of Grain by Trichothecene Mycotoxins. Toxicology Letters 2004, 153, 29–35. [Google Scholar] [CrossRef] [PubMed]
- Lori, G.A.; Sisterna, M.N.; Sarandón, S.J.; Rizzo, I.; Chidichimo, H. Fusarium Head Blight in Wheat: Impact of Tillage and Other Agronomic Practices under Natural Infection. Crop Protection 2009, 28, 495–502. [Google Scholar] [CrossRef]
- Lu, Q.; Lillemo, M.; Skinnes, H.; He, X.; Shi, J.; Ji, F.; Dong, Y.; Bjørnstad, A. Anther Extrusion and Plant Height Are Associated with Type I Resistance to Fusarium Head Blight in Bread Wheat Line Shanghai-3/Catbird. Theor Appl Genet 2013, 126, 317–334. [Google Scholar] [CrossRef]
- O’Donnell, K.; Rooney, A.P.; Proctor, R.H.; Brown, D.W.; McCormick, S.P.; Ward, T.J.; Frandsen, R.J.N.; Lysøe, E.; Rehner, S.A.; Aoki, T.; et al. Phylogenetic Analyses of RPB1 and RPB2 Support a Middle Cretaceous Origin for a Clade Comprising All Agriculturally and Medically Important Fusaria. Fungal Genetics and Biology 2013, 52, 20–31. [Google Scholar] [CrossRef]
- Tamburic-Ilincic, L.; Wragg, A.; Schaafsma, A. Mycotoxin Accumulation and Fusarium Graminearum Chemotype Diversity in Winter Wheat Grown in Southwestern Ontario. Can. J. Plant Sci. 2015, 95, 931–938. [Google Scholar] [CrossRef]
- Wegulo, S.N.; Baenziger, P.S.; Hernandez Nopsa, J.; Bockus, W.W.; Hallen-Adams, H. Management of Fusarium Head Blight of Wheat and Barley. Crop Protection 2015, 73, 100–107. [Google Scholar] [CrossRef]
- He, X.; Singh, P.K.; Dreisigacker, S.; Singh, S.; Lillemo, M.; Duveiller, E. Dwarfing Genes Rht-B1b and Rht-D1b Are Associated with Both Type I FHB Susceptibility and Low Anther Extrusion in Two Bread Wheat Populations. PLoS ONE 2016, 11, e0162499. [Google Scholar] [CrossRef]
- Miller, J. Epidemiology of Fusarium Graminearum Diseases of Wheat and Corn; 1994; pp. 19–36. ISBN 978-0-9624407-5-5. [Google Scholar]
- Dill-Macky, R.; Jones, R.K. The Effect of Previous Crop Residues and Tillage on Fusarium Head Blight of Wheat. Plant Disease 2000, 84, 71–76. [Google Scholar] [CrossRef]
- Alisaac, E.; Mahlein, A.-K. Fusarium Head Blight on Wheat: Biology, Modern Detection and Diagnosis and Integrated Disease Management. Toxins 2023, 15, 192. [Google Scholar] [CrossRef]
- Buerstmayr, H.; Ban, T.; Anderson, J.A. QTL Mapping and Marker-Assisted Selection for Fusarium Head Blight Resistance in Wheat: A Review. Plant Breeding 2009, 128, 1–26. [Google Scholar] [CrossRef]
- Mesterházy, Á.; Bartók, T.; Mirocha, C.G.; Komoróczy, R. Nature of Wheat Resistance to Fusarium Head Blight and the Role of Deoxynivalenol for Breeding. Plant Breeding 1999, 118, 97–110. [Google Scholar] [CrossRef]
- Huang, X.; Han, B. Natural Variations and Genome-Wide Association Studies in Crop Plants. Annual Review of Plant Biology 2014, 65, 531–551. [Google Scholar] [CrossRef] [PubMed]
- Paillard, S.; Schnurbusch, T.; Tiwari, R.; Messmer, M.; Winzeler, M.; Keller, B.; Schachermayr, G. QTL Analysis of Resistance to Fusarium Head Blight in Swiss Winter Wheat (Triticum Aestivum L.). Theor Appl Genet 2004, 109, 323–332. [Google Scholar] [CrossRef]
- Mesterházy, A. Types and Components of Resistance to Fusarium Head Blight of Wheat. Plant Breeding 1995, 114, 377–386. [Google Scholar] [CrossRef]
- Ma, H.; Liu, Y.; Zhang, S.; Sha, J.; Sun, Y.; Hu, Z.; Gong, L.; Dai, Y.; Gao, Y.; Wang, Y.; et al. Wheat Resistance to Fusarium Head Blight and Breeding Strategies. Crop Health 2025, 3, 9. [Google Scholar] [CrossRef]
- Mesterhazy, A. What Is Fusarium Head Blight (FHB) Resistance and What Are Its Food Safety Risks in Wheat? Problems and Solutions—A Review. Toxins 2024, 16, 31. [Google Scholar] [CrossRef]
- Buerstmayr, M.; Buerstmayr, H. Comparative Mapping of Quantitative Trait Loci for Fusarium Head Blight Resistance and Anther Retention in the Winter Wheat Population Capo × Arina. Theor Appl Genet 2015, 128, 1519–1530. [Google Scholar] [CrossRef]
- Haile, J.K.; N’Diaye, A.; Walkowiak, S.; Nilsen, K.T.; Clarke, J.M.; Kutcher, H.R.; Steiner, B.; Buerstmayr, H.; Pozniak, C.J. Fusarium Head Blight in Durum Wheat: Recent Status, Breeding Directions, and Future Research Prospects. Phytopathology® 2019, 109, 1664–1675. [Google Scholar] [CrossRef]
- Jones, S.; Farooqi, A.; Foulkes, J.; Sparkes, D.L.; Linforth, R.; Ray, R.V. Canopy and Ear Traits Associated With Avoidance of Fusarium Head Blight in Wheat. Front. Plant Sci. 2018, 9. [Google Scholar] [CrossRef] [PubMed]
- Mesterhazy, A. Updating the Breeding Philosophy of Wheat to Fusarium Head Blight (FHB): Resistance Components, QTL Identification, and Phenotyping—A Review. Plants (Basel) 2020, 9, 1702. [Google Scholar] [CrossRef] [PubMed]
- Jones, S.P.T. The Identification of Physiological Traits in Wheat Confering Passive Resistance to Fusarium Head Blight. Available online: https://eprints.nottingham.ac.uk/28786/ (accessed on 29 May 2025).
- Couture, L. Receptive De Cultivars De Cereals De Printemps A La Contamination Des Graines Sur Inflorescence Par Les Fusarium Spp. Can. J. Plant Sci. 1982, 62, 29–34. [Google Scholar] [CrossRef]
- Hilton; Jenkinson; Hollins; Parry. Relationship between Cultivar Height and Severity of Fusarium Ear Blight in Wheat. Plant Pathology 1999, 48, 202–208. [Google Scholar] [CrossRef]
- Buerstmayr, M.; Buerstmayr, H. The Semidwarfing Alleles Rht-D1b and Rht-B1b Show Marked Differences in Their Associations with Anther-Retention in Wheat Heads and with Fusarium Head Blight Susceptibility. Phytopathology® 2016, 106, 1544–1552. [Google Scholar] [CrossRef]
- Lu, Q.; Szabo-Hever, A.; Bjørnstad, Å.; Lillemo, M.; Semagn, K.; Mesterhazy, A.; Ji, F.; Shi, J.; Skinnes, H. Two Major Resistance Quantitative Trait Loci Are Required to Counteract the Increased Susceptibility to Fusarium Head Blight of the Rht-D1b Dwarfing Gene in Wheat. Crop Science 2011, 51, 2430–2438. [Google Scholar] [CrossRef]
- Srinivasachary, S.; Gosman, N.; Steed, A.; Hollins, T.W.; Bayles, R.; Jennings, P.; Nicholson, P. Semi-Dwarfing Rht-B1 and Rht-D1 Loci of Wheat Differ Significantly in Their Influence on Resistance to Fusarium Head Blight. Theor Appl Genet 2009, 118, 695–702. [Google Scholar] [CrossRef]
- Tessmann, E.W.; Van Sanford, D.A. Associations between Morphological and FHB Traits in a Soft Red Winter Wheat Population. Euphytica 2019, 215, 189. [Google Scholar] [CrossRef]
- Miedaner, T.; Voss, H.-H. Effect of Dwarfing Rht Genes on Fusarium Head Blight Resistance in Two Sets of Near-Isogenic Lines of Wheat and Check Cultivars. Crop Science 2008, 48, 2115–2122. [Google Scholar] [CrossRef]
- Franco, M.F.; Lori, G.A.; Cendoya, G.; Alonso, M.P.; Panelo, J.S.; Malbrán, I.; Mirabella, N.E.; Pontaroli, A.C. Spike Architecture Traits Associated with Type II Resistance to Fusarium Head Blight in Bread Wheat. Euphytica 2021, 217, 209. [Google Scholar] [CrossRef]
- Franco, M.F.; Lori, G.A.; Cendoya, M.G.; Panelo, J.S.; Alonso, M.P.; Mirabella, N.E.; Malbrán, I.; Pontaroli, A.C. Using Anthesis Date as a Covariate to Accurately Assessing Type II Resistance to Fusarium Head Blight in Field-Grown Bread Wheat. Crop Protection 2021, 142, 105504. [Google Scholar] [CrossRef]
- Kubo, K.; Fujita, M.; Kawada, N.; Nakajima, T.; Nakamura, K.; Maejima, H.; Ushiyama, T.; Hatta, K.; Matsunaka, H. Minor Differences in Anther Extrusion Affect Resistance to Fusarium Head Blight in Wheat. Journal of Phytopathology 2013, 161, 308–314. [Google Scholar] [CrossRef]
- Skinnes, H.; Tarkegne, Y.; Dieseth, J.; Bjørnstad, Å. Associations between Anther Extrusion and Fusarium Head Blight in European Wheat. CEREAL RESEARCH COMMUNICATIONS 2008, 36, 223–231. [Google Scholar] [CrossRef]
- Xu, Q.; Xu, F.; Qin, D.; Li, M.; Fedak, G.; Cao, W.; Yang, L.; Dong, J. Molecular Mapping of QTLs Conferring Fusarium Head Blight Resistance in Chinese Wheat Cultivar Jingzhou 66. Plants 2020, 9, 1021. [Google Scholar] [CrossRef]
- McMullen, M.; Bergstrom, G.; De Wolf, E.; Dill-Macky, R.; Hershman, D.; Shaner, G.; Van Sanford, D. A Unified Effort to Fight an Enemy of Wheat and Barley: Fusarium Head Blight. Plant Dis 2012, 96, 1712–1728. [Google Scholar] [CrossRef]
- Gervais, L.; Dedryver, F.; Morlais, J.-Y.; Bodusseau, V.; Negre, S.; Bilous, M.; Groos, C.; Trottet, M. Mapping of Quantitative Trait Loci for Field Resistance to Fusarium Head Blight in an European Winter Wheat. Theor Appl Genet 2003, 106, 961–970. [Google Scholar] [CrossRef]
- Miedaner, T.; Flamm, C.; Oberforster, M. The Importance of Fusarium Head Blight Resistance in the Cereal Breeding Industry: Case Studies from Germany and Austria. Plant Breeding 2024, 143, 44–58. [Google Scholar] [CrossRef]
- Skinnes, H.; Semagn, K.; Tarkegne, Y.; Marøy, A.G.; Bjørnstad, Å. The Inheritance of Anther Extrusion in Hexaploid Wheat and Its Relationship to Fusarium Head Blight Resistance and Deoxynivalenol Content. Plant Breeding 2010, 129, 149–155. [Google Scholar] [CrossRef]
- Syed, S.; Aleliūnas, A.; Lillemo, M.; Gorash, A. Analyses of Wheat Resistance to Fusarium Head Blight Using Different Inoculation Methods. Agronomy 2024, 14, 2415. [Google Scholar] [CrossRef]
- Syed, S.; Aleliūnas, A.; Armonienė, R.; Brazauskas, G.; Gorash, A. GWAS Analysis of Fusarium Head Blight Resistance in a Nordic-Baltic Spring Wheat Panel. Front. Plant Sci. 2025, 16. [Google Scholar] [CrossRef]
- Bissonnette, K. Scouting for Fusarium Head Blight (FHB) and Harvest Considerations; 2019. [Google Scholar]
- Osman, M.; He, X.; Singh, R.P.; Duveiller, E.; Lillemo, M.; Pereyra, S.A.; Westerdijk-Hoks, I.; Kurushima, M.; Yau, S.-K.; Benedettelli, S.; et al. Phenotypic and Genotypic Characterization of CIMMYT’s 15th International Fusarium Head Blight Screening Nursery of Wheat. Euphytica 2015, 205, 521–537. [Google Scholar] [CrossRef]
- R: Epsilon-Squared. Available online: https://search.r-project.org/CRAN/refmans/rcompanion/html/epsilonSquared.html (accessed on 3 September 2025).
- Alvarado, G.; Rodríguez, F.M.; Pacheco, A.; Burgueño, J.; Crossa, J.; Vargas, M.; Pérez-Rodríguez, P.; Lopez-Cruz, M.A. META-R: A Software to Analyze Data from Multi-Environment Plant Breeding Trials. The Crop Journal 2020, 8, 745–756. [Google Scholar] [CrossRef]
- Olivoto, T.; Lúcio, A.D. Metan: An R Package for Multi-Environment Trial Analysis. Methods in Ecology and Evolution 2020, 11, 783–789. [Google Scholar] [CrossRef]
- Wright, M.N.; Ziegler, A. Ranger: A Fast Implementation of Random Forests for High Dimensional Data in C++ and R. Journal of Statistical Software 2017, 77, 1–17. [Google Scholar] [CrossRef]
- Breiman, L. Random Forests. Machine Learning 2001, 45, 5–32. [Google Scholar] [CrossRef]
- Altmann, A.; Toloşi, L.; Sander, O.; Lengauer, T. Permutation Importance: A Corrected Feature Importance Measure. Bioinformatics 2010, 26, 1340–1347. [Google Scholar] [CrossRef] [PubMed]
- Buerstmayr, M.; Steiner, B.; Buerstmayr, H. Breeding for Fusarium Head Blight Resistance in Wheat—Progress and Challenges. Plant Breeding 2020, 139, 429–454. [Google Scholar] [CrossRef]
- Miedaner, T.; Sieber, A.-N.; Desaint, H.; Buerstmayr, H.; Longin, C.F.H.; Würschum, T. The Potential of Genomic-Assisted Breeding to Improve Fusarium Head Blight Resistance in Winter Durum Wheat. Plant Breeding 2017, 136, 610–619. [Google Scholar] [CrossRef]
- Moreno-Amores, J.; Michel, S.; Miedaner, T.; Longin, C.F.H.; Buerstmayr, H. Genomic Predictions for Fusarium Head Blight Resistance in a Diverse Durum Wheat Panel: An Effective Incorporation of Plant Height and Heading Date as Covariates. Euphytica 2020, 216, 22. [Google Scholar] [CrossRef]
- Liu, S.; Abate, Z.A.; Lu, H.; Musket, T.; Davis, G.L.; McKendry, A.L. QTL Associated with Fusarium Head Blight Resistance in the Soft Red Winter Wheat Ernie. Theor Appl Genet 2007, 115, 417–427. [Google Scholar] [CrossRef]
- Somers, D.J.; Fedak, G.; Savard, M. Molecular Mapping of Novel Genes Controlling Fusarium Head Blight Resistance and Deoxynivalenol Accumulation in Spring Wheat. Genome 2003, 46, 555–564. [Google Scholar] [CrossRef]
- Pirgozliev, S.R.; Edwards, S.G.; Hare, M.C.; Jenkinson, P. Strategies for the Control of Fusarium Head Blight in Cereals. European Journal of Plant Pathology 2003, 109, 731–742. [Google Scholar] [CrossRef]
- Salgado, J.D.; Madden, L.V.; Paul, P.A. Quantifying the Effects of Fusarium Head Blight on Grain Yield and Test Weight in Soft Red Winter Wheat. Phytopathology® 2015, 105, 295–306. [Google Scholar] [CrossRef]
- Spanic, V.; Cosic, J.; Zdunic, Z.; Drezner, G. Characterization of Agronomical and Quality Traits of Winter Wheat (Triticum Aestivum L.) for Fusarium Head Blight Pressure in Different Environments. Agronomy 2021, 11, 213. [Google Scholar] [CrossRef]
- Semagn, K.; Henriquez, M.A.; Iqbal, M.; Brûlé-Babel, A.L.; Strenzke, K.; Ciechanowska, I.; Navabi, A.; N’Diaye, A.; Pozniak, C.; Spaner, D. Identification of Fusarium Head Blight Sources of Resistance and Associated QTLs in Historical and Modern Canadian Spring Wheat. Front. Plant Sci. 2023, 14. [Google Scholar] [CrossRef]
- Slafer, G.A. Physiology of Determination of Major Wheat Yield Components. In Proceedings of the Wheat Production in Stressed Environments; Buck, H.T., Nisi, J.E., Salomón, N., Eds.; Springer Netherlands: Dordrecht, 2007; pp. 557–565. [Google Scholar]
- Faris, J.D.; Zhang, Z.; Garvin, D.F.; Xu, S.S. Molecular and Comparative Mapping of Genes Governing Spike Compactness from Wild Emmer Wheat. Mol Genet Genomics 2014, 289, 641–651. [Google Scholar] [CrossRef] [PubMed]
- Xu, Y.-F.; Ma, F.-F.; Zhang, J.-P.; Liu, H.; Li, L.-H.; An, D.-G. Unraveling the Genetic Basis of Grain Number-Related Traits in a Wheat-Agropyron Cristatum Introgressed Line through High-Resolution Linkage Mapping. BMC Plant Biology 2023, 23, 563. [Google Scholar] [CrossRef] [PubMed]
- Nemati, M.; Hokmalipour, S. The Study of the Relationship Between Traits and Resistance to Fusarium Head Blight (FHB) in Spring Wheat Genotypes. 2012. [Google Scholar]
- Steiner, B.; Lemmens, M.; Griesser, M.; Scholz, U.; Schondelmaier, J.; Buerstmayr, H. Molecular Mapping of Resistance to Fusarium Head Blight in the Spring Wheat Cultivar Frontana. Theor Appl Genet 2004, 109, 215–224. [Google Scholar] [CrossRef]
- Buerstmayr, M.; Lemmens, M.; Steiner, B.; Buerstmayr, H. Advanced Backcross QTL Mapping of Resistance to Fusarium Head Blight and Plant Morphological Traits in a Triticum Macha × T. Aestivum Population. Theor Appl Genet 2011, 123, 293–306. [Google Scholar] [CrossRef]
- Giancaspro, A.; Giove, S.L.; Zito, D.; Blanco, A.; Gadaleta, A. Mapping QTLs for Fusarium Head Blight Resistance in an Interspecific Wheat Population. Front. Plant Sci. 2016, 7. [Google Scholar] [CrossRef] [PubMed]
- Aleliūnas, A.; Gorash, A.; Armonienė, R.; Tamm, I.; Ingver, A.; Bleidere, M.; Fetere, V.; Kollist, H.; Mroz, T.; Lillemo, M.; et al. Genome-Wide Association Study Reveals 18 QTL for Major Agronomic Traits in a Nordic–Baltic Spring Wheat Germplasm. Front. Plant Sci. 2024, 15. [Google Scholar] [CrossRef] [PubMed]
- Zanke, C.D.; Ling, J.; Plieske, J.; Kollers, S.; Ebmeyer, E.; Korzun, V.; Argillier, O.; Stiewe, G.; Hinze, M.; Neumann, K.; et al. Whole Genome Association Mapping of Plant Height in Winter Wheat (Triticum Aestivum L.). PLOS ONE 2014, 9, e113287. [Google Scholar] [CrossRef]
- Buerstmayr, M.; Buerstmayr, H. The Effect of the Rht1 Haplotype on Fusarium Head Blight Resistance in Relation to Type and Level of Background Resistance and in Combination with Fhb1 and Qfhs.Ifa-5A. Theor Appl Genet 2022, 135, 1985–1996. [Google Scholar] [CrossRef] [PubMed]
- Steiner, B.; Buerstmayr, M.; Michel, S.; Schweiger, W.; Lemmens, M.; Buerstmayr, H. Breeding Strategies and Advances in Line Selection for Fusarium Head Blight Resistance in Wheat. Trop. plant pathol. 2017, 42, 165–174. [Google Scholar] [CrossRef]
- Del Ponte, E.M.; Fernandes, J.M.C.; Pierobom, C.R. Factors Affecting Density of Airborne Gibberella Zeae Inoculum. Fitopatol. bras. 2005, 30, 55–60. [Google Scholar] [CrossRef]
- Reis, E.M.; Zoldan, S.M.; Zanata, M. Interactions between Temperature and Wheat Head Wetting Duration on Fusarium Head Blight Intensity. Summa phytopathol. 2023, 49, e268908. [Google Scholar] [CrossRef]
- Louppe, G. Understanding Random Forests: From Theory to Practice 2015.
- Goldstein, B.A.; Polley, E.C.; Briggs, F.B.S. Random Forests for Genetic Association Studies - PMC. Available online: https://pmc.ncbi.nlm.nih.gov/articles/PMC3154091/ (accessed on 9 December 2025).
- Salman, H.A.; Kalakech, A.; Steiti, A. Random Forest Algorithm Overview. Babylonian Journal of Machine Learning 2024, 2024, 69–79. [Google Scholar] [CrossRef]
- Verges, V.L.; Lyerly, Jeanette; Dong, Y.; Sanford, D.A.V. Frontiers | Training Population Design With the Use of Regional Fusarium Head Blight Nurseries to Predict Independent Breeding Lines for FHB Traits. Available online: https://www.frontiersin.org/journals/plant-science/articles/10.3389/fpls.2020.01083/full (accessed on 8 December 2025).
- Thapa, S.; Gill, H.S.; Halder, J.; Rana, A.; Ali, S.; Maimaitijiang, M.; Gill, U.; Bernardo, A.; St. Amand, P.; Bai, G.; et al. Integrating Genomics, Phenomics, and Deep Learning Improves the Predictive Ability for Fusarium Head Blight–Related Traits in Winter Wheat. The Plant Genome 2024, 17, e20470. [Google Scholar] [CrossRef]
- Liu, Y.; Salsman, E.; Fiedler, J.D.; Hegstad, J.B.; Green, A.; Mergoum, M.; Zhong, S.; Li, X. Genetic Mapping and Prediction Analysis of FHB Resistance in a Hard Red Spring Wheat Breeding Population. Front. Plant Sci. 2019, 10. [Google Scholar] [CrossRef]
- Zhang, L.; Luo, P.; Ren, Z.; Zhang, H. Controlling Fusarium Head Blight of Wheat (Triticum Aestivum L.) with Genetics. ABB 2011, 02, 263–270. [Google Scholar] [CrossRef]
- Schulthess, A.W.; Zhao, Y.; Longin, C.F.H.; Reif, J.C. Advantages and Limitations of Multiple-Trait Genomic Prediction for Fusarium Head Blight Severity in Hybrid Wheat (Triticum Aestivum L.). Theor Appl Genet 2018, 131, 685–701. [Google Scholar] [CrossRef]
- Morales, L.; Akdemir, D.; Girard, A.-L.; Neumayer, A.; Reddy Nannuru, V.K.; Shahinnia, F.; Stadlmeier, M.; Hartl, L.; Holzapfel, J.; Isidro-Sánchez, J.; et al. Leveraging Trait and QTL Covariates to Improve Genomic Prediction of Resistance to Fusarium Head Blight in Central European Winter Wheat. Front. Plant Sci. 2024, 15. [Google Scholar] [CrossRef]
- Moreno-Amores, J.; Michel, S.; Löschenberger, F.; Buerstmayr, H. Dissecting the Contribution of Environmental Influences, Plant Phenology, and Disease Resistance to Improving Genomic Predictions for Fusarium Head Blight Resistance in Wheat. Agronomy 2020, 10. [Google Scholar] [CrossRef]
Figure 1.
Precipitation and temperature trend during heading and flowering stages during the year 2022 (a) and 2023 (b).
Figure 1.
Precipitation and temperature trend during heading and flowering stages during the year 2022 (a) and 2023 (b).
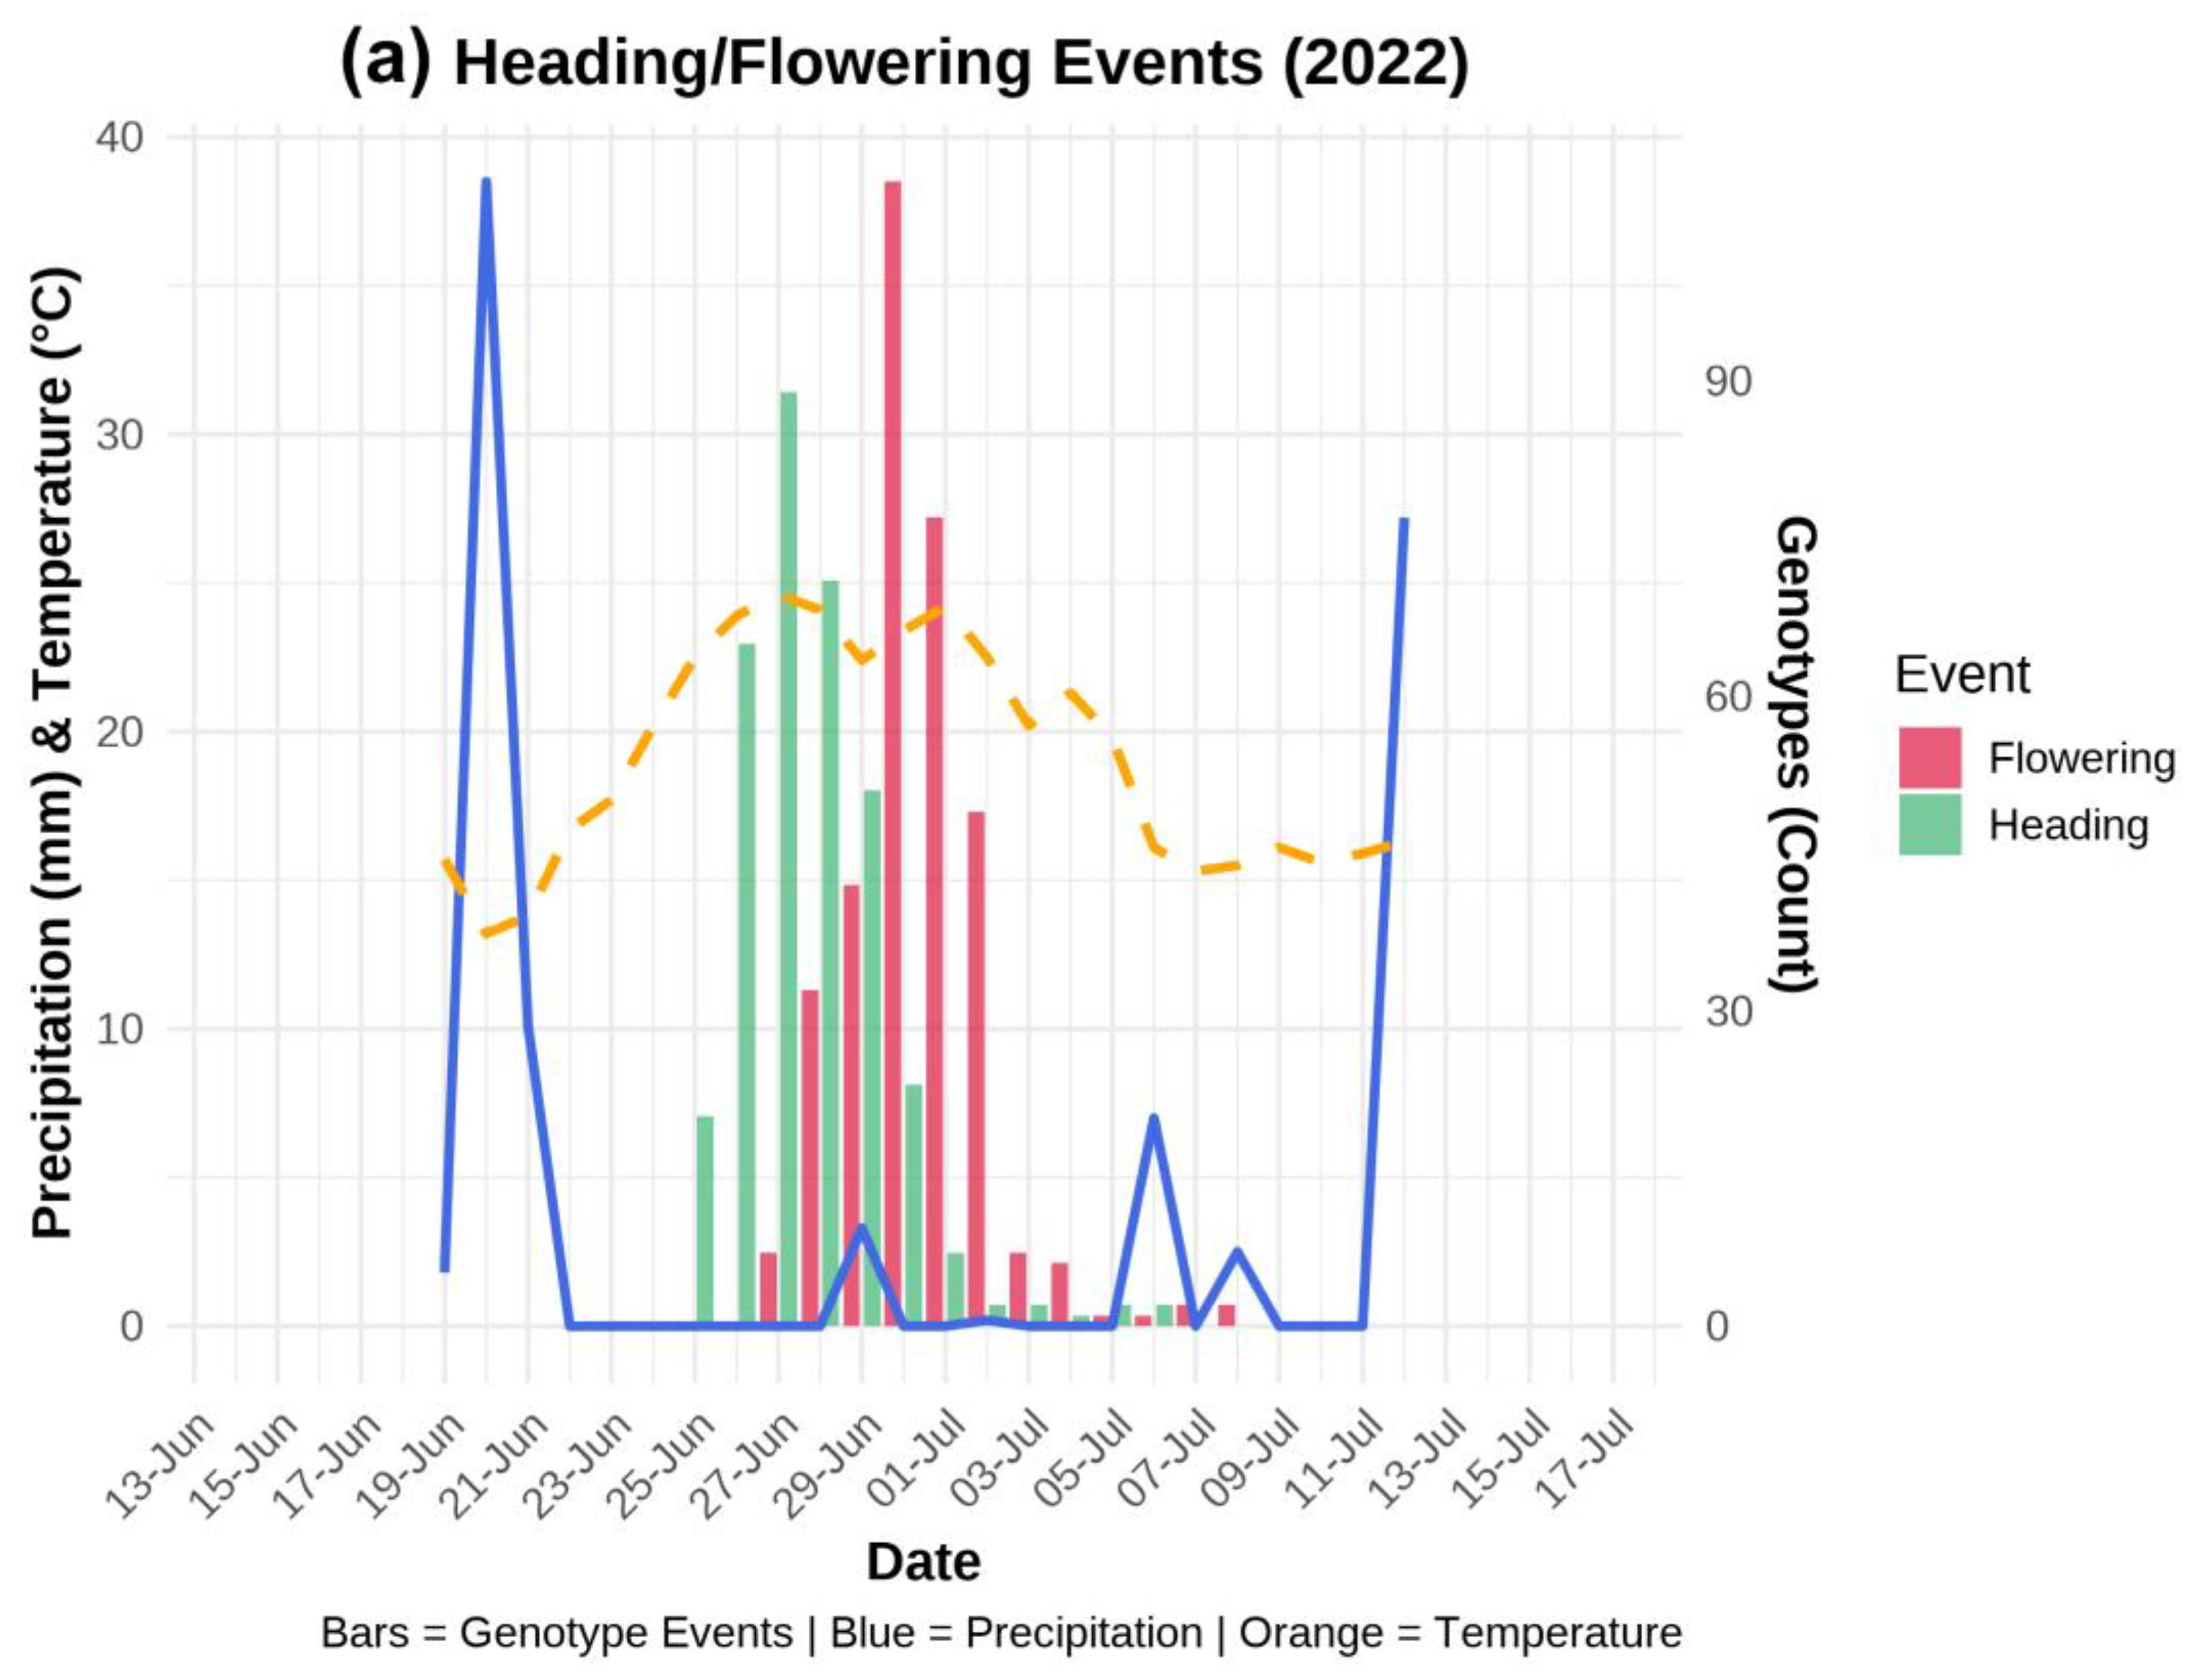
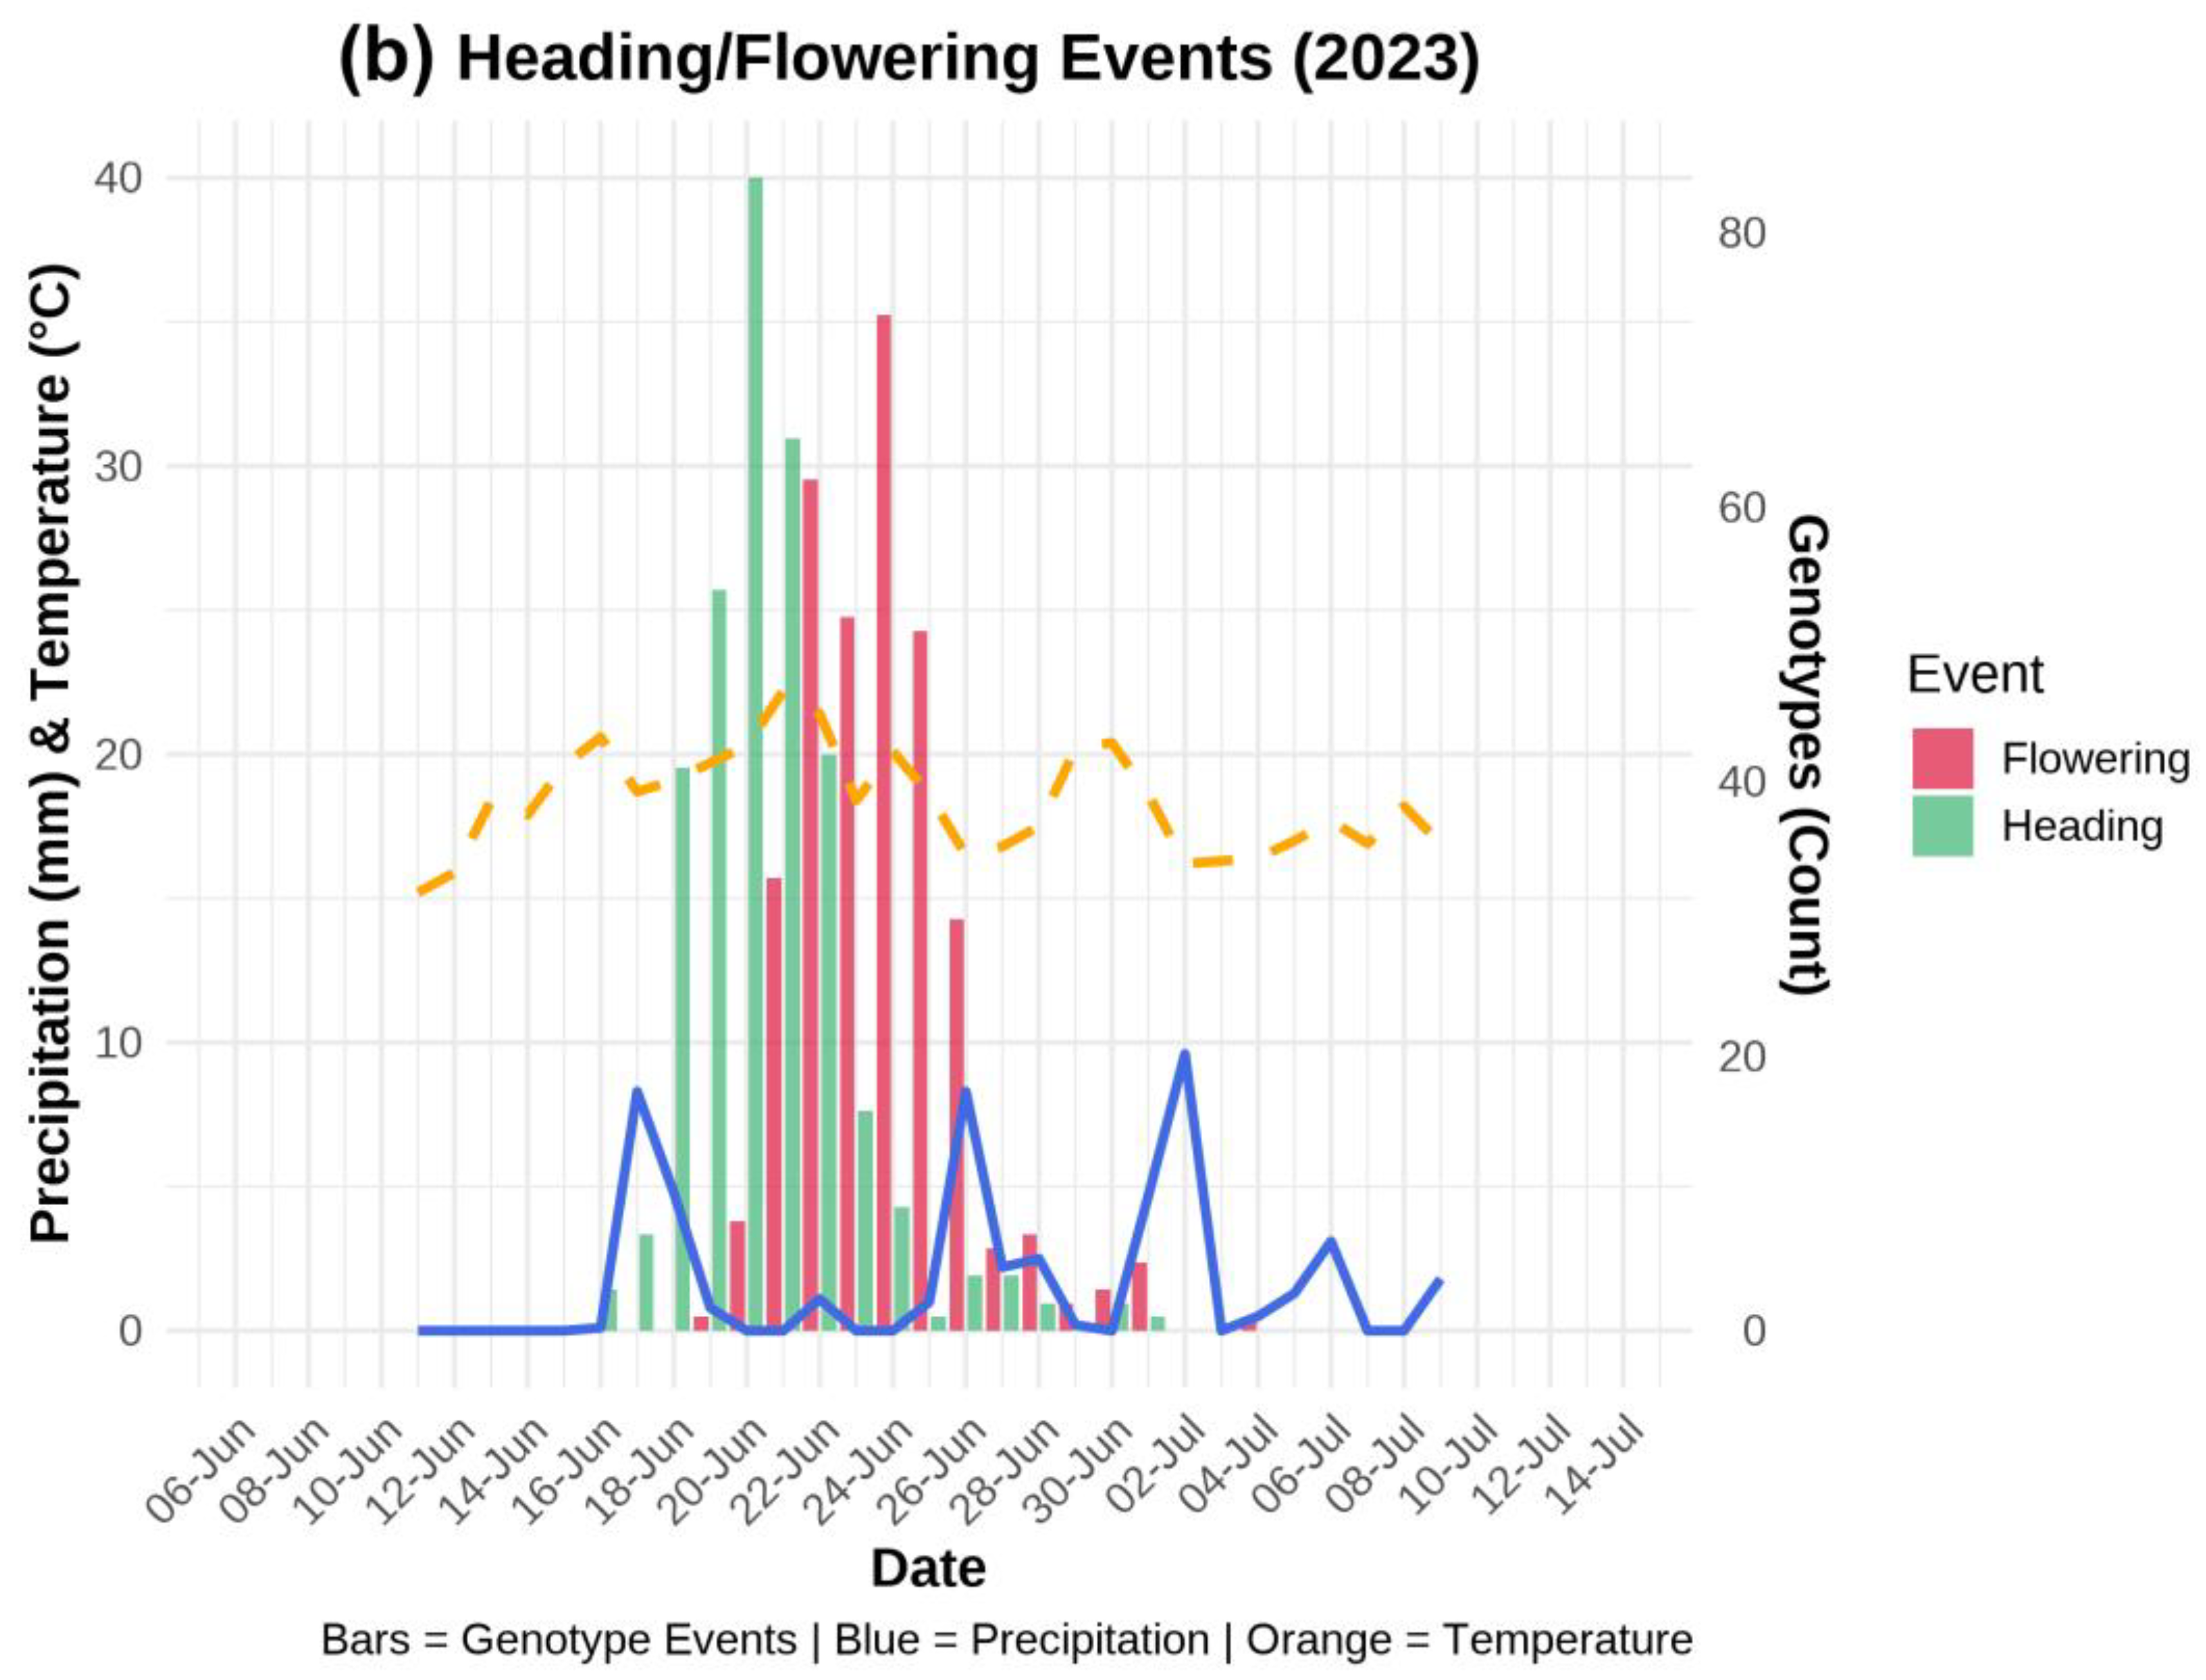
Figure 2.
Correlation analysis between morpho-phenological and FHB severity (BLUEs) across three years.
Figure 2.
Correlation analysis between morpho-phenological and FHB severity (BLUEs) across three years.
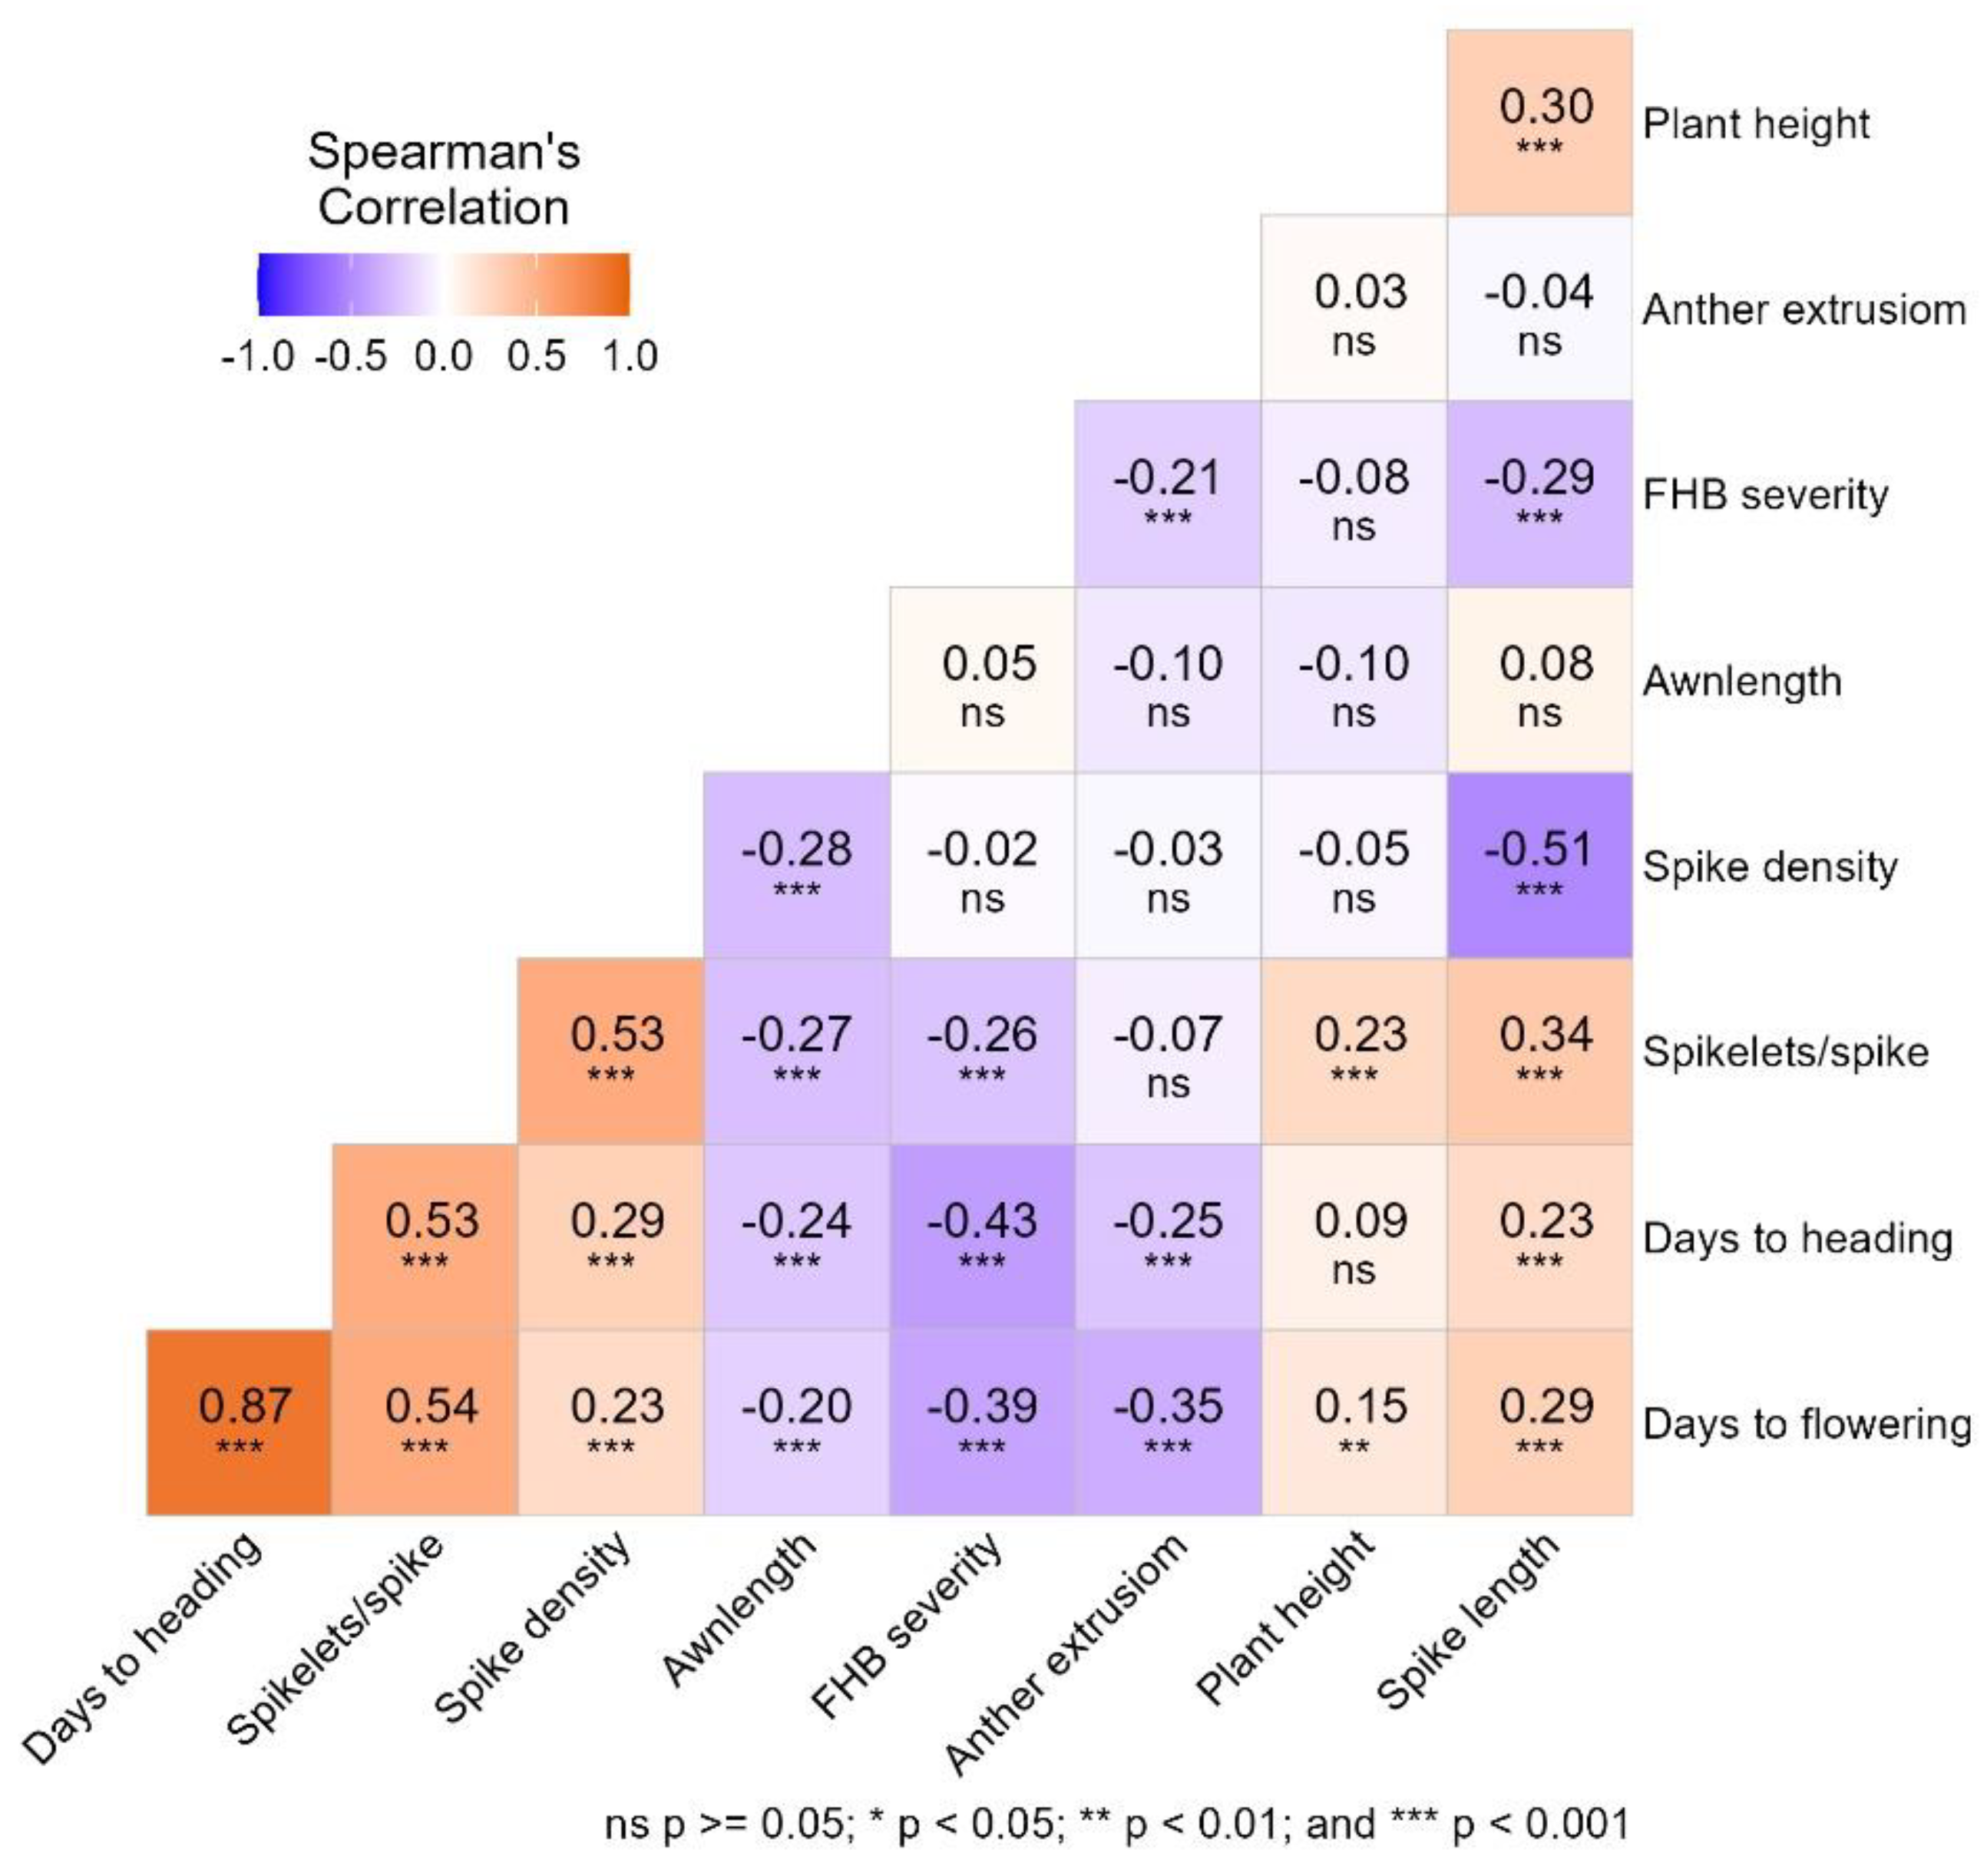
Figure 3.
Illustration of violin plots showing distribution of genotypes according to their (a) height (cm) and, (b) FHB severity across different Rht groups. Different letters (a, b or ab) above each violin plot represent significant differences between the groups at p < 0.05.
Figure 3.
Illustration of violin plots showing distribution of genotypes according to their (a) height (cm) and, (b) FHB severity across different Rht groups. Different letters (a, b or ab) above each violin plot represent significant differences between the groups at p < 0.05.
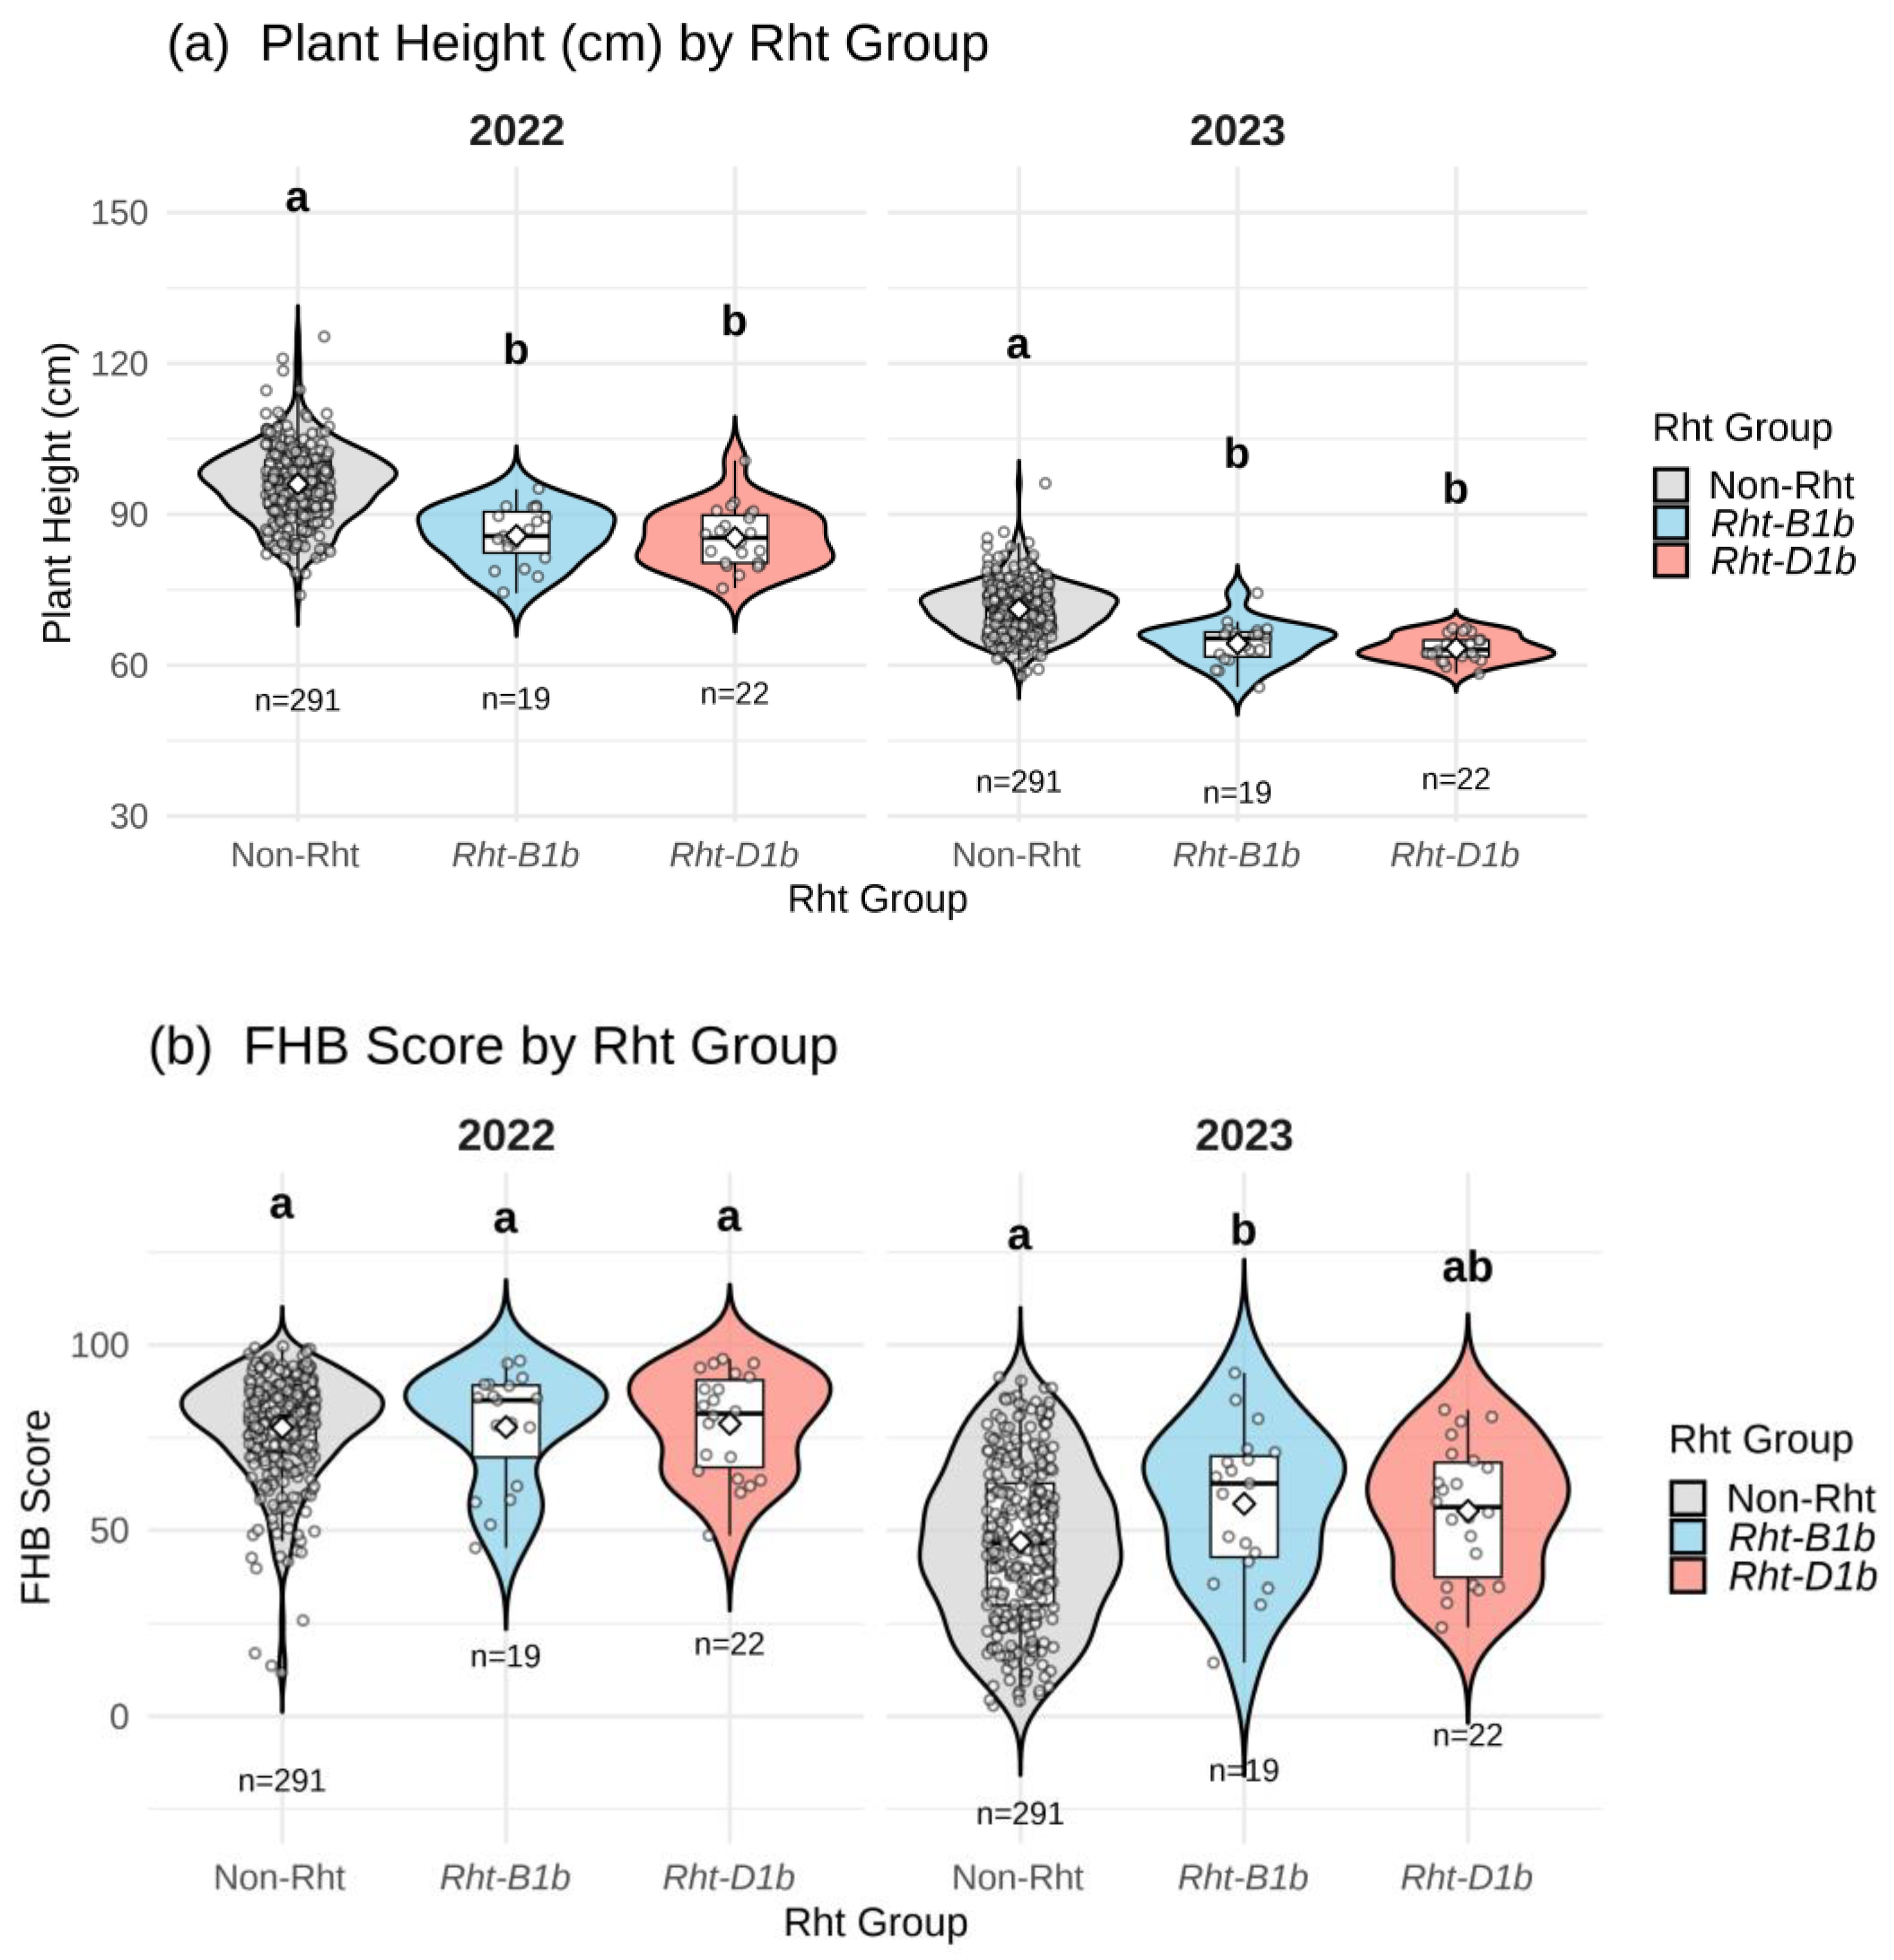
Figure 4.
Prediction of FHB severity from eight morpho-phenological traits. (a) demonstrates prediction of resistance across morpho-phenological traits on the basis of 2023. (b) graph represents prediction on the basis of 2022-2023 phenotypic data. Random forest regression repeated 100 times, 80/20 cross-validation. Notes: r – Person correlation between predicted and observed values; RMSE – root mean squared error; n – number of genotypes; Optimal mtry – optimal number of morpho-phenological traits for prediction; SDpredicted – standard deviation in predicted values; SDobserved – standard deviation in observed values.
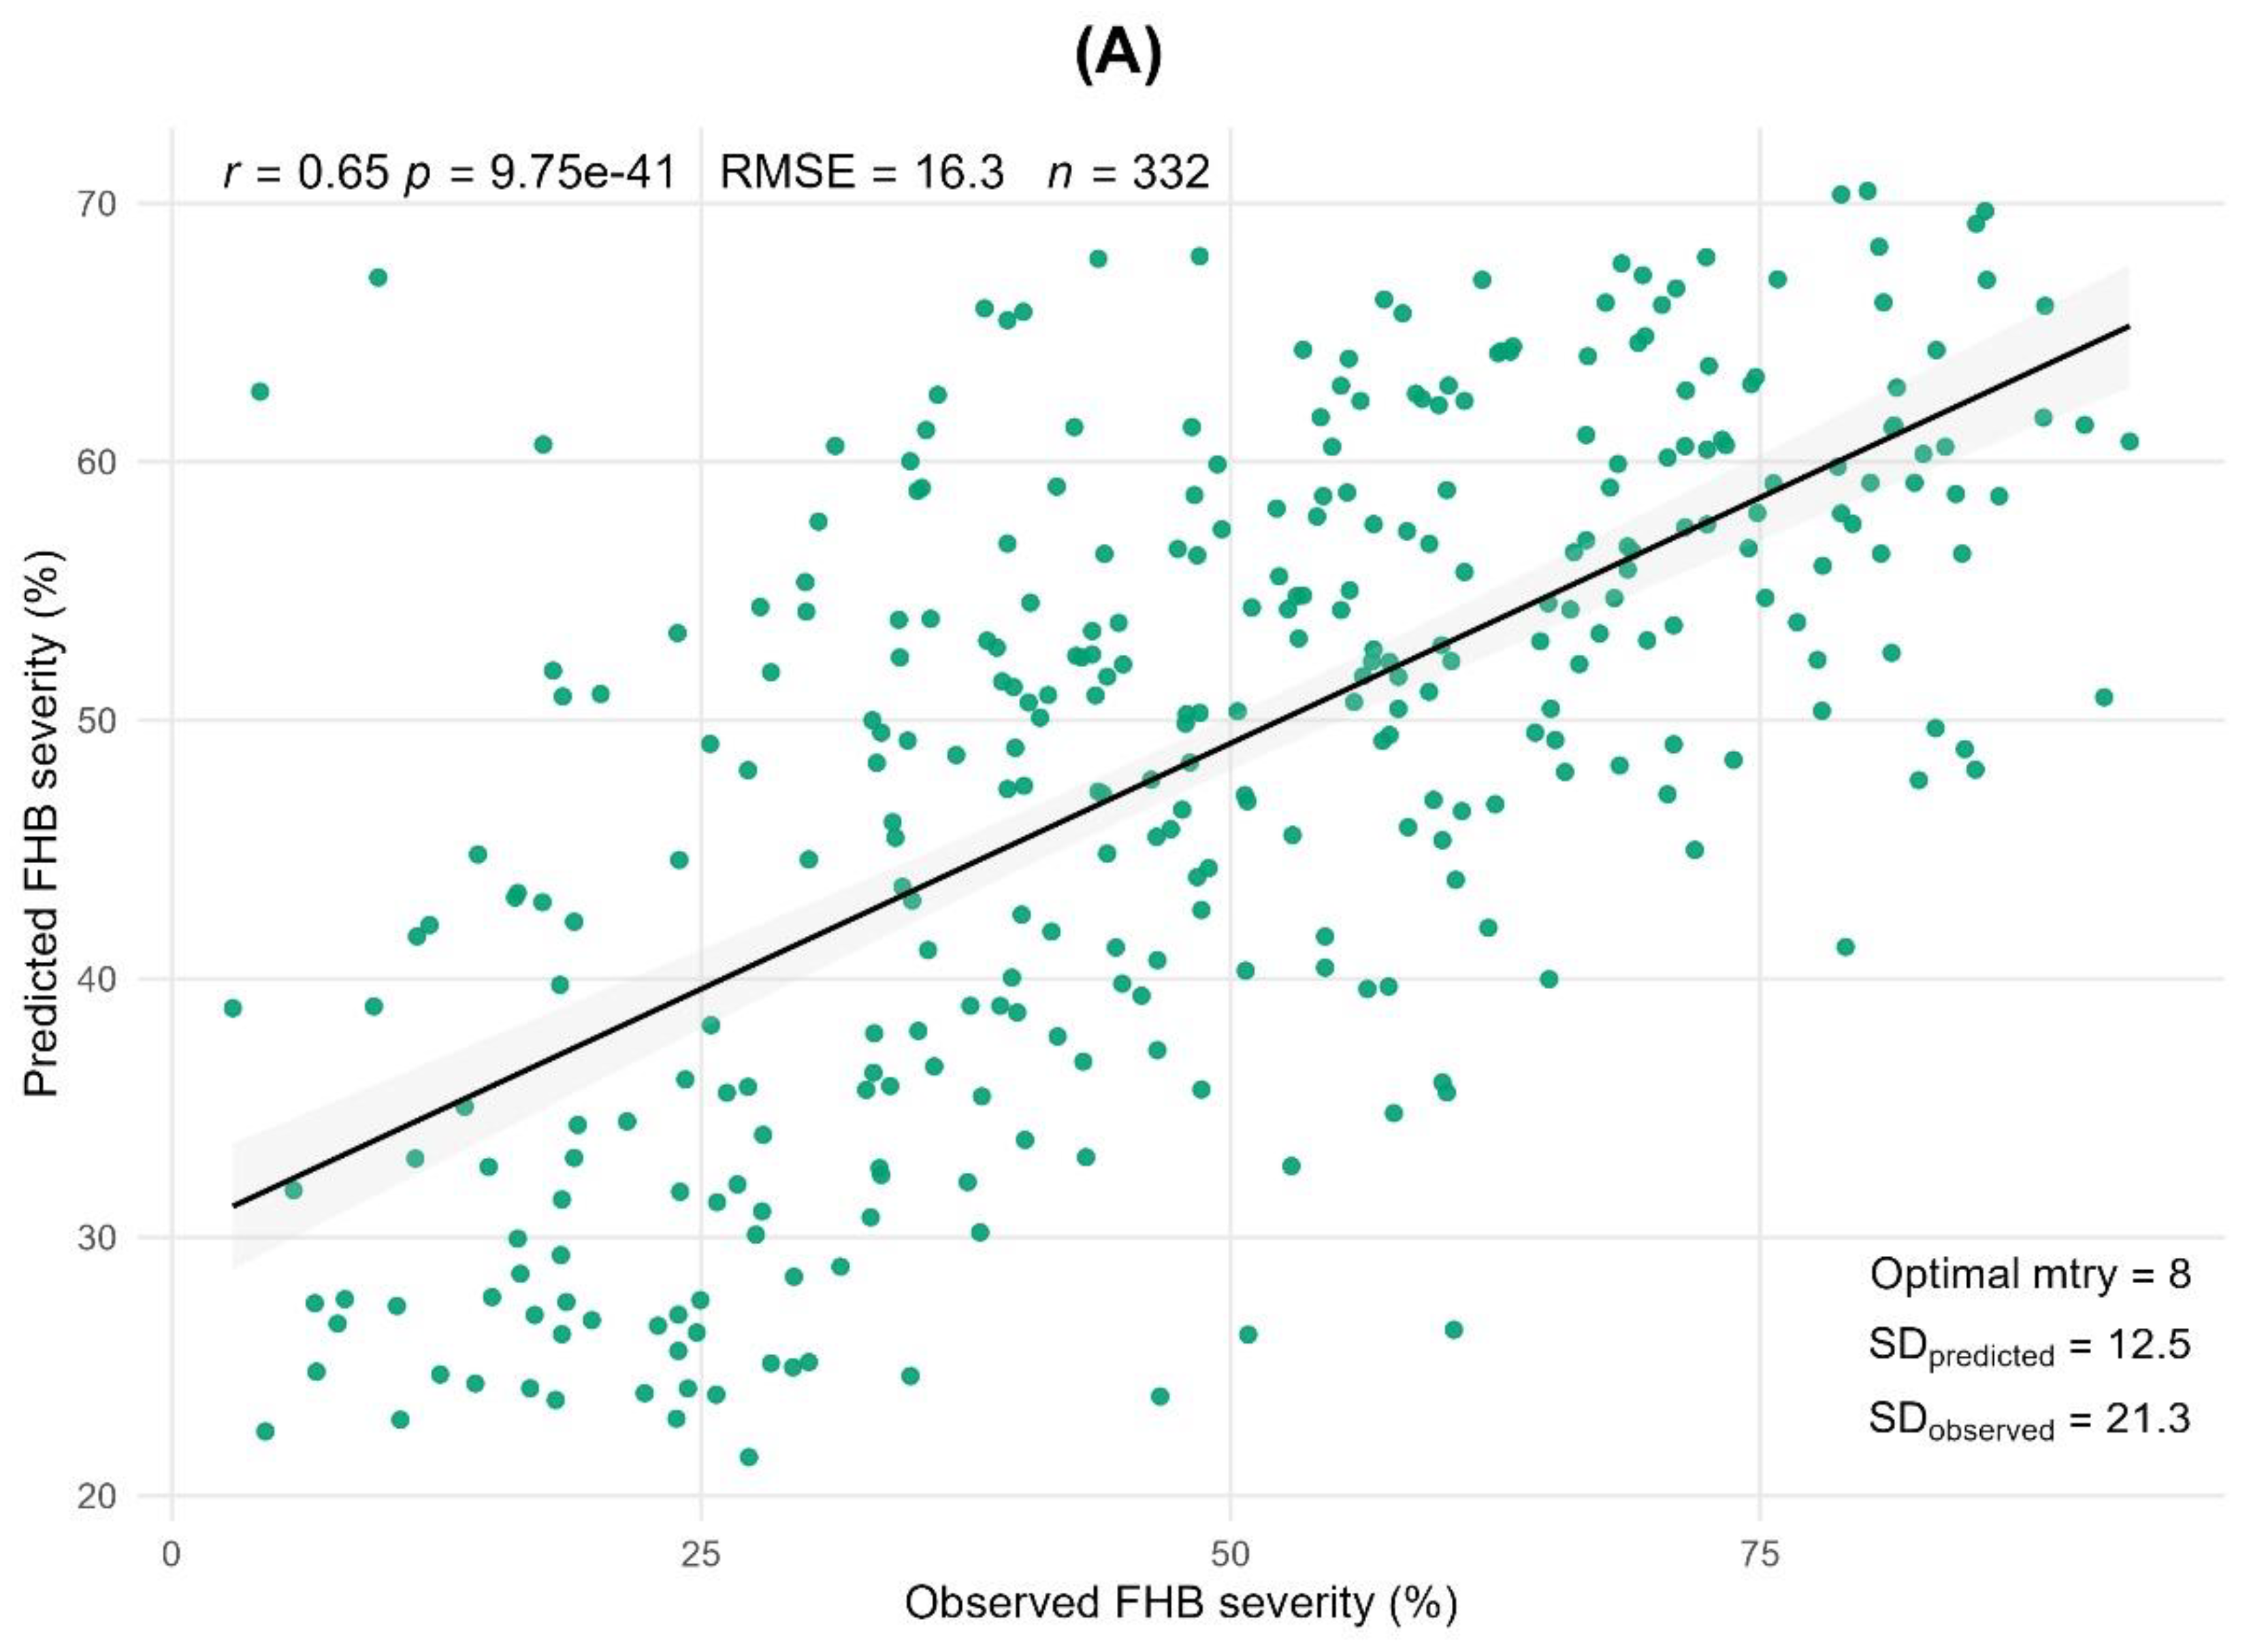
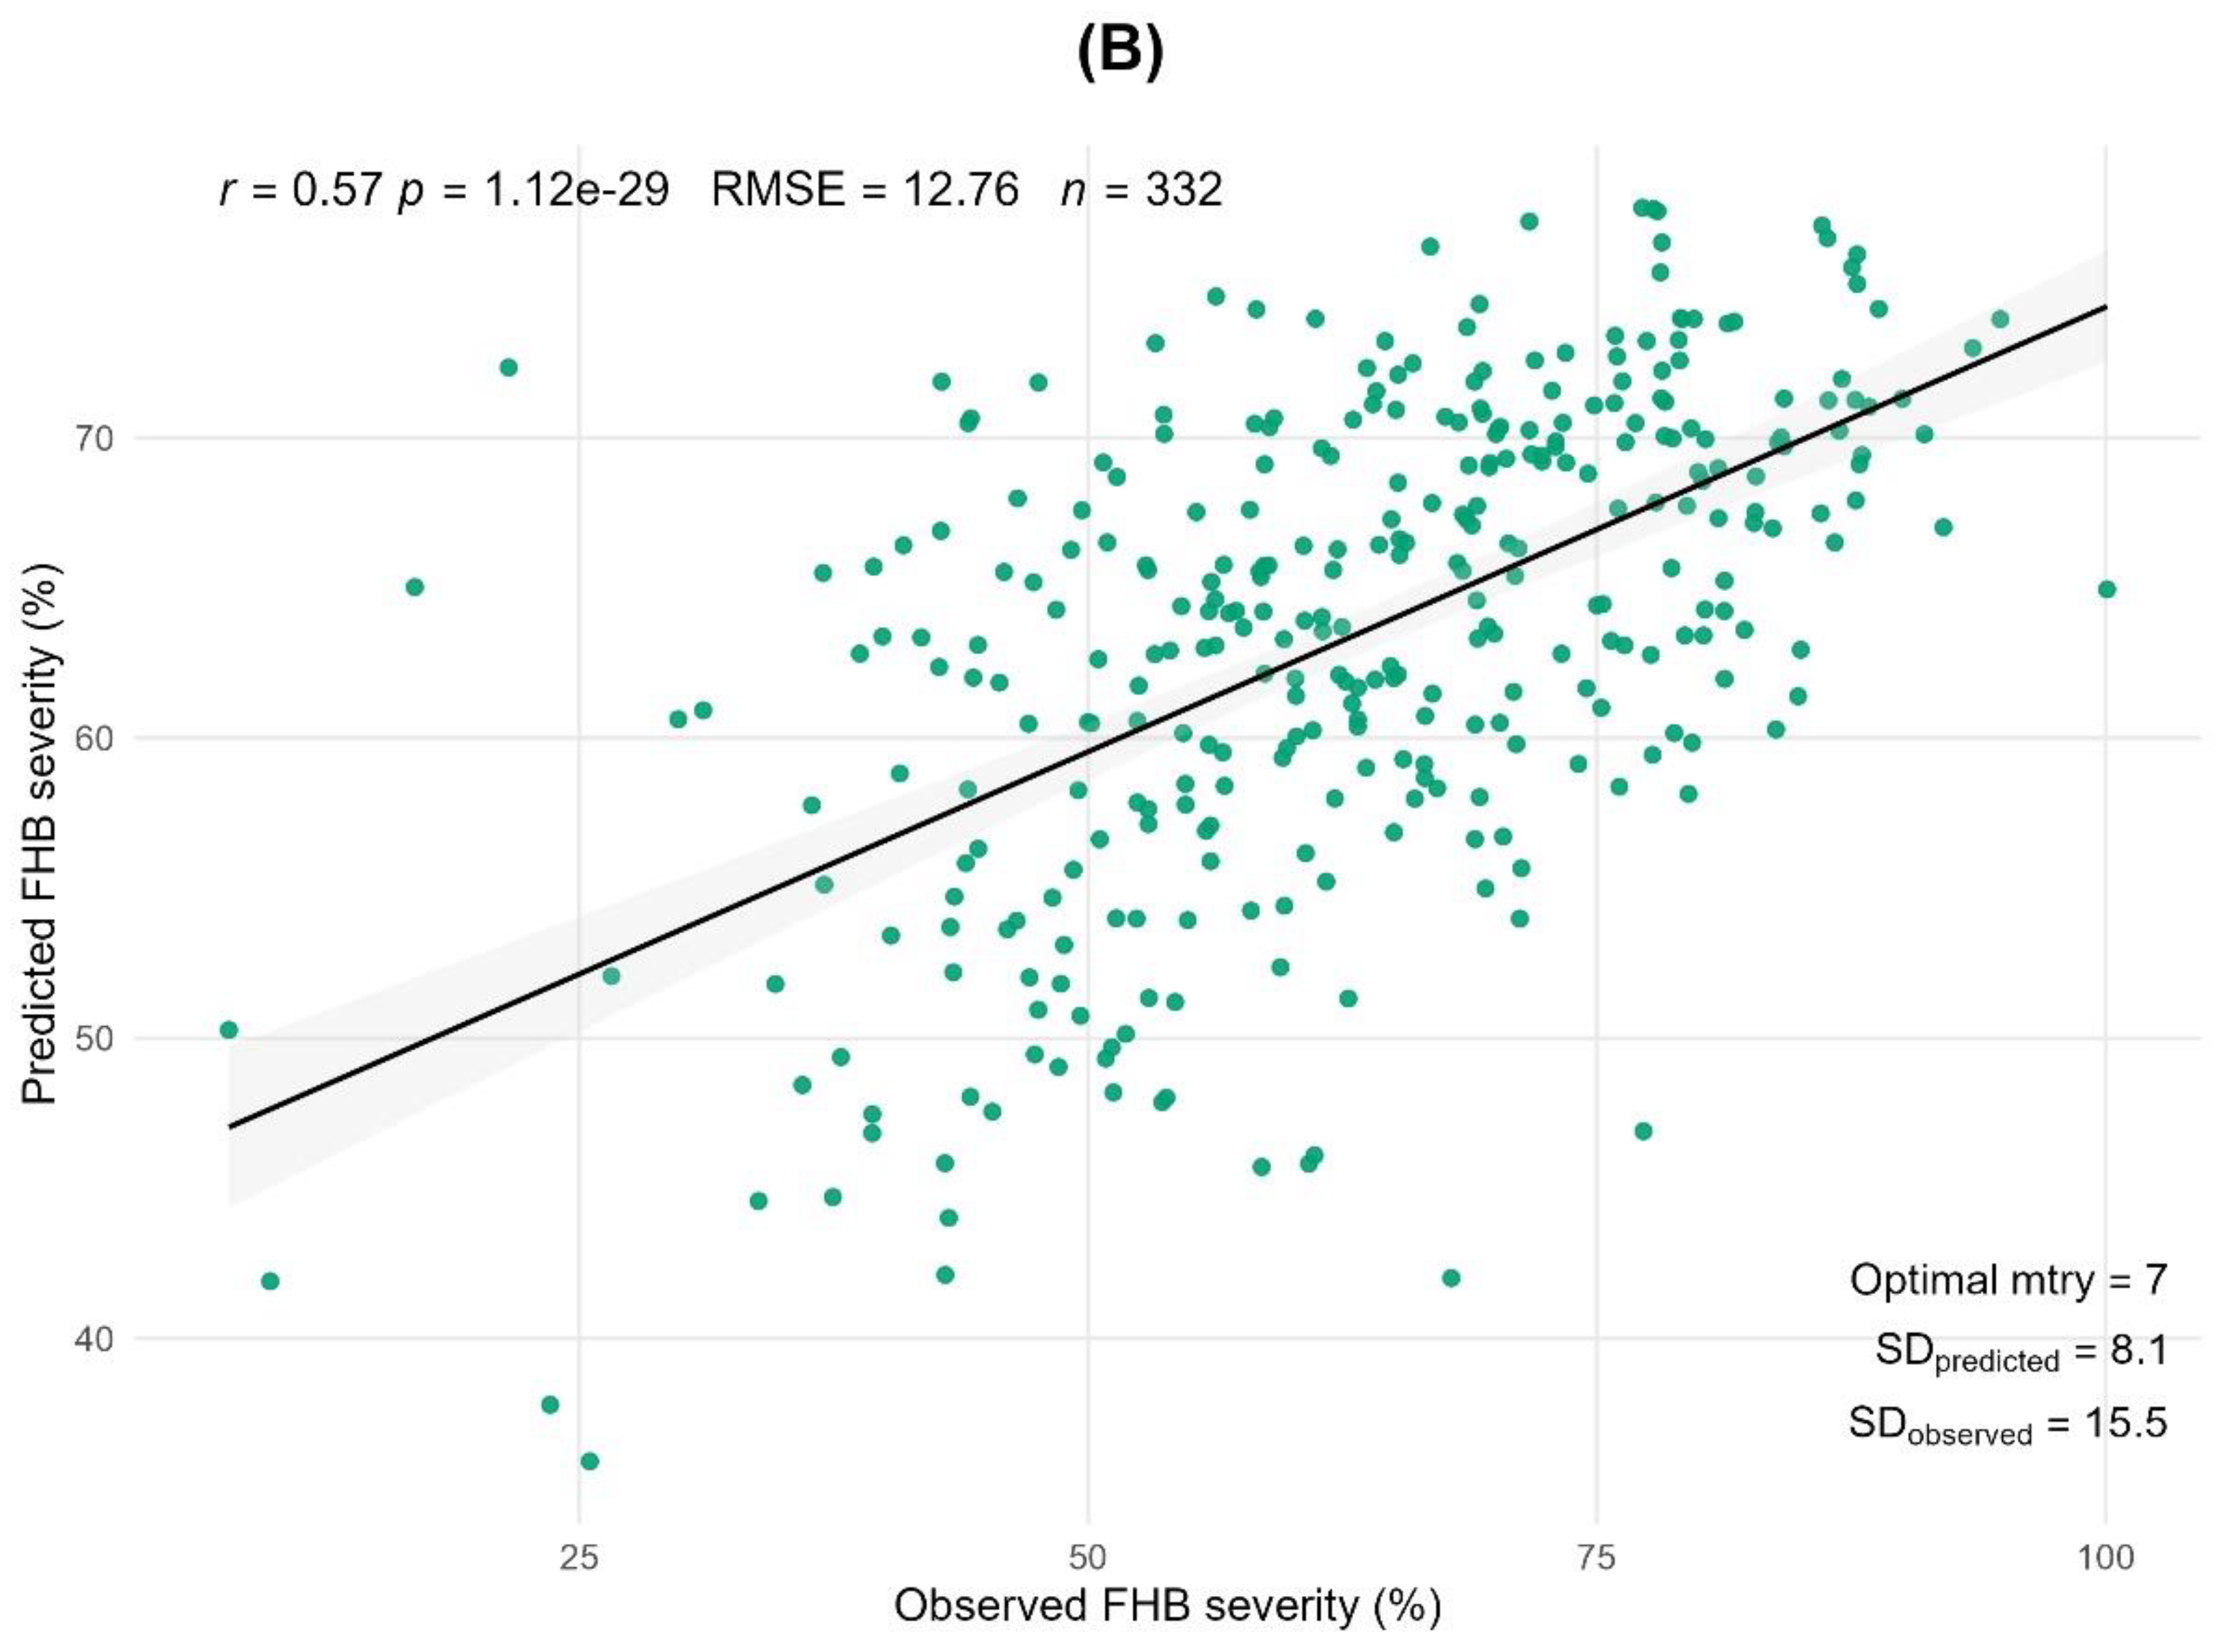
Figure 5.
Importance of morpho-phenological traits computed using a random forest regression model. (a) importance determined on the basis of 2023 phenotypic BLUEs data. (b) importance computed on the basis of 2022-2023 phenotypic BLUEs data. The importance was assessed using the permutation importance of 2000 trees. Statistical significance was determined using the permutation-based method of Altmann (200 permutations). Whiskers above the bars demonstrate the standard error among 30 independent, random runs. Significance levels: *** p < 0.001, ** p < 0.01, * p < 0.05 – according to the Altman permutation test [51].
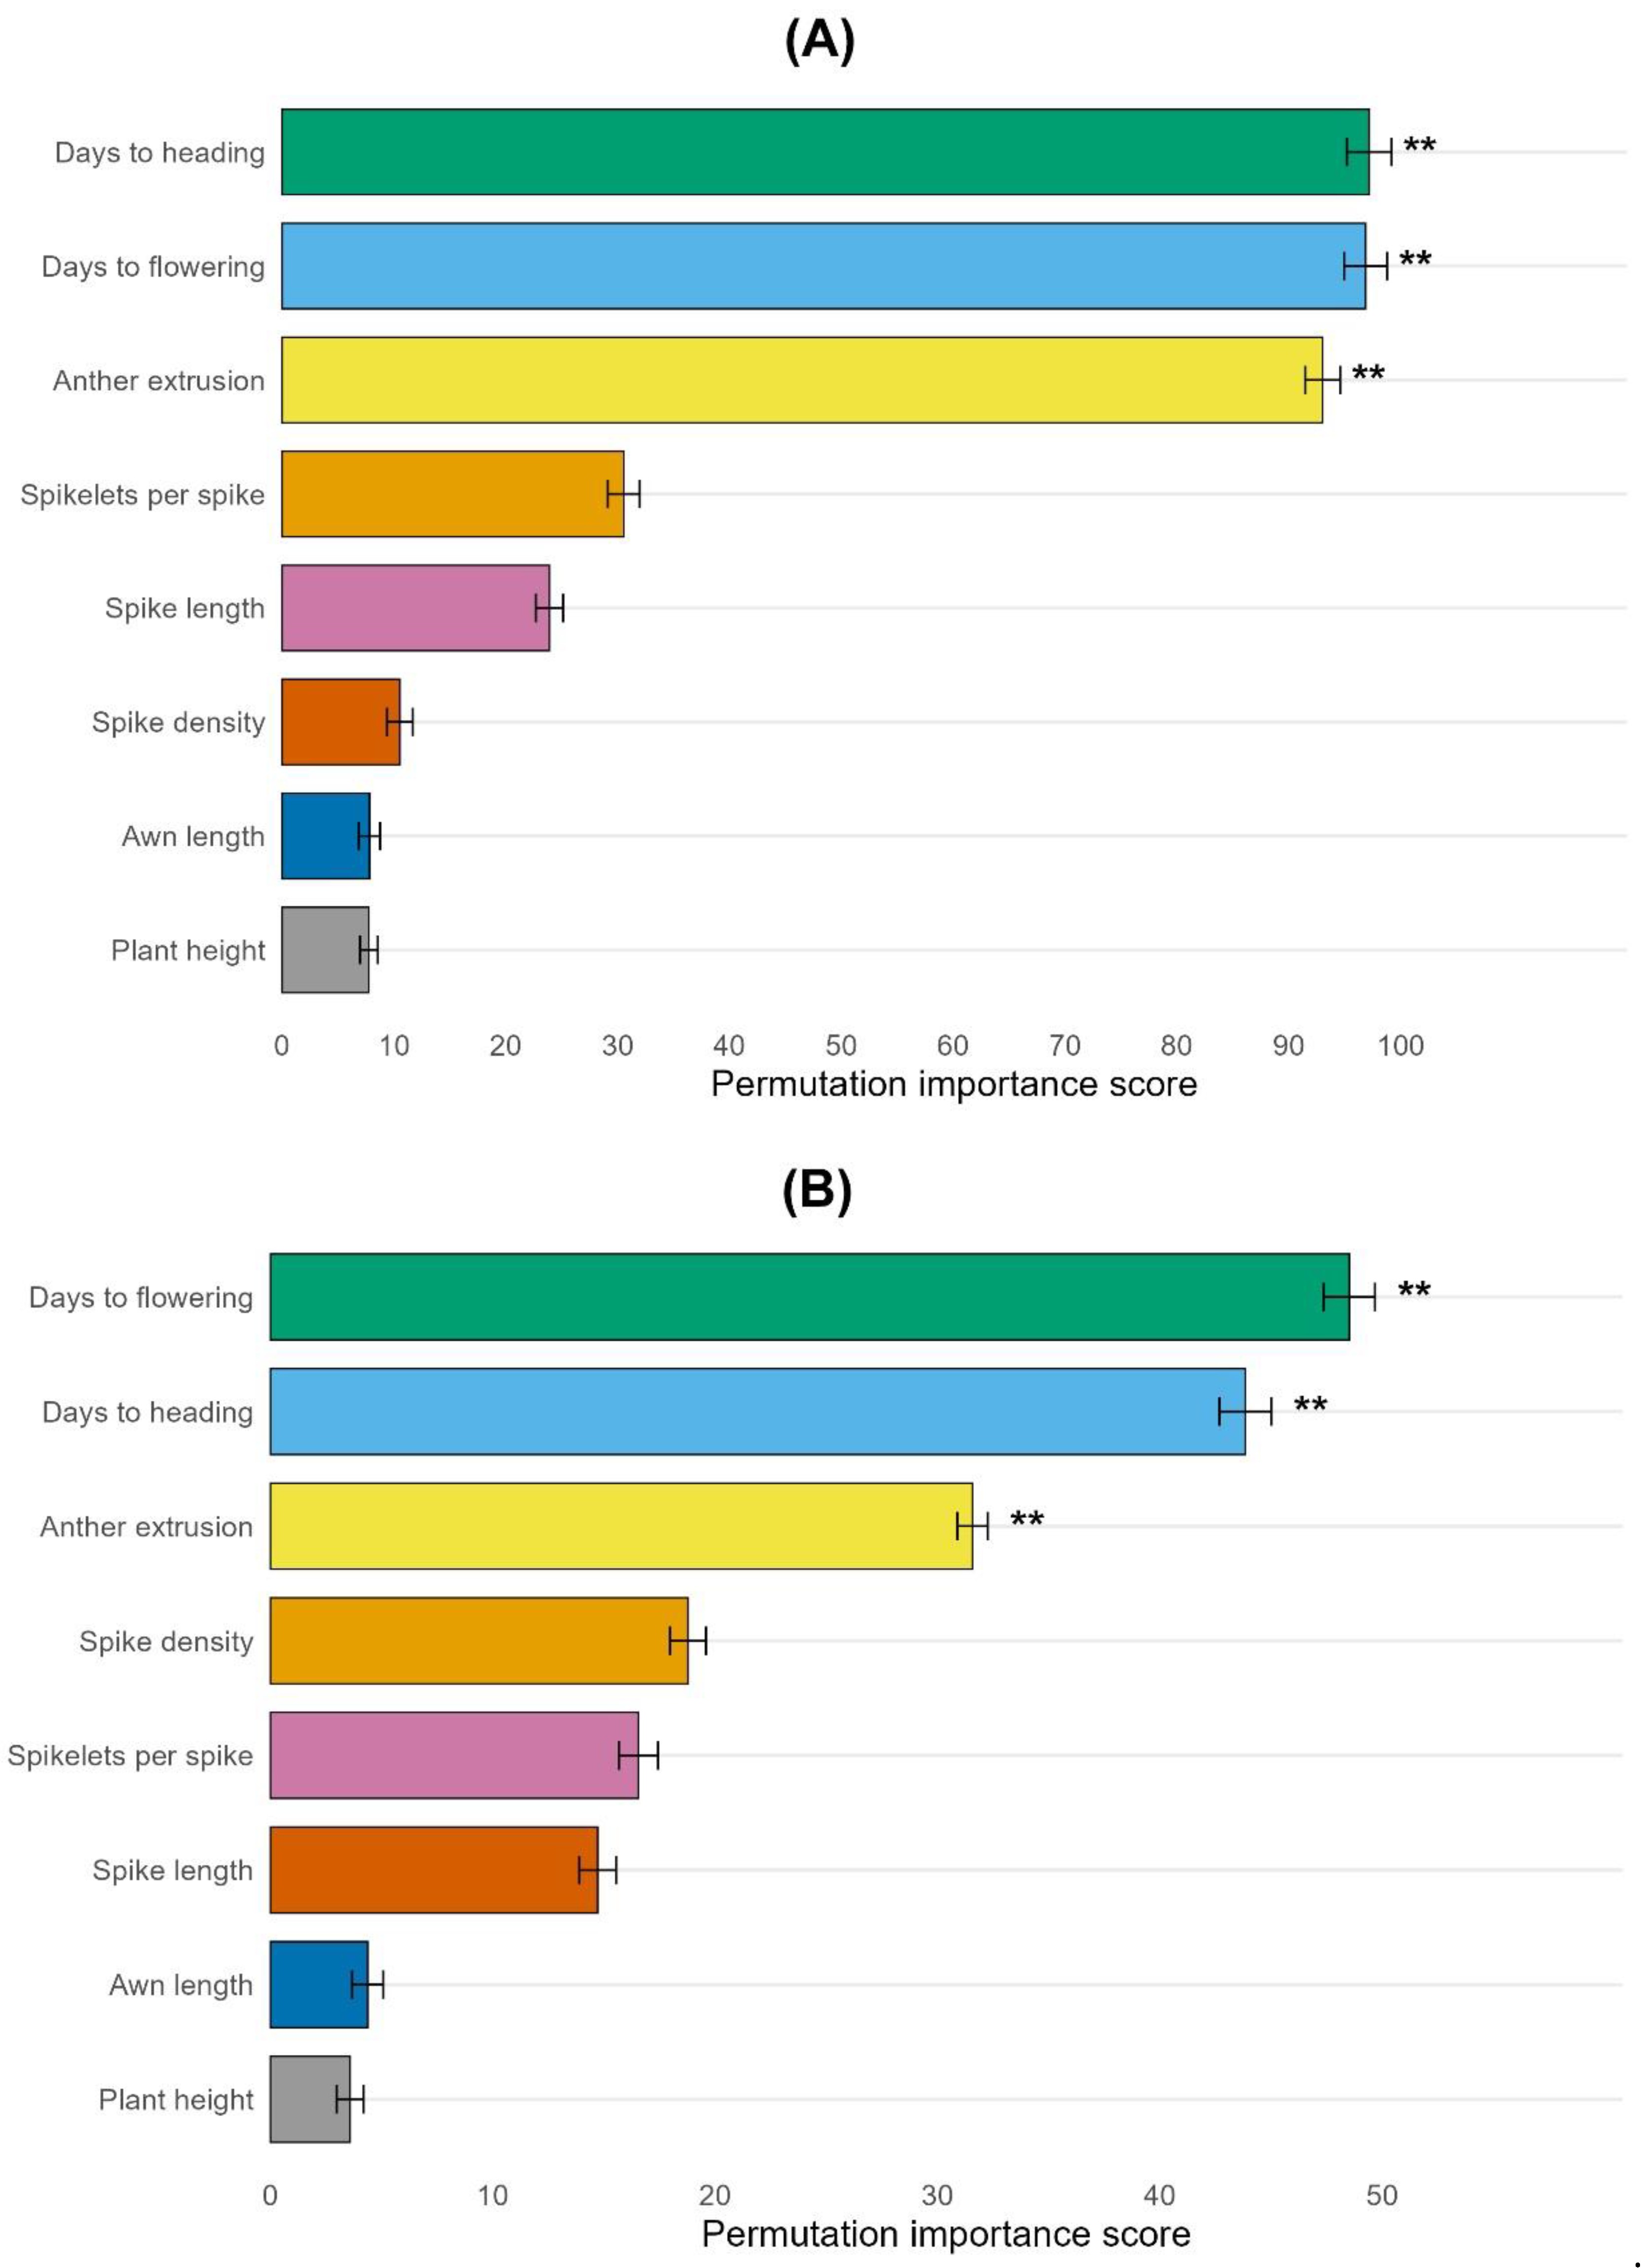

Table 1.
Genotype’s effect on phenotypic traits in 2022 and 2023.
| Trait | χ² | df | ε2 | Residual portion | p-value | Significance |
|---|---|---|---|---|---|---|
| AE_2023 | 636.16 | 331 | 0.92 | 0.08 | 1.64E-21 | *** |
| AE_2025 | 485.01 | 331 | 0.46 | 0.54 | 6.67E-08 | *** |
| AL_2022 | 833.00 | 331 | 0.76 | 0.24 | 4.31E-45 | *** |
| AL_2023 | 2379.07 | 331 | 0.56 | 0.44 | 5.4E-306 | *** |
| PH_2022 | 924.39 | 331 | 0.89 | 0.11 | 1.59E-57 | *** |
| PH_2023 | 1396.69 | 331 | 0.64 | 0.36 | 1.1E-130 | *** |
| SL_2022 | 1853.26 | 331 | 0.57 | 0.43 | 1.2E-209 | *** |
| SL_2023 | 1977.72 | 331 | 0.45 | 0.55 | 5E-232 | *** |
| S/S_2022 | 1701.48 | 330 | 0.52 | 0.48 | 3.9E-183 | *** |
| S/S_2023 | 1798.45 | 331 | 0.40 | 0.60 | 7E-200 | *** |
| SD _2022 | 1434.12 | 331 | 0.42 | 0.58 | 6.5E-137 | *** |
| SD_2023 | 1202.78 | 331 | 0.24 | 0.76 | 3.2E-99 | *** |
| DH_2022 | 586.91 | 331 | 0.77 | 0.23 | 1.56E-16 | *** |
| DH_2023 | 604.52 | 331 | 0.82 | 0.18 | 2.92E-18 | *** |
| DF_2022 | 526.93 | 331 | 0.59 | 0.41 | 3.8E-11 | *** |
| DF_2023 | 584.47 | 331 | 0.76 | 0.24 | 2.67E-16 | *** |
| FHB severity 2022 | 4730.33 | 330 | 0.38 | 0.62 | 0 | *** |
| FHB severity 2023 | 3815.31 | 331 | 0.46 | 0.54 | 0 | *** |
Note: χ2 = Chi-squared, ε2 = Epsilon-squared, AE = Anther extrusion, AL = Awn length, PH = Plant height, SL = Spike length, S/S = number of spikelets, SD = Spike density, DH = Days to heading, DF = Days to flowering, * p < 0.05, ** p < 0.01, *** p < 0.001 and ns = non-significant.
Table 2.
Mean values, standard deviation, and coefficient of variance of 332 genotypes.
| Traits | 2022 | 2023 | ||||
|---|---|---|---|---|---|---|
| Mean | SD | CV | Mean | SD | CV | |
| AE | 3.87* | 0.62* | 16.02* | 3.16 | 0.96 | 30.43 |
| AL | 2.75 | 1.83 | 66.64 | 2.40 | 1.99 | 82.94 |
| PH | 94.62 | 8.39 | 8.87 | 70.17 | 6.54 | 9.32 |
| SL | 8.11 | 0.92 | 11.29 | 8.13 | 0.95 | 11.65 |
| S/S | 15.72 | 1.79 | 11.41 | 14.58 | 1.85 | 12.71 |
| SD | 1.95 | 0.30 | 15.18 | 1.81 | 0.27 | 14.95 |
| DF | 70.53 | 2.30 | 3.27 | 56.05 | 2.40 | 4.28 |
| DH | 67.85 | 2.03 | 2.99 | 52.76 | 2.24 | 4.24 |
| FHB Severity | 77.93 | 23.62 | 30.31 | 48.37 | 30.93 | 63.95 |
AE = Anther extrusion, AL = Awn length, PH = Plant height, SL = Spike length, S/S = number of spikelets, SD = Spike density, DH = Days to heading, DF = Days to flowering. *AE measurements of 2025.
Table 3.
Genotype and year’s effects on morpho-phenological traits and FHB severity.
| Trait | Genotype ◊ | Year ◊ | G × E □ | |||
|---|---|---|---|---|---|---|
| ε2 | Significance | ε2 | Significance | ε2 | Significance | |
| AE | 0.30 | *** | 0.16 | *** | 0.14 | *** |
| AL | 0.53 | *** | 0.02 | *** | 0.04 | *** |
| PH | 0.14 | *** | 0.64 | *** | 0.04 | *** |
| SL | 0.42 | *** | 0.00 | ns | 0.10 | *** |
| S/S | 0.35 | *** | 0.09 | *** | 0.14 | *** |
| SD | 0.27 | *** | 0.07 | *** | 0.05 | *** |
| DH | -0.07 | ns | 0.75 | *** | 0.03 | *** |
| DF | -0.10 | ns | 0.75 | *** | 0.03 | *** |
| FHB severity | 0.24 | *** | 0.21 | *** | 0.19 | *** |
Note: ◊ = Kruskal-Wallis Test, □ = non-parametric Mixed Model Test, ε2 = Epsilon square, AE = Anther extrusion, AL = Awn length, DF = Days to flowering, DH = Days to heading, PH = Plant height, SL = Spike length, S/S = number of spikelets, SD = Spike density, * p < 0.05, ** p < 0.01, *** p < 0.001 and ns = non-significant.
Table 4.
Correlation between the combined BLUEs values for days to flowering, heading, and plant height with FHB severity.
Table 4.
Correlation between the combined BLUEs values for days to flowering, heading, and plant height with FHB severity.
| Trait/Year | Severity 2022 | Severity 2023 | Severity average |
|---|---|---|---|
| Days to Flowering 2022 | -0.14* | -0.38*** | -0.32*** |
| Days to Flowering 2023 | -0.09ns | -0.49*** | -0.37*** |
| Days to Flowering average | -0.14* | -0.49*** | -0.40*** |
| Days to Heading 2022 | -0.14** | -0.44*** | -0.37*** |
| Days to Heading 2023 | -0.10ns | -0.50*** | -0.39*** |
| Days to Heading average | -0.15** | -0.51*** | -0.43*** |
| Plant Height 2022 | 0.08ns | -0.07ns | -0.01ns |
| Plant Height 2023 | -0.04ns | -0.09ns | -0.12* |
| Plant Height average | 0.01ns | -0.12* | -0.08ns |
ns=p>0.05, * =p<0.05, **=p<0.01 and ***= p <0.001.
Disclaimer/Publisher’s Note: The statements, opinions and data contained in all publications are solely those of the individual author(s) and contributor(s) and not of MDPI and/or the editor(s). MDPI and/or the editor(s) disclaim responsibility for any injury to people or property resulting from any ideas, methods, instructions or products referred to in the content. |
© 2025 by the authors. Licensee MDPI, Basel, Switzerland. This article is an open access article distributed under the terms and conditions of the Creative Commons Attribution (CC BY) license (http://creativecommons.org/licenses/by/4.0/).
Copyright: This open access article is published under a Creative Commons CC BY 4.0 license, which permit the free download, distribution, and reuse, provided that the author and preprint are cited in any reuse.


