1. Introduction
Phytoplasmas are wall-less pleomorphic prokaryotes that colonize the phloem sieve tubes of host plants, inducing disease syndromes characterized by yellowing (yellows diseases) and malformations of vegetative and reproductive organs. These symptoms are associated with the plant’s defense response, which includes the deposition of callose at sieve plate pores, leading to phloem blockage, accumulation of photoassimilates, and disruptions of hormonal homeostasis. Since their discovery in the late 1960s [
1], phytoplasmas have been associated with a wide range of plant diseases in tritrophic pathosystems involving phloem-feeding insect vectors (leafhoppers, planthoppers, psyllids). Phytoplasmas are obligate parasites that rely entirely on host metabolism due to the absence of many genes essential for key metabolic pathways required for independent existence. Despite numerous attempts, they remain unculturable in axenic media [
2].
Fruit tree species within the family Rosaceae can be infected by phytoplasmas belonging to the Apple Proliferation group (16SrX), particularly ‘Candidatus Phytoplasma mali’, ‘Ca. P. prunorum’, and ‘Ca. P. pyri’. The latter is associated to Pear Decline (PD), a severe disease characterized by early leaf senescence in late summer, often accompanied by typical reddening or yellowing, delayed bud break in spring, upwardly rolled (cup-shaped) leaves, and progressive decline of the tree.
‘
Ca. P. pyri’ has been reported in almost all species of the genus
Pyrus and in
Cydonia oblonga (quince), a species frequently used as a rootstock for pear plants. Furthermore,
Prunus persica, P. avium and
P. dulcis have also been reported as natural hosts of the phytoplasma [
3]. Detection of the phytoplasma in peach trees, in association with Peach Yellow Leaf Roll (PYRL) syndrome, has led to confusion between ‘
Ca. P. pyri’ and the PYRL phytoplasma. This latter should be considered a related strain of the former [
4]. Easterling and co-workers (2024) [
5], distinguish
two strains of ‘Ca. P. pyri’ can be based on immunodominant membrane (imp) protein gene.
Recently, two draft genomes of the phytoplasma have been deposited in GenBank. Notably, there is a substantial difference in genome size between the two sequenced isolates—one from Chile and the other from Argentina—measuring approximately 456,000 bp (
GCA_049440465.1) and 575,000 bp (GCA_049440465.1 o GCF_046600495.1), respectively [
6,
7]. Alessio et al. (2025) [
7] highlighted differences in genome size between the Argentine and Chilean isolates, which were associated with differences in gene content and assembly quality between the two characterized strains.
Phytoplasmas of the 16SrX group are transmitted by psyllids in a persistent–propagative manner. This mode requires midgut crossing, systemic multiplication, and subsequent colonization of the salivary glands before successful inoculation. Once acquired, the phytoplasma is retained for the insect’s lifetime, enabling repeated inoculation events.
The principal confirmed vectors are
Cacopsylla pyricola,
C. pyri, and
C. pyrisuga, while
C. bidens has been proposed as a potential vector [
8], and the recent detection of the phytoplasma in adults of this species in Jordan further supports this hypothesis [
9].
All pear psyllids are specialized on Pyrus species for development, although they may feed on non-host plants to obtain water and nutrients during diapause or dispersal.
Cacopsylla pyri, C. pyricola, and C. bidens, are distributed across the Western and Eastern Palaearctic regions and are multivoltine, producing multiple generations per year depending on latitude, and overwinter as adults in reproductive diapause, characterized by delayed ovary maturation and suspended mating. Seasonal dimorphism is pronounced, with a large, dark winterform and a smaller, lighter summerform. Overwintering adults may disperse from orchards to alternative host plants, including other fruit trees and evergreens, to secure water and nutrients. Return to pear orchards occurs in late winter, when post-diapause females begin oviposition under unopened buds, shifting later to leaves and flowers.
In contrast,
Cacopsylla pyrisuga exhibits a univoltine life cycle. Adults overwinter on shelter plants, primarily on conifers, and migrate to pear trees in early spring (March–April) to lay eggs immediately on emerging leaves and flowers. The single summer generation disperses to shelter plants, often aided by winds, leaving pear trees largely free of the psyllid for most of the year [
8,
10]. Data on the presence of pear psyllids in Sicily dates back to 1992 [
11].
The seasonal biology, dispersal, and host interactions of psyllid vectors are key factors in the epidemiology of
‘Ca. P. pyri
’, as overwintered adults represent the primary source of inoculum in spring. Although phytoplasmas of the 16SrX group are known to interact closely with their psyllid vectors, the effects of
‘Ca. P. pyri’ infection on the biology and behavior of
Cacopsylla spp. remain poorly understood, in contrast to other phytoplasma–vector systems where pathogen-induced changes are well documented [
12]. Nevertheless, available evidence suggests that
‘Ca. P. pyri’ may affect vector dispersal and host association, as infected
C. pyricola adults have been reported to exhibit reduced movement and prolonged residence on pear plants [
13]. Recent transcriptomic analyses further support a complex interaction between
‘Ca. P. pyri
’ and its vectors, involving genes related to immunity, metabolism, and sensory functions [
5].
Recent advances highlight the growing relevance of sensor-based monitoring systems for early disease detection in phytoplasma pathosystems. These technologies, ranging from proximal sensing to multispectral and hyperspectral imaging, have demonstrated strong potential for detecting subtle physiological disturbances before visible symptoms emerge [
14].
Within this framework, satellite remote sensing has become an essential tool for monitoring plant health and detecting stress conditions over large areas, thanks to its ability to capture changes in canopy structure, pigment concentration, and photosynthetic activity without direct contact with vegetation [
15,
16]. Multispectral satellite missions such as Sentinel-2 provide high spatial and temporal resolution data that enable the assessment of vegetation vigor through indices including the Normalized Difference Vegetation Index (NDVI) [
17] and the Normalized Difference Red-Edge Index (NDRE) [
18], which exploits the strong sensitivity of red-edge wavelengths to chlorophyll concentration [
19]. These indices have proven effective in detecting both abiotic and biotic stress by quantifying variations in photosynthetic capacity, leaf internal structure, and canopy density [
20,
21].
Remote sensing approaches have been increasingly used in plant pathology to identify early stress signals associated with pathogen infection. While spectral signatures cannot directly identify the causal agent, they can capture the physiological consequences of infection, making remote sensing a powerful complementary tool for disease surveillance [
22]. Applications in perennial crops and forest ecosystems demonstrate the capacity of multispectral and hyperspectral data to detect early decline symptoms. For example, multispectral satellite time series were recently used in Sicily to monitor climate-driven dieback in
Fagus sylvatica forests, revealing NDVI reductions consistent with field-observed vitality loss [
23].
Similarly, hyperspectral remote sensing has proven effective for detecting early symptoms of phytoplasma-associated diseases, as shown for Flavescence dorée in grapevine, where spectral changes in the red-edge region allowed discrimination between healthy and infected plants well before severe canopy degradation occurred [
24].
Given that phytoplasma infections cause phloem blockage, chlorosis, altered carbohydrate allocation, and premature senescence, resulting in characteristic changes in chlorophyll content and canopy vigour, optical remote sensing represents a suitable tool for monitoring PD. The integration of satellite imagery with field observations and molecular diagnostics can therefore improve early detection, support epidemiological reconstruction, and enhance the understanding of disease progression in affected pear orchards.
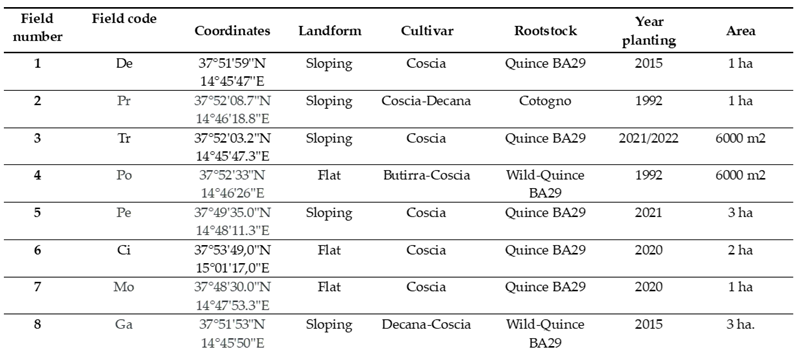
In this study, we report the results of a two-years survey of a PD outbreak in Sicily. Field surveys aimed at identifying characteristic disease symptoms and the associated insect vectors were integrated with the molecular characterization of ‘Ca. P. pyri’ isolates from plants and vectors by multilocus sequence typing to define the current epidemiological status of the outbreak. Furthermore, a remote sensing approach was employed to assess the temporal evolution of the disease starting from the first year of observation in 2019.
4. Discussion
In this study, we applied a multi-approach strategy to investigate the pear decline epidemic in the province of Catania. The first detection, in autumn 2019, of two disease foci in the provinces of Catania (Bronte) and Palermo (Castronuovo di Sicilia), affecting the cultivars Coscia and Abate Fetèl respectively, initially suggested the introduction of infected propagation material from other regions where ‘
Ca. P. pyri’ has been present for decades [
25]. From that moment onward, reports of symptoms attributable to PD increased rapidly, marking the onset of the PD epidemic in Sicily, a disease that had never before been observed in this region. Among the factors potentially associated with the emergence of the epidemic, both the presence of elevated psyllid population densities and the contemporaneous deregulation of ‘
Ca. P. pyri’ as an RNQP (Regulated Non-Quarantine Pest) must be considered. The latter occurred at the end of November 2019 under the Commission Implementing Regulation (EU) 2019/2072, thereby precluding the implementation of eradication measures in the initial foci. The monitoring activities conducted in the eight surveyed orchards revealed highly characteristic symptoms of pear decline, mostly correlated to a slow decline syndrome. It should be emphasized that identifying the symptom of delay through visual inspection was not as effective as the application of remote sensing, which unequivocally identified the phenomenon.
Leaf samples were collected in autumn from all eight orchards, and 69% of them tested positive for ‘Ca. P. pyri’, thus confirming the strong association between the pathogen and the disease.
Among the psyllid species collected,
C. pyri was by far the predominant species, whereas individuals belonging to other phytoplasma vector species were detected only sporadically over the two-year survey. Only a few specimens of
C. pyricola and
C. pyrisuga were recorded, the latter represented by a single individual. Capture data of potential phytoplasma vectors in the two selected orchards, characterized by different insecticide management strategies, demonstrated the marked prevalence of
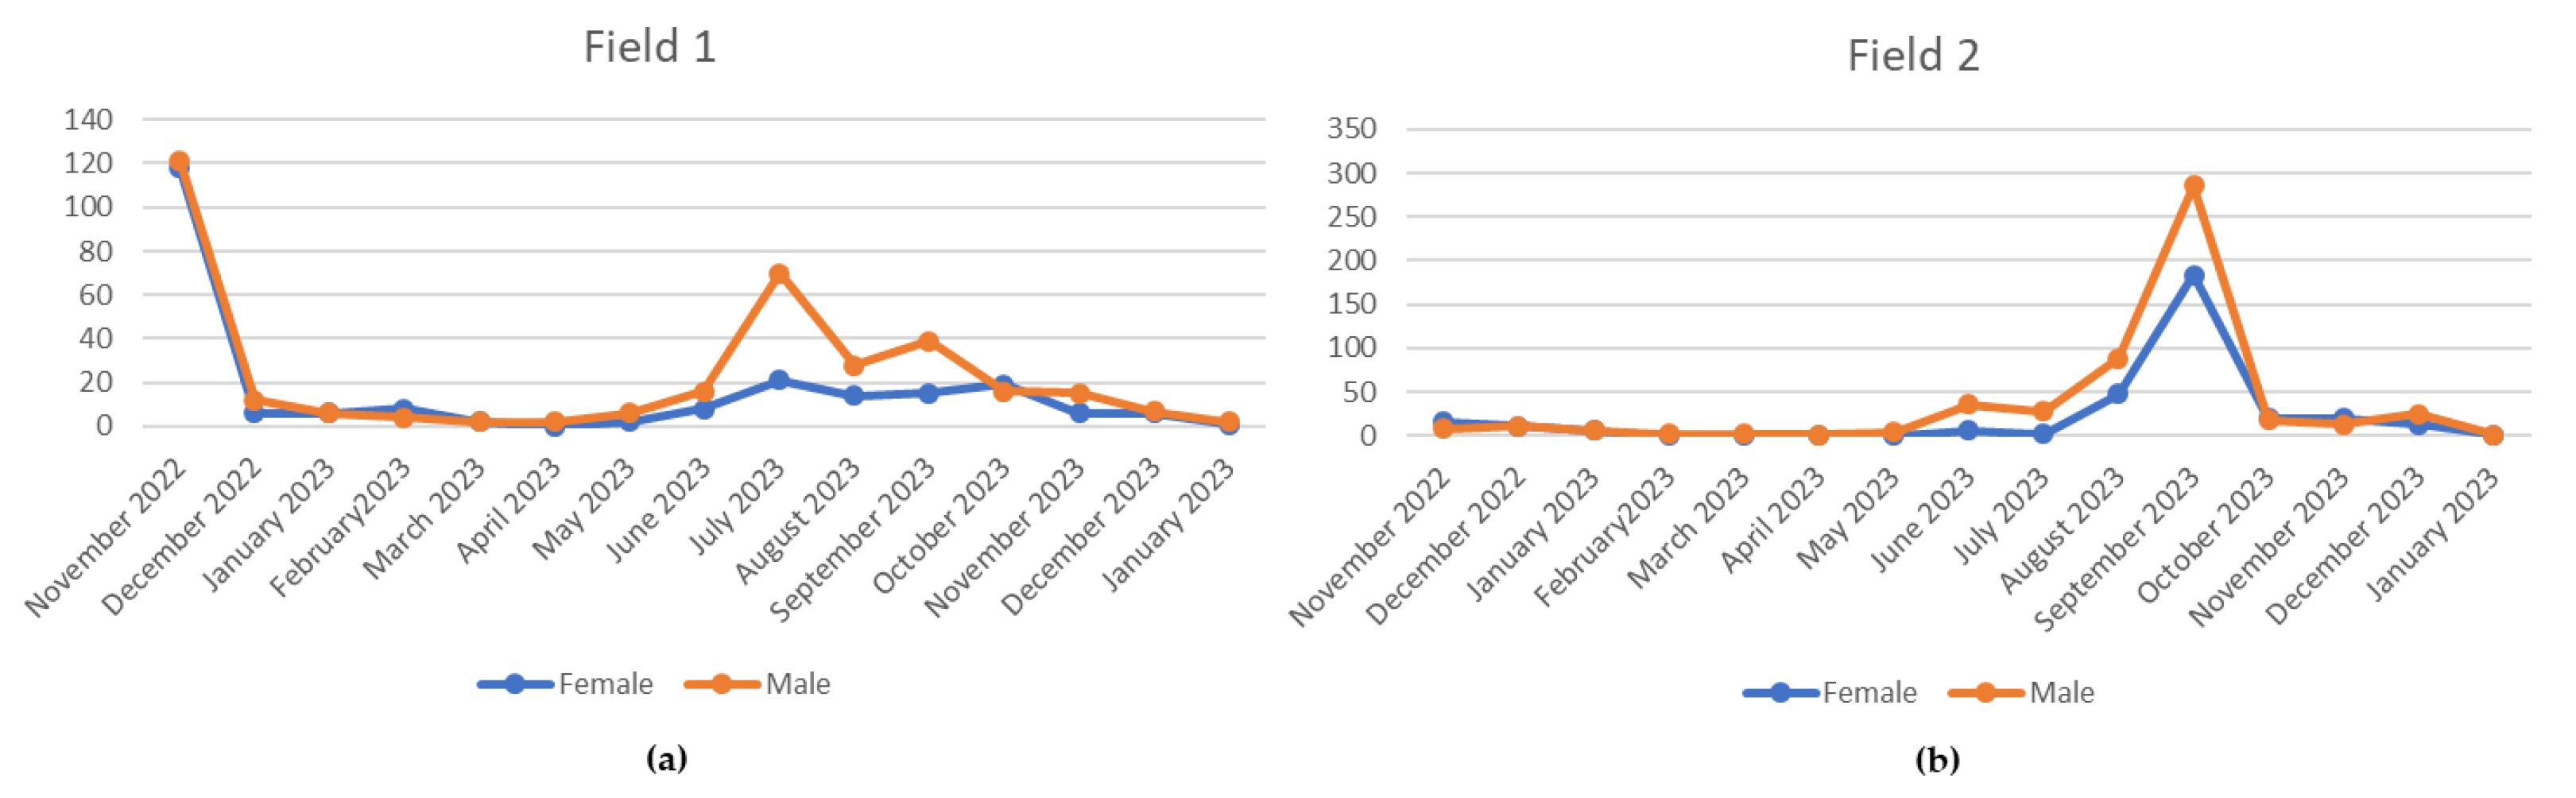
C. pyri in both fields throughout the 13-month monitoring period. Considering the overall psyllid population, males predominated in both fields. The highest proportion of captured adults across the four seasons was recorded in summer and autumn, likely influenced by the elevated temperatures observed during the latter season. The persistence of pear canopy foliage until late November in the study area, driven by these unusually high autumn temperatures and coupled with the high psyllid population levels recorded during the same period, may indicate a potential increase in the risk of pathogen dissemination. The estimated proportion of psyllid individuals testing positive for the phytoplasma, exclusively
C. pyri, was 4.6%, a value consistent with previous reports from other European growing areas [
37]. Differences in population dynamics between the two study orchards further indicated that, although a higher total number of insects and pronounced summer peaks were observed in Field 2 under integrated pest management, the interruption of insecticide treatments after harvest in 2022 resulted in a sharp increase in adult psyllid abundance. These findings further support the notion that reliance on chemical control alone against the insect vector is insufficient to limit phytoplasma spread and may ultimately constitute an additional economic burden associated with the disease.
The Multi-Locus Sequence Typing (MLST) analysis revealed limited genetic diversity among the isolates collected on the island. Specifically, the phylogenetic analysis performed on the secY locus resolved the isolates into three distinct clusters. Each of these groups showed strong clustering with ‘Ca. Phytoplasma pyri’ reference sequences previously isolated across the Italian territory, two of which had already been identified in Sicily in 2019 (MT321503 and MT321504). Consistently, phylogenetic analysis of the loci encoding the Ace and Imp proteins further confirms the overall low genetic variability of the Sicilian isolates.
The apparent uniformity of sequence of the Sicilian isolates found in this study seems to be in contrast with the genomic diversity recently found in ten isolates collected in mainland Italy [
6]. However, it should be noted that while the disease has been present in northern Italy since at least 1965 [
40] or even 1908 [
41], the recent introduction of ‘
Ca. P. pyri’ to the island (around 2019) could, on the contrary, justify the limited evolutionary divergence of the Sicilian isolates. Such a hypothesis may be proven by monitoring the future evolution of both the disease and the associated phytoplasma on the island
It is worth noting that, based on the results obtained with virtual RFLP, 22 of the 24 samples analyzed appear to be members of 16SrX-C. Only two of the 24 showed similarity coefficients lower than 0.97% compared to the reference. These two strains could represent a new subgroup within 16SrX.
The integration of Sentinel-2 remote sensing provided a complementary and highly informative perspective on disease progression. Vegetation indices such as NDVI and NDRE are widely used for detecting stress-related changes in plant canopies [
42,
43] and are sensitive to both structural (NDVI) and biochemical (NDRE) alterations. NDRE, in particular, is strongly correlated with chlorophyll content and has been shown to detect subtle physiological stress before the manifestation of visible symptoms [
44,
45]. The multi-annual reduction of NDVI and NDRE observed in symptomatic orchards, especially the early-season decline and advanced senescence, aligns with patterns commonly associated with decline syndromes in perennial crops and forest ecosystems [
46].
The consistency of these spectral signals across multiple years demonstrates the value of satellite-based monitoring for chronic diseases such as PD, particularly in fragmented or remote orchard systems. The results also support the growing body of evidence recognizing the potential of sensor-based monitoring systems for phytoplasma-related disorders [
14]. The ability to integrate long-term time series from Sentinel-2, with its high revisit frequency and dedicated red-edge bands, offers a robust tool for surveillance and early detection in commercial orchards [
19,
47].
In conclusion, the evidence derived from field observations, molecular detection, vector monitoring and remote-sensing analysis strongly supports the hypothesis of a recent introduction of ‘Ca. P. pyri’ into Sicily, followed by rapid dissemination facilitated by abundant local vector populations. The integration of multi-source data enhances our understanding of PD epidemiology in newly affected areas and provides a framework for future disease management. Continued monitoring of pathogen diversity, vector dynamics, and orchard canopy status will be essential for tracking the evolution of the epidemic and mitigating its long-term impact on pear production in Sicily.
Figure 1.
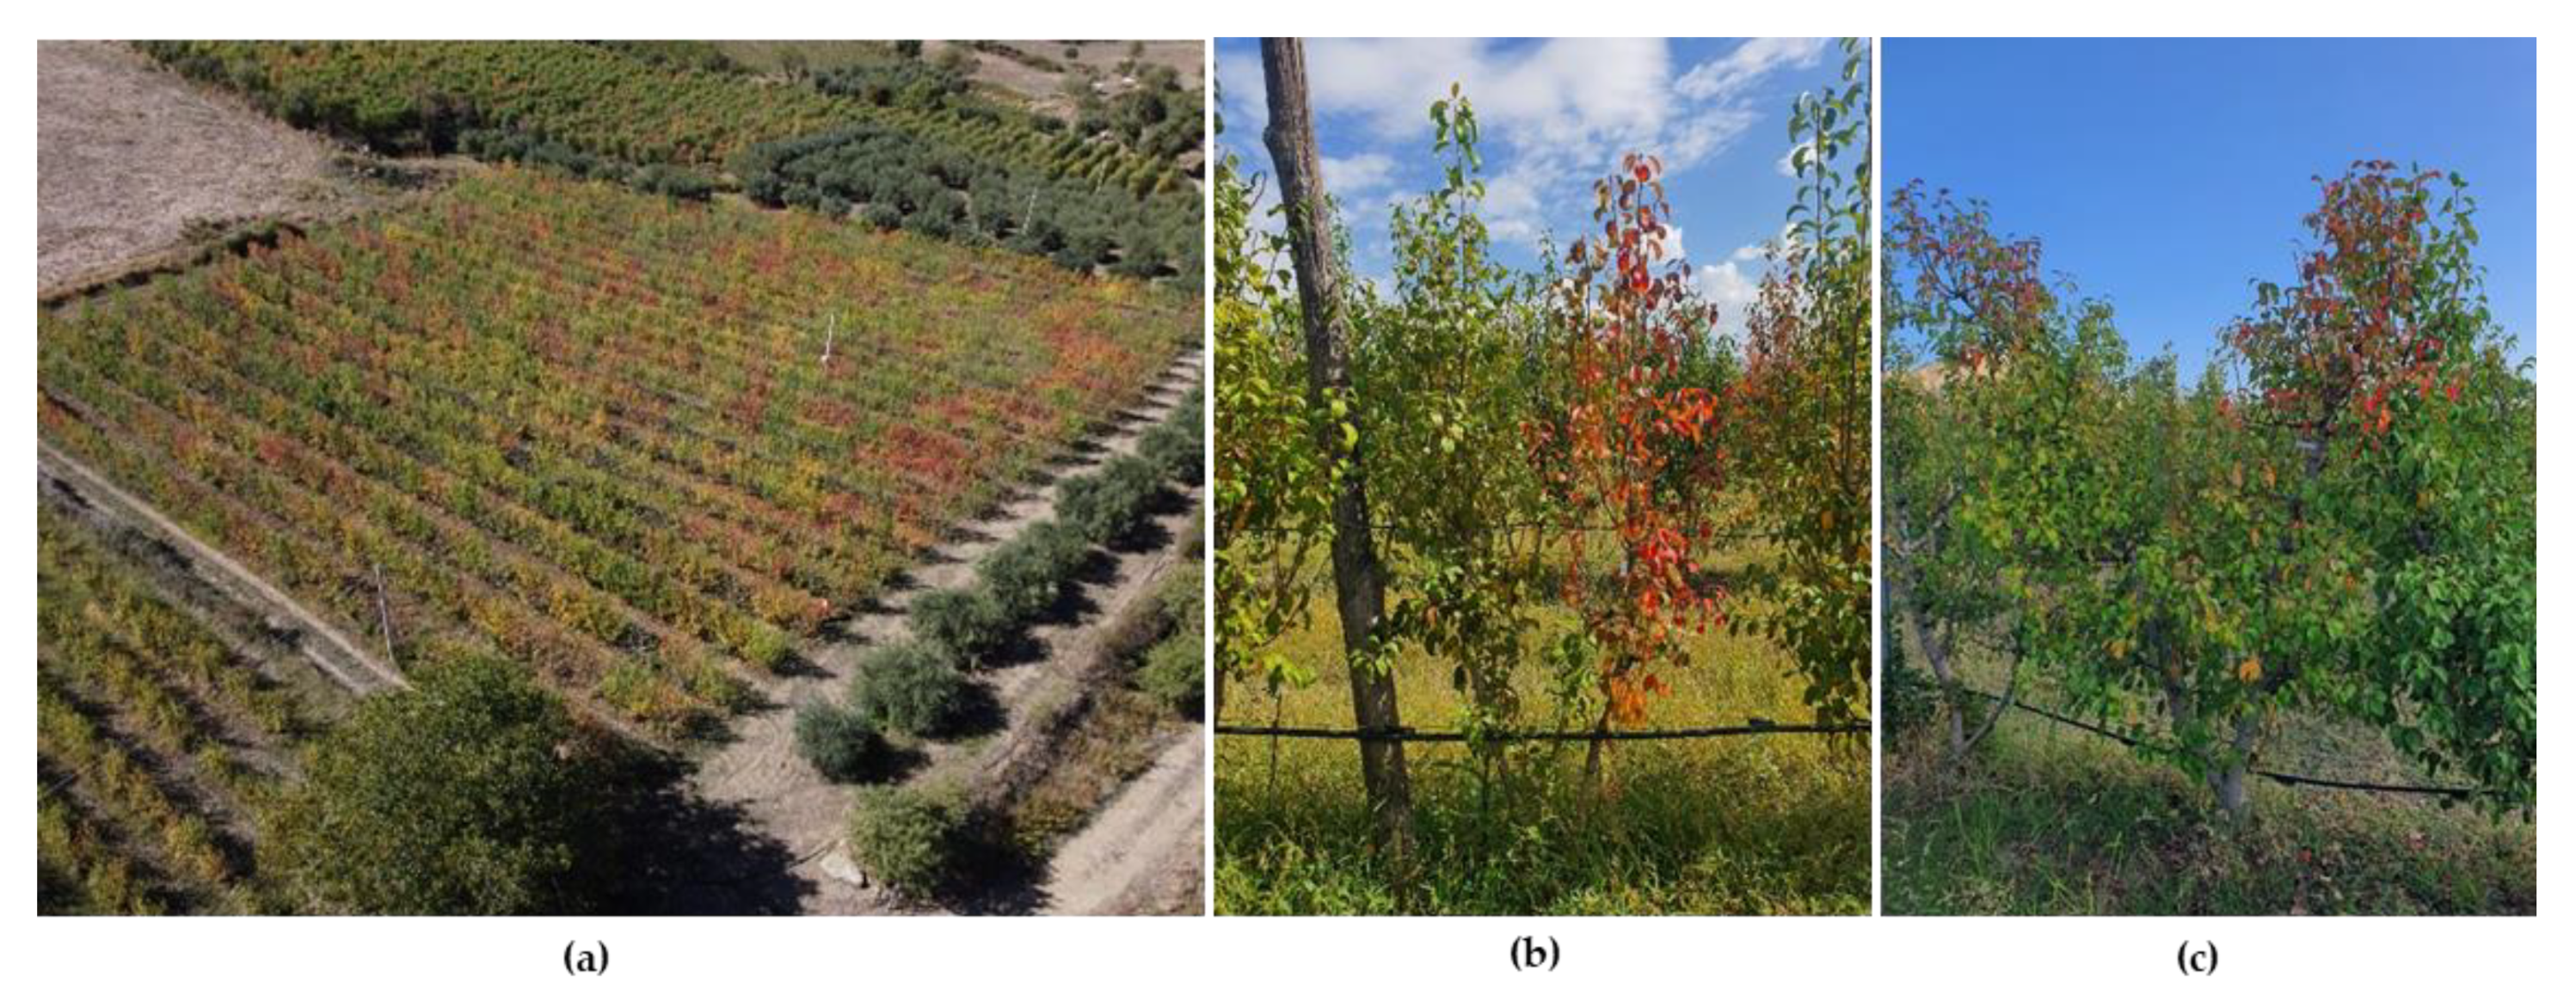
Symptoms observed during the two-year survey. (a) aerial view of Field 1 in 2023, four years since the original report; (b) Sectorial symptoms on double-leader young plants in Field 3; (c) sectorial symptoms of early reddening in Field 2.
Figure 1.
Symptoms observed during the two-year survey. (a) aerial view of Field 1 in 2023, four years since the original report; (b) Sectorial symptoms on double-leader young plants in Field 3; (c) sectorial symptoms of early reddening in Field 2.
Figure 2.
Monthly trend of the C. pyri population during the 13 months of monitoring.( a) Field 1 under conventional farming; (b) Field 2 under integrated pest management.
Figure 2.
Monthly trend of the C. pyri population during the 13 months of monitoring.( a) Field 1 under conventional farming; (b) Field 2 under integrated pest management.
Figure 3.
Comparative Phylogenetic Analysis of Phytoplasmas Based on 16S rRNA and Protein-Coding Genes. Comparative phylogenetic analysis was performed using the ribosomal 16S rRNA gene (A) and three nuclear protein-coding genes:
secY (B),
ace (C), and
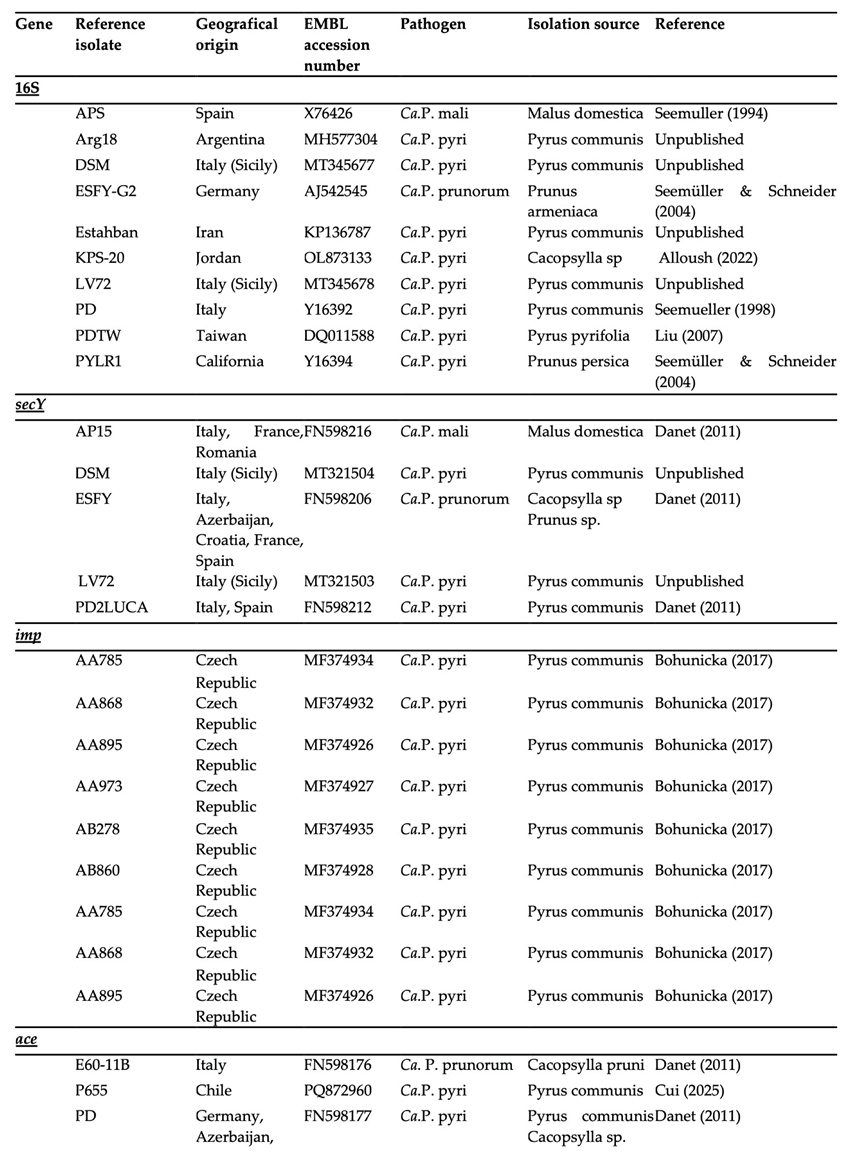
imp (D). Consensus nucleotide (for 16S rRNA) or amino acid sequences (for the protein-coding genes) for the respective markers were aligned using the ClustalW algorithm. The evolutionary history was inferred for all four markers using the Maximum Parsimony (MP) method, employing the partial deletion option. The optimal tree was obtained by applying the Subtree-Pruning-Regrafting (SPR) algorithm. Trees were drawn to scale, with branch lengths proportional to the number of inferred character state transformations and calculated using the average pathway method within the MEGA12 software. Bootstrap values resulting from 500 replicates are indicated at the branch nodes when support is equal to or greater than 50% (≥50). The list of isolates used for the construction of the trees is provided in
Table 2. Isolates obtained from psyllid vectors are specifically marked with red dots next to their name.
Figure 3.
Comparative Phylogenetic Analysis of Phytoplasmas Based on 16S rRNA and Protein-Coding Genes. Comparative phylogenetic analysis was performed using the ribosomal 16S rRNA gene (A) and three nuclear protein-coding genes:
secY (B),
ace (C), and
imp (D). Consensus nucleotide (for 16S rRNA) or amino acid sequences (for the protein-coding genes) for the respective markers were aligned using the ClustalW algorithm. The evolutionary history was inferred for all four markers using the Maximum Parsimony (MP) method, employing the partial deletion option. The optimal tree was obtained by applying the Subtree-Pruning-Regrafting (SPR) algorithm. Trees were drawn to scale, with branch lengths proportional to the number of inferred character state transformations and calculated using the average pathway method within the MEGA12 software. Bootstrap values resulting from 500 replicates are indicated at the branch nodes when support is equal to or greater than 50% (≥50). The list of isolates used for the construction of the trees is provided in
Table 2. Isolates obtained from psyllid vectors are specifically marked with red dots next to their name.
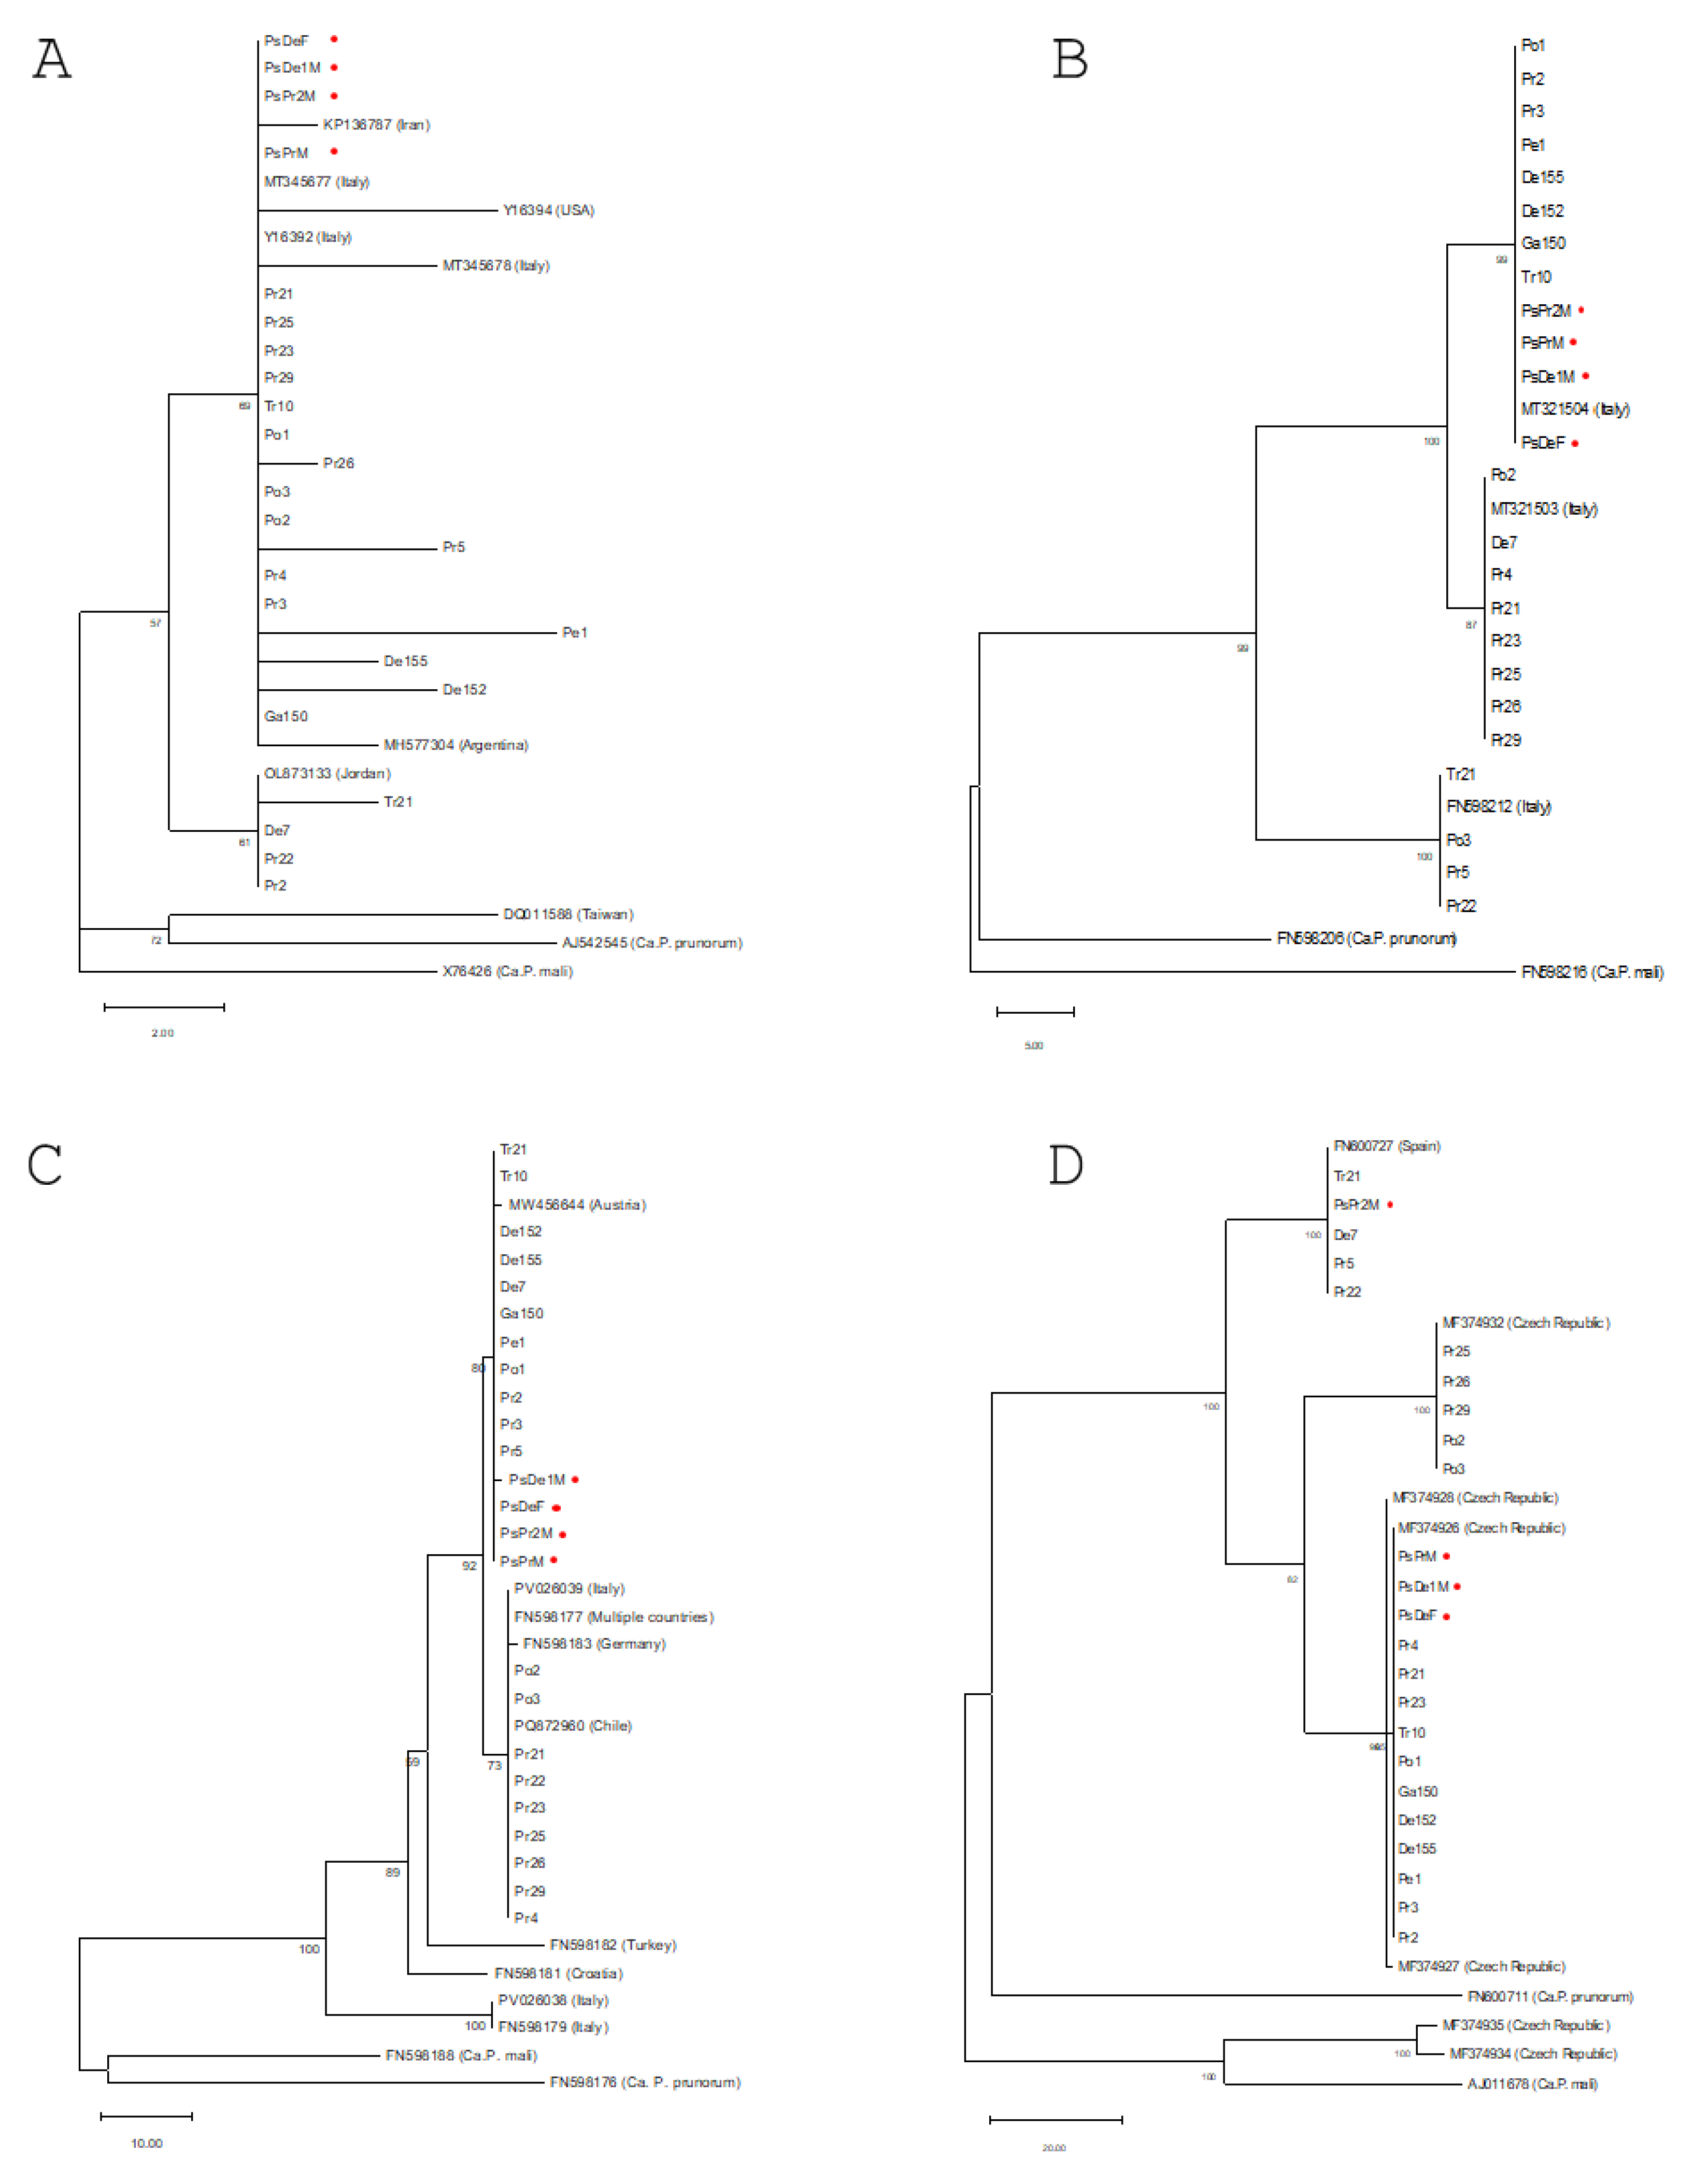
Figure 4.
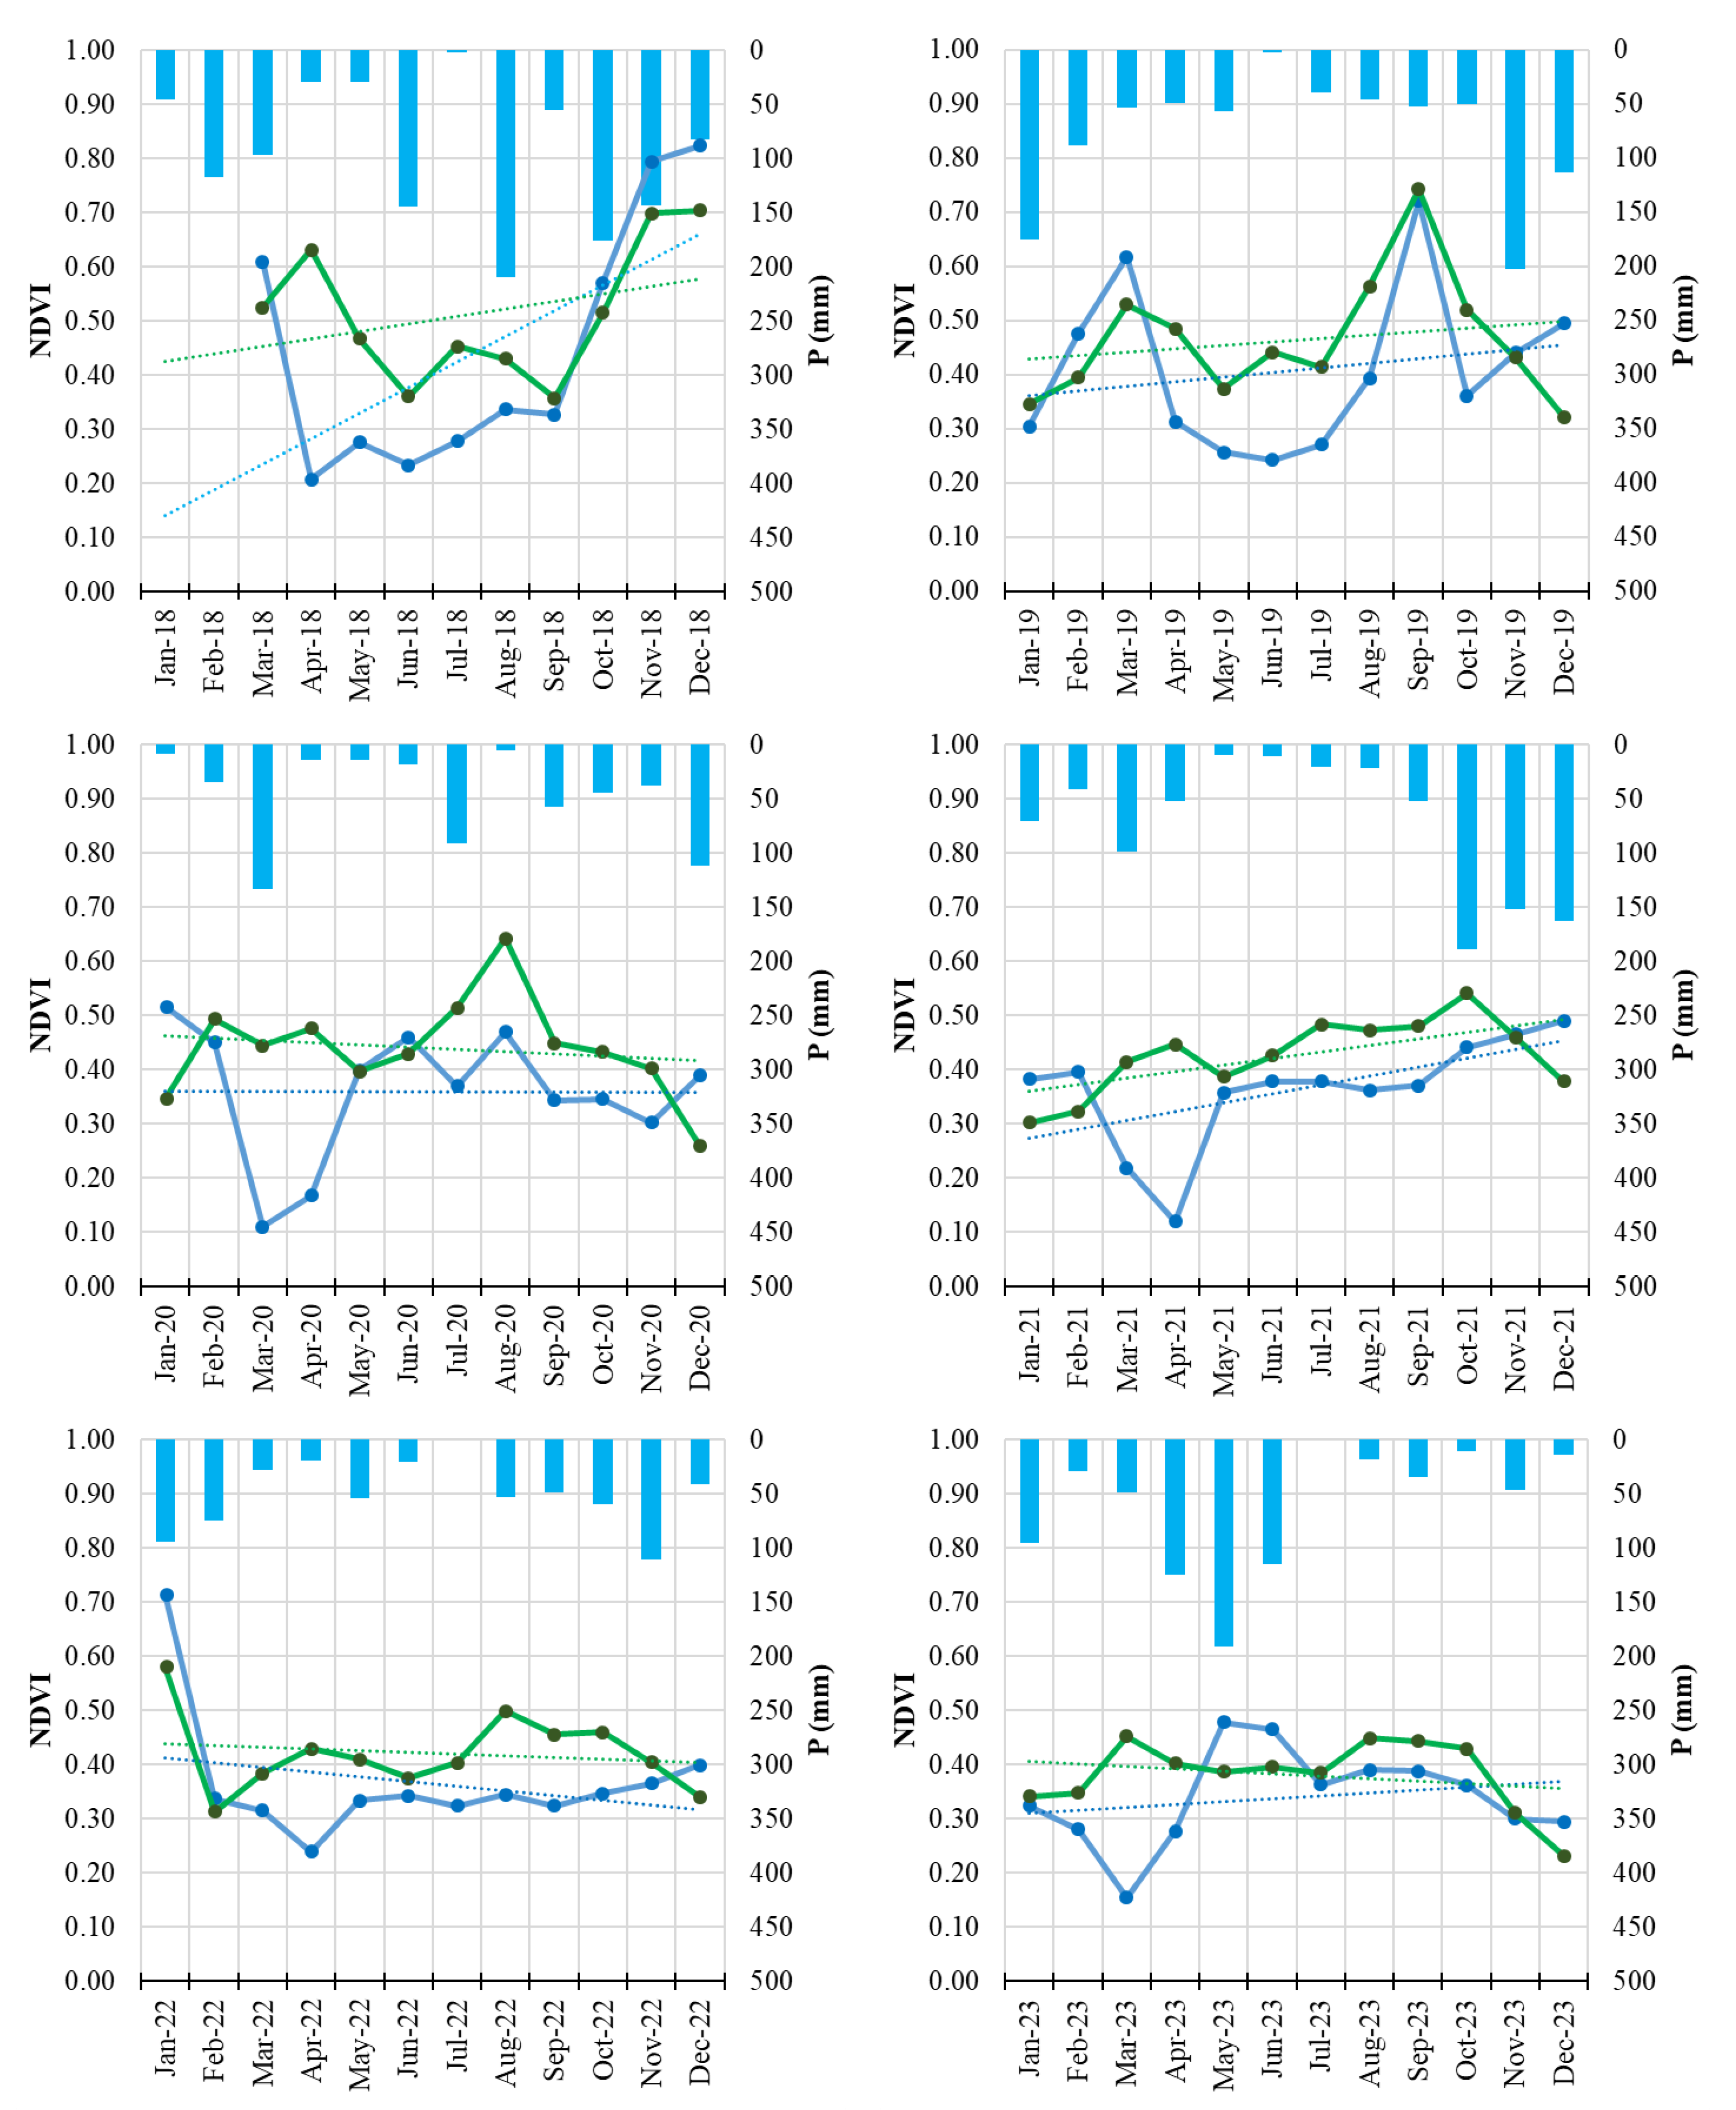
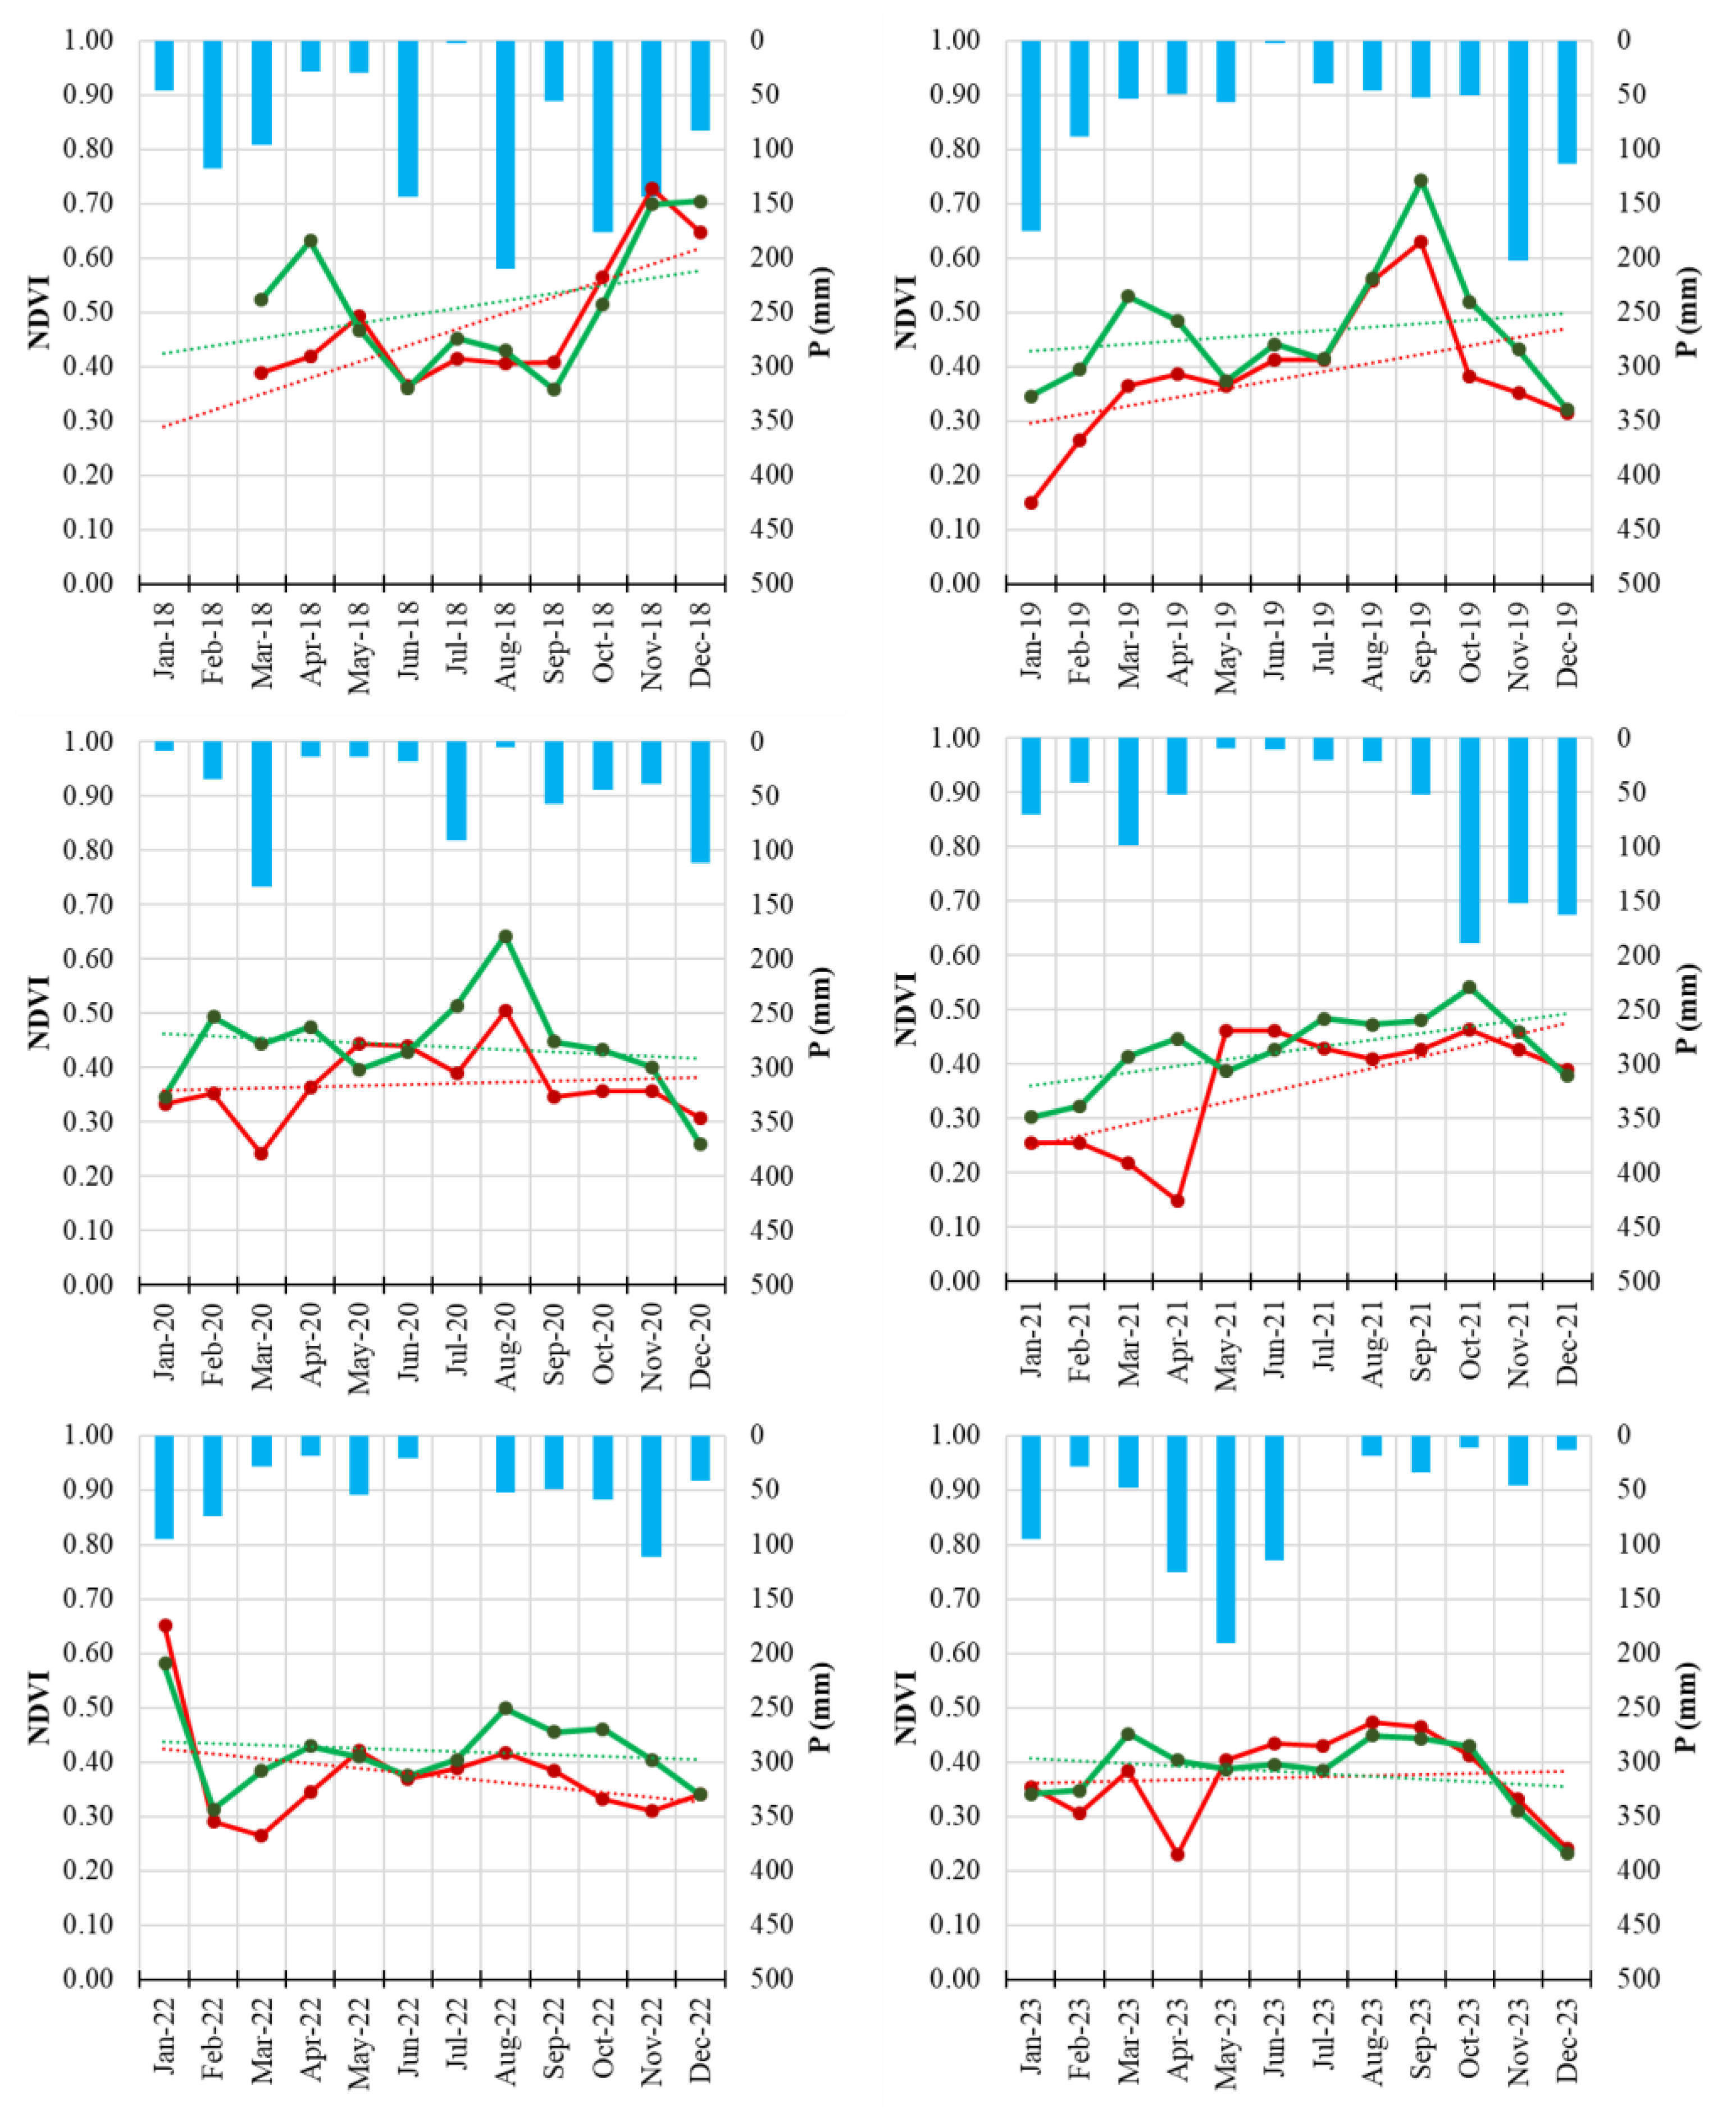
Monthly NDVI time series of Field 1 (symptomatic orchard, blue line) and the healthy reference orchard (Field H, green line) from January 2018 to December 2023. Solid lines represent monthly NDVI values; dotted lines indicate linear trends. Blue bars represent monthly precipitation totals.
Figure 4.
Monthly NDVI time series of Field 1 (symptomatic orchard, blue line) and the healthy reference orchard (Field H, green line) from January 2018 to December 2023. Solid lines represent monthly NDVI values; dotted lines indicate linear trends. Blue bars represent monthly precipitation totals.
Figure 5.
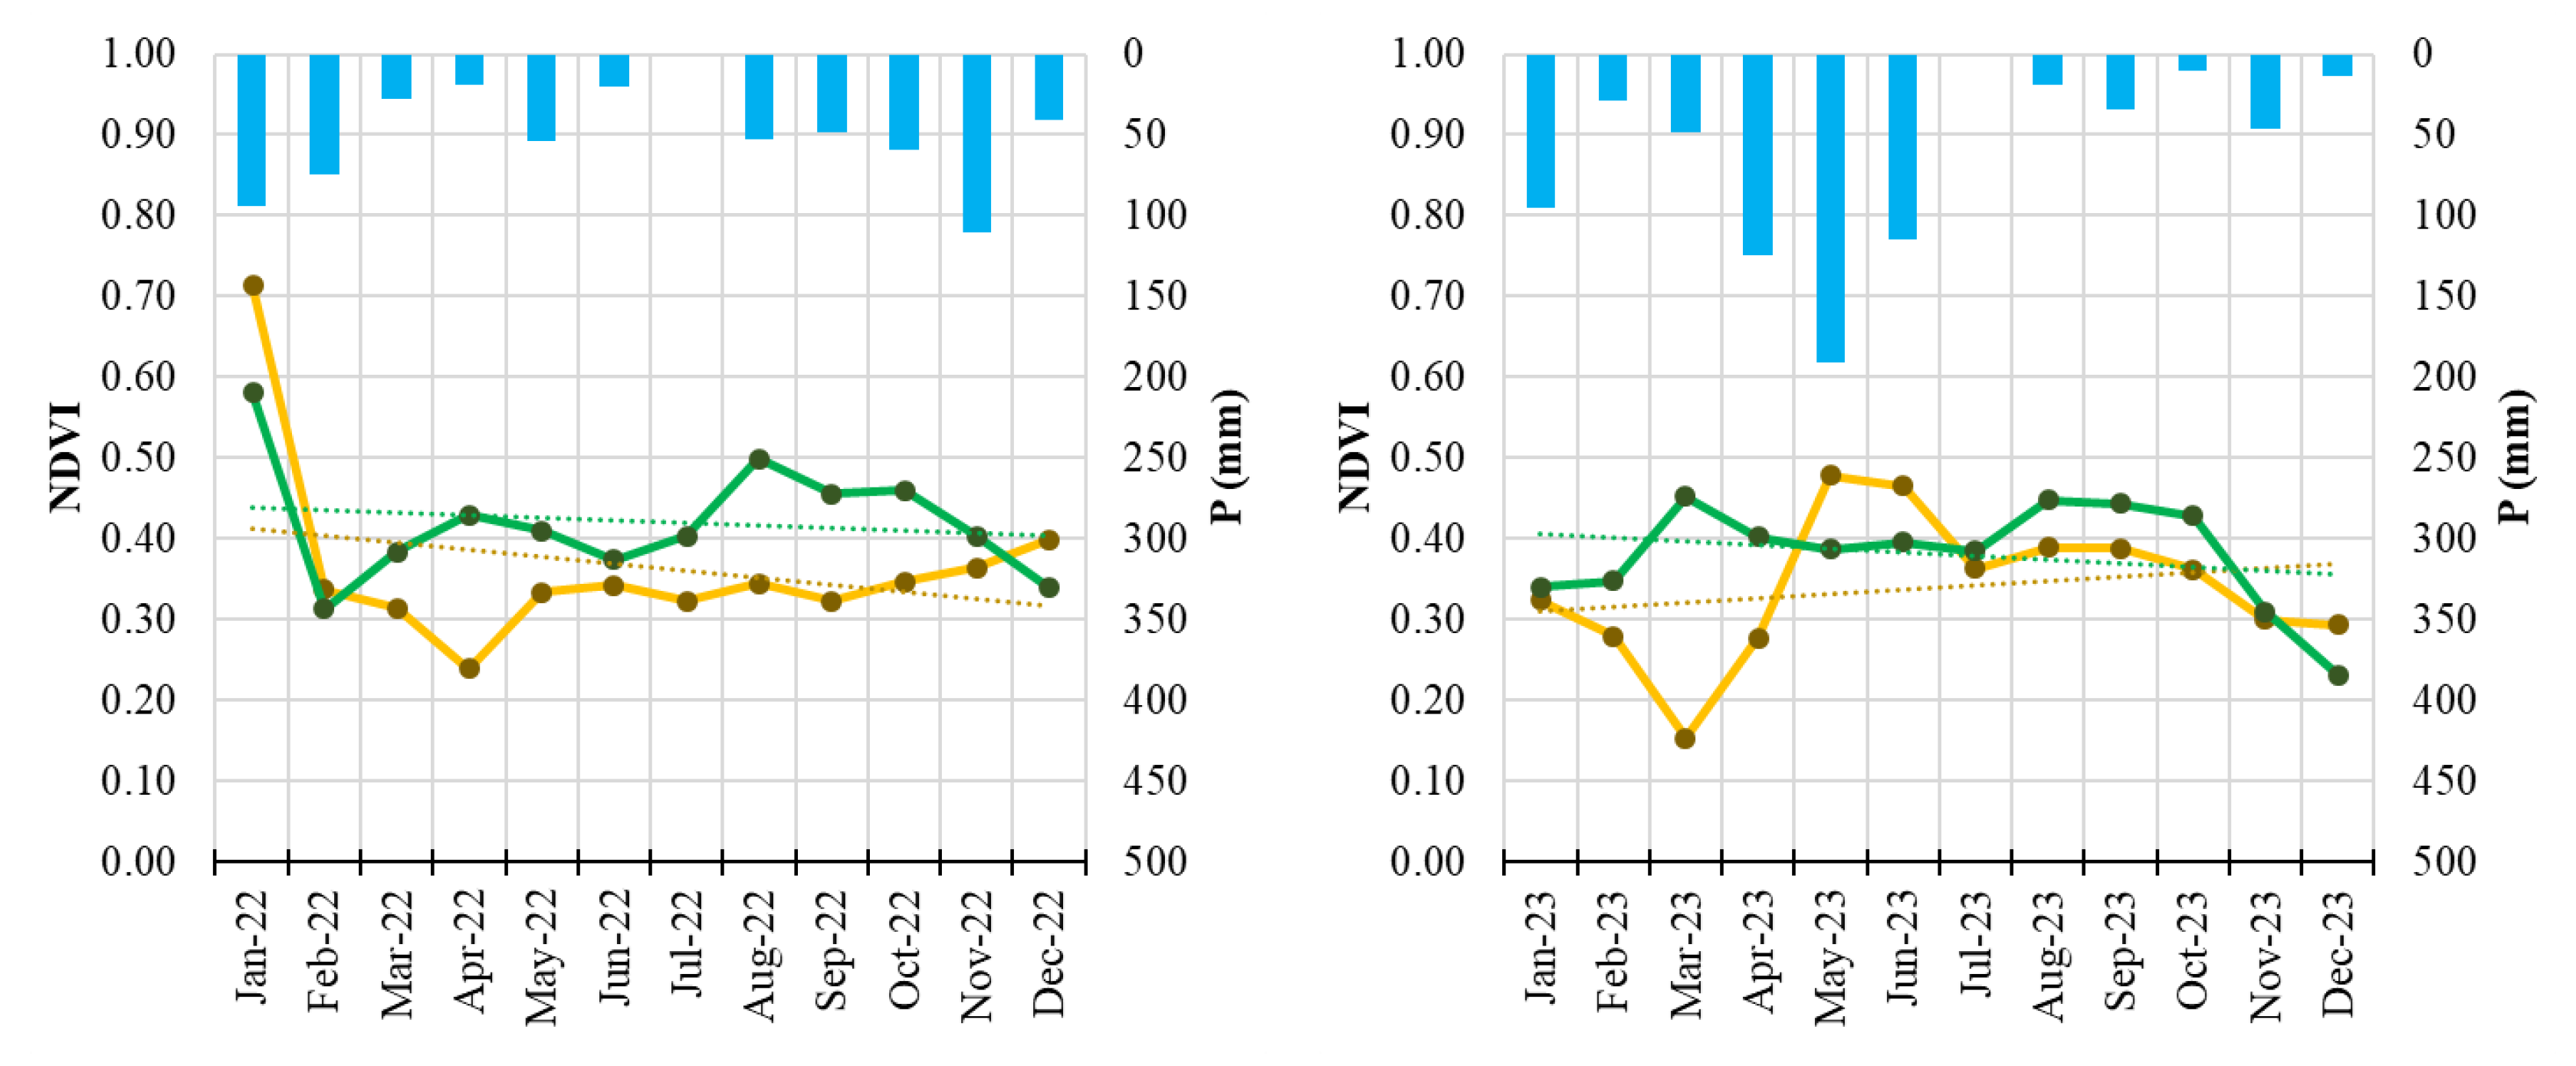
Monthly NDVI time series of Field 3 (symptomatic orchard, yellow line) and the healthy reference orchard (Field H, green line) from January 2022 to December 2023. Solid lines represent monthly NDVI values; dotted lines indicate linear trends. Blue bars represent monthly precipitation totals.
Figure 5.
Monthly NDVI time series of Field 3 (symptomatic orchard, yellow line) and the healthy reference orchard (Field H, green line) from January 2022 to December 2023. Solid lines represent monthly NDVI values; dotted lines indicate linear trends. Blue bars represent monthly precipitation totals.
Figure 6.
Monthly NDVI time series of Field 8 (symptomatic orchard, red line) and the healthy reference orchard (Field H, green line) from January 2018 to December 2023. Solid lines represent monthly NDVI values; dotted lines indicate linear trends. Blue bars represent monthly precipitation totals.
Figure 6.
Monthly NDVI time series of Field 8 (symptomatic orchard, red line) and the healthy reference orchard (Field H, green line) from January 2018 to December 2023. Solid lines represent monthly NDVI values; dotted lines indicate linear trends. Blue bars represent monthly precipitation totals.
Figure 7.
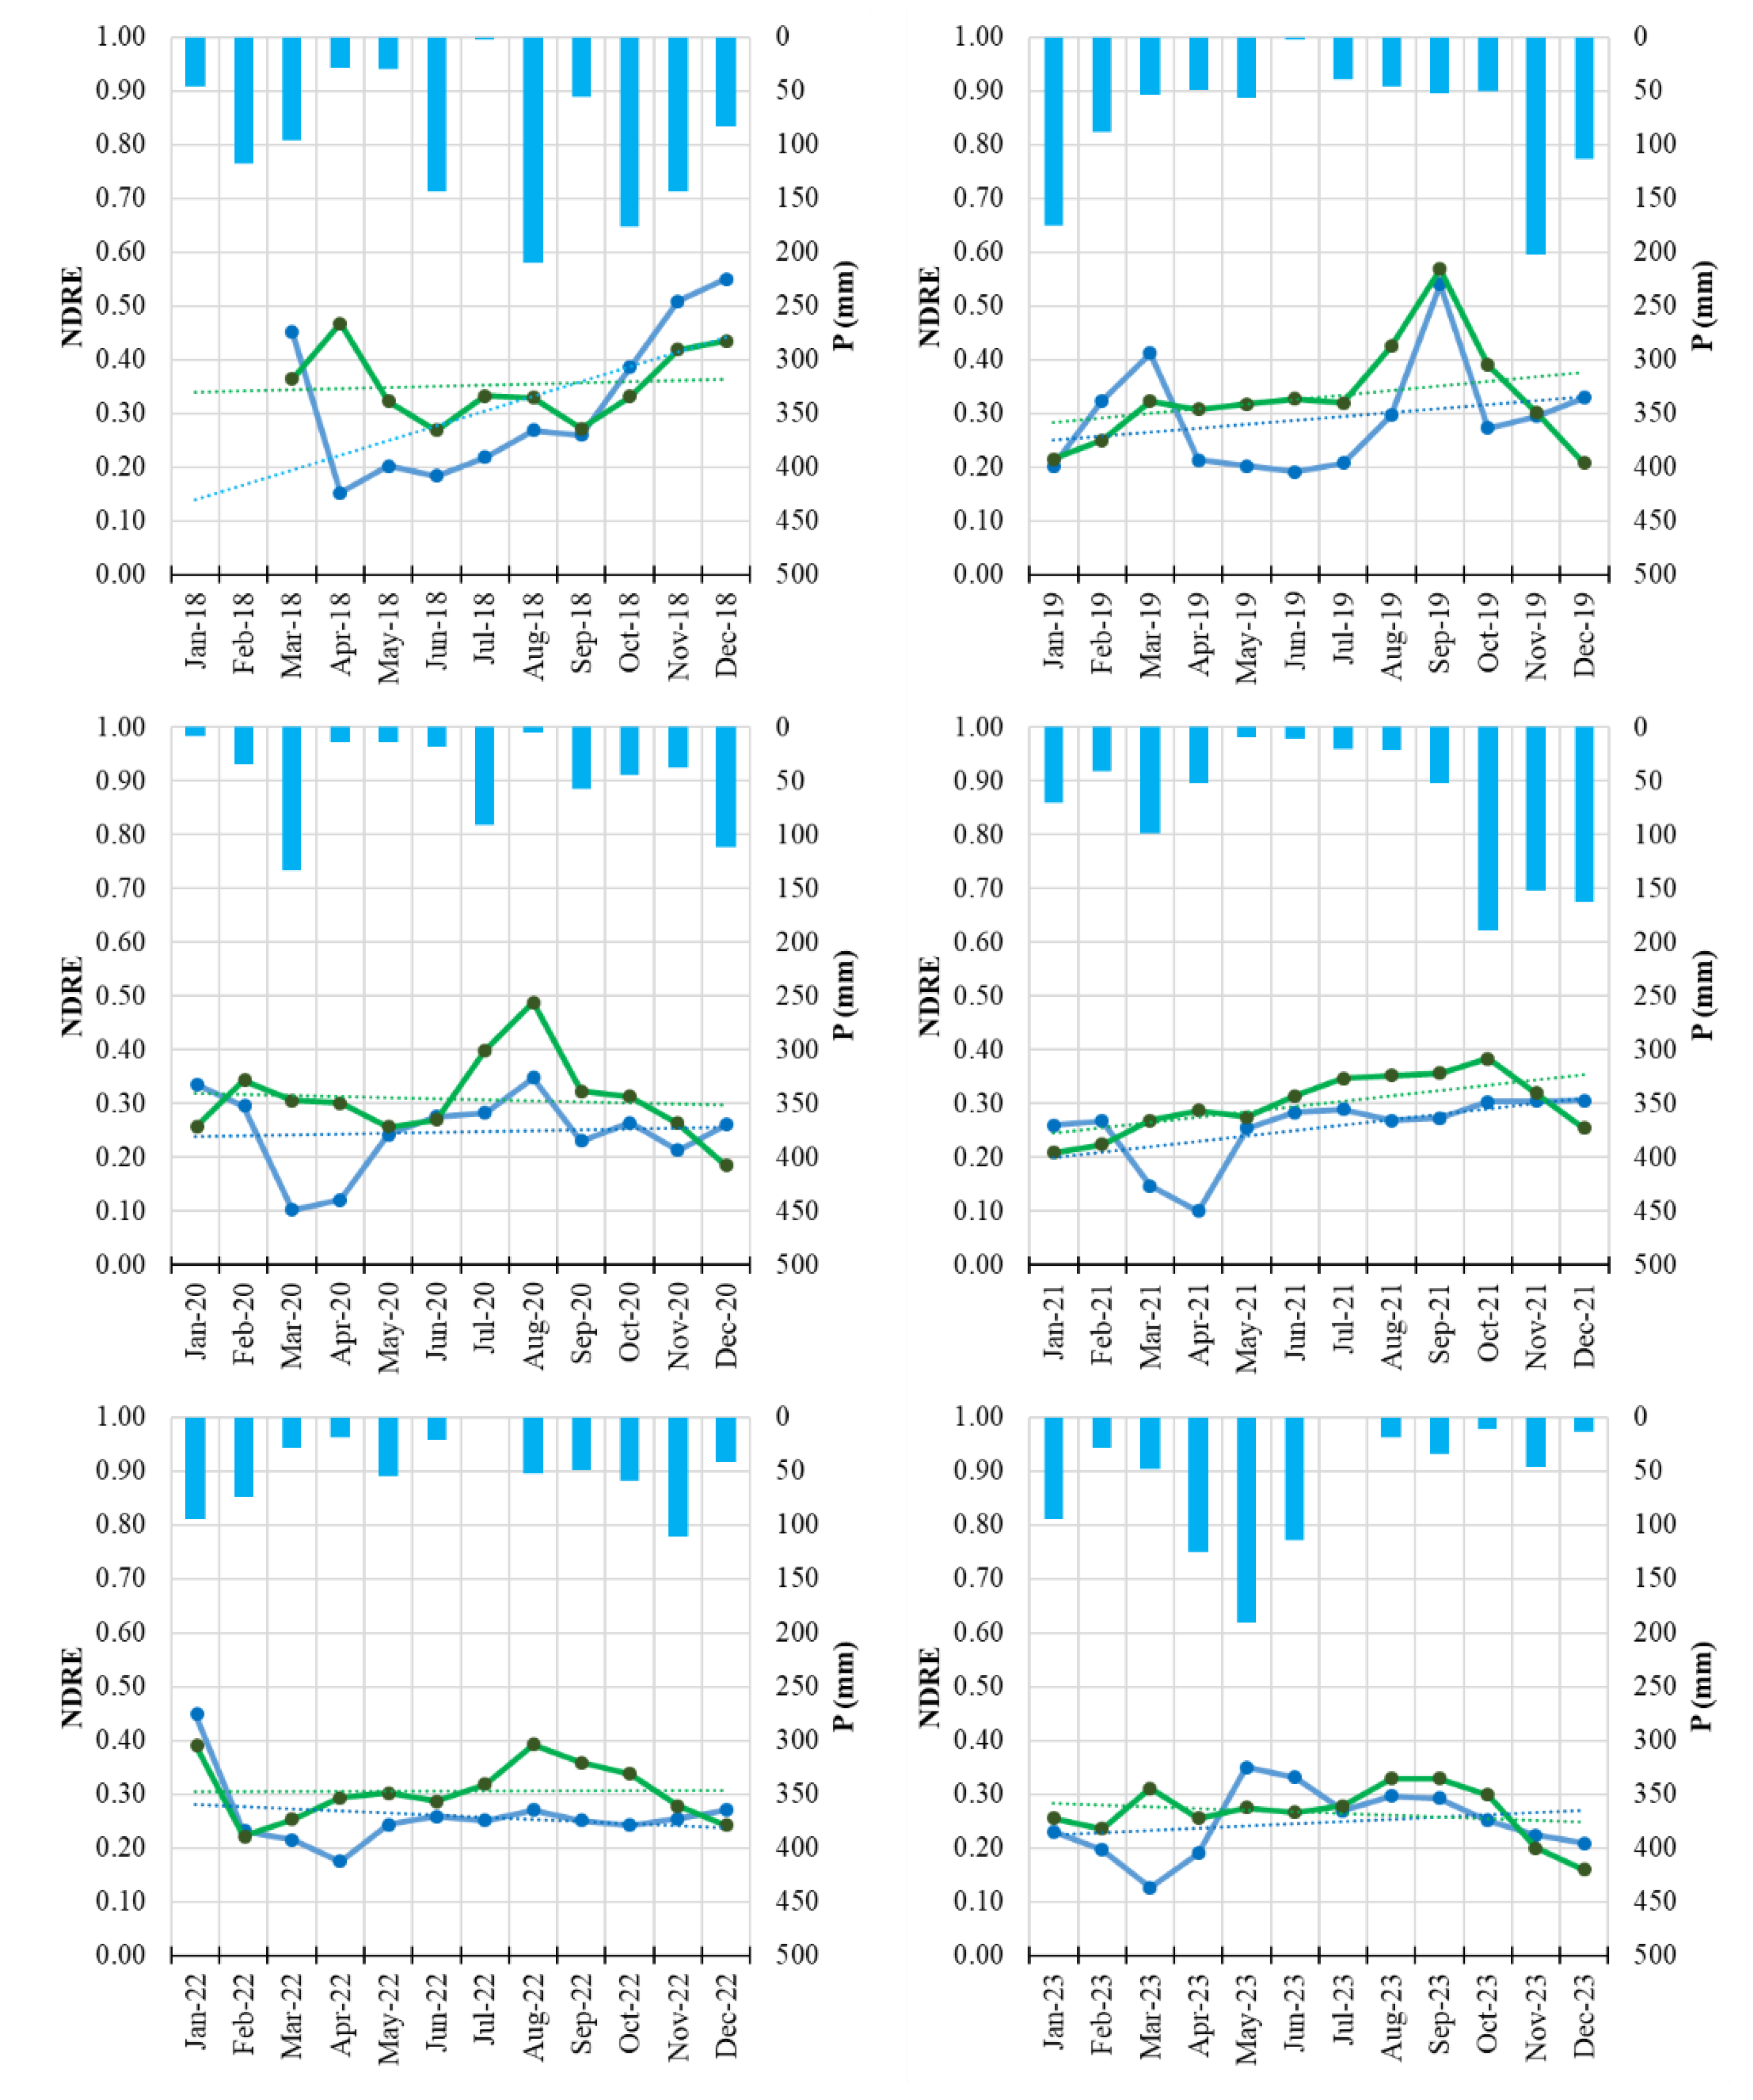
Monthly NDRE time series of Field 1 (symptomatic orchard, blue line) and the healthy reference orchard (Field H, green line) from January 2018 to December 2023. Solid lines represent monthly NDRE values; dotted lines indicate linear trends. Blue bars represent monthly precipitation totals.
Figure 7.
Monthly NDRE time series of Field 1 (symptomatic orchard, blue line) and the healthy reference orchard (Field H, green line) from January 2018 to December 2023. Solid lines represent monthly NDRE values; dotted lines indicate linear trends. Blue bars represent monthly precipitation totals.
Figure 8.
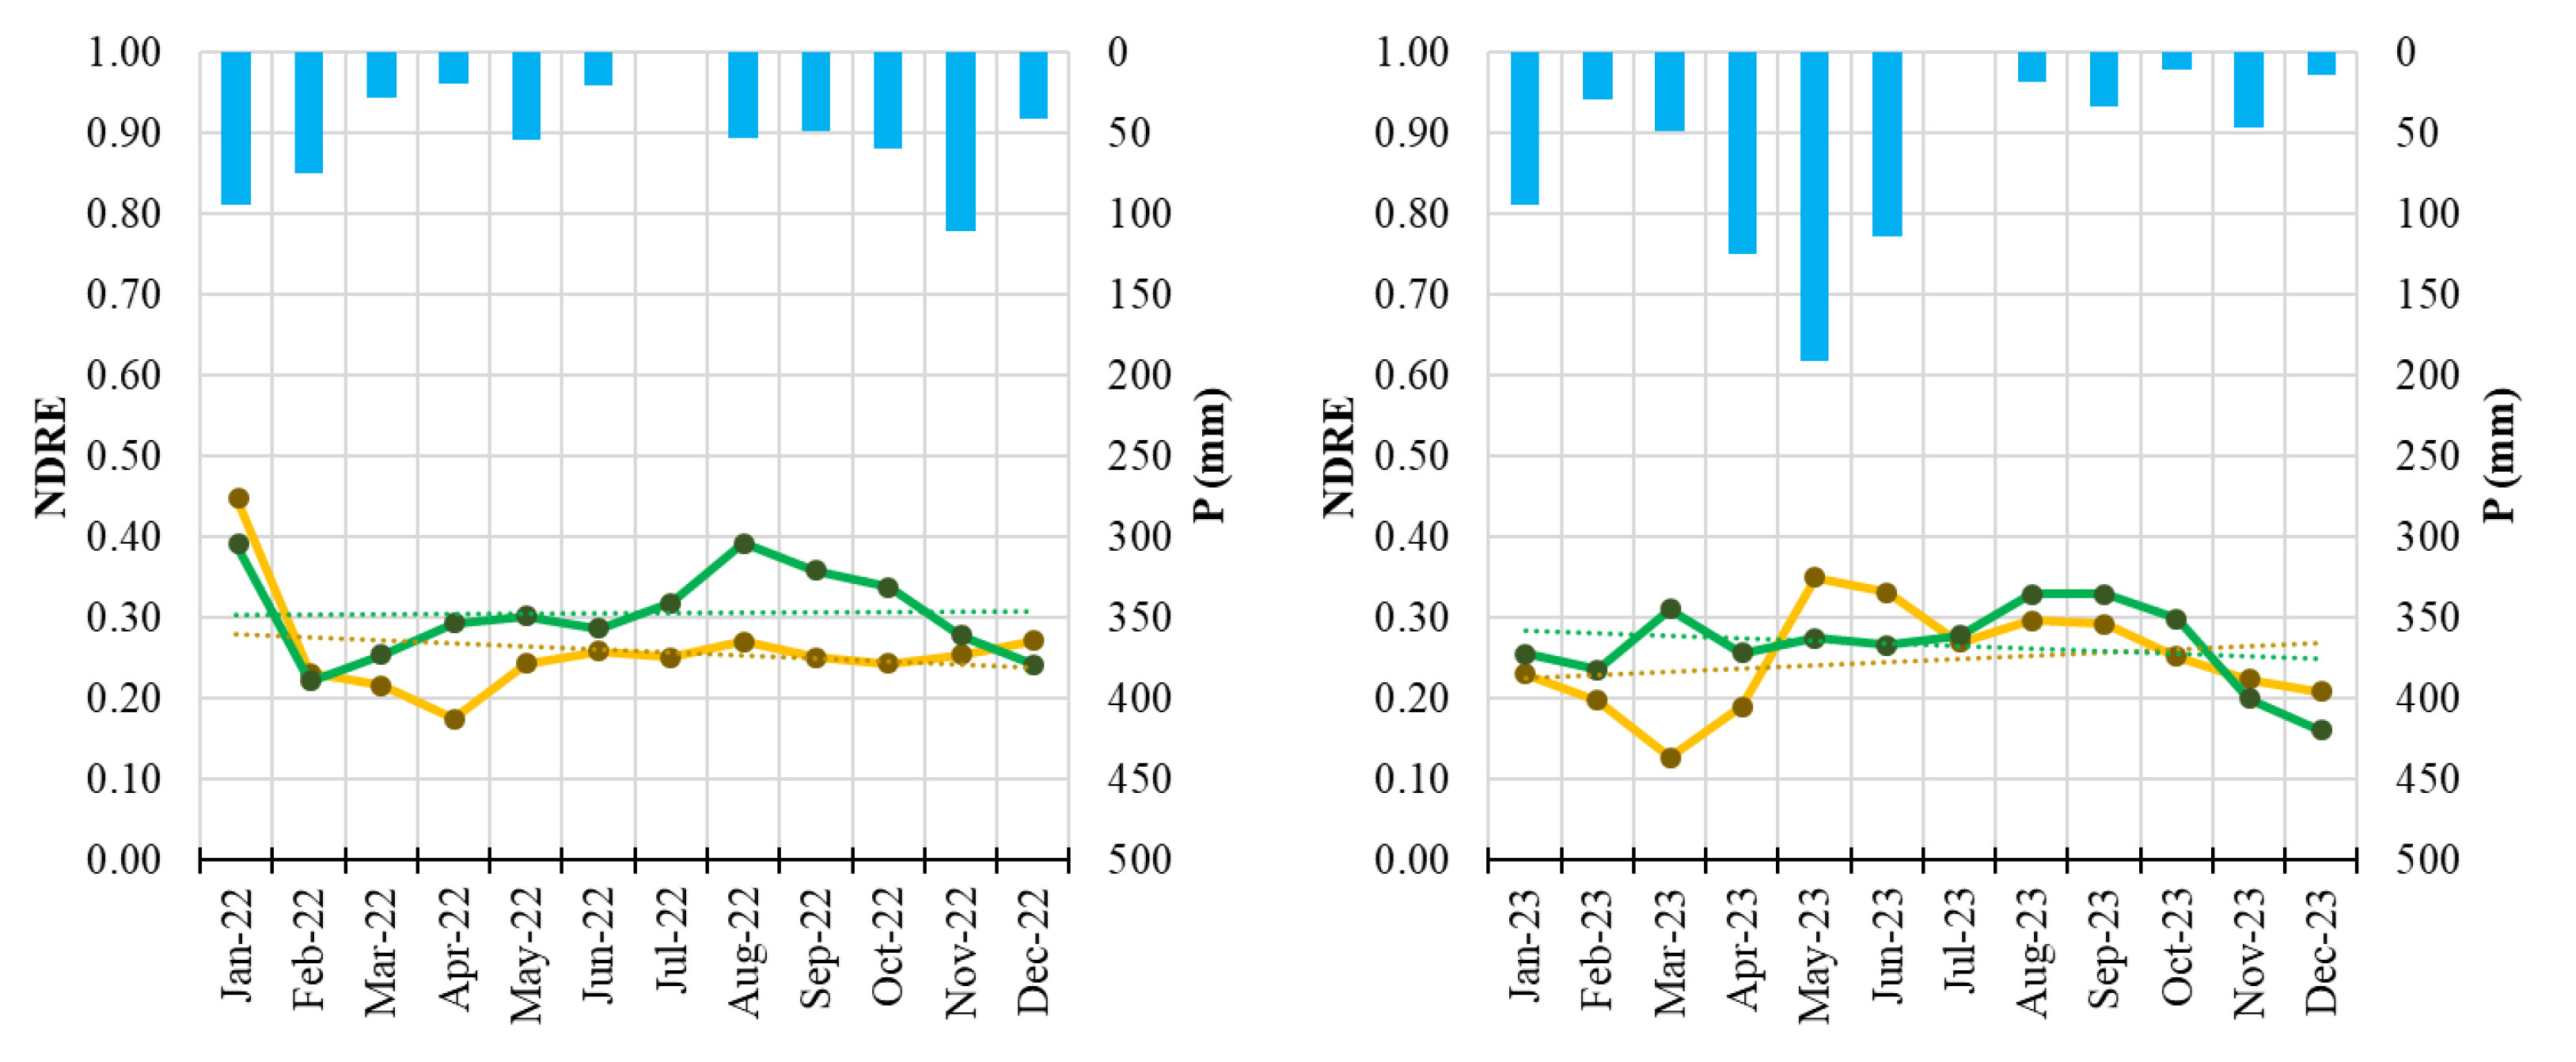
Monthly NDRE time series of Field 3 (symptomatic orchard, yellow line) and the healthy reference orchard (Field H, green line) from January 2022 to December 2023. Solid lines represent monthly NDRE values; dotted lines indicate linear trends. Blue bars represent monthly precipitation totals.
Figure 8.
Monthly NDRE time series of Field 3 (symptomatic orchard, yellow line) and the healthy reference orchard (Field H, green line) from January 2022 to December 2023. Solid lines represent monthly NDRE values; dotted lines indicate linear trends. Blue bars represent monthly precipitation totals.
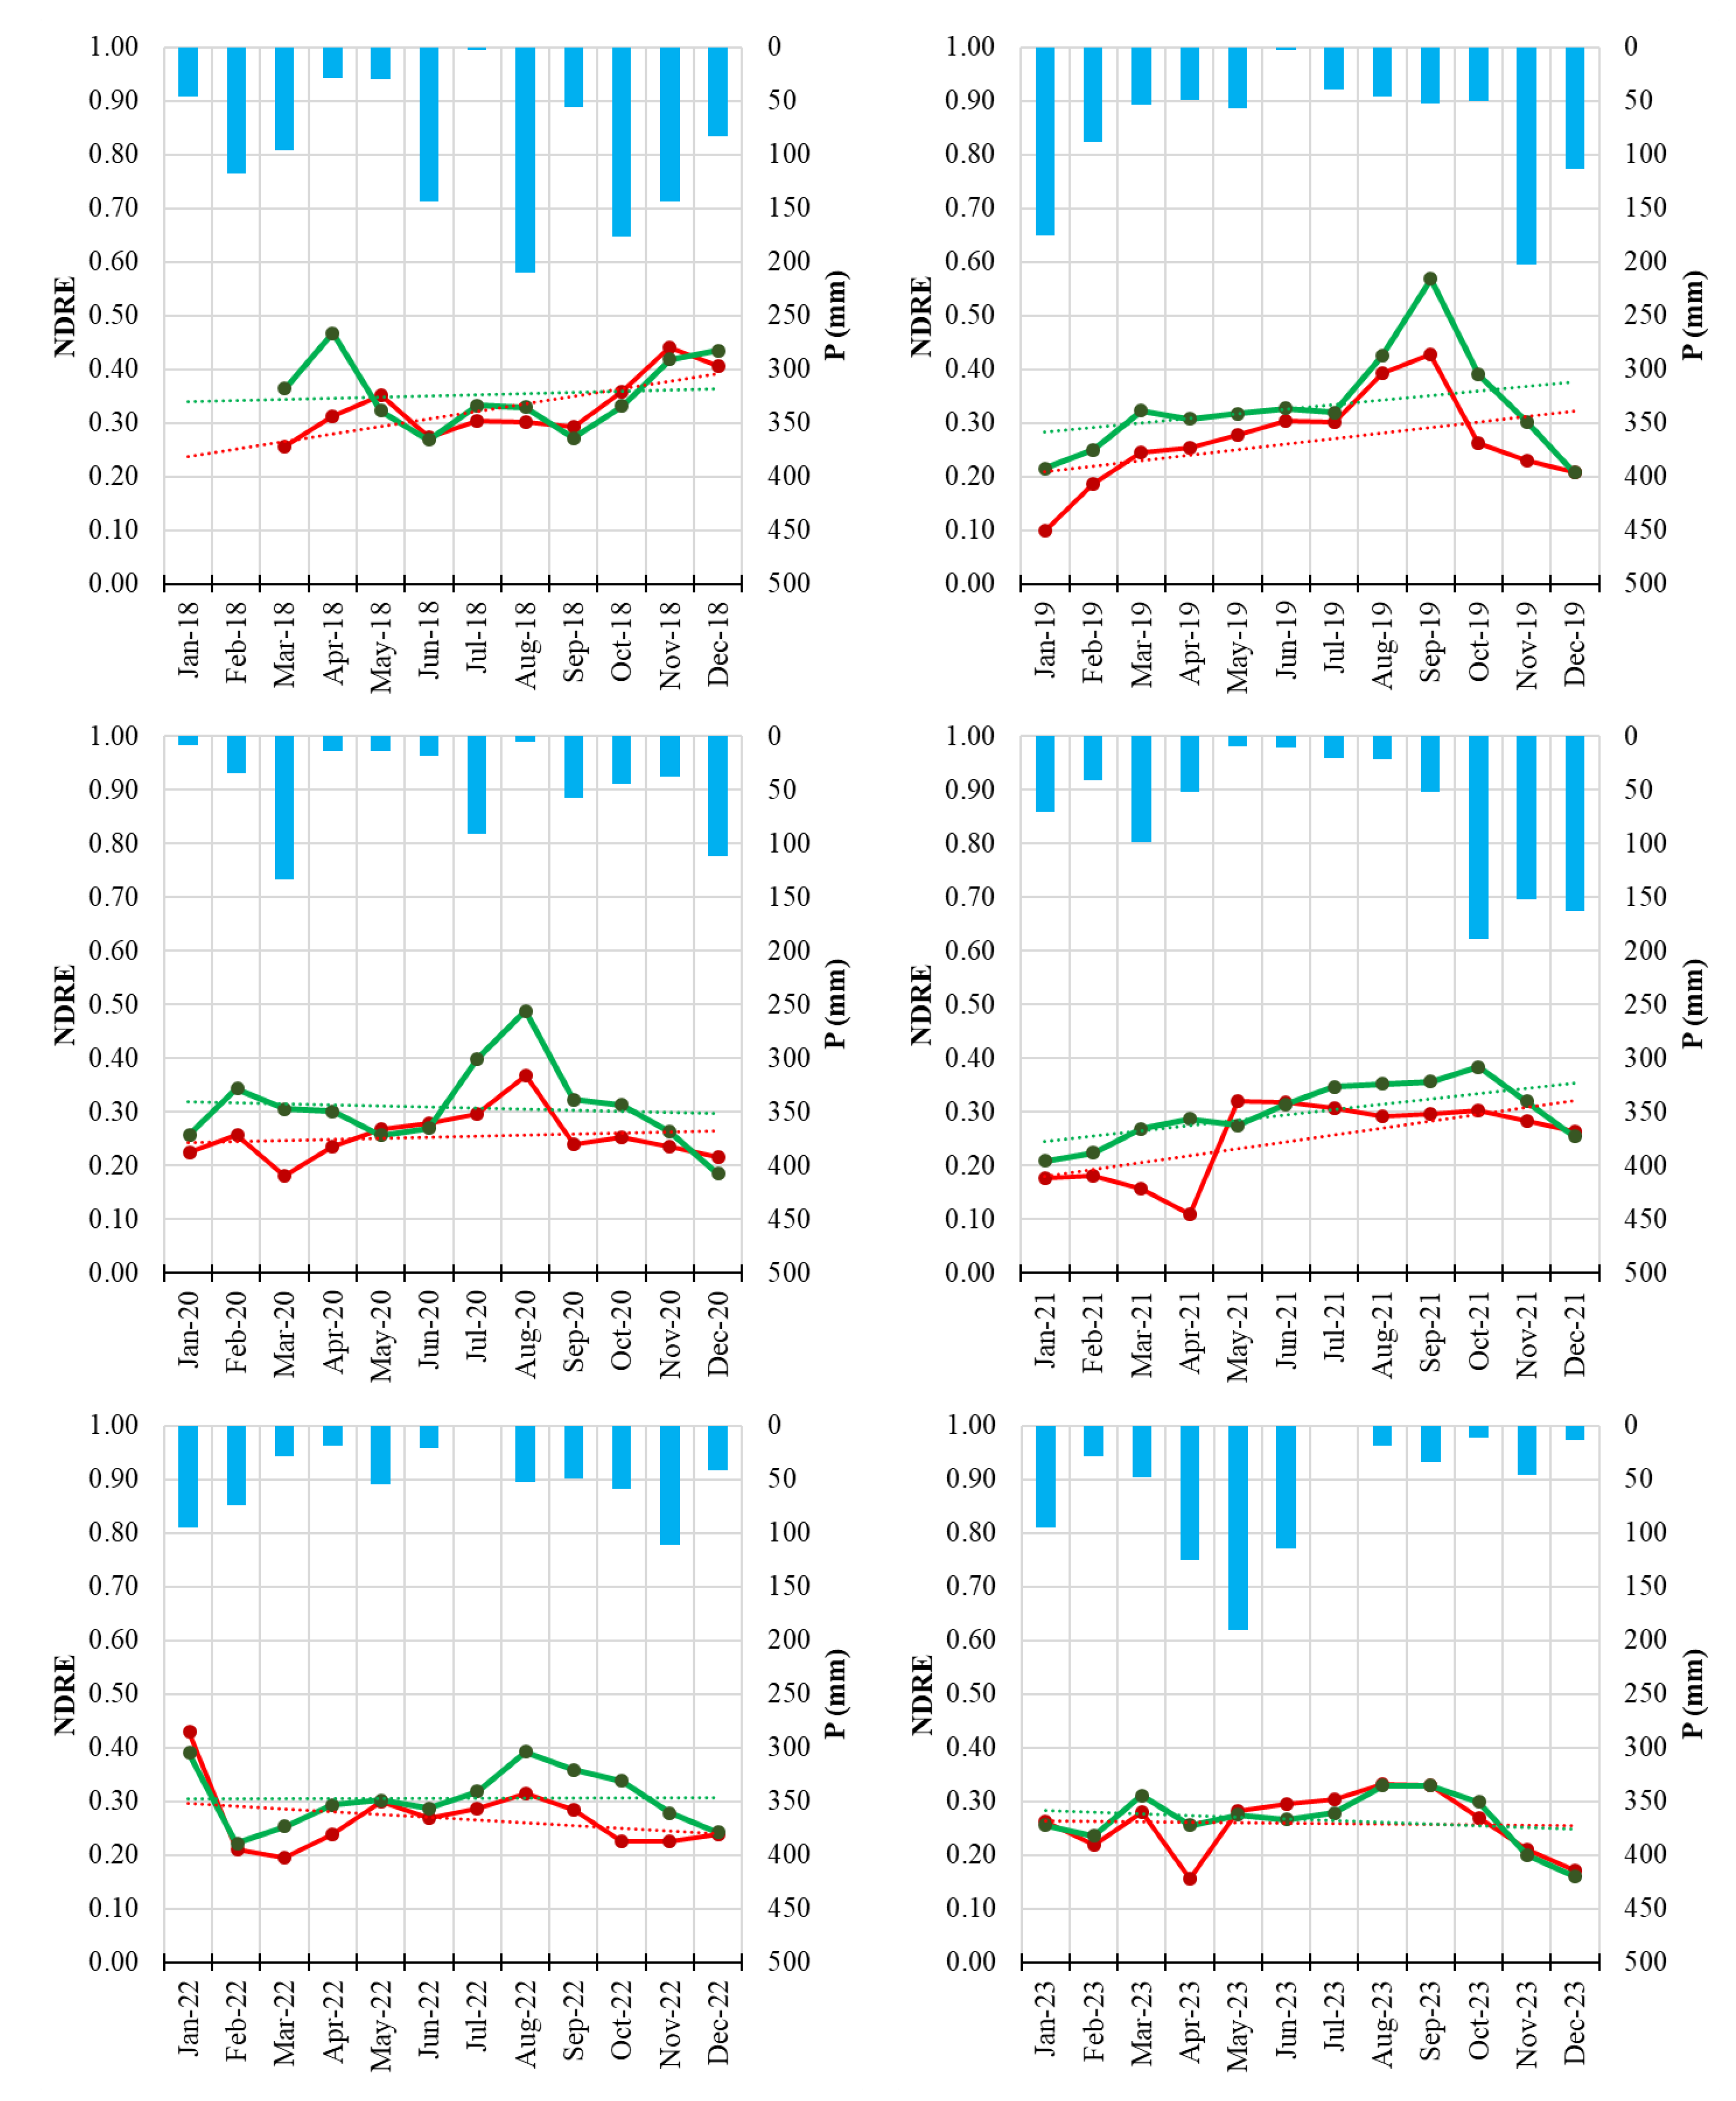
Figure 9.
Monthly NDRE time series of Field 8 (symptomatic orchard, red line) and the healthy reference orchard (Field H, green line) from January 2018 to December 2023. Solid lines represent monthly NDRE values; dotted lines indicate linear trends. Blue bars represent monthly precipitation totals.
Figure 9.
Monthly NDRE time series of Field 8 (symptomatic orchard, red line) and the healthy reference orchard (Field H, green line) from January 2018 to December 2023. Solid lines represent monthly NDRE values; dotted lines indicate linear trends. Blue bars represent monthly precipitation totals.
Table 1.
characteristics of fields chosen after visual survey and plant sampling. Field code was used for sampling collection.
Table 1.
characteristics of fields chosen after visual survey and plant sampling. Field code was used for sampling collection.
Table 2.
List of isolates used for the construction of the phylogenetic trees.
Table 2.
List of isolates used for the construction of the phylogenetic trees.
Table 3.
Annual mean NDVI values (± standard deviation) for the three symptomatic orchards (Fields 1, 3, and 8) and the healthy reference orchard (Field H) during the 2018–2023 monitoring period. Missing values for Field 3 reflect the establishment year of the orchard (planted in 2022).
Table 3.
Annual mean NDVI values (± standard deviation) for the three symptomatic orchards (Fields 1, 3, and 8) and the healthy reference orchard (Field H) during the 2018–2023 monitoring period. Missing values for Field 3 reflect the establishment year of the orchard (planted in 2022).
| |
2018 |
2019 |
2020 |
2021 |
2022 |
2023 |
| |
mean |
st_dev |
mean |
st_dev |
mean |
st_dev |
mean |
st_dev |
mean |
st_dev |
mean |
st_dev |
| Field 1 |
0.45 |
0.23 |
0.41 |
0.15 |
0.36 |
0.12 |
0.36 |
0.10 |
0.37 |
0.12 |
0.34 |
0.09 |
| Field 3 |
|
|
|
|
|
|
|
|
0.22 |
0.09 |
0.33 |
0.09 |
| Field 8 |
0.48 |
0.12 |
0.38 |
0.12 |
0.37 |
0.07 |
0.36 |
0.11 |
0.38 |
0.10 |
0.37 |
0.08 |
| Field H |
0.51 |
0.13 |
0.46 |
0.12 |
0.44 |
0.09 |
0.43 |
0.07 |
0.42 |
0.07 |
0.38 |
0.07 |
Table 4.
Annual mean NDRE values (± standard deviation) for the three symptomatic orchards (Fields 1, 3, and 8) and the healthy reference orchard (Field H) during the 2018–2023 monitoring period. Missing values for Field 3 reflect the establishment year of the orchard (planted in 2022).
Table 4.
Annual mean NDRE values (± standard deviation) for the three symptomatic orchards (Fields 1, 3, and 8) and the healthy reference orchard (Field H) during the 2018–2023 monitoring period. Missing values for Field 3 reflect the establishment year of the orchard (planted in 2022).
| |
2018 |
2019 |
2020 |
2021 |
2022 |
2023 |
| |
mean |
st_dev |
mean |
st_dev |
mean |
st_dev |
mean |
st_dev |
mean |
st_dev |
mean |
st_dev |
| Field 1 |
0.32 |
0.14 |
0.29 |
0.10 |
0.25 |
0.07 |
0.25 |
0.06 |
0.26 |
0.07 |
0.25 |
0.06 |
| Field 3 |
|
|
|
|
|
|
|
|
0.17 |
0.06 |
0.24 |
0.06 |
| Field 8 |
0.33 |
0.06 |
0.27 |
0.09 |
0.25 |
0.05 |
0.25 |
0.07 |
0.27 |
0.06 |
0.26 |
0.06 |
| Field H |
0.35 |
0.07 |
0.33 |
0.10 |
0.31 |
0.08 |
0.30 |
0.06 |
0.31 |
0.06 |
0.27 |
0.05 |