
Submitted:
10 December 2025
Posted:
12 December 2025
You are already at the latest version
Abstract
The toxic effects of fluorides on aquatic organisms have raised widespread concerns on their pollution in water bodies. This study derived water quality criteria for fluorides by collecting acute and chronic toxicity data globally and conducted an ecological risk assessment of fluoride concentrations in China's surface water: the acute toxicity data covered 34 species across 14 families and 4 phyla, while the chronic toxicity data covered 7 species across 5 families and 3 phyla; Using the species sensitivity distribution (SSD), the water quality criteria SWQC and LWQC were determined to be 17.47 mg/L and 3.334 mg/L, respectively; An ecological risk assessment of fluoride concentrations in China's surface water was conducted using the risk quotient (RQ), identifying the Shahe River, Xihe River, Ebinur Lake, and Chagan Lake as high risk areas among 32 river and lake basins. Among 21 provincial-level administrative regions, the Guangxi Zhuang Autonomous Region was assessed as no risk, while the remaining river and lake basins and administrative regions were classified as moderate risk or low risk. The findings of this study can serve as a reference for subsequent research and detailed optimization in related fields.
Keywords:
fluoride
; water quality criteria
; risk assessment
; species sensitivity method
; risk quotient
1. Introduction
Fluorine is a common element in nature, first discovered by German scholar Georgius Agricola in the form of fluorite (calcium fluoride, CaF2) in 1529 [1]. Broadly speaking, fluoride refers to compounds containing fluorine elements, but in academia, fluoride usually refers to ionic fluorides (mostly inorganic fluorides). The sources of fluoride include volcanic eruptions, rock weathering, industrial production emissions, etc. It exists in the atmosphere, soil, and water bodies [2]. The types and contents of fluoride are regulated by different factors. For example, fluoride in soil and water is mainly present as fluorine-containing particles (e.g., Al2(SiF6)3, CaF2, AlF3), while gaseous fluoride (e.g., HF, SiF4) is also present in the atmosphere in addition to fluorine-containing particles [3]. As a fluoride, HF is an important intermediate widely used in important industrial production activities such as chemical, material, and energy industries, making it the main form of fluoride emissions [4]. Fluorine has a wide range of harmful effects on living organisms, causing damage to various organ systems in the human body, leading to diseases, e.g., vascular inflammation and hardening, tooth and bone mineralization. Animals consuming plants or feed with high fluoride content may experience similar symptoms; Plants will experience slow development of their roots, leaves, buds, and other tissues and organs after being enriched with fluoride, resulting in damage during branching, fruiting, and other growth stages [5,6,7,8]. The nature of fluorosis varies in different countries and regions in the world. It is mainly divided into drinking water type fluorosis, tea drinking type fluorosis and coal burning pollution type fluorosis. Drinking water type fluorosis is widespread in all countries in the world, tea drinking type fluorosis is mainly distributed in China, Spain, Vietnam, Britain, Jordan, and coal burning pollution type fluorosis is unique to China, mainly in the North China Plain and provincial-level administrative regions in the south [9,10,11,12,13,14,15,16,17,18,19]. In addition, various endemic fluorosis caused by inorganic fluorides have not been effectively controlled and managed. Taking China as an example, as of 2023, the detection rate of fluorosis in children in 28 provincial-level administrative regions was 8.61%, and the detection rate of fluorosis in adults in 7 provincial-level administrative regions was 8.52% [20]. According to data from the National Health and Nutrition Examination Survey (NHANES) in 2004, the prevalence of dental fluorosis in the United States was 23%, with adolescents accounting for 41% [21]. These data indicate that fluorosis is still having an impact on human health.
As an important medium for the abundant occurrence of fluoride, fluoride pollution in water bodies has received widespread attention. Fluoride poses a significant threat to the growth and development of aquatic organisms. Camargo summarized the acute symptoms of fluoride poisoning in fish exposed to fluoride: as the concentration of fluoride increases, symptoms, e.g., drowsiness, apathy, loss of appetite, and decreased respiratory rate occur, while the observed fluoride levels in the blood increase; Mid stage fish have blackened back skin and mucous secretion from the epidermis and respiratory organs; Later, they died in a state of muscle paralysis [22]. According to reports, some fluoride sensitive invertebrates (e.g., brown mussel) can have a mortality rate of up to 30% when exposed to an initial concentration of 7.2 mg/L for up to 120 hours [23]. It can be seen that it is necessary to conduct water quality criteria research on fluoride and continuously update research progress. The water quality standard refers to the maximum concentration or level of pollutants or harmful factors in the water environment that do not have harmful effects on human health or aquatic ecosystems. It provides a scientific basis for the development of water quality standards [24]. At present, the water quality limits for ionic fluorides exist in the current standards of many countries. In China, the fluoride (calculated as F-) limit range specified in the “Surface Water Environment Quality Standard” (GB 3838-2002), “Groundwater Quality Standard” (GB/T 14848-2017), and “Standard for Drinking Water Quality” (GB 5749-2022) is 1.0 mg/L-2.0 mg/L. This is almost the same as the fluoride limit values in most countries, which means that many countries may not have scientifically standardized water quality standards based on their own biological specificity and usage needs. Based on this, this study collected fluoride toxicity data in recent years and used the species sensitivity distribution (SSD) method to derive acute and chronic criteria. China was selected as the study area, and the risk quotient (RQ) method was used to assess the ecological risk of surface water within its territory, providing reference for research on fluoride limit values.
2. Materials and Methods
2.1. Collection and Screening of Toxicity Data
The principles of data collection and screening follow the Chinese “Technical guideline for deriving water quality criteria for freshwater organisms” (HJ 831-2022) (hereinafter referred to as the “Guideline”), sourced from the ECOTOX database, Web of Science, China National Knowledge Infrastructure and other databases. The collected data will be screened, and the specific screening content is as follows: (1) Due to the fact that the species involved in the collected data are not limited to native Chinese species, only some Chinese freshwater invasive species will be removed based on the relevant list in Appendix C of the guideline; (2) For the most suitable exposure time in experimental conditions, it is stipulated that for animal acute experiments, it is about 24 hours for rotifers, 48 hours for fleas and chironomatodes, and 96 hours for other species. For plant acute experiments, it is about 96 hours. For animal chronic experiments, it is not less than 48 hours for rotifers, not less than 21 days for other animals, or covering a sensitive life cycle. For plant chronic experiments, it is not less than 21 days or covering one generation; (3) For the screening of exposure types, it is stipulated that static, semi static, and flow-through can be selected for acute experiments, semi static and flow-through can be selected for chronic experiments, and static and semi static can be selected for microalgae; (4) Priority of toxicity data: LC50 and EC50 can be used as acute toxicity endpoints without distinguishing priority. Chronic toxicity endpoints are MATC (maxium acceptable toxicant concentration)=CVE (chronic value for the same effect)>EC20 (20% effect concentration)>EC10=NOEC(no observed effect concentration)>LOEC(lowest observed effect concentration)>EC50>LC50. Exposure endpoints are classified as flow-through exposure data>semi static exposure data>static exposure data [25].
2.2. Species Sensitivity Distribution Method
The species sensitivity distribution method is a recommended method for deriving water quality criteria of freshwater organisms in the guideline. It is a method that uses different models to fit the distribution of species sensitivity and calculate the pollutant concentration that can protect (100-x)% of organisms, namely HCx (hazardous concentration for x% of species), and then extrapolates the evaluation factors to obtain the standard [26]. This method reflects the differences in sensitivity of different species to the same pollutant due to postnatal factors, e.g., lifestyle habits and geographical location in toxicology, and can use different optimal probability models to describe these sensitivities, making it easier to compare differences [27]. This method involves a series of data processing and selecting appropriate models for fitting, ultimately deriving SWQC (short-term water quality criteria for aquatic organisms) and LWQC (long-term water quality criteria for aquatic organisms). The specific steps are shown in Figure 1. The model with RMSE (root mean square error) closest to 0 (indicating the highest model fitting accuracy) and a probability P-value>0.05 is considered as the optimal model. The selection of AF (assessment factor) is based on the value of 3 when the number of species covered by toxicity data is less than or equal to 15, and 2 when the number is less than or equal to 15 [28]. The fitting software used in this study is the Chinese “National Ecological Environment Criteria Calculation Software-Species Sensitivity Distribution Method” (EEC-SSD).
2.3. Ecological Risk Assessment
The risk quotient method is a relatively simple ecological risk assessment method, mainly used for risk assessment of surface water. The calculation formula for this method is as follows:
In the formula, HC5 is the 5% species hazard concentration, measured in mg/L; AF is assessment factor, dimensionless; ρWQC is the derived water quality criteria concentration, measured in mg/L; ρMEC is the measured environmental concentration, and in this article, the collected concentration data is in mg/L; RQ is the risk quotient value, dimensionless. The basis for risk assessment is that RQ ≥ 1 indicates a high ecological risk of fluoride in the local water body, 1>RQ ≥ 0.1 indicates a moderate ecological risk of fluoride in the local water body, 0.1>RQ ≥ 0.01 indicates a low ecological risk of fluoride in the local water body, and RQ<0.01 indicates no ecological risk of fluoride in the local water body [29].
3. Results
3.1. Collection and Screening of Toxicity Data
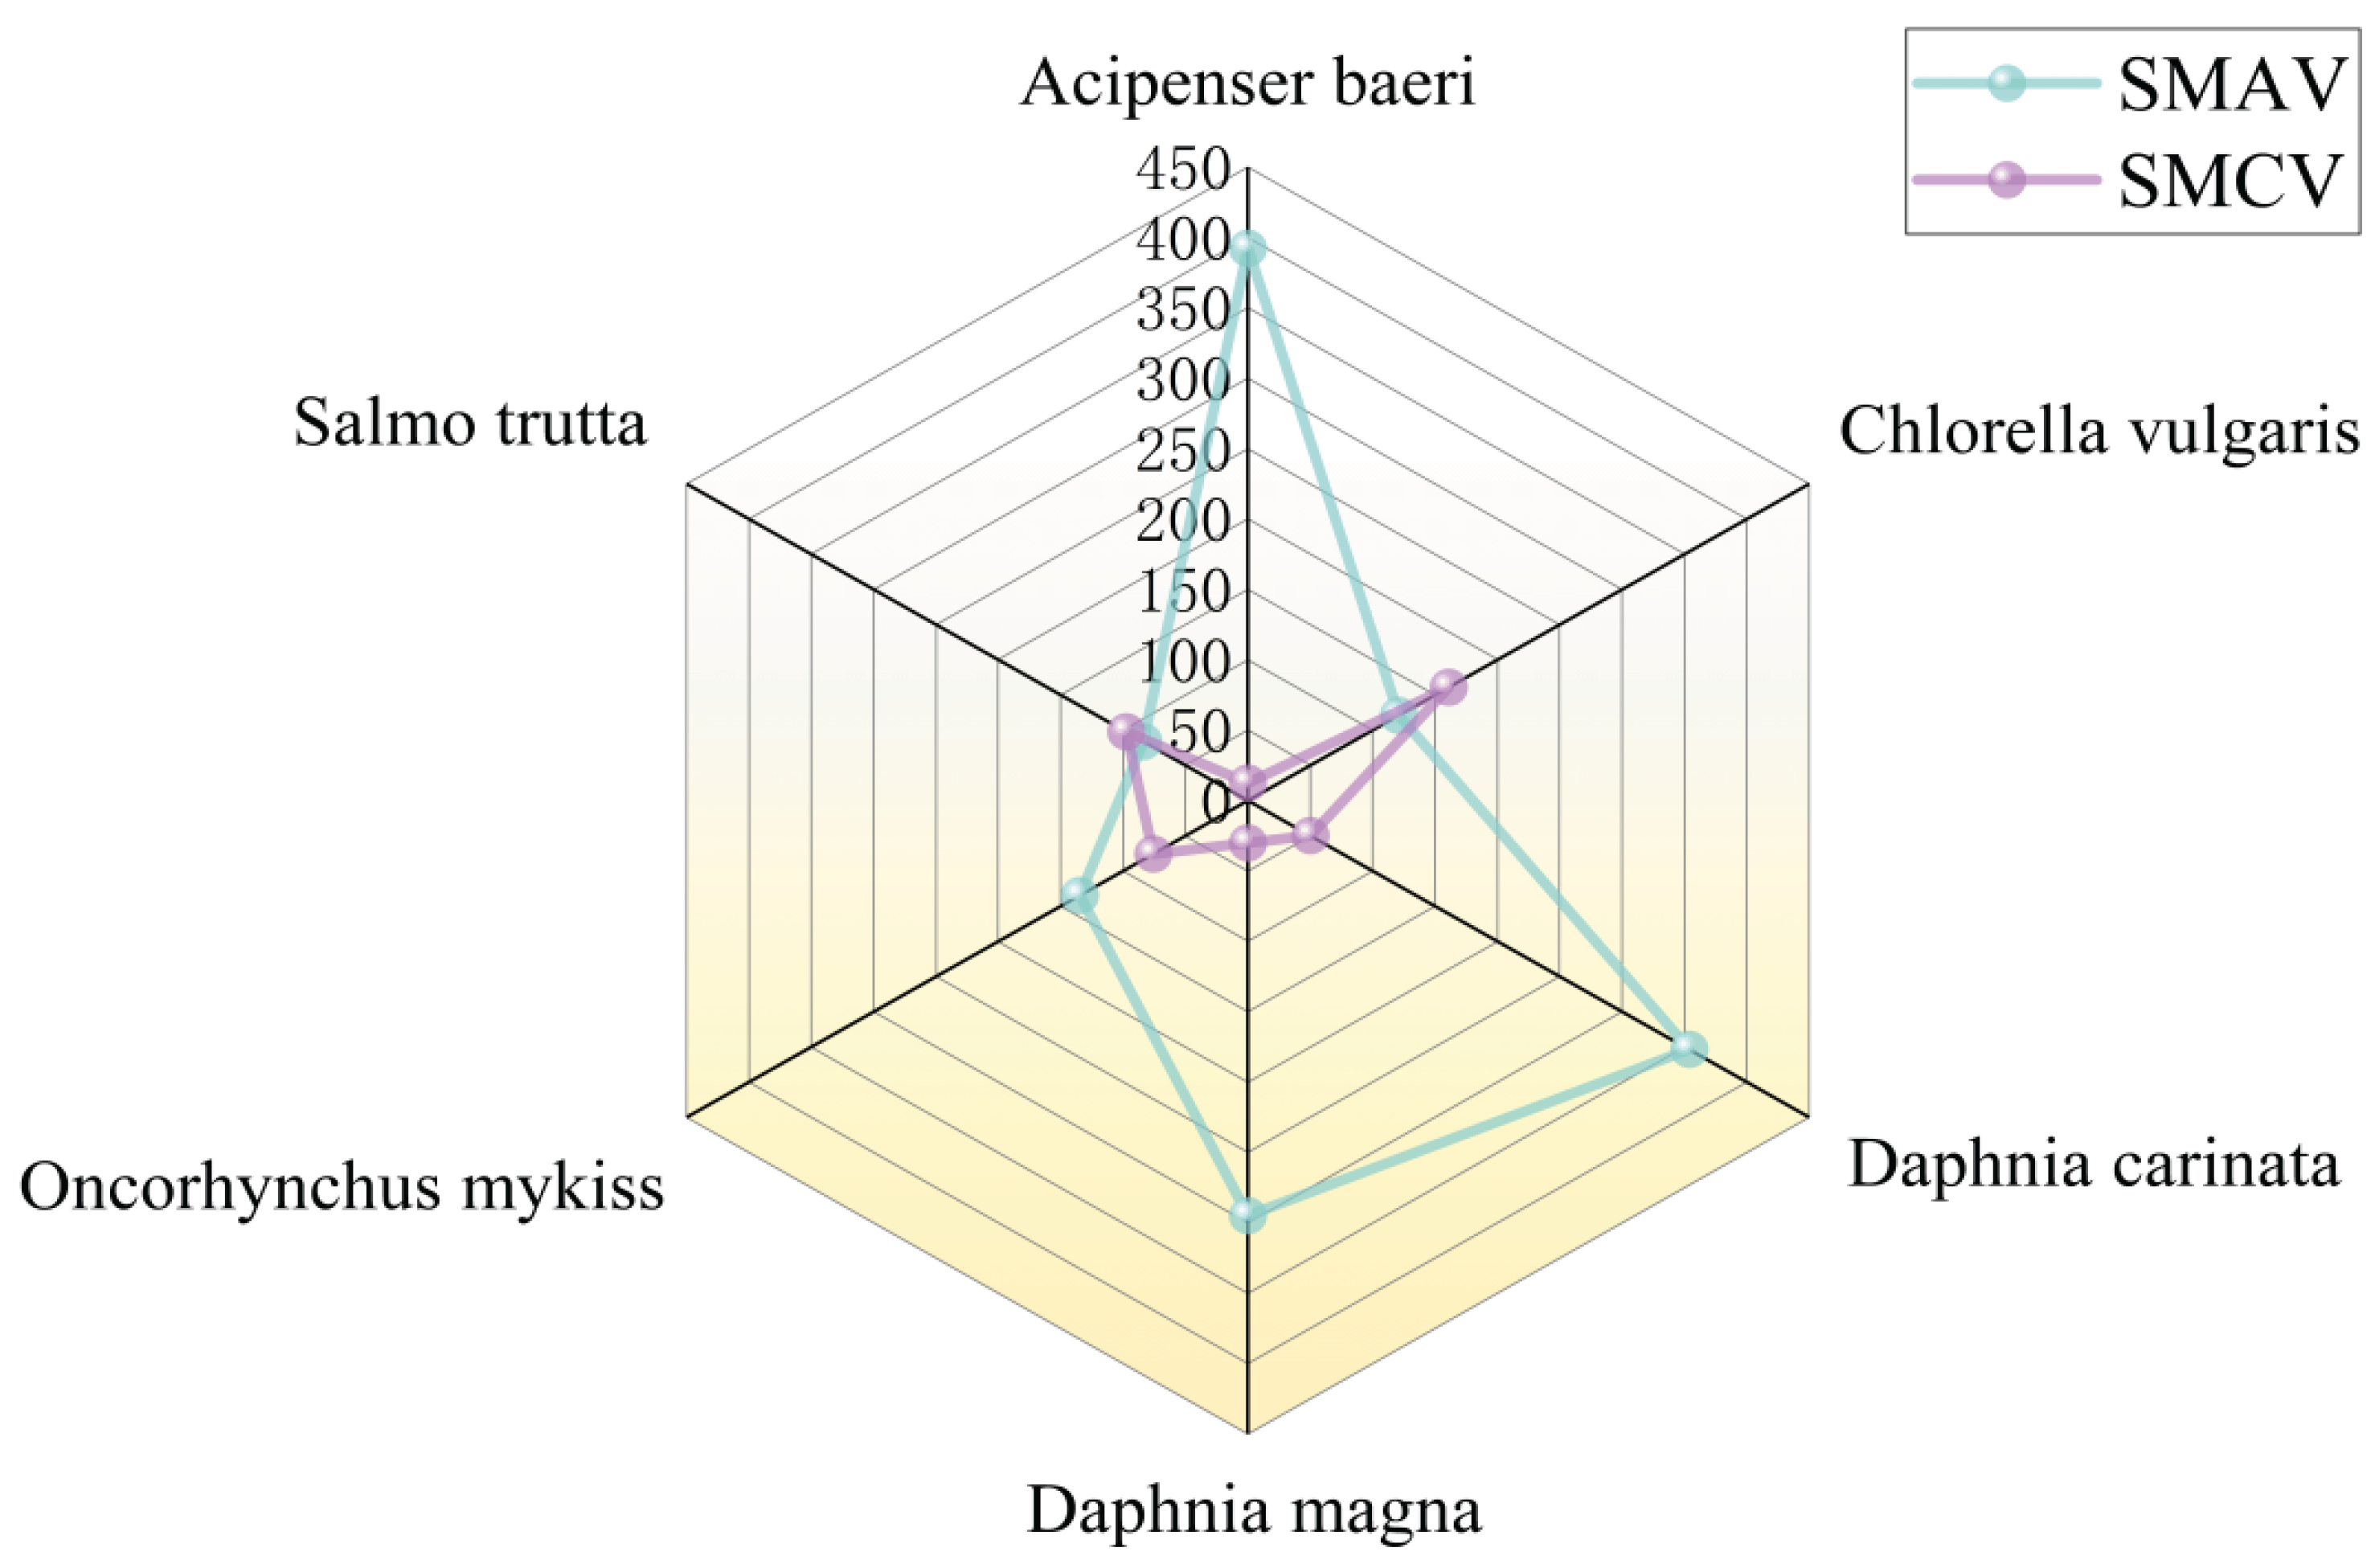
The ionic fluorides with toxicity data found include sodium fluoride, aluminum fluoride, and ammonium fluoride; The collected acute data covers 4 phyla, 14 families, and 34 species, while chronic data covers 3 phyla, 5 families, and 7 species; The arithmetic mean of acute toxicity data SMAV is 226.5 mg/L, among which the species most sensitive to toxicity is Hydropsyche bronta (SMAV is 20.43 mg/L), and the species least sensitive is Lepomis macrochirus (Bluegill) (SMAV is 663.3 mg/L). The arithmetic mean of chronic toxicity data SMCV is 63.60 mg/L, among which the species most sensitive to toxicity is Acipenser baeri (Siberian sturgeon) (SMCV is 12.37 mg/L), and the species least sensitive is Chlorella (Chlorella vulgaris) (SMCV is 160.8 mg/L); The specific results are shown in Table 1 and Table 2.
Figure 2.
Comparison of SMAV and SMCV data for selected species.
3.2. Fluoride Criteria Derived from Species Sensitivity Distribution Method
Fit the 34 acute SMAV data and 7 chronic SMCV data using the “National Ecological Environment Criteria Calculation Software-Species Sensitivity Distribution Method” (EEC-SSD). The fitting results showed that the normal distribution model had the optimal fitting results for acute data (RMSE=0.04671, P>0.05) and chronic data (RMSE=0.05820, P>0.05). The detailed fitting results of the four models for acute and chronic data are shown in Figure 3, Figure 4, and Table 3. The normal distribution model was used for acute SMAV data, with a corresponding HC5 value of 34.94 mg/L. As the number of species is greater than 15, the AF value is 2, and the calculated SWQC is 17.47 mg/L. The chronic SMCV data were analyzed using a normal distribution model, with a corresponding HC5 value of 10.00 mg/L. Since the number of species is less than 15, the AF value is 3, and the calculated LWQC is 3.334 mg/L.
3.3. Ecological Risk Assessment
Select China as a typical region for ecological risk assessment. The water concentration data of fluoride (calculated as F-) in China is based on surface water data. The time range of the statistical data is from 1986 to 2023, involving 21 provincial-level administrative regions and 32 major river and lake basins and their tributaries. Referring to the current “Surface Water Environment Quality Standard GB 3838-2002”, among the 1445 data collected, 1153 concentration data are less than or equal to 1.0 mg/L, belonging to Class I-III limits (approximately 79.79% of the total), and 163 concentration data are greater than 1.0 mg/L and less than or equal to 1.5 mg/L, belonging to Class IV-V limits (approximately 11.28% of the total).

Table 4.
The fluoride concentration (expressed as F-) in surface water in China.
| Provincial-level administrative region/River and lake basin | Time | Simple size | Concentration range(mg/L) | Mean value(mg/L) |
|---|---|---|---|---|
| Yangtze River | 2004-2020 | 31 | 0.12-0.29 | 0.2224 |
| Yellow River | 1986-2021.7 | 65 | 0.06-1.79 | 0.4419 |
| Zhe Min Pian River | 2020 | 1 | 0.239 | 0.239 |
| Northwest Rivers | 2020 | 1 | 0.428 | 0.428 |
| Southwest Rivers | 2020 | 1 | 0.19 | 0.19 |
| Songhua River | 2020 | 1 | 0.325 | 0.325 |
| the Pearl River | 2020 | 1 | 0.205 | 0.205 |
| Wujiang River | 1989-1999 | 2 | 0.2-0.21 | 0.205 |
| Liao River | 2020 | 1 | 0.41 | 0.41 |
| Shahe River | 1986-2004 | 20 | 0.05-181.6 | 25.49 |
| Puhe River | 2018-2022 | 5 | 0.25-0.72 | 0.58 |
| Qingshui River | 2013-2022 | 102 | 0.29-1.84 | 0.8127 |
| Huai River | 2020 | 1 | 0.61 | 0.61 |
| Haihe River | 2020 | 18 | 0.5-3.72 | 0.9034 |
| Guo river | 2009.1-2020.9 | 23 | 0.882-1.51 | 1.130 |
| Tuohe River | 2009.1-2023 | 7 | 0.84-1.171 | 1.011 |
| Hui River | 2009.1-2020.9 | 3 | 1.006-1.215 | 1.094 |
| Chaiwen River | 2007.1-2016.9 | 376 | 0.16-0.65 | 0.3260 |
| Beiluo River | 2 | 0.66-1 | 0.83 | |
| Yanhe River | 2 | 0.64 | 0.64 | |
| Xihe River | 1986-2004 | 8 | 0.57-42.72 | 19.18 |
| Ertix River | 2021.4-2021.10 | 1 | 0.18 | 0.18 |
| Zuli River | 1 | 1.048 | 1.048 | |
| Wuliangsu Lake | 2021.7 | 16 | 0.19-1.9 | 0.5039 |
| the Taihu Lake | 2010.5.22-2010.6.10 | 1 | 0.52 | 0.52 |
| Yangcheng Lake | 2018.11.5-2018.11.7 | 55 | 0.15-0.5 | 0.3551 |
| Chagan Lake | 2008 | 1 | 4.56 | 4.56 |
| South Four Lakes | 2022.2-2022.3 | 1 | 1.2 | 1.2 |
| Dalinor Lake | 2016-2021 | 6 | 1.62-4.24 | 2.892 |
| Ebinur Lake | 2005-2018 | 13 | 2.31-16.9 | 7.208 |
| Chaiwobao Lake | 2005-2009 | 15 | 0.24-3.78 | 2.607 |
| Ulungur Lake | 2021.4-2021.10 | 2 | 0.41-2.62 | 1.515 |
| Anhui | 2006-2020.9 | 38 | 0.77-7.75 | 1.703 |
| Fujian | 1997-2008 | 178 | 0.12-12.5 | 0.6450 |
| Gansu | 2011-2015 | 34 | 0.284-1.2 | 0.5584 |
| Guangdong | 2010-2024 | 8 | 0.4-1.5 | 1.020 |
| Guangxi | 2005 | 12 | 0.00024-0.00308 | 0.000642 |
| Guizhou | 2013.7 | 1 | 0.19 | 0.19 |
| Hebei | 2013-2021 | 16 | 0.24-1.488 | 0.8222 |
| Heilongjiang | 4 | 0.333-0.37 | 0.347 | |
| Henan | 2009-2022.8 | 52 | 0.28-5.55 | 1.436 |
| Jiangxi | 15 | 0.068-0.231 | 0.1118 | |
| Liaoning | 2018-2023.2 | 8 | 0.453-1.17 | 0.9794 |
| Inner Mongolia | 2008-2021 | 98 | 0.38-7.13 | 1.325 |
| Ningxia | 2013.4.1-2013.4.26 | 4 | 0.4-1.4 | 0.8 |
| Qinghai | 2005-2019 | 7 | 0-0.3 | 0.2186 |
| Shaanxi | 2006-2018 | 79 | 0.15-5.18 | 1.028 |
| Shandong | 2005-2021.8 | 66 | 0.25-1.49 | 0.7958 |
| Shanxi | 2013.4.1-2020 | 5 | 0.4-1.7 | 1.058 |
| Sichuan | 2005-2012 | 4 | 0.17-0.22 | 0.78 |
| Taiwan | 2007 | 4 | 0.09-0.15 | 0.1125 |
| Xinjiang | 2019.7-2019.8 | 7 | 0.144-1.83 | 0.4569 |
| Tibet | 2013.4.27-2013.8.23 | 22 | 0.02-0.58 | 0.14 |
In the concentration data collected, the river and lake basins with the highest and lowest average fluoride levels in water are the Shahe River Basin (25.49 mg/L) and the Ertix River Basin (0.18 mg/L), respectively. The provincial-level administrative regions with the highest and lowest average fluoride levels are Anhui Province (1.703 mg/L) and Guangxi Zhuang Autonomous Region (0.000642 mg/L), respectively; The river and lake basins with the largest and smallest fluoride concentration ranges are the Shahe River Basin (0.05-181.6 mg/L, concentration difference of 3632 times) and the Wujiang River Basin (0.2-0.21 mg/L, concentration difference of 1.05 times), respectively. The provincial-level administrative regions with the largest and smallest fluoride concentration ranges are Fujian (0.12-12.5 mg/L, concentration difference of 104.17 times) and Heilongjiang (0.333-0.37 mg/L, concentration difference of 1.11 times), respectively.
Compared with SWQC and LWQC derived using the species sensitivity distribution method, it was found that the average concentration of fluoride in the Chagan Lake Basin and Ebinur Lake Basin was higher than that in LWQC, indicating that there is a certain possibility of fluoride causing chronic toxic effects on organisms in their water bodies; The average concentration of fluoride in both the Shahe River Basin and the Xihe River Basin is higher than that in SWQC and LWQC, indicating that fluoride is most likely to cause acute and chronic toxic effects on organisms in their water bodies. The LWQC derived using the species sensitivity distribution method was used to calculate all concentration data, and the RQ values and evaluation results obtained are shown in Table 5 and Figure 5. In the evaluation results, the Shahe River Basin has the highest RQ value (RQ=7.645, indicating high risk), while the Ertix River Basin has the lowest RQ value (RQ=0.05399, indicating low risk); The provincial-level administrative region with the highest RQ value is Anhui Province (RQ=0.5107, evaluation result is moderate risk), and the lowest provincial-level administrative region is Guangxi Zhuang Autonomous Region (RQ=0.0001926, evaluation result is no risk); In the assessment results of river and lake basins, four of them were classified as high-risk, namely the Shahe River Basin (RQ=7.645), Xihe River Basin (RQ=5.753), Ebinur Lake Basin (RQ=2.162), and Chagan Lake Basin (RQ=1.368). The assessment results of the remaining basins were classified as moderate or low risk, while those without river and lake basins were classified as no risk; In the evaluation results of provincial-level administrative regions, none of them were rated as high risk, while the evaluation results of other provincial-level administrative regions were mainly moderate risk and low risk. Only the evaluation result of Guangxi Zhuang Autonomous Region (RQ=0.0001926) was rated as no risk.
3.4. Comparison of Fluoride Water Quality Standards in Different Countries
Many countries in the world have limits on the concentration of fluoride in water bodies. Under the principle of phased development of chemical pollutant regulations, the US Environmental Protection Agency (US EPA) has included 65 pollutants, including inorganic fluorides, in the second/fifth phase of chemical pollutant regulations, and included them in MCLG (Maximum Contaminant Level Goals), MCL (Maximum Contaminant Levels), monitoring requirements and removal technologies [30]. Canada has set fluoride limits of 1.5 mg/L and 0.12 mg/L, respectively, in the “Guidelines for Canadian Drinking Water Quality” and the “Water Quality Guidelines for the Protection of Aquatic Life” [31,32]. However, there is not much research on the criteria of fluoride in freshwater aquatic organisms by domestic and foreign scholars. McPherson et al. collected chronic toxicity data of 16 species in 2014, and based on this, used the species sensitivity distribution method to derive a chronic baseline of 1.4 mg/L for fluoride. In their study, they pointed out that there is currently a lack of international criteria research on fluoride [33]. In the process of demonstrating the practicality of the empirical bioavailability model based on multiple linear regression, Parker et al. introduced three TMFs (toxicity-modifying factors) and obtained a preliminary FAV (16 species) range of 18.1 mg/L-56.3 mg/L. Then, using ACR (acute to chronic ratio), the range of FCV was calculated to be 3.4 mg/L-10.4 mg/L; When TMF is not introduced, FAV (29 species), FCV (19 species), and FCV derived through ACR are 30.6 mg/L, 4 mg/L, and 5.7 mg/L, respectively; The team pointed out in their research that there is a lack of uniformity in the species selection required for model construction, resulting in differences in the sensitivity of the same species to fluoride observed. Based on the research results, it was found that some indicator values (e.g., AF and ACR) used in the calculation methods used in the guidelines of countries such as the United States and Canada deviate from academic consensus, leading to overly conservative fluoride limits [34,35,36]. Comparing the criteria values derived using the species sensitivity distribution method with domestic and international standards (see Table 6), it was found that the derived LWQC values were only lower than the criteria standards in the United States. This may be due to the fact that species are distributed all over the world in this criteria derivation study, and chronic toxicity values are relatively lacking. The resulting SMCV data only has 7 and does not cover the number of species to 3 phyla and 8 families, making it impossible to use methods that require the number of species covered by phyla and families when deriving the criteria.
4. Conclusions
(1) The toxicity data of fluoride at home and abroad were collected, and the SWQC and LWQC derived using the species sensitivity distribution method were 17.47 mg/L and 3.334 mg/L, respectively. After comparing with the criteria standard of various countries, regions, and organizations around the world, SWQC and LWQC were recommended as water quality criteria for fluoride in freshwater aquatic organisms
(2) Selecting China as the research area, calculate the RQ value using the risk quotient method and conduct ecological risk assessment. The results showed that the ecological risks of Shahe River, Xihe River, Ebinur Lake, and Chagan Lake were higher in the river and lake basins, and there were no basins with no risk assessment results; Among the provincial-level administrative regions, the assessment results of Guangxi Zhuang Autonomous Region are considered as no risk, and there are no administrative regions with high risk assessment results; The assessment results of river and lake basins and provincial-level administrative regions are mainly classified as moderate risk and low risk.
5. Prospect
Through investigation of existing research, it was found that there are the following issues with fluoride criteria studies: firstly, the species and calculation methods used by countries around the world are not unified, and there is a phenomenon of custom methods in many studies, resulting in a deviation between values and actual needs; secondly, there are few toxicity exposure experiments on fluoride, and there is not enough toxicity data to support the application of some model methods, resulting in the abandonment of key steps in the research process (e.g., screening for locally sensitive species). For the above issues, the author believes that it is necessary to combine local conditions with academic consensus, and pay attention to the role of key indicators in species selection and calculation, so as to ensure the standardization of results and obtain research results suitable for the research area according to local conditions.
Author Contributions
Conceptualization, J.Z.; formal analysis, J.Z.; supervision, C.F. and X.H.; writing—original draft preparation, J.Z.; writing—review and editing, J.Y., C.F., and X.H.; resources, C.F.; visualization, Y.P.; data curation, J.Y.; investigation, Y.P.; project admin istration, C.F.; funding acquisition, C.F.; methodology, C.F. All authors have read and agreed to the published version of the manuscript.
Funding
This research was supported by Jing-Jin-Ji Regional Integrated Environmental Improvement-National Science and Technology Major Project (2025ZD1207902) and the National Natural Science Foundation of China (42577557).
Institutional Review Board Statement
Not applicable.
Informed Consent Statement
Not applicable.
Data Availability Statement
All the data in this study are from public literature, so data sharing is not applicable to this article.
Acknowledgments
We would like to express our gratitude to some units of the Chinese Research Academy of Environmental Sciences and Shanghai Institute of Technology for providing personnel and technical support for this research.
Conflicts of Interest
The authors declare that there are no economic or personal conflicts of interest in this study.
Abbreviations
The following abbreviations are used in this manuscript:
| SSD | Species Sensitivity Distribution |
| RQ | Risk Quotient |
| MATC | Maxium Acceptable Toxicant Concentration |
| CVE | Chronic Value for the same Effect |
| ECx | x% Effect Concentration |
| LCx | x% Lethal Concentration |
| NOEC | No Observed Effect Concentration |
| LOEC | Lowest Observed Effect Concentration |
| HCx | Hazardous Concentration for x% of species |
| WQC | Water Quality Criteria for aquatic organisms |
| SWQC | Short-term Water Quality Criteria for aquatic organisms |
| LWQC | Long-term Water Quality Criteria for aquatic organisms |
| RMSE | Root Mean Square Error |
| AF | Assessment Factor |
| EEC-SSD | National Ecological Environment Criteria Calculation Software-Species Sensitivity Distribution Method |
| AVE | Acute Value for the same Effect |
| SMAV | Species Mean Acute Value |
| SMCV | Species Mean Chronic Value |
| MEC | Measured Environmental Concentration |
| MCLG | Maximum Contaminant Level Goals |
| MCL | Maximum Contaminant Levels |
| U.S. EPA | United States Environmental Protection Agency |
| TMFs | Toxicity-Modifying Factors |
| ACR | Acute to Chronic Ratio |
| FAV | Final Acute Value |
| FCV | Final Chronic Value |
| HDL | Highest Disirable Level |
| MPL | Maximum Permissible Level |
| MAC | Maximum Acceptable Concentrations |
| NHANES | National Health And Nutrition Examination Survey |
References
- Fluorine. Available online: https://en.wikipedia.org/wiki/Fluorine (accessed on 1 December 2025).
- Summary Review of Health Effects Associated with Hydrogen Fluoride and Related Compounds: Health Issue Assessment. Available online: https://nepis.epa.gov/Exe/ZyNET.exe/30001I17.TXT?ZyActionD=ZyDocument&Client=EPA&Index=1986+Thru+1990&Docs=&Query=&Time=&EndTime=&SearchMethod=1&TocRestrict=n&Toc=&TocEntry=&QField=&QFieldYear=&QFieldMonth=&QFieldDay=&IntQFieldOp=0&ExtQFieldOp=0&XmlQuery=&File=D%3A%5Czyfiles%5CIndex%20Data%5C86thru90%5CTxt%5C00000004%5C30001I17.txt&User=ANONYMOUS&Password=anonymous&SortMethod=h%7C-&MaximumDocuments=1&FuzzyDegree=0&ImageQuality=r75g8/r75g8/x150y150g16/i425&Display=hpfr&DefSeekPage=x&SearchBack=ZyActionL&Back=ZyActionS&BackDesc=Results%20page&MaximumPages=1&ZyEntry=1&SeekPage=x&ZyPURL (accessed on 2 December 2025).
- Toxicological Profile for Fluorides, Hydrogen Fluoride, and Fluorine. Available online: https://www.atsdr.cdc.gov/toxprofiles/tp11.pdf (accessed on 2 December 2025).
- Fluoride compounds: Sources of emissions. Available online: https://www.dcceew.gov.au/environment/protection/npi/substances/fact-sheets/fluoride-compounds-sources-emissions (accessed on 2 December 2025).
- Ahmad, S.; Singh, R.; Arfin, T.; Neeti, K. Fluoride Contamination, Consequences and Removal Techniques in Water: A Review. Env. Sci. Adv. 2022, 1, 620-661. [CrossRef]
- Fluoride Poisoning in Animals - Toxicology. Available online: https://www.merckvetmanual.com/toxicology/fluoride-poisoning/fluoride-poisoning-in-animals (accessed on 2 December 2025).
- Elloumi, N.; Abdallah, F. B.; Imed, M.; Rhouma, A.; Boukhris, M.; Tunisia, S. Effect of Fluoride on Almond Seedlings in Culture Solution. Fluoride 2005, 38, 193-198.
- Hong, B. D.; Joo, R. N.; Lee, K. S.; Lee, D. S.; Rhie, J. H.; Min, S. won ; Song, S. G.; Chung, D. Y. Fluoride in Soil and Plant. Korean J. Agric. Sci. 2016, 43, 522-536. [CrossRef]
- Zhang, H. Investigation and Analysis on Control Status of Endemic Fluorosis Area in Jilin Province. M.P.H. Thesis, Jilin University, Changchun, China, 2017 (in Chinese).
- 2013 National Surveillance Report on Coal-Fuelled Pollution-Related Endemic Fluorosis (Abstract). Available online: https://www.hrbmu.edu.cn/__local/C/6A/40/2688C792787B18A773CB5FE59F2_0E7724D7_9000.doc?e=.doc. (accessed on 2 December 2025) (in Chinese).
- .2014 National Surveillance Report on Coal-Fuelled Pollution-Related Endemic Fluorosis (Abstract). Available online: https://www.hrbmu.edu.cn/__local/8/27/63/B3DBB400556532E30D605C4332B_57FA55C7_C000.doc?e=.doc. (accessed on 2 December 2025) (in Chinese).
- 2015 National Surveillance Report on Coal-Fuelled Pollution-Related Endemic Fluorosis (Abstract). Available online: https://www.hrbmu.edu.cn/__local/0/52/43/E2DE830EBC4F2B9FE28F1BE6B5E_39A844AE_4A85.docx?e=.docx. (accessed on 2 December 2025) (in Chinese).
- 2016 National Surveillance Report on Coal-Fuelled Pollution-Related Endemic Fluorosis (Abstract). Available online: https://www.hrbmu.edu.cn/__local/C/A7/E9/C4A902E843BCD7774C779F94CD5_4D7687D5_9C00.doc?e=.doc. (accessed on 2 December 2025) (in Chinese).
- 2017 National Surveillance Report on Coal-Fuelled Pollution-Related Endemic Fluorosis (Abstract). Available online: https://www.hrbmu.edu.cn/__local/E/AF/C3/6FAC44DC2630BBC38BEA296FCDA_4EE8DEB0_A200.doc?e=.doc. (accessed on 2 December 2025) (in Chinese).
- 2018 National Surveillance Report on Coal-Fuelled Pollution-Related Endemic Fluorosis (Abstract). Available online: https://www.hrbmu.edu.cn/__local/D/5F/B4/763C32218C792A9ECB9CB7ADC56_CFFA4DBC_C400.doc?e=.doc. (accessed on 2 December 2025) (in Chinese).
- 2019 National Surveillance Report on Coal-Fuelled Pollution-Related Endemic Fluorosis (Abstract). Available online: https://www.hrbmu.edu.cn/__local/5/D4/6E/96EBE3C7E75172C729F6A4F2900_81C55C61_9A00.doc?e=.doc. (accessed on 2 December 2025) (in Chinese).
- 2020 National Surveillance Report on Coal-Fuelled Pollution-Related Endemic Fluorosis (Abstract). Available online: https://www.hrbmu.edu.cn/dbzx/fzjc/2020nianduquanguoranmeiwuranxingdifangxingfuzhongdujiancebaogao.docx. (accessed on 2 December 2025) (in Chinese).
- 2021 National Surveillance Report on Coal-Fuelled Pollution-Related Endemic Fluorosis (Abstract). Available online: https://www.hrbmu.edu.cn/dbzx/fzjc/2021nianduquanguoranmeiwuranxingdifangxingfuzhongdujiancebaogaozhaiyao.doc. (accessed on 2 December 2025) (in Chinese).
- 2022 National Surveillance Report on Coal-Fuelled Pollution-Related Endemic Fluorosis (Abstract). Available online: https://www.hrbmu.edu.cn/dbzx/fzjc/2022nianduquanguoranmeiwuranxingdifangxingfuzhongdujiancebaogaozhaiyao.doc. (accessed on 2 December 2025) (in Chinese).
- 2023 National Surveillance Report on Coal-Fuelled Pollution-Related Endemic Fluorosis (Abstract). Available online: https://www.hrbmu.edu.cn/dbzx/fzjc/2023nianduquanguoranmeiwuranxingdifangxingfuzhongdujiancebaogaozhaiyao.doc. (accessed on 2 December 2025) (in Chinese).
- U.S. Department of Health and Human Services Federal Panel on Community Water Fluoridation. U.S. Public Health Service Recommendation for Fluoride Concentration in Drinking Water for the Prevention of Dental Caries. Public Health Rep. 2015, 130, 318-331. [CrossRef]
- Camargo, J. A. Fluoride Toxicity to Aquatic Organisms: A Review. Chemosphere 2003, 50, 251-264. [CrossRef]
- Hemens, J.; Warwick, R. J. The Effects of Fluoride on Estuarine Organisms. Water Res. 1972, 6, 1301–1308. [CrossRef]
- Feng, C.; Wu, F.; Zhao, X.; Li, H.; Chang, H. Water Quality Criteria Research and Progress. Sci. China Earth Sci. 2012, 55, 882-891. [CrossRef]
- HJ 831-2022; Technical Guideline for Deriving Water Quality Criteria for Freashwater Organisms; Ministry of Ecology and Environment of China: Beijing, China, 2022.
- Posthuma, L.; Suter II, G. W.; Traas, T. P. Species Sensitivity Distributions in Ecotoxicology, 1st ed.; CRC Press: Boca Raton, FL, USA, 2002; pp. 1-616, ISBN 978-036-739-648-0.
- Posthuma, L.; van Gils, J.; Zijp, M. C.; van de Meent, D.; de Zwart, D. Species Sensitivity Distributions for Use in Environmental Protection, Assessment, and Management of Aquatic Ecosystems for 12 386 Chemicals. Environ. Toxicol. Chem. 2019, 38, 905–917. [CrossRef]
- HJ 1260-2022; Technical guideline for deriving water quality criteria for marine organisms(on trial); Ministry of Ecology and Environment of China: Beijing, China, 2022.
- Mohan, S.; Balakrishnan, P. Triclosan in Treated Wastewater from a City Wastewater Treatment Plant and Its Environmental Risk Assessment. Water Air Soil Pollut. 2019, 230, 1-13. [CrossRef]
- Chemical Contaminant Rules | US EPA. Available online: https://www.epa.gov/dwreginfo/chemical-contaminant-rules (accessed on 2 December 2025).
- Guidelines for Canadian Drinking Water Quality - Summary Tables. Available online: https://www.canada.ca/en/health-canada/services/environmental-workplace-health/reports-publications/water-quality/guidelines-canadian-drinking-water-quality-summary-table.html#t (accessed on 2 December 2025).
- Canadian Water Quality Guidelines for the Protection of Aquatic Life: Inorganic Fluorides. Available online: https://publications.gc.ca/collections/Collection/En1-34-3-2001E.pdf (accessed on 2 December 2025).
- McPherson, C. A.; Lee, D. H. Y.; Chapman, P. M. Development of a Fluoride Chronic Effects Benchmark for Aquatic Life in Freshwater. Environ. Toxicol. Chem. 2014, 33, 2621-2627. [CrossRef]
- Parker, S. P.; Wilkes, A. E.; Long, G. R.; Goulding, N.; Ghosh, R. S. Development of Fluoride Protective Values for Aquatic Life Using Empirical Bioavailability Models. Environ. Toxicol. Chem. 2022, 41, 396-409. [CrossRef]
- Soucek, D. J.; Mount, D. R.; Dickinson, A.; Hockett, J. R.; McEwen, A. R. Contrasting Effects of Chloride on Growth, Reproduction, and Toxicant Sensitivity in Two Genetically Distinct Strains of Hyalella Azteca. Environ. Toxicol. Chem. 2015, 34, 2354–2362. [CrossRef]
- Fluoride [Fact sheet]. Available online: https://ccme.ca/en/summary-table?lang=en%26factsheet=98526pdf=1. (accessed on 2 December 2025).
Figure 1.
The operational process of species sensitivity distribution.
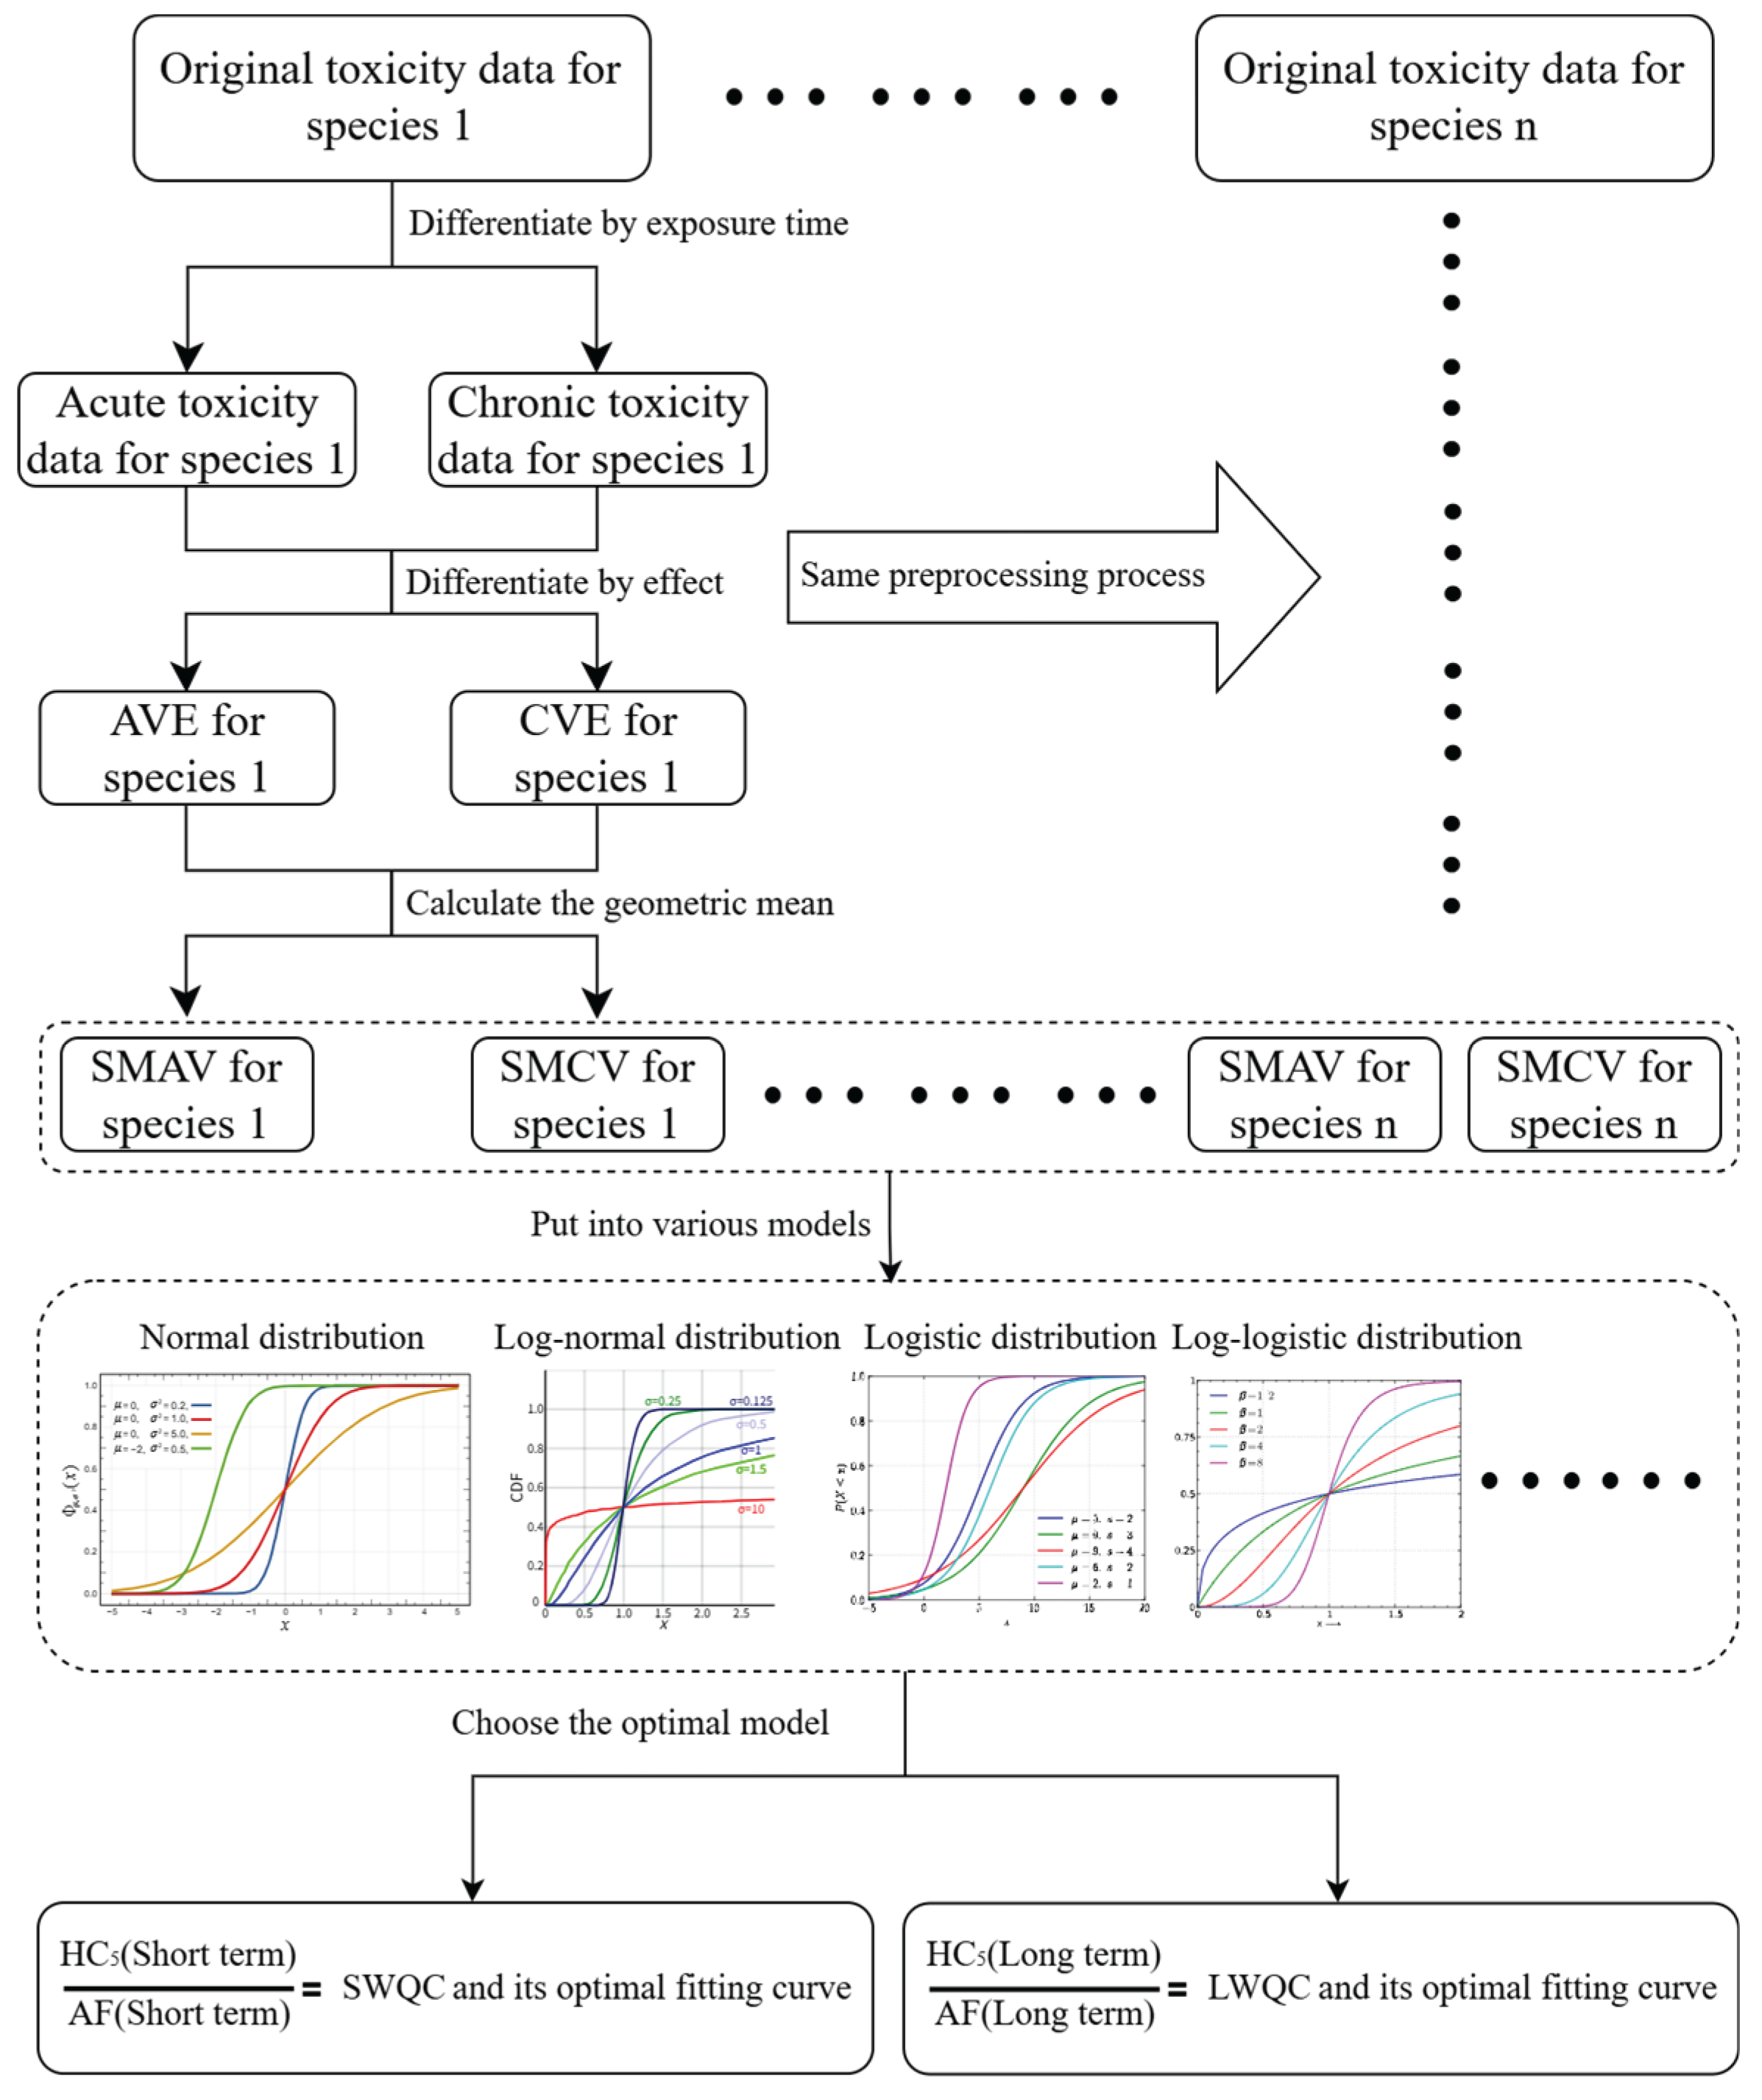
Figure 3.
Fitting curves of four models to acute SMAV data. (A-D) represent the fitting curves using the normal distribution model, logarithmic normal distribution model, logistic distribution model, and logarithmic logistic distribution model, respectively.
Figure 3.
Fitting curves of four models to acute SMAV data. (A-D) represent the fitting curves using the normal distribution model, logarithmic normal distribution model, logistic distribution model, and logarithmic logistic distribution model, respectively.
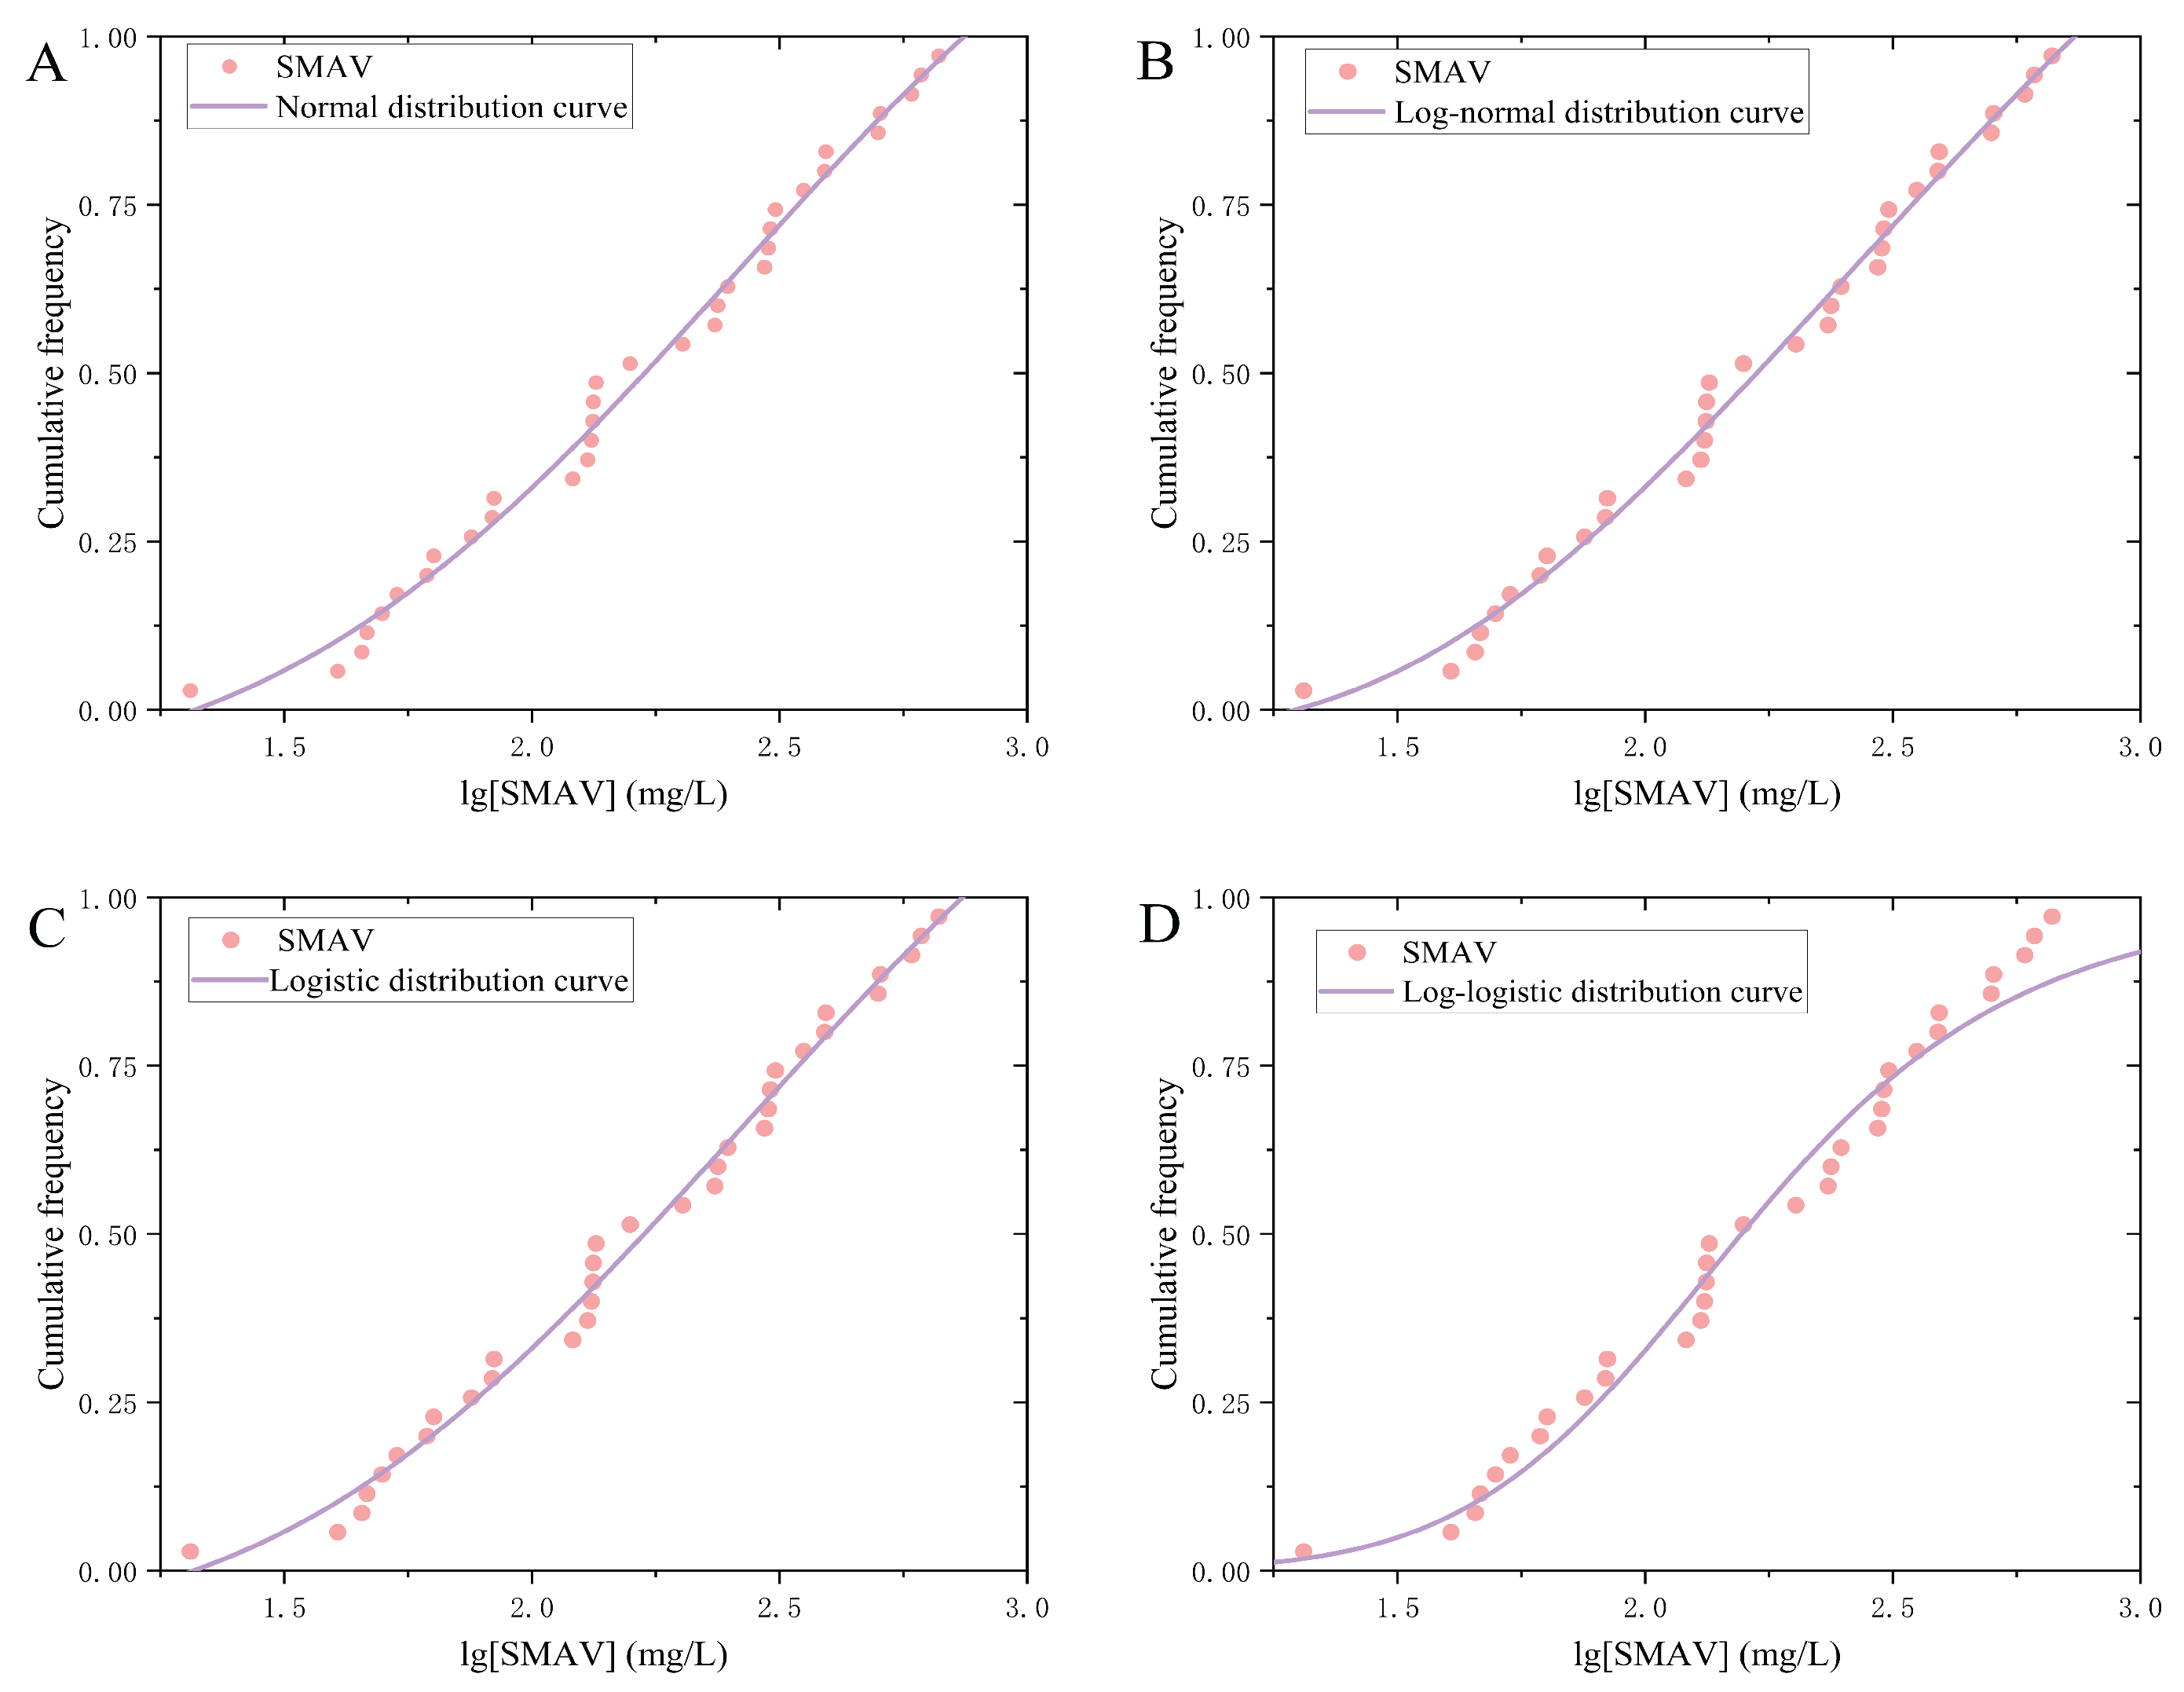
Figure 4.
Fitting curves of four models to chronic SMAV data. (a-d) represent the fitting curves using the normal distribution model, logarithmic normal distribution model, logistic distribution model, and logarithmic logistic distribution model, respectively.
Figure 4.
Fitting curves of four models to chronic SMAV data. (a-d) represent the fitting curves using the normal distribution model, logarithmic normal distribution model, logistic distribution model, and logarithmic logistic distribution model, respectively.
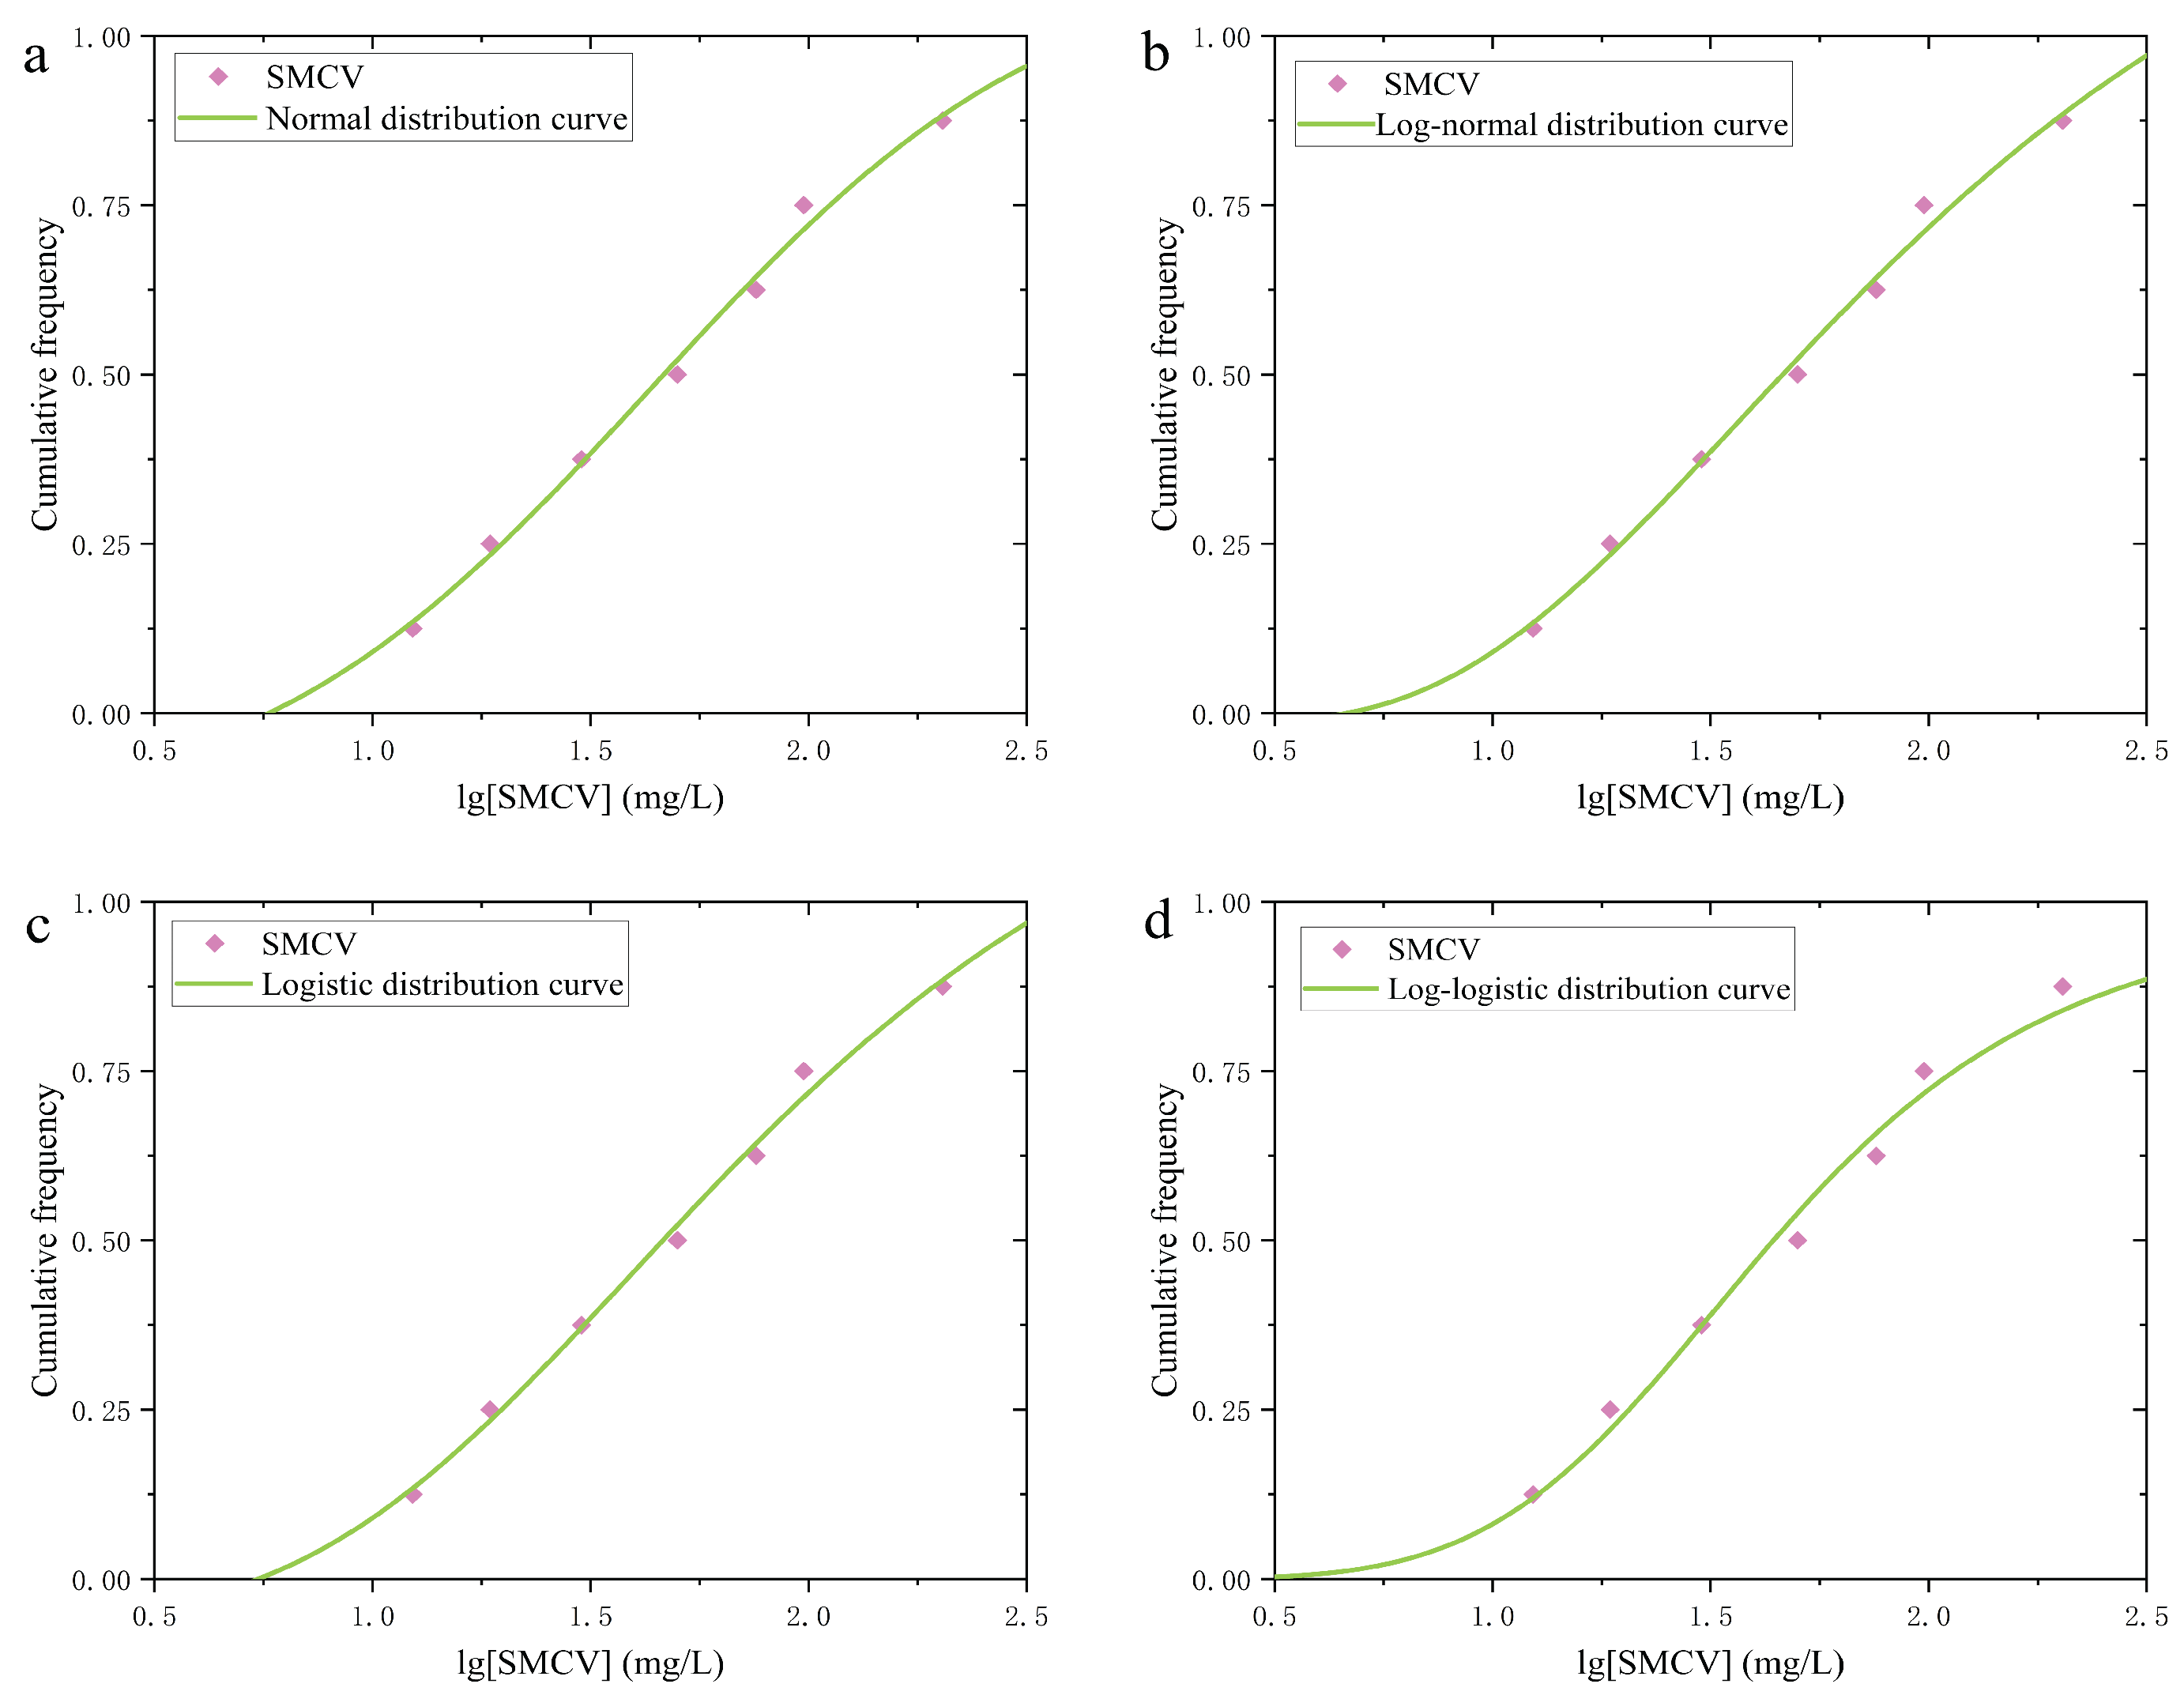
Figure 5.
Comparison of RQ values among river basins and provincial-level administrative regions.
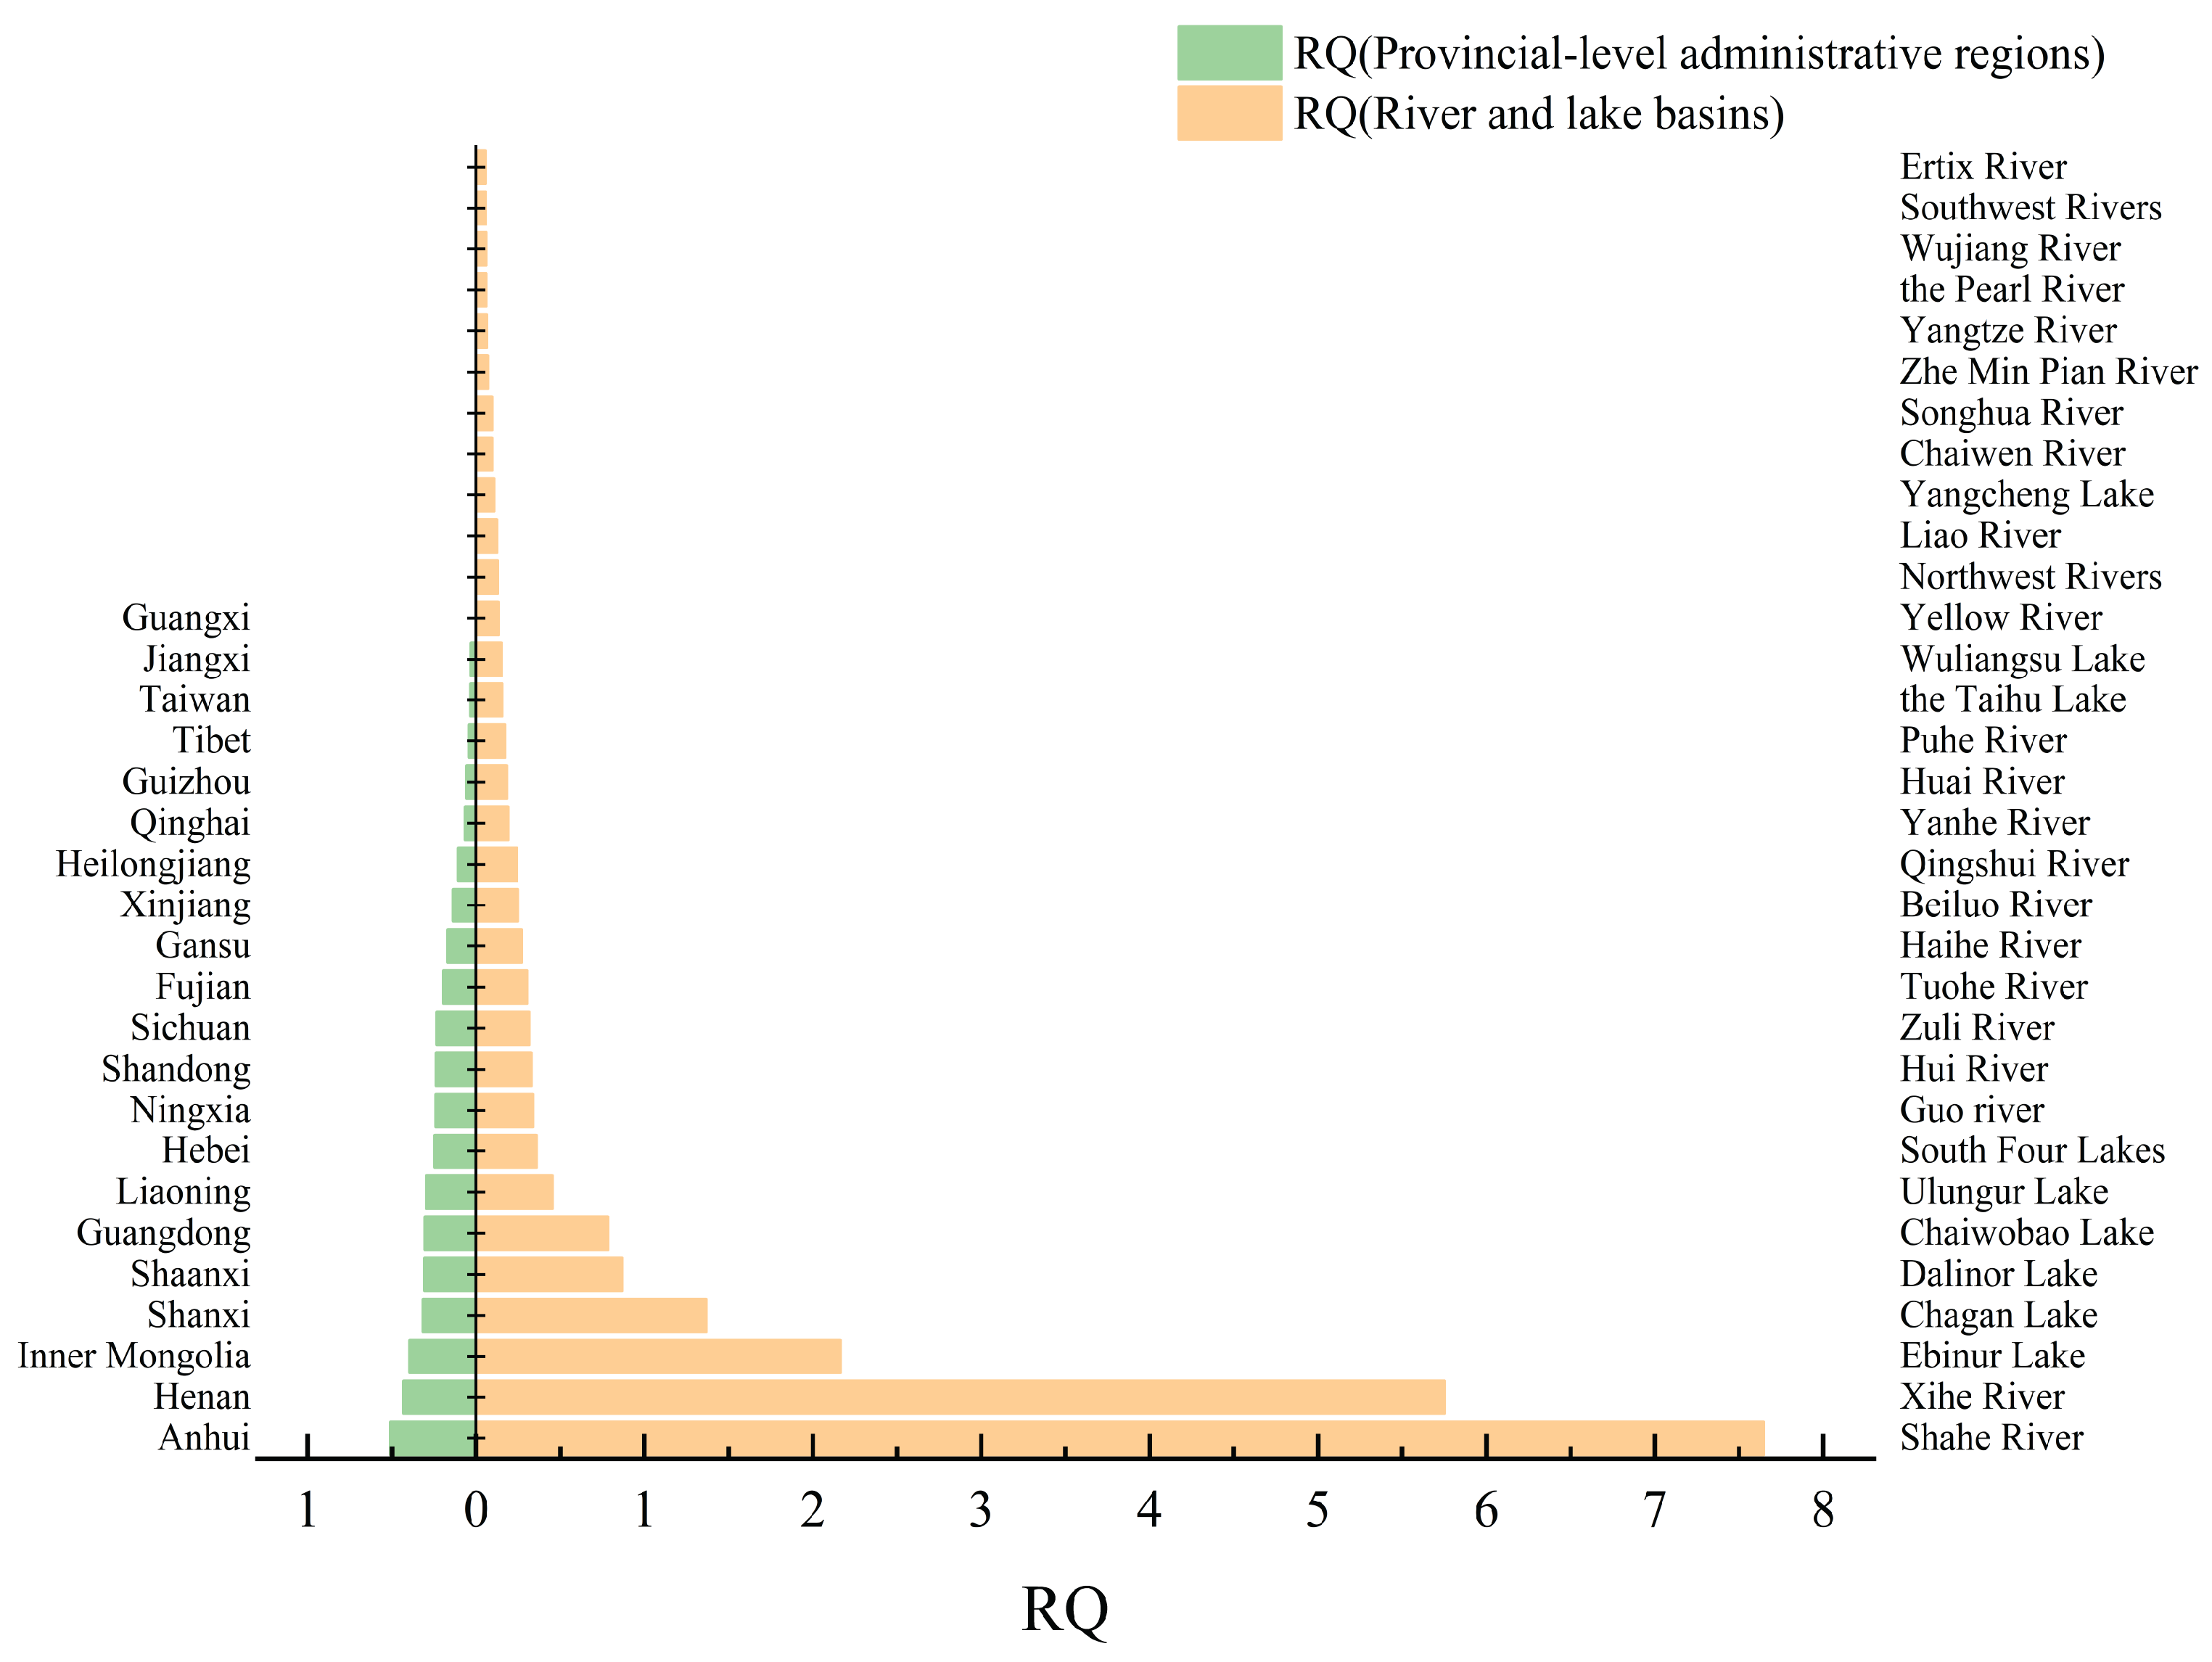
Table 1.
Acute toxicity data of fluoride to freshwater organisms.
| Phylum | Family | Species common name | Species scientific name | Effect | Endpoint | SMAV(mg/L) |
|---|---|---|---|---|---|---|
| Chordata | Acipenseridae | Siberian sturgeon | Acipenser baeri | Mortality | LC50 | 392.4 |
| Chinese sturgeon | Acipenser sinensis | Mortality | LC50 | 131.74 | ||
| Cyprinidae | Catla | Catla catla | Mortality | LC50 | 53.37 | |
| Mrigal | Cirrhinus mrigala | Mortality | LC50 | 505.56 | ||
| Fathead minnow | Pimephales promelas | Mortality | LC50 | 310.24 | ||
| Stigma barb | Puntius sophore | Mortality | LC50 | 129.48 | ||
| Salmonidae | Silver salmon | Oncorhynchus kisutch | Mortality | MATC | 500 | |
| Rainbow trout | Oncorhynchus mykiss | Mortality | LC50 | 134.74 | ||
| Brown trout | Salmo trutta | Mortality | LC50 | 83.89 | ||
| Bufonidae | Asiatic toad | Bufo gargarizans | Mortality | LC50 | 610.44 | |
| Channidae | Spotted snakehead | Channa punctata | Mortality | LC50 | 300 | |
| Gasterosteidae | Threespine stickletback | Gasterosteus aculeatus | Mortality | LC50 | 390.25 | |
| Centrarchidae | Bluegill | Lepomis macrochirus | Mortality | LC50 | 663.25 | |
| Poeciliidae | Guppy | Poecilia reticulate | Mortality | LC50 | 248.65 | |
| Arthropoda | Hydropsychidae | Hydropsyche exocellata | Mortality | LC50 | 46.46 | |
| Hydropsyche occidentalis | Mortality | LC50 | 40.53 | |||
| Hydropsyche bronta | Mortality | LC50 | 20.43 | |||
| Hydropsyche pellucidula | Mortality | LC50 | 63.4 | |||
| Hydropsyche lobata | Mortality | LC50 | 61.39 | |||
| Cheumatopsyche pettiti | Mortality | LC50 | 49.84 | |||
| Hydropsyche bulbifera | Mortality | LC50 | 45.39 | |||
| Stenopsychidae | Chimarra marginata | Mortality | LC50 | 75.44 | ||
| Daphnidae | Ceriodaphnia dubia | Mortality | EC50 | 157.9 | ||
| Ceriodaphnia pulchella | Mortality | EC50 | 83.2 | |||
| Daphnia carinata | Mortality | EC50 | 353.6 | |||
| Simocephalus vetulus | Mortality | EC50 | 210.5 | |||
| Large water flea | Daphnia magna | Mortality | EC50 | 294.97 | ||
| LC50 | ||||||
| Survival | EC50 | |||||
| Growth | EC50 | |||||
| Mollusca | Unionidae | Actinonaias pectorosa | Mortality | LC50 | 237.07 | |
| Appalachian elktoe | Alasmidonta raveneliana | Mortality | LC50 | 303 | ||
| Wavyrayed lampmussel | Lampsilis fasciola | Mortality | LC50 | 133 | ||
| Paper pondshell | Utterbackia imbecillis | Mortality | LC50 | 234 | ||
| Viviparidae | Bellamya aeruginosa | Mortality | LC50 | 132.74 | ||
| Cipangopaludina cathayensis | Mortality | LC50 | 583.8 | |||
| Chlorophyta | Chlorellales | Chlorella | Chlorella vulgaris | Mortality | LC50 | 120.86 |
| Growth | LC50 |
Table 2.
Chronic toxicity data of fluoride to freshwater organisms.
| Phylum | Family | Species common name | Species scientific name | Effect | Endpoint | SMCV(mg/L) |
|---|---|---|---|---|---|---|
| Chordata | Salmonidae | Rainbow trout | Oncorhynchus mykiss | Mortality | MATC | 75.78 |
| LC50 | ||||||
| Brown trout | Salmo trutta | Mortality | LC50 | 97.5 | ||
| Acipenseridae | Siberian sturgeon | Acipenser baeri | Growth | LOEC | 12.37 | |
| NOEC | ||||||
| Cyprinidae | Zebra danio | Danio rerio | Growth | LOEC | 18.6 | |
| Arthropoda | Daphniidae | Daphnia carinata | Reproduction | LOEC | 50 | |
| Large water flea | Daphnia magna | Mortality | NOEC | 30.15 | ||
| Growth | NOEC | |||||
| Reproduction | LOEC | |||||
| NOEC | ||||||
| Chlorophyta | Chlorellales | Chlorella | Chlorella vulgaris | Mortality | LC50 | 160.82 |
| Growth | LC50 | |||||
| Population | NOEC |
Table 3.
Fitting results of four models for acute and chronic data.
| Selected model | HC5(mg/L) | RMSE | P(A-D test) | |
|---|---|---|---|---|
| SMAV | Normal distribution | 34.94 | 0.04671 | >0.05 |
| Log-normal distribution | 37.94 | 0.05221 | >0.05 | |
| Logistic distribution | 32.92 | 0.04908 | >0.05 | |
| Log-logistic distribution | 38.14 | 0.05113 | >0.05 | |
| SMCV | Normal distribution | 10.00 | 0.05820 | >0.05 |
| Log-normal distribution | 11.62 | 0.06422 | >0.05 | |
| Logistic distribution | 10.01 | 0.06875 | >0.05 | |
| Log-logistic distribution | 11.99 | 0.07106 | >0.05 |
Table 5.
Ecological risk assessment results of surface water in various river basins and provincial-level administrative regions in China.
Table 5.
Ecological risk assessment results of surface water in various river basins and provincial-level administrative regions in China.
| River and lake basin | RQ | Assessment result | Provincial-level administrative region | RQ | Assessment result |
|---|---|---|---|---|---|
| Shahe River | 7.645 | High risk | Anhui | 0.5107 | Moderate risk |
| Xihe River | 5.753 | High risk | Henan | 0.4307 | Moderate risk |
| Ebinur Lake | 2.162 | High risk | Inner Mongolia | 0.3974 | Moderate risk |
| Chagan Lake | 1.368 | High risk | Shanxi | 0.3173 | Moderate risk |
| Dalinor Lake | 0.8673 | Moderate risk | Shaanxi | 0.3083 | Moderate risk |
| Chaiwobao Lake | 0.7820 | Moderate risk | Guangdong | 0.3058 | Moderate risk |
| Ulungur Lake | 0.4544 | Moderate risk | Liaoning | 0.2937 | Moderate risk |
| South Four Lakes | 0.3599 | Moderate risk | Hebei | 0.2466 | Moderate risk |
| Guo river | 0.3389 | Moderate risk | Ningxia | 0.2399 | Moderate risk |
| Hui River | 0.3280 | Moderate risk | Shandong | 0.2387 | Moderate risk |
| Zuli River | 0.3143 | Moderate risk | Sichuan | 0.2339 | Moderate risk |
| Tuohe River | 0.3031 | Moderate risk | Fujian | 0.1934 | Moderate risk |
| Haihe River | 0.2710 | Moderate risk | Gansu | 0.1675 | Moderate risk |
| Beiluo River | 0.2489 | Moderate risk | Xinjiang | 0.1370 | Moderate risk |
| Qingshui River | 0.2438 | Moderate risk | Heilongjiang | 0.1041 | Moderate risk |
| Yanhe River | 0.1920 | Moderate risk | Qinghai | 0.06556 | Low risk |
| Huai River | 0.1830 | Moderate risk | Guizhou | 0.05697 | Low risk |
| Puhe River | 0.1740 | Moderate risk | Tibet | 0.04199 | Low risk |
| the Taihu Lake | 0.1560 | Moderate risk | Taiwan | 0.03374 | Low risk |
| Wuliangsu Lake | 0.1511 | Moderate risk | Jiangxi | 0.03353 | Low risk |
| Yellow River | 0.1325 | Moderate risk | Guangxi | 0.0001926 | No risk |
| Northwest Rivers | 0.1284 | Moderate risk | |||
| Liao River | 0.1230 | Moderate risk | |||
| Yangcheng Lake | 0.1065 | Moderate risk | |||
| Chaiwen River | 0.09777 | Low risk | |||
| Songhua River | 0.09748 | Low risk | |||
| Zhe Min Pian River | 0.07168 | Low risk | |||
| Yangtze River | 0.06670 | Low risk | |||
| the Pearl River | 0.06149 | Low risk | |||
| Wujiang River | 0.06149 | Low risk | |||
| Southwest Rivers | 0.05697 | Low risk | |||
| Ertix River | 0.05399 | Low risk |
Table 6.
The comparison results between the derived results of this study and the fluoride water quality standards of various countries/regions/organizations.
Table 6.
The comparison results between the derived results of this study and the fluoride water quality standards of various countries/regions/organizations.
| Countries/Regions/Organizations | Water source type | Classification | F-(mg/L) | |
|---|---|---|---|---|
| This study | Surface water | 17.47(SWQC) | ||
| 3.334(LWQC) | ||||
| Surface Water Environment Quality Standard(GB 3838-2002)* | China | Groundwater | I | ≤1.0 |
| II | ≤1.0 | |||
| III | ≤1.0 | |||
| IV | ≤1.5 | |||
| IV | ≤1.5 | |||
| Groundwater Quality Standard(GB/T 14848-2017)* | China | Groundwater | I | ≤1.0 |
| II | ≤1.0 | |||
| III | ≤1.0 | |||
| IV | ≤2.0 | |||
| IV | >2.0 | |||
| Standard for Drinking Water Quality(GB 5749-2022)* | China | Drinking water | 1.0 | |
| Guidelines for drinking-water quality: fourth edition incorporating the first and second addenda* | WHO | Drinking water | ≤1.5 | |
| National Primary Drinking Water Regulations (NPDWR)* | USA | Drinking water | 4.0(MCL①) | |
| Australian Drinking Water Guidelines Version 4.0* | Australia | Drinking water | ≤1.5 | |
| Water Services (Drinking Water Standards for New Zealand) Regulations 2022* | New Zealand | Drinking water | ≤1.5 | |
| (EU) 2020/2184* | EU | Drinking water | ≤1.5 | |
| Environmental Quality Standards (EQS)* | Japan | Groundwater | ≤0.8 | |
| Revision of Drinking Water Quality Standards in Japan* | Japan | Drinking water | ≤0.8 | |
| GROUNDWATER STANDARDS | Malaysia | Groundwater | 1.5 | |
| Surface and Groundwater Quality Control Regulation-2011 | Nigeria | Groundwater | 0.6-1.5(HDL②) | |
| 1.5(MPL③) | ||||
| Water Quality Standards for drinking water in Korea* | Korea | Drinking water | ≤1.5 | |
| Guidelines for Canadian Drinking Water Quality* | Canada | Drinking water | 1.5(MAC④) | |
| Water Quality Guidelines for the Protection of Aquatic Life* | Canada | 0.12 | ||
| 2024 Update of the national groundwater quality indicator* | New Zealand | Groundwater | 0.01-0.41 |
* The symbol ’*’ indicates that this criteria standard is in force. ①MCL:Maximum Contaminant Levels. ②HDL:highest disirable level. ③MPL:maximum permissible level. ④MAC:maximum acceptable concentrations.
Disclaimer/Publisher’s Note: The statements, opinions and data contained in all publications are solely those of the individual author(s) and contributor(s) and not of MDPI and/or the editor(s). MDPI and/or the editor(s) disclaim responsibility for any injury to people or property resulting from any ideas, methods, instructions or products referred to in the content. |
© 2025 by the authors. Licensee MDPI, Basel, Switzerland. This article is an open access article distributed under the terms and conditions of the Creative Commons Attribution (CC BY) license (http://creativecommons.org/licenses/by/4.0/).
Copyright: This open access article is published under a Creative Commons CC BY 4.0 license, which permit the free download, distribution, and reuse, provided that the author and preprint are cited in any reuse.


