Submitted:
09 December 2025
Posted:
10 December 2025
You are already at the latest version
Abstract
Urban Green Space Per Capita (UGSPC) is one of the oldest and most widely applied indicators in urban planning, providing a measure of green areas in relation to the population size. Despite its century-long application and decades of research, no global systematic review has previously synthesized how UGSPC has been applied, interpreted, and evolved across different contexts. This study aims to fill that gap by conducting the first comprehensive systematic review, following PRISMA guidelines, examining the usage, trends, and effectiveness of UGSPC in both developed and developing countries. Thematic analysis revealed that most studies were published in journals focused on sustainability and environmental science. The results show a surge in publications following the COVID-19 pandemic, reflecting a growing recognition of the importance of urban green spaces for public health and livability. Moreover, 67% of the studies were conducted in developing countries, while 30% of the publications were in developed countries. Higher UGSPC values are generally found in developed cities; however, this was not a rule. Time series studies showed a decline in UGSPC in some developed and developing countries, influenced by factors such as population density, urbanization stage, climate, and economic conditions. Although UGSPC is widely used, most municipalities typically develop their plans based on this measurement. 95% of the included research incorporated additional measurements, including accessibility, social equity, spatial patterns, ecological services, ecosystem benefits, and human health. This study suggests that UGSPC is still used as an indicator in urban planning and policy and integrating it with other indicators can serve as contemporary indicators to capture better equity, functionality, and sustainability in urban environments.
Keywords:
urban green space per capita
; PRISMA
; developed and developing counties
; cities
; WHO
; VOSviewer
1. Introduction
As urban green space (UGS) plays a crucial role in urban planning and sustainability, well-managed green space can also positively impacts human well-being. Functionally, it is similar to natural and semi-natural environments [1]. Urban green space per capita (UGSPC) utilized as quick and important measurement between human and green space. The connection between the natural environment and humans has a long history. It has shaped human life by providing food, shelter and opportunity for recreation [2]. Even in early civilizations, the importance of green spaces was recognized, for instance, as a "garden" for private use or specific purposes such as the "Hanging Gardens of Babylon", "Healing Garden", "Paradise Garden" from the 5th to the 15th", later Baroque and Renaissance Garden [3,4].
The current understanding of urban green space comes from several concepts, for instance, urban park, by Frederick Law Olmsted, emerged during the 19th century. In the 20th and 21st centuries, several influential figures advanced this theoretical concept [5]. John Muir highlighted, maintaining wilderness in sustaining human well-being [6]. Meanwhile, design with nature, a concept promoted by Ian McHarg, emphasized ecological planning that aligns with natural systems [7]. Jane Jacobs noted the importance of community-driven urban planning and vibrant public spaces [8]. Regional planning that links urban areas with their surroundings was promoted by Patrick Geddes [9]. William H. Whyte studied public spaces and stressed their role in fostering social interaction [10]. Ebenezer Howard developed the garden city movement [11], and Julius Gy. Fábos contributed to greenway planning [12]. Collectively, these contributions shaped the modern understanding of UGS as essential for livable, sustainable cities.
Moreover, in the last four decades, a combined approach to urban areas has emerged, such as green-blue infrastructure in the US and Europe, which plays a crucial role in integrating greenery into water management systems[13]. Later, as green infrastructure integrates natural ecosystems into cities. Furthermore, nowadays, UGS is a key to sustainability as it has been highlighted in the United Nations Sustainable Development Goals (SDGs), particularly in SDG 11 (Sustainable Cities and Communities), SDG 13 (Climate Action), and SDG 15 (Life on Land) [14,15].
Despite these advances, human connections with nature have historically weakened with the birth of civilizations and the rise of industrialization. It has increased with the Industrial Revolution, which occurred in the 18th and 19th centuries [16,17]. Later, the effects of population growth, urbanization, and climate change have made the situation more challenging. The world population grew from 1 billion in the early 1800s and passed 8 billion in 2022, and it is estimated to surpass 9.8 billion by 2050 [18]. As more people moved to cities, the world's urban population increased from about 30% to 56% over the last 70 years, and it is expected to reach around 68% by 2050 [19]. By mid-century, urbanization is projected to increase, reaching 86% in developed countries and 64% in developing ones [19]. This led to an increase in energy consumption in cities, which accounts for 75% of global energy consumption, resulting in a 70% rise in greenhouse gas emissions [20]. These are intensifying significant pressures on ecosystems, infrastructure, and human well-being. Similarly, UGS has been impacted, typically evident in two ways. First, by reducing undeveloped land or green space as it is transformed into residential, commercial areas, warehouses, and other uses, and second, by increasing congestion in existing green spaces as residents visit parks, sports fields, and other recreational areas for leisure and well-being. These changes reduce the quantity and degrade the quality of green spaces.
Green space planning as a formal practice dates back over a century. A standard provision was first established by the National Recreation Association (NRA) in America in 1926, which recommended 10 acres per 1,000 population (approximately 40.5 m² per person) [21]. In 1938, the National Playing Fields Association (NPFA) (Britain) adopted 6 acres of permanent playing space per 1000 population (approximately 24.3 m² per person) [21]. Recently, at the global level, as highlighted in many peer-reviewed articles, the World Health Organization (WHO) has recommended a minimum of 9 m² of urban green space per capita, with an ideal provision of up to 50 m² [22,23].
UGSPC has been utilized as an indicator; the actual level of it has been highlighted in many studies, at the local level across various cities worldwide, from East to West. For example, Beijing 17 m² [24], Singapore 66 m² [25] Sydney 27 m² [26], Tehran, near 7 m² [27], Erbil 7m² [28] Riyadh near 1m² [29] Cairo, near 1 m² [30], Addis Ababa, near 10 m² [31], Istanbul, near 7 m² [32] Budapest 71 m², Vienna 52 m² [33], Berlin, near 8 m² [34] London 40 m², [25], Los Angeles, near 48 m² [35], Mexico, near 3 m² [36]. However, there is no universally agreed standard, first, due to the diversity of definitions and classification of UGS adopted by researchers, institutions, and urban planners, second, the location of the cities in the climatic zones and finally, the population density [37,38].
Despite UGSPC being a crucial metric in urban planning for a century and despite the existence of thousands of related studies, it has not yet been the subject of a dedicated systematic review. Based on my Scopus-based search of the most relevant and recent review papers on urban green space (UGS) analysis related to UGS per capita (Table 1), this indicator is rarely considered, appearing only partially in a single locally focused review [39]. Thus, highlighting the limitation of systematic or comprehensive literature review on this topic. Most review papers employ spatial and quantitative indicators, such as accessibility, proximity, NDVI, vegetation cover, and land-use data. In addition to that, functional and qualitative measures, for example, equity of access, restorative potential and community participation, are also mostly used, particularly in studies focused on health and social outcomes, in conjunction with temporal analyses, which primarily concern tracking changes in UGS over time.
Overall, studies and the standards reveal that UGSPC has been widely used; however, in contrast, our analysis of review papers shows that UGSPC has not become a topic in comprehensive review papers. This study aims to address this gap by answering the key questions, which are also guiding this systematic literature review:
- How has UGSPC been applied in developed and developing countries?
- What trends emerge in the included studies concerning the integration of UGSPC into research, urban planning and sustainability analyses?
- To what extent has UGSPC been utilized as a standalone indicator in the analysis and assessment of urban green spaces?
2. Materials and Methods
This research follows the Preferred Reporting Items for Systematic Reviews and Meta-Analyses (PRISMA) approach to ensure rigor, transparency, and reliability in reporting systematic reviews (the PRISMA flow diagram and checklist are provided in the Supplementary Materials). The data sources used in this study were limited to Elsevier Scopus, and PubMed. However, the authors believe these sources are sufficient for identifying empirical articles, as advanced search tools enabled the efficient retrieval of high-quality, focused research that meets the study’s objectives. For the document types to be investigated, we considered published papers between 1990 and 2024. The search was conducted in two periods, first was on 14th July 2023 including all paper before that period. The second period was on 30th January 2025 including new papers in this field till January 2025. The systematic review process was conducted in four stages. First, the titles, abstracts, keywords, authors’ name, affiliations, journals’ name, publication date, were downloaded from the sources in CSV format. Second, the files were converted to MS Excel and merged. Third, the dataset was uploaded to Google Sheets for screening by two researchers remotely and independently. Finally, the literature was evaluated for eligibility and inclusion.
2.1. Data Acquisition
The search terms used in this study were, first, for Elsevier Scopus: TITLE-ABS-KEY ( "urban green space*" OR "green space*" OR "greenspace*" OR "urban forest*" OR "public park*" OR "urban green area" OR "green urban area" OR "green infrastructure*" AND "per capita" OR "per person" OR "population density" ) AND ( LIMIT-TO ( LANGUAGE , "English" ) ) AND ( EXCLUDE ( DOCTYPE , "no" ) OR EXCLUDE ( DOCTYPE , "re" ) ). This search term includes papers related to green space or urban green space and population, limits the results to English-language papers only, and excludes Note and Review papers.
While screening the full text, only peer-reviewed articles were retained as eligible for the study, as they are more reliable. This step can be done in advance in this data source by limiting the source to articles only.
The search term in the second data source, PubMed, was: (("urban green space*"[All Fields] OR "green space*"[All Fields] OR "greenspace*"[All Fields] OR "urban forest*"[All Fields] OR "public park*"[All Fields] OR "urban green area"[All Fields] OR "green urban area"[All Fields] OR "green infrastructure"[All Fields]) AND ("per capita"[All Fields] OR "per person"[All Fields] OR "population density"[All Fields])).
The term TITLE-ABS-KEY means that the search is conducted across three research parts (Title, Abstract, and Keyword). The use of AND serves to narrow the search by only including documents that contain the words before and after AND, ensuring more precise search results. The use of "" (double quotation marks) ensures that the enclosed words are treated as one phrase and must appear exactly as written in the paper. Additionally, OR is used to search for alternative words, which allows for retrieving more papers in the research field.
Finally, the asterisk (*) is used for truncation, allowing for two or more variations of a word. For instance, the term space* includes both space and spaces. The total research paper were 1203 papers, including 976 from Scopus and 227 from PubMed, and after removing the duplicate papers, which were 189 papers, 1014 papers remain for the next step of PRISMA.
2.2. Screening, Eligibility and Inclusion
The research followed PRISMA (Figure 1). In the first step, only the titles of the documents were screened independently by two researchers to minimize bias. The title screening was based on three categories: exclude, maybe, and include. The results were classified according to the criteria in (Table 2), for example, the (exclude + exclude = 0) criteria means both researchers agreed the study is not related to the scope, and (exclude + maybe = 1) means one researcher thinks the study is not related and the other one thinks maybe related. These two were out of further processing. The rest of the criteria with values of 2, 3 and 4 reached the second step. This led to the exclusion of 545 (54%) records, while 469 (46%) records remained.
The second step was the abstract screening phase. The remaining 469 records were classified based on their relevance to our research scope. The studies were classified on a scale from 0 (not relevant) to 10 (most relevant). Only studies scoring between 5 and 10 proceeded to the next step. As a result, 224 records were removed, as they were out of our research scope or theoretical focus. The final number of records remaining was 245.
The third step was eligibility; full-text screening of the remaining 245 records was performed. Thus, leading to the exclusion of 176 studies because they focused on regional, national, or global trends rather than city-level or lower administrative divisions. The number of studies eligible in this process was 69. To update the research, an additional 11 studies published between July 27, 2023, and December 31, 2024, were added based on the same selection criteria. In the final synthesis, 80 empirical studies were included, all of which focused on urban environments at the city, town, district, ward or neighborhood level.
3. Results
3.1. Urban Green Space Per Capita Application
3.1.1. A Global Analysis of Urban Green Space Per Capita Through Case Studies
More than 40 countries in Asia, Europe, Africa, Oceania, and North America were included in these research articles (Figure 2). Most of the studies (67%) used case studies were in cities in developing countries, while 30% in developed countries, and 3% involved mixed cases. Among the developing countries, China (23 articles) and India (9 articles) contributed the highest number of studies, followed by Turkey (3 articles) and several countries with two studies each, including Iraq (Kurdistan Region), Iran, Ukraine, Sri Lanka, and Bangladesh. Among developed countries, Germany (10 articles) was the most frequently studied, followed by the United States of America, with three multi-case studies. Italy, Hungary, the Netherlands, multiple European countries and Australia, each accounted for two studies.
3.1.2. Publication and Thematic Patterns Across Journals
A total of 80 articles were published across 46 journals, which reflect a broad interdisciplinary scope in the research field. Among these journals, the most frequently used were Sustainability, followed by Ecological Indicators and GeoJournal. These three journals have been used for publishing 9, 7, and 5 articles, respectively. The second group, consisting of journals that published between two and four articles (eight journals in total), includes Landscape and Urban Planning, Urban Forestry and Urban Greening, Land, PLOS ONE, Environmental Monitoring and Assessment, Ecology and Society, Forests, and Land Use Policy. The last group, comprising journals that appeared only once in this study (Thirty-five journals), encompasses a diverse range of publications (Figure 3).
The journals had been classified into several groups according to their primary focus. Most of them are under the Sustainability, Ecology, and Environmental Science category, which accounts for 43% of all publications, indicating a strong environmental and ecological orientation. This is followed by other aspects, mainly related to Geography, Land Use, and Technology (18%), Urban and Landscape Planning & Design (12%), and Forestry and Urban Greening (11%), reflecting a consistent focus on spatial planning and landscape analysis. Smaller yet significant portions of the publications are within General and Interdisciplinary Studies (7%), Policy and Administration (5%), Agriculture (2%), and Public Health (1%). These results show that while environmental sustainability remains the central focus, the study also explores related areas such as urban planning, land use, governance, and public well-being.
3.1.3. UGSPC Definition and Formula
Urban Green Space Per Capita is a quantitative measurement that refers to measuring and using the amount of green space available per person in an area. It is based on the two key components: UGS (e.g., parks, gardens, and other green areas) and the population. The simplest formula of measurement is:
3.1.4. Terms Used in Relation to Urban Green Space
Table 3 summarizes the different terms used to describe greenery in urban areas and the frequency of use in the studies. The most frequently used term is "Urban green space(s)", which appears in 32 studies, accounting for 40% of all studies. This is followed by "Green space(s)" with 16 mentions and "Urban park" with 10. "Urban green(ing)", "Urban park green space", and "Green area", appearing between 2 and 4 times each. Some publications use more specific terms like "Urban green infrastructure", "Urban-blue-and-green-spaces (UBGS)", and "Green and blue infrastructure." Some terms emphasize the social and ecological aspects of urban vegetation, such as "Public parks and gardens", "Community green space", and "Open and green public space(s)". However, each of these is mentioned only once.
3.1.5. UGS and Population Sources Utilized in the Studies
Diverse sources have been used for UGS and population data acquisition; the Sankey diagram (Figure 4), using the SankeyMATIC online tool, illustrates the sources utilized in the empirical studies. The numbers and line thickness indicate the frequency of use; moreover, some studies utilized two or more sources. UGS data are often derived from municipal records, freely available satellite imagery (e.g., Sentinel and Landsat), commercial satellite imagery (e.g., RapidEye, Gaofen, PlanetScope, and WorldView), global and local LULC datasets (e.g., Urban Atlas, Corine Land Cover, and ESA World Cover), supported by tools such as Google Earth, OpenStreetMap, Baidu maps, Goade maps, and Map World images, as well as local planning documents (e.g., master plans and construction statistical yearbook). For population data, statistical offices and census records are the primary sources used by researchers, followed by yearbooks, population heat maps, global and regional datasets (e.g., WorldPop and EUROSTAT), and newer approaches, including mobile phone data. Together, these sources combine official records with modern remote sensing and digital platforms, as well as field surveys, to analyze the relationship between green spaces and population.
3.1.6. UGSPC Value Across Developed Countries
The analysis of UGSPC across cities in developed countries reveals noticeable differences in the amount of green space available to residents (Figure 5). The data include both values obtained directly from case studies and those frequently cited by the included studies. We classified them based on World Health Organization (WHO) standards (9 m² per person as the minimum and 50 m² per person as the ideal level), and illustrated by using Datawrapper online tool. These cities can be classified into three categories. The first, characterized by UGSPC exceeding 50 m². Includes Berlin (54–60.19 m²)[86,109], Glasgow (55.6 m²), Budapest (71–86 m²) [33], Munich (74 m²)[86], Vienna (55–124.6 m²)[109,115], Boston (101.9 m²)[110], Zadar (114 m²) [77], and San Juan (122.2 m²)[110]. These cities may stand out for high urban livability, ecological sustainability, and the well-being of their residents. The second, with values between 9 m² and 50 m², includes Lisbon (11.6 m²), Copenhagen (12.89–42.4 m²)[115], Berlin (16.3 m²) without forests [124], Amsterdam (16.79–45.5 m²)[109,116], London (16.16–27 m²)[115], Rome (23.5 m²)[96], Brussels (29.2 m²)[96], Stockholm (34 m²)[90], Bergisch Gladbach (36.3 m²)[34,113] and Padua (48.54 m²)[103]. These cities meet or exceed the WHO minimum but remain below the ideal level, reflecting a balance between compact urban development and the availability of green areas. The third, with less than 9 m² per person, includes Schwerin (2.5 m²)[34,113], Tokyo (5.73 m²)[99], and Seoul (6.5 m²)[99]. These cities fall below the minimum recommended by WHO, indicating a shortage of green space that may limit recreational opportunities and reduce overall environmental quality.
3.1.7. UGSPC Value Across Developing Countries
UGSPC across various cities in developing countries is illustrated in Figure 6, using Datawrapper online tool, compared to the WHO standards of 9 m² per person and 50 m² per person. The data include both values obtained directly from case studies and some of those cities that were cited by the included studies. Overall, while a few cities surpass the ideal level, most developing cities provide less than the minimum level. Cities with UGSPC over 50 m² include Dnipro (219 m²)[54], Gandhinagar (147.6 m²)[87], Nadym (61.08 m²)[85], Chandigarh (54.5 m²)[87], and Curitiba (51.5 m²)[59]. A moderate number of cities and towns fall within the 9–50 m² range, including Kyiv (36 m²), Xi’an (27.85 m²), Kalaburagi and Kumasi (25 m²)[61], Asansol (24.67 m²)[59], Bathinda (21.7 m²)[76], Jaipur (20 m²)[116], Bangalore (17.8 m²)[59], Beijing (16.4 m²)[108], Battalgazi (16.3 m²)[58], Sanya (16.26 m²)[67], Dubai (13.1 m²)[96], Urumqi (11.5 m²)[72], Erbil (9.3 m²)[56] and Lanzhou (9.1 m²)[107]. However, most of them fall below the WHO minimum threshold, such as Baghdad (1 m²)[96], Cairo (1.5 m²)[96], Tehran (4.5 m²)[60], Delhi (5.5 m²), Mumbai (2.1 m²)[59], and Wuhan (5 m²)[112], among many others. This indicates a lack of green spaces for urban residents.
3.2. The Trend in UGSPC
3.2.1. Publication Trend in Urban Green Space Per Capita
Our original search covered publications from the earliest available records, dating back to 1979, up to January 2025. However, after applying the PRISMA methodology, the final set of included studies consisted only of papers published after 2010. We attribute this to our inclusion criteria, which were limited to empirical studies focusing on cities and smaller scales. The publication trend results show that the number of studies on UGSPC has increased over the past fifteen years (Figure 7). Interest began to grow gradually after 2010. Activity increased notably in 2018, coinciding with heightened global attention to urban sustainability indicators following the adoption of the SDGs (2015) and the expanded availability of high-resolution spatial datasets, such as Sentinel-2, around 2016-2017. A sharp peak occurred in 2021 with 17 articles, likely driven by the COVID-19 pandemic, reflecting a growing global awareness of the importance of UGS [125,126]. The studies have remained high, despite a slight decline in publications after 2021.
3.2.2. The Authors' Keywords Co-Occurrence
Keyword co-occurrence is a powerful method for uncovering the main themes and conceptual structures across large sets of texts [127,128]. Figure 8 presents the Authors' keyword co-occurrence network generated using VOSviewer. Each node represents a keyword from the included studies. The node size corresponds to the frequency of occurrence, and connected lines indicate co-occurrence relationships; the thicker the line, the stronger the association. Network visualization shows how research themes have evolved, with node colors indicating the average year of publication. Although the legend spans from 2010 to 2025, most nodes appear in lighter red and yellow tones, suggesting that most studies have been published after 2015. The overall structure highlights a clear shift in focus, from earlier work centered on biophysical and methodological topics like ecosystem services, spatial analysis, and remote sensing, to more recent interests in accessibility, equity, and urban green space planning.
Key nodes such as accessibility, urban green space, green infrastructure, and urban planning act as central hubs that connect multiple research areas. Distinct clusters mark major research pathways, including ecosystem and spatial studies, sustainability and urban planning, and social equity and accessibility. Taken together, the visualization reflects a broader transformation in the field: a move away from purely technical, mapping-based analyses toward more socially focused, policy-oriented research that emphasizes spatial equity, livability, and sustainable urban development.
3.2.3. Trend in the Value of UGSPC in the Studies
Figure 9 illustrates the trend in UGSPC values reported in eligible studies. The data were drawn from the included studies, encompassing both case study findings and cited studies.
There are only three cases from developed countries: Vienna (AT), Budapest (HU) and Seoul (KR). Vienna's UGS were 64 m² per capita in 1990, declining to 55 m² in 2018, while Budapest experienced a steady increase from 54 m² to 71 m² of UGS per capita during the same period [33]. Although UGS has increased in both cities, the trends were significantly influenced by population growth in Vienna and population decline in Budapest. Seoul showed modest growth in UGSPC from 15.9 m² to 16.5 m² (2007–2017)[52], which is influenced by both planning and polices; in 1995, the Policy Direction of Parks and Green Spaces was established, and the Seoul Parks and Green Space Master Plan for 2030 was introduced in 2015.
In developing countries, the trend of UGSPC in the cities is unstable and generally declining, with some exceptions. UGSPC declined sharply in Dhaka, Colombo, Kumasi, Mumbai, Kolkata, Chandigarh, Gandhinagar and Bangalore. Dhaka experienced a dramatic reduction in UGSPC, plummeting from 83.9 m² in 1975 to 0.5 m² in 2014, primarily due to rapid population growth and intense urban densification [101]; in Kumasi, from 202 m² in 1986 to 25 m² in 2014 [78], mainly driven by rapid urbanization and land-use change (conversion of vegetation to built-up), combined with weak planning and institutional control and socio-economic patterns that produce unequal loss; and in Colombo from 53.3 m² to 7.2 m² (1980–2015)[101], primarily attributed to rapid urbanization, the significant development of infrastructure, and the conversion of most vacant and forest areas into urban settlements and administration buildings. UGSPC has been gradually decreasing in Kolkata, from 15.9 m² in 1991 to 7.2 m² in 2018, with a projected value of 2.9 m² by 2035 [70]. This trend is primarily driven by the loss of urban green spaces resulting from inadequate planning policies and rapid urbanization, despite a population decline [70]. In other Indian cities, UGSPC declined from 2001 to 2011; for example, Mumbai from 2 to 0.65 m², Chandigarh from 54.5 to 15.9 m², Gandhinagar from 162.8 to 30.3 m², and Bangalore from 17.2 to 2.2 m². This extreme decline in UGSPC even affects the greenest cities in India, like Gandhinagar and Chandigarh. This occurred due to the high rate of population growth and economic advancements, resulting in significant changes in land use and a decline in urban forests. Kuala Lumpur, with the plan 'Garden Nation' having the direction of green spaces as part of the social and environmental infrastructure of the cities, UGSPC still decreased from 13 m² to 8.5 m² (2010–2014)[52]. However, in contrast, UGSPC in Chinese cities increased, for instance, in Beijing, where UGSPC has increased from 5.1 m² in 1978 to 16.4 m² in 2019, primarily due to the municipal government's proactive efforts to expand the city's green coverage [108]. The amount of UGSPC in Xi'an city has increased from 13.6 m² to 27.9 m² between 2009 and 2019 [55]. This growth can be attributed to government policies promoting the "park city" concept. Similarly, in Kunming, the area has expanded from 1.63 m² to 8.69 m² per capita from 2010 to 2020 [101].
3.3. The Usability of UGSPC
3.3.1. Global Standards for Measuring UGSPC
At the international level, the World Health Organization (WHO) standard is the most frequently applied benchmark for urban green space per capita (UGSPC). It recommends a minimum of 9 m² per person and an ideal level of 50 m² per person, and has been adopted by approximately 40% of the reviewed studies [33,54]. The United Nations (UN) guidelines suggest 12–16 m² up to 30 m² per capita in the same cases [115,116]. Similarly, the European Union (EU) applies a standard of 26 m² per capita [82,84,115]. At the same time, many developed countries adopt thresholds ranging between 20 m² and 60 m² per capita, reflecting higher expectations for urban livability and environmental quality.
In addition to these international benchmarks, several national and city-level standards are also widely applied. In the United States, the average provision of green space is around 18 m² per capita. The Public Health Bureau in the USA recommends 18 m² UGSPC [84]. In addition, the LEED-ND (Leadership in Energy and Environmental Design – Neighbourhood Development) framework, developed by the U.S. Green Building Council (USGBC), recommends 12.5 m² per capita [75,116], while the National Recreation and Park Association (NRPA) suggests a standard of 40 m² per person [57]. The SNiP standard in Russia, which shows no less than 6 m² per capita [85]. The URDPFI Guidelines, which is the standard in India, recommend 10–12 m² per capita . In Germany, it really depends on the city. For example, Leipzig, sets 10 m² UGSPC as standard [76], while Berlin's standard is 6 m² as minimum [65]. China is an example of how these goals can change. The 'National Garden City' evaluation started at least 8 m² per capita, which later increased to 14.6 m² by 2020 [67]; however, the Wuhan master plan still sets a minimum of 5 m² per capita. Amsterdam standard specifies a minimum provision of 24 m² UGS per capita [49], while the Netherlands standard aims to reach 60 m² UGSPC of accessible green space per capita within a 500-meter radius [115].
3.3.2. Dimensions of Urban Green Space Assessment
Researchers have employed a diverse range of metrics to assess UGS (Table 4). Besides using the UGSPC metric, they apply multidimensional frameworks that combine factors such as accessibility, spatial patterns, quality, equity, and ecosystem services. From these, accessibility metrics are the most common, such as catchment-area, distance-based, and network-based methods, which focus on how easily people can access green areas [34,74,94,117]. Many studies also explore social equity, UGS justice, and fairness in the distribution of green spaces, often using supply–demand matching or optimization modeling to highlight disparities [57,99,110]. Analyses of spatial patterns and configurations, frequently supported by landscape or remote sensing indices, are used to capture the composition, fragmentation, and overall structure of green areas [52,60,107]. Other research emphasizes quality, assessing aspects such as vegetation health, visual appeal, and service provision [65,75], while also linking UGS to broader ecosystem benefits, including carbon reduction, cooling effects, and water regulation [86,100]. In addition, indicators like urban resilience, and green infrastructure provision expand the discussion toward sustainability and urban regeneration [62,81,127].
4. Discussion
Cities in developing countries have a low amount of UGSPC; most of them cannot reach the minimum level set by the WHO, whereas cities in developed countries have a high amount, typically near the ideal level [128]. In addition, the trend of UGSPC was not clearly seen as upward in developed countries and downward in developing countries, as several factors can influence it. For example, the population growth rate and population density have a negative correlation with UGS availability [33]. Urbanization, particularly when the shift occurs from natural or semi-natural lands to residential and commercial areas [131]. Notably, the effects of city size and stage of development can differ. In rapidly urbanizing areas, we often observe a decline in UGSPC. At the same time, more established cities may focus on revitalizing their green infrastructure as part of urban renewal efforts [132].
Moreover, economic growth led to a rapid increase in land prices, which posed a challenge to prioritizing green space, as commercial development often precedes environmental concerns [133]. However, other studies highlighted that high GDP has been seen as a positive aspect [134], and wealthier neighborhoods tend to have greater UGSPC [135].
Another important factor is climate zones; cities with moderate climates and high humidity tend to support more vegetation, resulting in healthier and higher rates of green spaces. In contrast, in other climate zones, such as arid or semi-arid regions, people struggle to maintain green spaces, as irrigation is costly [136].
Furthermore, geography and topology play a critical role; flat land often finds it easier to develop and maintain green spaces, in contrast to green spaces in hilly or high-altitude locations [137].
Finally, the various definitions of UGS have different impacts, as some researchers consider only public spaces, which show low UGSPC, while others have included a broader range, from small private gardens, street trees, to larger urban parks [138].
Despite the challenges mentioned above, which often reduce UGSPC, proactive governance, equitable urban planning, thoughtful design that respects local contexts, and climate-adjusted strategies can effectively enhance the UGS and increase UGS provision.
While UGSPC is a widely used indicator, many researchers have argued that it is not sufficient on its own to evaluate urban sustainability, livability, and environmental equity. They pointed out that measuring urban green space solely in terms of per-capita is a purely quantitative measure and does not capture other important dimensions such as maintenance, biodiversity, amenities, accessibility, safety, and spatial configuration. Our systematic literature review has also shown that approximately 95% of the reviewed literature incorporates other complementary metrics in addition to UGSPC. These additional measures include accessibility, spatial distribution, quality, ecosystem services, and user satisfaction.
UGSPC remains popular, particularly because it has a straightforward assessment and provides quick results. This characteristic can be beneficial, first during urgent situations, such as the COVID-19 pandemic period. Second, it offers insights into a broader understanding of sustainability at the national and regional levels by comparing multiple cities across countries or globally. Some studies have expanded the UGSPC analytical scale, moving beyond citywide averages to examine smaller spatial units such as districts, wards, and even neighborhoods. Moreover, UGS per capita is improved by interlocking with the catchment area, such as 500 or 300 meters, to obtain a more accurate result. Despite much progress in UGS analysis in academia, most cities still lack a standardized benchmark for UGS analysis. Most cities with urban green space plans or sustainability frameworks rely on UGSPC as their primary reference indicator, underscoring its continued relevance in terms of sustainability and livability, despite its limitations. These might show that it is not just simple for research, but also applicable for implementation.
5. Conclusions
The systematic review is the first review of urban green space per capita, as it is the most commonly used indicator in UGS analysis. The study was conducted in accordance with the PRISMA guidelines and independently performed by two researchers to minimize bias. It synthesized evidence from 80 empirical studies on UGSPC worldwide, with a focus on cities and smaller scales. Our analysis revealed that UGSPC is more commonly used in studies from developing countries than from developed countries, with usage rates of 67% and 30%, respectively. China and India primarily used this indicator among developing countries, while Germany used it among developed countries. A notable increase in publications has occurred following the COVID-19 pandemic, reflecting heightened global attention to urban green spaces and their role in public health and livability.
The most frequently used Journals for publishing articles were Sustainability, Ecological Indicators, and GeoJournal. The thematic analysis of the Journals shows that most of them are under the Sustainability, Ecology, and Environmental Science category, followed by Geography, Land Use, and Technology. The terms used to represent greenery in urban areas were different. The studies utilized various sources to collect data related to UGS and population, including municipal records and remote sensing. Differences in UGSPC between developed and developing countries highlight disparities in both quantity and planning approaches. The high rate and positive trend of UGSPC are influenced by several factors, including population growth rate, urbanization stage, and microclimate. The importance of the metric increased significantly, especially during COVID-19. The trend of focus in the included studies shifted from technical, mapping-based analyses toward more socially focused, policy-oriented research.
UGSPC is rarely used as a standalone indicator of green space equity, livability, and sustainability in the research, despite its widespread use in urban planning, particularly in cities where it remains the primary metric for green space provision. Furthermore, a declining trend in UGSPC in developing countries highlights the need for strategic urban planning that addresses the negative factors. Overall, while UGSPC has been used for a century and remains a valuable metric for quick understanding of urban green space provision and implementation, its effectiveness can be enhanced when combined with multiple and complementary indicators.
References
- Eldridge, D.J.; et al. Urban greenspaces and nearby natural areas support similar levels of soil ecosystem services. npj Urban Sustainability 2024, 4(1), p. 15. [Google Scholar] [CrossRef]
- Kellert, S.R. Building for life: Designing and understanding the human-nature connection; Island press, 2012. [Google Scholar]
- Dalley, S. Nineveh, Babylon and the Hanging Gardens: cuneiform and classical sources reconciled1. Iraq, 1994. 56: p. 45-58.
- Ruggles, D.F. Islamic gardens and landscapes; University of Pennsylvania Press, 2008. [Google Scholar]
- Eisenman, T.S. Frederick Law Olmsted, green infrastructure, and the evolving city. Journal of planning history 2013, 12(4), 287–311. [Google Scholar] [CrossRef]
- Duke, J.A. Three men in the wilderness: Ideas and concepts of nature during the Progressive Era with Theodore Roosevelt, Gifford Pinchot and John Muir; 2016. [Google Scholar]
- Yang, B.; Li, S. Design with Nature: Ian McHarg’s ecological wisdom as actionable and practical knowledge. Landscape and Urban Planning 2016, 155, 21–32. [Google Scholar] [CrossRef]
- Rosenberg, E. Public and private: Rereading jane Jacobs. Landscape journal 1994, 13(2), 139–144. [Google Scholar] [CrossRef]
- Mercer, C. Geographies for the present: Patrick Geddes, urban planning, the human sciences and the question of culture1. Independent Academia, 2003.
- Marcus, C.C.; Francis, C. People places: design guidlines for urban open space; John Wiley & Sons, 1997. [Google Scholar]
- Culpin, E.G.; Ward, S. The garden city movement up-to-date; Routledge, 2015. [Google Scholar]
- Ryan, R.L.; Eisenman, T.S. Building connections to the minute man national historic park: greenway planning and cultural landscape design. In Fábos Conference on Landscape and Greenway Planning; University of Massachusetts Amherst Libraries, 2019. [Google Scholar]
- Grabowski, Z.J.; et al. What is green infrastructure? A study of definitions in US city planning. Frontiers in Ecology and the Environment 2022, 20(3), 152–160. [Google Scholar] [CrossRef]
- Lorenzo-Sáez, E.; et al. Contribution of green urban areas to the achievement of SDGs. Case study in Valencia (Spain). Ecological Indicators 2021, 131, 108246. [Google Scholar] [CrossRef]
- Hyder, M.B.; Haque, T.Z. Understanding the linkages and importance of urban greenspaces for achieving sustainable development goals 2030. J. Sustain. Dev 2022, 15, 144. [Google Scholar] [CrossRef]
- Moghadam, D.M.; Singh, H.; Yahya, W. A brief discussion on human/nature relationship. International Journal of Humanities and Social Science 2015, 5(6), 90–93. [Google Scholar]
- Sibthorpe, R.L.; Brymer, E. Disconnected from nature: the lived experience of those disconnected from the natural world. In Innovations in a changing world; 2020; p. 59. [Google Scholar]
- Affairs, U.N.D.o.E.a.S., World population projected to reach 9.8 billion in 2050, and 11.2 billion in 2100.
- United Nations. D.o.E.a.S.A., Population Division, World Urbanization Prospects 2018: Highlights; United Nations, 2019. [Google Scholar]
- Ribeiro, H.V.; Rybski, D.; Kropp, J.P. Effects of changing population or density on urban carbon dioxide emissions. Nature communications 2019, 10(1), 3204. [Google Scholar] [CrossRef]
- Wilkinson, P.F. The golden fleece: The search for standards. Leisure studies 1985, 4(2), 189–203. [Google Scholar] [CrossRef]
- Badiu, D.L.; et al. Is urban green space per capita a valuable target to achieve cities’ sustainability goals? Romania as a case study. Ecological indicators 2016, 70, 53–66. [Google Scholar] [CrossRef]
- Russo, A. G.T. Cirella, Modern compact cities: how much greenery do we need? International journal of environmental research and public health 2018, 15(10), 2180. [Google Scholar] [CrossRef] [PubMed]
- Cao, Y.; et al. Estimation of Carbon Density in Different Urban Green Spaces: Taking the Beijing Main District as an Example. Land 2025, 14(2), 270. [Google Scholar] [CrossRef]
- Yukhnovskyi, V.; Zibtseva, O. Normalization of green space as a component of ecological stability of a town. 2019. [Google Scholar] [CrossRef]
- Hsu, Y.-Y.; et al. Beyond the backyard: GIS analysis of public green space accessibility in Australian metropolitan areas. Sustainability 2022, 14(8), 4694. [Google Scholar] [CrossRef]
- Ziari, K.; Zebardast, K. Spatial distribution and equity of urban green space provision in Tehran Metropolis using hybrid Factor Analysis and Analytic Network Process (F′ ANP) model. Geomatica 2024, 76(2), p. 100022. [Google Scholar] [CrossRef]
- Hassan, Y.N.; et al. Evaluating Urban Green Space Accessibility and Per Capita Distribution in Erbil and Sulaymaniyah, Kurdistan Region of Iraq. In Fábos Conference on Landscape and Greenway Planning; University of Massachusetts Amherst Libraries, 2025. [Google Scholar]
- Ledraa, T.; Aldegheishem, A. What Matters Most for Neighborhood Greenspace Usability and Satisfaction in Riyadh: Size or Distance to Home? Sustainability 2022, 14(10), 6216. [Google Scholar] [CrossRef]
- Keleg, M.M.; Watson, G. Butina; Salheen, M.A. A critical review for Cairo’s green open spaces dynamics as a prospect to act as placemaking anchors. Urban Design International 2022, 27(3), 232–248. [Google Scholar] [CrossRef]
- Tassew, A.; Fikresilassie, A. An assessment of the availability, accessibility, and attractiveness of urban green space and parks in three African cities. African Journal of Land Policy and Geospatial Sciences 2024, 7(1), 53–70. [Google Scholar]
- Yaysis, Planning approach: Spatial analysis. 2022.
- Hassan, Y.N.; et al. A Comparative Assessment of UGS Changes and Accessibility Using Per Capita Metrics: A Case Study of Budapest and Vienna. Journal of Digital Landscape Architecture 2024, 723–734. [Google Scholar]
- Wüstemann, H.; Kalisch, D.; Kolbe, J. Access to urban green space and environmental inequalities in Germany. Landscape and Urban Planning 2017, 164, 124–131. [Google Scholar] [CrossRef]
- Maryanti, M.; et al. The urban green space provision using the standards approach: issues and challenges of its implementation in Malaysia. WIT Transactions on Ecology and the Environment 2017, 210, 369–379. [Google Scholar]
- Ayala-Azcarraga, C.; et al. Uneven distribution of urban green spaces in relation to marginalization in Mexico City. Sustainability 2023, 15(16), 12652. [Google Scholar] [CrossRef]
- Kabisch, N. D. Haase, Green justice or just green? Provision of urban green spaces in Berlin, Germany. Landscape and urban planning 2014, 122, 129–139. [Google Scholar] [CrossRef]
- Haaland, C.; van Den Bosch, C.K. Challenges and strategies for urban green-space planning in cities undergoing densification: A review. Urban forestry & urban greening 2015, 14(4), 760–771. [Google Scholar]
- Blaschke, P.; et al. Multiple roles of green space in the resilience, sustainability and equity of Aotearoa New Zealand’s cities. Land 2024, 13(7), 1022. [Google Scholar] [CrossRef]
- Endalew Terefe, A.; Hou, Y. Determinants influencing the accessibility and use of urban green spaces: a review of empirical evidence. City and Environment Interactions 2024, 24 100159. [Google Scholar] [CrossRef]
- Xian, Z.; et al. The effects of neighbourhood green spaces on mental health of disadvantaged groups: a systematic review. Humanities and Social Sciences Communications 2024, 11(1), 1–19. [Google Scholar] [CrossRef]
- Raza, W.; et al. A Systematic Review of the Impact of Changes to Urban Green Spaces on Health and Education Outcomes, and a Critique of Their Applicability to Inform Economic Evaluation. International Journal of Environmental Research and Public Health 2024, 21(11), 1452. [Google Scholar] [CrossRef] [PubMed]
- Huang, H.; et al. Urban heatwave, green spaces, and mental health: A review based on environmental health risk assessment framework. Science of the Total Environment 2024, 948, 174816. [Google Scholar] [CrossRef]
- Castañeda, N.R.; et al. Exploring the restorative capacity of urban green spaces and their biodiversity through an adapted One Health approach: A scoping review. Urban Forestry & Urban Greening 2024, 100, 128489. [Google Scholar] [CrossRef]
- Ihle, T.; et al. Health effects of participation in creating urban green spaces—A systematic review. Sustainability 2024, 16(12), 5000. [Google Scholar] [CrossRef]
- Vilcins, D.; et al. Green space in health research: an overview of common indicators of greenness. Reviews on Environmental Health 2024, 39(2), 221–231. [Google Scholar] [CrossRef]
- Liu, Y.; Fan, C.; Xue, D. A review of the effects of urban and green space forms on the carbon budget using a landscape sustainability framework. Sustainability 2024, 16(5), 1870. [Google Scholar] [CrossRef]
- Park, H.; Brown, C.D.; Pearson, A.L. A systematic review of audit tools for evaluating the quality of green spaces in mental health research. Health & place 2024, 86, 103185. [Google Scholar]
- Tian, Y.; et al. Urban green inequality and its mismatches with human demand across neighborhoods in New York, Amsterdam, and Beijing. Landscape Ecology 2024, 39(3), p. 60. [Google Scholar] [CrossRef]
- Nambazo, O.; Nazombe, K. The spatial heterogeneity of urban green space distribution and configuration in Lilongwe City, Malawi. Plos one 2024, 19(7), e0307518. [Google Scholar] [CrossRef]
- Zhao, W.; et al. Spatial Heterogeneity Analysis of the Multidimensional Characteristics of Urban Green Spaces in China—A Study Based on 285 Prefecture-Level Cities. Land 2024, 13(7), 1050. [Google Scholar] [CrossRef]
- Olfato-Parojinog, A.; Dagamac, N.H.A.; Limbo-Dizon, J.E. Assessment of urban green spaces per capita in a megacity of the Philippines: implications for sustainable cities and urban health management. GeoJournal 2024, 89(3), 94. [Google Scholar] [CrossRef]
- Pattanakiat, S.; et al. Spatial Green Space Assessment in Suburbia: Implications for Urban Development: 10.32526/ennrj/22/20230153. Environment and Natural Resources Journal 2024, 22(1), 76–92. [Google Scholar] [CrossRef]
- Buchavyi, Y.; Lovynska, V.; Samarska, A. A GIS assessment of the green space percentage in a big industrial city (Dnipro, Ukraine). Ekológia (Bratislava) 2023, 42(1), 89–100. [Google Scholar] [CrossRef]
- Pang, B.; et al. Calculating optimal scale of urban green space in Xi'an, China. Ecological Indicators 2023, 147, 110003. [Google Scholar] [CrossRef]
- Wahab, A.A.A.; Jassim, M.A. Optimization of the urban green area in Erbil territory for sustainable development. Periodicals of Engineering and Natural Sciences (PEN) 2023, 11(3), 203–216. [Google Scholar] [CrossRef]
- Dash, M.; Chakraborty, M. Distribution of green spaces across socio-economic groups: a study of Bhubaneswar, India. Journal of Architecture and Urbanism 2023, 47(1), 57–67-57–67. [Google Scholar] [CrossRef]
- Pouya, S.; Aghlmand, M. Evaluation of urban green space per capita with new remote sensing and geographic information system techniques and the importance of urban green space during the COVID-19 pandemic. Environmental monitoring and assessment 2022, 194(9), 633. [Google Scholar] [CrossRef]
- Siddique, G.; et al. An assessment on the changing status of urban green space in Asansol city, West Bengal. GeoJournal 2022, 87(2), 1299–1321. [Google Scholar] [CrossRef]
- Nasri Roodsari, E.; Hoseini, P. An assessment of the correlation between urban green space supply and socio-economic disparities of Tehran districts—Iran. Environment, development and sustainability 2022, 24(11), 12867–12882. [Google Scholar] [CrossRef]
- Aryal, J.; Sitaula, C.; Aryal, S. NDVI threshold-based urban green space mapping from sentinel-2A at the Local Governmental Area (LGA) level of victoria, Australia. Land 2022, 11(3), 351. [Google Scholar] [CrossRef]
- Chen, Y.; et al. Inequalities of urban green space area and ecosystem services along urban center-edge gradients. Landscape and Urban Planning 2022, 217, 104266. [Google Scholar] [CrossRef]
- Kolcsár, R.A.; et al. Age-group-based evaluation of residents’ urban green space provision: Szeged, Hungary. A case study. Hungarian Geographical Bulletin 2022, 71(3), 249–269. [Google Scholar] [CrossRef]
- Dong, Y.; et al. Decrease in the residents’ accessibility of summer cooling services due to green space loss in Chinese cities. Environment International 2022, 158, 107002. [Google Scholar] [CrossRef]
- De Luca, C.; et al. Accessibility to and availability of urban green spaces (UGS) to support health and wellbeing during the COVID-19 pandemic—the case of Bologna. Sustainability 2021, 13(19), 11054. [Google Scholar] [CrossRef]
- Mathey, J.; et al. Qualifying the urban structure type approach for urban green space analysis–A case study of Dresden, Germany. Ecological Indicators 2021, 125, 107519. [Google Scholar] [CrossRef]
- Li, X.; et al. Investigation of urban green space equity at the city level and relevant strategies for improving the provisioning in China. Land Use Policy 2021, 101, 105144. [Google Scholar] [CrossRef]
- Wu, L.; Kim, S.K. Exploring the equality of accessing urban green spaces: A comparative study of 341 Chinese cities. Ecological Indicators 2021, 121, 107080. [Google Scholar] [CrossRef]
- Zhang, Y.; et al. Designating National Forest Cities in China: Does the policy improve the urban living environment? Forest Policy and Economics 2021, 125, 102400. [Google Scholar] [CrossRef]
- Dinda, S.; Chatterjee, N.D.; Ghosh, S. An integrated simulation approach to the assessment of urban growth pattern and loss in urban green space in Kolkata, India: A GIS-based analysis. Ecological Indicators 2021, 121, 107178. [Google Scholar] [CrossRef]
- Wu, L.; Kim, S.K. Does socioeconomic development lead to more equal distribution of green space? Evidence from Chinese cities. Science of The Total Environment 2021, 757, 143780. [Google Scholar] [CrossRef] [PubMed]
- Shi, L.; et al. Urban green space accessibility and distribution equity in an arid oasis city: Urumqi, China. Forests 2020, 11(6), 690. [Google Scholar] [CrossRef]
- He, S.; Wu, Y.; Wang, L. Characterizing horizontal and vertical perspectives of spatial equity for various urban green spaces: a case study of Wuhan, China. Frontiers in public health 2020, 8, 10. [Google Scholar] [CrossRef]
- Shekhar, S.; Aryal, J. Role of geospatial technology in understanding urban green space of Kalaburagi city for sustainable planning. Urban forestry & urban greening 2019, 46, 126450. [Google Scholar]
- Lahoti, S.; Lahoti, A.; Saito, O. Benchmark assessment of recreational public Urban Green space provisions: A case of typical urbanizing Indian City, Nagpur. Urban Forestry & Urban Greening 2019, 44, 126424. [Google Scholar] [CrossRef]
- Singh, K.K. Urban green space availability in Bathinda City, India. Environmental monitoring and assessment 2018, 190(11), 671. [Google Scholar] [CrossRef] [PubMed]
- Šiljeg, S.; et al. Accessibility analysis of urban green spaces in the settlement of Zadar in Croatia. Šumarski list 2018, 142(9-10), 487–496. [Google Scholar]
- Nero, B.F. Urban green space dynamics and socio-environmental inequity: multi-resolution and spatiotemporal data analysis of Kumasi, Ghana. International Journal of Remote Sensing 2017, 38(23), 6993–7020. [Google Scholar] [CrossRef]
- Hosseini, J.; et al. Comparison of the analytic network process and the best–worst method in ranking urban resilience and regeneration prioritization by applying geographic information systems. Land 2024, 13(7), 1008. [Google Scholar] [CrossRef]
- Sun, Y.; et al. Spatial green space accessibility in Hongkou District of Shanghai based on Gaussian two-step floating catchment area method. Buildings 2023, 13(10), 2477. [Google Scholar] [CrossRef]
- Mumm, O.; et al. Green densities: accessible green spaces in highly dense urban regions—a comparison of Berlin and Qingdao. Sustainability 2022, 14(3), 1690. [Google Scholar] [CrossRef]
- Yukhnovskyi, V.; Zibtseva, O. Green space trends in small towns of Kyiv region according to EOS Land Viewer–a case study. Journal of Forest Science 2020, 66(6), 252–263. [Google Scholar] [CrossRef]
- Heo, S.; et al. Do persons with low socioeconomic status have less access to greenspace? Application of accessibility index to urban parks in Seoul, South Korea. Environmental Research Letters 2021, 16(8), 084027. [Google Scholar] [CrossRef]
- Maghrabi, A.; Alyamani, A.; Addas, A. Exploring pattern of green spaces (Gss) and their impact on climatic change mitigation and adaptation strategies: evidence from a saudi arabian city. Forests 2021, 12(5), 629. [Google Scholar] [CrossRef]
- Kuklina, V.; Sizov, O.; Fedorov, R. Green spaces as an indicator of urban sustainability in the Arctic cities: Case of Nadym. Polar Science 2021, 29, 100672. [Google Scholar] [CrossRef]
- Taubenböck, H.; et al. Which city is the greenest? A multi-dimensional deconstruction of city rankings. Computers, Environment and Urban Systems 2021, 89, 101687. [Google Scholar] [CrossRef]
- Verma, P.; et al. Green space indicators in a social-ecological system: A case study of Varanasi, India. Sustainable Cities and Society 2020, 60, 102261. [Google Scholar] [CrossRef]
- Rahman, M.M.; Rahman, M.M.; Momotaz, M. Environmental quality evaluation in Dhaka City Corporation–using satellite imagery. Proceedings of the Institution of Civil Engineers-Urban Design and Planning 2019, 172(1), 13–25. [Google Scholar] [CrossRef]
- Sun, C.; et al. Spatial pattern of urban green spaces in a long-term compact urbanization process—A case study in China. Ecological indicators 2019, 96, 111–119. [Google Scholar] [CrossRef]
- Wolff, M.; Haase, D. Mediating sustainability and liveability—Turning points of green space supply in European cities. Frontiers in Environmental Science 2019, 7, 61. [Google Scholar] [CrossRef]
- Xu, C.; Haase, D.; Pauleit, S. The impact of different urban dynamics on green space availability: A multiple scenario modeling approach for the region of Munich, Germany. Ecological Indicators 2018, 93, 1–12. [Google Scholar] [CrossRef]
- Morar, T.; et al. Assessing pedestrian accessibility to green space using GIS. Transylvanian Review of Administrative Sciences 2014, 10(42), 116–139. [Google Scholar]
- Senanayake, I.; Welivitiya, W.; Nadeeka, P. Urban green spaces analysis for development planning in Colombo, Sri Lanka, utilizing THEOS satellite imagery–A remote sensing and GIS approach. Urban forestry & urban greening 2013, 12(3), 307–314. [Google Scholar]
- Onder, S.; Polat, A.T.; Korucu, S. The evaluation of existing and proposed active green spaces in Konya Selçuklu District, Turkey. African Journal of Agricultural Research 2011, 6(3), 738–747. [Google Scholar]
- Li, B.; et al. Application of High-Spatial-Resolution Imagery and Deep Learning Algorithms to Spatial Allocation of Urban Parks' Supply and Demand in Beijing, China 2024. Land (2012), 2024. 13(7).
- Mohammed, S.S.; Hammo, Y.H. Evaluate of Green space (Parks) in Duhok city by use Image satellite, Google earth, GIS,(NDVI), and Field survey Techniques. Kufa Journal for Agricultural Sciences 2023, 15(1), 73–92. [Google Scholar]
- Deliry, S.I.; Uyguçgil, H. Accessibility assessment of urban public services using GIS-based network analysis: A case study in Eskişehir, Türkiye. GeoJournal 2023, 88(5), 4805–4825. [Google Scholar] [CrossRef]
- Haase, D.; Wolff, M. Enabling ecosystem services at the neighborhood scale while allowing for urban regrowth: the case of Halle, Germany. Ecology and Society 2022, 27(1). [Google Scholar] [CrossRef]
- Mushkani, R.A.; Ono, H. Spatial equity of public parks: a case study of Kabul city, Afghanistan. Sustainability 2021, 13(3), 1516. [Google Scholar] [CrossRef]
- Luo, T.; et al. Equity evaluation of urban park system: a case study of Xiamen, China. Journal of Environmental Engineering and Landscape Management 2020, 28(3), 125–136. [Google Scholar] [CrossRef]
- Li, L.; Pussella, P. Is Colombo city, Sri Lanka secured for urban green space standards? Applied Ecology & Environmental Research 2017, 15(3). [Google Scholar]
- Kabisch, N.; et al. Urban green space availability in European cities. Ecological indicators 2016, 70, 586–596. [Google Scholar] [CrossRef]
- Pristeri, G.; et al. Whose urban green? mapping and classifying public and private green spaces in Padua for spatial planning policies. ISPRS International Journal of Geo-Information 2021, 10(8), 538. [Google Scholar] [CrossRef]
- Riad, P.; et al. Landscape transformation processes in two large and two small cities in Egypt and Jordan over the last five decades using remote sensing data. Landscape and Urban Planning 2020, 197, 103766. [Google Scholar] [CrossRef]
- Li, F.; et al. Does economic development improve urban greening? Evidence from 289 cities in China using spatial regression models. Environmental monitoring and assessment 2018, 190(9), 541. [Google Scholar] [CrossRef] [PubMed]
- Tan, P.Y.; Wang, J.; Sia, A. Perspectives on five decades of the urban greening of Singapore. Cities 2013, 32, 24–32. [Google Scholar] [CrossRef]
- Yu, S.; et al. Equitable evaluation of supply-demand and layout optimization of urban park green space in high-density linear large city. Plos one 2024, 19(9), e0310015. [Google Scholar] [CrossRef]
- Wang, X.; et al. Evaluation of fairness of urban park green space based on an improved supply model of green space: a case study of Beijing central city. Remote Sensing 2022, 15(1), 244. [Google Scholar] [CrossRef]
- Laan, C.M.; Piersma, N. Accessibility of green areas for local residents. Environmental and Sustainability Indicators 2021, 10, 100114. [Google Scholar] [CrossRef]
- Ramos-González, O.M. The green areas of san juan, Puerto Rico. Ecology and society 2014, 19(3). [Google Scholar] [CrossRef]
- Liu, M.; et al. Evaluation and monitoring of urban public greenspace planning using landscape metrics in Kunming. Sustainability 2021, 13(7), 3704. [Google Scholar] [CrossRef]
- Wu, H.; et al. Evaluation and planning of urban green space distribution based on mobile phone data and two-step floating catchment area method. Sustainability 2018, 10(1), 214. [Google Scholar] [CrossRef]
- Krzywnicka, I.; Jankowska, P. The accessibility of public urban green space. A case study of Białystok city. Acta Scientiarum Polonorum Administratio Locorum 2021, 20(3), 203–214. [Google Scholar] [CrossRef]
- Rahman, K.A.; Zhang, D. Analyzing the level of accessibility of public urban green spaces to different socially vulnerable groups of people. Sustainability 2018, 10(11), 3917. [Google Scholar] [CrossRef]
- Gelan, E.; Girma, Y. Urban green infrastructure accessibility for the achievement of SDG 11 in rapidly urbanizing cities of Ethiopia. GeoJournal 2021, 1–20. [Google Scholar] [CrossRef]
- Paul, S.; Bardhan, S. Overview: framework for quantitative assessment of Urban-Blue-and-Green-spaces in a high-density megacity. International Review for Spatial Planning and Sustainable Development 2022, 10(3), 280–301. [Google Scholar] [CrossRef] [PubMed]
- Yu, X.; et al. An evaluation system for sustainable urban space development based in green urbanism principles—A case study based on the Qin-Ba mountain area in China. Sustainability 2020, 12(14), 5703. [Google Scholar] [CrossRef]
- Shoari, N.; et al. Accessibility and allocation of public parks and gardens in England and Wales: A COVID-19 social distancing perspective. PloS one 2020, 15(10), e0241102. [Google Scholar] [CrossRef] [PubMed]
- Wen, C.; Albert, C.; Von Haaren, C. Equality in access to urban green spaces: A case study in Hannover, Germany, with a focus on the elderly population. Urban Forestry & Urban Greening 2020, 55, 126820. [Google Scholar] [CrossRef]
- Orsi, F. How densely populated and green are the places we live in? A study of the ten largest US cities. Land Use Policy 2018, 76, 300–316. [Google Scholar] [CrossRef]
- Arshad, H.S.H.; Routray, J.K. From socioeconomic disparity to environmental injustice: The relationship between housing unit density and community green space in a medium city in Pakistan. Local Environment 2018, 23(5), 536–548. [Google Scholar] [CrossRef]
- Kumar, S.; Rajak, F. Informal green space contribution to city’s recreational green open space need of a densely populated old city: A case of Patna, India. GeoJournal 2024, 89(4), p. 128. [Google Scholar] [CrossRef]
- Pham, T.-T.-H.; Labbé, D. Spatial logic and the distribution of open and green public spaces in Hanoi: Planning in a dense and rapidly changing city. Urban Policy and Research 2018, 36(2), 168–185. [Google Scholar] [CrossRef]
- Nero, B. Urban green space dynamics and distributional equity in Kumasi, Ghana. In Living Planet Symposium; 2016. [Google Scholar]
- Lusseau, D.; Baillie, R. Disparities in greenspace access during COVID-19 mobility restrictions. Environmental Research 2023, 225, 115551. [Google Scholar] [CrossRef] [PubMed]
- bin Nor Azhar, A.S.; Hussain, M.R.b.M.; Tukiman, I. The Sustainability of Urban Green Space during Pandemic Crises. In IOP Conference Series: Earth and Environmental Science; IOP Publishing, 2023. [Google Scholar]
- Scharp, K.M. Thematic co-occurrence analysis: Advancing a theory and qualitative method to illuminate ambivalent experiences. Journal of Communication 2021, 71(4), 545–571. [Google Scholar] [CrossRef]
- Sedighi, M. Application of word co-occurrence analysis method in mapping of the scientific fields (case study: the field of Informetrics). Library review 2016, 65(1/2), 52–64. [Google Scholar] [CrossRef]
- Wang, Z.; Yan, G.; Wang, S. Fairness evaluation of landscape justice in urban park green space: a case study of the Daxing Part of Yizhuang New Town, Beijing. Sustainability 2022, 15(1), 370. [Google Scholar] [CrossRef]
- Yukhnovskyi, V.Y.; Zibtseva, O.V.; Debryniuk, I.M. Evaluation of green space systems in small towns of Kyiv region. Bulletin of Geography. Socio-economic Series 2021, 53, 7–16. [Google Scholar] [CrossRef]
- Wei, L.; et al. Global urban green spaces in the functional urban areas: Spatial pattern, drivers and size hierarchy. Urban Forestry & Urban Greening 2025, 107, 128770. [Google Scholar] [CrossRef]
- Dong, X.; et al. Effectiveness Trade-Off Between Green Spaces and Built-Up Land: Evaluating Trade-Off Efficiency and Its Drivers in an Expanding City. Remote Sensing 2025, 17(2), 212. [Google Scholar] [CrossRef]
- Rahmati, L.; Hanaei, T. Comparative analysis of key factors influencing urban green space in Mashhad, Iran (1988–2018). Environmental Systems Research 2024, 13(1), 13. [Google Scholar] [CrossRef]
- Zhou, H.; Liu, Y.; He, M. The spatial interaction effect of green spaces on urban economic growth: Empirical evidence from China. International Journal of Environmental Research and Public Health 2022, 19(16), 10360. [Google Scholar] [CrossRef]
- Rigolon, A. A complex landscape of inequity in access to urban parks: A literature review. Landscape and urban planning 2016, 153, 160–169. [Google Scholar] [CrossRef]
- Saher, R.; Stephen, H.; Ahmad, S. Role of urban landscapes in changing the irrigation water requirements in arid climate. Geosciences 2022, 13(1), 14. [Google Scholar] [CrossRef]
- Sun, P.; Song, Y.; Lu, W. Effect of urban green space in the hilly environment on physical activity and health outcomes: mediation analysis on multiple greenery measures. Land 2022, 11(5), 612. [Google Scholar] [CrossRef]
- Lee, D.H.; Chamberlain, B.; Park, H.Y. Toward a Construct-Based Definition of Urban Green Space: A Literature Review of the Spatial Dimensions of Measurement, Methods, and Exposure. Land 2025, 14(3), 517. [Google Scholar] [CrossRef]
Figure 1.
PRISMA flow diagram illustrates the UGSPC eligibility process.
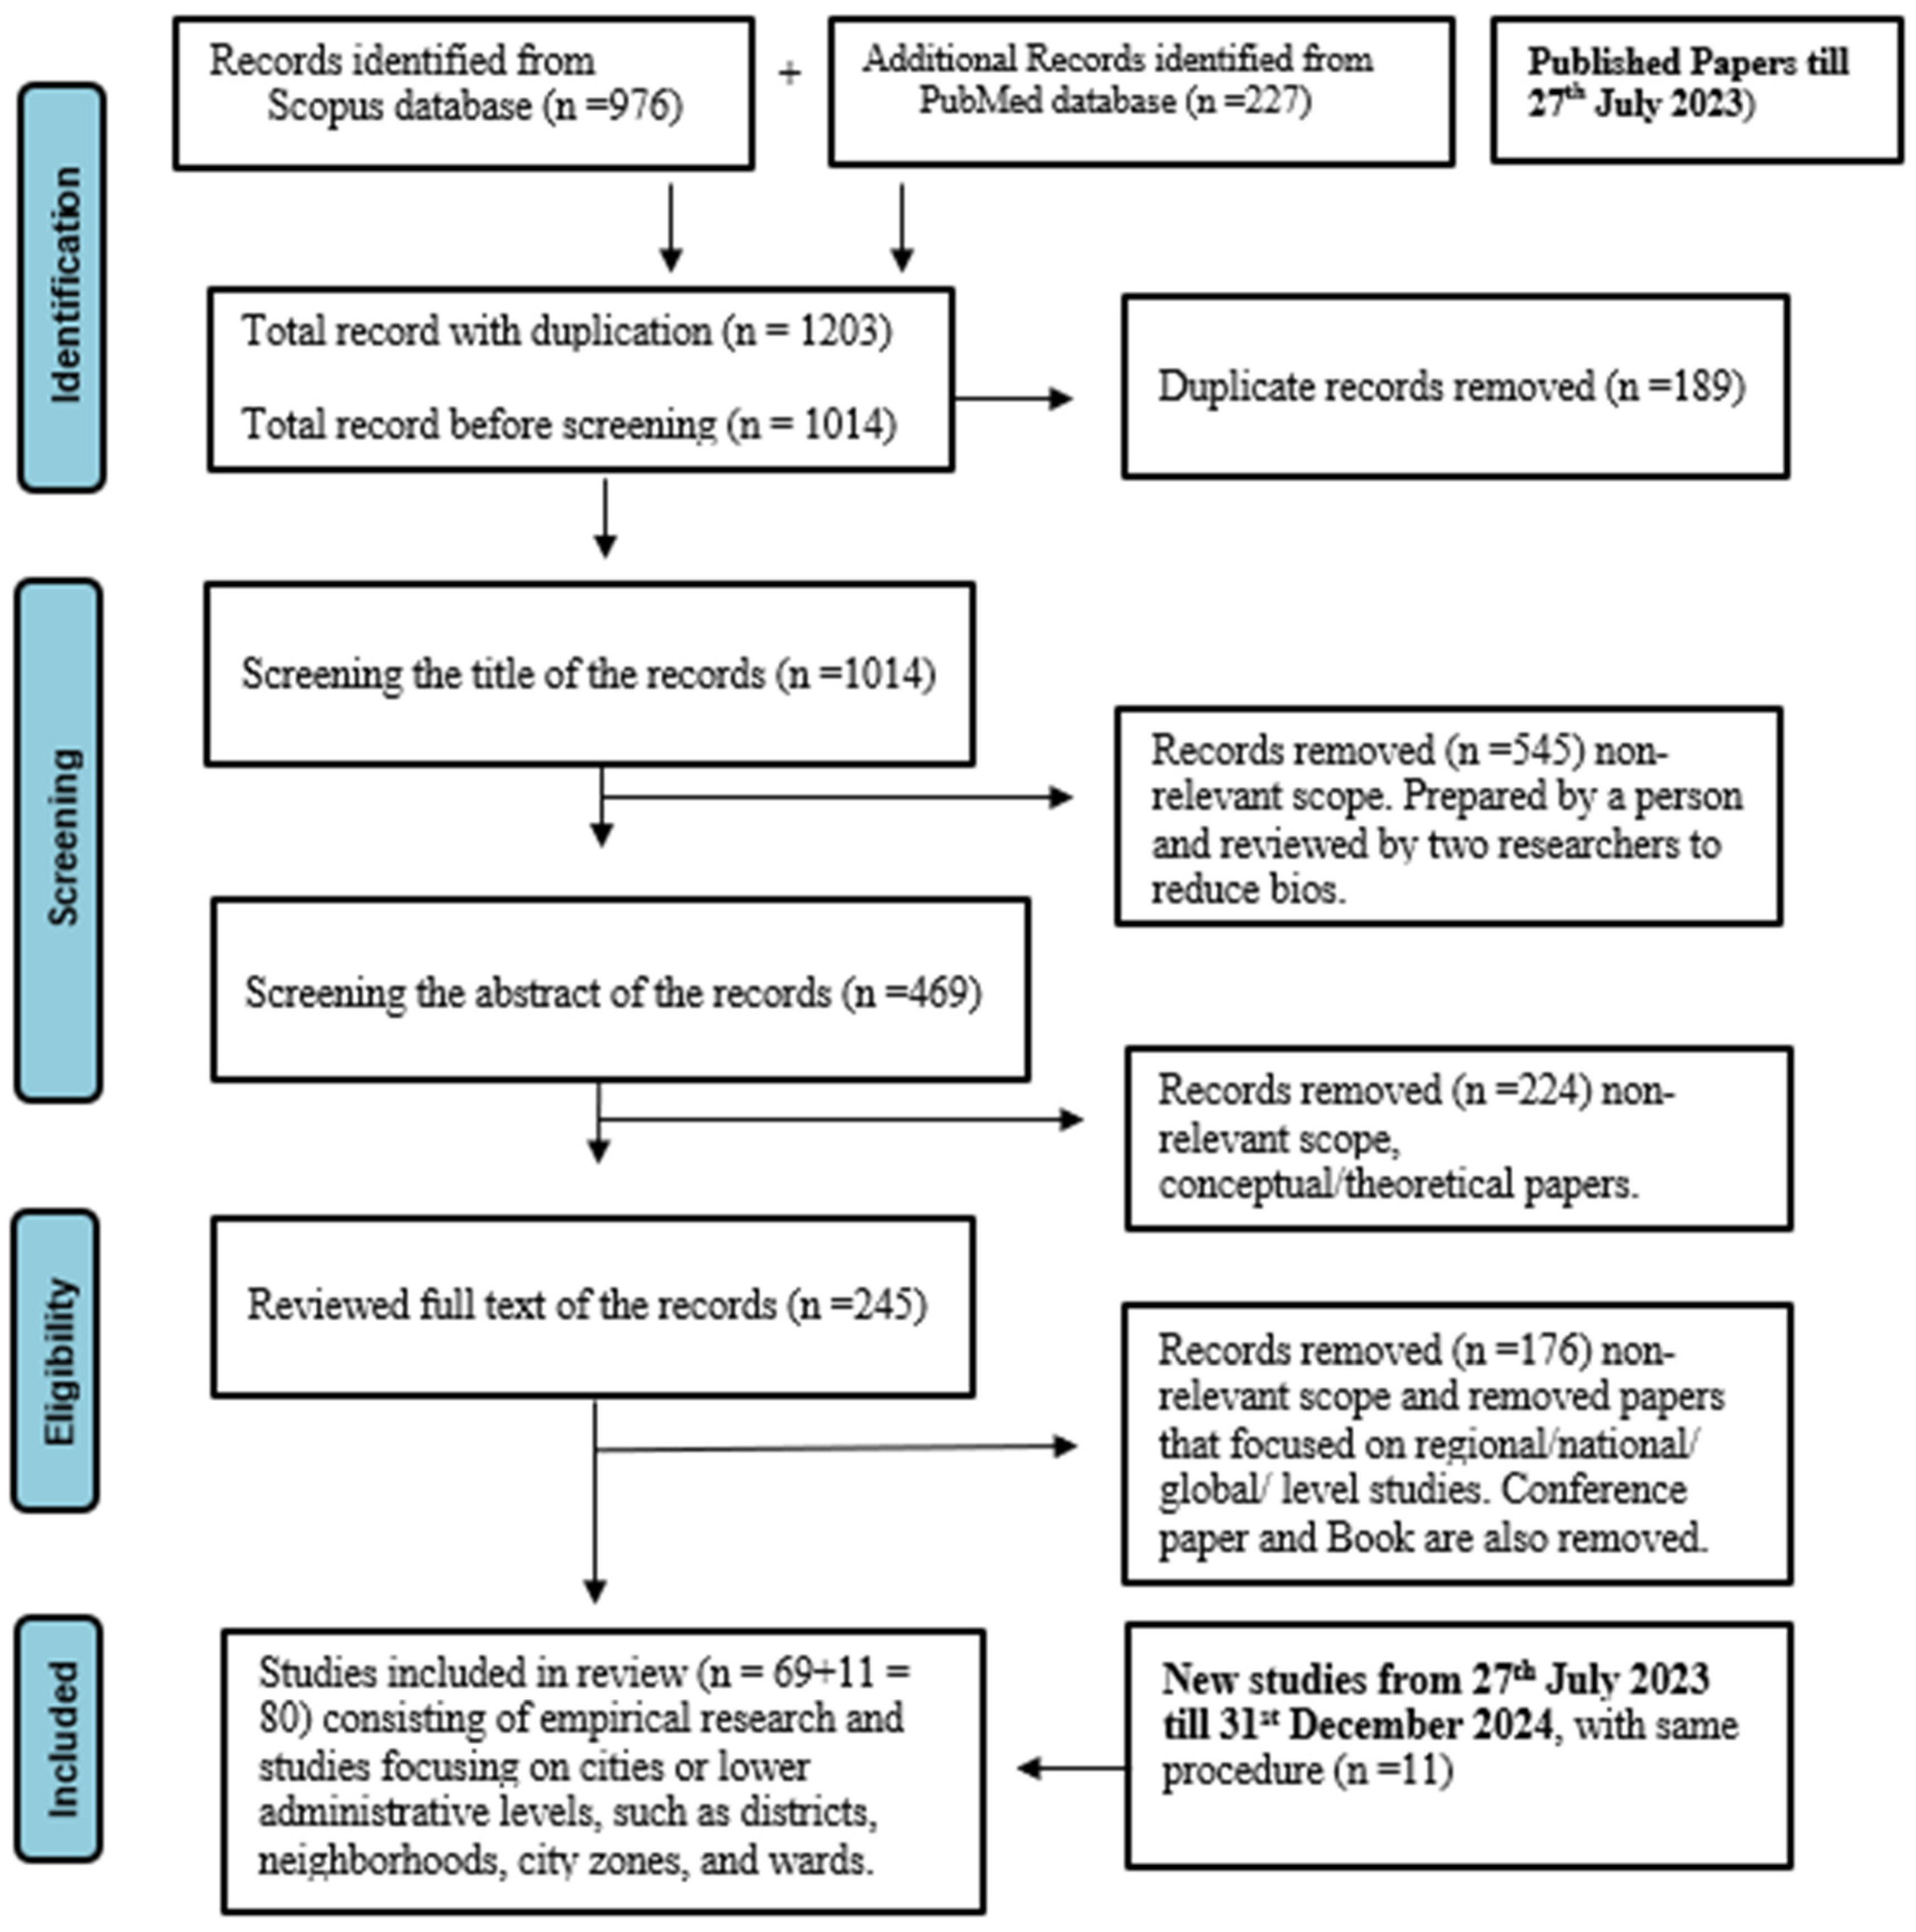
Figure 2.
Distribution of Case Studies in Developed and Developing Countries.

Figure 3.
Overview of Journals and Disciplinary Coverage in the Reviewed Studies.
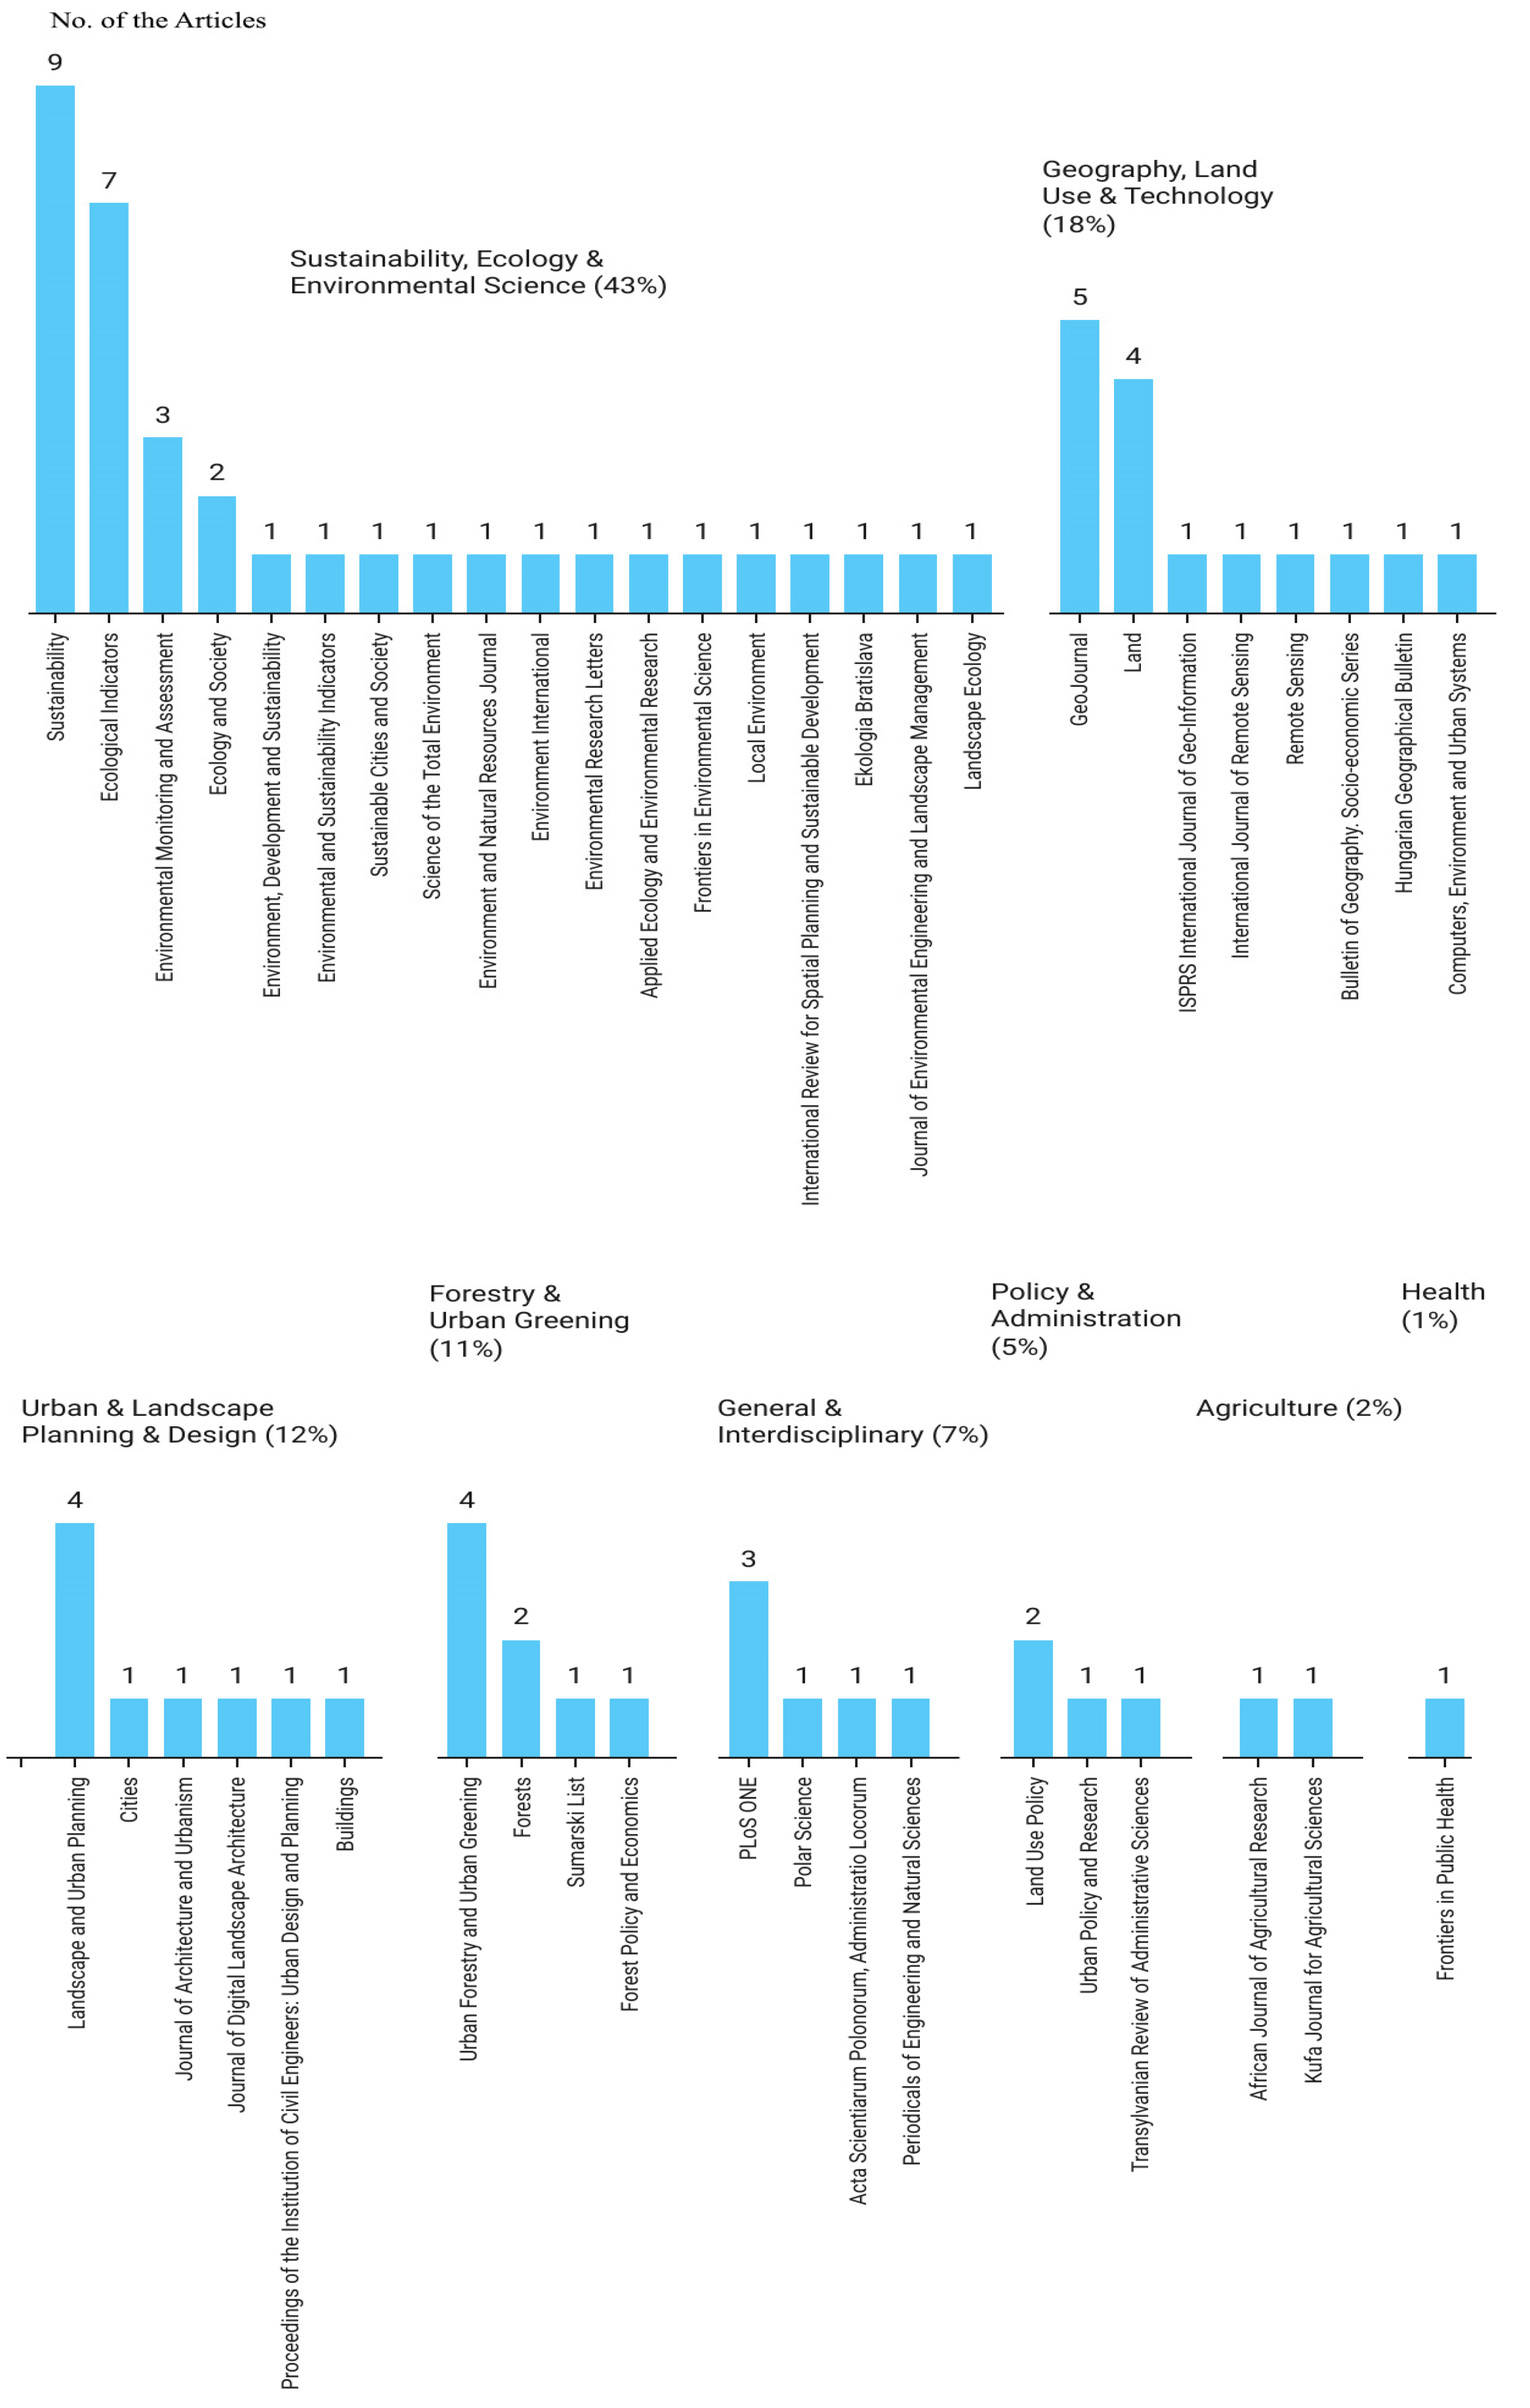
Figure 4.
Frequency of Sources Used for UGS and Population Data.
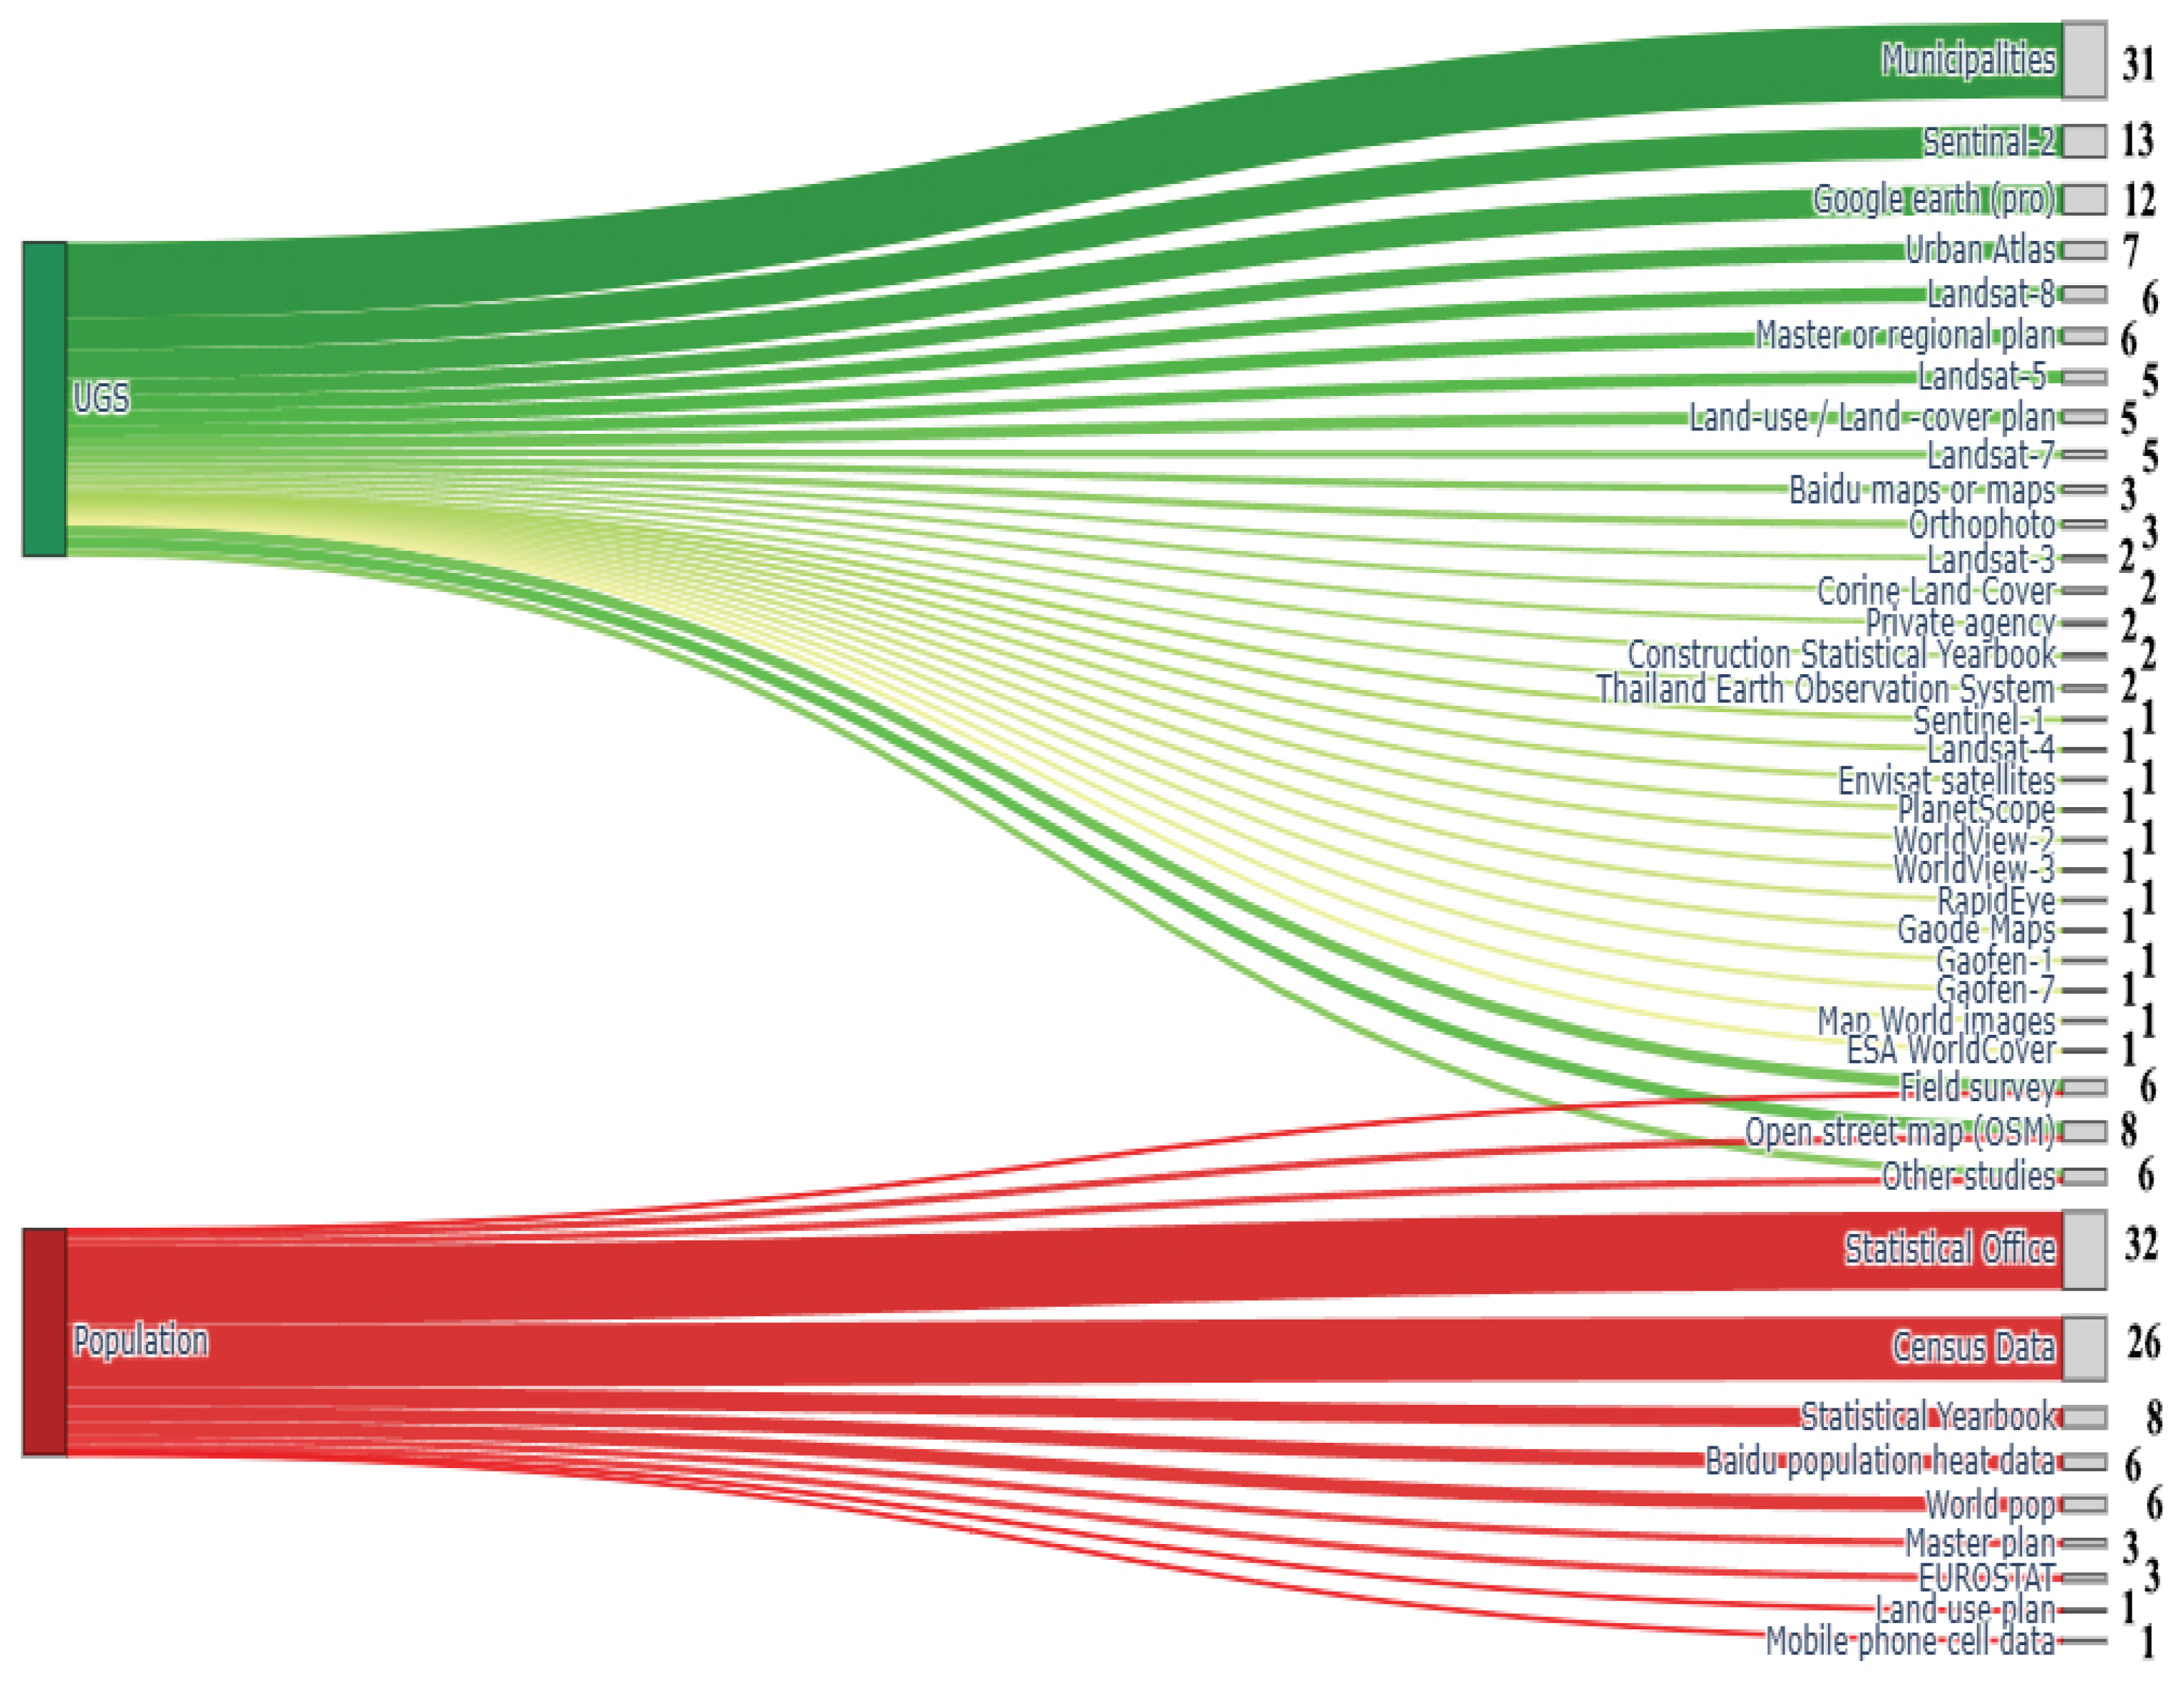
Figure 5.
Existing UGSPC in Cities of Developed Countries Compared with WHO Standards, Blue Points are the Value of UGSPC, Red Lines Represent the WHO Minimum and Ideal Level of UGSPC, Source: Created by the Authors Using Datawrapper Online Tool.
Figure 5.
Existing UGSPC in Cities of Developed Countries Compared with WHO Standards, Blue Points are the Value of UGSPC, Red Lines Represent the WHO Minimum and Ideal Level of UGSPC, Source: Created by the Authors Using Datawrapper Online Tool.

Figure 6.
Existing UGSPC in Cities of Developing Countries Compared with WHO Standards, Blue Points are the Value of UGSPC, Red Lines Represent the WHO Minimum and Ideal Level of UGSPC.
Figure 6.
Existing UGSPC in Cities of Developing Countries Compared with WHO Standards, Blue Points are the Value of UGSPC, Red Lines Represent the WHO Minimum and Ideal Level of UGSPC.
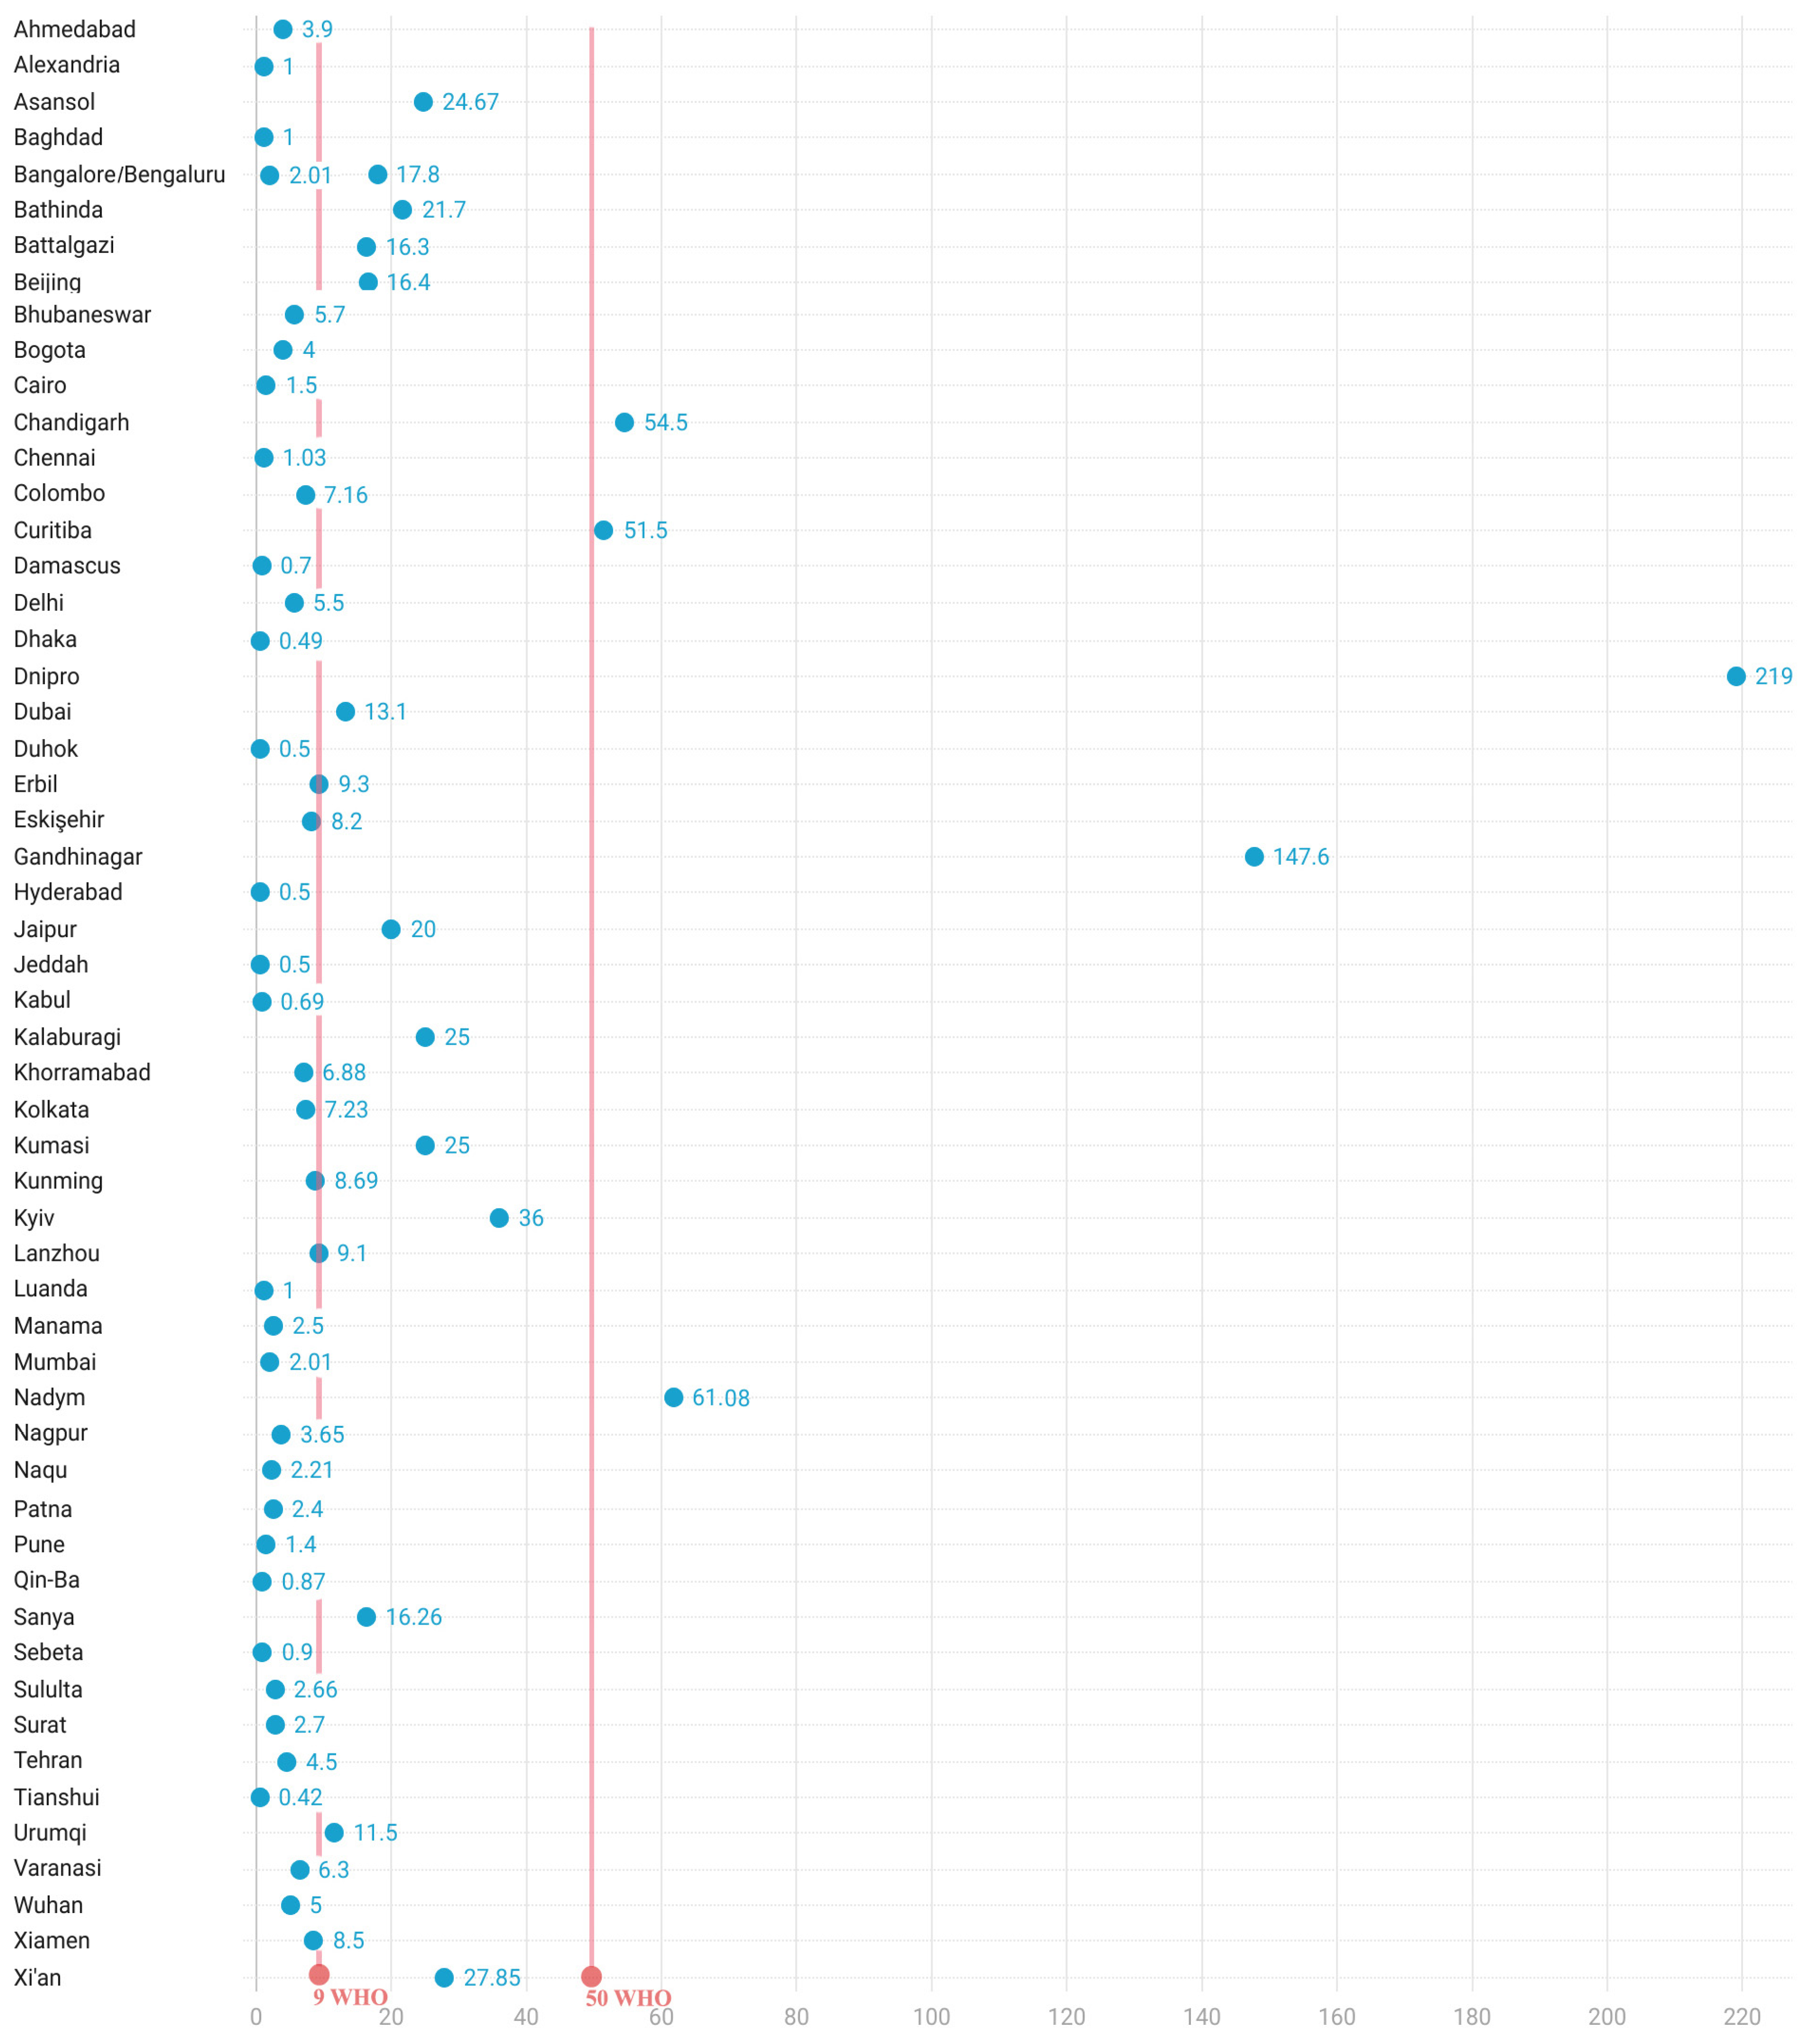
Figure 7.
Publication Trend in UGSPC During the Past 15 Years, Source: Created by the Authors.
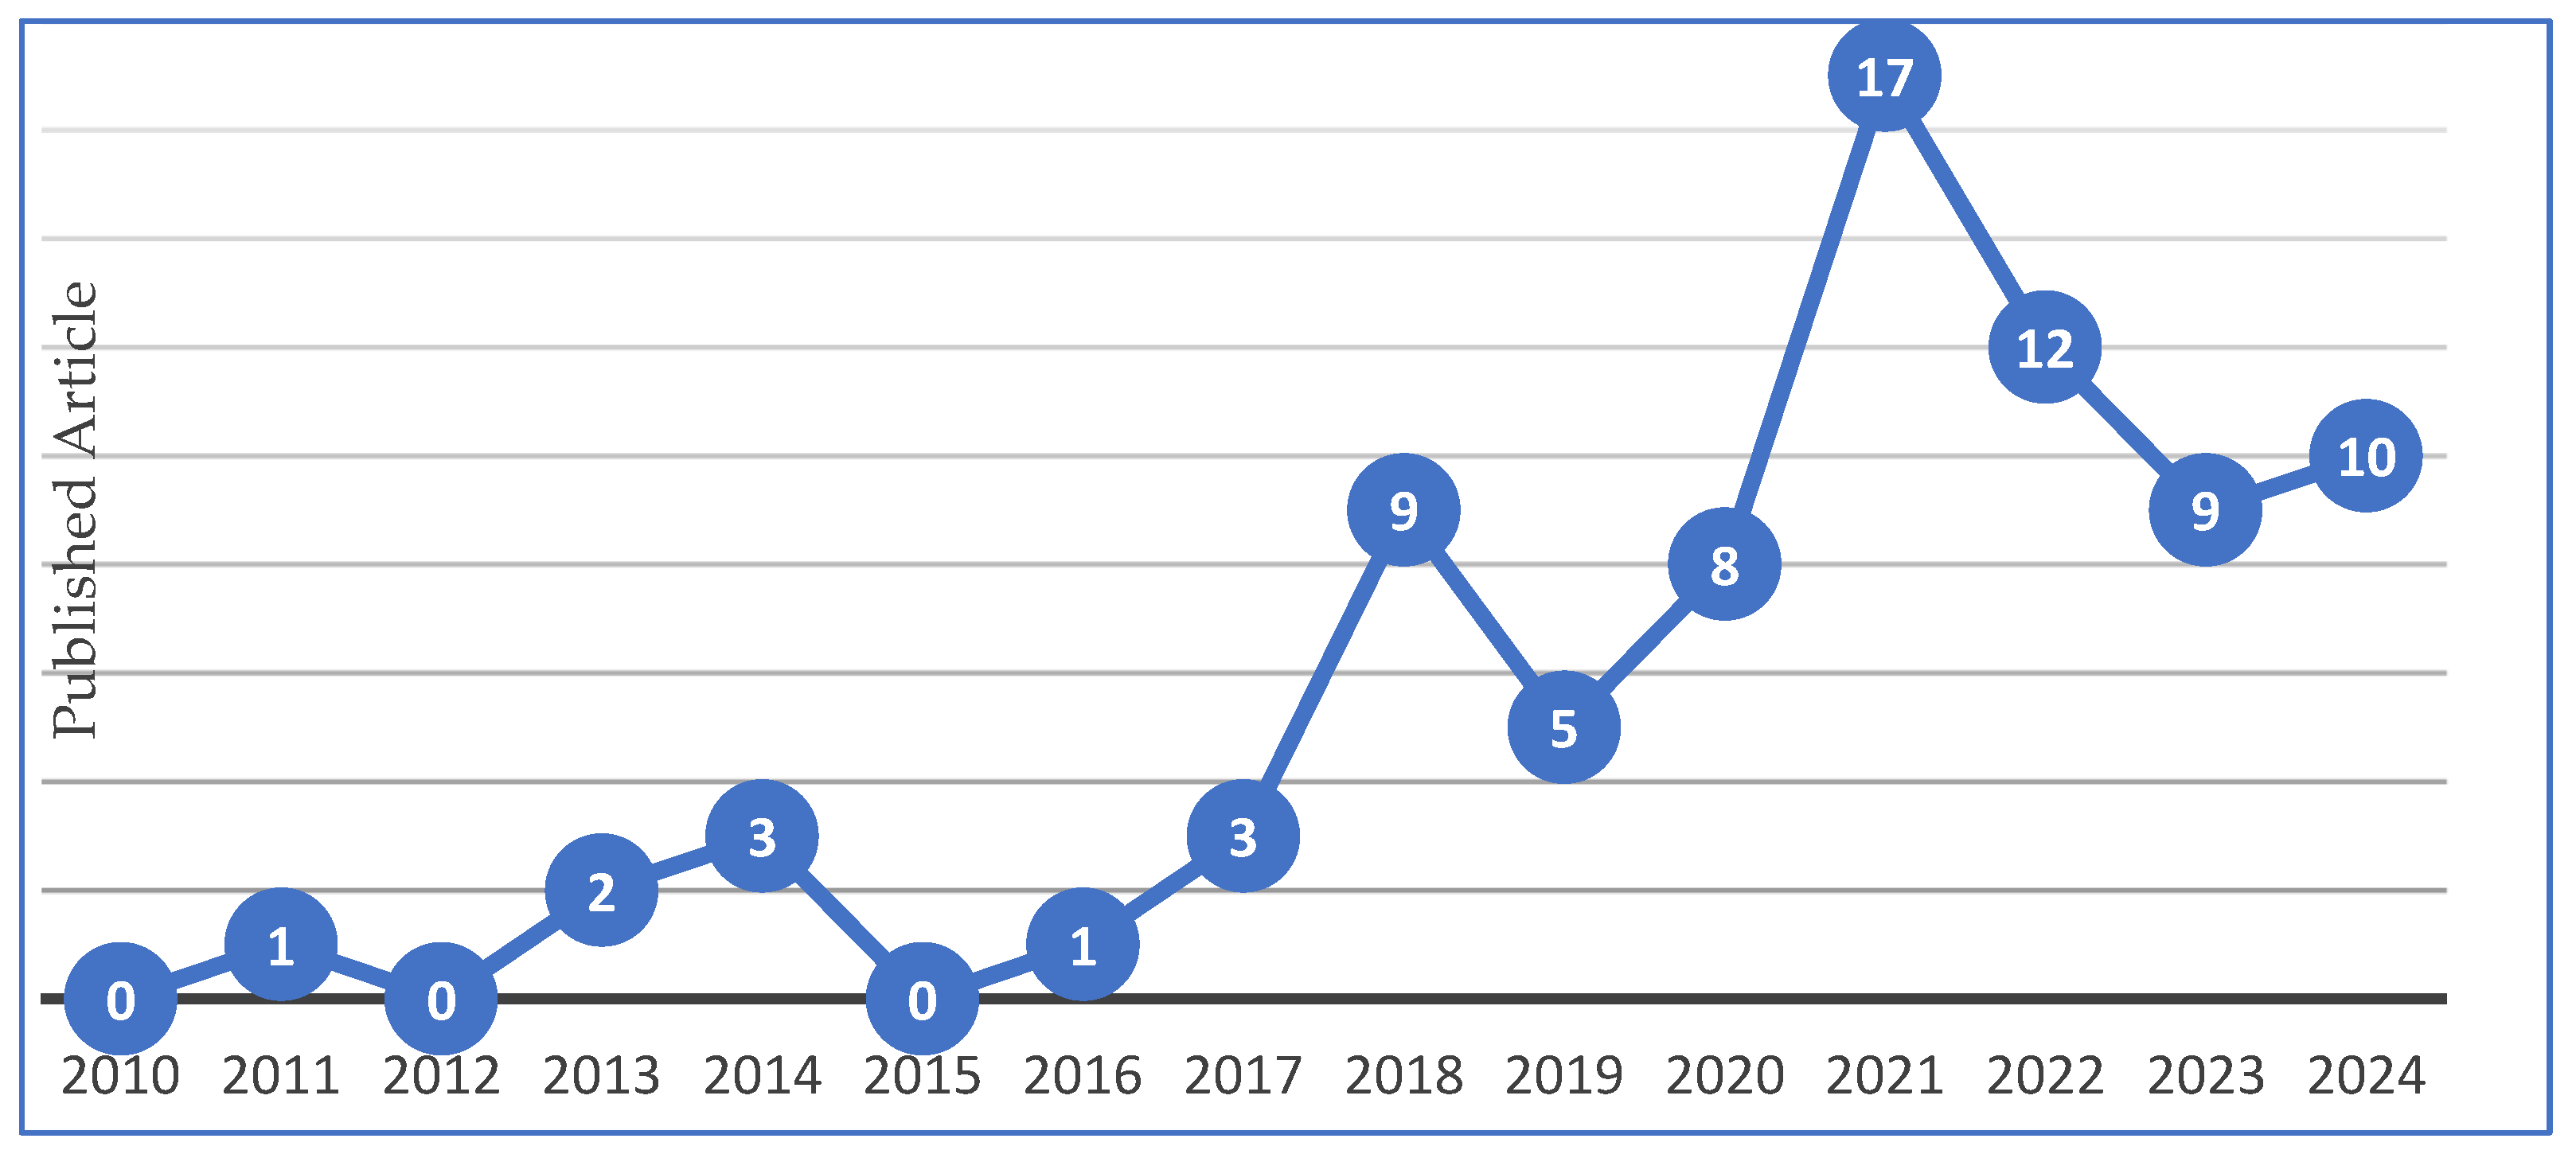
Figure 8.
Co-occurrence of Authors Keywords, Source: Created by the Authors Using VOSviewer Tool.
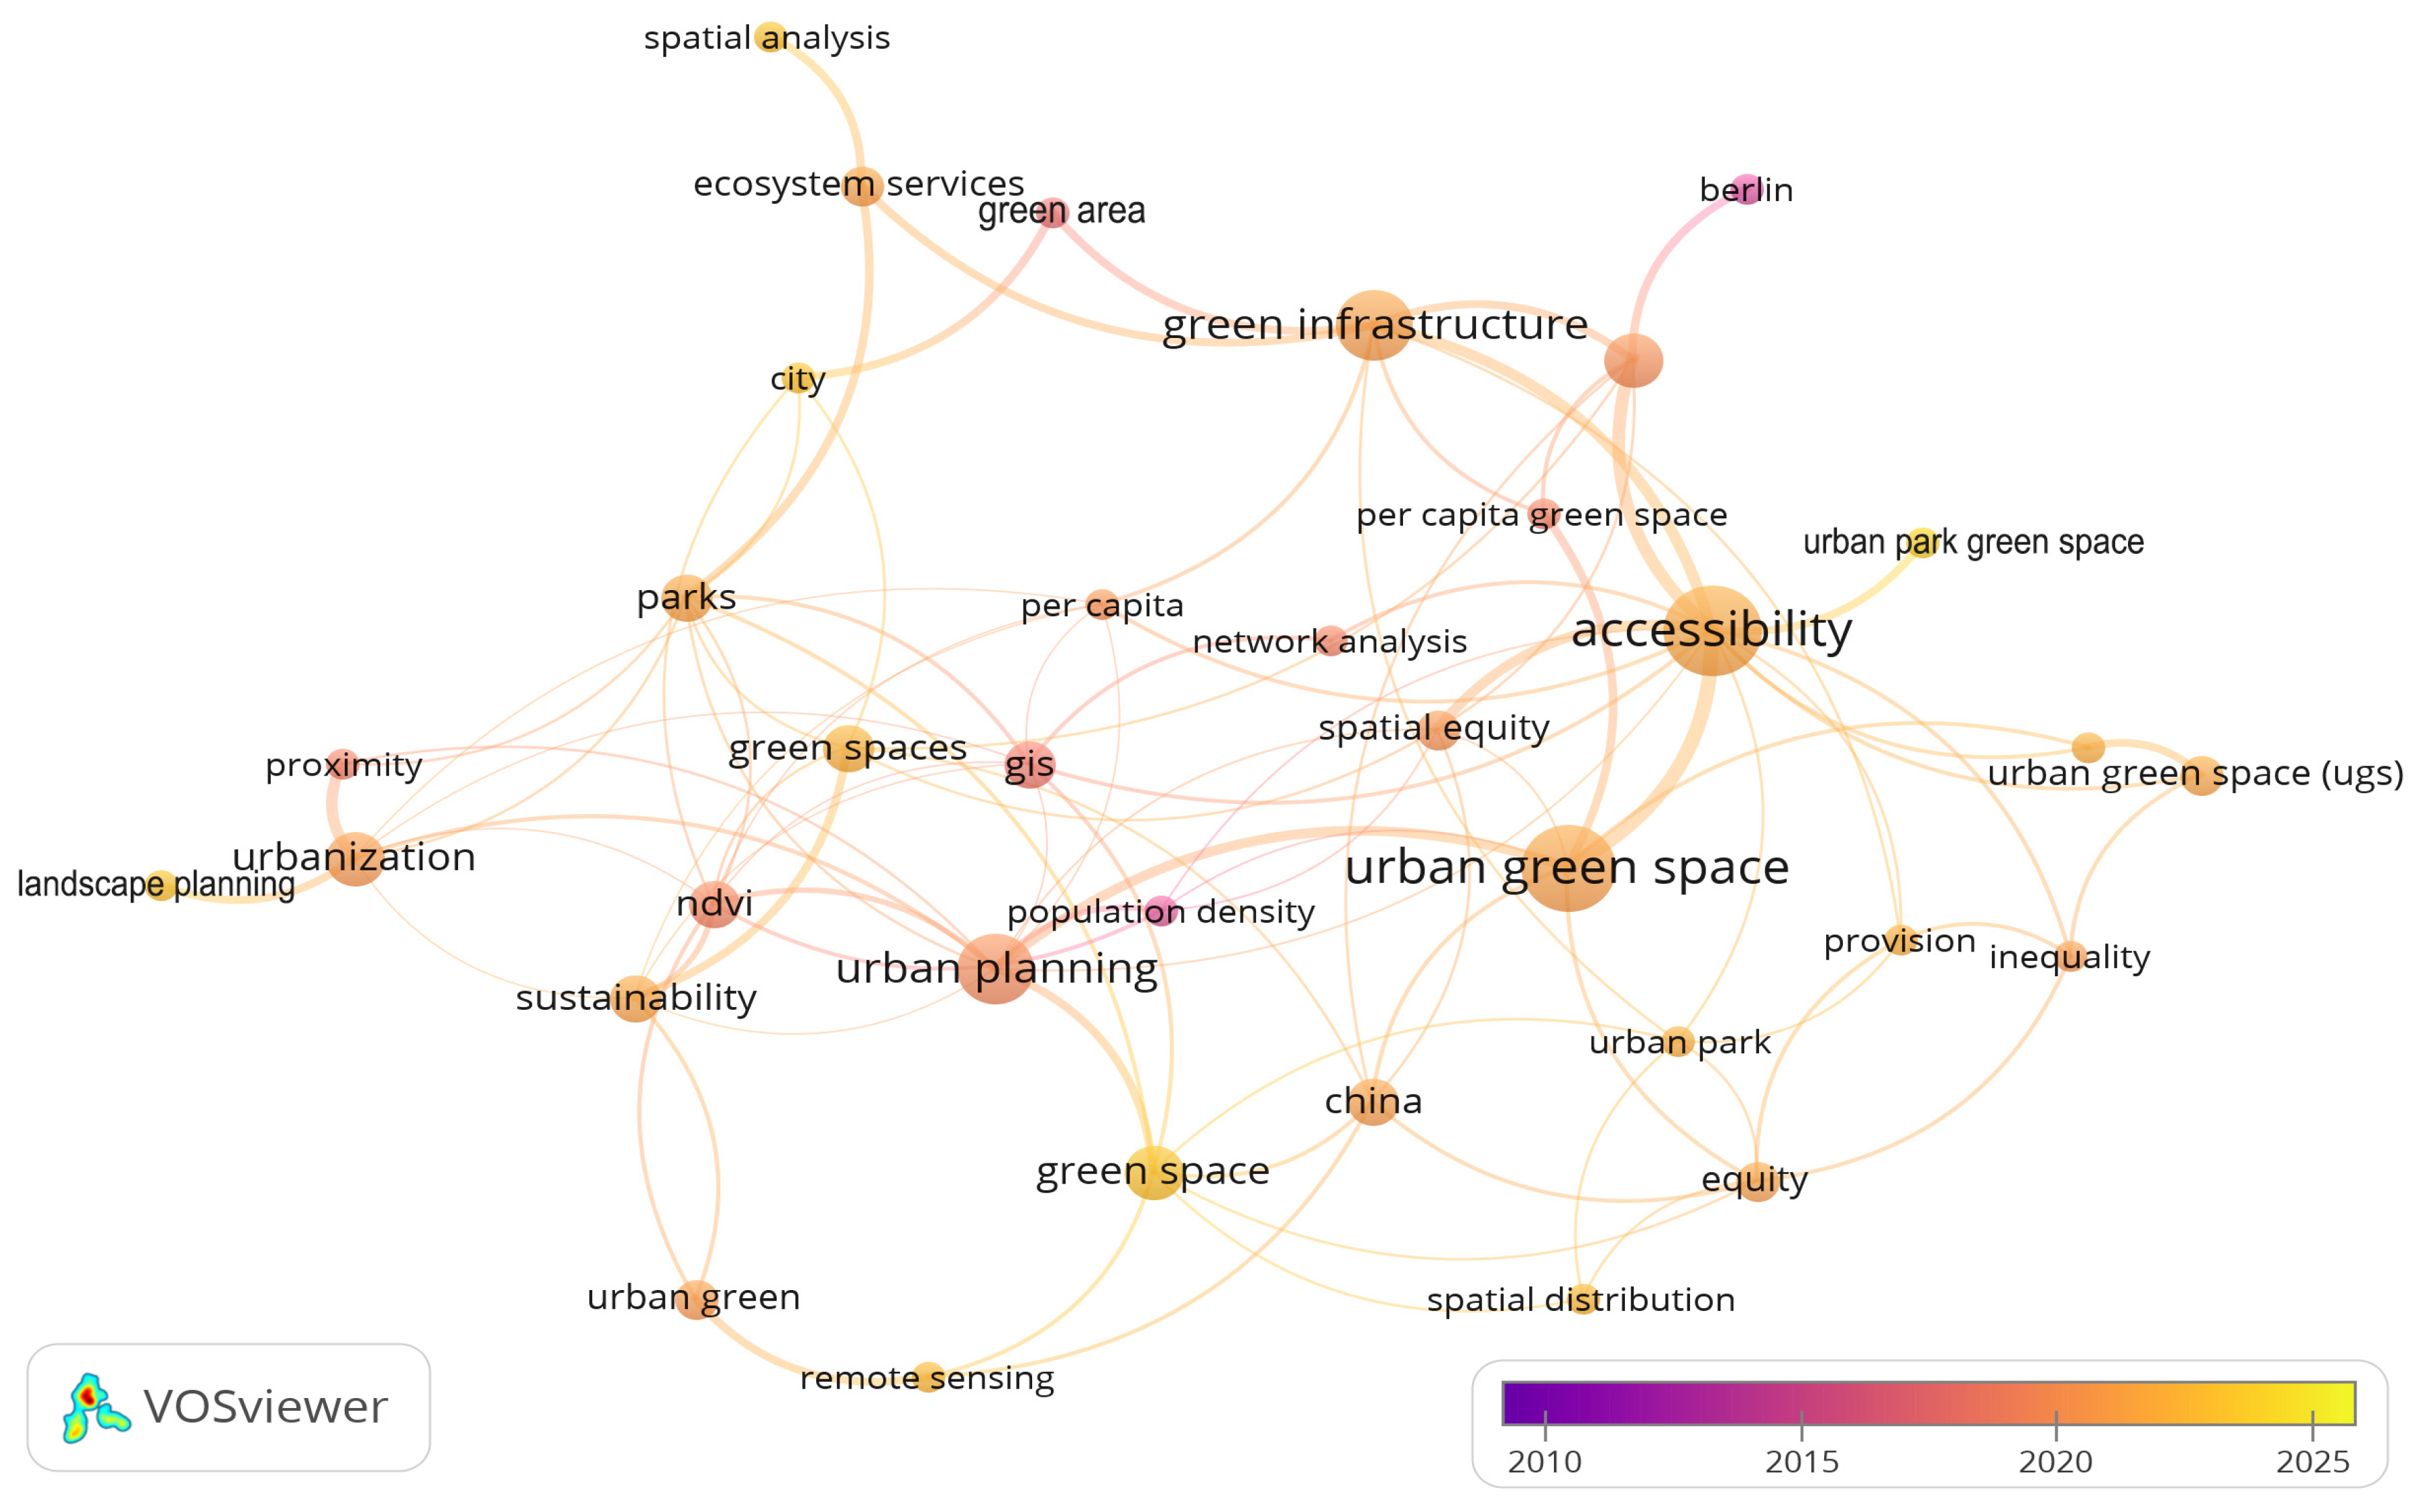
Figure 9.
Temporal variation of UGSPC values, green colors represent growth, red colors represent a decline.
Figure 9.
Temporal variation of UGSPC values, green colors represent growth, red colors represent a decline.
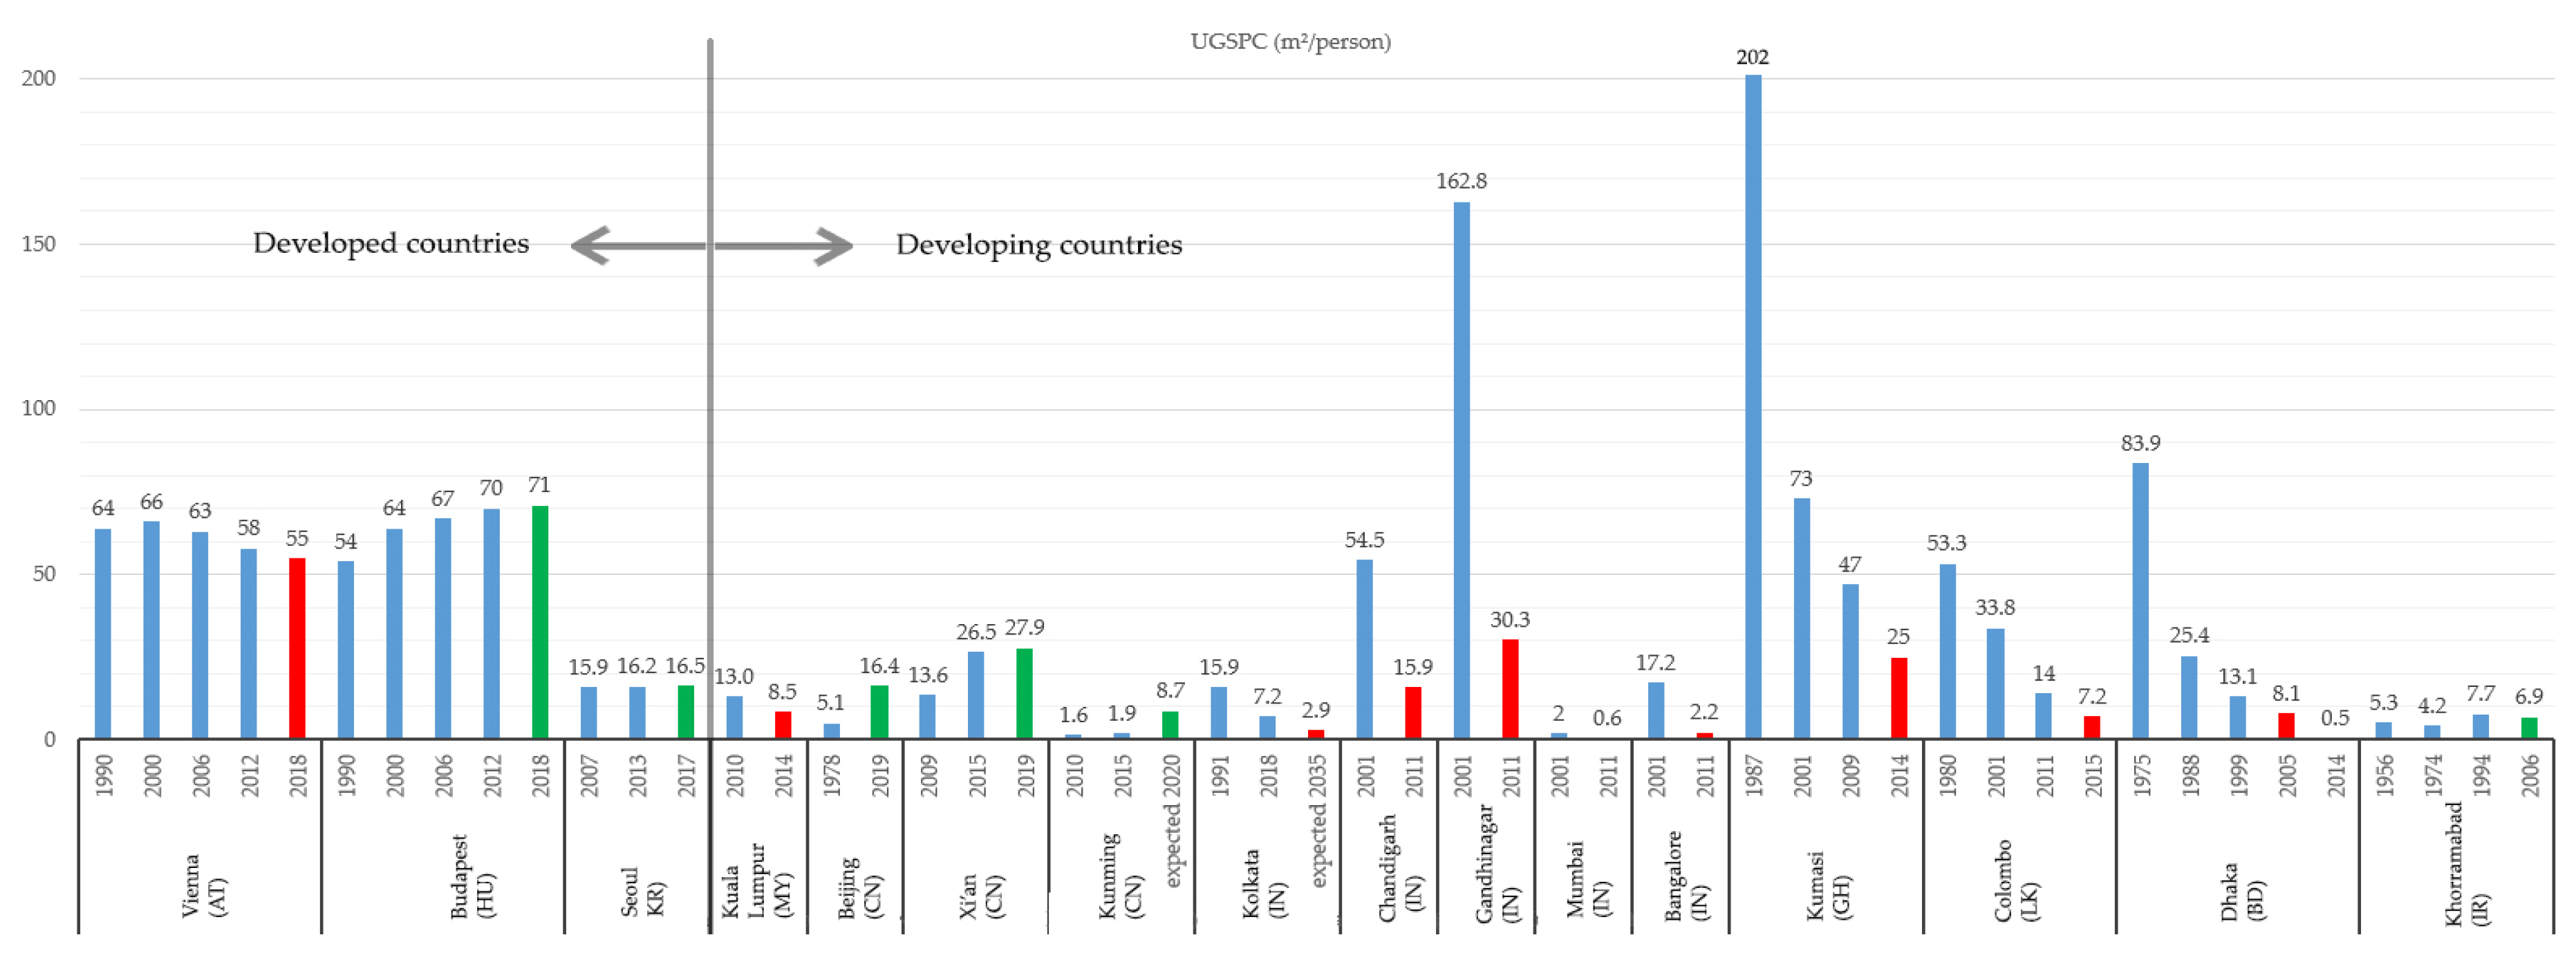

Table 1.
Published Review Papers Related to the Use of UGS Measurements.
| No. | Review Title | Main Focus | UGS measurement | Classification |
| 1 | Determinants influencing the accessibility and use of urban green spaces: A review of empirical evidence [40] | Urban planning | Accessibility, Proximity, Socioeconomic factors | Spatial / Quantitative |
| 2 | The effects of neighbourhood green spaces on mental health of disadvantaged groups: a systematic review [41] | Mental health | Exposure, Availability, Equity of access | Spatial / Functional |
| 3 | A Systematic Review of the Impact of Changes to Urban Green Spaces on Health and Education Outcomes, and a Critique of Their Applicability to Inform Economic Evaluation [42] | Physical and mental health, Educational results | Change in UGS (extent and quality) | Temporal / Quantitative |
| 4 | Urban heatwave, green spaces, and mental health: A review based on environmental health risk assessment framework [43] | Mental health | Vegetation cover, Cooling capacity, Heat mitigation | Quantitative / Functional |
| 5 | Exploring the restorative capacity of urban green spaces and their biodiversity through an adapted One Health approach: A scoping review [44] | Psychological restoration | Biodiversity, Restorative potential | Functional / Qualitative |
| 6 | Multiple Roles of Green Space in the Resilience, Sustainability and Equity of Aotearoa New Zealand’s Cities [39] | Equity, Sustainability. |
UGS per capita, Resilience, Equity | Quantitative / Functional |
| 7 | Health Effects of Participation in Creating Urban Green Spaces—A Systematic Review [45] | Health | Participation, Engagement, Co-creation | Qualitative / Functional |
| 8 | Green space in health research: An overview of common indicators of greenness [46] | Health | NDVI, Land cover, Proximity | Quantitative / Spatial |
| 9 | A Review of the Effects of Urban and Green Space Forms on the Carbon Budget Using a Landscape Sustainability Framework [47] | Sustainability (Carbon storage) |
Vegetation type, Area, Spatial configuration | Spatial / Quantitative |
| 10 | A systematic review of audit tools for evaluating the quality of green spaces in mental health research [48] | Mental health | Quality (design and maintenance) | Qualitative / Functional |
Table 2.
Screening Criteria Applied by Two Researchers for Classification.
| Response Combination | No | Yes | % |
| exclude + exclude | 0 | 18.6 | |
| exclude + maybe | 1 | 35.0 | |
| include + exclude or maybe + maybe | 2 | 18.7 | |
| include + maybe | 3 | 16.2 | |
| include + include | 4 | 11.4 |
Table 3.
Terms Used to Describe Greenery in Urban Areas.
| Terminology | Frequency of Occurrence | Sources |
| Urban green space(s) | 32 | [26,33,49,50,51,52,53,54,55,56,57,58,59,60,61,62,63,64,65,66,67,68,69,70,71,72,73,74,75,76,77,78] |
| Green space(s) | 16 | [79,80,81,82,83,84,85,86,87,88,89,90,91,92,93,94] |
| Urban park | 10 | [34,37,95,96,97,98,99,100,101,102] |
| Urban green(ing) | 04 | [103,104,105,106] |
| Urban park green space | 03 | [107,108] |
| Green area | 02 | [109,110] |
| Urban public greenspace | 02 | [111,112] |
| Public urban green space(s) | 02 | [113,114] |
| Urban green infrastructure | 01 | [115] |
| Urban-blue-and-green-spaces (UBGS) | 01 | [116] |
| Green land area | 01 | [117] |
| Public parks and gardens | 01 | [118] |
| Green and blue infrastructure | 01 | [119] |
| Park areas and greenery | 01 | [120] |
| Community green space | 01 | [121] |
| Urban green open space | 01 | [122] |
| Open and green public space(s) | 01 | [123] |
Table 4.
Multi-dimensional Evaluation of UGS Assessment Beyond Per Capita Metrics .
| Sources | Year | UGS analysis |
| [50] | 2024 | UGS Index, Landscape Metrics and Pattern (Composition and Configuration) |
| [49] | 2024 | Inequality, Social Equity, Green Supply |
| [95] | 2024 | Parkland Distribution Pattern, Accessibility |
| [107] | 2024 | UPGS Accessibility, Social Equity, Supply-Demand Matching, Optimization |
| [33] | 2024 | Accessibility, Proximity, UGS Typologies |
| [51] | 2024 | UGS Quantity and Scale, UGS Spatial Patterns, Accessibility, Equity |
| [52] | 2024 | UGS Identification (Vegetation Index) Spatio-temporal Change, Accuracy Assessment |
| [122] | 2024 | Accessibility, Catchment Area, Informal Green Open Spaces Typologies, Quality analysis |
| [79] | 2024 | Urban Resilience, Regeneration Prioritization |
| [53] | 2024 | Green Space Classification, Pattern, UGS Index, Accessibility, Proximity |
| [96] | 2023 | Quantitative Measurement, Pattern Analysis (Remote Sensing Indices) |
| [108] | 2023 | Fairness and Equity Assessment, Accessibility, Supply and Demand, Optimization Modeling, UGS Quality |
| [54] | 2023 | Quantitative Measurement, Pattern Analysis (Remote Sensing Indices, Image Classification) |
| [55] | 2023 | Supply and Demand, Optimization Modeling, Cost-Benefit Analysis |
| [129] | 2023 | Accessibility, Fairness and Equity Assessment, Proximity, Pattern Analysis (Spatial Autocorrelation) |
| [56] | 2023 | Quantitative Measurement, Pattern Analysis, Supply and Demand, Optimization Modeling |
| [57] | 2023 | Fairness and Equity Assessment, Quantitative Measurement, Statistical Analysis |
| [97] | 2023 | Accessibility, Proximity, Supply and Demand, Optimization Modeling |
| [80] | 2023 | Accessibility, Pattern Analysis (Clustering, Interpolation) |
| [58] | 2022 | Quantitative Measurement, Pattern Analysis (Remote Sensing Indices, Image Classification) |
| [59] | 2022 | Accessibility, Spatial Pattern, Analysis Suitability Analysis |
| [115] | 2022 | Accessibility (Distance Approach) (Service Area) |
| [26] | 2022 | Accessibility, Proximity, Compound Metric (Accessible UGS per capita) |
| [60] | 2022 | UGS Justice, UGS Quantity (Supply), Accessibility |
| [61] | 2022 | Hierarchical UGS Mapping, Vegetation Detection, UGS Index |
| [116] | 2022 | Urban Blue Green Space Distribution Index, UBGS Availability Index |
| [81] | 2022 | Density Dimensions, Vegetation Identification, Accessible Recreational Green Space |
| [62] | 2022 | Inequality Measurement, ecosystem services |
| [63] | 2022 | Accessibility, and Attractiveness (Quality). |
| [98] | 2022 | Ecosystem Service Provision (Air Cooling), (Hydrological), Carbon Mitigation) |
| [64] | 2022 | Trend in UGS |
| [65] | 2021 | Accessibility |
| [130] | 2021 | Green Infrastructure Provision |
| [109] | 2021 | Accessibility (Minimal Walking Distance) |
| [66] | 2021 | Green Provision, Quality, Urban Green Volume |
| [83] | 2021 | UGS Access Inequality (Socioeconomic Status) |
| [67] | 2021 | Equity, UGS Quantity, Accessibility |
| [99] | 2021 | Place-based Equity (Horizontal Equity), Population-based Equity (Vertical Equity) |
| [68] | 2021 | Equality of Accessing Green Spaces, Access to UGS, Access to Parks (PGS) |
| [69] | 2021 | UGS Quantity and Coverage Environmental Outcome |
| [84] | 2021 | Climatic Mitigation, Ecosystem Benefits |
| [111] | 2021 | Pattern analysis, Configuration, Average Greening Index |
| [70] | 2021 | UGS Change Index |
| [71] | 2021 | Equality, Inequality (Distributional Equity) |
| [85] | 2021 | Vegetation Mapping, Classification, Accuracy Assessment |
| [113] | 2021 | Evaluation, Accessibility |
| [103] | 2021 | UGS Classification (Property and Use) |
| [86] | 2021 | UGS Classification, City Rankings |
| [117] | 2020 | Ecological Space Construction, Infrastructure Perfection (Accessibility) |
| [65] | 2020 | Crowdedness, Spatial Proximity, Catchment Area |
| [104] | 2020 | Landscape Transformation, Change Detection |
| [72] | 2020 | Accessibility, Spatial Distribution, Equity |
| [73] | 2020 | Equity (Horizontal and Vertical Equity) Park Supply Index, Proximity and Quality |
| [119] | 2020 | Urban Green Blue Infrastructure Accessibility, Equality |
| [87] | 2020 | Green space distribution, accessibility indicators |
| [100] | 2020 | Equity evaluation, Area-weighted Park Service Level |
| [88] | 2019 | Environmentally critical area, Determined qualitatively (CO, PM10, and PM².5) |
| [74] | 2019 | spatial distribution, Mapping UGS Density of Greenness, UGS Index |
| [89] | 2019 | Spatial Characteristics and Pattern of GS, distribution |
| [75] | 2019 | Proximity, Accessibility, Distribution disparity |
| [90] | 2019 | Green Space Supply, Green Space pressure |
| [112] | 2018 | Supply and Demand analysis, UGS accessibility, Spatial distribution |
| [114] | 2018 | Accessibility, Time–Distance Weighted Technique, Spatial Equity |
| [76] | 2018 | Availability, Green Index |
| [105] | 2018 | Spatial Autocorrelation of Greening Indices, Relationship Between Greening and Socio-economic Variables |
| [77] | 2018 | Accessibility (Objective measures) Subjective Perception of UGS Accessibility |
| [91] | 2018 | Accessibility, Urban Dynamics, Multiple Scenario Modeling Approach |
| [121] | 2018 | Relationship Between Housing Density and Green Space Provision |
| [123] | 2018 | Spatial Accessibility, Proximity (Physical, Spatial accessibility) |
| [120] | 2018 | Population density (Density Indicator), UGS Change Analysis |
| [78] | 2017 | UGS Distributional inequities, Relationship between Socioeconomic conditions and UGS |
| [34] | 2017 | Accessibility, Environmental inequalities |
| [101] | 2017 | UGS Coverage Change Analysis |
| [102] | 2016 | UGS availability (Spatial availability) |
| [37] | 2014 | Accessibility, Unequal Distribution, Inequality |
| [110] | 2014 | Spatial Patterns of Green Areas |
| [92] | 2014 | Pedestrian accessibility (Network distance) |
| [93] | 2013 | Green Space Classification, Environmental Indices (SO2 or NO3) |
| [106] | 2013 | Distribution of UGS, Vegetation Quality |
| [94] | 2011 | UGS Distribution, Accessibility |
Disclaimer/Publisher’s Note: The statements, opinions and data contained in all publications are solely those of the individual author(s) and contributor(s) and not of MDPI and/or the editor(s). MDPI and/or the editor(s) disclaim responsibility for any injury to people or property resulting from any ideas, methods, instructions or products referred to in the content. |
© 2025 by the authors. Licensee MDPI, Basel, Switzerland. This article is an open access article distributed under the terms and conditions of the Creative Commons Attribution (CC BY) license (http://creativecommons.org/licenses/by/4.0/).
Copyright: This open access article is published under a Creative Commons CC BY 4.0 license, which permit the free download, distribution, and reuse, provided that the author and preprint are cited in any reuse.


