
Submitted:
09 December 2025
Posted:
11 December 2025
You are already at the latest version
Abstract
The paper focuses on materials characterization and «in vivo» biocompatibility tests of Ti6Al7Nb alloys microdoped by 0.3 wt. % of rareearth elements (REE) to use it as perspective materials to produce personalized medical implants. All Ti6Al7Nb0.3REE alloys (REE Y, Ce, La) were produced by electric arc melting method and characterized by scanning electron microscopy (SEM), optical microscopy (OM), energy-dispersive Xray spectroscopy analysis (EDX), helium pycnometer as well as reducing/oxidation melting methods. The measured true densities increased in the order: Ti−6Al−7Nb−0.3Y (4.4563 ± 0.1075 g/cm³) < Ti−6Al−7Nb−0.3Ce (4.7255 ± 0.2853 g/cm³) < Ti−6Al−7Nb−0.3La (4.8019 ± 0.0111 g/cm³). Diffraction analysis was performed to indicate phases composition and calculate crystallites sizes, crystal orientation and lattice parameters that confirmed REEmicrodoping due to increase of lattice volume. The single-phase Ti6Al7Nb0.3Y alloy had the finest αTi crystallites (22.32 nm), the larger αTi crystallites in the dualphase Ti6Al7Nb0.3Ce and Ti6Al7Nb0.3La (30.77 nm and 29.83 nm, respectively) suggest that the presence of the βTi phase. Hardness (H) and elastic modulus (E) were indicated by nanoindentation and increased in the order: Ti−6Al−7Nb−0.3La (4.01 GPa and 17.7 GPa respectively) < Ti−6Al−7Nb−0.3Y (4.39 GPa and 137 GPa respectively ) < Ti−6Al−7Nb−0.3Ce (4,67 GPa and 146 GPa respectively). In vivo tests showed that Ti6Al7Nb0.3La alloy had statistically significant increase of local inflammation at the one-week mark needed to further research and explanation as well, that could be indicator of toxicity in comparison with other studied alloys.
Keywords:
REE
; rare-earth elements
; rare-earth
; lanthanum
; La
; cerium
; Ce
; yttrium
; Y
; microalloying
; microdoping
; titanium
; Ti
; titanium alloys
; Ti-based alloys
; TiAlNb
; Ti6Al7Nb
; alpha titanium alloy
; beta titanium alloy
; biocompatible alloys
; material characterization
; personal implants
; biocompatibility
; biocompatible tests
; in vivo
1. Introduction
Titanium and their alloys have played a predominant role as structural biomaterials in reconstructive surgery, especially orthopedics and maxillofacial surgery[1,2,3]. Based on the fact that pure titanium and its alloys undoubtedly have excellent properties as biomaterials for surgical implants, current scientific work [4,5,6,7,8] focuses on increasing the efficiency of these materials by introducing optimal alloying components. This allows maintaining a high level of biocompatibility. Metals such as thallium, niobium, zirconium and, in certain situations, molybdenum are suitable candidates for such modification[5,7,9,10,11,12].
The addition of alloying elements such as Nb, Si, Mo, Ta, W, Fe, Cr and some rare earth metals can stabilize the β−phase [9,13,14,15,16,17,18,19,20]. Mechanical properties are improved by the addition of Nb to TiAl−based alloys, an increase in the Nb content in Ti–Al–Nb alloys from 40 to 50 at.%. Al promotes the formation of γ−TiAl and σ−Nb2Al phases in the structure of the material, which can improve its properties at high temperatures. A preceding study established that modifying the composition of γ + σ phases within the structure can enhance the fracture resistance of titanium, aluminum and niobium-based composites with elevated σ-phase content.
Small additions of rare earth metals make it possible to control the structure of aluminum and alloys containing it due to the formation of secondary precipitations of intermetallic phases [15,16,21]. With an increase in the Ce content, the average grain size decreases, and the grain gradually passes from a large lamellar structure to a two-phase microstructure [21]. The addition of yttrium has a positive effect on the structural stability of alloys, reduces their liquation heterogeneity, and prevents the formation of harmful structural components [16,22]. It promotes the removal of interstitial oxygen in the α- and γ-phases [3]. Dispersed oxide particles in the microstructure of the alloy containing La slow down dynamic recrystallization [23,24].
Other researchers [25] focused on 34 different compositions of new titanium β–alloys with different amounts of niobium (Nb) and other metals such as molybdenum (Mo), tantalum (Ta), vanadium (V) and they carried out numerous biological tests to evaluate the biocompatibility of Ti–based β–alloys. A table with data on the biocompatibility of the main alloying elements Ti, Al, Nb, V, Zr, Mo, Ta, Fe, Cu, Zn was considered in the previous work [3,5,9,10,15,17,19,20,26,27,28,29].
It is perfectly understandable that rare earth elements (REEs) are a group of metals that include lanthanum (La), 14 lanthanides, yttrium (Y), and scandium (Sc). However, the contradictions between adverse (e.g. toxicological and ecotoxicological) and beneficial effects associated with REEs have not been fully discussed. There are a number of reviews that address both the toxic effects on the body [30,31] (Table 1) and the antioxidant effects associated with REEs in the treatment of many diseases [30,31,32,33,34], as well as the use of REEs as alternative safe feed additives used to stimulate growth and performance of animals [31].
Ti-based β-alloys possess low elastic modules of between 40 and 80 GPa. This is comparable to the elastic modules of bone, thus helping to prevent bone absorption, which can otherwise lead to implant loosening or refracture of the bone following removal [24,35,36].
The amount of additive introduced was determined using ASTM 1295-23 standard specification have little different chemical requirement for TiAlNb-based alloy such as impurities of oxygen (0.2 wt. % ± 0.02), carbon (0.08 wt. % ± 0.02), nitrogen (0.05 wt. % ± 0.02), hydrogen (0.009 wt. % ± 0.002), iron (0.25 wt. % ±0.10), cobalt (0.10 wt. % ± 0.02), other elements need not be reported unless the concentration level is greater than 0.1 wt. % each, or 0.4 wt. % total [37].

Table 2.
Chemical Requirements for Ti−6Al−7Nb alloy according to ASTM F1295-23 and ISO 5832-11: 2024 standards[37,38].
| Element | Compositional limits, wt. % (ASTM F1295-23) |
Compositional limits, wt. % (ISO 5832-11: 2024) |
| Titanium (Ti) | Balance | Balance |
| Aluminum (Al) | 5.50 to 6.50 | 5.50 to 6.50 |
| Niobium (Nb) | 6.50 to 7.50 | 6.50 to 7.50 |
| Iron (Fe) | 0.25 max | 0.25 max |
| Oxygen (O) | 0.20 max | 0.20 max |
| Carbon (C) | 0.08 max | 0.08 max |
| Nitrogen (N) | 0.05 max | 0.05 max |
| Hydrogen (H) | 0.009 max | 0.009 max |
| Cobalt (Co) | < 0.10 | No requirements |
| Tantalum (Ta) | No requirements | 0.50 max |
| Other elements each | 0.10 max | 0.10 max |
| Other elements total | 0.40 max | 0.30 max |
The aim of current work was to develop novel Ti−6Al−7Nb−0.3REE (REE – Y, Ce, La) alloys and evaluate effect of cerium, lanthanum and yttrium rare-earth elements microdoping on microstructure, mechanical properties, phase composition and to perform in vivo biocompatibility tests to access the possibility for further producing by hot rotary forging, additive manufacturing (AM) and use novel alloys for personalized medicine.
2. Materials and Methods
Smelting of master-alloy and titanium alloy: Titanium (99.9% purity), Aluminum (99.99% purity), Niobium (99.9% purity), Lanthanum (99.9% purity), Cerium (99.9% purity) and Yttrium (99.9%) were used as a raw material to produce Aluminum- Rare-Earth Element master-alloys (Al-REE) and Ti–6Al–7Nb-0.3REE alloys (REE - Y, Ce, La) The raw material were weighed with an accuracy of 0.0001 g on AS 220/C/2 (RADWAG, Republic of Korea). Master alloys Al−10Ce, Al−10La and Al−10Y were get into resistance furnace in graphite crucible to perform microalloying and homogeneous distribution of rare-earth elements (REE) in the Ti–6Al–7Nb−0.3REE (REE − Y, Ce, La) alloys. Alloys were smelted by the electric arc melting method in vacuum using copper cooling molds with four continuous melting−crystallization stages and flipping ingots from one side to another side.
True density measurements: true density of Ti–6Al–7Nb–0.3REE (REE − Y, Ce, La) alloys was measured using an Ultrapyc 1200e gas pycnometer (Quantachrome, USA) with an accuracy of ± 0.03% in a high-purity helium atmosphere 99.999% with constant gas flow. The cell calibration with volume 10 cm3 was performed using 7.0699 cm3 stainless-steel spheres. True density was calculated using a built-in computing program based on the Archimedes displacement principle.
Electron microscopy (SEM) and energy-dispersive X-ray spectroscopy (EDS): Ti–6Al–7Nb–0.3REE (REE − Y, Ce, La) microstructure was evaluated by SEM images, obtained using a FEI Dual Beam Helios NanoLab system (FEI, Thermo Fisher, USA). Cross–sectional was produced by a focused ion beam (FIB) technique, employing an FEI Dual Beam Helios NanoLab system (FEI, Thermo Fisher, USA). Elemental analysis was performed with EDAX system (USA).
Analysis of oxygen, nitrogen, hydrogen, sulfur and carbon: the total content of oxygen, nitrogen and hydrogen of Ti–6Al–7Nb–0.3REE (REE − Y, Ce, La) was determined using TC–600 (LECO, USA) gas analyzer by the method of reducing melting in a nickel capsule in a graphite crucible in a flow of inert carrier gas – helium. Oxygen detection is carried out by the amount of CO and CO2 by the infrared absorption method. Nitrogen detection is carried out by thermal conductivity. The total content of carbon and sulfur in Ti–6Al–7Nb–0.3REE (REE - Y, Ce, La) was determined on a CS–600 (LECO, USA) gas analyzer by the method of oxidative melting in a ceramic crucible in an induction furnace in the presence of a flux – a mixture of metallic tungsten, iron and tin. Carbon and sulfur detection by the amount of released gaseous CO2 and SO2 by the infrared absorption method.
X-ray fluorescence spectrometry: elements analysis of Ti–6Al–7Nb–0.3REE (REE - Y, Ce, La) alloys were determined by X–ray fluorescence analysis using a sequential–wave dispersive X–ray fluorescence spectrometer S8 Tiger Series 2 (Bruker, Germany). The spectrometer is equipped with an OEG 95LT X–ray tube with rhodium (Rh) anode with a maximum power of 4 kW and current up to 170 mA, crystal analyzers set, flow–proportional and scintillation detectors, collimators, as well as Al and Cu filters of various thicknesses. The spectrometer is controlled, and spectral data are processed using the Spectra Plus software package, which includes Quant–Express software for semi-quantitative (standard-free) express analysis of samples of unknown composition.
X-ray phase analysis (XRD): X-ray phase analysis (XRD) registration of X–ray diffraction spectra of Ti–6Al–7Nb–0.3REE (REE − Y, Ce, La) alloys was carried out on X–ray diffractometer “UltimaIV” of the company “Rigaku” (Japan) with vertical goniometer and high-speed semiconductor detector “D/teX”, Ni filter on the primary beam, in CuKα – radiation in the range of angles of 2 theta from 9 to 100 degrees with a shooting step of 0.02 degrees. Phase qualitative and analysis of samples was performed in the Sleve software package using the ICDD and ICSD database.
Hardness (H) and Elastic Modulus Measurements (E): hardness, elastic modules and ratio of elastic work to the total work of indentation (ηit) of Ti–6Al–7Nb−0.3REE (REE − Y, Ce, La) alloys were measured according to ISO 14577 Metallic materials – Instrumented indentation test for hardness and materials parameters. All samples were hot poured into epoxy resin and then polished to a roughness at least 100 nm.
To assess the safety of the new tested Ti−6Al−7Nb−0.3REE (REE – Ce, La, Y) alloys using intravital research methods, the animals were recorded: body weight (g), overall body temperature (°C) and local body temperature in the implantation area (°C) during the periods: immediately before the start of the experiment, 3, 7, 14, 21 and 28 days after the operation. The values obtained before the surgery were taken as the norm.
At the same time, the animals’ appearance, behavioral reactions, intensity and nature of motor activity, condition of the hair and skin, and color of the mucous membranes were noted. A visual assessment of the soft tissues in the implantation area was performed.
The body weight of the animals was recorded using electronic scales TV_A. Overall body temperature was measured using an electronic thermometer DT − 622.
Local body temperature was measured using a thermal imager. The studies were conducted in the morning before the first feeding.
The quantitative data obtained was a subject of statistical analysis. Statistical analysis was performed using the AtteStat add−in version 13.1 for Excel spreadsheets (2016, 16.0.5278.1000). The median and 1−3 quartiles (Me, Q1 − Q3) were determined using descriptive statistical methods. Comparative studies were performed using the Mann-Whitney criterion. Differences in parameters were considered statistically significant at p < 0.05.
The animals were kept in the same conditions in a vivarium. They received standard, nutritionally balanced food and clean drinking water.
During in vivo biocompatibility tests of new alloys Ti–6Al–7Nb−0.3REE (REE − Y, Ce, La) convention for the Protection of Vertebrate Animals used for Experimental and other Scientific Purposes and Directive 2010/63/EU of the European Parliament and of the Council of the European Union of 22.09.2010 on the protection of animals used for scientific purposes were used.
3. Results
SEM images of the Ti−6Al−7Nb−0.3REE (REE – Y, Ce, La) showed fine dispersed acicular needle-like pattern, typical for hexagonal α−Ti phase (Figure 1a), and ultrafine acicular needles were identified, typical of the α−Ti phase in addition to grain boundaries characteristic of the cubic β−Ti phase (Figure 1b,c).
EDS spot and surface analyses were performed on specific “plain” and “top land” areas of interest reporting elemental composition registered Ti, Al, Nb, Y for Ti−6Al−7Nb−0.3Y alloy (Figure 2a,b); Ti, Al, Nb, Ce for Ti−6Al−7Nb−0.3Ce (Figure 2c,d), and Ti, Al, Nb, La for Ti−6Al−7Nb−0.3La alloy (Figure 2e,f). The following component contents in the alloys were found: Ti−6Al−7Nb−0.3Y had next elemental composition − titanium 88.09 ± of 1.64 wt.%, aluminum 5.87 ± 7.04% wt.%, niobium 5.35 ± 5.42 wt.%, and yttrium 0.08 ± 61.56 wt.% (Figure 2b); had next elemental composition Ti−6Al−7Nb−0.3Ce – Ti 86.7 ± 1.65 wt.%, aluminum 7.03 ± 7.02wt.%, niobium 4.66 ± 6.23% wt.%, and cerium 1.61 ± 27.66% (Figure 2d); for Ti−6Al−7Nb−0.3La – titanium 65.29 ± 2.24 wt.%, aluminum 4.81 ± 12.98 wt.%, niobium 6.88 ± 9.92 wt.%, and lanthanum 23.02 ± 7.09 wt.% (Figure 2f).
X-ray elemental analysis indicated that Ti−6Al−7Nb−0.3Y alloy comprised 87.61 wt.% of titanium, 6.23 wt.% of aluminum, 5.79 wt.% of niobium, 0.195 wt. % of vanadium, 0.114 wt. % of yttrium, 973 ppm of cerium. Titanium based alloy with composition Ti−6Al−7Nb−0.3Ce 86.6 wt.% of titanium, 6.72 wt.% of aluminum, 5.52 wt.% of niobium, 0.296 wt.% of iron, 0.215 wt. % of vanadium, 0.202 wt.% of chromium, 0.250 wt.% of cerium, Ti−6Al−7Nb−0.3La 85.1 wt. % of titanium, 7.67 wt. % of aluminum, 6.06 wt.% of niobium, 0.34 wt. % of iron, 0.134 wt.% of vanadium, 0.23 wt. % of chromium, 0.287 wt. % of lanthanum (Table 3).
A comparative analysis reveals systematic shifts in the titanium, aluminum, and niobium balances across the three alloys. The titanium content shows a gradual decrease from 87.61 wt.% in the Y−alloy to 86.6 wt.% in the Ce−alloy, and further to 85.1 wt.% in the La−alloy. This trend is inversely correlated with the aluminum content, which increases progressively from 6.23 wt.% to 7.67 wt.%. Niobium content remains relatively stable, ranging from 5.52 to 6.06 wt.% (Table 3).
The Ti−6Al−7Nb−0.3Y alloy demonstrates the highest purity, with vanadium (0.195 wt.%) as the only detected trace element aside from cerium the mentioned above. In contrast, the Ce− and La−modified alloys contain measurable quantities of Iron (0.296 wt.% and 0.34 wt.%, respectively), Vanadium, and Chromium (0.202 wt.% and 0.23 wt.%, respectively). These elements are common beta (β) stabilizers. Their concurrent presence, particularly Fe and Cr, could have a synergistic effect on stabilizing the β-phase. This could lead to a finer, more refined two-phase (α + β) microstructure upon cooling, which may contribute to the enhanced mechanical strength observed in the Ce−alloy, offsetting the softening tendency expected from its lower Ti content (Table 3).
Reducing melting method showed 0.35 ± 0.02 wt.% of oxygen, 0.14 ± 0.01 wt.% of nitrogen, and 0.011 ± 0.001 wt.% of hydrogen impurities for Ti−6Al−7Nb−0.3Y alloy, 0.18±0.02 wt. % of oxygen, 0.077 ± 0.004 wt. % of nitrogen, 0.010 ± 0.002 wt. % of hydrogen for Ti−6Al−7Nb−0.3Ce alloy, 0.25 ± 0.02 wt.% of oxygen, 0.028 ± 0.005 wt. % of nitrogen, 0.010 ± 0.002 wt. % of hydrogen for Ti−6Al−7Nb−0.3La alloy (Table 4).
The Ti−6Al−7Nb−0.3Y alloy exhibited the highest oxygen concentration at 0.35 ± 0.02 wt.%, a value that approaches the upper limit for many commercial α+β titanium alloys. In contrast, the Ti−6Al−7Nb−0.3Ce alloy demonstrated the lowest oxygen pickup at 0.18 ± 0.02 wt.%, a reduction of nearly 50% compared to the Y-containing variant. The La-modified alloy showed an intermediate oxygen level of 0.25 ± 0.02 wt.%. This hierarchy suggests that Cerium may act as a more effective deoxidizer during the melting process compared to Yttrium− or Lanthanum microdoped Ti−6Al−7Nb alloys, potentially forming stable oxide inclusions that are sequestered from the titanium matrix.
A parallel trend is observed for nitrogen impurities for Ti−6Al−7Nb−0.3REE (REE – Y, Ce, La) alloys. The Ti−6Al−7Nb−0.3Y contains the highest nitrogen level (0.14 ± 0.01 wt.%), followed by the Ti−6Al−7Nb−0.3Ce (0.077 ± 0.004 wt.%), with the Ti−6Al−7Nb−0.3La possessing the lowest concentration (0.028 ± 0.005 wt.%). The low nitrogen in the Lanthanum microdoped Ti−6Al−7Nb alloy is particularly noteworthy. All three alloys Ti−6Al−7Nb−0.3REE (REE – Y, Ce, La) maintained hydrogen concentrations at a consistently low and safe level (0.010 – 0.011 wt.%), well below the threshold that could lead to hydrogen embrittlement, indicating that the melting and solidification processes were effectively controlled to minimize hydrogen absorption. Analysis of Ti−6Al−7Nb−0.3REE (REE − Y, Ce, La) alloys by infrared absorption of CO2 and SO2 gases method indicated very small amount of impurities. A comparable increase in carbon content was observed from the Ti−6Al−7Nb−0.3Y 0.019 ± 0.001 wt.% to the Ti−6Al−7Nb−0.3Ce alloy 0.023 ± 0.001 wt.% and finally to the Ti−6Al−7Nb−0.3La alloy 0.029 ± 0.001 wt.%. The sulfur level was lowest and identical in the Y− and Ce− microdoped Ti-6Al-7Nb alloy 0.0061 ± 0.0005 wt.% and was measurably higher in the La−microdoped Ti-6Al-7Nb alloy 0.0080 ± 0.0005 wt.%.
In alloys Ti−6Al−7Nb−0.3La and Ti−6Al−7Nb−0.3Ce − both α−Ti and β−Ti phases are present, which corresponds to the classical phase composition of the Ti−6Al−7Nb alloy – consisting of the hexagonal α−phase (stabilized by aluminum) and the regular body-centered β−phase (stabilized by niobium). However, a significant deviation from this expected composition is observed in the Ti−6Al−7Nb−0.3Ce alloy, characterized by a substantial shift in the α-Ti peaks and a distortion of the crystal lattice (~1.799%, Table 2). A quantitative analysis of the phase composition reveals that the phase ratios in the Ti−6Al−7Nb−0.3La alloy are as follows: α−Ti to β−Ti = 82 to 18. In the Ti−6Al−7Nb−0.3Ce alloy: α−Ti to β−Ti = 90.5 to 9.5. Furthermore, the Ti−6Al−7Nb−0.3La alloy exhibited an absence of the (200) β-Ti peak, and the (211) phase exhibited an extremely low intensity, consequence of its minimal presence in the sample.
It was observed slight texture demonstration since the peak intensities of certain planes are subject to change (Table 5). Ti−6Al−7Nb−0.3Ce alloy indicated minor peaks of the Titanium Aluminate phase. It suggested the presence of an impurity phase, which may be an unreacted component of the synthesis. It should be fixed that Ti−6Al−7Nb−0.3Y alloy had a single α-Ti phase in comparison with Ti−6Al−7Nb−0.3La and Ti−6Al−7Nb−0.3La (Figure 3, Table 5).
It was used an approximation that the crystallites in the Ti−6Al−7Nb−0,3REE (REE- Y, Ce, La) had spherical shapes to calculate coherent scattering area sizes. These calculations were performed using the Debye−Scherrer and Wulff−Bragg equations (Table 6). The lattice volumes of the α− Ti phase increased that indicated doping of the Ti-6Al-7Nb alloy with rare-earth elements and other compounds. The lattice parameters of the hexagonal close-packed (hcp) α−Ti phase reveal significant deviations from the reference material indicated of substantial solute-induced lattice strain. The most significant effect is observed in the Ti−6Al−7Nb−0.3Ce alloy, which exhibits a pronounced contraction of its unit cell volume (ΔV = -1.799%). It is indicated a measurable reduction in both the a-axis (2.925 Å) and c−axis (4.683 Å) parameters in comparison with the α−Ti standard alloys. This volumetric difference is a strong signature of the Cerium atoms integration into the Titanium lattice, likely as a substitutional solute. The significant atomic radius mismatch between Ti ( ≈ 140 pm) and Ce ( ≈ 185 pm) induces considerable compressive strain, distorting the crystal lattice and potentially enhancing solid solution strengthening. In contrast, the α-Ti phases in the Ti−6Al−7Nb−0.3Y and Ti−6Al−7Nb−0.3La alloys show a moderate unit cell expansion (ΔV = + 0.269% and + 0.595%, respectively). The expansion in the Ti−6Al−7Nb−0.3Y alloy can be attributed to the combined effects of Yttrium solubility and its notably higher interstitial oxygen content 0.35 wt.% (Table 4), as oxygen is a potent α−stabilizer known to expand the lattice. The intermediate expansion in the Ti−6Al−7Nb−0.3La alloy suggests a different balance of solute and interstitial effects (Table 6).
The size of the coherent scattering domains (crystallite size, D) for the α−phase, calculated using the Debye-Scherrer equation, varies notably. The single-phase Ti−6Al−7Nb−0.3Y alloy exhibits the finest α−Ti crystallites (22.32 nm), which is consistent with a microstructure refined by the pinning effect of dissolved Yttrium and/or its oxides. The larger α−Ti crystallites in the dual−phase Ti−6Al−7Nb−0.3Ce and Ti−6Al−7Nb−0.3La (30.77 nm and 29.83 nm, respectively) suggest that the presence of the β−phase at elevated temperatures may have provided a different kinetic environment for grain growth during cooling.
The lattice parameters of the body-centered cubic (bcc) β−Ti phase also showed element-specific trends. The β−phase in the Ti−6Al−7Nb−0.3Ce alloy displayed a slight contraction (a = 3.279 Å, ΔV = +0.334%), whereas the β-phase in the Ti−6Al−7Nb−0.3La alloy showed a more significant expansion (a = 3.290 Å, ΔV = -0.670%) relative to the β−Ti standard alloy. This indicates that while Niobium is the primary β−stabilizer, the specific rare-earth element and associated trace elements (e.g., Fe, Cr) influence the local electronic structure and atomic packing of the metastable β−phase. The refined β-phase crystallite sizes (23.34 nm for Ti−6Al−7Nb−0.3Ce, 25.61 nm for Ti−6Al−7Nb−0.3La) further confirm the nano−scale nature of this phase’s distribution.
A clear and statistically significant gradient in true density is observed, correlating directly with the atomic mass of the rare-earth element. The measured true densities increase in the order: Ti−6Al−7Nb−0.3Y (4.4563 ± 0.1075 g/cm³) < Ti−6Al−7Nb−0.3Ce (4.7255 ± 0.2853 g/cm³) < Ti−6Al−7Nb−0.3La (4.8019 ± 0.0111 g/cm³). This progression aligns precisely with the atomic masses of the respective rare-earth metals: Yttrium (88.91 g/mol), Cerium (140.12 g/mol), and Lanthanum (138.91 g/mol). The near-identical masses of Ce and La are reflected in their closely matched densities, while the significantly lighter Y atom results in a measurably lower density for its respective alloy (Table 7).
Microindentation showed different dependencies of Vickers hardness under different loading forces of Ti−6Al−7Nb−0.3REE (REE – Y, Ce, La). It was indicated middle hardness for Ti−6Al−7Nb−0.3Y alloy equaled 378 ± 12 HV under 0.1 kgf, 384 ± 26 HV under 0.2 kgf , 355,7 ± 2,3 HV under 0.5 kgf, 344 ± 6 HV under 1 kgf, 345 ± 6 HV under 2 kgf, 351 ± 6 HV under 5 kgf, and 343 ± 6 HV under 10 kgf. Microhardness increased for Ti−6Al−7Nb−0.3Ce alloy equaled 436 ± 32 HV under 0.1 kgf, 351 ± 10 HV under 0.2 kgf, 374 ± 23 HV under 0.5 kgf, 376 ± 16 HV under 1 kgf, 329 ± 9 HV under 2 kgf, 376 ± 18 HV under 5 kgf, 372 ± 32 HV under 10 kgf. The lowest microhardness had Ti−6Al−7Nb−0.3La alloy equaled 364 ± 28 (HV 0.1), 350 ± 26 (HV 0.2), 322,3 ± 2,3 (HV 0.5), 334 ± 18 (HV 1), 313 ± 7 (HV 2), 323,7 ± 3,5 (HV 5), 317 ± 11 (HV 10). (Table 8, Figure 4).
Ti−6Al−7Nb−0.3Y alloy exhibited a characteristic indentation size effect (ISE), where the microhardness decreased markedly from 378 ± 12 HV at 0.1 kgf to a plateau of approximately 344 – 345 HV at loads above 1 kgf. This ~ 9% reduction in hardness with increasing load is indicative of a material whose resistance to plastic deformation is more significant at shallow indentation depths (Table 8, Figure 4). Ti−6Al−7Nb−0.3Ce alloy displayed a more complex non-monotonic trend. It registered the peak hardness value of 436 ± 32 HV at 0.1 kgf, which then declined sharply by over 24% to a minimum of 329 ± 9 HV at 2 kgf. Interestingly, the hardness subsequently recovered considerably to 376 ± 18 HV and 372 ± 32 HV at 5 kgf and 10 kgf, respectively. This recovery suggests a potential transition in the dominant deformation mechanism, possibly involving the interaction of dislocations with Cerium-containing precipitates at higher strain levels (Table 8, Figure 4). Among the three Ti−based alloys, the Ti−6Al−7Nb−0.3La composition consistently demonstrated the lowest microhardness profile, decreasing gradually from 364 ± 28 HV at 0.1 kgf to 317 ± 11 HV at 10 kgf. This overall reduction of ~ 13% underscores the comparatively limited strengthening effect of Lanthanum addition across the investigated load range (Table 8, Figure 4).
Nanoindentation testing using Berkovich’s indentor at loads of 20, 100, and 500 mN was performed to characterize the micromechanical properties of the Ti−6Al−7Nb−0.3RE alloys. The results revealed a clear load−dependence and a significant influence on the rare-earth element type (Table 9, Figure 5).
An indentation size effect (ISE) was observed for all alloys composition Ti−6Al−7Nb−0.3REE (REE – Y, Ce, La) , with nanohardness decreasing progressively as the applied load increased from 20 to 500 mN (Figure 5).
Ti−6Al−7Nb−0.3Ce alloy demonstrated the highest resistance to plastic deformation across the entire load range, with its nanohardness declining from 5.40 ± 0.5 GPa at 20 mN to 4.67 ± 0.26 GPa at 500 mN. In comparison, the Ti−6Al−7Nb−0.3Y alloy exhibited an intermediate nanohardness profile (5.20 ± 0.6 GPa to 4.39 ± 0.30 GPa), while the Ti−6Al−7Nb−0.3La alloy consistently displayed the lowest values, decreasing from 4.83 ± 0.37 GPa to 4.01 ± 0.23 GPa (Table 9, Figure 5a). The elastic modulus, a measure of stiffness, also showed a subtle decreasing trend with increasing load for the Y− and Ce−microdoped alloys (Table 9, Figure 5b). Notably, the Ce−microdoped alloy possessed the highest modulus, peaking at 150 ± 6 GPa at 100 mN, which is approximately 8 − 12% higher than that of the La−containing alloy at equivalent loads. This indicates that Ce microdoping provides the most substantial strengthening effect in the elastic modules (Table 9, Figure 5b). The elastic recovery, representing the proportion of elastically recovered deformation, gradually diminished with increasing indentation depth for all specimens (Table 9, Figure 5c). The Y−microdoped alloy showed a marginally superior elastic recovery, particularly at the highest load of 500 mN (18.8 ± 0.9%), compared to the Ce−microdoped (18.6 ± 0.6%) and La−microdoped alloys (17.7 ± 0.7%). This suggests a slightly enhanced ability to recover from deformation after the load is removed (Table 9, Figure 5c).
The systemic and local biocompatibility of the experimental Ti−6Al−7Nb−0.3REE (REE − Y, Ce, La) alloys was evaluated over a 28 − days implantation period and compared against pure titanium control. Assessment of general health, body weight, total body temperature, and local tissue temperature at the implantation site provided a multi-faceted view of the host response.
The general life condition of the rats in all groups was satisfactory during experiment. No deaths of rats have been fixed. There were no abnormalities in feed and water intake, as well as infectious and neurological complications. The condition of the skin and hair, and the color of the mucous membranes did not change. The behavioral features of the animals and their general condition corresponded to the expected clinical picture. During rest and movement, the animals assumed a natural physiological position. In all groups, there were no significant changes in body weight at different periods of the experiment compared to the initial values (Table 10).
Body weight served as a key indicator of metabolic and systemic health. As detailed in Table 10, longitudinal monitoring revealed no statistically significant fluctuations in body weight in any group compared to their respective baseline (Day 0) values. While absolute weight differences existed between groups at baseline (e.g., Groups 2 and 3 were initially heavier), each group maintained a stable trajectory over time. The control group (Pure Ti) and Group 1 (Ti−6Al−7Nb−0.3Y) showed remarkable stability, with median (Me) weights varying by less than 3%. Groups 2 and 3 (La and Ce) also maintained stable weights, with any minor variations falling within the interquartile ranges (Q1 − Q3). This sustained weight stability across all cohorts strongly suggests an absence of chronic systemic stress or metabolic disruption attributable to the implant materials.
A significant decrease in total body temperature of rats was recorded in comparison with preoperative values during all stages of in vivo experiments in all groups. No significant differences were found between the groups .
As presented in Table 11, a statistically significant decrease (p < 0.05) in core body temperature was observed at all post-operative time points (Days 7−28) compared to pre-operative baselines (Day 0). This phenomenon is a well−documented non-specific stress response to surgical trauma and anesthesia. Critically, no statistically significant differences were detected between the experimental groups №1-3 and the pure titanium control group at any stage. This indicates that the systemic inflammatory and stress response triggered by the implantation of Ti−6Al−7Nb−0.3REE (REE – Y, Ce, La) alloys was not significantly different in magnitude or duration from the response to the clinically established pure titanium control.
Analysis of the dynamics of rats’ local body temperature in the area of implantation of test samples showed that after 7 days of the experiment in the control group and the main group 1 there was a significant decrease in this parameter compared to the initial values by 1.6 °C (p = 0.0002; p = 0.01, respectively). During this period, a significant increase in local body temperature was recorded in the main group №2 by 0.9 − 1.2 °C compared to other groups. Subsequently, this parameter in all groups was significantly lower than the initial values, but there were no differences found within each group and between groups. The dynamics of changes in rats’ local body temperature in the area of implantation of pure titanium and Ti−6Al−7Nb−0.3 REE (REE – Y, Ce, La) samples is shown in Table 12.
The local body temperature at the implantation site was measured as a direct indicator of the localized inflammatory response. The data, detailed in Table 12, reveals a pattern of the initial tissue−material interaction.
All groups, including the control, exhibited a significant reduction in local temperature from baseline by Day 14 onwards, consistent with the resolution of the acute inflammatory phase and the progression into tissue repair and remodeling.
The most salient finding was observed on Day 7. While the Control (Pure Ti) and Group 1 (Ti−6Al−7Nb−0.3Y) alloys showed a significant decrease in local temperature, Group 2 (Ti−6Al−7Nb−0.3La) demonstrated a distinct and statistically significant increase in local temperature (Me = 34.2 °C) compared to both its own baseline and all other groups (p < 0.05). This transient local hyperthermia is a classic sign of an acute inflammatory response, suggesting that the La-modified alloy initially provoked a more pronounced local tissue reaction than its counterparts. However, by Day 14, the local temperature for Group 2 had decreased and normalized with the other groups, indicating that this inflammatory response was self-limiting and resolved promptly.
In contrast, Group 3 (Ti−6Al−7Nb−0.3Ce) and Group 1 (Ti−6Al−7Nb−0.3Y) displayed a local thermal profile that was largely indistinguishable from pure titanium control throughout the study. The Ce-containing alloy, in particular, showed no significant temperature deviation on Day 7, suggesting a minimal initial inflammatory response and a biocompatibility profile comparable to, or even exceeding, that of pure titanium.
No violations of thermoregulation and energy metabolism processes were detected in the organs of experimental rats in all groups during in vivo experiments, when assessing the safety of new tested materials Ti−6Al−7Nb−0.3 REE (REE – Y ,Ce, La) by means of lifetime research methods.
It was evidenced by the absence of sharp significant fluctuations in the general and local body temperature, as well as the weight of the rats at different periods of the experiment. The intensity of feed and water intake also did not change. Motor and behavioral reactions were preserved. No cases of animal deaths have been reported.
4. Discussion
The measured compositions align well with the target Ti-6Al-7Nb-0.3RE stoichiometry. The rare-earth elements were successfully integrated into the matrix, with measured concentrations of 0.114 wt.% Y, 0.250 wt.% Ce, and 0.287 wt.% La. The slight deviations from the nominal 0.3 wt.% can be attributed to standard manufacturing losses, such as oxidation or evaporation during the melting process. It is noteworthy that the Ti−6Al−7Nb−0.3Y alloy exhibited a trace amount of Cerium (973 ppm), suggesting a minor impurity in the starting Yttrium feedstock or cross-contamination during processing. This incidental inclusion, while small, could potentially influence the alloy’s microstructural evolution.
A comparative analysis reveals systematic shifts in the titanium, aluminum, and niobium balances across the three Ti−6Al−7Nb−0.3REE (REE − Y, Ce, La) alloys. The titanium content shows a gradual decrease from 87.61 wt.% in the Y− microdoped alloy to 86.6 wt.% in the Ce−microdoped alloy, and further to 85.1 wt.% in the La−microdoped alloy. This trend is inversely correlated with the aluminum content, which increases progressively from 6.23 wt.% to 7.67 wt.%. Niobium content remains relatively stable, ranging from 5.52 to 6.06 wt.%.
These variations are significant as they directly impact the phase stability and microstructural constituents of the Ti−6Al−7Nb−0.3 REE (REE – Y ,Ce, La) alloys. The Al content acts as a potent alpha (α) phase stabilizer, while Nb is a beta (β) phase stabilizer. The higher Al−equivalent content in the La−microdoped alloy suggests a potentially larger volume fraction of the α−phase at room temperature compared to the Y− and Ce−microdoped alloys (Figure 4, Table 5). This compositional shift could be a primary factor underlying the differences in mechanical properties, such as the lower hardness 4.01 GPa under load 500 mN observed in the La−microdoped alloy (Table 9).
For all three alloys Ti−6Al−7Nb−0.3 REE (REE – Y ,Ce, La), hardness decreases monotonically as the load increases from 20 mN to 500 mN. This is physically attributed to the greater influence of geometrically necessary dislocations (GNDs) at shallow indentation depths. At lower loads (e.g., 20 mN), the high strain gradient within a small, confined plastic zone necessitates a high density of GNDs, resulting in elevated hardness values. As the load and indentation depth increase, the role of GNDs diminishes relative to the statistically stored dislocation population, leading to a decrease in the measured hardness (Figure 5, Table 9), all these effects were studied and confirmed by authors [39,40,41,42,43,44]
The Ce−microdoped alloy (Ti−6Al−7Nb−0.3Ce) exhibits superior resistance to plastic deformation across the entire load spectrum. It possesses the highest hardness at 20 mN (5.40 ± 0.5 GPa) and maintains this advantage at 500 mN (4.67 ± 0.26 GPa). The Y−containing alloy (Ti−6Al−7Nb−0.3Y) shows an intermediate profile, while the La−containing alloy (Ti−6Al−7Nb−0.3La) consistently demonstrates the lowest hardness values, culminating in a minimum of 4.01 ± 0.23 GPa at 500 mN. This hierarchy suggests that Cerium acts as the most potent strengthener, likely through the formation of fine, stable dispersoids that effectively impede dislocation motion, it was confirmed by earliest research. A subtle yet consistent decrease in elastic modulus is observed for the Y−microdoped and Ce−microdoped alloys as the load increases. For instance, the modulus of the Ce− microdoped alloy decreases from 149 ± 9 GPa at 20 mN to 146 ± 5 GPa at 500 mN. This minor reduction may be attributed to the decreasing influence of surface oxide layers or near−surface residual stress at higher penetration depths. The La−microdoped alloy’s modulus remains relatively constant within error margins. Critically, the Ti−6Al−7Nb−0.3Ce alloy displays the highest elastic modulus at all loads, with a peak value of 150 ± 6 GPa at 100 mN. This represents a significant enhancement of approximately 9% and 12% over the Y− and La−microdoped alloys, respectively, at equivalent loads. This indicates that Ce addition most effectively increases the interatomic bonding forces and the overall stiffness of the titanium matrix, potentially via solid solution strengthening, it was indicated by authors [21,45,46,47,48,49,50,51,52,53,54,55,56,57].
Under a constant applied load, a shallower indentation depth correlates directly with higher resistance to penetration (hardness). Consistent with its superior hardness, the Ce-alloy consistently exhibits the smallest indentation depths at all loads (e.g., 2266 ± 60 nm at 500 mN). Conversely, the softest alloy, Ti−6Al−7Nb−0.3La, consistently displays the greatest penetration (e.g., 2429 ± 64 nm at 500 mN).
The elastic recovery, which quantifies the fraction of deformation recovered upon unloading, decreases progressively with increasing load for all compositions Ti−6Al−7Nb−0.3REE (REE – Y, Ce, La). This trend is expected, as larger plastic zones generated under higher loads lead to a greater proportion of irreversible deformation. Notably, the Y−microdoped alloy demonstrates a marginally superior elastic recovery at the highest load (18.8 ± 0.9% at 500 mN) compared to the Ce−microdoped alloy (18.6 ± 0.6%) and La−microdoped alloy (17.7 ± 0.7%) variants. This suggests that the Y−microdoped alloy possesses a slightly more resilient microstructure, capable of recovering a greater proportion of its deformation after the indentation load is removed − a property potentially linked to improved resistance to contact damage.
Thus, the Indentation Size Effect (ISE) is a dominant factor, with hardness being highly sensitive to the test load [39,40,41,42,46,57,58]. Cerium (Ce) microdoping of Ti−6Al−7Nb alloy is the most effective rare−earth elements addition for enhancing overall micromechanical performance, providing the highest combination of nanohardness (H) 4.67 GPa under load 500 mN and elastic modulus (E) 146 GPa (Figure 5, Table 9). Yttrium (Y) microdoping of Ti−6Al−7Nb alloy offers a balanced profile, with intermediate nanohardness (H) 4,39 GPa under load 500 mN, but with a marginally superior ability for elastic recovery 18.8% at 500 mN (Figure 5, Table 9). Lanthanum (La) microdoping of Ti−6Al−7Nb alloy provides the most modest strengthening effect, resulting in the lowest nanohardness (H) 4.01 GPa of the three Ti−6Al−7Nb−0.3REE (REE-Y, Ce, La) alloys studied.
Authors [59]determined that the maximum solid solubility of La in Ti is below 1,0 at. %, specifically finding the La−content in body−centered cubic β−Ti(La) phase at T = 1800 K to be (0.6 ± 0.3) at%, that is corresponding to XRD data. Another research [60] showed good yttrium solubility (2.33 wt. % or 1.0 at. %) in Ti−46Al−2Cr−2Nb alloy with α−Ti phase and γ−Ti phase formation with slight amount of Al2Y phase that was confirmed by XRD. Authors [61] reported that 0.1 wt. % Yttrium microalloying of Ti−24Nb−38Zr−2Mo alloy resulting lattice parameters increasing until 3.369 ± 0.003 А in comparison with 3.369± 0.003 А for basic alloy composition Ti−24Nb−38Zr−2Mo. For current research the XRD patterns show a clear pattern in the phase composition among the three alloys The Ti−6Al−7Nb−0.3REE (Figure 3, Table 5). The Ti−6Al−7Nb−0.3Y alloy exhibits a single-phase hexagonal close-packed (hcp) α−Ti structure, with no detectable peaks corresponding to the body-centered cubic (bcc) β−Ti phase. In contrast, both the Ti−6Al−7Nb−0.3Ce and Ti−6Al−7Nb−0.3La alloys display a classical dual-phase (α + β) microstructure typical of Ti−6Al−7Nb [62].
However, quantitative phase analysis reveals significant differences between these two duals−phase alloys. The volume fraction of the α−phase is substantially higher for Ce−microdoped Ti−6Al−7Nb alloy (90.5%) compared to the La−microdoped Ti−6Al−7Nb alloy (82%), with a corresponding β−phase fraction of 9.5% and 18%, respectively. This indicates that Cerium has a stronger α−stabilizing effect or suppresses the β−phase formation more effectively than Lanthanum under the given processing conditions. Furthermore, the absence of the (200) β−Ti peak and the extremely low intensity of the (211) β−Ti peak at the La−microdoped Ti−6Al−7Nb alloy diffractogram suggest a potential texture or a very low volume fraction of the β−phase that is near the detection limit of XRD (Figure 3, Table 5).
A detailed analysis of the lattice parameters provides insight into the dissolution and interaction of alloying elements within the titanium matrix. A critical finding is the significant lattice distortion observed in the α−Ti phase of the Ti−6Al−7Nb−0.3Ce alloy, which exhibits a contraction in unit cell volume (ΔV = 1.799%) relative to the standard α−Ti ICDD reference (01−089−3073). This substantial volumetric contraction is a strong indicator of Cerium atoms entering in the titanium lattice as a substitutional solute, likely inducing localized strain fields due to the atomic size mismatch (Table 6).
The α−Ti lattice in the Y− microdoped alloy (Ti−6Al−7Nb−0.3Y) and La−microdoped alloy (Ti−6Al−7Nb−0.3La) also showed volumetric changes (ΔV = +0.269% and +0.595%, respectively), though less pronounced than in the Ce−microdoped alloy (Ti−6Al−7Nb−0.3Ce). The expansion in the Y-microdoped alloy (Ti−6Al−7Nb−0.3Y) is consistent with the known solid solution behavior of yttrium and the potential influence of its higher oxygen content 0.35 wt. % (Table 4), as oxygen is a potential α-stabilizer that can also expand the lattice [8,63,64]. The presence of minor peaks corresponding to a Titanium Aluminate phase in the Ce−microdoped alloy (Ti−6Al−7Nb−0.3Y) suggests that not all Cerium remained in solid solution, with a fraction likely participating in the formation of secondary intermetallic compounds.
The size of the coherent scattering domains (crystallite size, D), calculated using the Debye−Scherrer equation, varied notably between the alloys. The α−Ti crystallites in the single-phase Y-alloy were the finest (22.32 nm), while the dual-phase Ce− and La−microdoped Ti−6Al−7Nb alloys exhibited larger α−Ti crystallites (30.77 nm and 29.83 nm, respectively). This suggests that the presence of the β−phase at the processing temperature may have provided a less constrained environment for α-phase grain growth during cooling. The β−phase crystallites in the Ce− and La−microdoped Ti−6Al−7Nb alloys were also refined, with sizes of 23.34 nm and 25.61 nm, respectively (Table 6).
Thus, XRD analysis provides a fundamental microstructural explanation for the previously observed mechanical properties: the single−phase α−Ti structure of the Ti−6Al−7Nb−0.3Y alloy, combined with its high interstitial (O, N) content, is a primary contributor to its medium hardness 4.39 under load 500 mN, as both factors provide strong solid solution strengthening (Table 9, Figure 5). However, the presence of the tougher β−Ti phase may be detrimental to its ductility; the high α−phase fraction and significant lattice strain in the Ti−6Al−7Nb−0.3Ce alloy, likely due to Cerium in solid solution and fine-scale precipitates (e.g., Titanium Aluminides), are consistent with its superior combination of high hardness 4.67 ± 0.26 GPa at 500 mN and high elastic modulus 146 ± 7 GPa at 500 mN (Table 9, Figure 5). The fine, dispersed β-phase and potential precipitate strengthening offer a balanced strengthening mechanism; the Ti−6Al−7Nb−0.3La alloy, with a more balanced α/β ratio and the least lattice distortion, exhibited the lowest hardness 4.01 GPa under load 500 mN, indicating that Lanthanum provides the most modest strengthening effect among the three rare-earth elements (REE – Y. Ce, La).
Other researchers confirmed that in vivo biocompatibility tests of biodegradable alloys Mg−REE (REE − Ce, La, Nd) with composition Mg−1.27Ce, Mg−0.69La, Mg−2.13Nd did not have significant harm tissue effects. There were no abnormal behavior and changes in weight and all three types of Mg–REE implants were slow−degrading and they showed good biocompatibility[6]. It was confirmed that Ti−24Nb−38Zr−2Mo−0.1Y exhibited good cytocompatibility on seeding with SaOS2 cells by authors [61]. The integrated analysis of these in vivo parameters allows for a comparative assessment of the alloys’ biosafety profiles: All tested Ti−6Al−7Nb−0.3REE (REE – Y, Ce, La) alloys demonstrated systemic biocompatibility, with no evidence of toxicity, as reflected in stable body weight, normal physiological parameters, and a systemic stress response indistinguishable from the Pure Titanium control sample (Table 10−12). The local tissue response delineates a clear biocompatibility hierarchy: Ti−6Al−7Nb−0.3Ce (Group №3) and Ti−6Al−7Nb−0.3Y (Group №1) exhibited the most favorable profiles, with local inflammatory responses that were minimal and/or equivalent to the Pure Titanium (Control Group). Ti−6Al−7Nb−0.3La (Group №2) induced a transient, but statistically significant, increase in local inflammation at the one-week mark. While this response resolved by the second week, it indicates a comparatively more reactive interface in the acute phase post−implantation. Thus, all three Ti−6Al−7Nb−0.3REE alloys (REE – Y, Ce, La) passed preliminary biocompatible in vivo tests in comparison to pure titanium (Control Group), but Ti−6Al−7Nb−0.3Y alloy (Group №1) and Ti−6Al−7Nb−0.3Ce alloy (Group №3) are much more preferable for further research due to minimal and/or equivalent local inflammatory responses that proven by other researchers [1,2,3,4,5]. As for Ti−6Al−7Nb−0.3La alloy (Group №2), it had statistically significant increase of local inflammation at the one-week mark needed to further research and explanation as well, that can be indicator of toxicity of La−microdoped Ti-6Al-7Nb alloy, but other researchers didn’t have same effect with highest concentration of lanthanum in different alloys for biomedical application [1,2,3].
5. Conclusions
- Cerium (Ce) is the most effective rare-earth addition to Ti−6Al−7Nb alloy for enhancing overall micromechanical performance, providing the highest combination of nanohardness (H) 4,67 GPa at 500 mN and elastic modulus (E) 146 GPa at 500 mN. Yttrium (Y) addition offers a balanced profile, with intermediate hardness (H) 4.39 GPa at 500mN, but with a superior ability for elastic recovery 18.8% at 500 mN. Lanthanum (La) addition provides the most modest strengthening effect, resulting in the lowest hardness (H) 4.01 GPa at 500 mN of the three alloys studied (Table 9, Figure 5).
- The XRD analysis provides a fundamental microstructural explanation for the previously observed mechanical properties: the single-phase α-Ti structure of the Ti−6Al−7Nb−0.3Y alloy, combined with its high interstitial oxygen and nitrogen content (0.35 wt. % and 0.14 wt. % respectively), is a primary contributor to its high hardness (H), as both factors provide strong solid solution strengthening. However, the presence of the tougher β-phase may be detrimental to its ductility; the high α-phase fraction and significant lattice strain in the Ti−6Al−7Nb−0.3Ce alloy, likely due to Cerium in solid solution and fine-scale precipitates (e.g., Titanium Aluminides), are consistent with its superior combination of high hardness (H) 4.67 GPa and high elastic modulus (E) 146 GPa. The fine, dispersed β-phase and potential precipitate strengthening offer a balanced strengthening mechanism; the Ti−6Al−7Nb−0.3La alloy, with a more balanced α/β ratio and the least lattice distortion, exhibited the lowest hardness 4.01 GPa, indicating that Lanthanum provides the most modest strengthening effect among the three rare-earth elements (Table 5, Table 6 and Table 7).
- The single-phase Ti−6Al−7Nb−0.3Y alloy exhibits the finest α−Ti crystallites (22.32 nm), which is consistent with a microstructure refined by the pinning effect of dissolved Yttrium and/or its oxides. The larger α−Ti crystallites in the dual−phase Ti−6Al−7Nb−0.3Ce and Ti−6Al−7Nb−0.3La (30.77 nm and 29.83 nm, respectively) suggest that the presence of the β−phase at elevated temperatures may have provided a different kinetic environment for grain growth during cooling (Table 6).
- A clear and statistically significant gradient in true density is observed, correlating directly with the atomic mass of the rare-earth element. The measured true densities increase in the order: Ti−6Al−7Nb−0.3Y (4.4563 ± 0.1075 g/cm³) < Ti−6Al−7Nb−0.3Ce (4.7255 ± 0.2853 g/cm³) < Ti−6Al−7Nb−0.3La (4.8019 ± 0.0111 g/cm³). This progression aligns precisely with the atomic masses of the respective rare-earth metals: Yttrium (88.91 g/mol), Cerium (140.12 g/mol), and Lanthanum (138.91 g/mol). The near-identical masses of Ce and La are reflected in their closely matched densities, while the significantly lighter Y atom results in a measurably lower density for its respective alloy (Table 7).
- All three Ti−6Al−7Nb−0.3REE alloys (REE – Y, Ce, La) passed preliminary biocompatible in vivo tests in comparison to pure titanium (Control Group), but Ti−6Al−7Nb−0.3Y alloy (Group №1) and Ti−6Al−7Nb−0.3Ce alloy (Group №3) are much more preferable for further research due to minimal and/or equivalent local inflammatory responses that proven by other researchers [1,2,3,4,5]. As for Ti−6Al−7Nb−0.3La alloy (Group №2), it had statistically significant increase of local inflammation at the one-week mark needed to further research and explanation as well, that can be indicator of toxicity of La−microdoped Ti-6Al-7Nb alloy.
Author Contributions
For research articles with several authors, a short paragraph specifying their individual contributions must be provided. The following statements should be used “Conceptualization, A.A., J.J. and A.K.; methodology, A.A. and E.K.; software, A.L.; validation, M.C and E.E..; formal analysis, J.J.; investigation, E.K. and N.K.; resources, A.A. and S.S.; data curation, N.K., M.C and E.E..; writing−original draft preparation, A.A. and M.C.; writing—review and editing, A.A, J.J., A.K and E.K..; visualization, M.C. and A.L.; supervision, A.A.; project administration, S.S.; funding acquisition, A.A. All authors have read and agreed to the published version of the manuscript.”.
Funding
This research was carried out with funds from Russian Science Foundation №24−43−02066, https://rscf.ru/project/24-43-02066/ (assessed on January 25, 2025).
Institutional Review Board Statement
The requirements of OECD Guide 1:1998 “Principles of good laboratory practice”, IDT and “Appendix А of the European Convention for the protection of Vertebrate animals used for experimental and other scientific purposes (ETS N 123). Guidelines for accommodation and care of animals (Article 5 of the Convention)”were observed when keeping the animals. ETS N 123 “European Convention for the protection of Vertebrate animals used for experimental and other scientific purposes”, NEQ. When performing experiments, the requirements of the European Convention for the Protection of Vertebrate Animals used for Experimental and other Scientific Purposes and Directive 2010/63/EU of the European Parliament and of the Council of the European Union of 22.09.2010 on the protection of animals used for scientific purposes were observed.
Informed Consent Statement
Not applicable.
Data Availability Statement
The original contributions presented in this study are included in the article. Further inquiries can be directed at the corresponding author.
Acknowledgments
The authors acknowledge support from Laboratory for New Technologies of Metallic and Ceramic Materials of IMET RAS, Laboratory for Materials Diagnostics of IMET RAS, and National Ilizarov Medical Research Centre for Traumatology and Ortopaedics.
Conflicts of Interest
The authors declare no conflicts of interest. The funders had no role in the design of the study; in the collection, analysis, or interpretation of data; in the writing of the manuscript; or in the decision to publish the results.
References
- Chen, Q.; Thouas, G.A. Metallic Implant Biomaterials. Materials Science and Engineering R: Reports 2015, 87, 1–57. [Google Scholar] [CrossRef]
- Peter, I. Investigations into Ti-Based Metallic Alloys for Biomedical Purposes. Metals (Basel) 2021, 11. [Google Scholar] [CrossRef]
- Kacsó, A.B.; Peter, I. A Review of Past Research and Some Future Perspectives Regarding Titanium Alloys in Biomedical Applications. J Funct Biomater 2025, 16. [Google Scholar] [CrossRef] [PubMed]
- Aldea, E.; Dicu, M.M.; Gleizes, A.; Demetrescu, I. The Modification of Titanium Dioxide MOCVD Coating in TiAlNb after Immersion in Artificial Saliva. 2008, Vol. 20. [Google Scholar]
- Mukanov, G.Zh.; Kuznetsov, V.P. The Effect of the Stress-Strain State during Rotary Forging on the Microstructure and Properties of the Ti–39Nb–7Zr Titanium Alloy. Diagnostics, Resource and Mechanics of materials and structures 2024, 91–106. [Google Scholar] [CrossRef]
- Willbold, E.; Gu, X.; Albert, D.; Kalla, K.; Bobe, K.; Brauneis, M.; Janning, C.; Nellesen, J.; Czayka, W.; Tillmann, W.; et al. Effect of the Addition of Low Rare Earth Elements (Lanthanum, Neodymium, Cerium) on the Biodegradation and Biocompatibility of Magnesium. Acta Biomater 2015, 11, 554–562. [Google Scholar] [CrossRef]
- Mikhlik, S.A.; Konushkin, S. V.; Volchikhina, M.A.; Kaplan, M.A.; Sergienko, K. V.; Nasakina, E.O.; Sudarchikova, M.A.; Kolmakov, A.G.; Sevostyanov, M.A. Effect of Electrolytic Plasma Polishing on Surface Morphology and Structure of Plates Made of Promising Biomedical Titanium Alloys. Inorganic Materials: Applied Research 2025, 16, 1116–1123. [Google Scholar] [CrossRef]
- Ren, Y.; Xu, J.; Wei, Y.; Liu, Y.; Zhu, J.; Liu, S. Effect of Interstitial Oxygen on the Microstructure and Mechanical Properties of Titanium Alloys: A Review. Crystals (Basel) 2025, 15. [Google Scholar] [CrossRef]
- Sergienko, K. V.; Konushkin, S. V.; Morozova, Y.A.; Gorbunov, S. V.; Kolmakov, A.G.; Sevost’yanov, M.A. Production of a Ti–(30–46) at % Zr–9 at % Nb Alloy in an Argon Arc Furnace. Russian Metallurgy (Metally) 2024, 2024, 1245–1251. [Google Scholar] [CrossRef]
- Meshalkin, V.P.; Kolmakov, A.G.; Nzioka, A.M.; Bannykh, I.O.; Sevostyanov, M.A.; Konushkin, S. V.; Kaplan, M.A.; Chistyakova, T.B. Structural Metal Alloys: Towards Environmentally Friendly Materials. Russian Chemical Reviews 2025, 94, RCR5165. [Google Scholar] [CrossRef]
- Konushkin, S. V.; Kaplan, M.A.; Baikin, A.S.; Sergienko, K. V.; Gorbenko, A.D.; Morozova, Y.A.; Mikhlik, S.A.; Rumyantsev, B.A.; Ivannikov, A.Y.; Leonova, N.P.; et al. Structure and Mechanical Properties of Ti–10Nb–(1–3)Mo Alloy Ingots. Russian Metallurgy (Metally) 2024, 2024, 1443–1450. [Google Scholar] [CrossRef]
- Sergienko, K. V.; Konushkin, S. V.; Morozova, Y.A.; Kaplan, M.A.; Gorbenko, A.D.; Rumyantsev, B.A.; Prutskov, M.E.; Baranov, E.E.; Nasakina, E.O.; Sevostyanova, T.M.; et al. Study of the Structure and Mechanical Properties of Ti-38Zr-11Nb Alloy. J Funct Biomater 2025, 16. [Google Scholar] [CrossRef]
- Kesler, M.S.; Goyel, S.; Rios, O.; Cupid, D.M.; Seifert, H.J.; Ebrahimi, F. A Study of Phase Transformation in a TiAlNb Alloy and the Effect of Cr Addition. Materials Science and Engineering: A 2010, 527, 2857–2863. [Google Scholar] [CrossRef]
- Belgibayeva, A.; Abzaev, Y.; Karakchieva, N.; Erkasov, R.; Sachkov, V.; Kurzina, I. The Structural and Phase State of the Tial System Alloyed with Rare-Earth Metals of the Controlled Composition Synthesized by the “Hydride Technology”. Metals (Basel) 2020, 10, 1–17. [Google Scholar] [CrossRef]
- Fang, H.Z.; Chen, R.R.; Chen, X.Y.; Ma, Z.K.; Ding, H.S.; Guo, J.J. Microstructure and Mechanical Properties of Ti44Al6Nb Alloys with Different Cerium Contents. Rare Metals 2020, 39, 402–407. [Google Scholar] [CrossRef]
- Yueyan Tian, R.X.B.X.K.W.G.X.Z.Y.X.X.L.Z.L.L. Influence of Scandium and Yttrium on Mechanical Properties, Corrosion Behavior, and Martensitic Transformation of near-β Titanium Alloys. Journal of Rare Earths 2025. [Google Scholar] [CrossRef]
- Strychor, R.; Williams, J.C.; Soffa, W.A. Phase Transformations and Modulated Microstructures in Ti-AI-Nb Alloys.
- Ke, Y.; Tao, J.; Duan, H. Structure Determination of Er Doped Ti-Al-Nb Alloy by Neutron Diffraction Analysis. Materials 2019, 12. [Google Scholar] [CrossRef]
- Shen, Y.; Ding, X.; Wang, F.; Tan, Y.; Yang, J.M. High Temperature Oxidation Behavior of Ti-Al-Nb Ternary Alloys. J Mater Sci 2004, 39, 6583–6589. [Google Scholar] [CrossRef]
- Digole, S.; Garg, M.; Bohara, S.; Tsai, F.-Y.; Ahsan, S.; Kothapalli, C.R.; Gwalani, B.; Young, D.; Taheri, H.; Borkar, T. Microstructure Evolution, Mechanical Properties, and Biological Response of Ti-Nb-Zr-Ta (TNZT)/HBN Metal Matrix Composites Processed via Spark Plasma Sintering (SPS). Mater Des 2025, 260, 115103. [Google Scholar] [CrossRef]
- Zhang, X.; Luo, T.; Liu, S.; Zheng, X.; Wang, F.; Ma, X.; Dang, Y. Effect of Rare Earth Yb and Ce on High Temperature Oxidation Resistance of TiAl Alloys. Fenmo Yejin Jishu/Powder Metallurgy Technology 2023, 41, 218–224. [Google Scholar] [CrossRef]
- Wu, Y.; Hwang, S.K. Microstructural Refinement and Improvement of Mechanical Properties and Oxidation Resistance in EPM TiAl-Based Intermetallics with Yttrium Addition. 2002, Vol. 50. [Google Scholar] [CrossRef]
- Kartavykh, A. V.; Asnis, E.A.; Piskun, N. V.; Statkevich, I.I.; Gorshenkov, M. V.; Tcherdyntsev, V. V. Lanthanum Hexaboride as Advanced Structural Refiner/Getter in TiAl-Based Refractory Intermetallics. J Alloys Compd 2014, 588, 122–126. [Google Scholar] [CrossRef]
- Hadi, M.; Meratian, M.; Shafyei, A. The Effect of Lanthanum on the Microstructure and High Temperature Mechanical Properties of a Beta-Solidifying TiAl Alloy. J Alloys Compd 2015, 618, 27–32. [Google Scholar] [CrossRef]
- Bartáková S., P.P., K.J., B.V., P.B., Č.P., V.J., S.J. New Titanium β-Alloys for Dental Implantology and Their Laboratory-Based Assays of Biocomatibility. Scr Med (Brno) 2009, 82, 76–82.
- Lourenço, M.L.; Cardoso, G.C.; Sousa, K. dos S.J.; Donato, T.A.G.; Pontes, F.M.L.; Grandini, C.R. Development of Novel Ti-Mo-Mn Alloys for Biomedical Applications. Sci Rep 2020, 10. [Google Scholar] [CrossRef]
- Niinomi, M.; Narushima, T.; Nakano, T. Recent Research and Development in the Processing, Microstructure, and Properties of Titanium and Its Alloy. Mater Trans 2024, 65, 1600–1611. [Google Scholar] [CrossRef]
- Legostaeva, E. V.; Eroshenko, A.Y.; Glukhov, I.A.; Sharkeev, Y.P.; Belyavskaya, O.A.; Zhilyakov, A.Y.; Kuznetsov, V.P. Ultrafine-Grained Microstructure and Thermal Properties of Titanium at Different Stages of Plastic Deformation. Russian Physics Journal 2022, 64, 1941–1948. [Google Scholar] [CrossRef]
- Illarionov, A.; Mukanov, G.; Stepanov, S.; Kuznetsov, V.; Karelin, R.; Andreev, V.; Yusupov, V.; Korelin, A. Microstructure and Physico-Mechanical Properties of Biocompatible Titanium Alloy Ti-39Nb-7Zr after Rotary Forging. Metals (Basel) 2024, 14. [Google Scholar] [CrossRef]
- Wang, W.; Yang, Y.; Wang, D.; Huang, L. Toxic Effects of Rare Earth Elements on Human Health: A Review. Toxics 2024, 12. [Google Scholar] [CrossRef]
- Malhotra, N.; Hsu, H.S.; Liang, S.T.; Roldan, M.J.M.; Lee, J.S.; Ger, T.R.; Hsiao, C. Der An Updated Review of Toxicity Effect of the Rare Earth Elements (REEs) on Aquatic Organisms. Animals 2020, 10, 1–27. [Google Scholar] [CrossRef]
- Kulaksiz, S.; Bau, M. Anthropogenic Dissolved and Colloid/Nanoparticle-Bound Samarium, Lanthanum and Gadolinium in the Rhine River and the Impending Destruction of the Natural Rare Earth Element Distribution in Rivers. Earth Planet Sci Lett 2013, 362, 43–50. [Google Scholar] [CrossRef]
- Palmer, R.J.; Butenhoff, J.L.; Stevens, J.B. Cytotoxicity of the Rare Earth Metals Cerium, Lanthanum, and Neodymium in Vitro: Comparisons with Cadmium in a Pulmonary Macrophage Primary Culture System. 1987, Vol. 43. [Google Scholar] [CrossRef] [PubMed]
- Ecotoxicity of Rare Earth Elements.
- Ozaki, T.; Matsumoto, H.; Watanabe, S.; Hanada, S. Beta Ti Alloys with Low Young’s Modulus.
- Chen, Q.; Thouas, G.A. Metallic Implant Biomaterials. Materials Science and Engineering R: Reports 2015, 87, 1–57. [Google Scholar] [CrossRef]
- ASTM F1295: 23 Standard Specification for Wrought Titanium-6 Aluminum-7 Niobium Alloy for Surgical Implant Applications (UNS R56700).
- ISO 5832-11:2024 Implants for Surgery-Metallic Materials Part 11: Wrought Titanium 6-Aluminium 7-Niobium Alloy.
- Fu, Y.; Lv, M.; Zhao, Q.; Zhang, H.; Cui, Z. Investigation on the Size and Distribution Effects of O Phase on Fracture Properties of Ti2AlNb Superalloy by Using Image-Based Crystal Plasticity Modeling. Materials Science and Engineering: A 2021, 805. [Google Scholar] [CrossRef]
- Wang, Q.; Ding, H.; Zhang, H.; Liu, S.; Chen, R.; Guo, J.; Fu, H. Growth Rates Dependence of Macro/Microstructures and Mechanical Properties of Ti-47Al-2Nb-2Cr-0.2Er Alloy Directionally Solidified by Cold Crucible. Mater Des 2017, 125, 146–157. [Google Scholar] [CrossRef]
- Nath, P.; Bhattacharjee, A.; Sen, I. Indentation Size Effect in 2nd and 3rd Generation Advanced Intermetallic TiAl Alloys: Theoretical and Experimental Estimation of Dislocation Density. J Mater Sci 2024, 59, 3066–3086. [Google Scholar] [CrossRef]
- Demir, E.; Raabe, D.; Zaafarani, N.; Zaefferer, S. Investigation of the Indentation Size Effect through the Measurement of the Geometrically Necessary Dislocations beneath Small Indents of Different Depths Using EBSD Tomography. Acta Mater 2009, 57, 559–569. [Google Scholar] [CrossRef]
- Widjaja, A.; Needleman, A.; Van Der Giessen, E. The Effect of Indenter Shape on Sub-Micron Indentation According to Discrete Dislocation Plasticity. In Proceedings of the Modelling and Simulation in Materials Science and Engineering, January 1 2007; Vol. 15. [Google Scholar]
- Voyiadjis, G.Z.; Yaghoobi, M. Review of Nanoindentation Size Effect: Experiments and Atomistic Simulation. Crystals (Basel) 2017, 7. [Google Scholar] [CrossRef]
- Li, K.M.; Liu, Y.J.; Liu, X.C.; Wu, X.; Zhou, S.F.; Zhang, L.C.; Li, W.; Zhang, W.C. Simultaneous Strength-Ductility Enhancement in as-Cast Ti6Al4V Alloy by Trace Ce. Mater Des 2022, 215. [Google Scholar] [CrossRef]
- Wheeler, D.W.; Zekonyte, J.; Wood, R.J.K. Structure and Mechanical Properties of Ce-La Alloys Containing 3-10 Wt. % La. Journal of Nuclear Materials 2021, 543. [Google Scholar] [CrossRef]
- Xu, Y.; Liu, Z.; Zhu, X.; Jiang, Z.; Chen, H.; Wang, N. Effect of Rare Earth Ce Addition on Microstructure and Mechanical Properties of Titanium Alloy Ti-6Al-4V. Mater Lett 2023, 330. [Google Scholar] [CrossRef]
- Chen, Y.-H.; Guan, S.-W.; Xing, M.; Wai-Kwok Yeung, K.; Liu, X.-Y.; Qian, W.-H.; Yin, J.-B.; Qiu, J.-J. Ce-Doped Defective Titanium Oxide Coating with Antibacterial, Antioxidant and Anti-Inflammatory Properties for Potential Application of Peri-Implantitis Treatment. [CrossRef]
- Yang, Y.F.; Luo, S.D.; Schaffer, G.B.; Qian, M. Impurity Scavenging, Microstructural Refinement and Mechanical Properties of Powder Metallurgy Titanium and Titanium Alloys by a Small Addition of Cerium Silicide. Materials Science and Engineering: A 2013, 573, 166–174. [Google Scholar] [CrossRef]
- Priyadarshini, B.; Ramya, S.; Shinyjoy, E.; Kavitha, L.; Gopi, D.; Vijayalakshmi, U. Structural, Morphological and Biological Evaluations of Cerium Incorporated Hydroxyapatite Sol-Gel Coatings on Ti-6Al-4V for Orthopaedic Applications. Journal of Materials Research and Technology 2021, 12, 1319–1338. [Google Scholar] [CrossRef]
- Pilchak, A.L.; Williams, J.C. Effect of Yttrium on the Fatigue Behavior of Investment-Cast and Wrought Ti-6Al-4V. Metall Mater Trans A Phys Metall Mater Sci 2009, 40, 2603–2615. [Google Scholar] [CrossRef]
- Poorganji, B.; Kazahari, A.; Narushima, T.; Ouchi, C.; Furuhara, T. Effect of Yttrium Addition on Grain Growth of α, β and A+β Titanium Alloys. In Proceedings of the Journal of Physics: Conference Series; Institute of Physics Publishing, 2010; Vol. 240. [Google Scholar]
- Jiaxiang Cui, M.Y.G.L.L.W.S.S.B.W.H.C.Y.X. Work-Hardening Ability Enhancement of Lightweight High Entropy Alloys via Adding Yttrium. J Alloys Compd 2024, 970.
- Wang, Q.; Zhang, K.; Qiu, D.; Niu, W. Additive Manufacturing of High-Strength Commercially Pure Titanium through Lanthanum Oxide Addition. Mater Charact 2021, 176. [Google Scholar] [CrossRef]
- Zhu, Y.; Deng, Y.; An, Y.; Liu, R.; Liu, L.; Wang, Z.; Wang, B. Effect of Rare Earth Lanthanum Addition on Microstructure and Properties of Pure Titanium. J Mater Eng Perform 2025, 34, 4669–4679. [Google Scholar] [CrossRef]
- Yuanyuan Zhu, Y.D.Y.A.K.W.R.L.L.L.Z.W.Y.X.B.W. Effect of Microalloying with Rare-Earth Lanthanum on Dynamic Recrystallization Behavior and Mechanical Properties of Ti Sheets. Mater Today Commun 2024, 39. [CrossRef]
- Wang, X.; Zhang, S.; Wang, L.; Liu, W.; Wu, Y.; Wang, L. Effect of Yttrium Addition on the Formation and Mechanical Properties of Ti-Zr-Ni-Cu Bulk Quasicrystalline Alloys. J Alloys Compd 2012, 522, 96–100. [Google Scholar] [CrossRef]
- Priyadarshini, B.; Ramya, S.; Shinyjoy, E.; Kavitha, L.; Gopi, D.; Vijayalakshmi, U. Structural, Morphological and Biological Evaluations of Cerium Incorporated Hydroxyapatite Sol-Gel Coatings on Ti-6Al-4V for Orthopaedic Applications. Journal of Materials Research and Technology 2021, 12, 1319–1338. [Google Scholar] [CrossRef]
- Mattern, N.; Yokoyama, Y.; Mizuno, A.; Han, J.H.; Fabrichnaya, O.; Richter, M.; Kohara, S. Experimental and Thermodynamic Assessment of the La-Ti and La-Zr Systems. CALPHAD 2016, 52, 8–20. [Google Scholar] [CrossRef]
- Liu, Z.G.; Chai, L.H.; Chen, Y.Y. Effect of Cooling Rate and y Element on the Microstructure of Rapidly Solidified TiAl Alloys. J Alloys Compd 2010, 504. [Google Scholar] [CrossRef]
- Weng, W.; Biesiekierski, A.; Lin, J.; Ozan, S.; Li, Y.; Wen, C. Impact of the Rare Earth Elements Scandium and Yttrium on Beta-Type Ti-24Nb-38Zr-2Mo-Base Alloys for Orthopedic Applications. Materialia (Oxf) 2020, 9. [Google Scholar] [CrossRef]
- Kazantseva, N. V.; Lepikhin, S. V. Study of the Ti-Al-Nb Phase Diagram. Physics of Metals and Metallography 2006, 102, 169–180. [Google Scholar] [CrossRef]
- Ghazisaeidi, M.; Trinkle, D.R. Interaction of Oxygen Interstitials with Lattice Faults in Ti. Acta Mater 2014, 76, 82–86. [Google Scholar] [CrossRef]
- Feng, X.; Liang, Y.; Sun, H.; Wang, S. Effect of Dislocation Slip Mechanism under the Control of Oxygen Concentration in Alpha-case on Strength and Ductility of Tc4 Alloy. Metals (Basel) 2021, 11. [Google Scholar] [CrossRef]
Figure 1.
SEM images of Ti−6Al−7Nb−0.3REE (REE – Y, La, Ce) alloys: (a) Ti−6Al−7Nb−0,3Y; (b) Ti−6Al−7Nb−0.3Ce; (с) Ti−6Al−7Nb−0.3La.
Figure 1.
SEM images of Ti−6Al−7Nb−0.3REE (REE – Y, La, Ce) alloys: (a) Ti−6Al−7Nb−0,3Y; (b) Ti−6Al−7Nb−0.3Ce; (с) Ti−6Al−7Nb−0.3La.
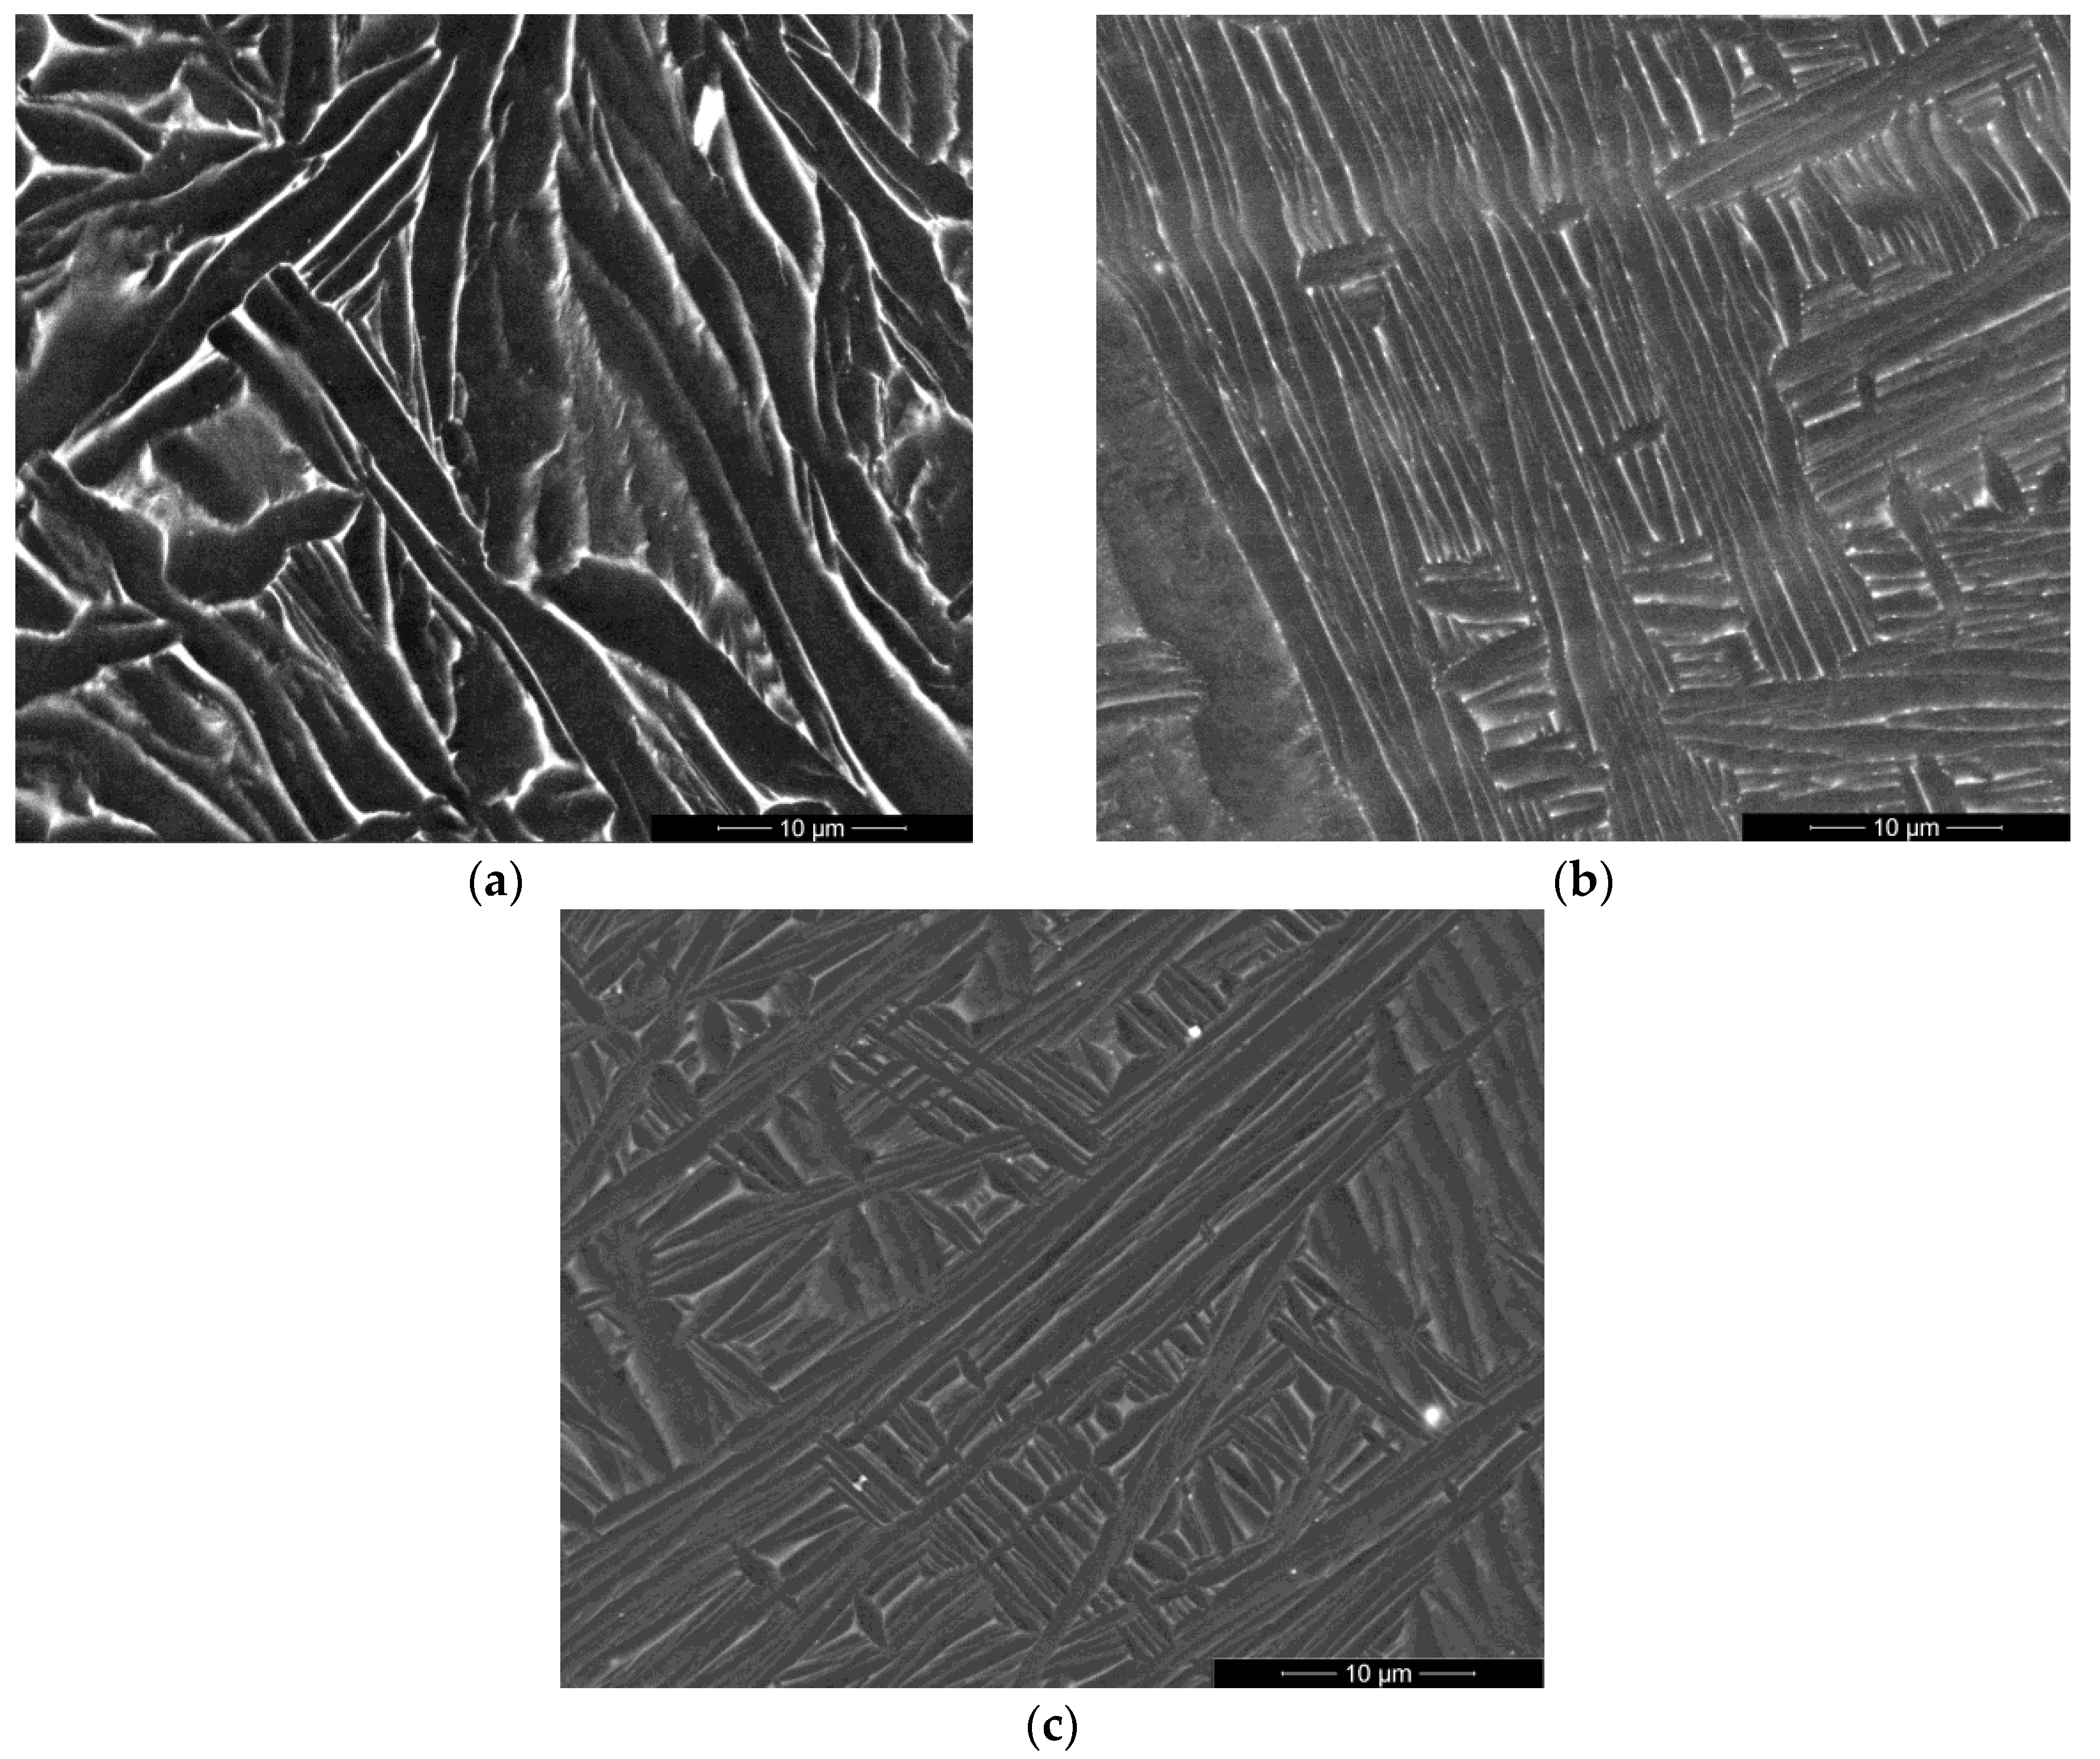
Figure 2.
SEM-images and EDS spectrum of Ti−6Al−7Nb−0.3REE (REE – Y, Ce, La) alloys: (a) EDS analysis areas and points and (b) EDS spectrum of selected areas of Ti−6Al−7Nb−0.3Y alloy, (c) EDS analysis areas and points and (d) EDS spectrum of selected areas of Ti6Al7Nb0.3Ce alloy, (e) EDS areas and analysis points and (f) EDS spectrum selected areas of Ti−6Al−7Nb−0,3La alloy.
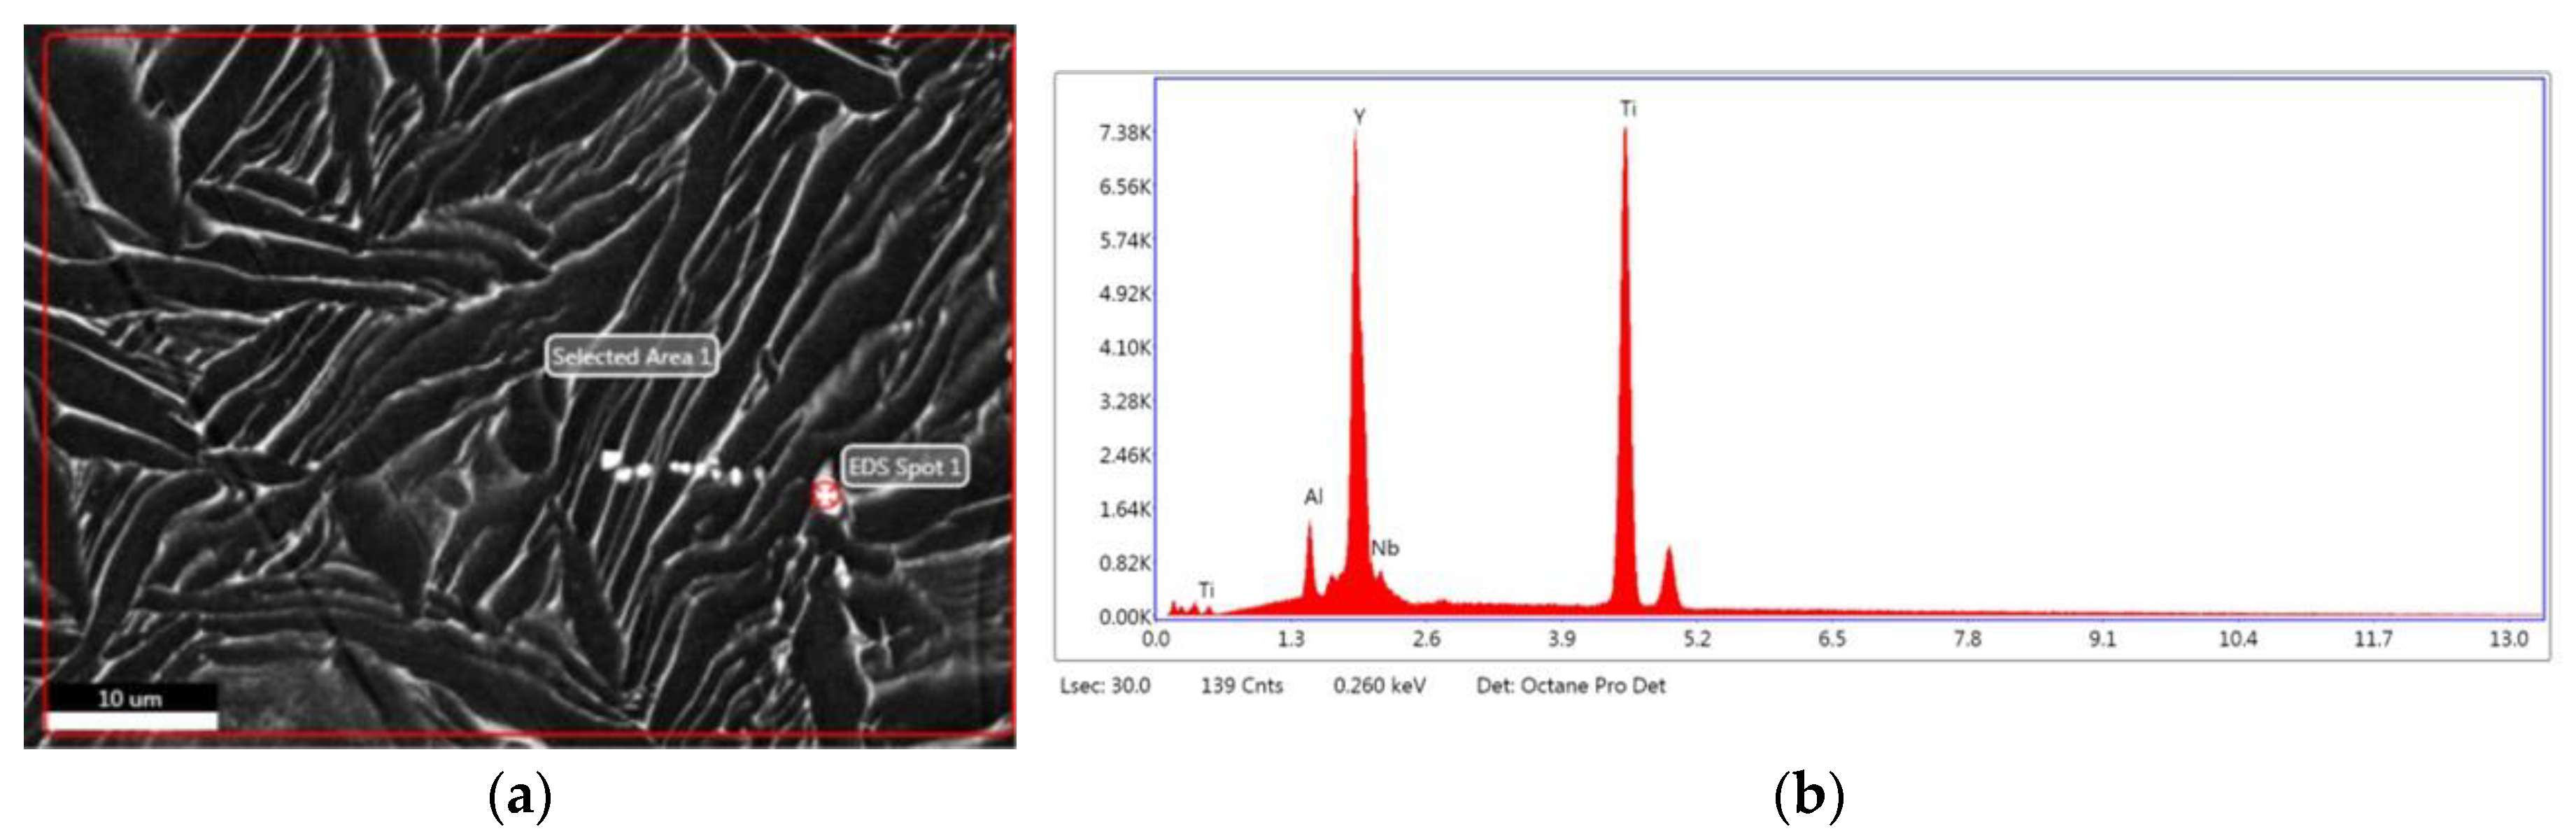
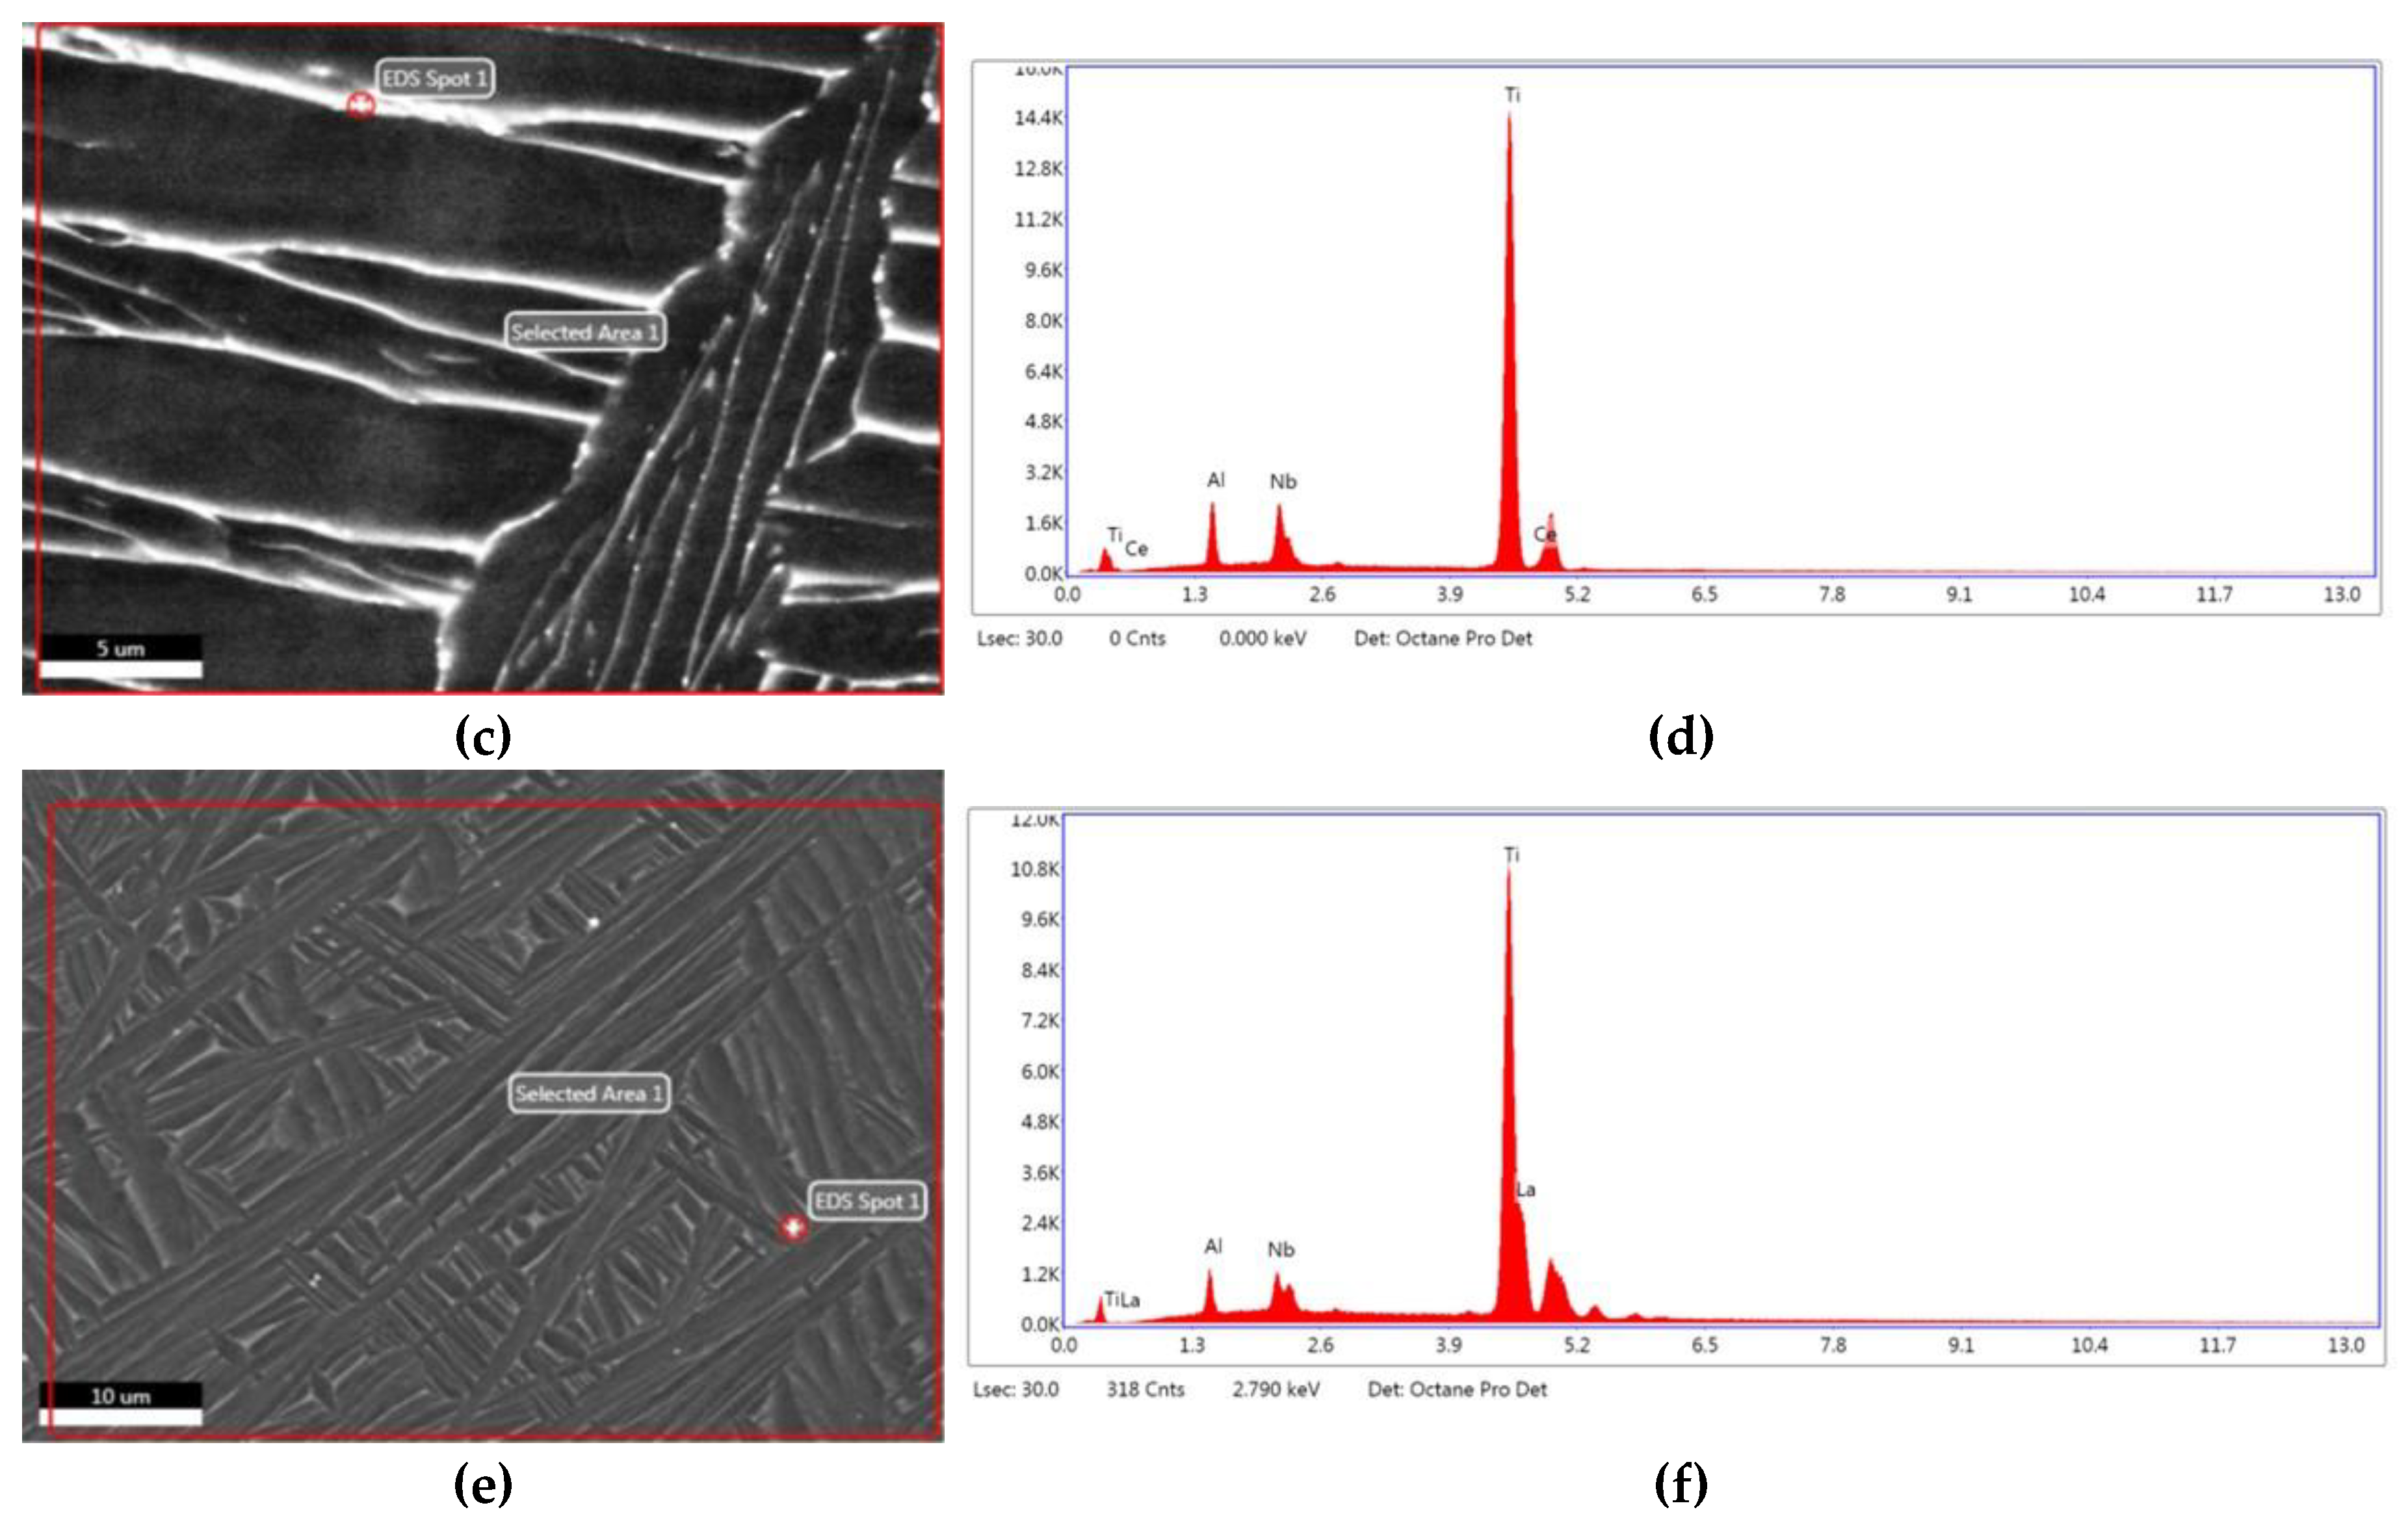
Figure 3.
XRD analysis of Ti−6Al−7Nb−0,3REE (REE – Y, Ce, La) alloys.
Figure 4.
Microhardness of Ti−6Al−7Nb−0.3REE (REE – Y, Ce, La) alloys under different load on indentor.
Figure 4.
Microhardness of Ti−6Al−7Nb−0.3REE (REE – Y, Ce, La) alloys under different load on indentor.
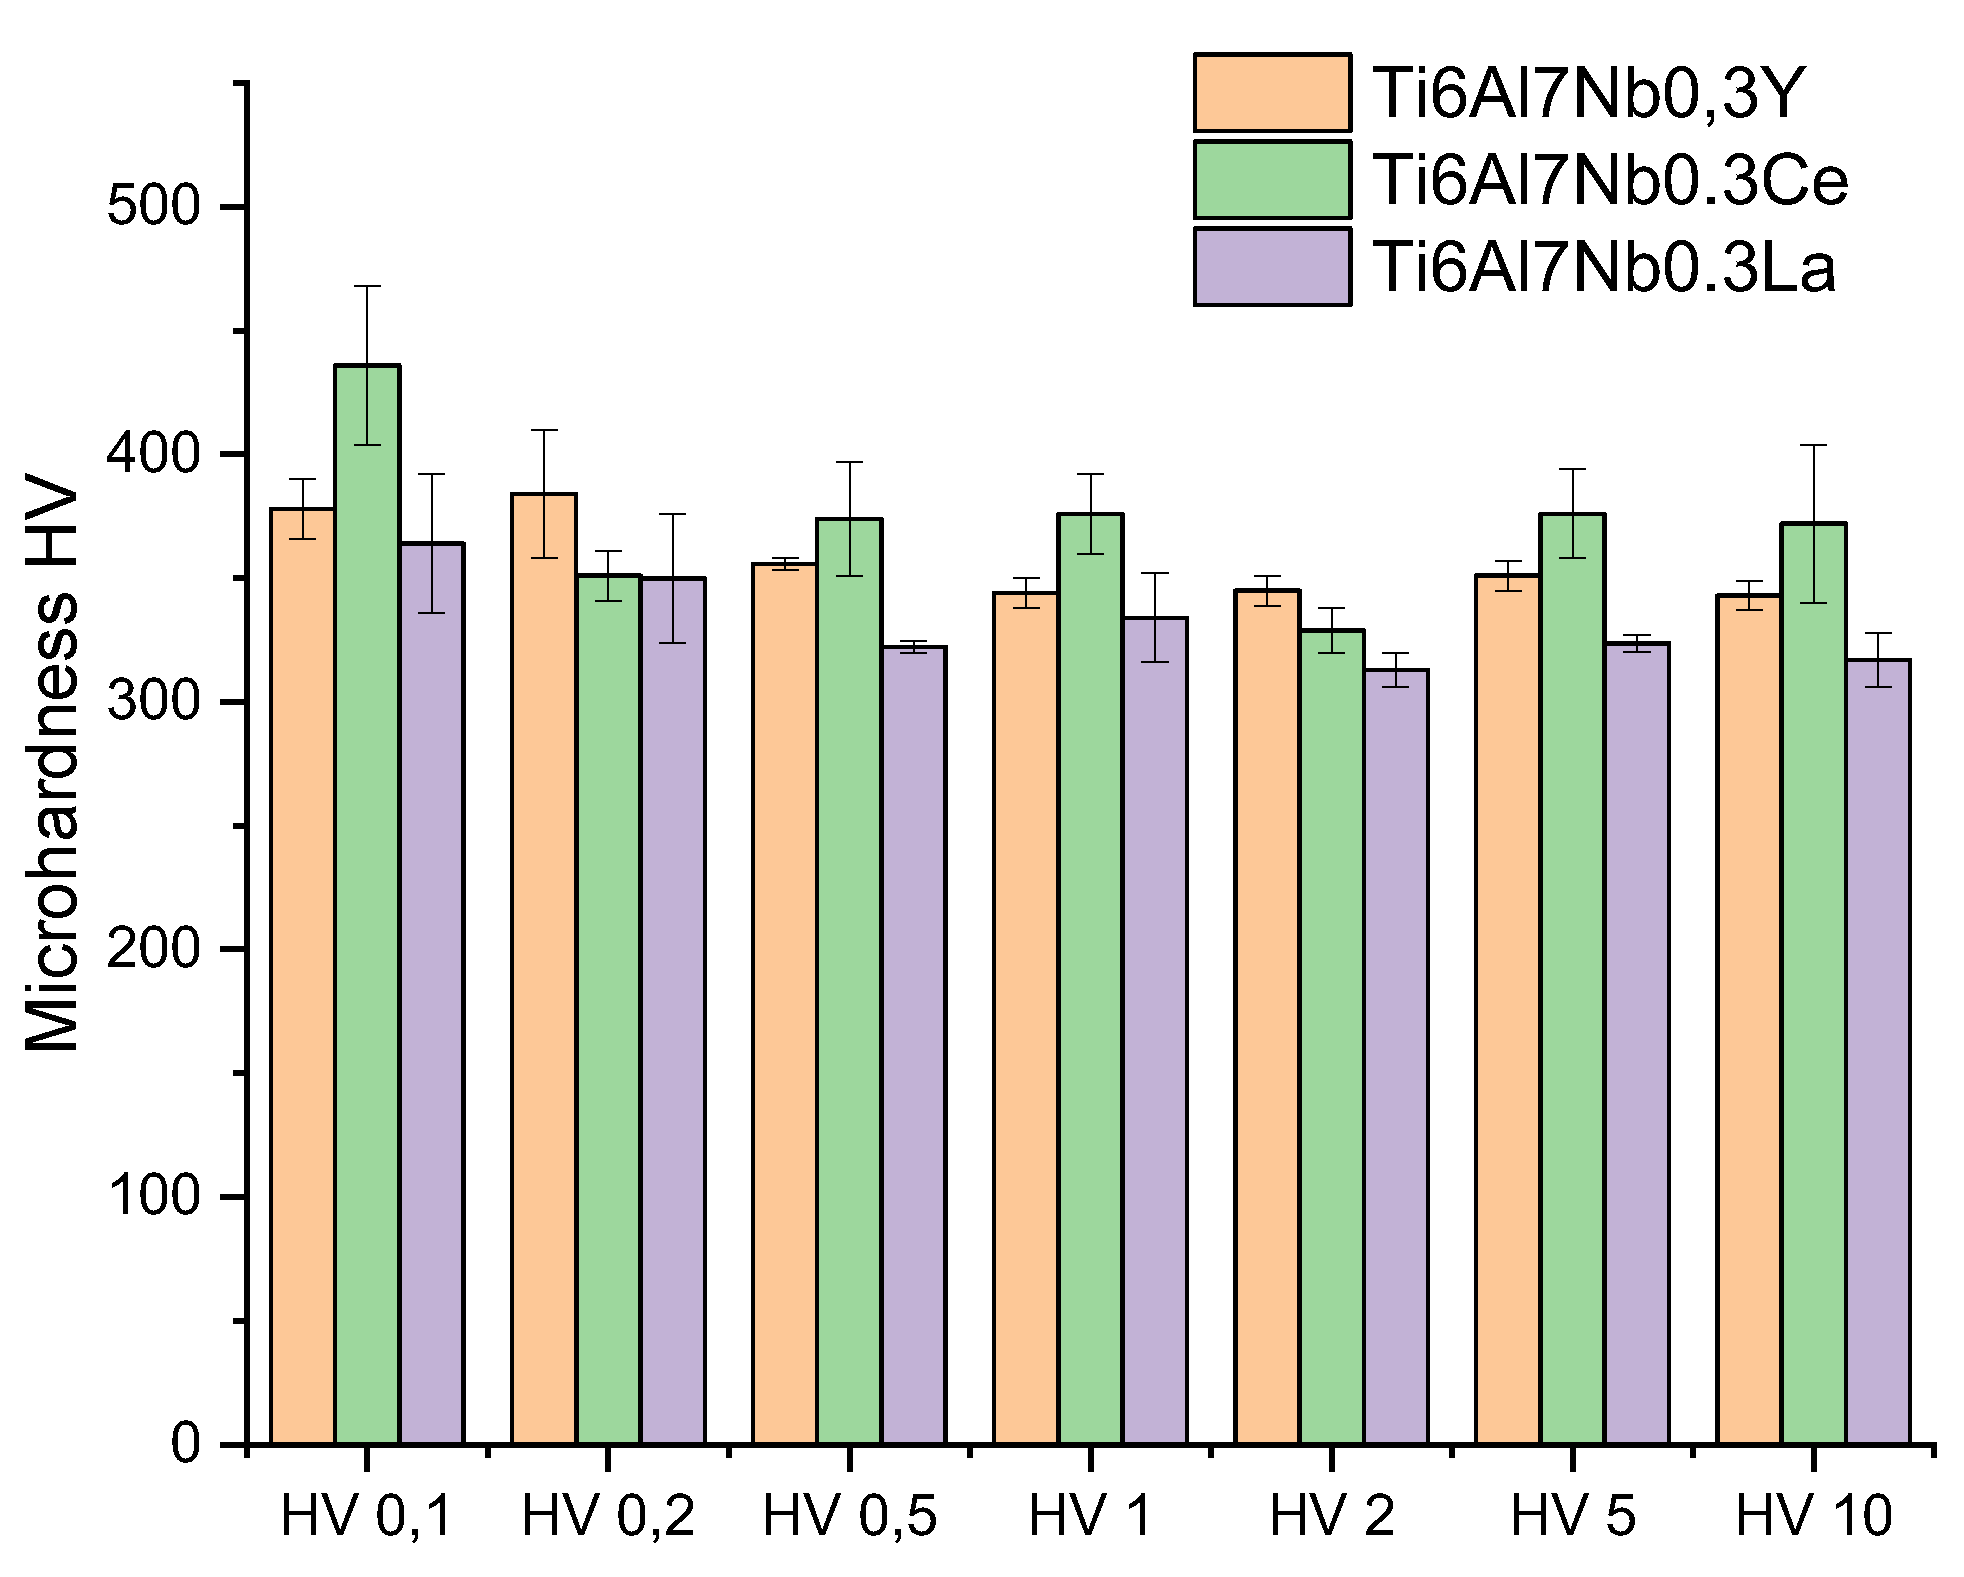
Figure 5.
(a) nanohardness of Ti−6Al−7Nb−0.3REE (REE – Y, Ce, La) alloys under different loads on Berkovich’s indentor − 20 mN, 100 mN and 500 mN; (b) elastic modules of Ti−6Al−7Nb−0.3REE (REE – Y, Ce, La) alloys under different loads on Berkovich’s indentor − 20 mN, 100 mN and 500 mN; (c) the proportionality of the elastic deformation during indentation of the Ti6Al7Nb0.3REE (REE – Ce, La, Y) under different loads on Berkovich’s indentor − 20 mN, 100 mN and 500 mN.
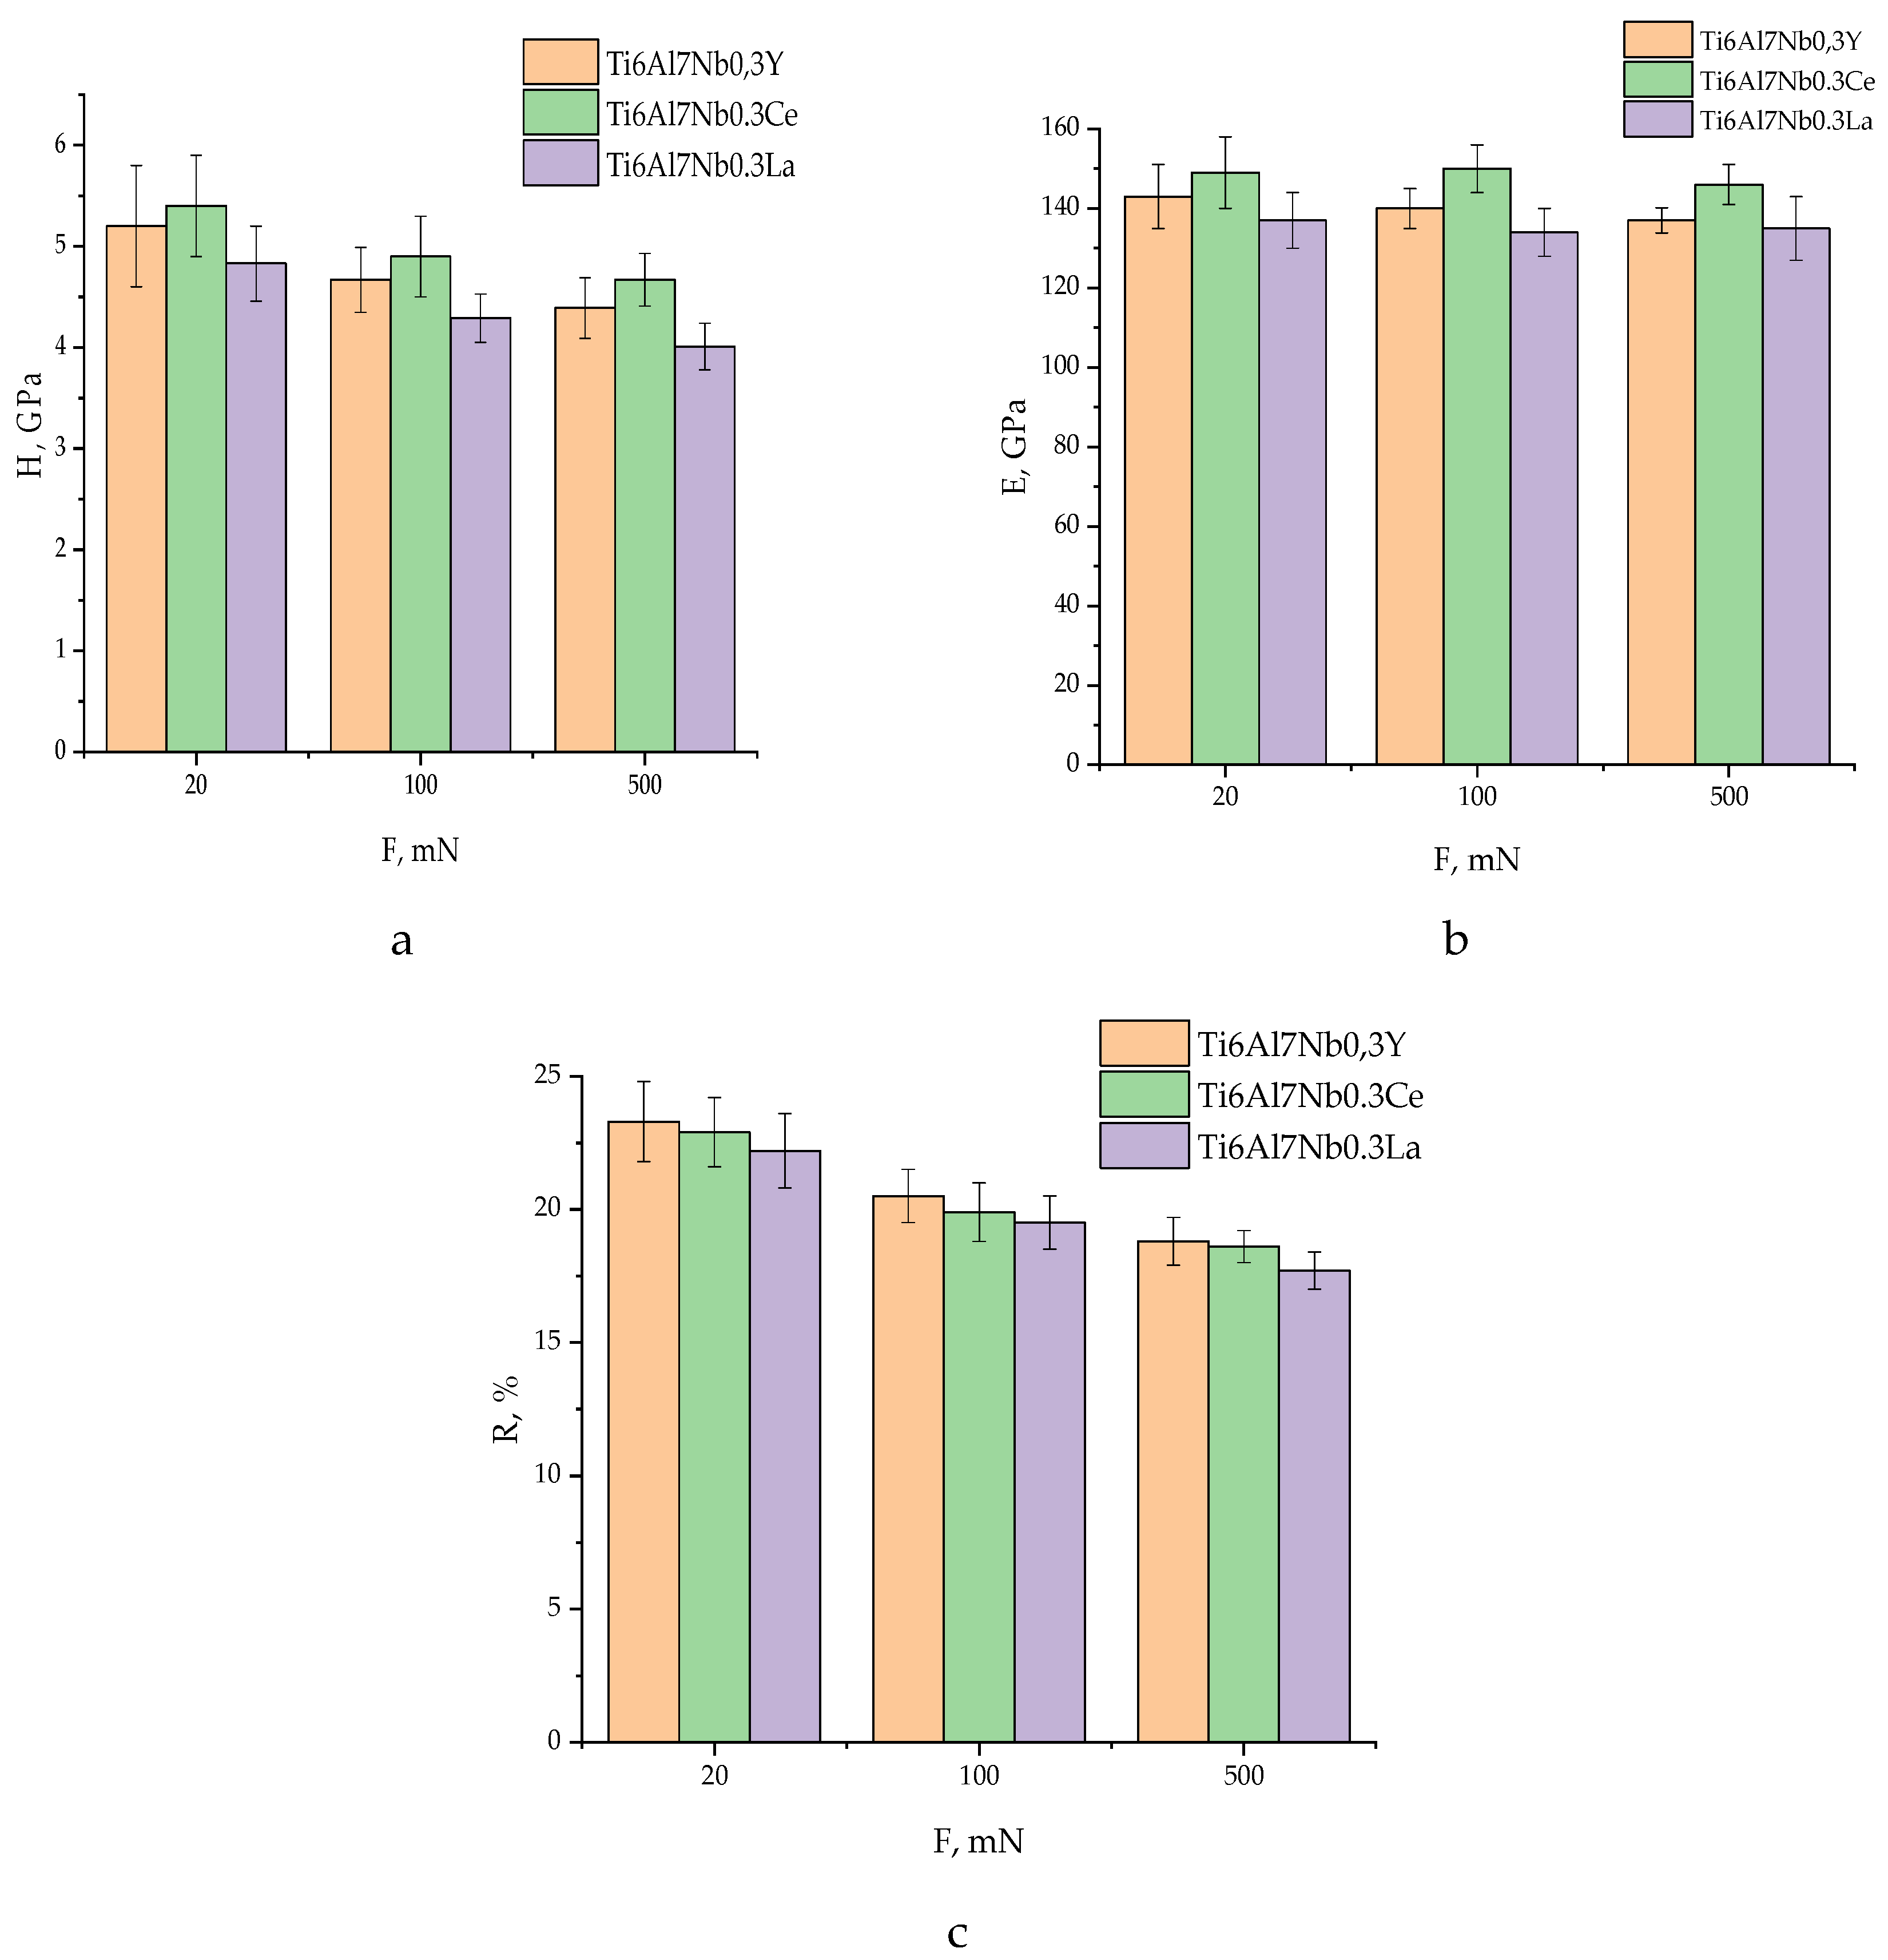
Table 1.
Concentration causing death of 50% of test organisms of rare earth metals[31].
Table 1.
Concentration causing death of 50% of test organisms of rare earth metals[31].
| Element | Toxicity LC50 (mg/L) |
| Yttrium (Y) | 27.6 |
| Lanthanum (La) | 62.7 |
| Cerium (Ce) | 25.6 |
| Neodymium (Nd) | 47.6 |
| Gadolinium (Ga) | 58.2 |
| Terbium (Tb) | 11.4 |
Table 3.
X-ray elemental analysis of Ti−6Al−7Nb−0.3REE (REE – Y, Ce, La) alloys.
| Element, wt. % | Ti−6Al−7Nb−0.3Y | Ti−6Al−7Nb−0.3Ce | Ti−6Al−7Nb−0.3La |
| Titanium (Ti) | 87.61 | 86.6 | 85.1 |
| Aluminium (Al) | 6.23 | 6.72 | 7.67 |
| Niobium (Nb) | 5.79 | 5.52 | 6.06 |
| Iron (Fe) | - | 0.296 | 0.34 |
| Vanadium (V) | 0.195 | 0.215 | 0.134 |
| Chromium (Cr) | - | 0.202 | 0.23 |
| Cerium (Ce) | 973PPM | 0.250 | - |
| Yttrium (Y) | 0.114 | - | - |
| Lanthanum (La) | - | - | 0.287 |
Table 4.
Ti−6Al−7Nb−0.3REE (REE – Y, Ce, La) analysis of oxygen (O), nitrogen (N), and hydrogen (H) by reduction melting and analysis of sulfur (S) and carbon (C) by oxidative melting of alloys.
Table 4.
Ti−6Al−7Nb−0.3REE (REE – Y, Ce, La) analysis of oxygen (O), nitrogen (N), and hydrogen (H) by reduction melting and analysis of sulfur (S) and carbon (C) by oxidative melting of alloys.
| Sample | Oxygen, wt. % | Nitrogen, wt. % | Hydrogen, wt. % | Carbon, wt. % | Sulphur, wt. % | |
| Ti−6Al−7Nb−0.3Y | Average | 0.35 | 0.14 | 0.011 | 0.019 | 0.0061 |
| Sd | 0.02 | 0.01 | 0.001 | 0.001 | 0.0005 | |
| Ti−6Al−7Nb−0.3Ce | Average | 0.18 | 0.077 | 0.010 | 0.023 | 0.0061 |
| Sd | 0.02 | 0.004 | 0.002 | 0.001 | 0.0005 | |
| Ti−6Al−7Nb−0.3La | Average | 0.25 | 0.028 | 0.010 | 0.029 | 0.0080 |
| Sd | 0.02 | 0.005 | 0.002 | 0.001 | 0.0005 | |
Table 5.
Ti-6Al-7Nb-0.3REE (REE – Y, Ce, La) intensity of the XRD peaks of certain planes.
| Crystal orientation | Ti−6Al−7Nb−0.3Y | Ti−6Al−7Nb−0.3Ce | Ti−6Al−7Nb−0.3La |
| α – Ti | |||
| 100 | + | + | + |
| 002 | + | + | + |
| 101 | + | + | + |
| 102 | + | + | + |
| 110 | + | + | + |
| 103 | + | + | + |
| 200 | + | + | + |
| 112 | + | + | + |
| 201 | + | + | + |
| β – Ti | |||
| 110 | - | + | + |
| 200 | - | + | + |
| 211 | - | + | + |
Table 6.
Crystal lattice parameters of Ti−6Al−7Nb−0.3REE (REE – Y, Ce, La) alloys and ICSD data for α–Ti 01−089−3073 and β–Ti 01−089−4913.
Table 6.
Crystal lattice parameters of Ti−6Al−7Nb−0.3REE (REE – Y, Ce, La) alloys and ICSD data for α–Ti 01−089−3073 and β–Ti 01−089−4913.
| Phase name | a, A | c, A | D, nm | V, A3 | ∆V, % |
| α – Ti−6Al−7Nb−0.3Y | 2.943 | 4.697 | 22.32 | 183.798 | 0.269 |
| α – Ti−6Al−7Nb−0.3Ce | 2.925 | 4.683 | 30.77 | 180.290 | 1.799 |
| α – Ti−6Al−7Nb−0.3La | 2.941 | 4.688 | 29.83 | 182.502 | 0.595 |
| β – Ti−6Al−7Nb−0.3Ce | 3.279 | - | 23.34 | 35.266 | 0.334 |
| β – Ti−6Al−7Nb−0.3La | 3.290 | - | 25.61 | 35.622 | -0.670 |
| α – Ti №01−089−3073 ICSD | 2.951 | 4.685 | - | 183.594 | - |
| β – Ti №01-089-4913 ICSD | 3.283 | - | - | 35.384 | - |
Table 7.
True density of Ti-6Al-7Nb-0.3REE (REE – Y, Ce, La) alloys.
| Alloy composition | True density, g/cm3 | Std.Dev. |
| Ti−6Al−7Nb−0.3Y | 4.4563 | ± 0.1075 |
| Ti−6Al−7Nb−0.3Ce | 4.7255 | ± 0.2853 |
| Ti−6Al−7Nb−0.3La | 4.8019 | ± 0.0111 |
Table 8.
Microindentation results of Ti−6Al−7Nb−0.3REE (REE – Y, Ce, La) alloys.
| Alloy composition | HV 0.1 | HV 0.2 | HV 0.5 | HV 1 | HV 2 | HV 5 | HV 10 |
| Ti−6Al−7Nb−0.3Y | 378 ± 12 | 384 ± 26 | 355,7 ± 2,3 | 344 ± 6 | 345 ± 6 | 351 ± 6 | 343 ± 6 |
| Ti−6Al−7Nb−0.3Ce | 436 ± 32 | 351 ± 10 | 374 ± 23 | 376 ± 16 | 329 ± 9 | 376 ± 18 | 372 ± 32 |
| Ti−6Al−7Nb−0.3La | 364 ± 28 | 350 ± 26 | 322,3 ± 2,3 | 334 ± 18 | 313 ± 7 | 323,7 ± 3,5 | 317 ± 11 |
Table 9.
Nanoindentation results for Ti−6Al−7Nb−0.3REE (REE – Y, Ce, La) alloys: maximum depth, hardness (H), elastic modulus (E) and elastic recovery (R).
Table 9.
Nanoindentation results for Ti−6Al−7Nb−0.3REE (REE – Y, Ce, La) alloys: maximum depth, hardness (H), elastic modulus (E) and elastic recovery (R).
| Alloy composition | Load F, mN | Depth, h (nm) | Hardness, H (GPa) | Elastic Modulus, E (GPa) | Elastic Recovery, R (%) |
| Ti−6Al−7Nb−0.3Y | 20 | 406 ± 20 | 5.20 ± 0,6 | 143 ± 8 | 23.3 ± 1,5 |
| 100 | 998 ± 31 | 4.67 ± 0,32 | 140 ± 5 | 20.5 ± 1,0 | |
| 500 | 2339 ± 67 | 4.39 ± 0,30 | 137 ± 3,2 | 18.8 ± 0,9 | |
| Ti−6Al−7Nb−0.3Ce | 20 | 401 ± 19 | 5.40 ± 0,5 | 149 ± 9 | 22.9 ± 1,3 |
| 100 | 974 ± 37 | 4.90 ± 0,4 | 150 ± 6 | 19.9 ± 1,1 | |
| 500 | 2266 ± 60 | 4.67 ± 0,26 | 146 ± 5 | 18.6 ± 0,6 | |
| Ti−6Al−7Nb−0.3La | 20 | 422 ± 15 | 4.83 ± 0,37 | 137 ± 7 | 22.2 ± 1,4 |
| 100 | 1037 ± 27 | 4.29 ± 0,24 | 134 ± 6 | 19.5 ± 1,0 | |
| 500 | 2429 ± 64 | 4.01 ± 0,23 | 135 ± 8 | 17.7 ± 0,7 |
Table 10.
Control of rats’ body weight during the in vivo experiment after skin implantation of Pure Titanium and Ti-6Al-7Nb-0.3 RE (RE – Ce, La, Y) samples. Control group – Pure Titanium, Group 1 – Ti-6Al-7Nb-0.3Y alloy, Group 2 – Ti-6Al-7Nb-0.3La alloy, Group 3 – Ti-6Al-7Nb-0.3Ce alloy.
Table 10.
Control of rats’ body weight during the in vivo experiment after skin implantation of Pure Titanium and Ti-6Al-7Nb-0.3 RE (RE – Ce, La, Y) samples. Control group – Pure Titanium, Group 1 – Ti-6Al-7Nb-0.3Y alloy, Group 2 – Ti-6Al-7Nb-0.3La alloy, Group 3 – Ti-6Al-7Nb-0.3Ce alloy.
| Group name | Parameter | In vivo experiment stages | ||||
| 0 days | 7 days | 14 days | 21 days | 28 days | ||
| Control group Ti |
Me | 412 | 404 | 393 | 394 | 398 |
| (Q1-Q3) | 390 - 434 | 388 - 439 | 378 - 439 | 382 - 452 | 386 - 398 | |
| Group 1 Ti–6Al–7Nb–0.3Y |
Me | 440 | 435.5 | 440 | 429 | 424 |
| (Q1-Q3) | 417 - 461 | 426 - 479 | 411 - 427 | 409 - 435,5 | 410 - 434 | |
| Group 2 Ti–6Al–7Nb–0.3La |
Me | 523 | 528 | 542 | 560 | 556 |
| (Q1-Q3) | 446 - 574 | 348 - 540 | 496 - 558 | 514 - 584 | 526 - 574 | |
| Group 3 Ti–6Al–7Nb–0.3Ce |
Me | 552 | 565 | 564 | 577 | 560 |
| (Q1-Q3) | 507 - 591 | 485 - 582 | 499 - 584 | 502 - 588 | 510 - 592 | |
Table 11.
Control of the body temperature of rats during the in vivo experiment after skin implantation of pure titanium and Ti−6Al−7Nb−0.3 REE (REE – Y, Ce, La) samples. Control Group Pure Titanium, Group №1 Ti−6Al−7Nb−0.3Y, Group №2 Ti−6Al−7Nb−0.3La, Group №3 Ti−6Al−7Nb−0.3Ce.
Table 11.
Control of the body temperature of rats during the in vivo experiment after skin implantation of pure titanium and Ti−6Al−7Nb−0.3 REE (REE – Y, Ce, La) samples. Control Group Pure Titanium, Group №1 Ti−6Al−7Nb−0.3Y, Group №2 Ti−6Al−7Nb−0.3La, Group №3 Ti−6Al−7Nb−0.3Ce.
| Group name | Parameter | In vivo experiment stages | ||||
| 0 days | 7 days | 14 days | 21 days | 28 days | ||
| Control group Ti |
Me | 37.3* | 36.35* | 36.65* | 36.5* | 36.2* |
| (Q1-Q3) | 37.2 - 37.6 | 36.3 - 36.7 | 36.2 - 37 | 36.3 - 36.5 | 35.8-36.2 | |
| Group 1 Ti–6Al–7Nb–0.3Y |
Me | 37.1* | 36.35* | 36.4* | 36.3* | 36.5* |
| (Q1-Q3) | 36.65 - 37.55 | 36.15 - 36.65 | 36.2 - 36.35 | 36.05 - 36.35 | 36.1 - 36.5 | |
| Group 2 Ti–6Al–7Nb–0.3La |
Me | 37.7* | 36.65* | 36.5* | 36.65* | 36.8* |
| (Q1-Q3) | 37.55 - 37.95 | 36.4 - 36.75 | 36.4 - 36.5 | 36.4 - 36.9 | 36.6 - 37 | |
| Group 3 Ti–6Al–7Nb–0.3Ce |
Me | 37.2* | 36.6* | 36.5* | 36.6* | 36.7* |
| (Q1-Q3) | 37.1-37.35 | 36.45-36.8 | 36.25-36.95 | 36.4-36.8 | 36.5-36.8 | |
Notes: * - differences with preoperative (duration of 0 days) values at p<0.05.
Table 12.
Control of local body temperature of animals during the in vivo experiment after skin implantation of Pure Titanium and Ti−6Al−7Nb−0.3 REE (REE – Ce, La, Y) samples. Control group Pure Titanium, Group №1 Ti−6Al−7Nb−0.3Y, Group №2 Ti−6Al−7Nb−0.3La, Group №3 Ti−6Al−7Nb−0.3Ce.
Table 12.
Control of local body temperature of animals during the in vivo experiment after skin implantation of Pure Titanium and Ti−6Al−7Nb−0.3 REE (REE – Ce, La, Y) samples. Control group Pure Titanium, Group №1 Ti−6Al−7Nb−0.3Y, Group №2 Ti−6Al−7Nb−0.3La, Group №3 Ti−6Al−7Nb−0.3Ce.
| Group name | Parameter | In vivo experiment stages | ||||
| 0 days | 7 days | 14 days | 21 days | 28 days | ||
| Control group Pure Titanium |
Me | 34.1*/91.42 | 32.5 / 89.4 | 32 */ 97.31 | 33* / 90.41 | 32.5 */ 89.78 |
| (Q1-Q3) | 34-34.3 | 32.1-32.9 | 31.2-32 | 32-33 | 31.8-32.5 | |
| Group №1 Ti–6Al–7Nb–0.3Y |
Me | 33.75/90.97 | 32.1*/88.31 | 32.6*/89.56 | 32.1*/88.43 | 32.8*/ 89.86 |
| (Q1-Q3) | 33.05 − 34.2 | 31.35-33.1 | 32.15-32.4 | 31.65-32.1 | 32.1-32.8 | |
| Group №2 Ti–6Al–7Nb–0.3La |
Me | 34.95 / 92.7 | 34.2 / 93.31 | 32.0*/ 7.67 | 32.5*/88.68 | 33.0*/ 89.67 |
| (Q1-Q3) | 34.05 - 35 | 33.55 - 34.85 | 31 - 32.8 | 32 - 33.8 | 32.2 - 33.2 | |
| Group №3 Ti–6Al–7Nb–0.3Ce |
Me | 34.0/91.40 | 33.3/90.98 | 32.55*/89.18 | 32.9*/89.89 | 32.7*/89.1 |
| (Q1-Q3) | 33.8 - 34.2 | 32.3 - 34.1 | 32.05 - 33.3 | 31.95 - 33.1 | 31.55 - 33.45 | |
Notes 1 * - differences with preoperative (duration of 0 days) values at p<0.05. 2 bold font - differences in the indicator with the control, main 1 and main 3 groups at p<0.05.
Disclaimer/Publisher’s Note: The statements, opinions and data contained in all publications are solely those of the individual author(s) and contributor(s) and not of MDPI and/or the editor(s). MDPI and/or the editor(s) disclaim responsibility for any injury to people or property resulting from any ideas, methods, instructions or products referred to in the content. |
© 2025 by the authors. Licensee MDPI, Basel, Switzerland. This article is an open access article distributed under the terms and conditions of the Creative Commons Attribution (CC BY) license (http://creativecommons.org/licenses/by/4.0/).
Copyright: This open access article is published under a Creative Commons CC BY 4.0 license, which permit the free download, distribution, and reuse, provided that the author and preprint are cited in any reuse.


