
Submitted:
09 December 2025
Posted:
10 December 2025
You are already at the latest version
Abstract
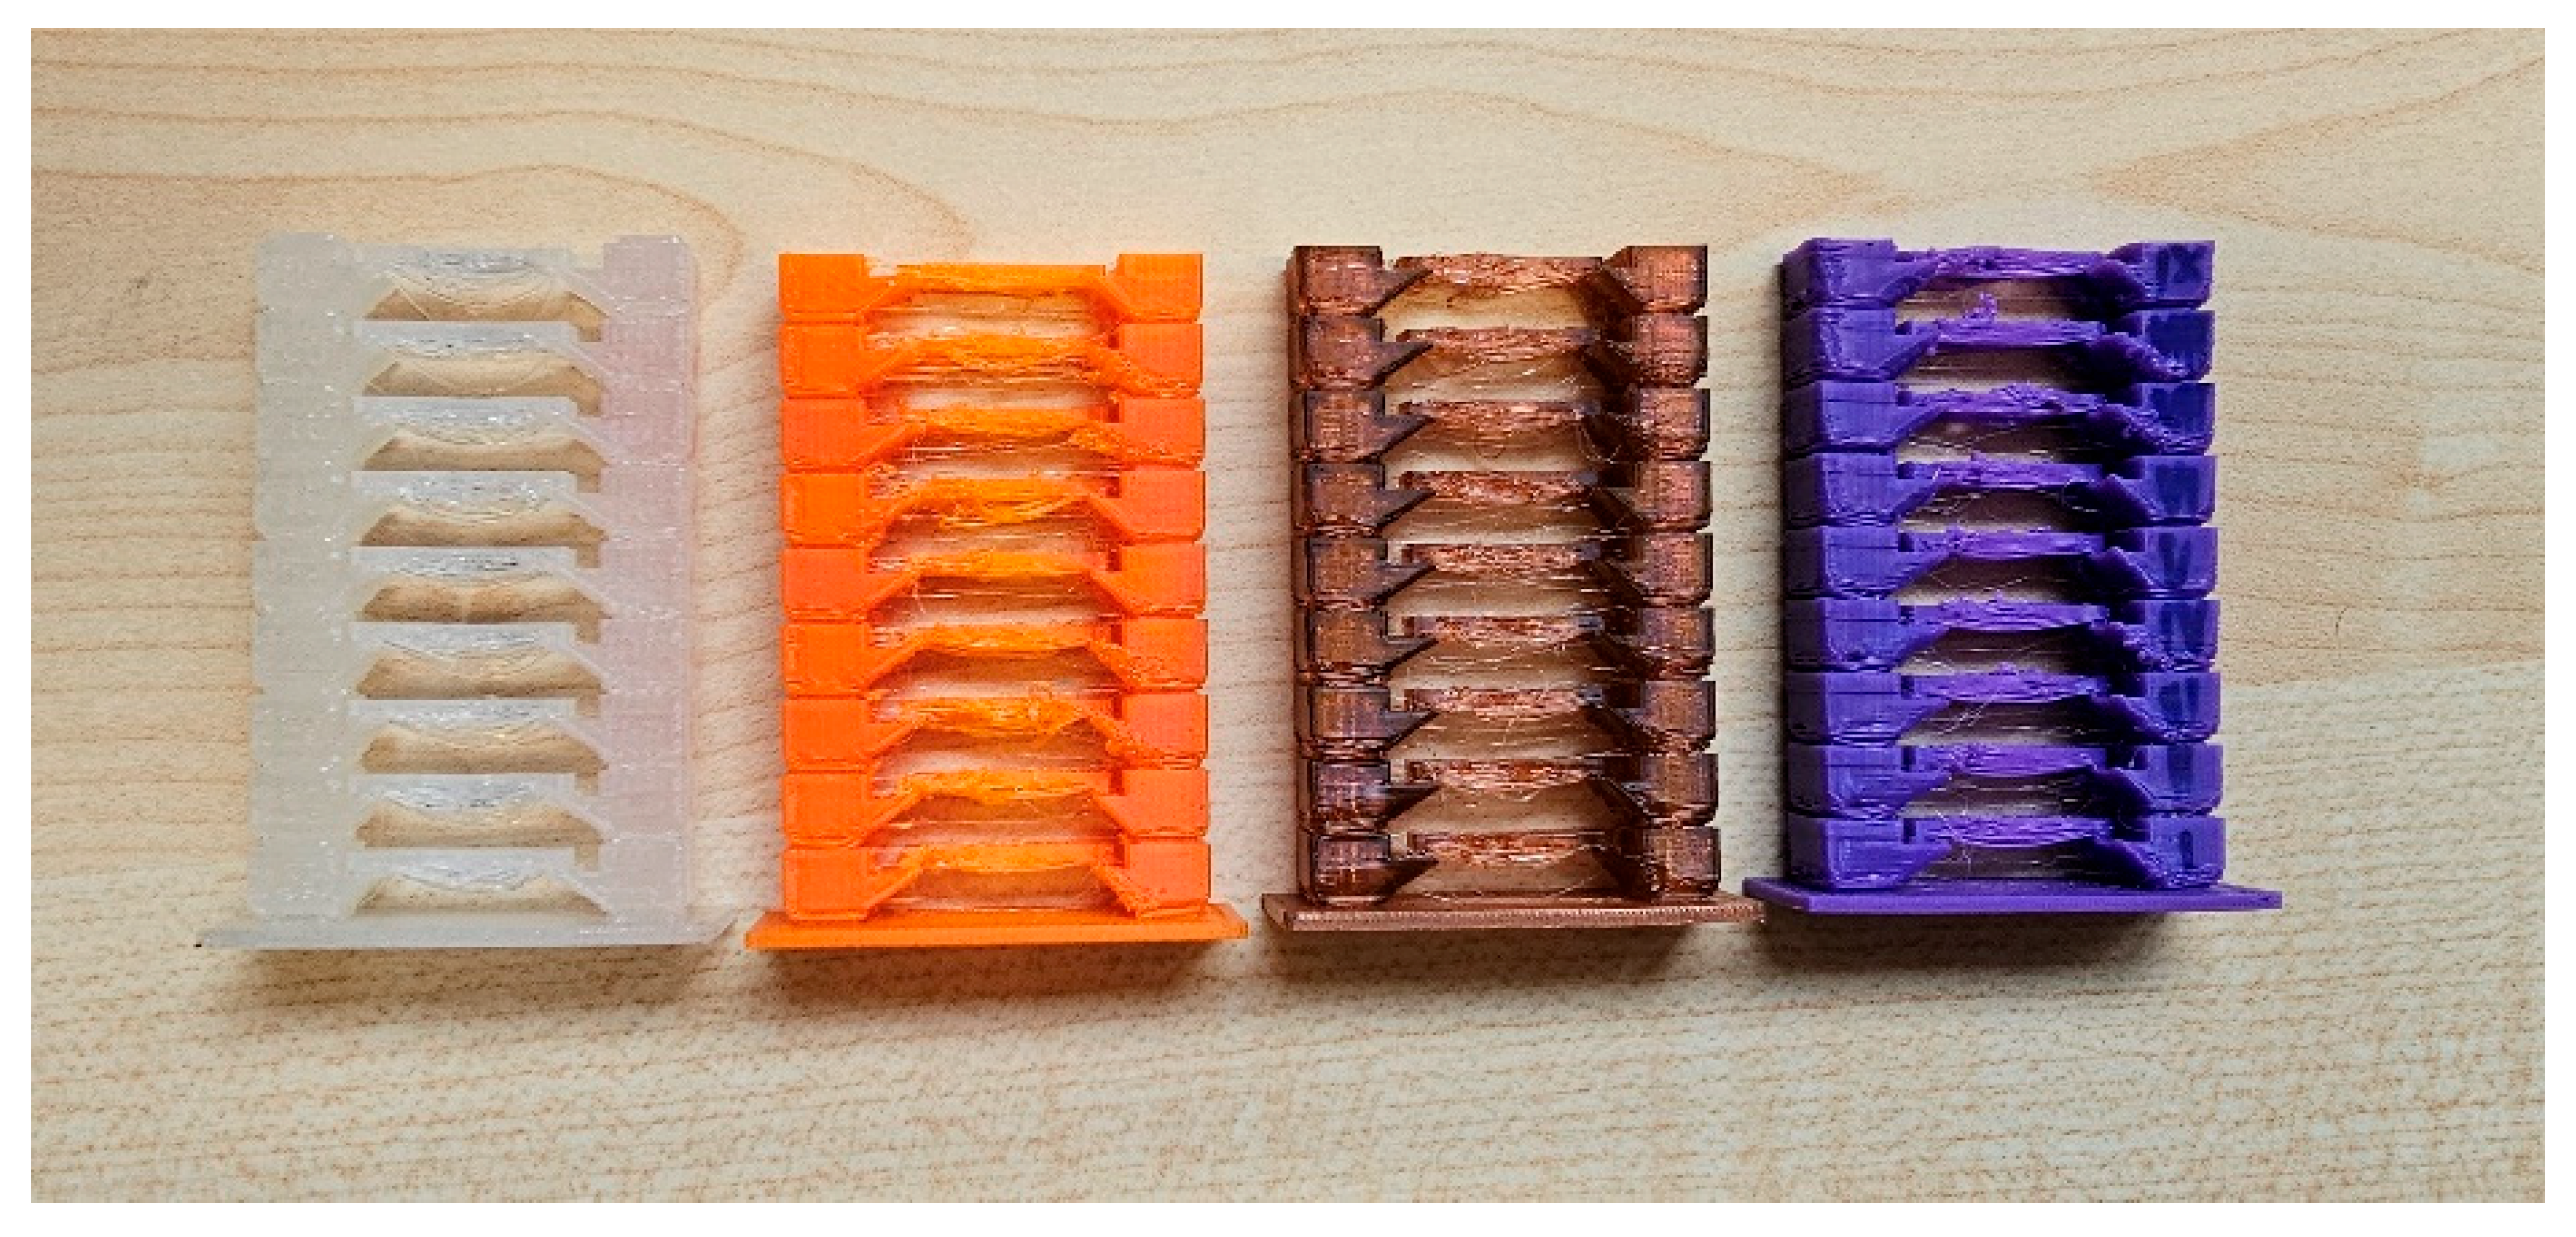
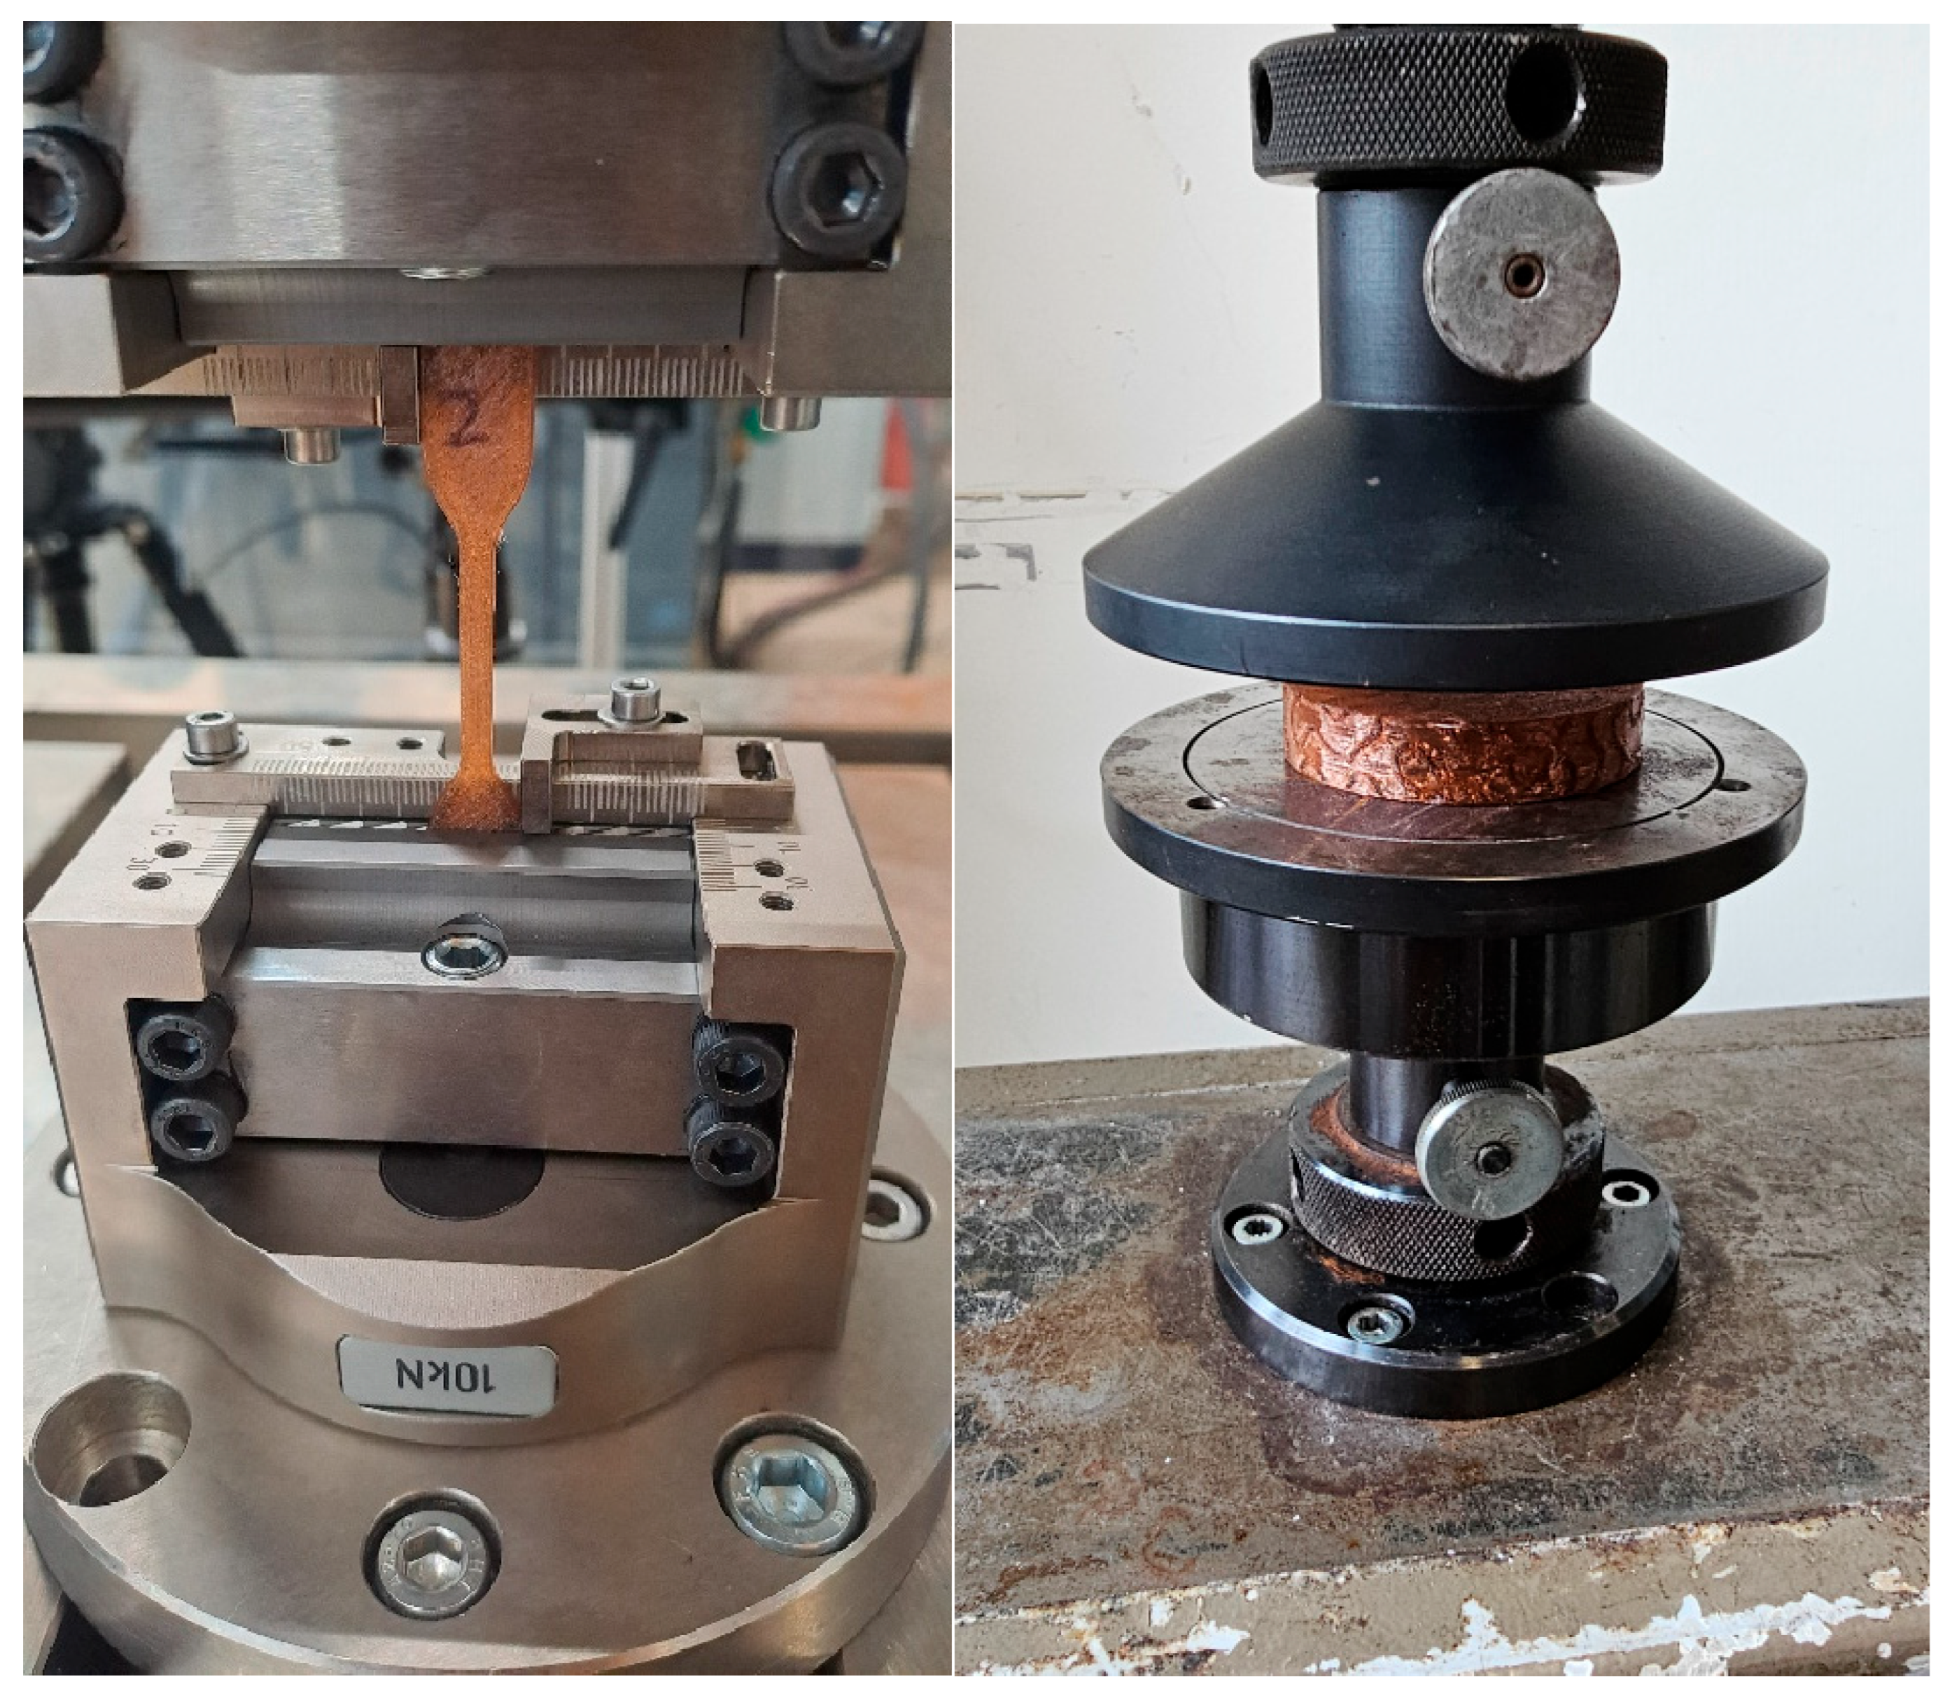
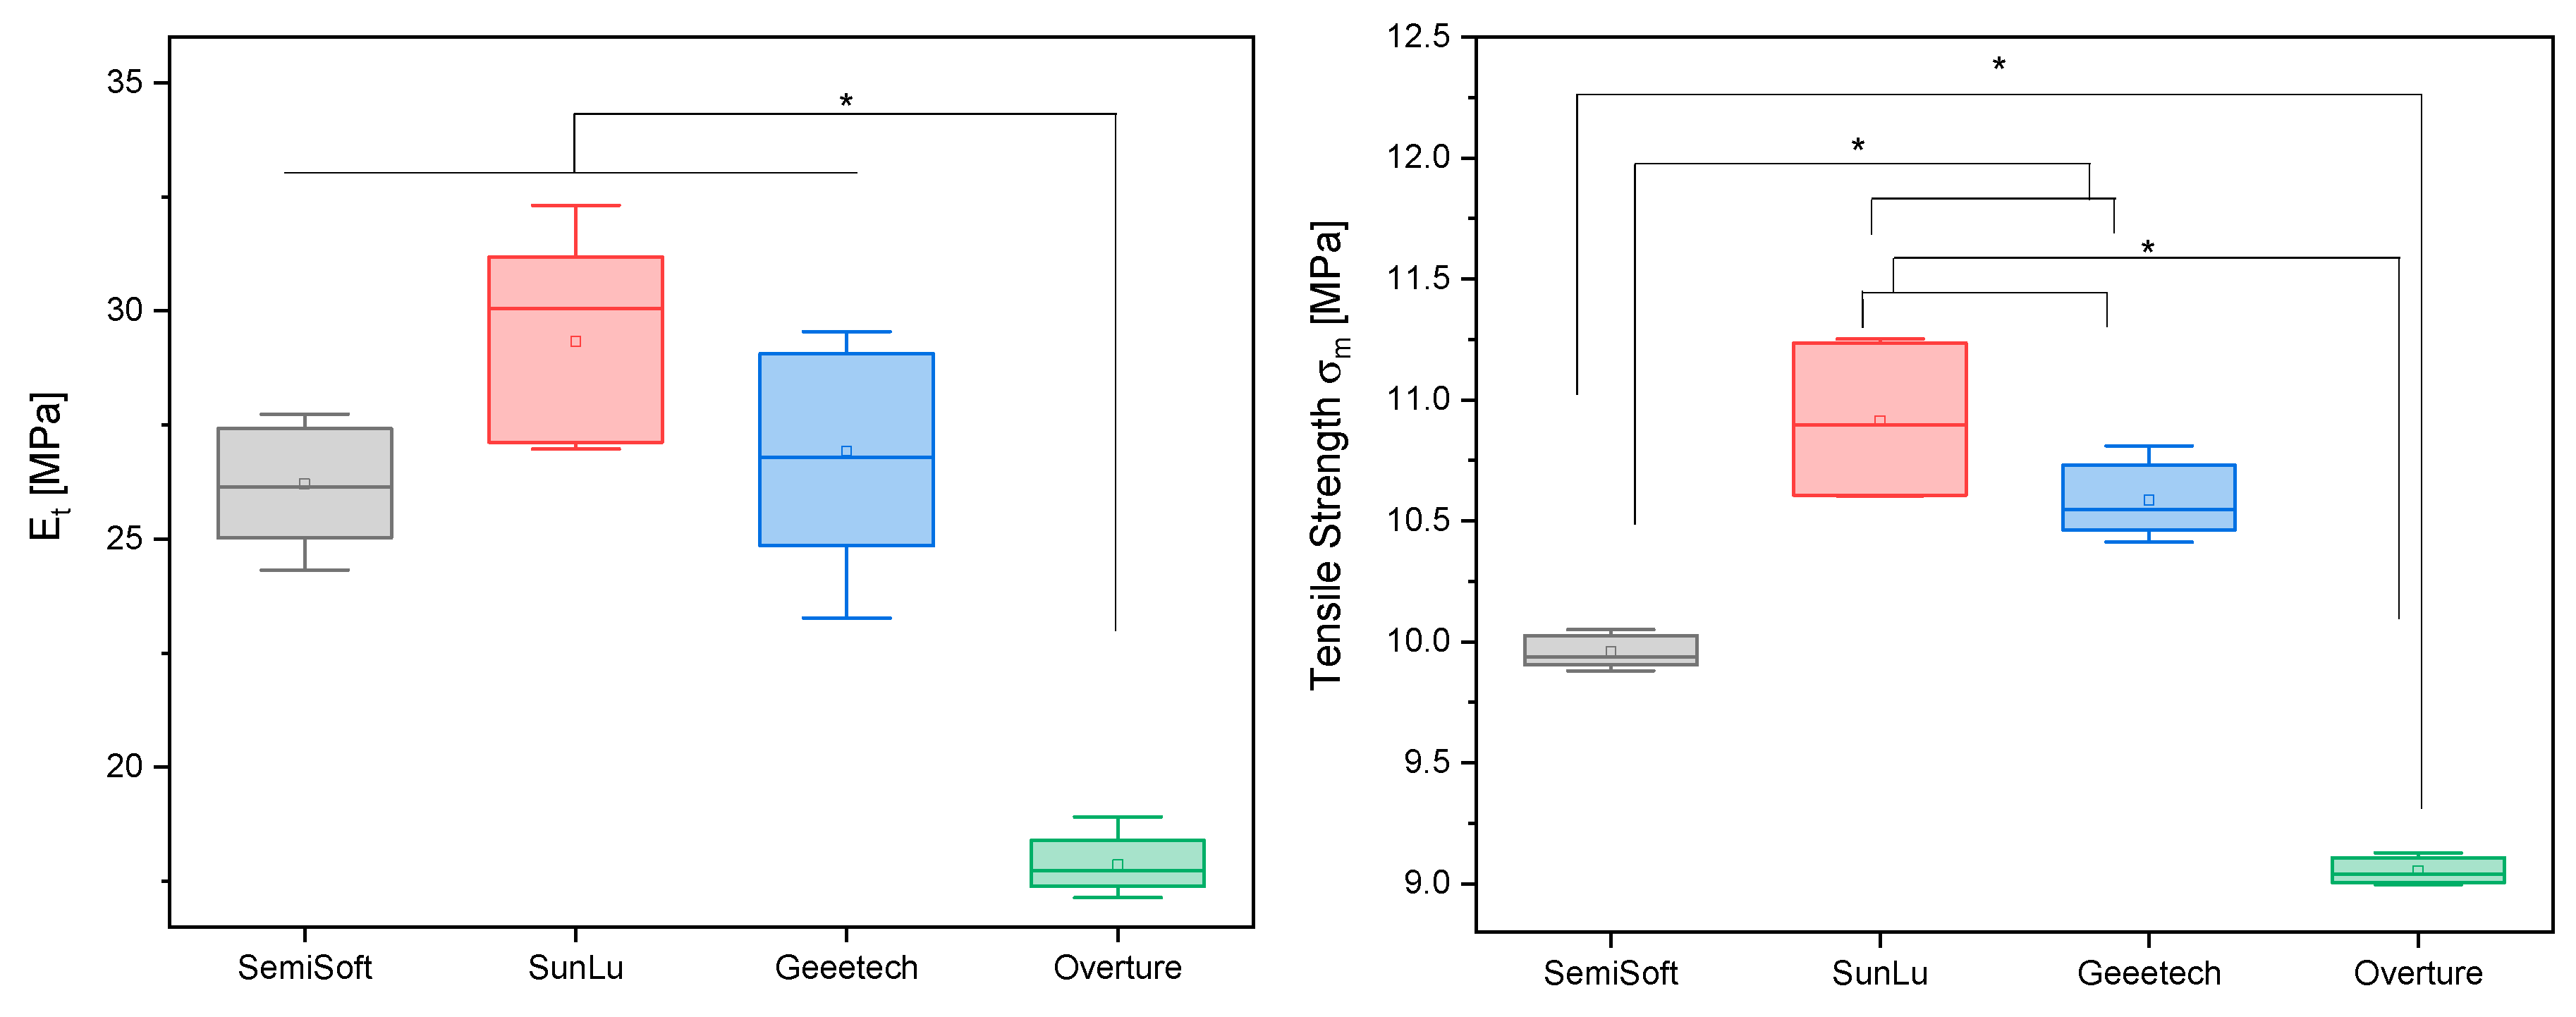
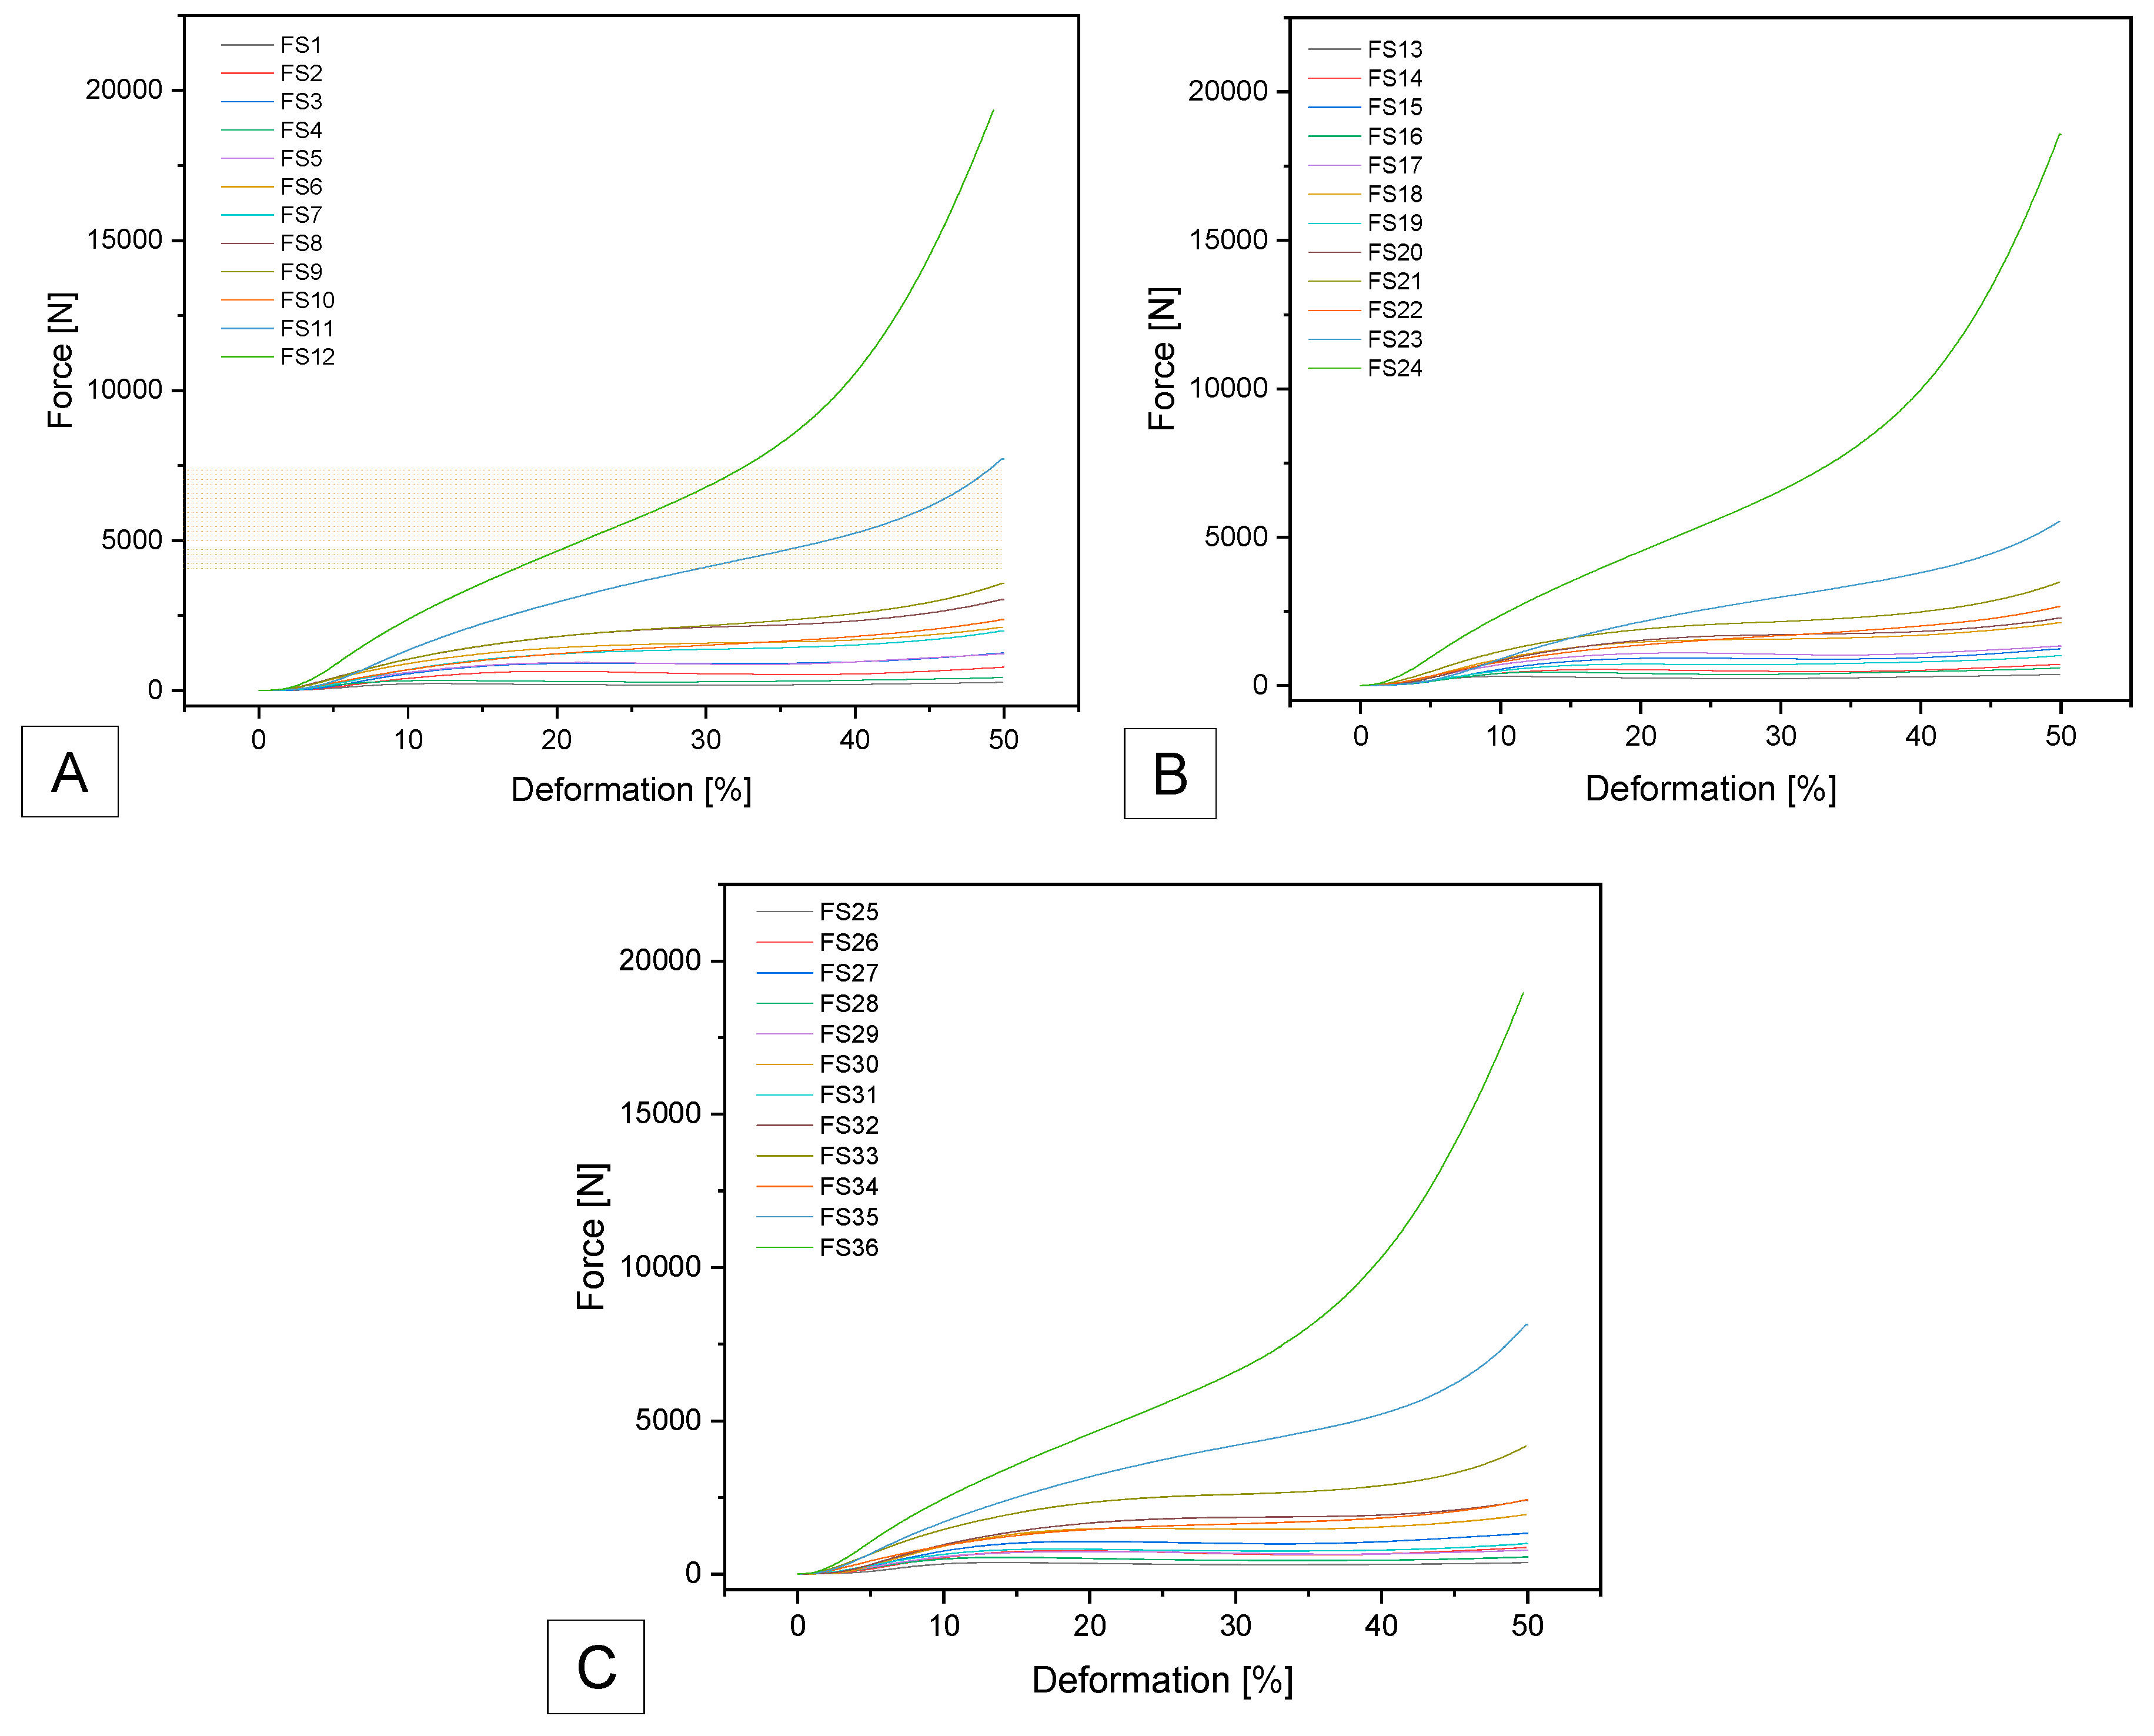
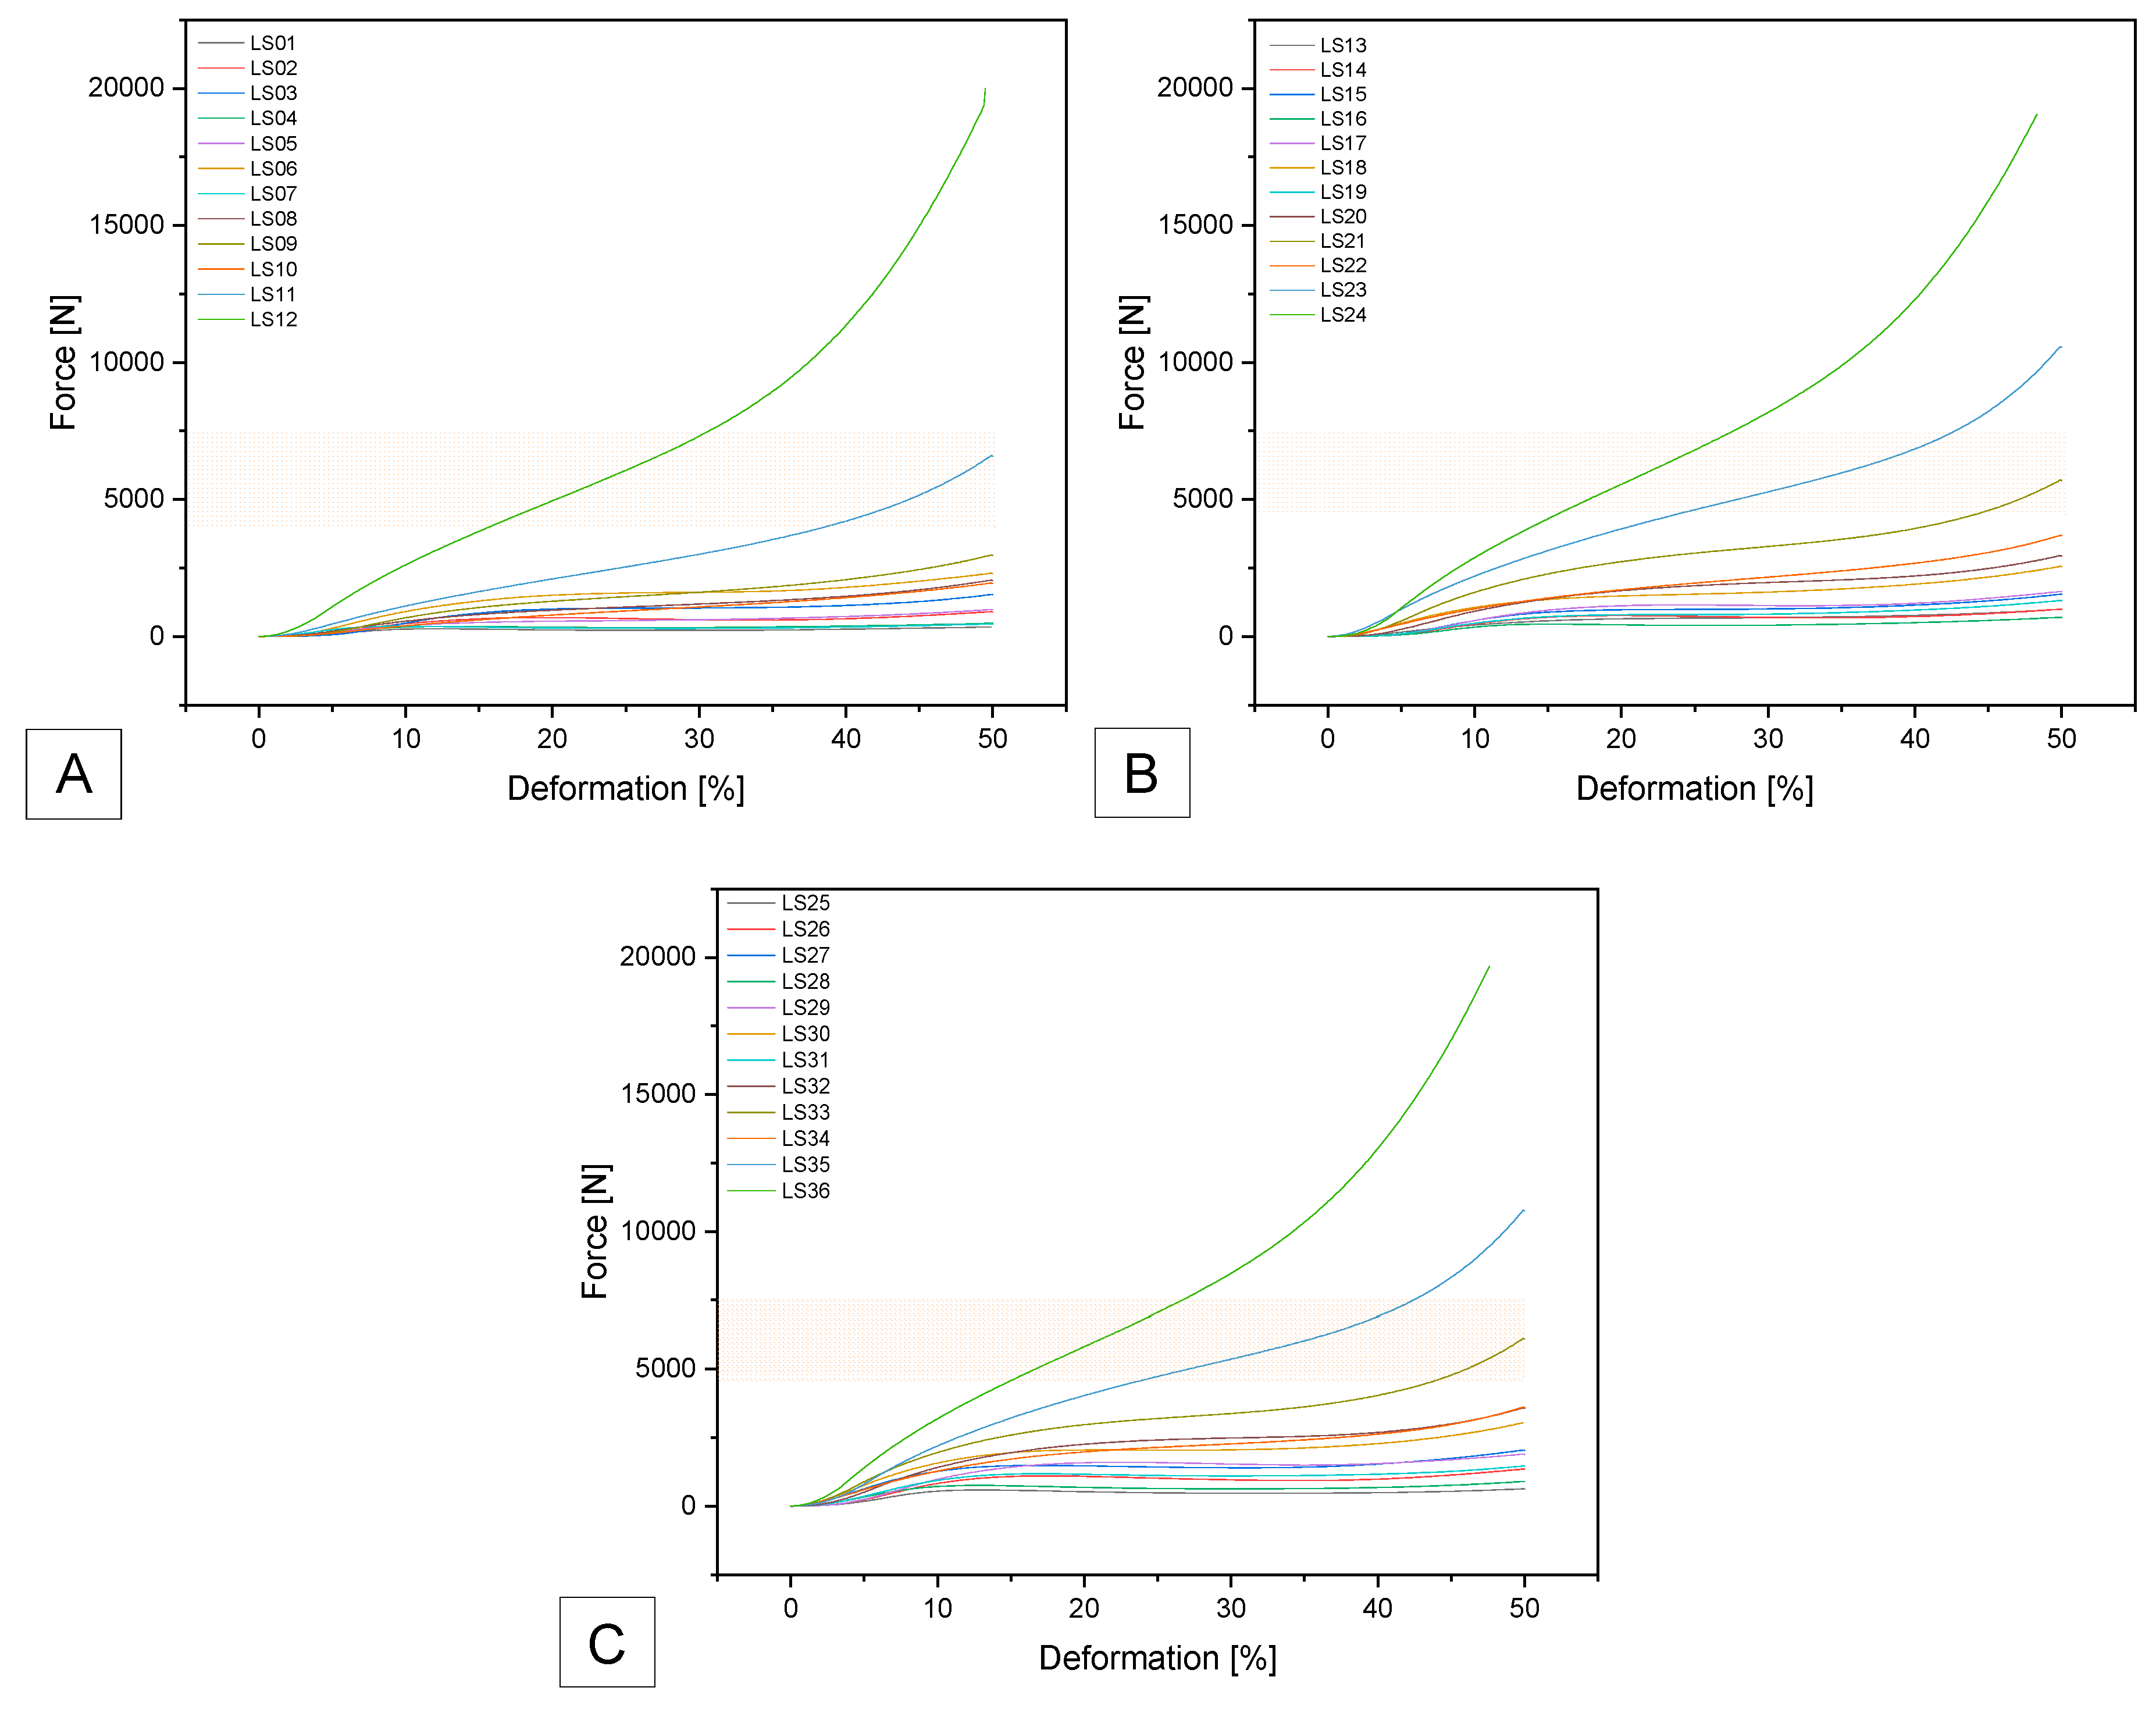
Background Disc degeneration is an increasingly common problem in modern society and is often a precursor to a herniated disc. Contributing factors include physical exertion, overuse, the natural aging process, and disease and injury. Over time, the fibrous ring of the disc develops cracks and small tears, allowing fluid from the nucleus pulposum to escape. As a result, the ability of the disc to absorb shock decreases, potentially leading to a bulging or herniated disc. In this work, previously initiated investigations are extended, and additional thermoplastic polyurethane (TPU) filaments are examined with respect to their suitability for additive manufacturing as potential disc replacement materials. Materials & Methods To remain comparable, the additive manufacturing in this work is also carried out with Fused Deposition Modeling (FDM) 3D printers and as a Ø50 mm x 10mm disc. The Gyroid was varied from 10 mm³ for the coarsest structure to 4 mm³ for the finest structure. The wall thickness of the Gyroid was also varied from 0.5 to 1.0 mm, as were the outer walls of the disc, whose wall thickness was varied from 0.4 to 0.8 mm. Four different TPU filaments (Extrudr FlexSemiSoft, GEEETECH TPU, SUNLU TPU and OVERTURE TPU) were used. This resulted in 36 different settings per filament. The 3D printed discs were analyzed using an Olympus SZ61 stereomicroscope. A tensile test according to DIN EN ISO 527-1 was performed on the 3D printed samples 5A. The aim was to investigate the difference between the different TPU filaments. To test the mechanical properties of the 3D printed discs, a uniaxial compression test was performed with at least three samples of each setting. The body was compressed to 50% of its total height and the force required was recorded as a force-deformation curve. To be comparable to a previous project, a maximum force of 4000–7500 N was used. Results Of the 36 different discs tested for each filament, only a maximum of three were within the target range of maximum force. Microscopy revealed that all wall thicknesses were within the target range with only minor variations. The tensile strengths of Geetech, SunLu, and SemiSoft were not significantly different and were in a similar range of 10-11 MPa, with Overture deviating significantly at 9 MPa. The tensile moduli exhibited a comparable distribution: 25-30 MPa for Geetech, SunLu, and SemiSoft, and 17.5 MPa for Overture. Conclusion For all of the filaments tested, it was possible to additively produce suitable discs that were within the specified range of 4000-7500 N at 50% compression. This would ensure that these discs would withstand the stresses they would be subjected to in a potential human disc replacement application. Thus, we were able to confirm the suitability of these four filaments, as well as the Gyroid structures, for use as a disc replacement.
Keywords:
1. Introduction
2. Materials and Methods
2.1. Materials
2.2. Methods
2.2.1. Filament Preparation
2.2.2. 3D Printing Parameter Optimization
2.2.3. Additive Manufacturing
2.3. Sample Characterization
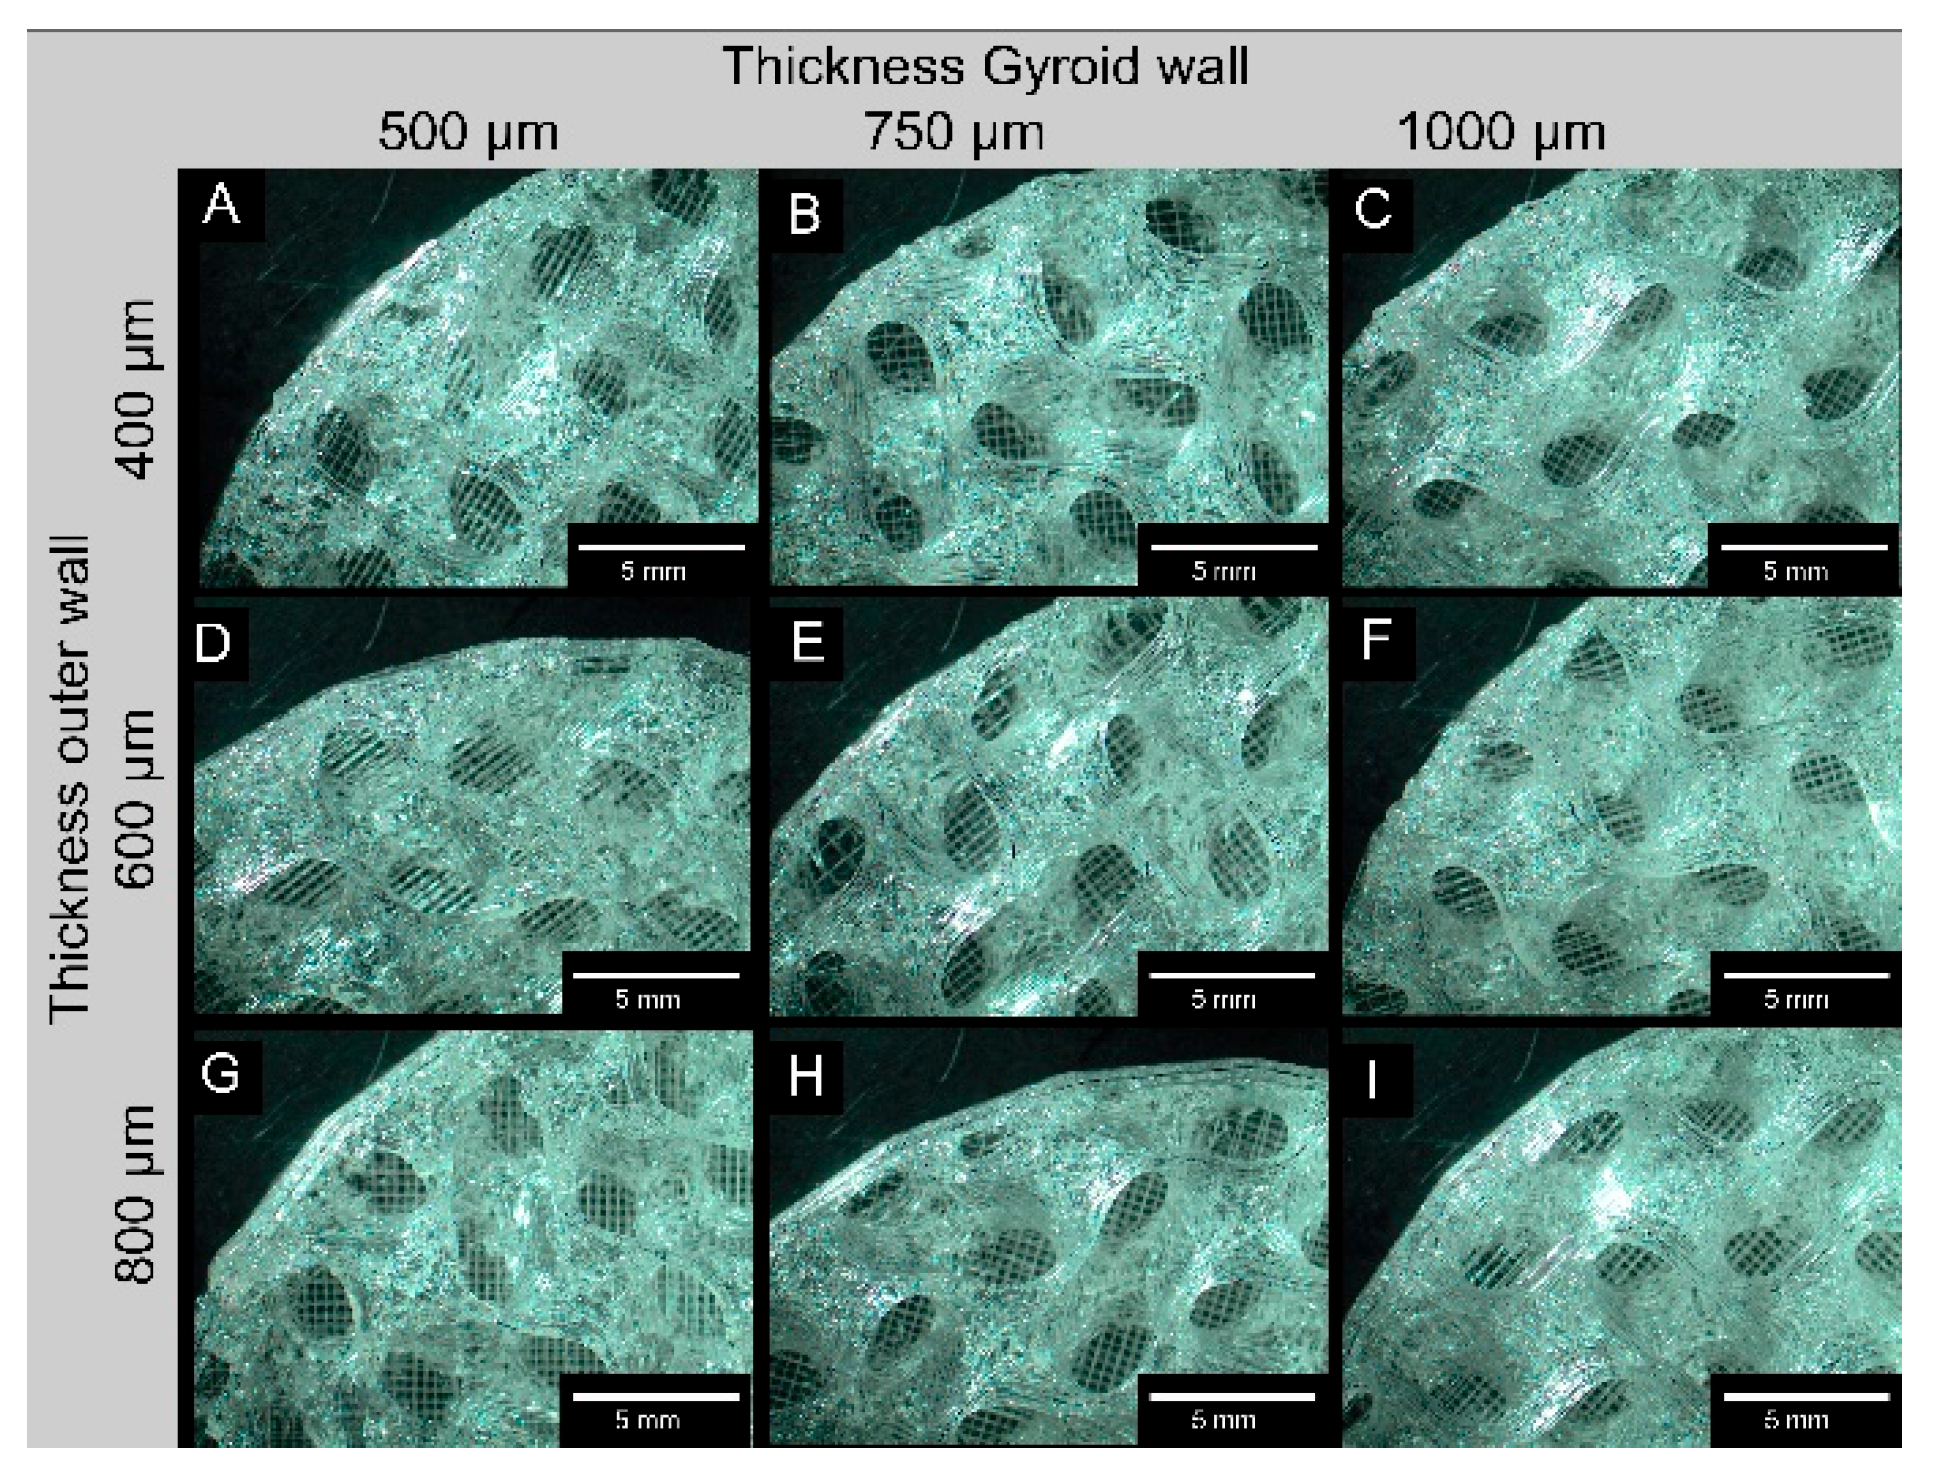
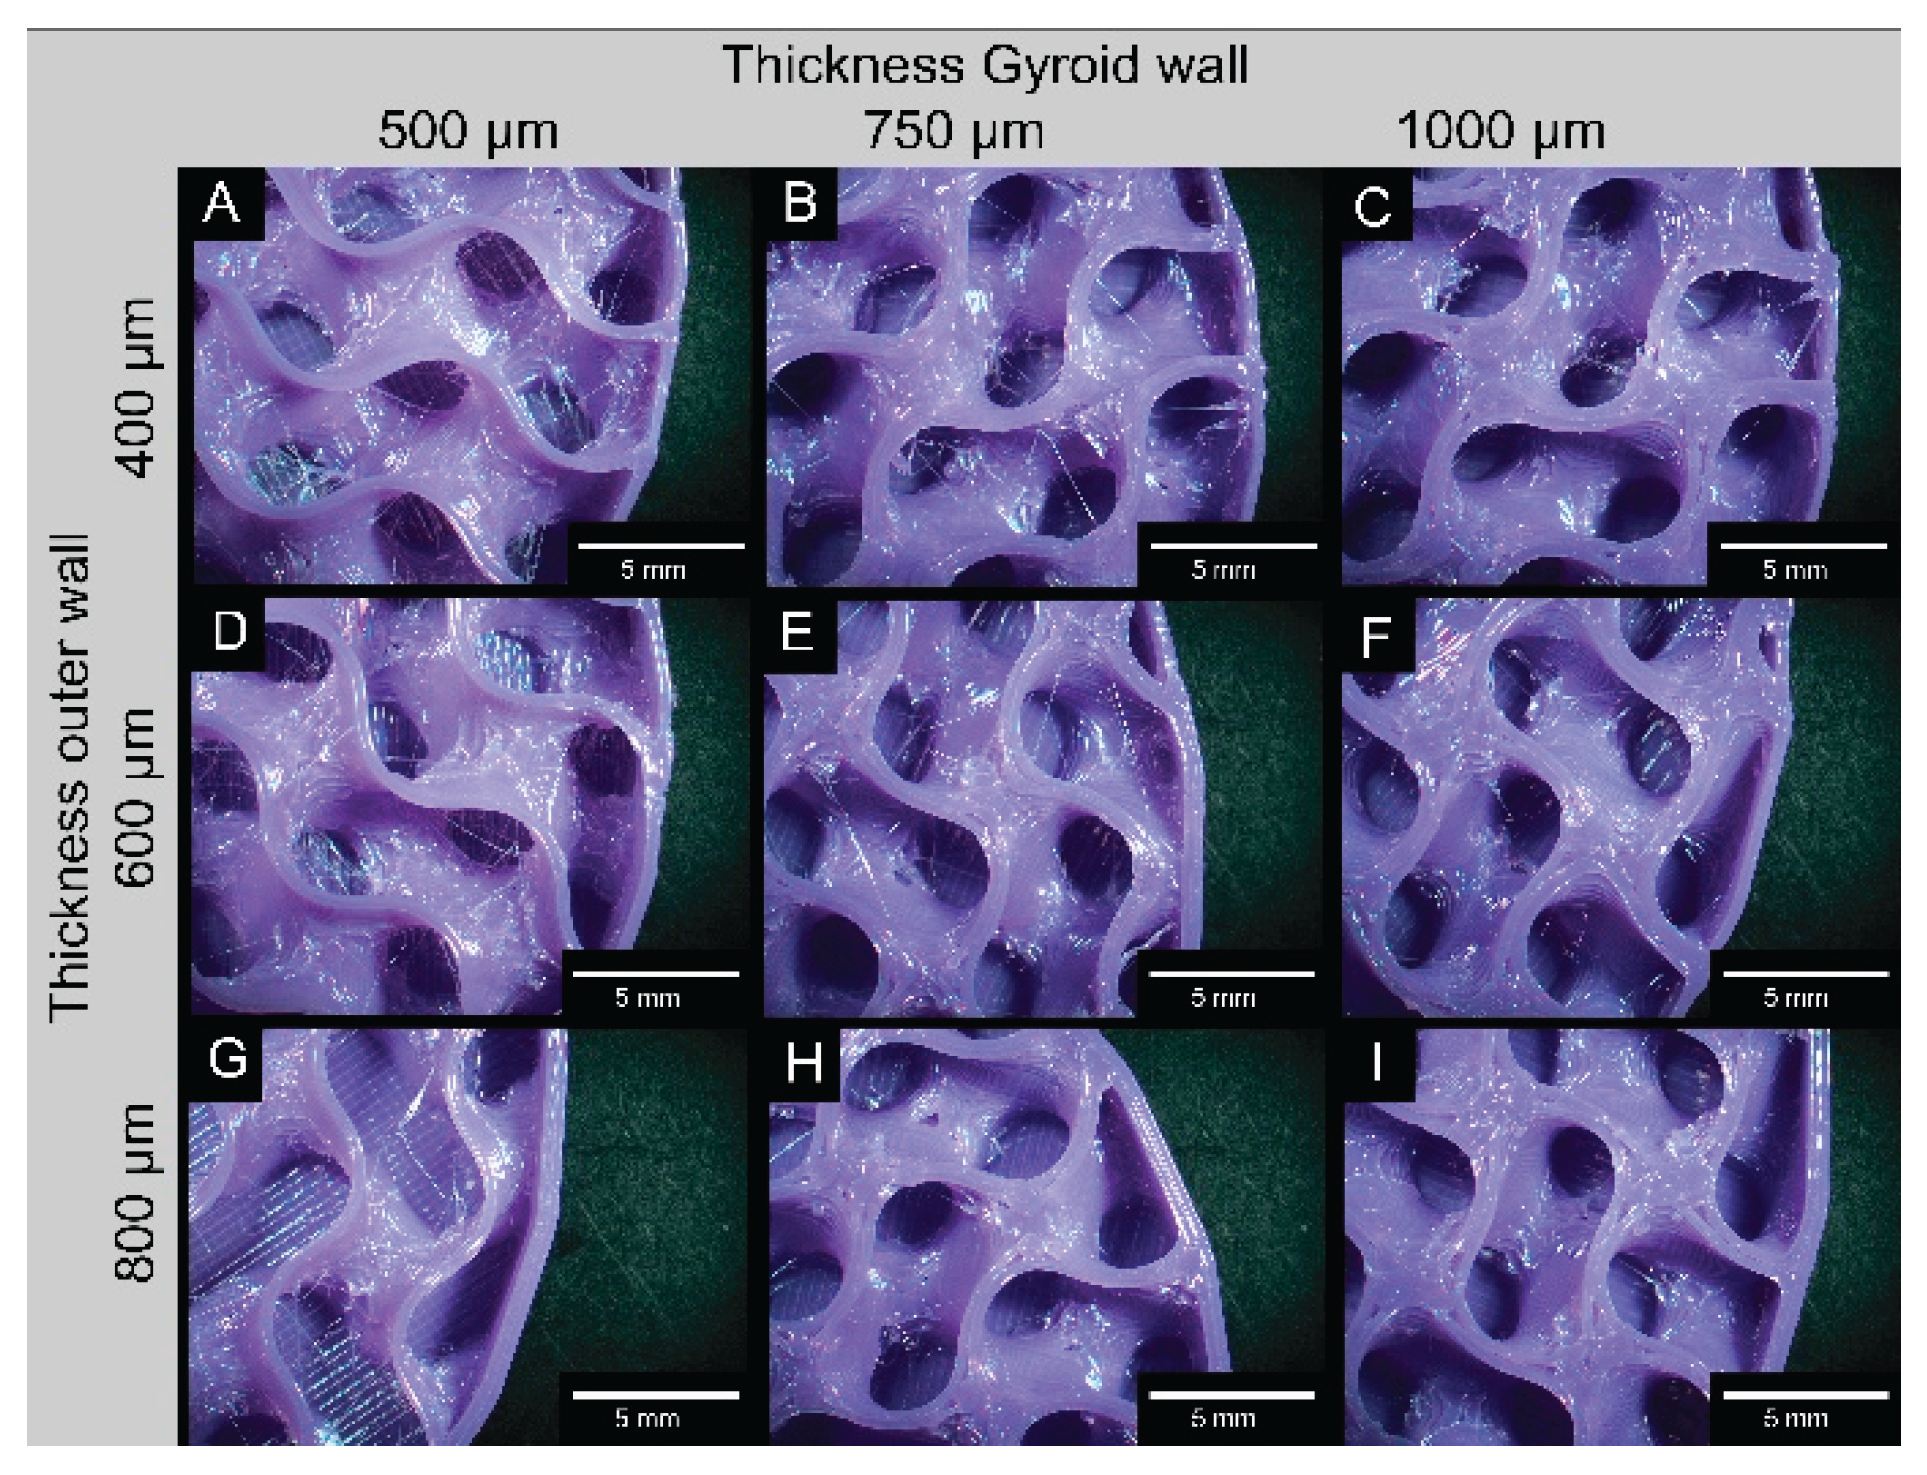
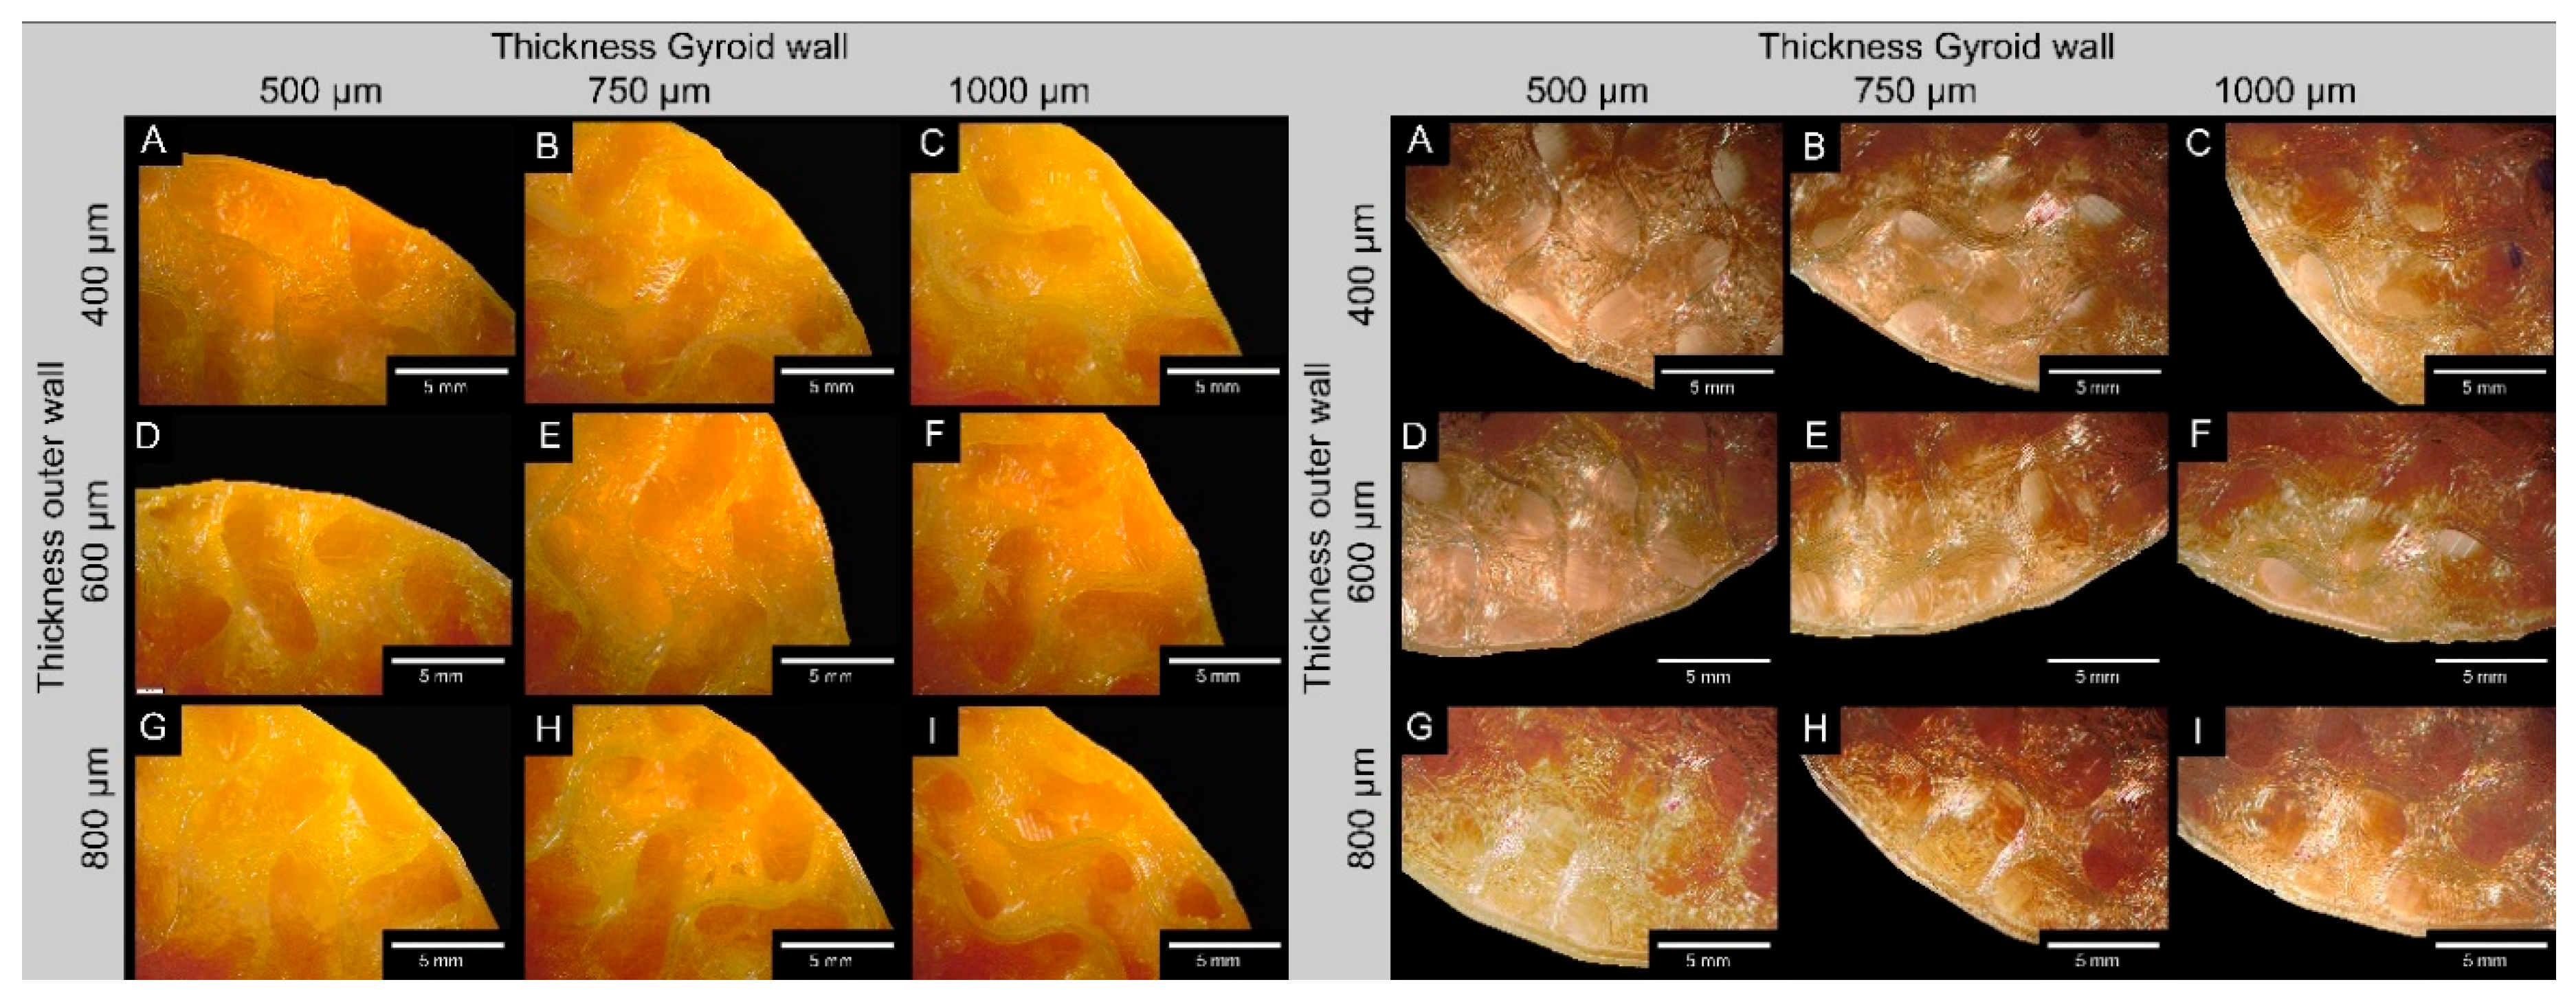
2.3.1. Microscopy
2.3.2. Mechanical Properties
2.4. Statistics
3. Results
3.1. Sample Dimensions
3.2. Mechanical Properties
3.2.1. Tensile Tests
3.2.2. Compression Tests
3.2.2.1. SemiSoft
3.2.2.2. SUNLU
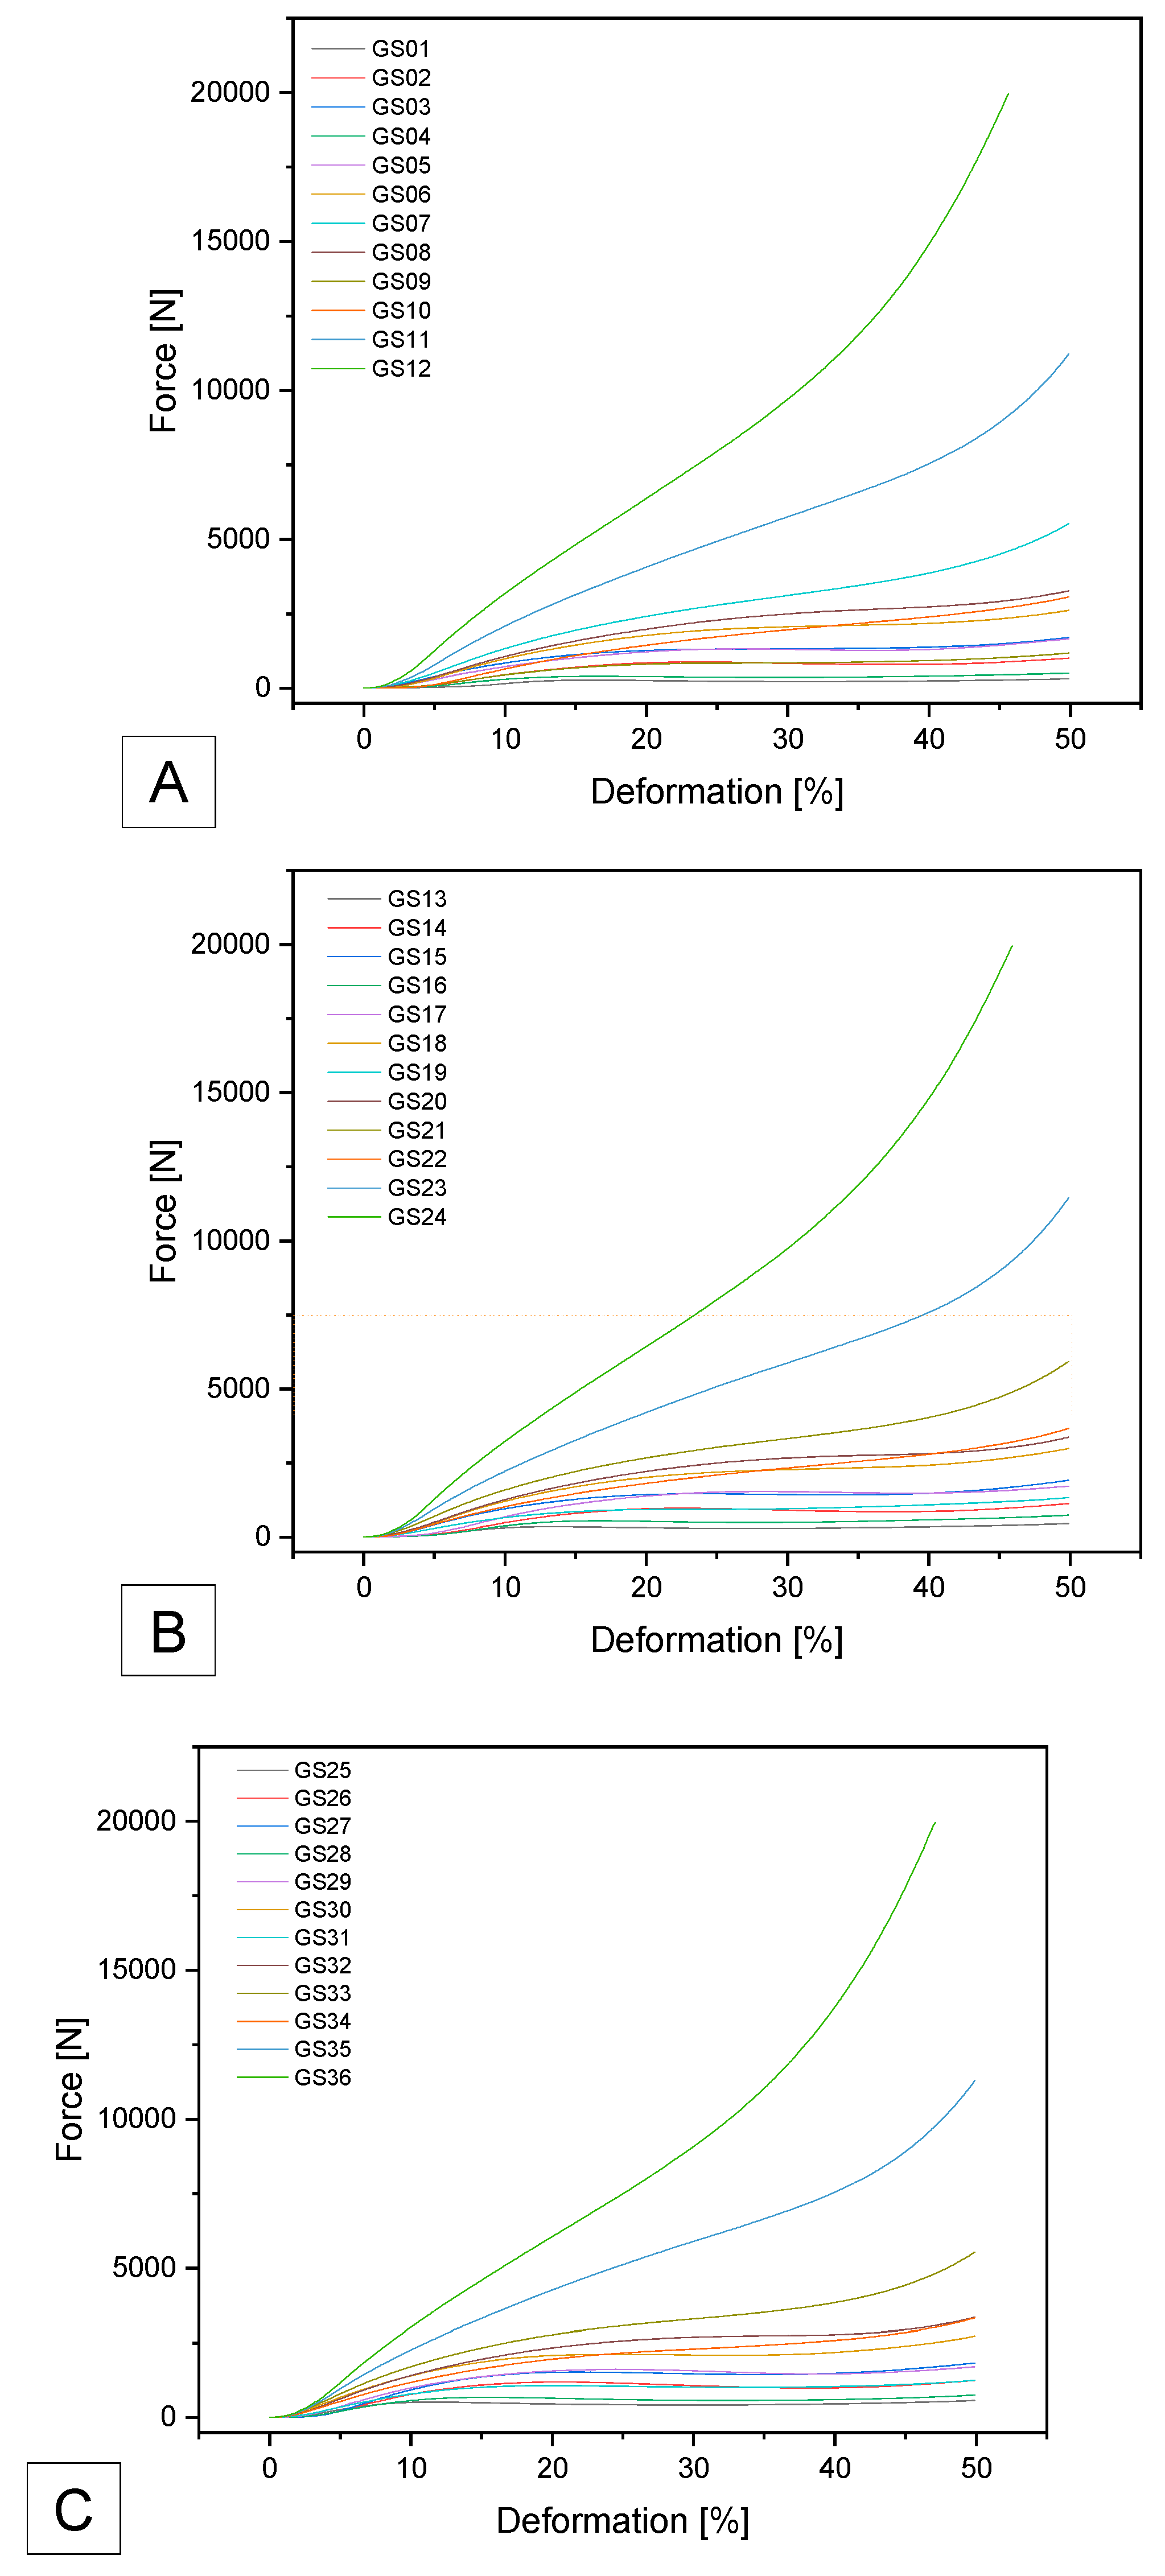
3.2.2.3. GEEETECH
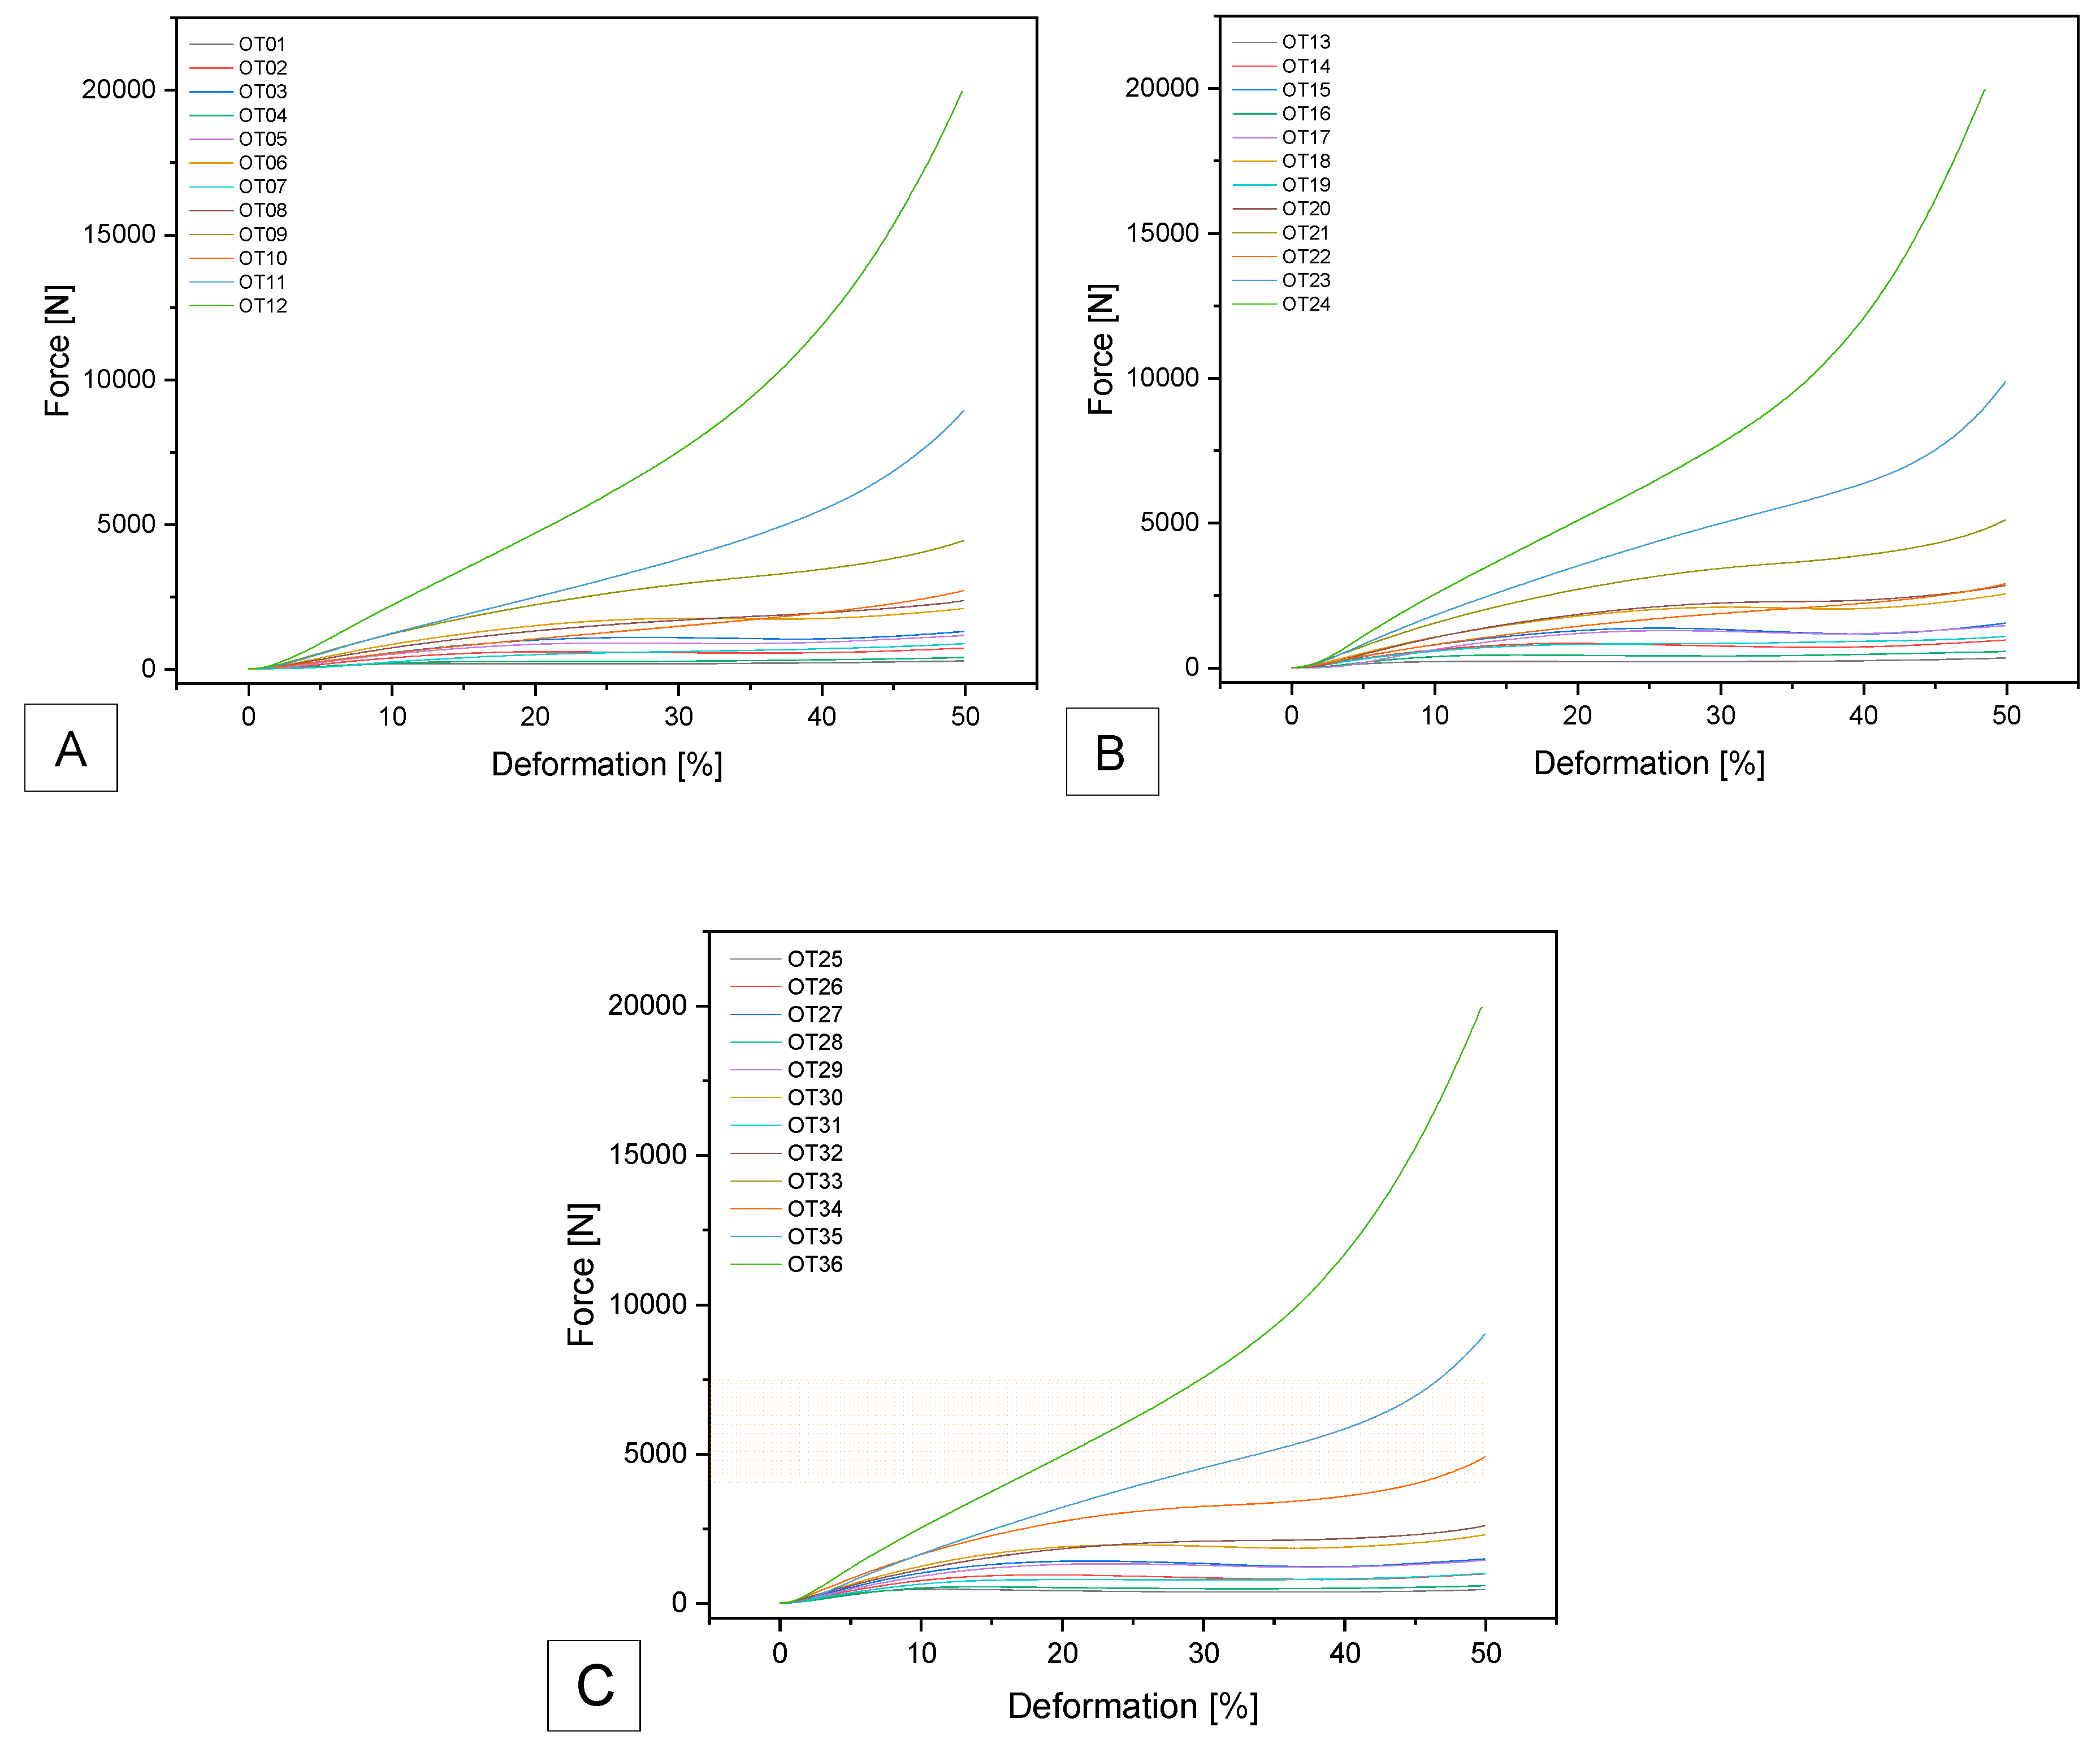
3.2.2.4. OVERTURE
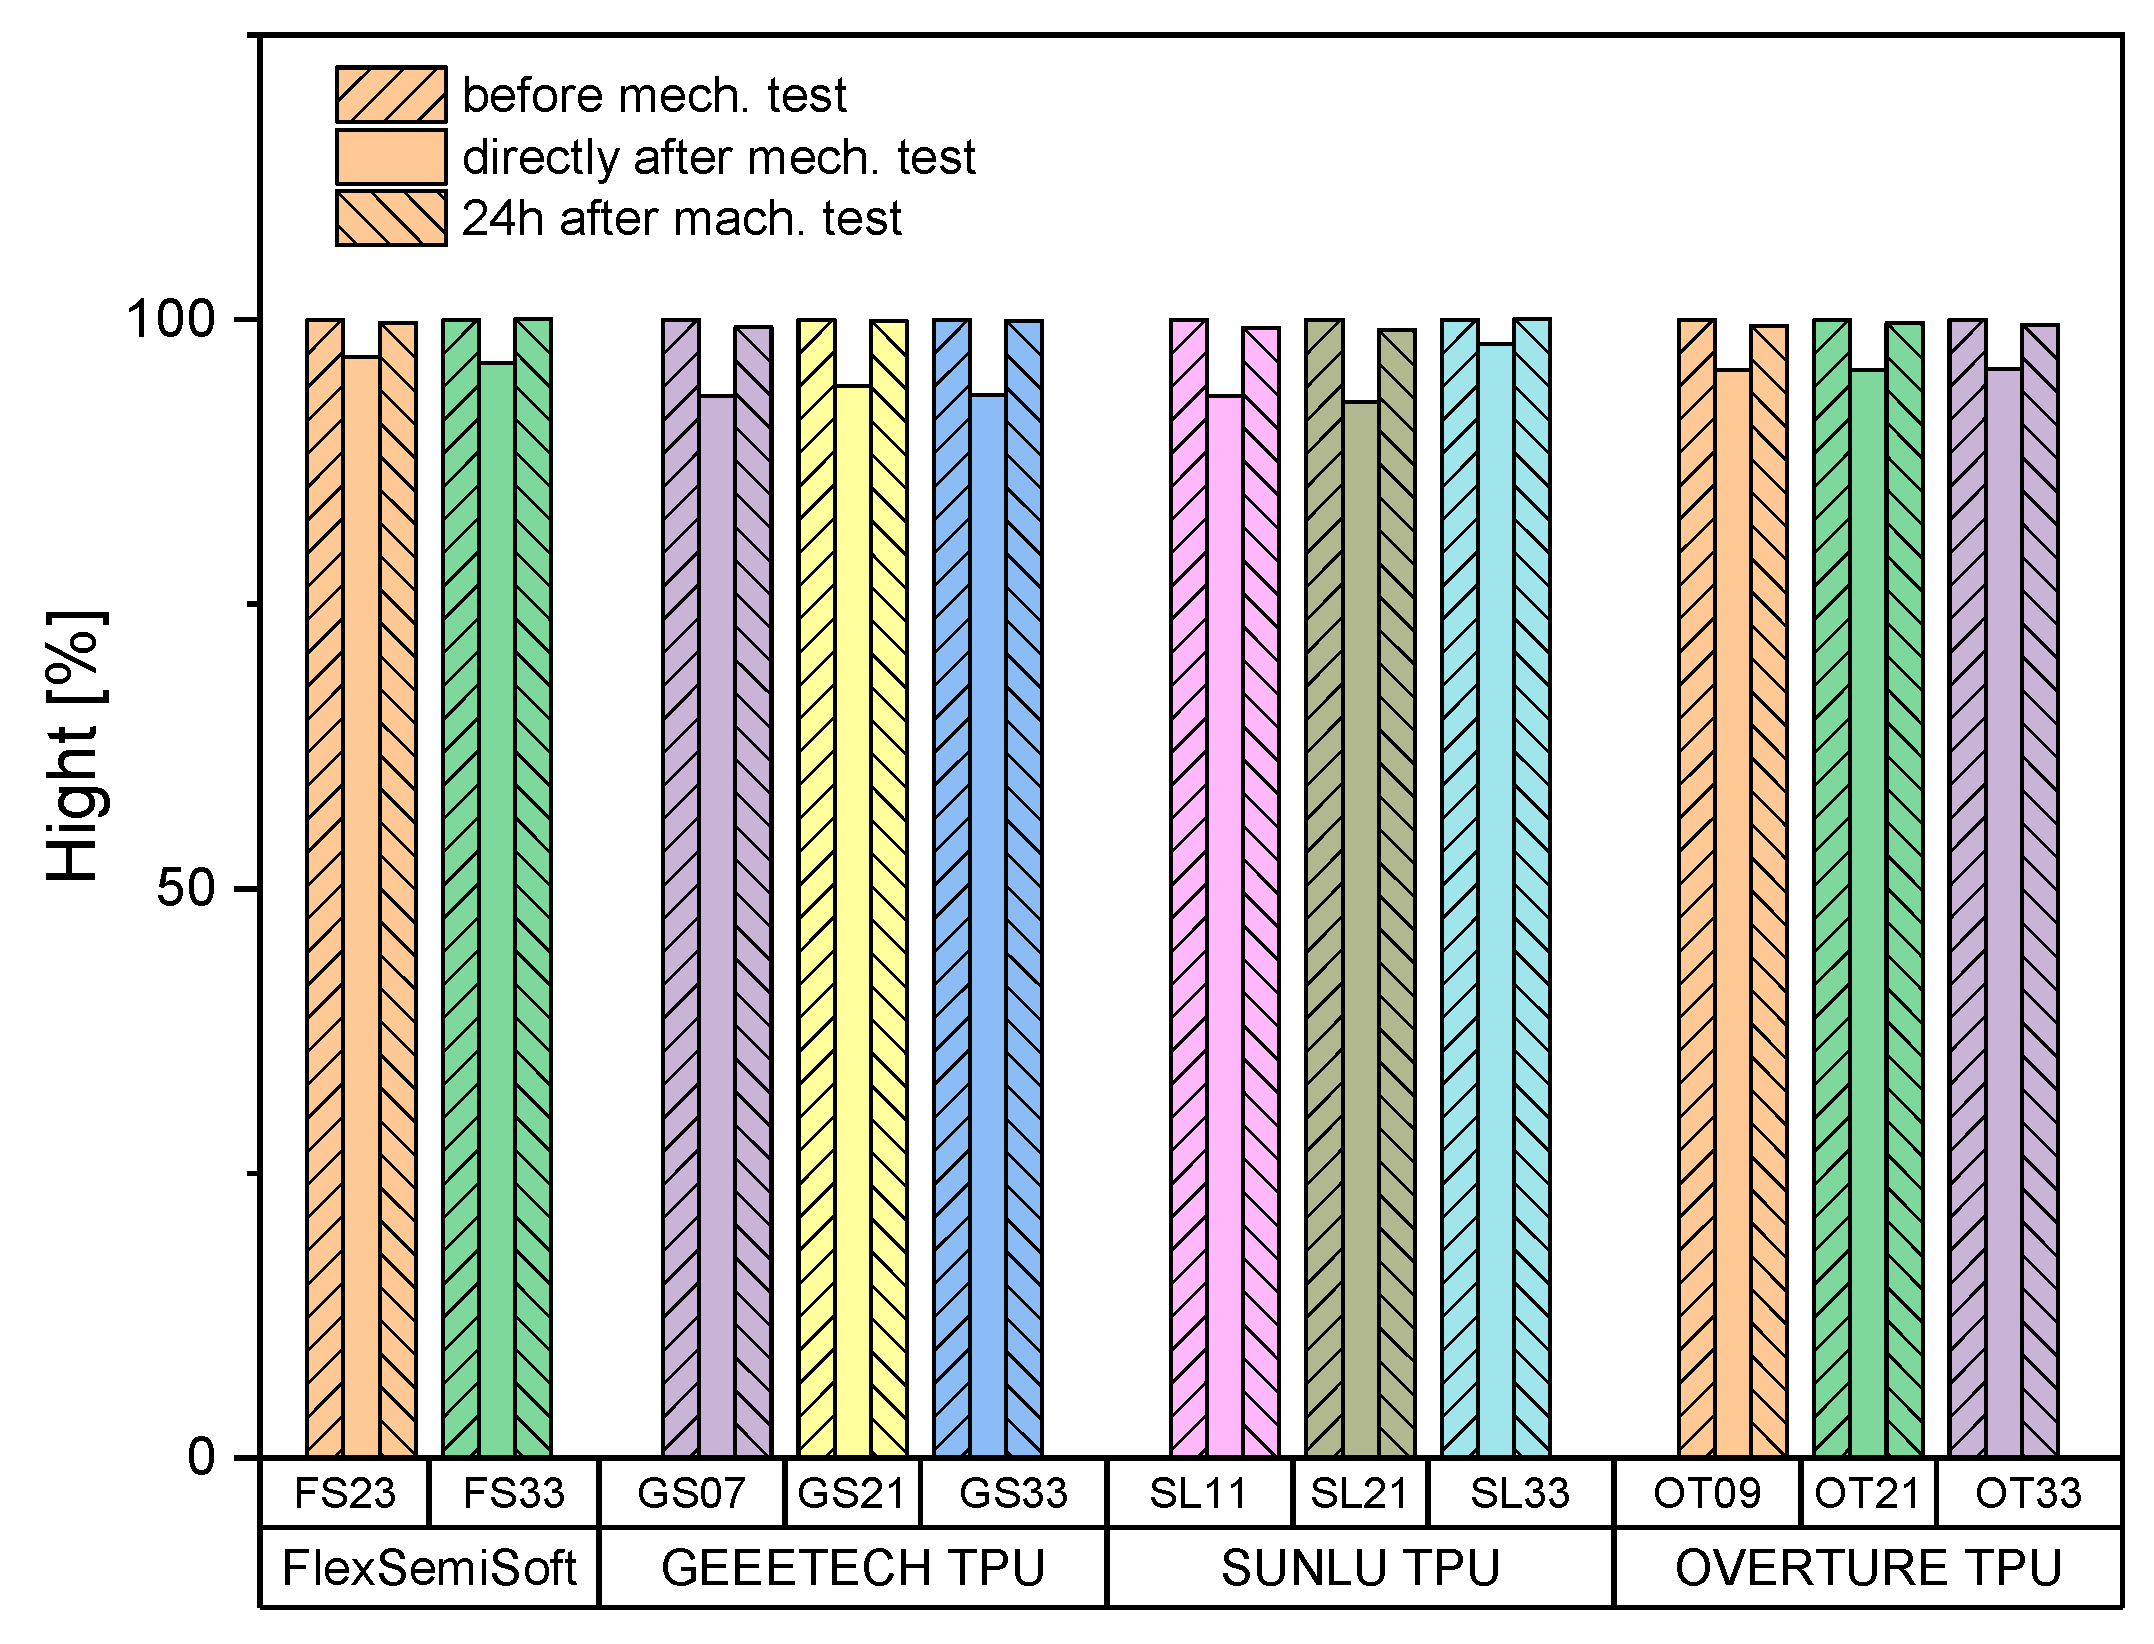
3.2.3. Sample Height
4. Discussion
5. Conclusion
Author Contributions
Funding
Institutional Review Board Statement
Informed Consent Statement
Data Availability Statement
Acknowledgments
Conflicts of Interest
List of abbreviations
| ASD | adjacent segment degeneration |
| CAD | computer aided design |
| FDM | fused deposition modelling |
| FS | Flex Semisoft Filament Sample |
| G-code | geometry code |
| GS | Geeetech TPU Filament Sample |
| OT | Overture TPU Filament Sample |
| ROM | range of motion |
| SL | Sunlu TPU Filament Sample |
| STL | stereo lithography file |
| TPU | thermoplastic polyurethane |
| Not listed here are SI abbreviations. | |
Appendix A

| Sample | Gyroid Dimensions | ||
|---|---|---|---|
| Volume [mm³] |
Wall thickness Gyroid [mm] |
Wall thickness outer wall [mm] |
|
| #01 | 10 | 0.5 | 0.4 |
| #02 | 10 | 0.75 | 0.4 |
| #03 | 10 | 1.0 | 0.4 |
| #04 | 8 | 0.5 | 0.4 |
| #05 | 8 | 0.75 | 0.4 |
| #06 | 8 | 1.0 | 0.4 |
| #07 | 6 | 0.5 | 0.4 |
| #08 | 6 | 0.75 | 0.4 |
| #09 | 6 | 1.0 | 0.4 |
| #10 | 4 | 0.5 | 0.4 |
| #11 | 4 | 0.75 | 0.4 |
| #12 | 4 | 1.0 | 0.4 |
| #13 | 10 | 0.5 | 0.6 |
| #14 | 10 | 0.75 | 0.6 |
| #15 | 10 | 1.0 | 0.6 |
| #16 | 8 | 0.5 | 0.6 |
| #17 | 8 | 0.75 | 0.6 |
| #18 | 8 | 1.0 | 0.6 |
| #19 | 6 | 0.5 | 0.6 |
| #20 | 6 | 0.75 | 0.6 |
| #21 | 6 | 1.0 | 0.6 |
| #22 | 4 | 0.5 | 0.6 |
| #23 | 4 | 0.75 | 0.6 |
| #24 | 4 | 1.0 | 0.6 |
| #25 | 10 | 0.5 | 0.8 |
| #26 | 10 | 0.75 | 0.8 |
| #27 | 10 | 1.0 | 0.8 |
| #28 | 8 | 0.5 | 0.8 |
| #29 | 8 | 0.75 | 0.8 |
| #30 | 8 | 1.0 | 0.8 |
| #31 | 6 | 0.5 | 0.8 |
| #32 | 6 | 0.75 | 0.8 |
| #33 | 6 | 1.0 | 0.8 |
| #34 | 4 | 0.5 | 0.8 |
| #35 | 4 | 0.75 | 0.8 |
| #36 | 4 | 1.0 | 0.8 |
References
- Abudouaini, H., T. Wu, Y. Meng, B. Wang, et al., Mechanical properties of an elastically deformable cervical spine implant. Journal of Orthopaedic Surgery and Research, 2023. 18(1): p. 605. [CrossRef]
- Goedmakers, C.M.W., F. de Vries, L. Bosscher, W.C. Peul, et al., Long-term results of the NECK trial—implanting a disc prosthesis after cervical anterior discectomy cannot prevent adjacent segment disease: five-year clinical follow-up of a double-blinded randomised controlled trial. The Spine Journal, 2023. 23(3): p. 350–360. [CrossRef]
- Abi-Hanna, D., J. Kerferd, K. Phan, P. Rao, et al., Lumbar Disk Arthroplasty for Degenerative Disk Disease: Literature Review. World Neurosurgery, 2018. 109: p. 188–196. [CrossRef]
- Li, J., P. OuYang, X. He, X. Wei, et al., Cervical non-fusion using biomimetic artificial disc and vertebra complex: technical innovation and biomechanics analysis. Journal of Orthopaedic Surgery and Research, 2022. 17(1): p. 122. [CrossRef]
- Cui, X.-D., H.-T. Li, W. Zhang, L.-L. Zhang, et al., Mid- to long-term results of total disc replacement for lumbar degenerative disc disease: a systematic review. Journal of Orthopaedic Surgery and Research, 2018. 13(1): p. 326. [CrossRef]
- Gornet, M.F., T.H. Lanman, J.K. Burkus, S.D. Hodges, et al., Cervical disc arthroplasty with the Prestige LP disc versus anterior cervical discectomy and fusion, at 2 levels: results of a prospective, multicenter randomized controlled clinical trial at 24 months. J Neurosurg Spine, 2017. 26(6): p. 653–667. [CrossRef]
- Shen, Y.-W., Y. Yang, H. Liu, X. Rong, et al., Effects of endplate coverage and intervertebral height change on heterotopic ossification following cervical disc replacement. Journal of Orthopaedic Surgery and Research, 2021. 16(1): p. 693. [CrossRef]
- Pham, M., K. Phan, I. Teng, and R.J. Mobbs, Comparative Study Between M6-C and Mobi-C Cervical Artificial Disc Replacement: Biomechanical Outcomes and Comparison with Normative Data. Orthop Surg, 2018. 10(2): p. 84–88. [CrossRef]
- Feng, H., X. Fang, D. Huang, C. Yu, et al., Quantitative morphometric study of the subaxial cervical vertebrae end plate. The Spine Journal, 2017. 17(2): p. 269–276. [CrossRef]
- Patwardhan, A.G. and R.M. Havey, Prosthesis design influences segmental contribution to total cervical motion after cervical disc arthroplasty. European Spine Journal, 2020. 29(11): p. 2713–2721. [CrossRef]
- destatis, Fallpauschalenbezogene Krankenhausstatistik (DRG-Statistik) Operationen und Prozeduren der vollstationären Patientinnen und Patienten in Krankenhäusern (4-Steller) für 2021, G.F.S. Office, Editor. 2022: Wiesbaden.
- Cloyd, J.M., N.R. Malhotra, L. Weng, W. Chen, et al., Material properties in unconfined compression of human nucleus pulposus, injectable hyaluronic acid-based hydrogels and tissue engineering scaffolds. Eur Spine J, 2007. 16(11): p. 1892–8. [CrossRef]
- Warburton, A., S.J. Girdler, C.M. Mikhail, A. Ahn, et al., Biomaterials in Spinal Implants: A Review. Neurospine, 2020. 17(1): p. 101–110. [CrossRef]
- Serra, T., C. Capelli, R. Toumpaniari, I.R. Orriss, et al., Design and fabrication of 3D-printed anatomically shaped lumbar cage for intervertebral disc (IVD) degeneration treatment. Biofabrication, 2016. 8(3): p. 035001. [CrossRef]
- Marshall, S.L., T.D. Jacobsen, E. Emsbo, A. Murali, et al., Three-Dimensional-Printed Flexible Scaffolds Have Tunable Biomimetic Mechanical Properties for Intervertebral Disc Tissue Engineering. ACS Biomaterials Science & Engineering, 2021. 7(12): p. 5836–5849. [CrossRef]
- Fidai, A.B., B. Kim, M. Lintz, S. Kirnaz, et al., Flexible support material maintains disc height and supports the formation of hydrated tissue engineered intervertebral discs in vivo. 2024. 7(3): p. e1363. [CrossRef]
- Obaid, M.N., N.A. Berto, and S.H. Radhi, Preparation and characterization of UHMWPE reinforced with polyester fibers for artificial cervical disc replacement (ACDR). J Biomater Sci Polym Ed, 2023. 34(12): p. 1758–1769 DOI: 10.1080/09205063.2023.2182576.
- Xiao, J. and Y. Gao, The manufacture of 3D printing of medical grade TPU. Progress in Additive Manufacturing, 2017. 2(3): p. 117–123. [CrossRef]
- Gross, V., S. Zankovic, B. Rolauffs, D. Velten, et al., On the suitability of additively manufactured gyroid structures and their potential use as intervertebral disk replacement - a feasibility study. Frontiers in Bioengineering and Biotechnology, 2024. 12. [CrossRef]
- Wang, B.H. and G. Campbell, Formulations of polyvinyl alcohol cryogel that mimic the biomechanical properties of soft tissues in the natural lumbar intervertebral disc. Spine (Phila Pa 1976), 2009. 34(25): p. 2745–53. [CrossRef]
- Rohlmann, A., H.-J. Wilke, H. Mellerowicz, F. Graichen, et al., Loads on the spine in sports. German Journal of Sports Medicine, 2001. 52(4): p. 118–123.
- Wilke, H.J., P. Neef, M. Caimi, T. Hoogland, et al., New in vivo measurements of pressures in the intervertebral disc in daily life. Spine (Phila Pa 1976), 1999. 24(8): p. 755–62. [CrossRef]
- Shin, E.J., Y.S. Jung, H.Y. Choi, and S. Lee, Synthesis and fabrication of biobased thermoplastic polyurethane filament for FDM 3D printing. Journal of Applied Polymer Science, 2022. 139(40): p. e52959. [CrossRef]
- Haryńska, A., I. Gubanska, J. Kucinska-Lipka, and H. Janik, Fabrication and Characterization of Flexible Medical-Grade TPU Filament for Fused Deposition Modeling 3DP Technology. Polymers, 2018. 10(12): p. 1304. [CrossRef]
- Shin, E.J., Y. Park, Y.S. Jung, H.Y. Choi, et al., Fabrication and characteristics of flexible thermoplastic polyurethane filament for fused deposition modeling three-dimensional printing. Polymer Engineering and Science, 2022. 62(9): p. 2947–2957. [CrossRef]
- Soltanmohammadi, K., D. Rahmatabadi, M. Aberoumand, E. Soleyman, et al., Effects of TPU on the mechanical properties, fracture toughness, morphology, and thermal analysis of 3D-printed ABS-TPU blends by FDM. Vinyl Additive Technology, 2024. 30(4): p. 958–968. [CrossRef]
- Bayati, A., M. Ahmadi, D. Rahmatabadi, M. Khodaei, et al., 3D printed elastomers with superior stretchability and mechanical integrity by parametric optimization of extrusion process using Taguchi Method. Materials Research Express, 2025. 12(1): p. 015301. [CrossRef]
- Syrlybayev, D., B. Zharylkassyn, A. Seisekulova, M. Akhmetov, et al., Optimisation of Strength Properties of FDM Printed Parts—A Critical Review. Polymers, 2021. 13(10): p. 1587.
- Gupta, C., P. MB, N.K. Shet, A.K. Ghosh, et al., Microstructure and mechanical performance examination of 3D printed acrylonitrile butadiene styrene thermoplastic parts. 2020. 60(11): p. 2770–2781. [CrossRef]
- Rahmatabadi, D., A. Bayati, M. Khajepour, K. Mirasadi, et al., Poly(ethylene terephthalate) glycol/carbon black composites for 4D printing. Materials Chemistry and Physics, 2024. 325: p. 129737. [CrossRef]
- Rahmatabadi, D., M. Khajepour, A. Bayati, K. Mirasadi, et al., Advancing sustainable shape memory polymers through 4D printing of polylactic acid-polybutylene adipate terephthalate blends. European Polymer Journal, 2024. 216: p. 113289. [CrossRef]
- Feki, F., F. Zaïri, A. Tamoud, M. Moulart, et al., Understanding the Recovery of the Intervertebral Disc: A Comprehensive Review of In Vivo and In Vitro Studies. Journal of Bionic Engineering, 2024. 21(4): p. 1919–1948. [CrossRef]
- Goode, J.D. and B.M. Theodore, Voluntary and Diurnal Variation in Height and Associated Surface Contour Changes in Spinal Curves. Engineering in Medicine, 1983. 12(2): p. 99–101. [CrossRef]
- Urban, J.P.G. and A. Maroudas, Swelling of the Intervertebral Disc in Vitro. Connective Tissue Research, 1981. 9(1): p. 1–10. [CrossRef]
- Urban, J.P. and J.F. McMullin, Swelling pressure of the lumbar intervertebral discs: influence of age, spinal level, composition, and degeneration. Spine (Phila Pa 1976), 1988. 13(2): p. 179–87. [CrossRef]
- Reilly, T., A. Tyrrell, and J.D. Troup, Circadian variation in human stature. Chronobiol Int, 1984. 1(2): p. 121–6. [CrossRef]
- Tyrrell, A.R., T. Reilly, and J.D. Troup, Circadian variation in stature and the effects of spinal loading. Spine (Phila Pa 1976), 1985. 10(2): p. 161–4. [CrossRef]
- Botsford, D.J., S.I. Esses, and D.J. Ogilvie-Harris, In vivo diurnal variation in intervertebral disc volume and morphology. Spine (Phila Pa 1976), 1994. 19(8): p. 935–40. [CrossRef]
- Adams, M.A., P. Dolan, W.C. Hutton, and R.W. Porter, Diurnal changes in spinal mechanics and their clinical significance. J Bone Joint Surg Br, 1990. 72(2): p. 266–70. [CrossRef]
- McMillan, D.W., G. Garbutt, and M.A. Adams, Effect of sustained loading on the water content of intervertebral discs: implications for disc metabolism. Ann Rheum Dis, 1996. 55(12): p. 880–7. [CrossRef]
- Malko, J.A., W.C. Hutton, and W.A. Fajman, An in vivo MRI study of the changes in volume (and fluid content) of the lumbar intervertebral disc after overnight bed rest and during an 8-hour walking protocol. J Spinal Disord Tech, 2002. 15(2): p. 157–63. [CrossRef]
- Adams, M.A. and W.C. Hutton, The effect of posture on the fluid content of lumbar intervertebral discs. Spine (Phila Pa 1976), 1983. 8(6): p. 665–71. [CrossRef]
- Adams, M.A. and P. Dolan, Recent advances in lumbar spinal mechanics and their clinical significance. Clin Biomech (Bristol), 1995. 10(1): p. 3–19. [CrossRef]

| Filament | Shore A | Density [g/cm³] | Tensile Strength [MPa]* | Elongation at break [%]** | Tg [°C] |
Tm [°C] |
| SUNLU | 95 | 1.23 | 21.7 | 536 | -24 | 190-220 |
| OVERTURE | 95 | 1.18 | 30.1 | 332 | -23 | 210 |
| GEEETECH | 95 | 1.30 | 23.6 | 525 | -24 | 185-220 |
| SemiSoft | 85 | 1.18 | 42 | 550 | -24 | 180-230 |
| Temperature [°C] | ||||
| SemiSoft | Sunlu | Geeetech | Overture | |
| IX | 255 | 210 | 240 | 230 |
| VIII | 252 | 207 | 235 | 227 |
| VII | 250 | 205 | 230 | 225 |
| VI | 247 | 202 | 225 | 222 |
| V | 245 | 200 | 220 | 220 |
| IV | 242 | 197 | 215 | 217 |
| III | 240 | 195 | 210 | 215 |
| II | 237 | 192 | 205 | 212 |
| I | 235 | 190 | 200 | 200 |
| FlexSemiSoft | ||||
| Specimen | Gyroid wall (target) [mm] | Gyroid wall (measured) [mm] | Outer wall (target) [mm] | Outer wall (measured) [mm] |
| FS01 | 0.5 | 0.49 ± 0.03 | 0.4 | 0.40 ± 0.02 |
| FS02 | 0.75 | 0.70 ± 0.02 | 0.4 | 0.41 ± 0.01 |
| FS03 | 1.0 | 0.90 ± 0.03 | 0.4 | 0.42 ± 0.07 |
| FS13 | 0.5 | 0.43 ± 0.09 | 0.6 | 0.61 ± 0.02 |
| FS14 | 0.75 | 0.70 ± 0.07 | 0.6 | 0.63 ± 0.02 |
| FS15 | 1.0 | 0.99 ± 0.11 | 0.6 | 0.58 ± 0.04 |
| FS25 | 0.5 | 0.43 ± 0.04 | 0.8 | 0.75 ± 0.05 |
| FS26 | 0.75 | 0.72 ± 0.08 | 0.8 | 0.77 ± 0.01 |
| FS27 | 1.0 | 0.93 ± 0.05 | 0.8 | 0.74 ± 0.07 |
| SUNLU | ||||
| SL01 | 0.5 | 0.49 ± 0.03 | 0.4 | 0.40 ± 0.02 |
| SL02 | 0.75 | 0.70 ± 0.01 | 0.4 | 0.40 ± 0.01 |
| SL03 | 1.0 | 0.92 ± 0.01 | 0.4 | 0.44 ± 0.07 |
| SL13 | 0.5 | 0.51 ± 0.08 | 0.6 | 0.62 ± 0.02 |
| SL14 | 0.75 | 0.72 ± 0.06 | 0.6 | 0.63 ± 0.02 |
| SL15 | 1.0 | 0.99 ± 0.10 | 0.6 | 0.56 ± 0.05 |
| SL25 | 0.5 | 0.45 ± 0.01 | 0.8 | 0.78 ± 0.05 |
| SL26 | 0.75 | 0.74 ± 0.06 | 0.8 | 0.75 ± 0.07 |
| SL27 | 1.0 | 0.91 ± 0.05 | 0.8 | 0.74 ± 0.01 |
| GEEETECH | ||||
| GS01 | 0.5 | 0.49 ± 0.01 | 0.4 | 0.41 ± 0.03 |
| GS02 | 0.75 | 0.77 ± 0.01 | 0.4 | 0.42 ± 0.02 |
| GS03 | 1.0 | 1.02 ± 0.06 | 0.4 | 0.39 ± 0.01 |
| GS13 | 0.5 | 0.48 ± 0.02 | 0.6 | 0.57 ± 0.02 |
| GS14 | 0.75 | 0.75 ± 0.01 | 0.6 | 0.62 ± 0.05 |
| GS15 | 1.0 | 0.99 ± 0.05 | 0.6 | 0.65 ± 0.02 |
| GS25 | 0.5 | 0.50 ± 0.03 | 0.8 | 0.82 ± 0.02 |
| GS26 | 0.75 | 0.75 ± 0.02 | 0.8 | 0.82 ± 0.02 |
| GS27 | 1.0 | 0.96 ± 0.04 | 0.8 | 0.81 ± 0.04 |
| OVERTURE | ||||
| OT01 | 0.5 | 0.49 ± 0.02 | 0.4 | 0.40 ± 0.02 |
| OT02 | 0.75 | 0.76 ± 0.01 | 0.4 | 0.41 ± 0.02 |
| OT03 | 1.0 | 0.99 ± 0.03 | 0.4 | 0.40 ± 0.03 |
| OT13 | 0.5 | 0.49 ± 0.05 | 0.6 | 0.61 ± 0.02 |
| OT14 | 0.75 | 0.76 ± 0.03 | 0.6 | 0.60 ± 0.01 |
| OT15 | 1.0 | 1.01 ± 0.04 | 0.6 | 0.60 ± 0.01 |
| OT25 | 0.5 | 0.51 ± 0.01 | 0.8 | 0.81 ± 0.01 |
| OT26 | 0.75 | 0.75 ± 0.01 | 0.8 | 0.81 ± 0.02 |
| OT27 | 1.0 | 0.98 ± 0.03 | 0.8 | 0.82 ± 0.02 |
| SemiSoft | Et [MPa] | σX [MPa] | σm [MPa] |
εm [%] |
| Mean | 26.2 | 3.2 | 10.0 | 240.6 |
| Min | 24.3 | 3.1 | 9.9 | 239.7 |
| Max | 27.7 | 3.2 | 10.1 | 241.3 |
| SD | 1.3 | 0.03 | 0.1 | 0.6 |
| SUNLU | Et [MPa] | σX [MPa] | σm [MPa] |
εm [%] |
| Mean | 29.3 | 3.9 | 10.9 | 240.0 |
| Min | 27.0 | 3.6 | 10.0 | 239.6 |
| Max | 32.3 | 4.1 | 11.3 | 240.8 |
| SD | 2.2 | 0.2 | 0.2 | 0.4 |
| GEEETECH | Et [MPa] | σX [MPa] | σm [MPa] |
εm [%] |
| Mean | 26.9 | 3.5 | 10.6 | 240.7 |
| Min | 23.3 | 3.4 | 10.4 | 239.8 |
| Max | 29.6 | 3.6 | 10.8 | 241.6 |
| SD | 2.4 | 0.1 | 0.2 | 0.7 |
| OVERTURE | Et [MPa] | σX [MPa] | σm [MPa] |
εm [%] |
| Mean | 17.9 | 2.5 | 9.1 | 239 |
| Min | 17.1 | 2.4 | 9.0 | 237.5 |
| Max | 18.9 | 2.5 | 9.1 | 239.9 |
| SD | 0.6 | 0.02 | 0.1 | 0.9 |
| Extrudr FlexSemiSoft | ||||||||
| 0.4 mm | 0.6 mm | 0.8 mm | ||||||
| Sample | Fmax [N] | σD [MPa] | Sample | Fmax [N] | σD [MPa] | Sample | Fmax [N] | σD [MPa] |
| - | - | - | FS23 | 6918 ± 66 | 3.52 ± 0.03 | FS33 | 4171 ± 38 | 2.13 ± 0.02 |
| SUNLU TPU | ||||||||
| 0.4 mm | 0.6 mm | 0.8 mm | ||||||
| Sample | Fmax [N] | σD [MPa] | Sample | Fmax [N] | σD [MPa] | Sample | Fmax [N] | σD [MPa] |
| SL11 | 6607 ± 267 | 3.4 ± 0.16 | SL21 | 5718 ± 222 | 2.9 ± 0.11 | SL33 | 6123 ± 207 | 3.1 ± 0.08 |
| GEEETECH TPU | ||||||||
| 0.4 mm | 0.6 mm | 0.8 mm | ||||||
| Sample | Fmax [N] | σD [MPa] | Sample | Fmax [N] | σD [MPa] | Sample | Fmax [N] | σD [MPa] |
| GS07 | 5533 ± 38 | 2.81 ± 0.06 | GS21 | 5935 ± 221 | 3.02 ± 0.09 | GS33 | 5542 ± 190 | 2.82 ± 0.08 |
| OVERTURE TPU | ||||||||
| 0.4 mm | 0.6 mm | 0.8 mm | ||||||
| Sample | Fmax [N] | σD [MPa] | Sample | Fmax [N] | σD [MPa] | Sample | Fmax [N] | σD [MPa] |
| OT09 | 4585 ± 117 | 2.29 ± 0.06 | OT21 | 5171 ± 45 | 2.55 ± 0.02 | OT33 | 4922 ± 69 | 2.38 ± 0.03 |
| Sample | Gyroid size [mm] |
Gyroid Wall [mm] |
Outer Wall [mm] |
|---|---|---|---|
| Extrudr FlexSemiSoft | |||
| FS23 | 4 | 0.75 | 0.6 |
| FS33 | 6 | 1.0 | 0.8 |
| SUNLU TPU | |||
| SL11 | 4 | 0.75 | 0.4 |
| SL21 | 6 | 1.0 | 0.6 |
| SL33 | 6 | 1.0 | 0.8 |
| GEEETECH TPU | |||
| GS07 | 6 | 0.5 | 0.4 |
| GS21 | 6 | 1.0 | 0.6 |
| GS33 | 6 | 1.0 | 0.8 |
| OVERTURE TPU | |||
| OT09 | 6 | 1.0 | 0.4 |
| OT21 | 6 | 1.0 | 0.6 |
| OT33 | 6 | 1.0 | 0.8 |
Disclaimer/Publisher’s Note: The statements, opinions and data contained in all publications are solely those of the individual author(s) and contributor(s) and not of MDPI and/or the editor(s). MDPI and/or the editor(s) disclaim responsibility for any injury to people or property resulting from any ideas, methods, instructions or products referred to in the content. |
© 2025 by the authors. Licensee MDPI, Basel, Switzerland. This article is an open access article distributed under the terms and conditions of the Creative Commons Attribution (CC BY) license (http://creativecommons.org/licenses/by/4.0/).


