
Submitted:
09 December 2025
Posted:
09 December 2025
You are already at the latest version
Abstract
Vegetation indices (VIs) offer potential for non-destructive olive fruit quality moni-toring, yet their performance across diverse germplasm remains uncharacterized. This exploratory screening systematically evaluated 87 VIs for predicting chlorophyll and polyphenol content across 31 cultivars at four ripening stages, prioritizing genetic diver-sity to establish species-level biochemical-spectral relationships through integration of hyperspectral data (380-1080 nm) with biochemical analyses.
Modified Chlorophyll Absorption Ratio Index and Transformed Chlorophyll Ab-sorption achieved 91 strong correlations (|r| ≥ 0.9) across 124 cultivar-stage combina-tions. High-performing indices incorporated 550 nm with red/red-edge bands (670-710 nm) and non-linear formulations. Moderate inter-cultivar variability (CV = 19.7-21.3%) in-dicated cultivar-specific calibrations may be necessary.
Principal component analysis captured 99.8% of variance, revealing three biochemi-cal clusters: high-chlorophyll cultivars (n=5; 450/4078 mg/kg chlorophyll/polyphenols), typical-range cultivars (n=23; 70/4750 mg/kg), and elite cultivars (n=3; 855/6260 mg/kg), demonstrating VI capacity for cultivar discrimination.
Chlorophyll degradation exhibited conserved patterns (p < 0.001), supporting uni-versal tracking models. Conversely, polyphenol dynamics displayed marked geno-type-dependency, with cultivars showing positive, negative, or minimal variation, yield-ing non-significant population-level effects (p = 0.969) despite robust cultivar-specific trends.
Keywords:
vegetation indices
; chlorophyll content
; polyphenol content
; olive
; ripening stage
1. Introduction
Olive (Olea europaea L.) fruits undergo profound biochemical and physiological changes during ripening, directly influencing both the technological and nutraceutical quality of fruits and the resulting oil. Among the most relevant biochemical constituents, chlorophylls and polyphenols play a key role in determining oil color, oxidative stability, and health-promoting properties [1]. Chlorophylls, mainly chlorophyll a and b, prevail in unripe drupes, conferring the characteristic green color and sustaining photosynthetic activity. As ripening progresses, chlorophyll degradation accompanies the conversion of chloroplasts into chromoplasts, while carotenoids and anthocyanins accumulate, driving the color shift from green to purple or black [2,3]. The two chlorophylls typically degrade in parallel, maintaining an approximately constant a/b ratio (~3:1), a parameter that reflects the physiological status of the photosynthetic apparatus [4]. Chlorophylls also influence the oxidative stability of olive oil [5]. Polyphenols, in turn, are a heterogeneous class of secondary metabolites responsible for the antioxidant activity, sensory properties, and stability of olive oil. Their biological importance is well recognized by the European Union, which authorizes health claims linking olive oil polyphenols to the protection of blood lipids from oxidative stress [6]. Beyond their nutritional value, polyphenols act as primary antioxidants during storage, delaying oxidation processes, and preserving oil freshness. Their concentration strongly affects sensory attributes, shelf life, and the nutritional value of olive oil, and its evolution throughout drupe maturation has been widely investigated [7]. Indeed, polyphenol concentration is typically high in early fruit development and decline markedly during ripening, with the extent of reduction varying among cultivars and depending on environmental factors [8]. The quantification of both metabolites is conventionally performed through destructive analytical assays based on extracts obtained from fruit or oil samples. To determine optimal harvest timing that balances yield and quality, several ripening indices have been proposed, often relying on simple, easily measurable parameters such as skin color [9]. However, these indices are affected by cultivar-specific characteristics and environmental variability, limiting their general applicability. In contrast, spectroscopic techniques provide a non-destructive, rapid, and sensitive alternative to traditional chemical analyses. Hyperspectral imaging enables simultaneous, non-destructive monitoring of multiple parameters and repeated analysis of the same samples, allowing the development of predictive models for identify different cultivar, ripening stage or key fruit traits such as moisture, dry matter, oil content, and total phenolics [10,11,12,13] Despite extensive biochemical characterization of olive fruit maturation, several critical knowledge gaps remain, and most spectroscopic studies have focused on leaves or oils, with limited research addressing in situ quantification of secondary metabolites in intact fruits during ripening [14].
Vegetation indices (VIs) have been widely applied in agricultural remote sensing for crop monitoring and quality assessment [15,16], but their systematic evaluation for predicting biochemical dynamics in olive fruits remains largely unexplored [17,18]. The majority of available VIs—originally developed for canopy-level vegetation monitoring, stress detection, or leaf pigment estimation—have not been tested for their suitability in tracking ripening-associated biochemical changes in olive drupes, leaving uncertainty about which spectral formulations and wavelength combinations are optimal for this specific application [19]. Furthermore, while cultivar-specific variation in chlorophylls and polyphenol dynamics has been documented, the relative contribution of conserved physiological mechanisms versus genotype-dependent regulation remains poorly understood, limiting the development of robust, germplasm-wide predictive models. Additionally, conventional ripening indices based on visual parameters are affected by cultivar-specific characteristics and environmental variability, reducing their reliability for harvest optimization across diverse production systems.
The present study represents the first phase of a systematic research program for vegetation index performance evaluation in olive fruit biochemical phenotyping. This exploratory screening prioritizes genetic diversity over within-cultivar replication to establish species-level relationships between spectral signatures and biochemical dynamics across diverse germplasms. A library of 87 vegetation indices was systematically assessed against biochemical data collected from thirty-one cultivars at four ripening stages, representing the most extensive germplasm-wide VI performance comparison conducted to date for olive fruit quality assessment. This foundational phase pursued three primary objectives: (i) identify vegetation indices exhibiting consistent correlations with chlorophylls and polyphenol content across diverse genotypes, determining optimal spectral formulations and wavelength combinations that capture species-level biochemical patterns; (ii) quantify inter-cultivar variability in VI-chemical relationships to distinguish conserved physiological processes from genotype-dependent metabolic strategies, thereby assessing the feasibility of universal versus cultivar-specific calibration approaches; and (iii) characterize the range and directionality of cultivar-level patterns in chlorophyll degradation and polyphenol accumulation dynamics across the germplasm panel.
The outcomes of this germplasm-wide screening will guide the design of subsequent validation studies employing higher within-cultivar replication to develop cultivar-specific predictive coefficients for operational deployment. By establishing general VI-chemical relationships and quantifying cultivar-specific variability boundaries, this work provides the foundation for targeted selection of cultivars and indices for intensive calibration efforts aimed at optimizing harvest timing in commercial production environments.
2. Materials and Methods
2.1. Plant Material and Olive Sampling
A total of thirty-one olive cultivars were harvested from the “Santa Paolina” experimental farm of the National Research Council of Italy (CNR), situated in Follonica, Central Italy (42°56′39″ N, 10°46′16″ E; 38 m a.s.l.) and were included in the study (Table 1). All cultivars were grown under uniform environmental conditions at a single site. The genotypes encompassed a broad genetic background representative of the main olive-growing areas, including Spain, Turkey, Croatia, France, and various Italian regions. Fruit sampling was performed between early October and late November 2024, collecting drupes from different canopy positions of each tree and across successive ripening stages. Four maturity levels were identified on the basis of visual evaluation of peel coloration (M1: 100% green; M2: small reddish spots; M3: turning color; M4: 100% purple or black), following the classification reported by Alamprese et al. [20]. For each ripening stage, ten uniform and defect-free drupes were selected for spectral acquisition. Reflectance measurements were acquired at two opposing positions on each fruit (apical and stylar sides) to account for spatial variation in surface coloration, yielding a total of 2,480 spectra (31 cultivars × 4 ripening stages × 10 fruits × 2 positions). For each cultivar, spectral data were averaged wavelength-by-wavelength across all replicates (10 fruits × 2 positions) to obtain representative reflectance profiles (124).
2.2. Hyperspectral Measurement Processing
Spectral reflectance data were collected using an HR2 spectrometer (Ocean Optics, Orlando, FL, USA) covering the 380–1080 nm range with a spectral resolution of 0.46 nm. The setup included a 45° diffuse reflectance probe (DR-Probe, Ocean Optics) integrated with a tungsten–halogen light source, connected via a 6 μm core optical fiber. A 40 mm stand-off spacer ensured a constant measurement distance and minimized ambient light interference. Custom-designed masks were used to match the size of the olives and to confine the measurement area exclusively to the fruit surface. Each mask was coated with ultra-matte black acrylic paint exhibiting up to 98% visible light absorption to prevent reflectance contamination. Instrumental drift was controlled by applying a dark current correction after each cultivar set. Additionally, a white reference spectrum from a certified reflective standard was recorded every five samples to normalize the data and express the radiance as percent reflectance, compensating for light source and sensor variability.
2.3. Chlorophyll a and b Determination by HPLC-DAD
Fruit chlorophyll a and b contents were determined following Arar [21] with some modifications. Briefly, 0.5 g of homogenized fresh fruit was extracted with 20 ml acetone/water (80:20, v/v) and sonicated for 20 min. Then, the extract was centrifuged at 2500 rpm for 10 min at 4° C in centrifuge, and the supernatant was recovered. An aliquot of 1 ml of the supernatant was filtered through a 0.22 µm polytetrafluoroethylene (PTFE) syringe filter (Millipore Ltd., Bedford, MA, USA) and used for subsequent analysis. Analysis of chlorophylls was performed using a high-performance liquid chromatography (HPLC) system (Shimadzu, Kyoto, Japan) equipped with autosampler and photodiode array (PDA) detector. Chromatographic separation was carried out on a C18 column (Zorbax® Eclipse Plus, Agilent Technologies, USA) using a gradient elution. Eluents A and B were H2O and methanol, respectively, both containing 20 mM ammonium acetate. The detection wavelength was set at 432 nm for chlorophyll a and 460 nm for chlorophyll b.
2.4. Total Polyphenols Determination by UV–VIS Spectrophotometry
Total polyphenols of olive drupe were quantified using a solid–liquid extraction followed by colorimetric determination with a modified Folin–Ciocalteu method [22] Approximately 1 g of homogenized sample was weighed and mixed with 10 ml of extraction solvent (acetone/water 80:20, v/v, containing 0.1% HCl). Then, the mixture was sonicated for 15 min and subsequently shaken for 30 min. Samples were, then, centrifuged at 3000 rpm for 5 min, and the supernatant was recovered and transferred into a 25 ml volumetric flask, brought to volume with ultrapure water, and filtered through a 0.45 µm membrane filter. An aliquot of 5 ml of the extract was mixed with 25 mL of ultrapure water, 2.5 mL of Folin–Ciocalteu reagent, and 10 mL of 20% (w/v) sodium carbonate solution. The mixture was then brought to 50 mL volume with ultrapure water in a volumetric flask. A reagent blank was prepared by mixing 2.5 mL of Folin–Ciocalteu reagent and 10 mL of 20% (w/v) sodium carbonate solution and ultrapure water. All flasks were kept in the dark for 2 h, after which absorbance was measured at 750 nm using a UV–VIS spectrophotometer. Total polyphenol content was expressed as gallic acid equivalents (GAE).
2.5. Vegetation Index Computation
A comprehensive set of 87 vegetation indices (VIs) was selected through systematic literature review, focusing specifically on indices relevant to fruit maturation physiology (Table S1). The selection strategy prioritized indices sensitive to key biochemical processes during ripening, including chlorophyll degradation, carotenoid dynamics, and structural modifications. To ensure comprehensive coverage of potential spectral responses, multiple indices targeting similar biochemical processes were deliberately included, enabling identification of the most effective formulations for assessing olive maturation. From the full hyperspectral dataset, only wavelengths specifically required for VI calculation were extracted to optimize computational efficiency. A comprehensive list of required wavelengths was compiled from the mathematical formulations of all 87 indices, identifying 54 unique wavelengths. A custom Visual Basic macro was developed to systematically extract these specific wavelengths from the complete spectral database. All 87 vegetation indices were then computed from this reduced dataset according to their respective mathematical formulations and evaluated as candidate predictors for the biochemical target variables.
2.6. Data Structure and Preprocessing
The analysis was conducted on a dataset of 124 observations, corresponding to 31 olive cultivars evaluated at four distinct ripening stages (M1, M2, M3, M4), with each cultivar-stage combination representing an individual data point. Target variables included chlorophyll a content (Chl_A), chlorophyll b content (Chl_B), total chlorophyll content (Chl_A+B), and total polyphenol content (Polyphenol).
2.7. Selection of Vegetation Indices Correlated with Chemical Parameters
A multi-step statistical framework was developed to identify vegetation indices (VIs) most strongly and consistently correlated with chemical parameters (chlorophyll a, chlorophyll b, total chlorophyll, and polyphenols) across olive cultivars at different ripening stages (M1-M4).
For each VI, correlation coefficients were computed between the VI values and each chemical parameter across all cultivars. A correlation was classified as "strong" if its absolute value exceeded a predefined threshold (τ = 0.9). To assess sensitivity to this threshold choice, the analysis was repeated using τ ∈ {0.8, 0.85, 0.9, 0.95}, and the stability of the top-ranked VIs across thresholds was evaluated. For each VI, a composite score was calculated as:
Total Score = Σ (|r_ij| ≥ 0.9)
where i represents each cultivar-target variable combination and j represents each vegetation index. This binary scoring system assigned equal weight to all correlations meeting the threshold criterion, providing an objective ranking based on consistency of strong predictive relationships.
To quantify the consistency of correlations across cultivars, a stability metric was computed for each top-ranked VI. For each VI-chemical parameter pair, all cultivar-specific correlation coefficients were collected, and the coefficient of variation (CV) of the absolute correlation values was calculated:
where σ|r| and μ|r| are the standard deviation and mean of absolute correlation coefficients, respectively.
CV = (σ|r| / μ|r|) × 100
To evaluate whether the observed correlation scores exceeded chance expectations, a permutation test was additionally performed. In each iteration, chemical parameter values were randomly shuffled while maintaining VI structure, and the maximum Total Score across all VIs was recorded to construct a null distribution. P-values were calculated as the proportion of permuted scores equal to or exceeding the observed scores. Statistical significance was denoted as: *** (p < 0.001), ** (p < 0.01), * (p < 0.05), or ns (p ≥ 0.05). A final robustness score incorporating all three criteria was computed for each VI:
Weighted Score = Total Score × Stability Weight × Significance Weight
VIs were ranked according to their Weighted Score for subsequent selection.
Elbow Method was employed to determine the optimal subset size of VIs most strongly and consistently correlated with chemical parameters, thereby reducing noise from weakly correlated indices in subsequent multivariate analysis. It identifies the point of diminishing returns where adding more VIs yields minimal improvement in correlation strength. Three algorithms were applied to detect the inflection point in the Weighted Score curve: i) maximum curvature (identification of maximum absolute value in the second derivative of normalized scores); ii) Kneedle Algorithm (maximum perpendicular distance from the score curve to the line connecting first and last points); and iii) Threshold Method (First position where Weighted Score fell below 70% of maximum). The median of these three estimates provided a consensus elbow position. Compositional stability was assessed using Jaccard similarity coefficients between top-N VIs and incrementally larger sets (top-N+k, k = 1...5). The optimal N was identified where the rate of change in mean Jaccard similarity fell below 1%, indicating that additional VIs no longer substantially altered subset composition. The final optimal number was determined as the median of values from both methods.
2.8. Principal Component Analysis and Cultivar Clustering
VI values and chemical parameters were averaged across the four ripening stages (M1-M4) for each cultivar, yielding cultivar-level mean profiles. Principal Component Analysis (PCA) was performed on the matrix of cultivar-level VI means (n cultivars × m selected VIs) using standardized variables (mean = 0, variance = 1). The first two principal components (PC1 and PC2) were extracted, and their contribution to total variance was reported. Variable contributions (loadings) and quality of representation (cos²) were computed for each VI to identify the most influential indices. To validate the PCA-based grouping, k-means clustering was performed directly on the standardized chemical parameter matrix. The optimal number of clusters (k) was determined using the elbow method (within-cluster sum of squares) and silhouette analysis. Cluster assignments were compared with the PCA-based grouping to assess consistency between VI-predicted and chemistry-based cultivar classifications.
ANOVA was performed to test the effect of ripening stage on each chemical parameter across all cultivars. Normality of residuals was assessed using the Shapiro-Wilk test, and homoscedasticity was evaluated using Levene's test. When parametric assumptions were violated (p < 0.05), the non-parametric Kruskal-Wallis test was applied. Post-hoc multiple comparisons were conducted using Tukey's HSD test for parametric analyses or Dunn's test with Bonferroni correction for non-parametric analyses.
All the above-mentioned analyses were performed using R (version 4.4.2) using the following packages: readxl for data import, dplyr for data manipulation, ggplot2 and ggrepel for visualization, car and agricolae for ANOVA, dunn.test for non-parametric cluster post-hoc tests, factoextra and NbClust for PCA and clustering, and corrplot for correlation matrix visualization. Custom functions were developed for robustness analysis and optimal VI selection. Statistical significance was set at α = 0.05 unless otherwise specified.
3. Results
3.1. Selection of Vegetation Indices
The analysis evaluated 87 vegetation indices across 31 olive cultivars at four ripening stages (M1-M4) against four chemical parameters (chlorophyll a, chlorophyll b, total chlorophyll, and polyphenols). The objective determination of optimal VI subset size revealed substantial agreement. The Elbow Method, which identifies the inflection point where incremental performance gains diminish, was decomposed into three complementary algorithms: (i) curvature detection via second-derivative analysis (optimal n = 10), (ii) the Kneedle algorithm measuring perpendicular distance from the score-rank linear trend (n = 12), and (iii) a 70%-threshold criterion identifying the point where weighted scores fell below 70% of the maximum value (n = 11). These three independent estimates converged on a median of n = 11 (Table 1), indicating robust detection of the performance plateau. This multi-method convergence provides objective validation that 11 vegetation indices (representing 87.4% reduction from the original 87-index set) capture the core predictive information while maintaining a Total Score of 71 (78% of maximum).
The top-ranked vegetation indices accounted a Total Scores ranging from 71 to 91 strong correlations (|r| ≥ 0.9) across cultivar-parameter combinations. ‘Mod_Chl_Abs_Ratio_Index’ and ‘Transformed_Chl_Absorbtion’ achieved 91 instances (over a total of 124) of strong correlation across 31 cultivars and 4 chemical parameters, representing consistent predictive capacity across diverse germplasm.
However, correlation stability metrics revealed moderate variability across cultivars, with coefficient of variation values ranging from 19.7% to 21.3% for the first eleven indices. This inter-cultivar variability resulted in Weighted Scores (42.2-72.8) substantially much lower than raw Total Scores, indicating that while these VIs exhibit strong correlations in individual cultivars, the magnitude and direction of correlations show moderate inconsistency across the population. This finding suggests cultivar-specific calibration may be necessary for operational deployment of VI-based chemical estimation models.
3.2. Principal Component Analysis and Chemical Parameter Relationships
The Principal Component Analysis (PCA) performed on cultivar-level aggregated data (31 cultivars × top-ranked 11 VIs) successfully captured 99.8% of total variance in the chemical dataset using only two principal components (PC1: 76.5%, PC2: 23.3%), demonstrating the high dimensionality reduction efficiency and the presence of strong underlying chemical patterns among olive cultivars (Figure 1).
K-means clustering applied directly to cultivar-level chemical parameters identified three clusters, revealing substantial between-cluster chemical variation.
The first cluster encompasses 5 cultivars positioned in the negative PC1 space, including the cultivars Intosso, Niedda, Obliga, Piangente, and Raza. This cluster exhibits a compact spatial distribution with cultivars clustering extending toward positive PC1 values and around negative PC2 values between -0.5 and -1.5, suggesting unique chemical signatures within this group. These cultivars maintained substantially higher chlorophyll concentrations throughout the ripening process, with chlorophyll a chlorophyll b and polyphenols levels averaging at 263, 186 and 4078 mg g-1, respectively.
A second group contains 23 cultivars distributed across negative PC1 values, containing varieties such as Bella di Spagna, Bianchera, Carboncella, Leccino, and Oliva Rossa. Key characteristics included a broader spatial dispersion along PC2 (-2.5 to +2.5) axes. Within this group, cv Salegna appears as an outlier, extending toward positive PC1 values and indicating distinctive chemical signatures. This group was characterized by low chlorophyll levels, with chlorophyll a, chlorophyll b and polyphenols levels averaging 43.3, 26.2 and 4753 mg g-1, respectively. This larger group represents what could be termed the "typical" chlorophyll range for most olive cultivars in the study.
The third group contains the remaining 3 cultivars (Coratina, Maurino, Moraiolo) distributed across positive PC1 values with a broader spatial dispersion along PC2 (-1 to +1.5) axes. It was characterized by the highest values, with chlorophyll a, chlorophyll b and polyphenols levels averaging 498, 357 and 6260 mg g-1, respectively. Critically, correlation analysis between PC scores and chemical parameters revealed uniformly weak relationships: PC1 correlated with chlorophyll a (r = -0.007), chlorophyll b (r = 0), total chlorophyll (r = -0.004), and polyphenols (r = 0.21); PC2 showed marginally stronger but still weak correlations with chlorophylls (r = 0.24-0.25) and polyphenols (r = 0.17). All correlations remained below the conventional threshold for practical predictability (|r| < 0.3). This discrepancy between VI-derived principal components and measured chemical parameters presents a significant interpretive challenge. While the selected VIs demonstrated strong within-cultivar correlations during ripening progression (|r| ≥ 0.9 at the stage-by-stage level), aggregation to cultivar-level means appears to collapse this variation, resulting in PC axes that capture inter-cultivar spectral differences orthogonal to the measured chemistry.
3.3. Chlorophyll Content
All the cultivars exhibited strong negative correlations between ripening stage and chlorophyll content (Table 2), consistent with chlorophyll degradation during fruit maturation. Cultivars such as Coratina (Ch_B: r = -0.999, p < 0.001), Bella di Spagna (Ch_A: r = -0.998, p < 0.01; Ch_A+B: r = -0.997, p < 0.01), Dolce d’Andria (Ch_B: -0.991, p < 0.01), XVII-87 (Ch_B: r = -0.996, p < 0.01), and Leccio del Corno (Ch_B: r = -0.993, p < 0.01), and Raccioppella (Ch_A: r = -0.997, p < 0.01) demonstrated particularly robust and statistically significant relationships. Conversely, Oblonga showed weaker negative correlations (r = -0.696 to -0.726, ns), suggesting more gradual or variable chlorophyll loss. The detection of statistically significant correlations with limited per-cultivar sample size (n=4) indicates that observed patterns exceed detection thresholds given low statistical power. However, non-significant correlations (even with |r| > 0.80) should not be dismissed, as they may represent genuine biological trends undetectable at n=4 due to insufficient degrees of freedom.
The cultivar-specific negative correlations between ripening stage and chlorophyll content are consistent with population-level statistical trends. Non-parametric Kruskal-Wallis tests demonstrated highly significant global effects of ripening stage on all chlorophyll fractions (Ch_A: χ² = 21.85, p < 0.001; Ch_B: χ² = 20.89, p < 0.001; Ch_A+B: χ² = 22.44, p < 0.001), with chlorophyll degradation particularly pronounced between early (M1) and advanced maturation stages (M3-M4) (Table A1, Appendix A). The concordance between individual cultivar patterns (31 of 31 cultivars exhibited negative relationships with mean |r| = 0.93) and the significant population-level effect indicates that chlorophyll degradation is a conserved biochemical process across olive genotypes, with quantitative rather than qualitative variation among cultivars.

Table 2.
Pearson correlation coefficients between ripening stage and chemical parameters across cultivars.
Table 2.
Pearson correlation coefficients between ripening stage and chemical parameters across cultivars.
| Cultivars | Chl_A | Chl_B | Chl_A+B | Polyphenols | ||||
| Bella di Spagna | -0.998 | ** | -0.995 | ** | -0.997 | ** | -0.403 | ns |
| Bianchera | -0.935 | ns | -0.904 | ns | -0.930 | ns | 0.995 | ** |
| Carboncella | -0.871 | ns | -0.862 | ns | -0.869 | ns | 0.395 | ns |
| Coratina | -0.972 | * | -0.999 | *** | -0.991 | ** | -0.939 | ns |
| Dolce d’Andria | -0.930 | ns | -0.991 | ** | -0.969 | * | 0.982 | * |
| Farga | -0.975 | * | -0.889 | ns | -0.982 | * | -0.963 | * |
| Frantoio | -0.962 | * | -0.914 | ns | -0.944 | ns | 0.978 | * |
| II-82 | -0.855 | ns | -0.965 | * | -0.882 | ns | 0.782 | ns |
| Intosso | -0.928 | ns | -0.952 | * | -0.964 | * | 0.986 | * |
| Leccino | -0.986 | * | -0.955 | * | -0.978 | * | -0.753 | ns |
| Leccio del Corno | -0.971 | * | -0.993 | ** | -0.982 | * | 0.991 | ** |
| Marzio | -0.978 | * | -0.988 | * | -0.991 | ** | 0.020 | ns |
| Maurino | -0.863 | ns | -0.768 | ns | -0.830 | ns | 0.966 | * |
| Moraiolo | -0.928 | ns | -0.963 | * | -0.954 | * | -0.842 | ns |
| Morchiaio | -0.926 | ns | -0.898 | ns | -0.933 | ns | -0.981 | * |
| Niedda | -0.964 | * | -0.969 | * | -0.966 | * | 0.980 | * |
| Obliga | -0.978 | * | -0.968 | * | -0.975 | * | 0.942 | ns |
| Oblonga | -0.740 | ns | -0.696 | ns | -0.726 | ns | 0.796 | ns |
| Oliva_Rossa | -0.970 | * | -0.924 | ns | -0.962 | * | -0.988 | * |
| Pendolino | -0.839 | ns | -0.831 | ns | -0.837 | ns | 0.959 | * |
| Piangente | -0.959 | * | -0.981 | * | -0.970 | * | 0.986 | * |
| Picholine | -0.842 | ns | -0.828 | ns | -0.836 | ns | 0.276 | ns |
| Raccioppella | -0.997 | ** | -0.987 | * | -0.995 | ** | 0.054 | ns |
| Raza | -0.859 | ns | -0.799 | ns | -0.832 | ns | -0.985 | * |
| Roggianella | -0.944 | ns | -0.945 | ns | -0.948 | ns | 0.978 | * |
| Rossellino | -0.855 | ns | -0.856 | ns | -0.855 | ns | -0.995 | ** |
| Salegna | -0.947 | ns | -0.939 | ns | -0.944 | ns | 0.953 | * |
| Sargano | -0.841 | ns | -0.861 | ns | -0.850 | ns | -0.965 | * |
| SariHasebi | -0.993 | ** | -0.933 | ns | -0.989 | * | -0.953 | * |
| XVII-87 | -0.975 | * | -0.996 | ** | -0.991 | ** | 0.998 | ** |
| XXXVI | -0.937 | ns | -0.932 | ns | -0.936 | ns | 0.739 | ns |
3.4. Total Polyphenols Content
Polyphenol dynamics during ripening revealed contrasting patterns among cultivars (Table 2), reflecting diverse biosynthetic strategies. Approximately half of the cultivars exhibited significant positive correlations with ripening stage, including Bianchera (r = 0.995, p < 0.01), Leccio del Corno (r = 0.991, p < 0.01), Intosso (r = 0.986, p < 0.05), Piangente (r = 0.986, p < 0.05), and Dolce d’Andria (r = 0.982, p < 0.05), indicating progressive polyphenol accumulation throughout maturation. In contrast, other cultivars displayed strong negative correlations, with Rossellino (r = -0.995, p < 0.01), Oliva Rossa (r = -0.988, p < 0.05), Raza (r = -0.985, p < 0.05), Morchiaio (r = -0.981, p < 0.05), and Farga (r = -0.963, p < 0.05) showing significant polyphenol degradation during ripening. Notably, cultivars such as Marzio (r = 0.02, ns) and Raccioppella (r = 0.054, ns) showed minimal variation, suggesting cultivar-specific regulation of phenolic metabolism during fruit development.
The contrasting directional patterns observed among individual cultivars—with some exhibiting positive correlations and others negative correlations between ripening and polyphenol content—effectively cancel each other when data are pooled across the entire population. Consequently, neither ANOVA nor Kruskal-Wallis tests detected significant global effects of maturation on polyphenol content (χ² = 0.25, p = 0.969; detailed statistical analysis in Table A1, Appendix A), masking biologically meaningful variation. This absence of species-level effects despite robust cultivar-specific trends underscores the necessity of cultivar-level phenotyping in agricultural research, as aggregated analyses can obscure the metabolic diversity inherent to different genotypes and lead to erroneous conclusions about the absence of ripening-related biochemical changes.
4. Discussion
The results of the present research clearly demonstrate that vegetation indices can effectively track biochemical changes during olive fruit ripening, with the top-ranked indices achieving strong correlations with chlorophyll and polyphenol content across multiple cultivars.
The Modified Chlorophyll Absorption Ratio Index and Transformed Chlorophyll Absorption demonstrated particularly robust performance, accumulating 91 strong correlations across 124 cultivar-stage combinations. These findings align with previous research showing that chlorophyll-sensitive indices, particularly those utilizing wavelengths in the 550-780 nm range, provide accurate estimation of photosynthetic pigment content in agricultural applications [23,24].The effectiveness of these indices in capturing chlorophyll degradation dynamics is consistent with the well-documented color transition in olive fruits, where progressive chlorophyll loss during ripening is accompanied by anthocyanin accumulation [25]. The strong negative correlations observed between maturation stage and chlorophyll fractions (χ² = 21.85-22.44, p < 0.001) confirm that VIs successfully capture this fundamental physiological process across diverse genetic backgrounds.
A critical finding of this study is the moderate inter-cultivar variability in VI-chemical relationships, as evidenced by coefficient of variation values ranging from 19.7% to 21.3% for the top-performing indices. This variability resulted in substantial reductions in Weighted Scores compared to raw Total Scores, indicating that while VIs exhibit strong correlations within individual cultivars during ripening progression, the magnitude and direction of these relationships show moderate inconsistency across the germplasm panel. This observed inter-cultivar variability in spectral-chemical relationships is consistent with cultivar-specific physiological processes during fruit maturation. Previous research has demonstrated that the relative rates of chlorophyll and carotenoid degradation differ markedly among olive varieties [25], suggesting that pigment catabolism occurs at rates inherent to each genotype.
The divergent polyphenol accumulation patterns observed among cultivars represent one of the most significant findings of this study. Approximately half of the cultivars in our germplasm panel exhibited significant positive correlations between ripening stage and polyphenol content, while others showed strong negative correlations, with a smaller subset displaying minimal variation throughout maturation. This marked inter-cultivar heterogeneity reflects the complex, genotype-dependent nature of phenolic compound dynamics during olive fruit ripening. Previous research has documented similarly contrasting patterns: while some studies report increases in total phenols with ripening progression [26,27], others have observed declining trends [28,29,30] or non-linear patterns characterized by initial decreases followed by subsequent increases in advanced maturity stages [30]. These findings underscore that polyphenol accumulation is governed by cultivar-specific regulation of phenylpropanoid pathway genes and differential enzymatic activities, resulting in genotype-specific biochemical signatures that fundamentally impact the universality of spectral-chemical relationships across diverse germplasm.
The absence of significant population-level effects (Kruskal-Wallis χ² = 0.25, p = 0.969) despite robust cultivar-specific trends reveals a critical limitation of aggregated analyses in germplasm studies. The contrasting directional patterns observed among individual cultivars—with some exhibiting positive correlations and others negative correlations between ripening and polyphenol content—effectively cancel each other when data are pooled across the entire population, masking biologically meaningful variation. This phenomenon underscores the necessity of cultivar-level phenotyping in agricultural research, as population-level analyses alone can obscure the metabolic diversity inherent to different genotypes and lead to erroneous conclusions about the absence of ripening-related biochemical changes.
A critical limitation emerged from the aggregation of temporal data to cultivar-level means. While individual vegetation indices demonstrated strong correlations with chemical parameters during ripening progression within each cultivar, the principal components derived from cultivar-averaged VI data showed uniformly weak correlations with measured chemical parameters. This decoupling indicates that the selected VIs effectively capture ripening dynamics within individual cultivars but are less effective for discriminating baseline chemical composition across cultivars when temporal variation is removed through averaging. This phenomenon represents a well-documented challenge in remote sensing applications, where relationships observed at fine temporal scales often fail to translate to coarser aggregation levels. The temporal averaging process obscures the stage-specific VI-chemical relationships that drive the strong within-cultivar correlations, particularly when these relationships exhibit non-linear or cultivar-dependent trajectories. This finding has important practical implications: while VI-based systems can effectively monitor ripening progression and optimize harvest timing for individual cultivars (provided cultivar-specific calibrations are developed), VIs alone may be insufficient for chemical phenotyping across diverse germplasm when temporal structure is collapsed through averaging. The observed weak cultivar-level correlations likely reflect the multifactorial nature of fruit spectral signatures, which integrate not only the measured chemical parameters (chlorophylls and total polyphenols), but also morphological traits such as epicarp thickness, surface wax composition, and fruit geometry, as well as unmeasured biochemical components including anthocyanins, specific carotenoid fractions, and detailed phenolic class distributions [17]. Consequently, effective cultivar-level chemical discrimination may require either preservation of temporal dynamics in predictive models or expansion of the analytical framework to encompass a more comprehensive biochemical characterization that captures the full complexity of spectral-chemical relationships in olive fruits.
Future work should consider several complementary strategies to address the limitations identified in this study and enhance the operational utility of VI-based phenotyping systems for olive fruit quality assessment. First, preservation of temporal structure in predictive models is essential, potentially through trajectory-based or time-series approaches that maintain stage-specific VI-chemical relationships rather than collapsing variation through cultivar-level averaging. Second, expansion of the chemical analytical panel to include anthocyanins, specific carotenoid fractions, and detailed phenolic class distributions would provide a more comprehensive biochemical characterization capable of explaining the multifactorial nature of fruit spectral signatures. Third, integration of advanced machine learning approaches such as convolutional neural networks or ensemble methods may capture complex non-linear relationships between spectral features and chemical composition that conventional VI formulations cannot detect. Finally, development of cultivar-specific or cultivar-adaptive models using techniques such as transfer learning or hierarchical modeling could account for genetic variation while maintaining predictive accuracy across diverse germplasm, enabling broader deployment of spectral-based quality monitoring systems in commercial olive production.
5. Conclusions
This study successfully identified vegetation indices capable of tracking biochemical changes during olive fruit ripening, with important implications for both production systems and breeding programs. The strong within-cultivar temporal correlations demonstrate that VI-based systems can effectively monitor ripening progression and optimize harvest timing, though the moderate inter-cultivar variability in VI-chemical relationships necessitates cultivar-specific calibrations rather than universal models for operational deployment across diverse germplasm.
For breeding applications, the contrasting behaviors between chlorophyll and polyphenol dynamics establish distinct strategic approaches. Chlorophyll content represents a relatively predictable trait with conserved degradation patterns across genotypes, supporting development of universal VI-based tracking models that require validation across additional environmental conditions and harvest seasons. Conversely, polyphenol profiles exhibited marked cultivar-specific diversity, with cultivars displaying positive correlations, or minimal variation throughout maturation.
Future research priorities emerge directly from the temporal aggregation artifacts identified in this study, where strong stage-by-stage correlations collapsed to weak cultivar-level relationships when averaged across ripening stages. Operational VI-based phenotyping systems must preserve ripening trajectory information through time-series approaches or repeated measurements at key developmental stages, enabling extraction of temporal derivatives and trajectory-based features that quantify ripening dynamics rather than instantaneous states. Additionally, expansion of biochemical panels to include anthocyanins, carotenoids, and detailed phenolic class distributions may reduce prediction uncertainty and improve cultivar-level discrimination, thereby bridging the current gap between temporal tracking capacity and cross-cultivar chemical phenotyping.
Supplementary Materials
The following supporting information can be downloaded at: https://www.mdpi.com/article/doi/s1, Figure S1: title; Table S1: title; Video S1: title.
Author Contributions
Conceptualization, G.A., E.R., and M.D.; methodology, G.A., E.R., and M.D.; investigation, G.A., E.R., G.C., B.G., and M.D.; data curation, G.A. and M.D.; writing—original draft preparation, G.A., E.R., B.G., and M.D.; writing—review and editing, G.A., E.R., B.G., and M.D; funding acquisition, E.R. All authors have read and agreed to the published version of the manuscript.
Funding
European Union Next-GenerationEU (PIANO NAZIONALE DI RIPRESA E RESILIENZA (PNRR) – MISSIONE 4 COMPONENTE 2, INVESTIMENTO 1.4 – D.D. 1032 17/06/2022, CN00000022) within the Agritech National Research Center.
Data Availability Statement
The data that support the findings of this study are available from the corresponding author, GA, upon reasonable request.
Conflicts of Interest
The authors declare no conflicts of interest.
Abbreviations
The following abbreviations are used in this manuscript:
| VIs | Vegetation indices |
| PCA | Principal component analysis |
| CV | Coefficient of variation |
| M1 | Ripening stage 1 (100% green skin) |
| M2 | Ripening stage 2 (small reddish spots on skin) |
| M3 | Ripening stage 3 (turning color) |
| M4 | Ripening stage 4 (100% purple or black skin) |
| Chl_A | Chlorophyll a content |
| Chl_B | Chlorophyll b content |
| Chl_A+B | Total chlorophyll (chlorophyll a + chlorophyll b) |
| HPLC | High-performance liquid chromatography |
| DAD | Diode-array detector |
| PDA | Photodiode array (detector) |
| UV–VIS | Ultraviolet–visible (spectrophotometry) |
| PRI | Photochemical reflectance index |
| PTFE | Polytetrafluoroethylene |
| GAE | Gallic acid equivalents |
| NDVI | Normalized Difference Vegetation Index |
| LAI | Leaf area index |
| NIR | Near-infrared |
| SR | Simple ratio (index) |
Appendix A
Population-Level Statistical Analysis of Ripening Effects on Chemical Parameters
While the main text (Table 2) presents cultivar-specific correlations between ripening stage and chemical parameters, this appendix provides complementary population-level analyses using pooled data across all 31 cultivars. These hierarchical approaches—individual genotype responses versus population-level trends—reveal fundamental differences between conserved physiological processes (chlorophyll degradation) and genotype-dependent metabolic strategies (polyphenol dynamics).
The ANOVA and Kruskal-Wallis tests assessed the overall effect of maturation across all cultivars pooled together. These complementary approaches provide insights at different hierarchical levels: individual genotype responses versus population-level trends. The Kruskal-Wallis tests (Table A1) demonstrated highly significant global effects of ripening stage on all chlorophyll fractions (Ch_A: χ² = 21.85, p < 0.001; Ch_B: χ² = 20.89, p < 0.001; Ch_A+B: χ² = 22.44, p < 0.001), despite the parametric ANOVA assumptions being violated due to non-normal residual distributions. Post-hoc Dunn tests revealed that chlorophyll degradation was particularly pronounced between early (M1) and advanced maturation stages (M3: p < 0.01; M4: p < 0.001), with significant decreases also observed from M2 to M4 (p < 0.05). Notably, the M3-M4 transition showed no significant differences, suggesting chlorophyll degradation plateaus in late ripening.
Table A1.
Non-parametric analysis of chemical parameter changes across olive ripening stages using Kruskal-Wallis tests and post-hoc pairwise comparisons (Dunn's test with Bonferroni correction).
Table A1.
Non-parametric analysis of chemical parameter changes across olive ripening stages using Kruskal-Wallis tests and post-hoc pairwise comparisons (Dunn's test with Bonferroni correction).
| Parameter | Kruskal-Wallis | Post-hoc Comparisons (Dunn's test) | ||||
| χ² | df | p-value | Significant Pairwise Differences | |||
| Chl A | 21.85 | 3 | <0.001 | M1>M3 (p=0.004) | M1>M4 (p<0.001) | M2>M4 (p=0.01) |
| Chl B | 20.89 | 3 | <0.001 | M1>M3 (p=0.005) | M1>M4 (p<0.001) | M2>M4 (p=0.02) |
| Chl A+B | 22.43 | 3 | <0.001 | M1>M3 (p=0.003) | M1>M4 (p<0.001) | M2>M4 (p=0.01) |
| Polyphenols | 0.25 | 3 | 0.969 | No significant differences | ||
*, **, *** for p < 0.05, p < 0.01, p < 0.001 respectively, ns = not significant.
In stark contrast, neither ANOVA (F = 0.017, p = 0.997) nor Kruskal-Wallis tests (χ² = 0.25, p = 0.969) detected significant global effects of maturation on polyphenol content. This apparent absence of a population-level trend, however, masks substantial cultivar-specific dynamics revealed in the correlation analysis. Individual cultivars exhibited strong positive correlations (e.g., Bianchera: r = 0.995, p < 0.01; Leccio del Corno: r = 0.991, p < 0.01) or strong negative correlations (e.g., Rossellino: r = -0.995, p < 0.01), with approximately equal numbers of cultivars showing each pattern.
Appendix B
Spectral and Mathematical Determinants of Vegetation Index Performance
The performance ranking of 87 vegetation indices (Table S1) for predicting chlorophyll and polyphenol content in olive fruits revealed substantial variation, with Total Scores ranging from 91 (top performers) to 1 (poorest performers). This appendix provides a systematic analysis of the spectral characteristics and mathematical formulations underlying VI performance, identifying the key determinants of predictive success and failure. Analysis of the top-ranked indices (Total Score: 71-91) revealed a consistent pattern: 8 out of 10 incorporated the 550 nm wavelength. This green reflectance peak represents the region of maximum canopy reflectance in the visible spectrum. The exceptional performance of 550 nm-based indices is well-documented in reflectance spectroscopy literature. Many authors demonstrated that simple ratios of the form R_NIR/R_550 exhibited high sensitivity to chlorophyll content across diverse plant species and tissues, including both leaves and fruits, with linear relationships maintained over wide pigment concentration ranges [31,32,33]. Their work established that while NIR reflectance (700-800 nm) remains relatively insensitive to chlorophyll variation due to minimal pigment absorption in this spectral region, the 550 nm band demonstrates strong sensitivity to pigment dynamics through multiple concurrent mechanisms.
Three primary spectral combinations emerged among top performers:
- 550 + 670—680 nm (n=5 indices, mean score = 83.6): Exploits the green peak versus red chlorophyll absorption minimum
- 550 + 700-710 nm (n=4 indices, mean score = 81.5): Incorporates red-edge transition for enhanced pigment sensitivity
- 550 + 800 nm (n=2 indices, mean score = 83.0): Captures green reflection versus near-infrared (NIR) plateau
The spectral separation (Δλ) in successful indices consistently exceeded 100 nm, ensuring sufficient physiological contrast and minimizing spectral autocorrelation.
Complex mathematical transformations, incorporating non-linear terms (square roots, weighted combinations) dominated the top rankings (Ranks 1, 2, 4, 7). Instead, Normalized Difference formulations appeared in only 2 cases (Ranks 6, 9), representing 13% of top performers and suggesting that simple normalized difference alone is insufficient for optimal olive fruit biochemical assessment.
The three highest-ranked indices (Ranks 1, 2, 4; Total Scores: 86-91) all incorporated non-linear mathematical operations, distinguishing them from standard normalized difference or simple ratio formulations. Critically, these indices demonstrated balanced high performance across both chlorophyll and polyphenol prediction, suggesting their mathematical complexity captures the co-occurring biochemical changes during olive ripening.
- Rank 1 - Modified Chlorophyll Absorption Ratio Index 3 (Score=91):
(((a-670)+(670+b))/√(a^2+1))×700/670
Performance: Chl_A=24, Chl_B=22, Chl_total=25, Polyphenols=20 (over 31)
- Rank 2 - Transformed Chlorophyll Absorption Ratio (Score=91):
3[(R_700-R_670)-0.2(R_700-R_550)]×R_700/R_670
Performance: Chl_A=25, Chl_B=22, Chl_total=25, Polyphenols=19 (over 31)
- Rank 4 - Triangular Chlorophyll Index (Score=86):
1.2(R_700-R_550)-1.5(R_670-R_550)⋅√(R_700/R_670)
Performance: Chl_A=23, Chl_B=20, Chl_total=24, Polyphenols=19 (over 31)
The shared architectural features of these top-performing indices reveal their suitability for multi-component biochemical systems:
1. Multiplicative coupling: All three formulations include product terms (e.g., difference × ratio), which capture interactive effects between spectral bands rather than treating them as independent contributors.
2. Square root transformations: Ranks 1 and 4 incorporate √ terms, which compress the dynamic range of high reflectance values while expanding sensitivity at low values — precisely the behavior needed during olive ripening when chlorophyll absorption bands (670 nm) progressively weaken.
3. Weighted spectral differences: Rank 2 and 4 apply empirical coefficients (0.2, 1.2, 1.5) to different spectral contrasts, effectively creating multi-scale filters that respond to both chlorophyll-specific (670 nm) and broader pigment changes (550-700 nm continuum).
Simple ratio indices (SR = Rλ₁/Rλ₂) achieved high performance when employing spectrally distant bands with strong physiological contrast. For example:
Simple_Ratio_550_800 (Rank 5, Score=84): Δλ = 250 nm
Simple_Ratio_430_680 (Rank 10, Score=72): Δλ = 250 nm
The single-band 550 nm (Rank 3, Score = 86) represents an exception (see below) because this wavelength represents a local reflectance maximum (15-35% reflectance), rather than absorption minimum, exhibits directional sensitivity to chlorophyll loss. It underperformed compared to normalized formulations incorporating 550 nm (i.e. Normalized Difference 780_550 (Rank 6): Score=82; Simple Ratio 550_800 (Rank 5): Score=84). This indicates that while 550 nm alone is highly effective, modest additional gains are achievable through normalization—though the marginal benefit is surprisingly small compared to typical VI performance improvements from ratio/difference transformations.
Indices ranked from 28 to 87 exhibited three primary failure modes:
- Narrow red-edge ratios (Δλ < 50 nm): i.e. Vogelmann index Simple Ratio 715_705 (Rank 81), Simple_Ratio_750_710 (Rank 71) with limited physiological contrast.
- Single-band measurements: The performance of single-band indices revealed a stark dichotomy: 550 nm alone (total score of 86) showed a 328% higher than other single 7 single bands (430, 470, 635, 640, 660, 680, and 720). This dramatic performance gap underscores that Single Band 550 is not failing due to being a single band, but rather that 550 nm contains exceptional standalone information content. Whereas, the failure of other single bands could result from a spectral region inadequacy. Bands at 430, 640, 660, 680 nm all coincide with chlorophyll absorption peaks where reflectance is extremely low (1-5%), making signals dominated by instrument noise rather than biochemical variation.
Poor performers also suffered from inappropriate mathematical formulations. Simple ratios between spectrally adjacent bands (e.g., 750/700) provided minimal information.
Design Principles for Olive Fruit VIs
Based on this analysis, optimal vegetation indices for olive biochemical composition should satisfy:
- Spectral criteria:
- Include 550 nm (green peak)
- Include 670-680 nm and/or 700-710 nm
- Maintain Δλ ≥ 100 nm between bands
- Optionally incorporate 800 nm (NIR reference)
- Consider non-linear terms for multi-pigment scenarios
- Avoid redundant spectral sampling
This systematic analysis of 87 vegetation indices identifies spectral band selection (particularly 550 nm inclusion) and mathematical formulation as the primary determinants of performance for olive fruit biochemical prediction. The failure of commonly used indices (NDVI, PRI variants, red-edge ratios) underscores the importance of target-specific VI design rather than generic application of established indices.
References
- Conde, C.; Delrot, S.; Gerós, H. Physiological, biochemical and molecular changes occurring during olive development and ripening. J. Plant Physiol. 2008, 165, 1545–1562. [Google Scholar] [CrossRef] [PubMed]
- Mínguez-Mosquera, M.I.; Gallardo-Guerrero, M.L. Disappearance of chlorophylls and carotenoids during the ripening of the olive. J. Sci. Food Agric. 1991, 69, 1–6. [Google Scholar] [CrossRef]
- Roca, M.; Mínguez-Mosquera, M.I. Changes in chloroplast pigments of olive varieties during fruit ripening. J. Agric. Food Chem. 2001, 49, 832–839. [Google Scholar] [CrossRef] [PubMed]
- Thomas, H. Chlorophyll: A symptom and a regulator of plastid development. New Phytol. 1997, 136, 163–181. [Google Scholar] [CrossRef]
- Aparicio-Ruiz, R.; Gandul-Rojas, B.; Roca, M. Pigment profile in non-Spanish olive varieties (Olea europaea L. var. Coratina, Frantoio, and Koroneiki). J. Agric. Food Chem. 2009, 57, 831–836. [Google Scholar] [CrossRef]
- European Community. Council Regulation No. 432/2012 of 16 May 2012 establishing a list of permitted health claims made on foods. Off. J. Eur. Communities 2012, L136, 1–40. [Google Scholar]
- Alagna, F.; Mariotti, R.; Panara, F.; Caporali, S.; Urbani, S.; Veneziani, G.; et al. Olive phenolic compounds: Metabolic and transcriptional profiling during fruit development. BMC Plant Biol. 2012, 12, 162. [Google Scholar] [CrossRef]
- Romani, A.; Mulinacci, N.; Pinelli, P.; Vincieri, F.; Cimato, A. Polyphenolic content in five Tuscany cultivars of Olea europaea L. J. Agric. Food Chem. 1999, 47, 964–967. [Google Scholar] [CrossRef]
- Garcia, J.M.; Seller, S.; Perez-Camino, M.C. Influence of fruit ripening on olive oil quality. J. Agric. Food Chem. 1996, 44, 3516–3520. [Google Scholar] [CrossRef]
- Distefano, M.; Avola, G.; Cantini, C.; Gioli, B.; Cavaliere, A.; Riggi, E. A Biologically Informed Wavelength Extraction (BIWE) Method for Hyperspectral Classification of Olive Cultivars and Ripening Stages. Remote Sens. 2025, 17, 3277. [Google Scholar] [CrossRef]
- Genangeli, A.; Avola, G.; Bindi, M.; Cantini, C.; Cellini, F.; Riggi, E.; Gioli, B. A novel correction methodology to improve the performance of a low-cost hyperspectral portable snapshot camera. Sensors 2023, 23, 9685. [Google Scholar] [CrossRef] [PubMed]
- Saad, A.; Azam, M.M.; Amer, B.M. Quality analysis prediction and discriminating strawberry maturity with a hand-held Vis–NIR spectrometer. Food Anal. Methods 2022, 15, 689–699. [Google Scholar] [CrossRef]
- Cayuela, J.A.; Perez-Camino, M.C. Prediction of quality of intact olives by near infrared spectroscopy. Eur. J. Lipid Sci. Technol. 2010, 112, 1209–1217. [Google Scholar] [CrossRef]
- Bellincontro, A.; Taticchi, A.; Servili, M.; Esposto, S.; Farinelli, D.; Mencarelli, F. Feasible application of a portable NIR-AOTF tool for on-field prediction of phenolic compounds during the ripening of olives for oil production. J. Agric. Food Chem. 2012, 60, 2665–2673. [Google Scholar] [CrossRef]
- Avola, G.; Di Gennaro, S.F.; Cantini, C.; Riggi, E.; Muratore, F.; Tornambè, C.; Matese, A. Remotely sensed vegetation indices to discriminate field-grown olive cultivars. Remote Sens. 2019, 11, 1242. [Google Scholar] [CrossRef]
- Cantini, C.; Nepi, P.E.; Avola, G.; Riggi, E. Direct and indirect ground estimation of leaf area index to support interpretation of NDVI data in hedgerow olive orchards. Smart Agric. Technol. 2023, 5, 100267. [Google Scholar] [CrossRef]
- Cirilli, M.; Bellincontro, A.; Urbani, S.; Servili, M.; Esposto, S.; Mencarelli, F.; Muleo, R. On-field monitoring of fruit ripening evolution and quality parameters in olive mutants using a portable NIR-AOTF device. Food Chem. 2016, 199, 96–104. [Google Scholar] [CrossRef]
- Main, R.; Cho, M.A.; Mathieu, R.; O’Kennedy, M.M.; Ramoelo, A.; Koch, S. An investigation into robust spectral indices for leaf chlorophyll estimation. ISPRS J. Photogramm. Remote Sens. 2011, 66, 751–761. [Google Scholar] [CrossRef]
- Haboudane, D.; Miller, J.R.; Pattey, E.; Zarco-Tejada, P.J.; Strachan, I.B. Hyperspectral vegetation indices and novel algorithms for predicting green LAI of crop canopies. Remote Sens. Environ. 2004, 90, 337–352. [Google Scholar] [CrossRef]
- Alamprese, C.; Grassi, S.; Tugnolo, A.; Casiraghi, E. Prediction of olive ripening degree combining image analysis and FT-NIR spectroscopy. Food Control 2021, 123, 107755. [Google Scholar] [CrossRef]
- Arar, E.J. Method 447.0: Determination of chlorophylls a and b and identification of other pigments of interest in algae using HPLC. In U.S. EPA; National Exposure Research Laboratory, 1997. [Google Scholar]
- Basile, F.; Mauro, R.P.; Buturi, C.V.; Distefano, M.; Cannata, C.; Adorna, F.; et al. Quality traits and mineral profile of carrot Dordogne as affected by foliar applications of silicon. Acta Hortic. 2022, 1353, 219–226. [Google Scholar] [CrossRef]
- Wu, C.; Niu, Z.; Tang, Q.; Huang, W. Estimating chlorophyll content from hyperspectral vegetation indices: Modeling and validation. Agric. For. Meteorol. 2008, 148, 1230–1241. [Google Scholar] [CrossRef]
- Lu, X.; Lu, S. Effects of adaxial and abaxial surface on the estimation of leaf chlorophyll content using hyperspectral vegetation indices. Int. J. Remote Sens. 2015, 36, 1447–1469. [Google Scholar] [CrossRef]
- Pino, C.; Sepúlveda, B.; Tapia, F.; Saavedra, J.; García-González, D.L.; Romero, N. The Impact of Mild Frost Occurring at Different Harvesting Times on the Volatile and Phenolic Composition of Virgin Olive Oil. Antioxidants 2022, 11, 852. [Google Scholar] [CrossRef]
- Sofo, A.; Benjeddou, H.; Fourati, R.; Ben Ahmed, C.; Ben Rouina, B.; Galgano, F.; Casacchia, T.; Scorpa, A. Characterization of biochemical factors affecting crop load in three olive cultivars. Eur. J. Hortic. Sci. 2018, 83, 28–34. [Google Scholar] [CrossRef]
- Sáinz, J.A.; Garrido, I.; Hernández, M.; Montaño, A.; Llerena, J.L.; Espinosa, F. Influence of cultivar, irrigation, ripening stage, and annual variability on the oxidant/antioxidant systems of olives as determined by MDS-PTA. PLoS ONE 2019, 14, e0215540. [Google Scholar] [CrossRef]
- Ortega-García, F.; Peragón, J. Phenylalanine ammonia-lyase, polyphenol oxidase, and phenol concentration in fruits of Olea europaea L. during ripening. J. Agric. Food Chem. 2009, 57, 10331–10340. [Google Scholar] [CrossRef]
- Cerretani, L.; Bendini, A.; Rotondi, A.; Mari, M.; Lercker, G.; Toschi, T. Evaluation of the oxidative stability and organoleptic properties of extra-virgin olive oils in relation to olive ripening degree. Prog. Nutr. 2004, 6, 50–56. [Google Scholar]
- Morelló, J.R.; Vuorela, S.; Romero, M.P.; Motilva, M.J.; Heinonen, M. Antioxidant activity of olive pulp and olive oil phenolic compounds of the Arbequina cultivar. J. Agric. Food Chem. 2005, 53, 2002–2008. [Google Scholar] [CrossRef]
- Lichtenthaler, H.K.; Gitelson, A.A.; Lang, M. Non-Destructive Determination of Chlorophyll Content of Leaves of a Green and an Aurea Mutant of Tobacco by Reflectance Measurements. J. Plant Physiol. 1996, 148, 483–493. [Google Scholar] [CrossRef]
- Merzlyak, M.N.; Solovchenko, A.E.; Gitelson, A.A. Reflectance Spectral Features and Non-Destructive Estimation of Chlorophyll, Carotenoid and Anthocyanin Content in Apple Fruit. Postharvest Biol. Technol. 2003, 27, 89–103. [Google Scholar] [CrossRef]
- Gitelson, A.A.; Merzlyak, M.N. Quantitative Estimation of Chlorophyll a Using Reflectance Spectra: Experiments with Autumn Chestnut and Maple Leaves. J. Photochem. Photobiol. 1994, 22, 247–252. [Google Scholar] [CrossRef]
Figure 1.
PCA-based clustering of olive cultivars according to chlorophyll and polyphenol content.
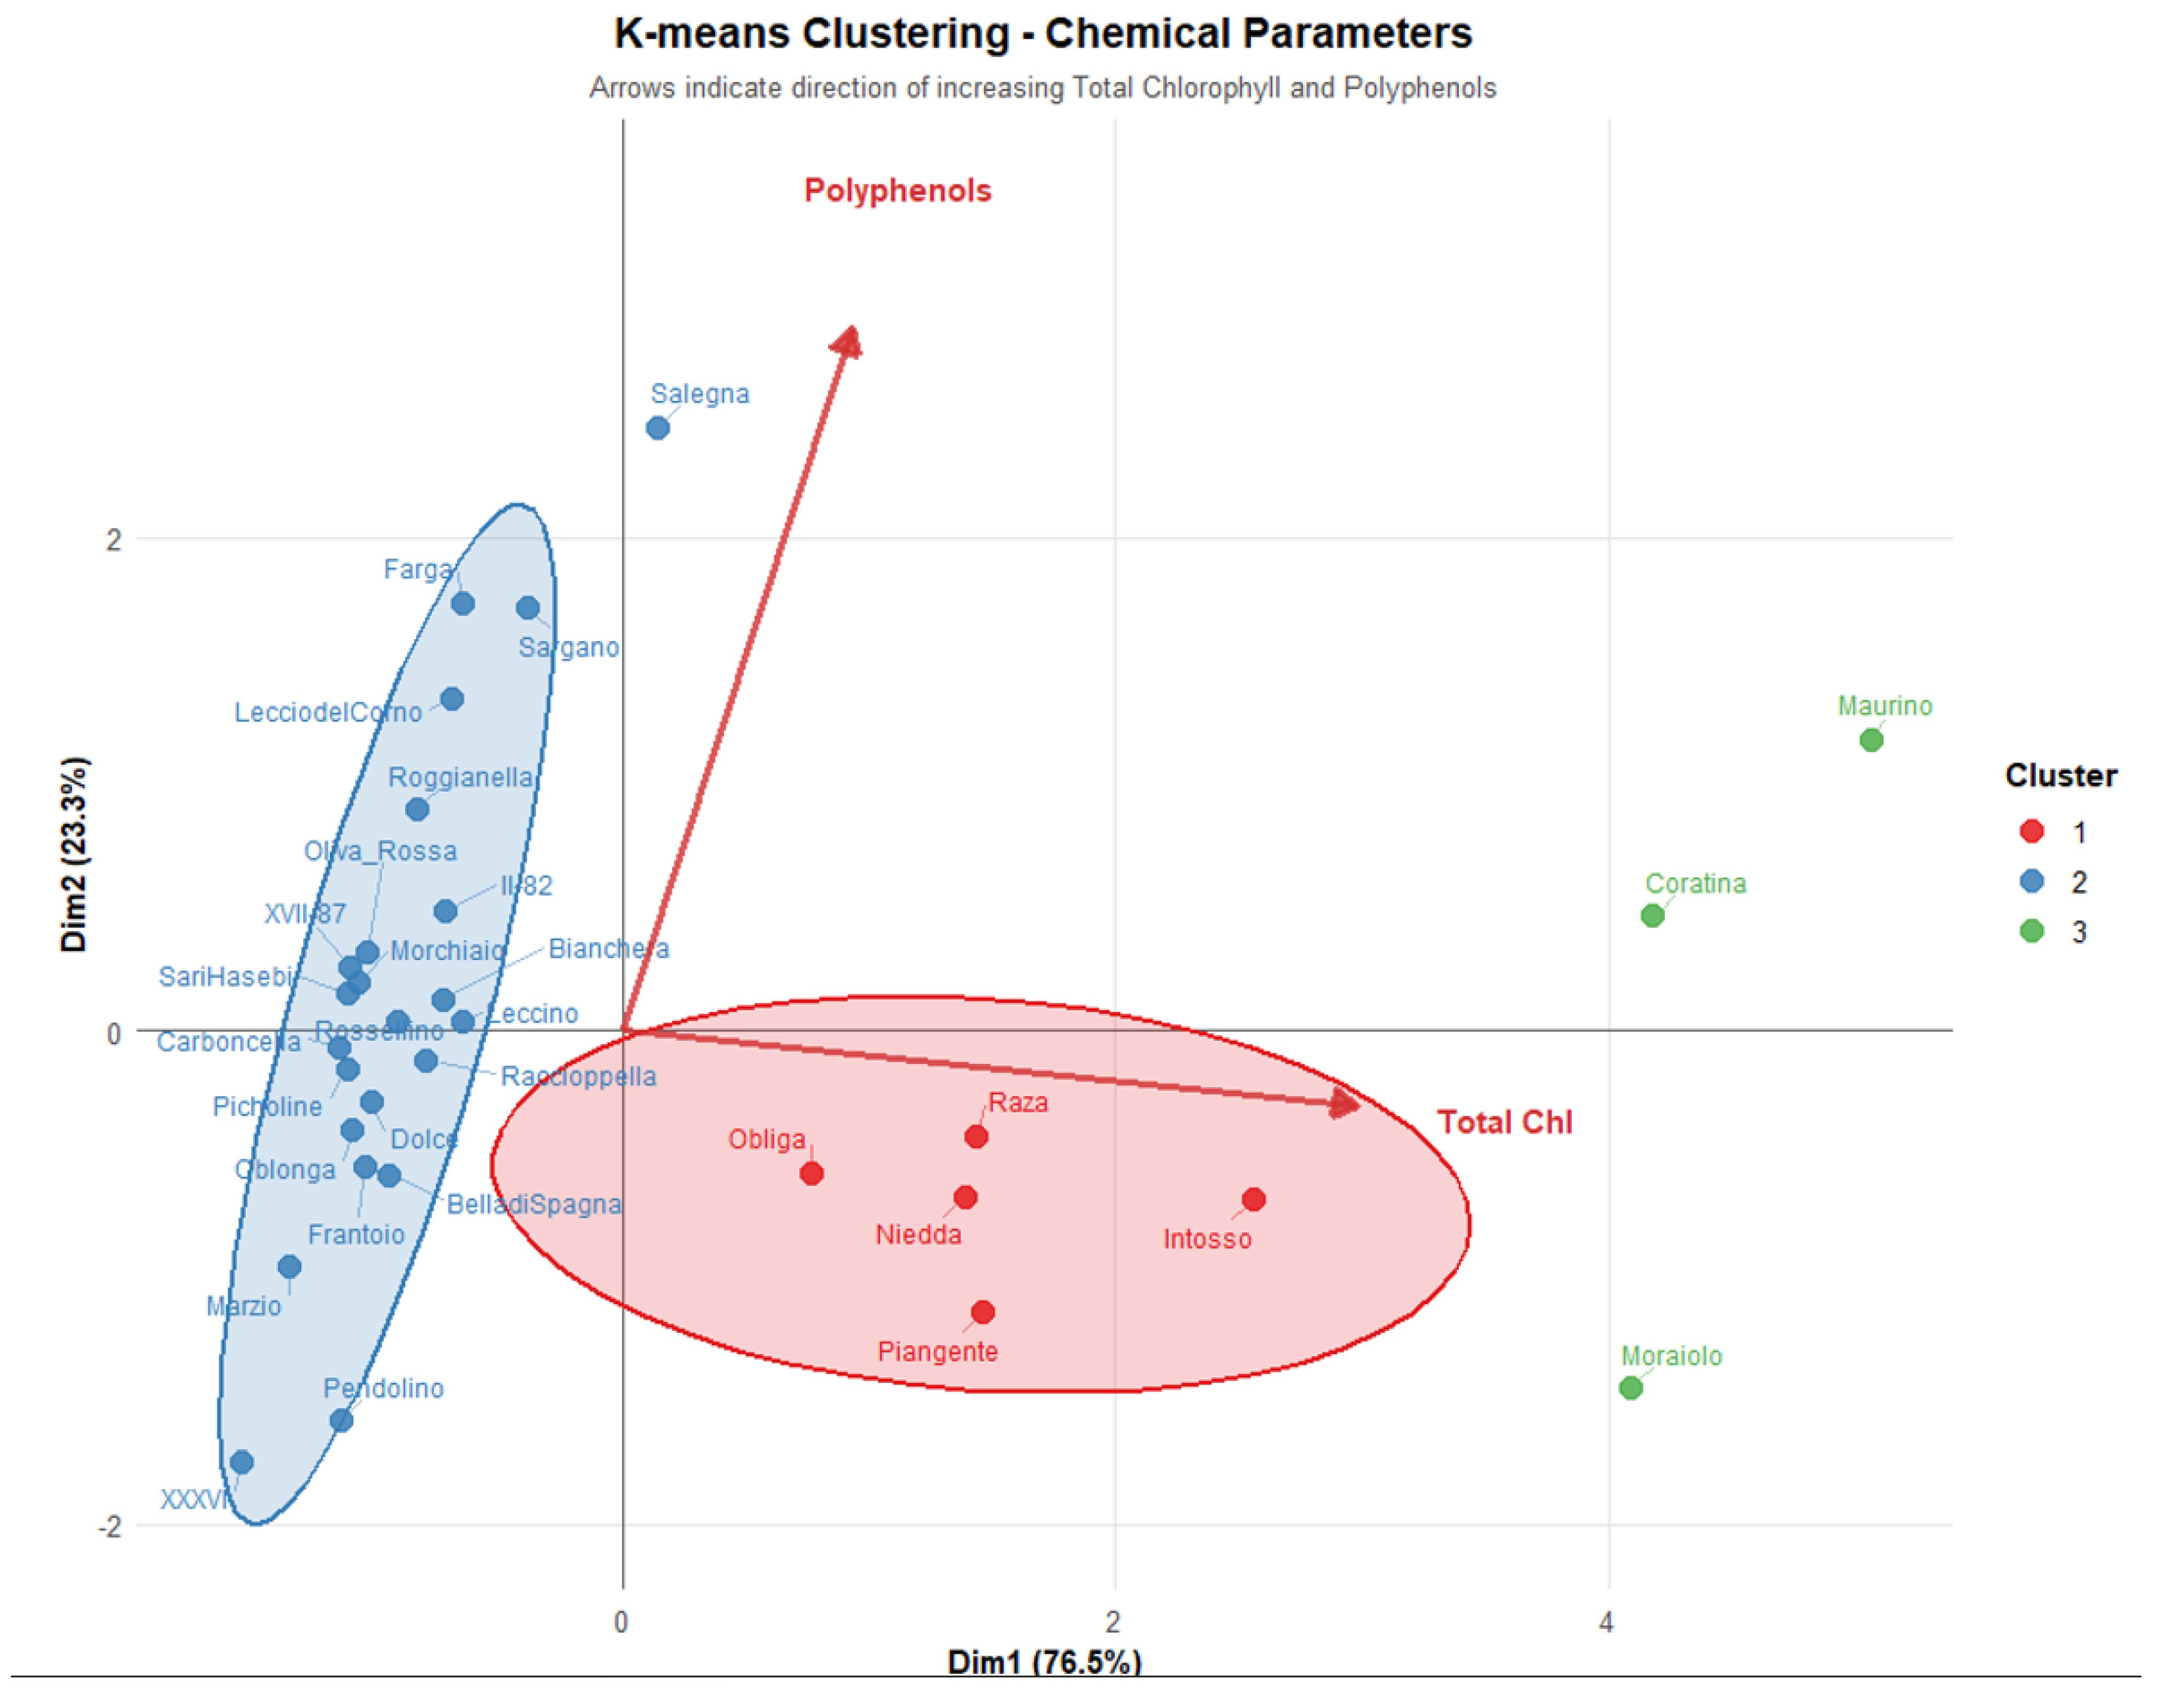
Table 1.
Cultivars, origin/diffusion, main destination use.
| No. | Cultivar | Origin/Diffusion | Use |
|---|---|---|---|
| 1 | Bella di Spagna | Apulia (Italy) | Fresh consumption |
| 2 | Bianchera | Friuli-Venezia G. (Italy) | Oil |
| 3 | Carboncella | Abruzzo (Italy) | Oil/Fresh consumption |
| 4 | Coratina | Apulia (Italy) | Oil |
| 5 | Dolce d’Andria | Umbria (Italy) | Oil/Fresh consumption |
| 6 | Farga | Valencia (Spain) | Oil |
| 7 | Frantoio | Tuscany (Italy) | Oil |
| 8 | II82 | Umbria (Italy) | Oil |
| 9 | Intosso | Abruzzi (Italy) | Oil/Fresh consumption |
| 10 | Leccino | Tuscany (Italy) | Oil |
| 11 | Leccio del Corno | Tuscany (Italy) | Oil |
| 12 | Marzio | Tuscany (Italy) | Oil |
| 13 | Maurino | Tuscany (Italy) | Oil |
| 14 | Moraiolo | Umbria (Italy) | Oil |
| 15 | Morchiaio | Tuscany (Italy) | Oil |
| 16 | Niedda | Sardinia (Italy) | Oil/Fresh consumption |
| 17 | Obliga | Croatia | Oil |
| 18 | Oblonga | USA | Oil |
| 19 | Oliva Rossa | Apulia (Italy) | Oil |
| 20 | Pendolino | Tuscany (Italy) | Oil |
| 21 | Piangente | Tuscany (Italy) | Oil |
| 22 | Picholine | France | Oil/Fresh consumption |
| 23 | Raccioppella | Campania (Italy) | Oil/Fresh consumption |
| 24 | Razza | Lombardy (Italy) | Oil |
| 25 | Roggianella | Sardinia (Italy) | Oil/Fresh consumption |
| 26 | Rossellino | Tuscany (Italy) | Oil |
| 27 | Salegna | Molise (Italy) | Oil |
| 28 | Sargano di Fermo | Abruzzi (Italy) | Oil/Fresh consumption |
| 29 | Sari Hasebi | Türkiye | Oil |
| 30 | XVII87 | Tuscany (Italy) | Oil |
| 31 | XXXVI | Tuscany (Italy) | Oil |
Table 2.
Performance Ranking of Vegetation Indices Based on Correlation Strength, Statistical Stability, and Permutation Significance.
Table 2.
Performance Ranking of Vegetation Indices Based on Correlation Strength, Statistical Stability, and Permutation Significance.
| Score | Chlorophylls | Polyphenols | ||||||
| Rank | Index | Total | Weighted | CV | a | b | a+b | |
| Σ (|r|≥0.9) | % | |||||||
| 1 | Mod Chl Abs Ratio Index 3 | 91 | 72.8 | 19.9 | 24 | 22 | 25 | 20 |
| 2 | Trans Chl Abs Ratio Index | 91 | 72.8 | 21.3 | 25 | 22 | 25 | 19 |
| 3 | Single Band (550) | 86 | 68.8 | 20.8 | 24 | 21 | 23 | 18 |
| 4 | Triangular Chl index | 86 | 68.8 | 20.9 | 23 | 20 | 24 | 19 |
| 5 | Simple Ratio (550/800) | 84 | 67.2 | 20.3 | 24 | 21 | 21 | 18 |
| 6 | Normalized Diff (780,550) | 82 | 65.6 | 20.7 | 22 | 20 | 22 | 18 |
| 7 | Chl Abs Ratio Index 2 | 79 | 63.2 | 20.9 | 21 | 18 | 21 | 19 |
| 8 | Plant Senescence Refl Index 2 | 76 | 60.8 | 19.2 | 20 | 20 | 21 | 15 |
| 9 | Normalized Diff (550,530) | 73 | 58.4 | 20.3 | 19 | 18 | 18 | 18 |
| 10 | Simple Ratio (430/680) | 72 | 57.6 | 19.7 | 20 | 20 | 19 | 13 |
| 11 | Simple Ratio (554/677) | 71 | 42.2 | 20.6 | 20 | 20 | 19 | 12 |
Disclaimer/Publisher’s Note: The statements, opinions and data contained in all publications are solely those of the individual author(s) and contributor(s) and not of MDPI and/or the editor(s). MDPI and/or the editor(s) disclaim responsibility for any injury to people or property resulting from any ideas, methods, instructions or products referred to in the content. |
© 2025 by the authors. Licensee MDPI, Basel, Switzerland. This article is an open access article distributed under the terms and conditions of the Creative Commons Attribution (CC BY) license (http://creativecommons.org/licenses/by/4.0/).
Copyright: This open access article is published under a Creative Commons CC BY 4.0 license, which permit the free download, distribution, and reuse, provided that the author and preprint are cited in any reuse.


