Submitted:
13 October 2025
Posted:
29 October 2025
You are already at the latest version
Abstract
Climate change–induced sea-level rise (SLR) is transforming coastal ecosystems and threatening fisheries-dependent livelihoods in Southeast Asia, a region marked by rapid environmental change and high population density in low-elevation coastal zones. While prior studies have examined the physical and ecological dimensions of SLR, few have integrated large-scale fisheries data with interpretable machine learning (ML) frameworks to identify and quantify socio-environmental vulnerabilities. This study applies ensemble learning models, Random Forest (RF) and Extreme Gradient Boosting (XGBoost), to the Food and Agriculture Organization’s (FAO) Global Fisheries Production dataset (2005–2025) across ten Southeast Asian countries. The analysis incorporates tide-gauge-derived SLR trends and production characteristics (species, production source, and water area) to predict fisheries outcomes and assess regional risk. Model explainability is achieved using SHapley Additive exPlanations (SHAP), allowing transparent attribution of feature importance. Results indicate that species type, production source, and country context are the most influential variables shaping fisheries vulnerability. The Random Forest model achieved superior predictive stability (R² = 0.45, Min–Max Accuracy = 0.71) relative to XGBoost. The findings reveal that Cambodia, Thailand, and the Philippines—regions experiencing some of the highest SLR rates—exhibit heightened fisheries vulnerability. The integration of explainable AI with environmental datasets enhances understanding of where climate and socio-economic stressors converge, providing a replicable framework for climate adaptation and sustainable resource governance in coastal Asia.
Keywords:
sea-level rise
; explainable Artificial Intelligence
; random forest
; XGBoost
; SHAP analysis
; fisheries vulnerability
; Southeast Asia
Sea Level Rise and Fisheries Production in Southeast Asia: Trends and Explainable AI Insights
Climate change-induced sea level rise represents one of the most pressing environmental challenges of the 21st century, particularly for coastal and island regions. In Southeast Asia, where coastal ecosystems are biologically rich and socioeconomically vital, rising sea levels are transforming both natural habitats and human livelihoods. This research investigates the extent to which sea level rise over the past two decades has affected fishing-dependent communities in the coastal zones of Southeast Asia - a region uniquely vulnerable due to its geographical, ecological, and economic characteristics.
Scientific observations and satellite-based assessments have revealed measurable changes in the region’s coastlines, with erosion, land loss, and altered hydrological dynamics becoming increasingly widespread. Southeast Asia has many coastal areas. These include tropical coastlines, mangrove forests, estuaries, and coral reefs. Many of these areas have high levels of different species. These ecosystems are at risk. The risks come from slow changes and extreme weather events. These are caused by sea level rise and changes in monsoon patterns. These ecosystems support many marine species. They also provide important services to people. Millions of people depend on coastal fisheries for food, income, and cultural reasons. The effects of environmental changes do not happen evenly. Small-scale and local fishing communities face higher risks. This is especially true in Vietnam, Malaysia, and the Philippines. These communities have limited resources. They also have poor infrastructure and less support from institutions. They have difficulty adapting to the changes in marine environments. When species move and habitats get worse, fishing areas become smaller or less productive. The ability of these communities to survive gets weaker. These issues affect not only local economies but also national food security and regional efforts for sustainability.
Previous studies have used regression and spatial methods to analyze environmental risks. Few studies have used explainable machine learning (ML) to model fisheries production and identify its causes. Among ML methods, ensemble algorithms like Random Forest (RF) and Extreme Gradient Boosting (XGBoost) have shown good prediction performance. Random Forest builds many decision trees and averages their results to improve accuracy. XGBoost adds trees sequentially to reduce errors and make the model more precise. To make the models understandable, this study uses a combination of ensemble learning and SHAP explainability. This approach shows how factors such as species composition, production source, and country context interact with environmental stressors like sea level rise (SLR). This method provides a clear, data-based way to find which regions and production systems are most at risk from climate change.
Literature Review
As Southeast Asia faces increasing climate changes, it is important to study how sea level rise affects biodiversity and fishing communities. This review looks at research from Malaysia, Vietnam, Thailand, Indonesia, and the Philippines. It explains how sea level rise and fishing vulnerability are connected. It also points out what we do not know now.
Sea-Level Rise in Southeast Asia
Sea level rise is caused by melting glaciers and ice sheets. It is also caused by warming seawater, which expands. In Southeast Asia, scientists have recorded sea level rise. They used satellites and tide gauges to make these recordings (Dong et al., 2024; Hamid et al., 2018; Zhang & Hou, 2020). Regional sea level rise rates vary across Southeast Asia. In Malaysia, the rate is about 3 millimeters per year. In some parts of Cambodia and Thailand, the rate exceeds 11 millimeters per year. The differences depend on local ocean currents, the effects of the monsoon, and land subsidence. Multiple studies show that sea level rise causes more coastal erosion and flooding. These problems lead to the loss of mangroves, saltwater intrusion, and the displacement of people who live near the coast (David et al., 2008; Gaines et al., 2023; Hens et al., 2018; Shukla et al., 2022).
In Vietnam and the Philippines, land subsidence combined with SLR has resulted in the submergence of agricultural land and altered hydrological regimes (Hens et al., 2018). The Intergovernmental Panel on Climate Change (IPCC) predicts that under high-emission scenarios, many Southeast Asian coastal zones will experience sea-level increases exceeding the global average, intensifying risks to biodiversity and infrastructure (Shukla et al., 2022).
Fisheries and Livelihood Vulnerability
Fisheries constitute both an ecological and socio-economic backbone of Southeast Asia. The region’s fisheries include capture (marine and inland) and aquaculture systems, with the former being highly sensitive to environmental fluctuations. Livelihood vulnerability in fishing communities arises from multiple interacting stressors, environmental exposure, sensitivity of fish stocks, and limited adaptive capacity (Hoang, Momtaz, & Schreider, 2020; Huynh et al., 2021; Islam et al., 2014; Liu, Borazon, & Munoz, 2021). Islam et al. (Islam et al., 2014) and Hoang et al. (Hoang, Momtaz, & Schreider, 2020) demonstrated that coastal households with few livelihood alternatives exhibit the highest vulnerability to climate variability. The dependence on climate-sensitive marine species exacerbates this risk, especially where government support and resource diversification are limited.
Despite an increasing number of national and regional adaptation initiatives, substantial gaps and challenges persist in integrating ecological resilience and socio-economic equity into policy frameworks. Governments across Southeast Asia have introduced coastal management programs, fisheries modernization plans, and climate adaptation strategies aimed at mitigating the socio-economic impacts of SLR and ecosystem degradation (Habib et al., 2025; Mohamed Rashidi et al., 2021). However, existing literature often addresses physical impacts, for example, erosion, flooding or livelihood vulnerabilities in isolation, without exploring their interdependence through a unified data-driven model.
Advances in Data-Driven Environmental Analysis
Recent technological progress in remote sensing, data analytics, and artificial intelligence (AI) has enabled researchers to quantify complex climate impacts with greater precision. Studies such as Zhang and Hou (Zhang & Hou, 2020) used spatial analyses of coastline change to map physical exposure, while MacManus et al. (MacManus et al., 2021) quantified urban exposure to coastal hazards using Earth observation datasets.
However, these approaches are limited by static models that fail to capture nonlinear dependencies and contextual interactions across ecological and socio-economic dimensions. Ensemble learning algorithms like Random Forest (RF) and Extreme Gradient Boosting (XGBoost) overcome these limitations by modeling nonlinear relationships and interactions among features (Ficke, Myrick, & Hansen, 2007; Gaines et al., 2023). Moreover, the emergence of explainable AI (XAI) techniques, particularly SHapley Additive exPlanations (SHAP), has made it possible to interpret ML predictions, assigning transparent, additive contributions to each feature’s influence on the output.
It is uncommon to include SHAP-based interpretability in environmental modeling within fisheries and sea level rise research. This study addresses this gap. We used FAO fisheries data, sea level rise measurements, and explainable ensemble learning. We show how physical factors and social factors together affect fisheries vulnerability in Southeast Asia.
Methods
Data Sources
This study examines ten Southeast Asian countries that have coastal fisheries. These countries are Brunei, Cambodia, Indonesia, Malaysia, Myanmar, the Philippines, Singapore, Thailand, Timor-Leste, and Vietnam. We used two main data sources for this research.
We collected data on sea level rise from national sources. This data includes tide-gauge and satellite measurements. The data comes from national hydrological agencies and from other studies. Average SLR rates (mm yr⁻¹) were assigned to each country (e.g., Cambodia = 11.7 mm/yr, Thailand = 10.3 mm/yr, Philippines = 8.6 mm/yr).
Fisheries Production Data comes from the FAO Global Fisheries Production Quantity database. This database covers the years 2005 to 2025. It provides yearly data on fisheries output for different countries. The data is organized by species group, source of production (capture or aquaculture), water type (inland or marine), and country. Each record shows the amount of fish produced in metric tons. This allows detailed analysis of fisheries, both ecologically and economically.
We preprocessed the dataset to remove incomplete or irrelevant records. We filtered data using official United Nations country codes to include only ten Southeast Asian coastal nations. We only kept records with species group code 1801. We removed records for aquatic plants, corals, and invertebrates. This focused the data on fisheries directly affected by environmental factors such as sea level rise.
The study combined different datasets to create a clear basis for modeling sea-level rise and its effects on fisheries in Southeast Asia. This approach made it possible to use ensemble learning models. These models can identify non-linear relationships between environmental factors and socio-economic data.
Variables
The main variable in this study is annual fisheries production. It is measured in metric tons. The data is from the FAO Global Fisheries Production dataset. This variable shows the total output of each country's fisheries. It indicates ecological productivity and economic dependence on aquatic resources. The raw data often has a skewed distribution toward higher values. To improve the data, we used the natural logarithm of (1 + production). This method reduces variability and helps the models work better. The variable reflects changes in fisheries output under different environmental and policy conditions. It provides a clear measure to study the effects of sea-level rise and other environmental factors.
Table 1 summarizes the independent variables used in this study, including both categorical and continuous predictors that collectively represent environmental, biological, and socio-economic dimensions influencing fisheries production. Together, these variables enable the machine learning models to detect complex, nonlinear relationships that link ecological processes and human activities to overall fisheries performance.
Data Analytic Plan
In this work, a ML-based analytical framework designed to evaluate how environmental and socio-economic variables influence fisheries production in Southeast Asia. Before modeling, the national SLR and the FAO fisheries datasets were aligned across the same time frame and geography. To clean the datasets, missing or anomalous entries, such as non-coastal nations, undefined species categories, or extreme SLR outliers were removed. Annual fisheries production records from 2005 to 2025 were merged with country-level SLR rates using the country codes as join keys. Because tide-gauge and satellite SLR measurements vary over time, national averages were computed to represent stable long-term exposure indicators. All continuous variables were normalized to unit variance, while categorical predictors were encoded numerically using LabelEncoder. The final analytical dataset with tens of thousands of valid observations is suitable for ML applications.
Two ensemble learning algorithms were implemented: Random Forest (RF) and Extreme Gradient Boosting (XGBoost). These methods were selected because they can capture nonlinear dependencies and hierarchical interactions among predictors. When dealing with large scale and complex environmental and socio-economic data, they give a big advantage over traditional linear regression.
The Random Forest model constructs multiple decision trees using bootstrapped samples of the training data and averages their predictions to minimize overfitting and variance. While XGBoost builds trees sequentially, each iteration corrects the residual errors of the previous one, thus optimizing model performance through gradient boosting. Both models were built in Python using the scikit-learn and XGboost libraries. The dataset was divided into training (80%) and testing (20%) subsets to enable out-of-sample evaluation. To ensure robustness and reduce random bias, the modeling process was repeated across five random seeds, and all performance metrics were averaged across runs. Hyperparameters, such as the number of trees, learning rate, and maximum tree depth, were tuned using cross-validation for better balance between accuracy and generalization.
The performance of the two models was evaluated using four complementary metrics. The first one is the coefficient of determination (R²), which measures the proportion of variance in fisheries production explained by the model, indicating its overall explanatory power; root-mean-squared error (RMSE) quantifies prediction error magnitude. Pearson correlation coefficient (COR) is an estimation of the linear association between predicted and observed values; and the last one, Min–Max Accuracy evaluates stability of the model by normalizing error across varying production scales.
For model interpretability, SHapley Additive exPlanations (SHAP) was employed. SHAP quantifies the marginal contribution of each input feature to a model’s output, allowing us to understand not only which variables are important but also how they influence predictions. In this study, a SHAP summary plot was generated to rank key predictors, including species group, production source, country, and SLR rate, based on their average contribution to fisheries production. Each feature is shown as a horizontal scatter of colored points, where color represents the feature’s value and the x-axis is the SHAP value that represents the magnitude and direction of that feature’s impact on the model output.
Results and Discussion
Sea Level Rise by Country
Figure1 shows the annual mean sea level trends across Southeast Asian countries from 2000 to 2025. Each line represents one country, and the vertical axis shows the average sea level. In this figure, all countries exhibit an upward trend, indicating a consistent regional sea level rise. Brunei, Cambodia, and Thailand show steeper slopes and highlights increasing climate exposure for coastal nations. The trend confirms that SLR is a persistent regional phenomenon.
Figure 1.
Annual mean sea level trends across Southeast Asian.
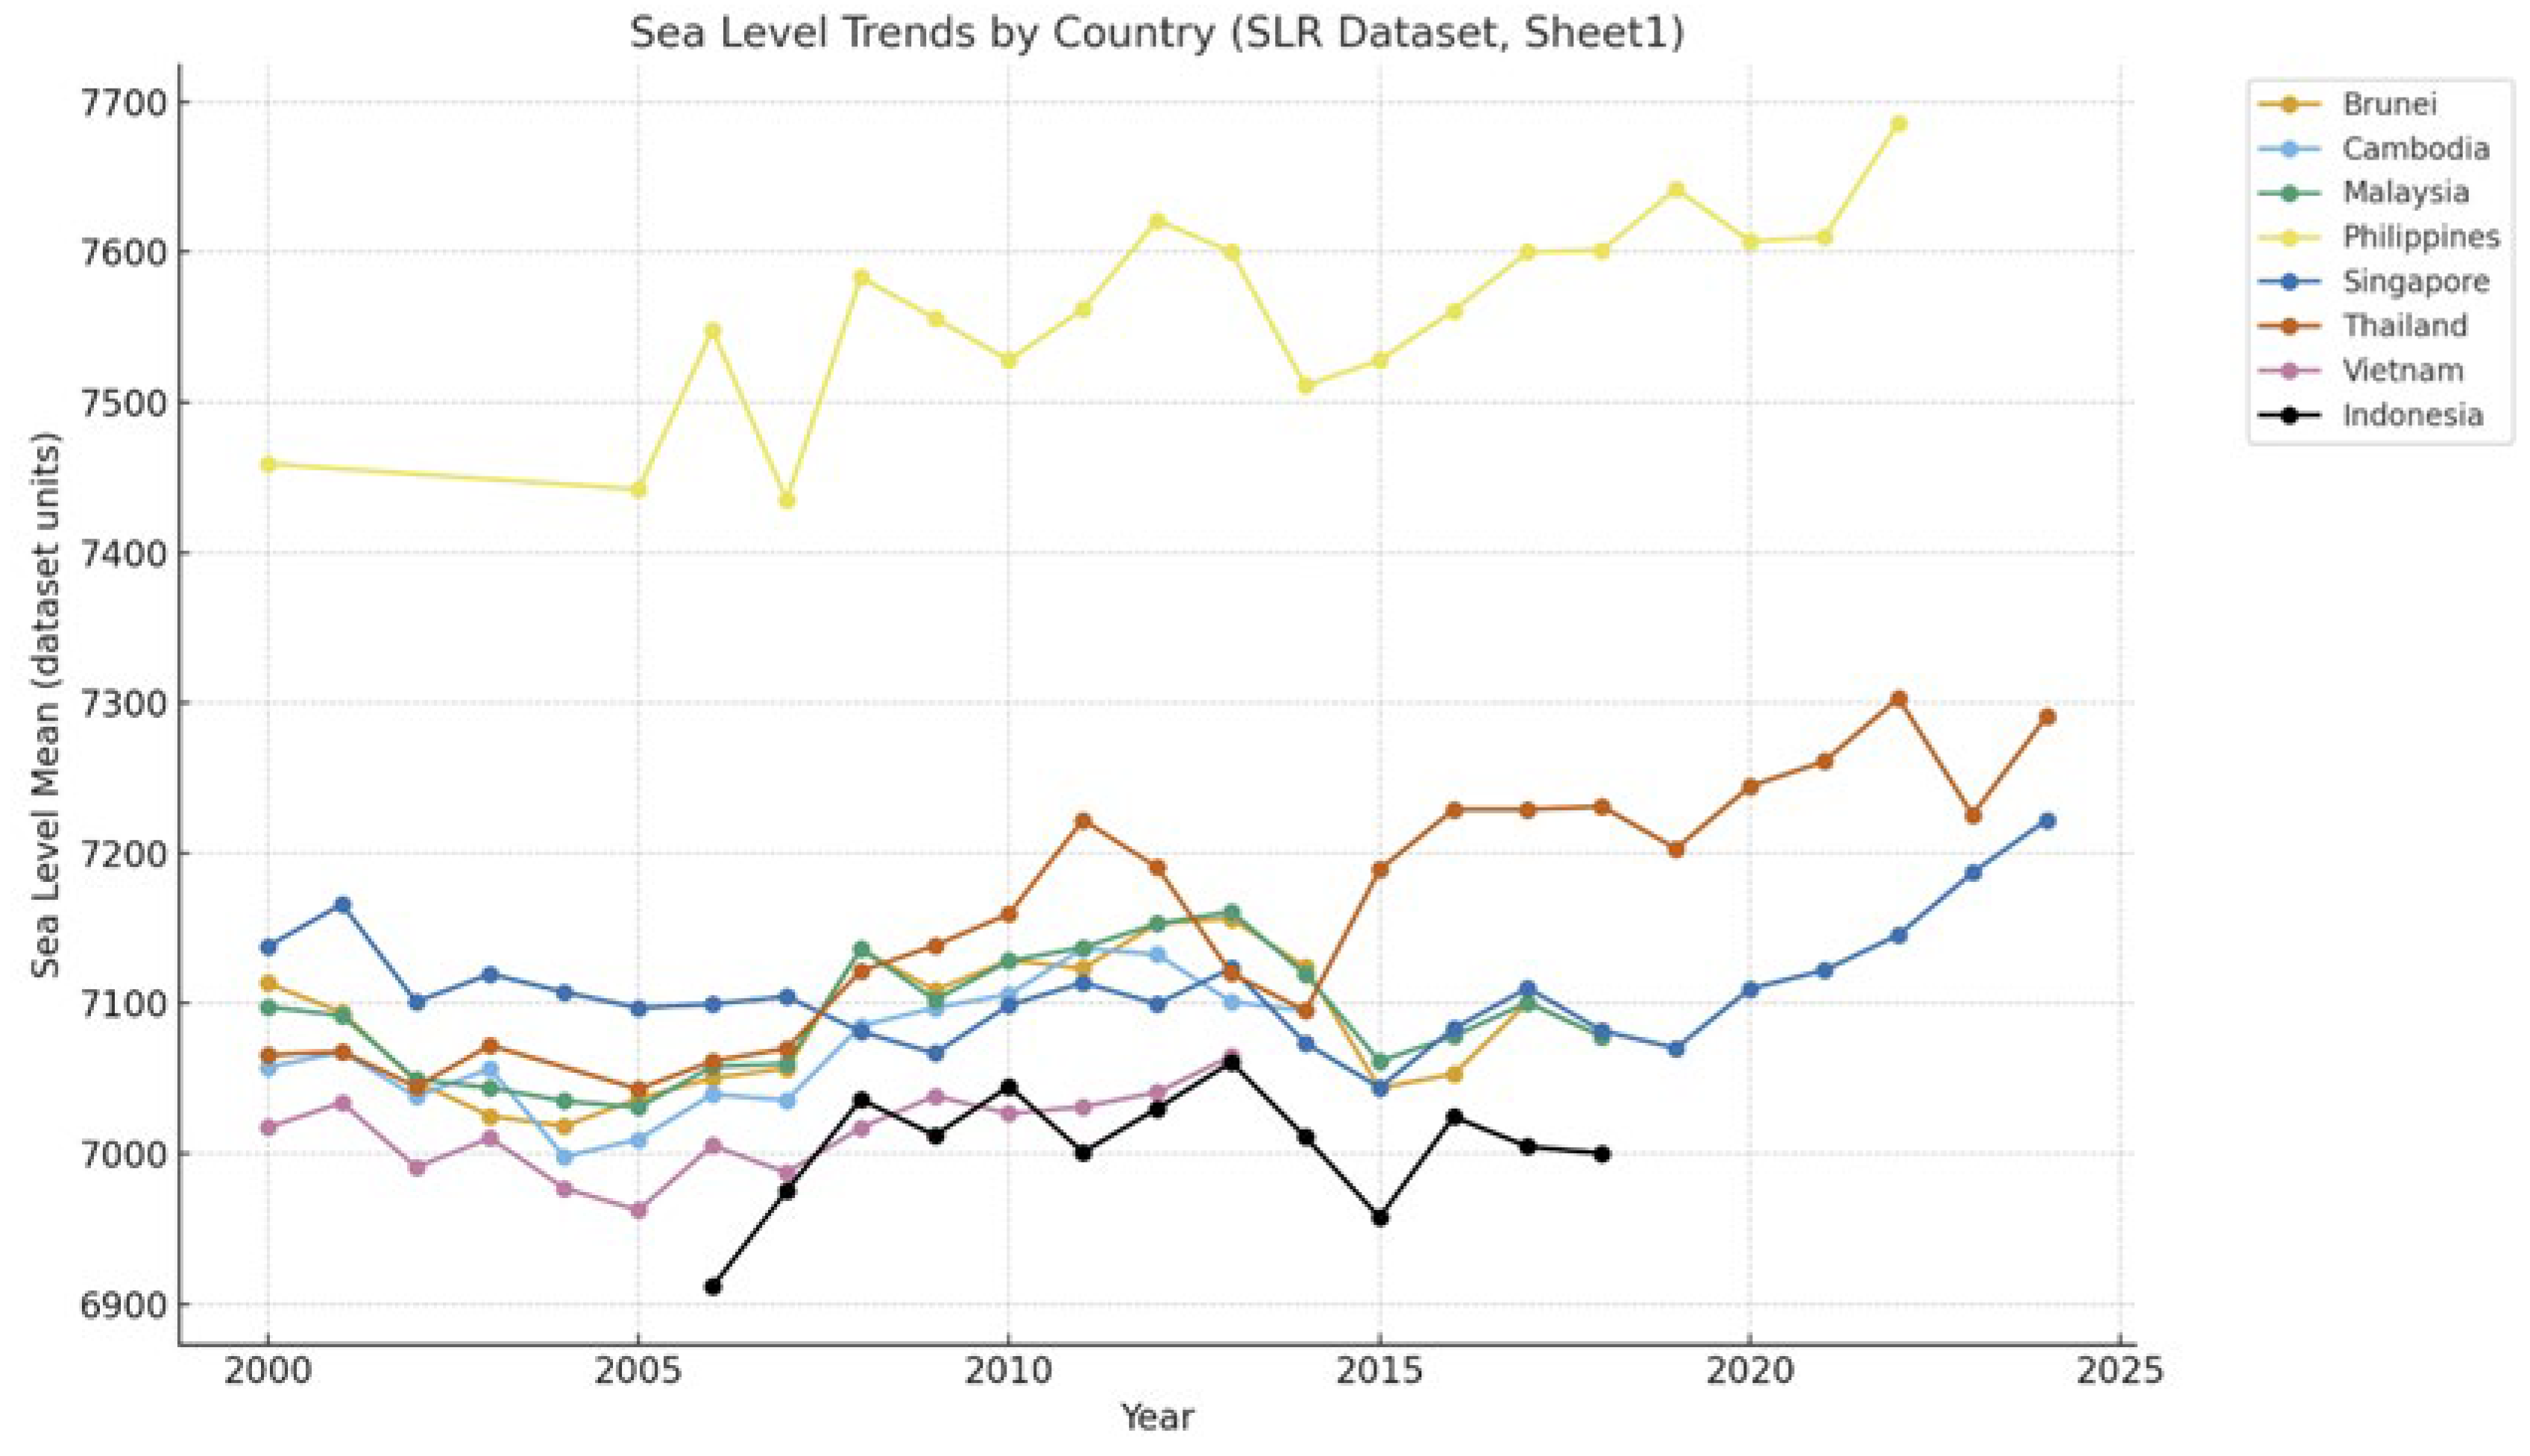
Figure 2 shows the average annual sea-level SLR rates for eight Southeast Asian countries. The results reveal that all Southeast Asian nations exhibit positive SLR trends. Cambodia (11.7 mm/yr) and Thailand (10.3 mm/yr) show the highest rise rates. The Philippines follows closely with ~8.6 mm/yr. These most vulnerable countries face accelerated risks for fisheries and coastal livelihoods.
We can see that Southeast Asian countries have different exposure to climate-induced ocean expansion and vertical displacement of land. Areas that have faster SLR rates are likely to face greater risks of coastal flooding and ecosystem loss, thus intensifying the vulnerability of fishing-dependent communities.
Model Comparison (Random Forest vs. XGBoost)
Figure 3 shows the comparison of Random Forest and XGBoost model performance. We can see that Random Forest achieved more reliable generalization, capturing nonlinear fisheries dynamics without excessive variance, while XGBoost, though achieving a higher test correlation, exhibited weaker fit across multiple seeds. RF’s ensemble averaging likely enhanced robustness for fisheries.
Table 2 summarizes the four key complementary metrics, previously mentioned in Methods, of the two models. The RF model achieved a high train R² of 0.992 and a moderate test R² of 0.450, suggesting strong internal fit but some reduction in generalization when exposed to unseen data. COR of 0.679 and Min–Max Accuracy of 0.705 demonstrate stable performance across varying scales of fisheries production, with a relatively higher capacity to maintain predictive consistency. In comparison, the XGBoost model has a lower training R² of 0.528 but a slightly higher test R², together with stronger correlation (COR of 0.860) and lower RMSE. These results indicate that although the XGBoost model achieved stronger linear relationships in the test dataset, it shows greater variability across runs. Overall, we believe that the RF model provided more robust and interpretable performance, especially in predictive stability. Therefore, in the following section, RF was selected as the primary model for SHAP analysis.
Feature Importance from SHAP Analysis
Figure 4 presents the SHAP global feature importance plot based on RF model, which ranks the input variables according to their mean absolute SHAP values, reflecting each feature’s overall contribution to the model’s prediction of fisheries production across Southeast Asia. Each point represents an observation, with color showing feature values, red for high and blue for low. The balance of blue and red dots shows how feature value shifts influence production either positively or negatively. The results indicate that species group, production source, and country are the three most important predictors.
The dominance of species group reflects biological vulnerability since species are more sensitive to climate and ecosystem shifts. Certain species groups strongly increase/decrease predicted production. Production source is the second most important driver. Aquaculture shows resilience in some contexts but capture fisheries more exposed to climate shocks. Country also matters significantly. Countries with high SLR rates such as Philippines, Vietnam and Indonesia also show strong effects in the model. Lower-ranked features such as water area, year, status and measure have smaller SHAP magnitudes but still have noticeable effects. In general, fisheries outcomes are primarily governed by biological and production characteristics, in other words, what species are produced and how they are produced.
Integration of Environmental and Fisheries Risks
By integrating country-level SLR data and explainable AI results, we may find out where Southeast Asian fisheries are most vulnerable and where adaptation must be prioritized. Figure 1 and Figure 2 confirm upward trends across all nations, with Cambodia and Thailand at the highest rates. These same countries exhibit negative SHAP contributions to production, suggesting that rapid SLR correlates with fisheries vulnerability.
Table 3 summarizes the above integrated discussion. On the left, we see the environmental side: sea level for countries like Cambodia, Thailand, and the Philippines are rising fastest. On the right, we see the socio-economic side: fisheries dependence in the Philippines, Vietnam, and Indonesia is very high, especially in capture fisheries. When we put these together, it’s clear that overlapping risks create hotspots of vulnerability, and these are the areas where adaptation strategies must be focused. The usage of explainable AI (SHAP) ensures that results are transparent and applicable.
Conclusions
In this paper, we first confirmed that SLR in Southeast Asia is real, significant and varies across countries, with Cambodia, Thailand, and the Philippines rising the fastest. Second, we applied machine learning models, RF and XGBoost, to FAO fisheries data. It is demonstrated that RF provided more stable and reliable predictions than XGBoost. Third, by using SHAP explainability, we were able to identify the factors matter most for fisheries production. Top three features are species choice, production source, and country effects. Finally, we demonstrated how environmental stress from sea level rise and socio-economic dependence on fisheries overlap in the region, creating clear vulnerability hotspots. In conclusion, this work shows that by integrating environmental data with explainable AI, we can pinpoint where fisheries in Southeast Asia are most at risk, and highlight where adaptation efforts should be prioritized.
Future work may include incorporation of more recent sea level datasets, such as satellite altimetry and IPCC projections, for better prediction of future trends. In addition, we may consider focusing more down to the province or community level fisheries data, instead of staying at national level. Finally, ML models may be used to simulate future fisheries outcomes under different sea level rise scenarios. The above steps may help make the analytic results more feasible and practical for local communities in Southeast Asia.
Code Availability
The Python scripts developed for data preprocessing, model training, and SHAP explainability analysis were written using open-source libraries, including pandas, scikit-learn, xgboost, and shap. The scripts can be made available by the corresponding author upon request.
Data Availability
The datasets used in this study are publicly accessible from the following two sources: Sea-level rise data were collected from the Permanent Service for Mean Sea Level (PSMSL) database: https://psmsl.org/data/ Fisheries production data were obtained from the Food and Agriculture Organization (FAO) Global Fisheries Production database: https://www.fao.org/fishery/en/collection/global_production. Data files are available from the corresponding author upon request.
References
- Zhang, Y., & Hou, X. (2020). Characteristics of coastline changes on southeast Asia Islands from 2000 to 2015. Remote Sensing, 12(3), 519.
- Hamid, A. I. A., Din, A. H. M., Hwang, C., Khalid, N. F., Tugi, A., & Omar, K. M. (2018). Contemporary sea level rise rates around Malaysia: Altimeter data optimization for assessing coastal impact. Journal of Asian Earth Sciences, 166, 247-259.
- Dong, W. S., Ismailluddin, A., Yun, L. S., Ariffin, E. H., Saengsupavanich, C., Maulud, K. N. A., ... & Yunus, K. (2024). The impact of climate change on coastal erosion in Southeast Asia and the compelling need to establish robust adaptation strategies. Heliyon, 10(4).
- Hens, L., Thinh, N. A., Hanh, T. H., Cuong, N. S., Lan, T. D., Van Thanh, N., & Le, D. T. (2018). Sea-level rise and resilience in Vietnam and the Asia-Pacific: A synthesis. Vietnam journal of earth sciences, 40(2), 126-152.
- Gaines, S., Cabral, R., Free, C. M., Golbuu, Y., Arnason, R., Battista, W., ... & Turley, C. (2023). The expected impacts of climate change on the ocean economy. In The Blue Compendium: From Knowledge to Action for a Sustainable Ocean Economy (pp. 15-50). Cham: Springer International Publishing.
- David, L. T. , Maneja, R., Goh, B., Lansigan, F., Sereywath, P., Radjawane, I. M.,... & Hinkel, J. (2008). Sea level rise vulnerability of southeast Asian coasts. Land-Ocean Interactions in the Coastal Zone, Inprint, 3, 3-6.
- Shukla, P. R. , Skea, J., Slade, R., Al Khourdajie, A., van Diemen, R., McCollum, D.,... & Malley, J. (2022). Climate change 2022: Mitigation of climate change. Contribution of working group III to the sixth assessment report of the Intergovernmental Panel on Climate Change.
- Islam, M. M. , Sallu, S., Hubacek, K., & Paavola, J. (2014). Vulnerability of fishery-based livelihoods to the impacts of climate variability and change: insights from coastal Bangladesh. Regional Environmental Change, 14, 281-294.
- Hoang, H. D. , Momtaz, S., & Schreider, M. (2020). Assessing the vulnerability of small-scale fishery communities in the estuarine areas of Central Vietnam in the context of increasing climate risks. Ocean & Coastal Management, 196, 105302.
- Huynh, P. T. , Le, N. D., Le, S. T., & Nguyen, H. X. (2021). Vulnerability of fishery-based livelihoods to climate change in coastal communities in central Vietnam. Coastal Management, 49(3), 275-292.
- Liu, J. M. , Borazon, E. Q., & Munoz, K. E. (2021). Critical problems associated with climate change: a systematic review and meta-analysis of Philippine fisheries research. Environmental Science and Pollution Research, 28(36), 49425-49433.
- Mohamed Rashidi, A. H. , Jamal, M. H., Hassan, M. Z., Mohd Sendek, S. S., Mohd Sopie, S. L., & Abd Hamid, M. R. (2021). Coastal structures as beach erosion control and sea level rise adaptation in Malaysia: a review. Water, 13(13), 1741.
- Habib, A. , Borazon, E. Q., Nallos, I. M., & Macusi, E. D. (2025). Climate change vulnerability, adaptation and ecosystem services in different fisheries and aquaculture in Asia: a review: English. Marine & Fishery Sciences (MAFIS), 38(2), 1.
- MacManus, K. , Balk, D., Engin, H., McGranahan, G., & Inman, R. (2021). Estimating population and urban areas at risk of coastal hazards, 1990–2015: how data choices matter. Earth System Science Data, 13(12), 5747-5801.
- Ficke, A. D., Myrick, C. A., & Hansen, L. J. (2007). Potential impacts of global climate change on freshwater fisheries. Reviews in Fish Biology and Fisheries, 17, 581-613.
Figure 2.
SLR rates in mm per year for 8 Southeast Asian countries.
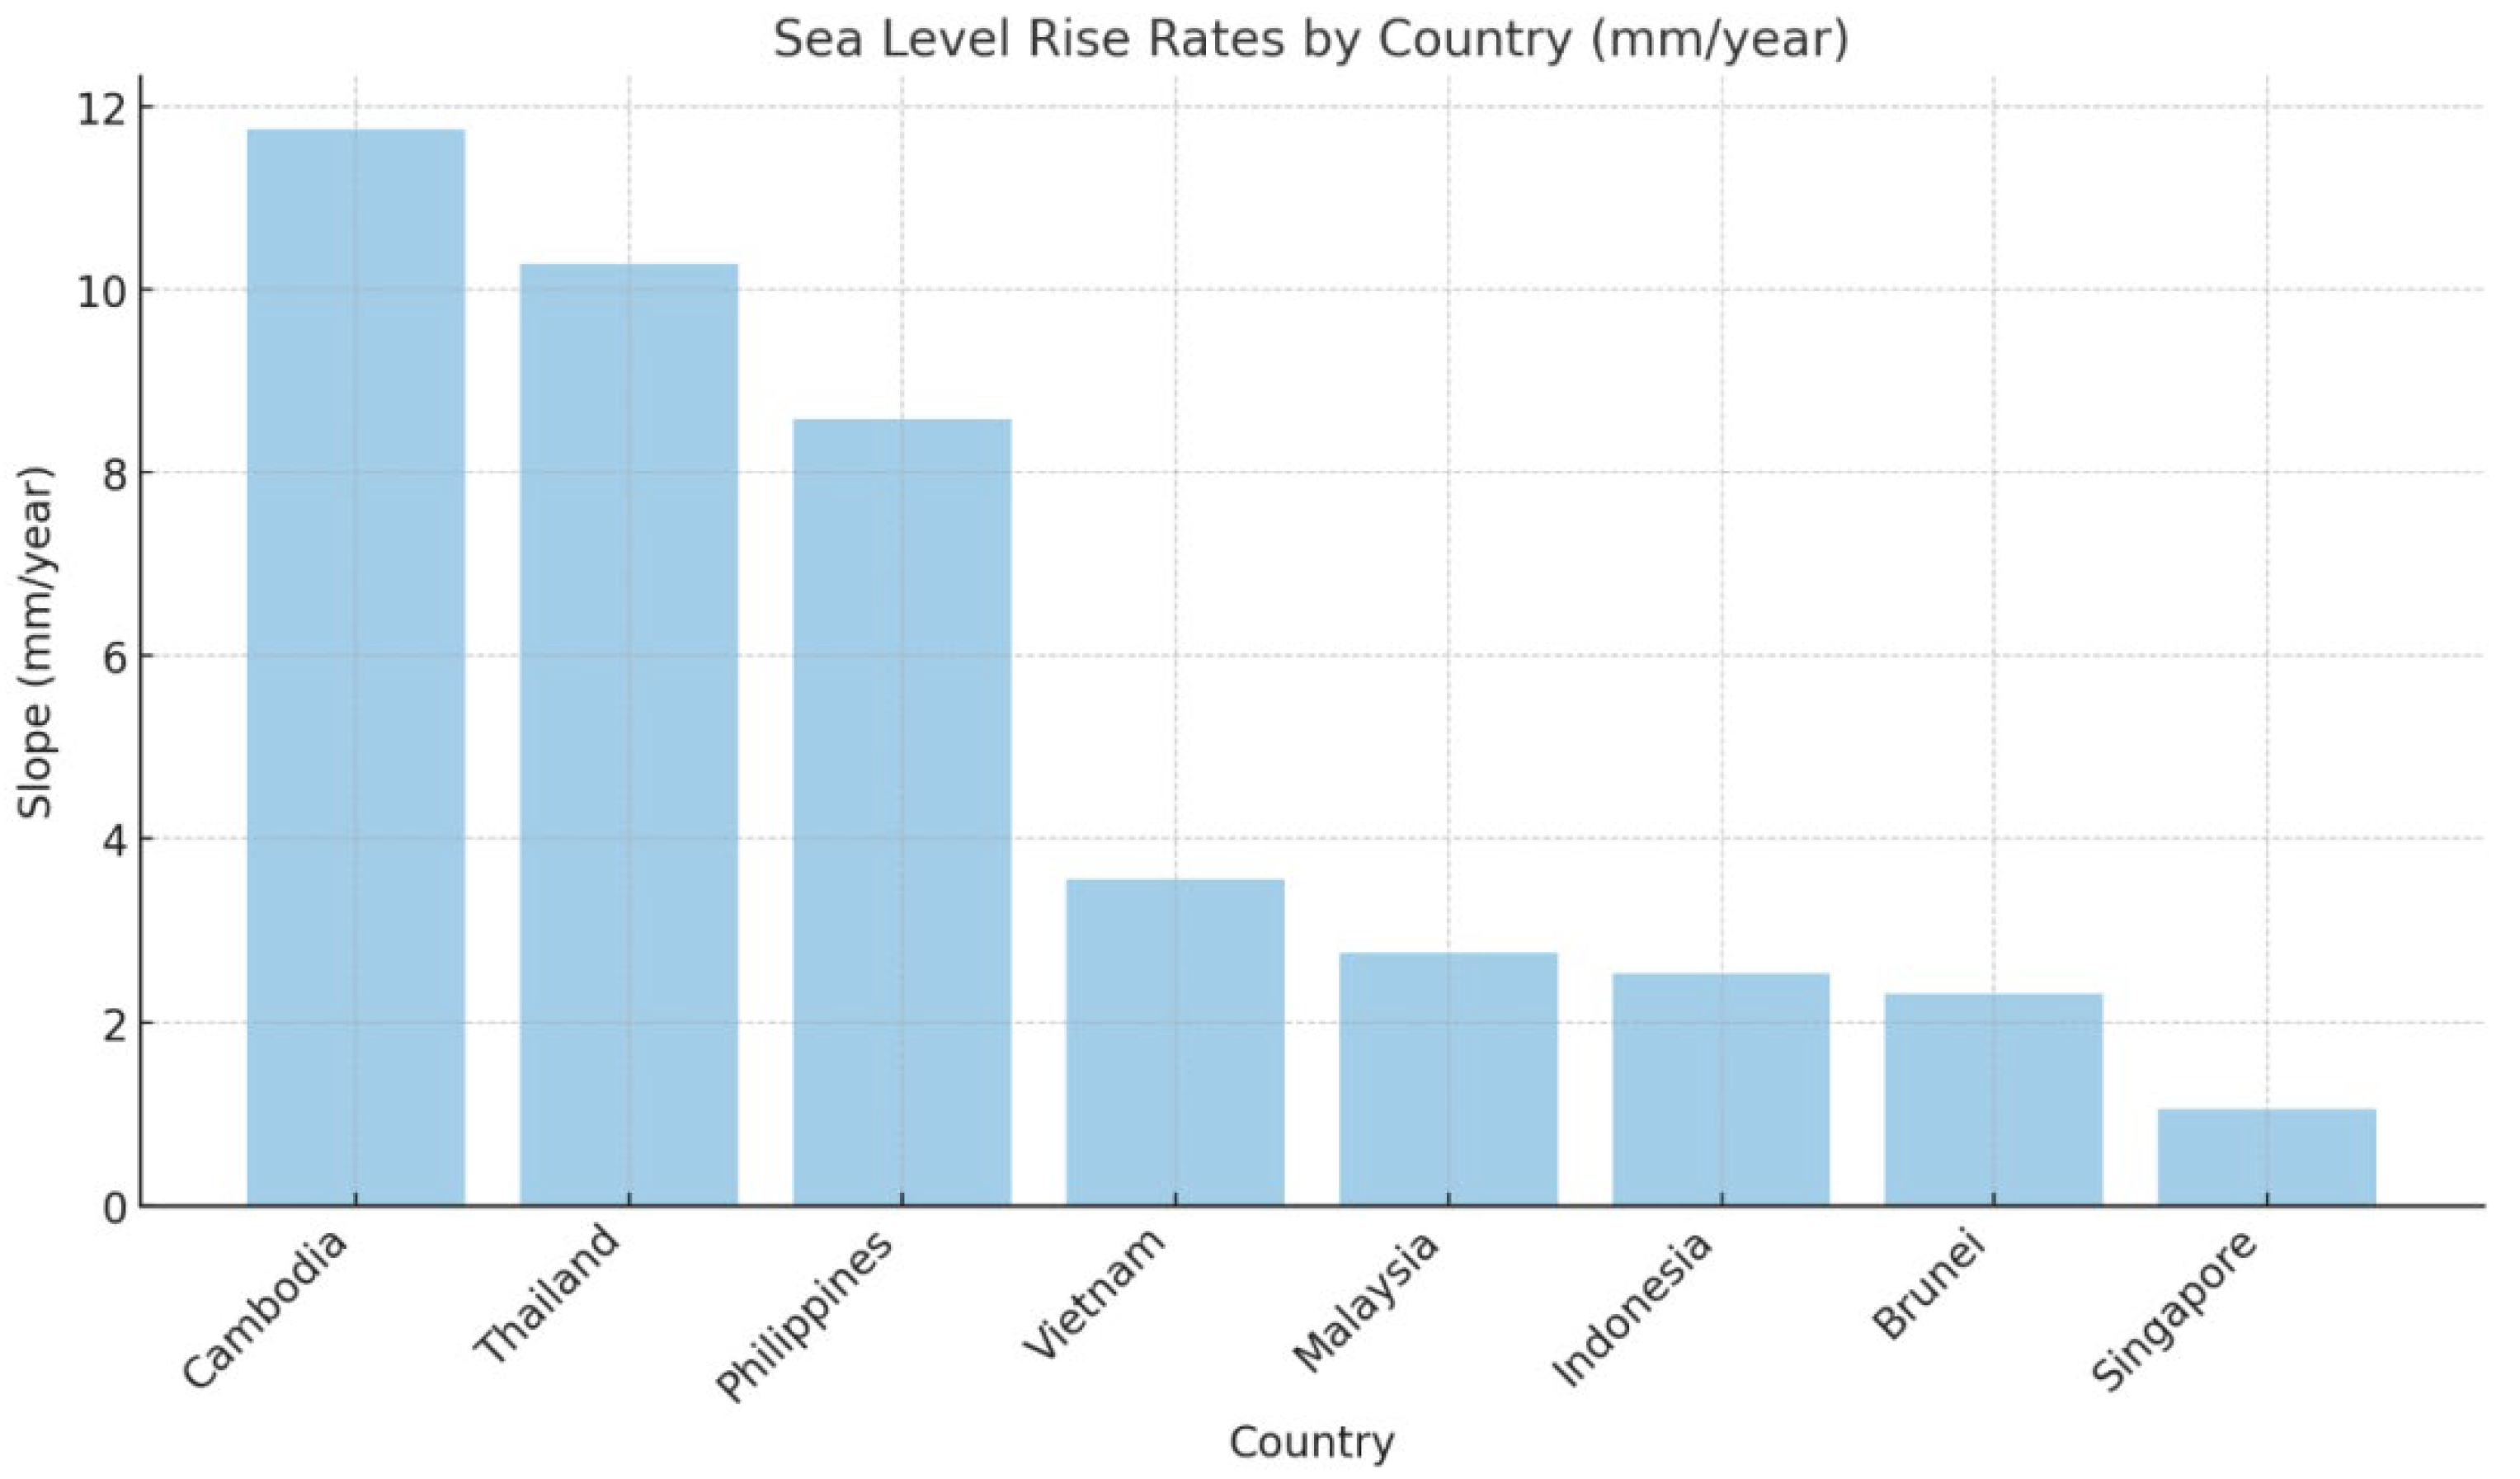
Figure 3.
Comparison of RF and XGBoost model performance. Averaged across five random seeds.
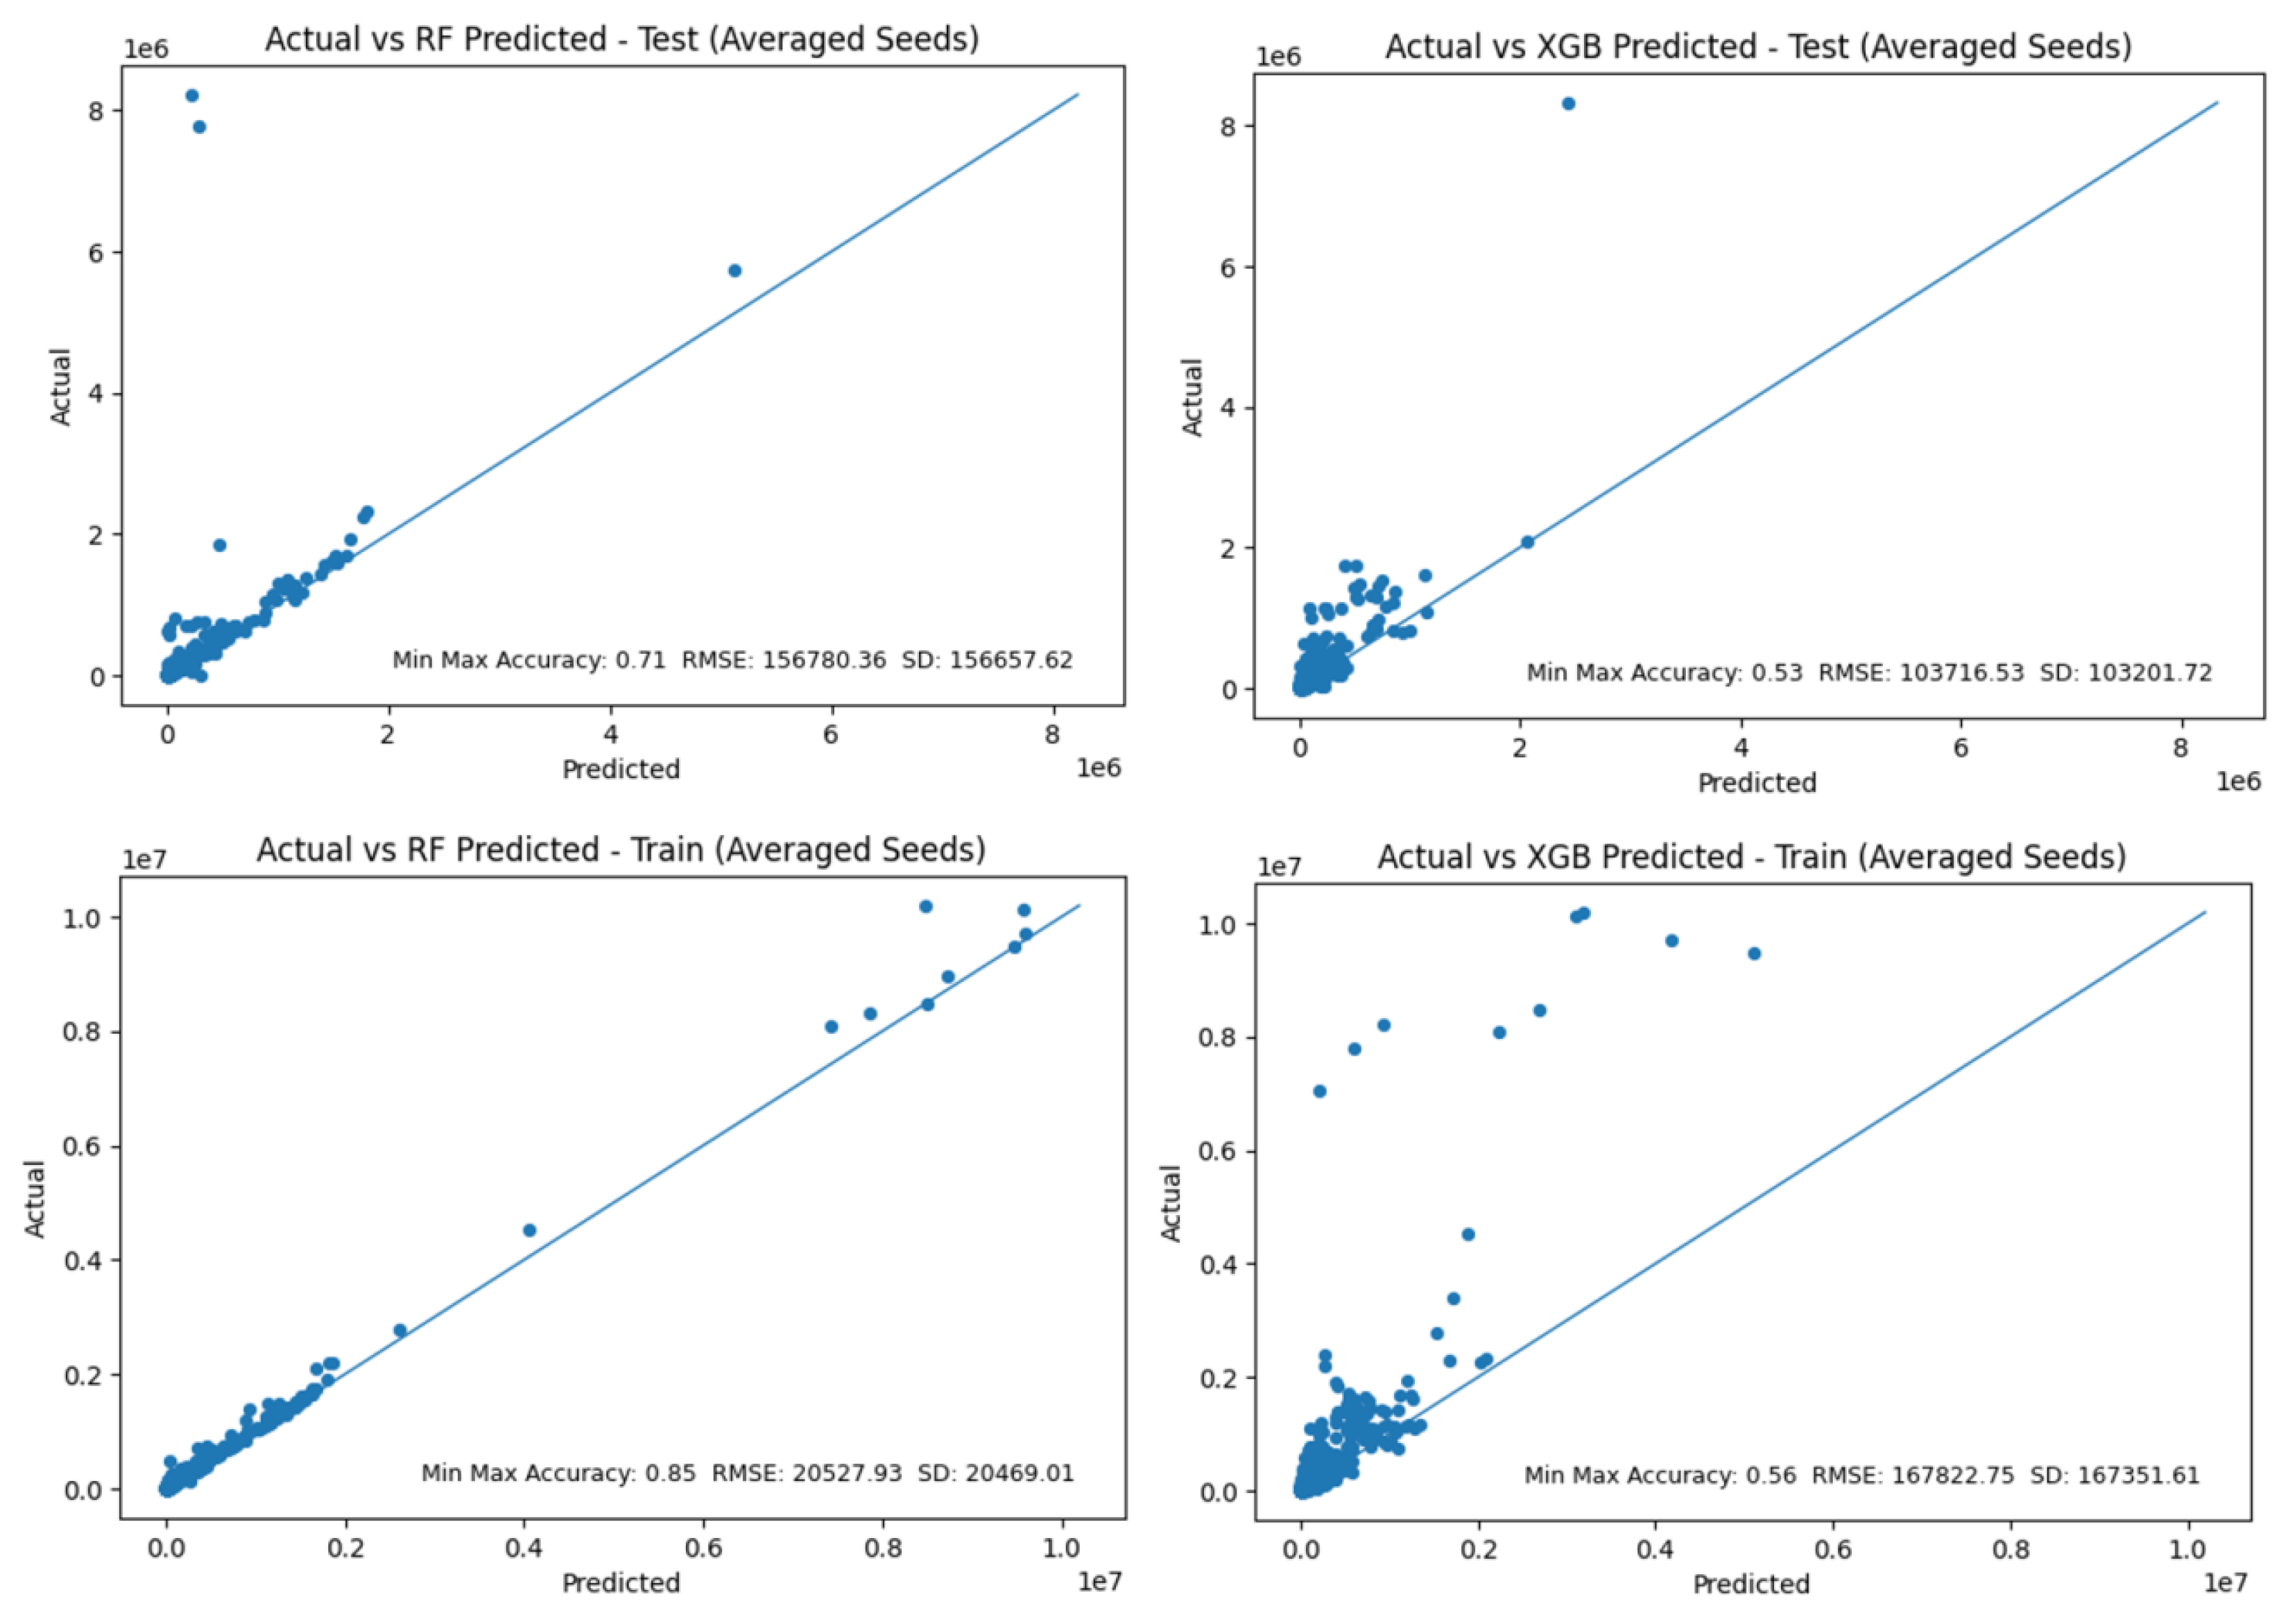
Figure 4.
SHAP global feature importance plot for Random Forest model.
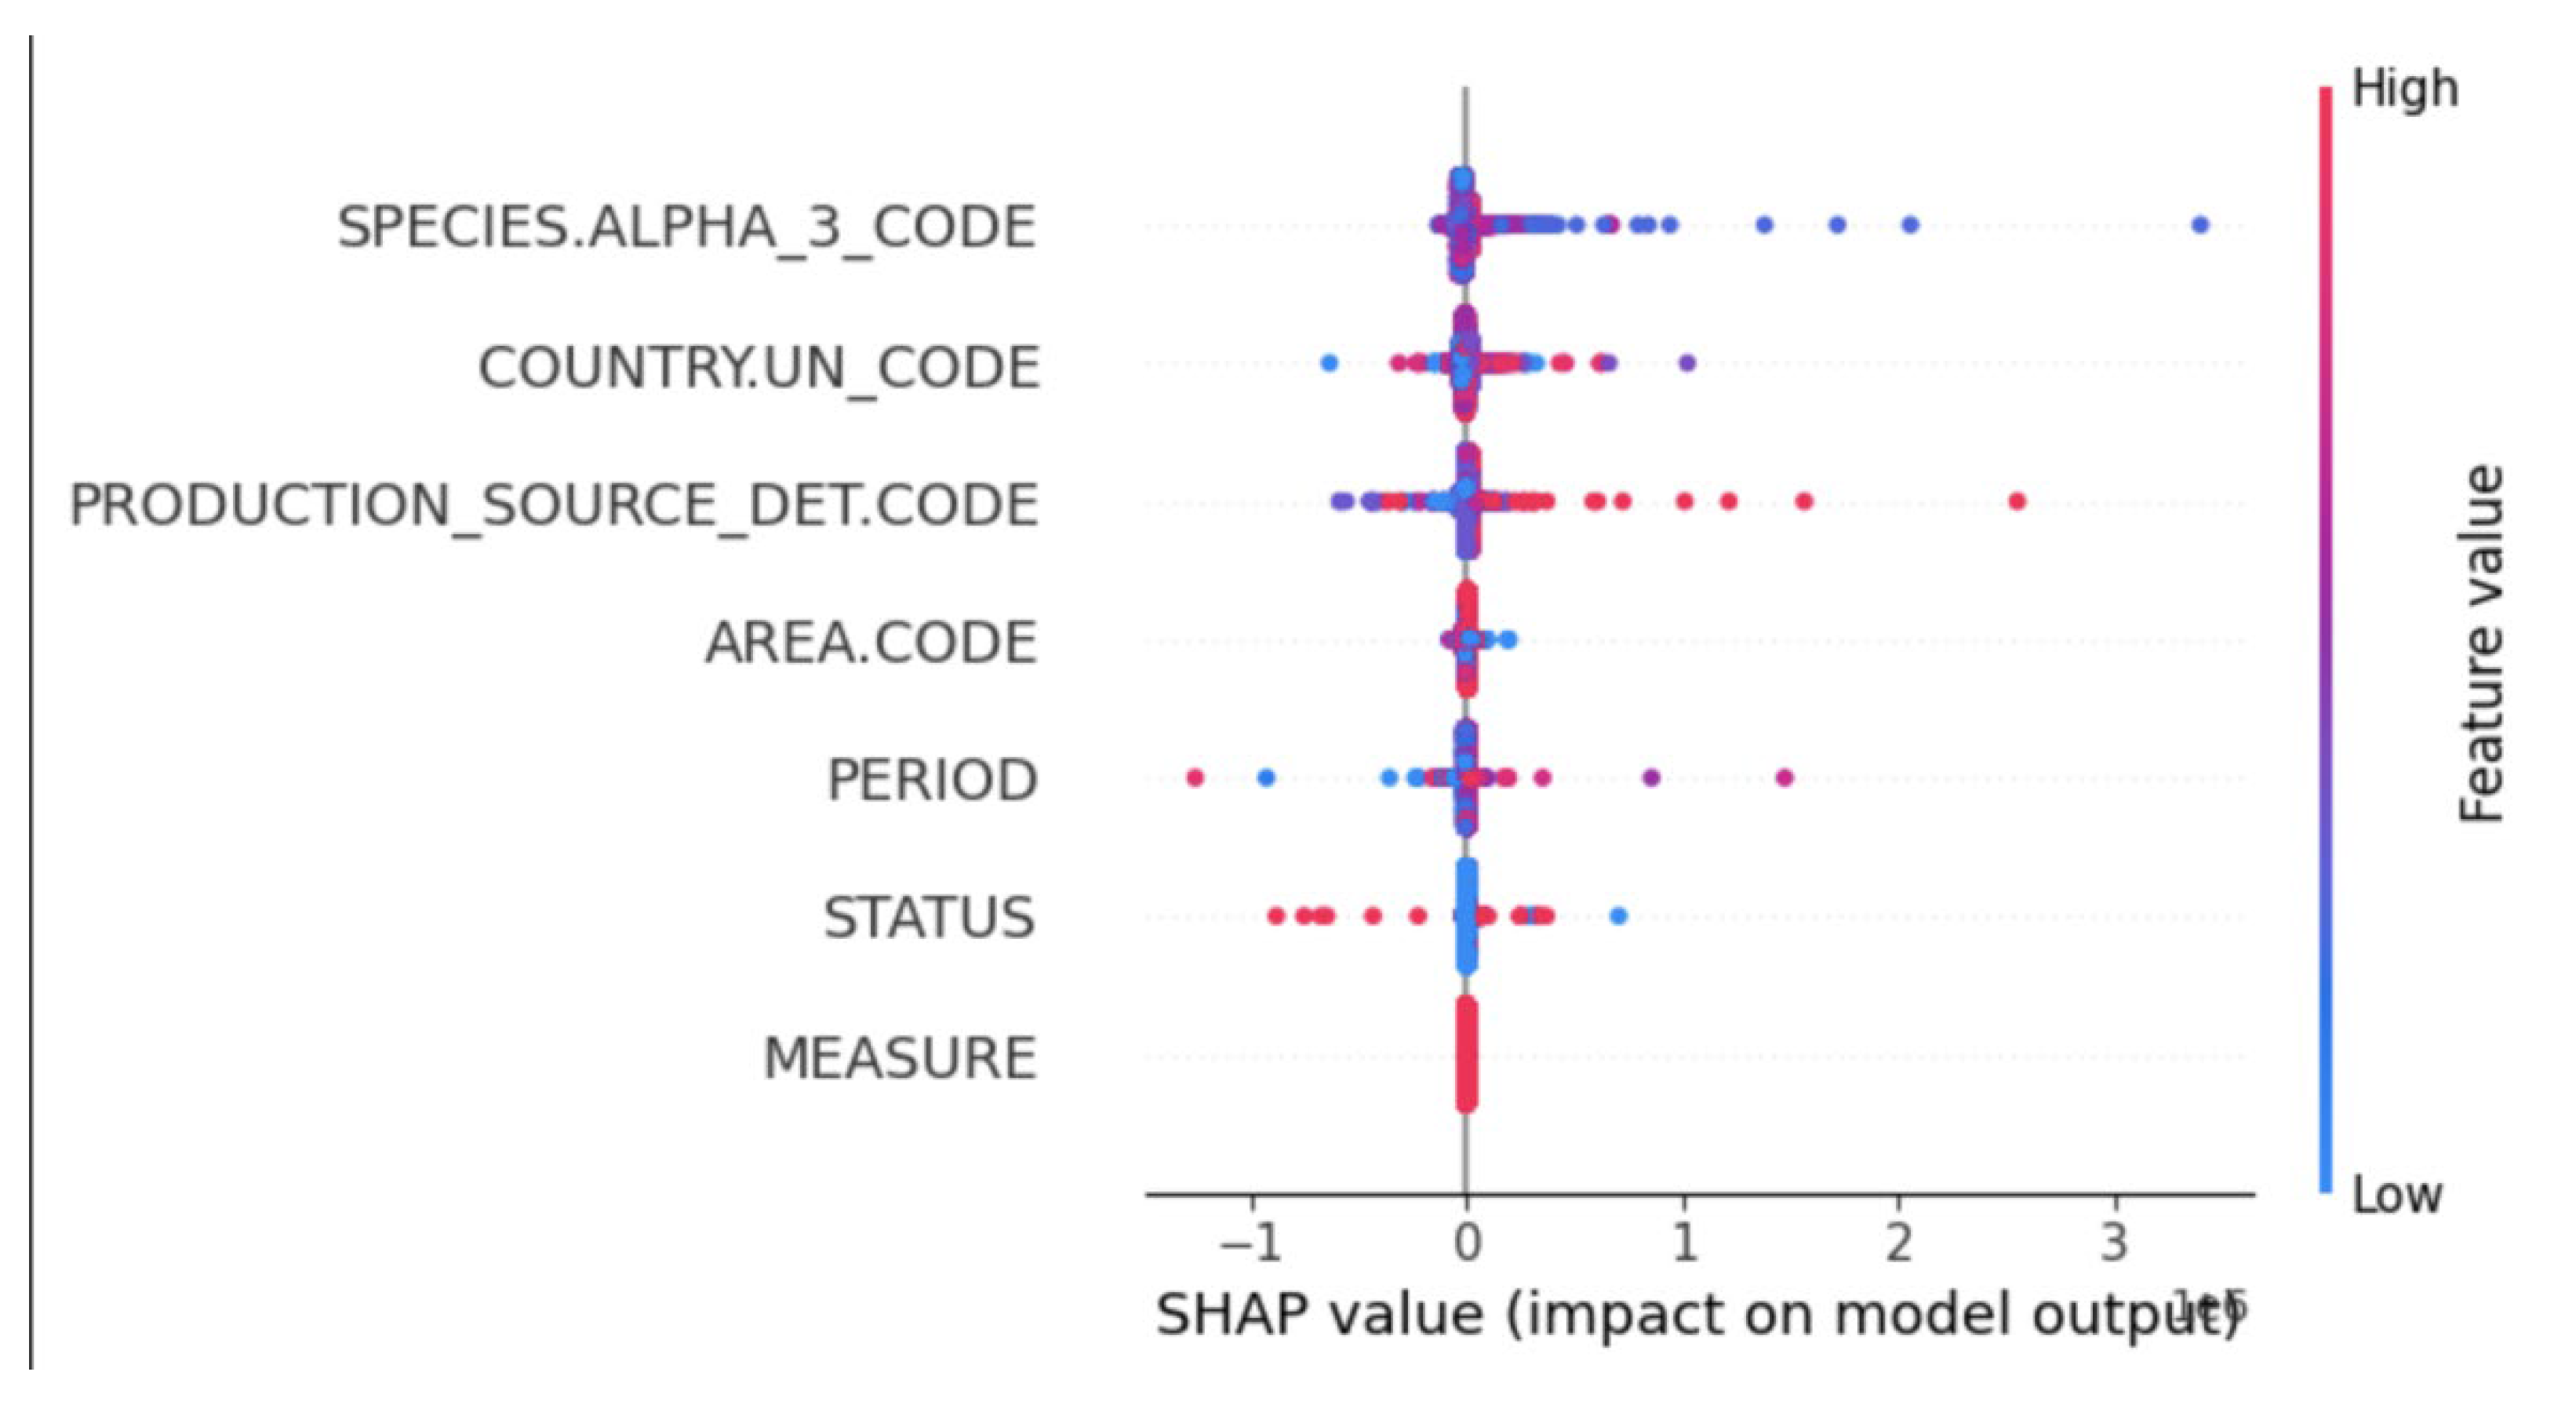

Table 1.
Summary of independent variables.
| Variable | Type | Description/Role in the model |
|---|---|---|
| Country | Categorical | 10 SEA nations (encoded) |
| Species group | Categorical | FAO species classification (encoded). Captures biological diversity and species-specific vulnerability |
| Production source | Categorical | Capture = 0, Aquaculture = 1 |
| Water area | Categorical | Indicates Inland = 0 or Marine = 1, production systems, reflecting environmental exposure level |
| Year (PERIOD) | Numeric | 2005–2025; controls for interannual variability and long-term shifts in production |
| SLR rate | Continuous | Mean national sea-level rise rate (mm yr⁻¹); quantifies physical environmental pressure associated with climate change |
Table 2.
Comparison of model performance.
| Model | Train R² | Test R² | RMSE (Test) | COR | Min–Max Acc_safe |
|---|---|---|---|---|---|
| Random Forest | 0.992 | 0.450 | 156,780 | 0.679 | 0.705 |
| XGBoost | 0.528 | 0.579 | 103,717 | 0.860 | 0.526 |
Table 3.
Integration of Environmental and Fisheries Risk Factors in Southeast Asia.
| Environmental Risk (SLR) | Socio-Economic Vulnerability (Fisheries) |
|---|---|
| Cambodia (11.7 mm/yr), Thailand (10.3 mm/yr), Philippines (8.6 mm/yr) show steepest rise. | FAO data: Philippines, Vietnam, Indonesia = high fisheries dependence. |
| Rising seas → flooding, erosion, habitat loss. | Capture fisheries more exposed to SLR; aquaculture shows partial resilience. |
| Coastal communities in deltas/islands most affected. | SHAP shows species & production source strongly drive outcomes. |
| Climate shocks amplify ecological degradation. | High SLR countries = also strong country-level SHAP effects. |
Disclaimer/Publisher’s Note: The statements, opinions and data contained in all publications are solely those of the individual author(s) and contributor(s) and not of MDPI and/or the editor(s). MDPI and/or the editor(s) disclaim responsibility for any injury to people or property resulting from any ideas, methods, instructions or products referred to in the content. |
© 2025 by the authors. Licensee MDPI, Basel, Switzerland. This article is an open access article distributed under the terms and conditions of the Creative Commons Attribution (CC BY) license (http://creativecommons.org/licenses/by/4.0/).
Copyright: This open access article is published under a Creative Commons CC BY 4.0 license, which permit the free download, distribution, and reuse, provided that the author and preprint are cited in any reuse.


