
Submitted:
25 October 2025
Posted:
27 October 2025
You are already at the latest version
Abstract
This work presents results of nylon-based composites used in additive manufacturing (AM) exposed during 24, 48, 96, 168, 336, and 504 hours of continuous exposure to UV and 50% humidity. Sample coupons were built on a Markforged Two® printer. To mimic UV exposure, samples were exposed to 253 nm UV light, whereas for humidity, samples were placed at 50% relative humidity and 22°C in a bi-distilled water atmosphere. The effects of said exposure were measured in tensile, Charpy impact energy, mass absorption, and Shore hardness D tests. nylon gained a 5.6% ±0.48 mass after 504 hrs. For Charpy, absorbed energy goes down from 0.463 J/mm^2 to 0.28 J/mm^2 at 504 h of humidity exposure. For Shore D, the variation goes from 59.1±0.82 for zero exposure to 66.8±2.5 at 504 h of UV exposure. Conversely, UV exposure induced an increase in Young’s modulus and Shore hardness, while significantly reducing impact energy to 0.32 J/mm², indicating embrittlement confirmed by SEM analysis. FTIR analysis revealed hydrolytic degradation under humidity and photo-oxidative degradation under UV, affecting N-H and C=O bonds. These findings allow a designer to project a component with mechanical properties according to the last day of service.
Keywords:
structural integrity
; additive manufacturing
; mechanical properties
; polymer aging
; UV and humidity
1. Introduction
One of the most popular techniques for polymers in additive manufacturing (AM) is material extrusion (MEX, per ISO/ASTM 52900, also known as fused deposition modeling, FDM) due to its affordability, speed, operational safety, and wide availability of materials such as ABS, PLA, PEEK, and nylon [1]. However, polymers used in MEX, such as nylon (PA6), are susceptible to degradation when exposed to adverse environmental conditions [2,3,4], which over time, negatively impacts their mechanical properties and limits the uses in engineering applications of these polymers [5,6] and polymer matrix composites (PMC) [7]. This paper explores the effect of UV and humidity exposure on PA6-based PMC mechanical properties. So, a designer has a quantitative assessment of such variation over time and forecasts a component for its last day in service.
Moreover, such degradation is widely documented in literature [2,3,4,8], and consists of a change in mechanical properties such as hardness, a change in stiffness, and a decrease in ductility over time. The literature recognizes the problem of moisture absorption in nylon samples [6,9] whether it is submerged [7,10] or in a humid atmosphere [11]. Such mechanical tests have been reported for nylon reinforced with continuous fibers [7,12,13,14] 3D printed composites [2,3] and nylon matrix under other media [8]. Therefore, the degradation of AM printed polymers under different combinations of time, UV light, and humidity generates uncertainty over the lifetime in the structural performance of components manufactured by this technique. However, damage in composites often starts at the matrix [15,16], but there are no studies for aging of just the MEX printed PA6 matrix [13] due to the orthotropy imposed by the printing process [14,17]. It is important to know the effect of such exposure to understand their long-term response [2].
Recent investigations focus on the hygrothermal aging and durability of composites with short carbon fibers [14]. Guo et al. [10] showed that the Onyx matrix reaches a saturation water content of 10.3% at 55 hours immersed in water at 60 ± 1℃. Then, they performed a three-point bending test where the general trend for flexural properties shows a gradual decline as aging effects become more pronounced. Shirinbayan et al. [11] performed tests to evaluate the physicochemical, thermomechanical, and mechanical properties of 3D printed PA6, obtaining water saturation plateaus at different temperatures. However, hydrothermal conditions are not the only ones that pose a risk to the performance of polymers. UV light degradation in polymers has also been documented [9] as failure mechanism for these polymers used as matrix. Moezzi et al. [18] conducted a study on the effects of UV degradation on the physical, thermal, and morphological properties of nylon 66. They showed that UV exposure had a significant effect on the shear modulus of the polyamide woven fabrics for as little as 20 hours. They also found through FTIR and XPS that the shear modulus of the fabrics decreased after only 4 h of exposure, but it increased after 15 h. Again, the shear modulus was reduced by increasing the UV exposure time to 20 h [16]. Mozzami et al. documented flexural elastic modulus drop for CFRP and GFRP exposed to water at 50° [19]. However, in all these cases [2,4,10,18] a composite was tested. It is known that damage in composites usually starts at the surface. This work explores the effects of UV and humidity exposure over time on the matrix for AM composites.
So, what we call ultraviolet light (UV) is the wavelength portion of the electromagnetic spectrum between 100 and 400 nm approx., as depicted in Figure 1. The UV range is divided into three parts: UV-A (315-400nm) is the least harmful for humans, UV-B (290-315 nm) causes sunburn, increases the risk of skin cancer, and consequent cellular damage. About 95% of all UV-B light is absorbed by the ozone in Earth's atmosphere, and UV-C (100-290nm) is harmful but is almost completely absorbed by Earth's atmosphere. It is commonly used as a disinfectant in food, air, and water to kill microorganisms by destroying cells. The shorter the wavelength, the more energy the wave has.
One way to optimize the mechanical properties of polymers is to embed short carbon microfibers into the thermoplastic matrix. The Mark Two® printer uses carbon fiber reinforced nylon (Onyx®) with mechanical properties of an order of magnitude higher than common 3D printers [20]. However, it has been shown that variables in the FDM process, including the flow and thermal dynamics of the melt, the extrusion process, the bonding process between successive layers of material, temperature and printing pattern play an important role in how the final interface between printing beads is formed, which consequently affects the mechanical properties of the final part [15]. This manuscript aims to have a better understanding of the effects on the mechanical properties of the Onyx material under relative humidity and exposure to UV light.
2. Materials and Experimental Methods
2.2. Material
Nylon is a synthetic polymer composed of repeating amide groups [21], forming strong covalent bonds that give it flexibility and toughness. nylons resist various oils and greases but can degrade with strong acids and bases [8]. The repeating amide groups attract water molecules, which causes a tendency of the material to absorb water absorption leading to dimensional swelling and softening [5,6]. nylon has a melting temperature of 250°C and has been used for AM due to its strength, toughness, versatility, and ease of processing by different AM techniques.
To improve nylon´s performance and finishing, short carbon fiber can be added to the matrix resulting in a composite. Carbon fiber is highly resistant to most chemicals, including acids, bases, and organic solvents, and can withstand high temperatures. In the resulting composite, the components are not bonded chemically; the fibers are dispersed in and held in place by the matrix.
2.3. Sample Preparation
Samples were fabricated using the MEX technology (per ASMT/ISO 52900). Using a Mark Two printer (Markforged® Inc.), with Onyx filament, which was also supplied by Markforged®. It has a density of 1.2 g/cm3, tensile modulus of elasticity of 2.4 GPa, and a tensile stress of 40 MPa [22]. All samples were printed with a solid fill pattern and were designed according to ASTM D638 for tensile tests, as shown in Figure 2a, and ASTM E23 for Charpy, as shown in Figure 2b.
2.1.1. Test Conditions
The tests included two environmental conditions: Relative humidity and exposure to UV-C light, each conducted with the two types of specimens shown in Figure 2, impact and tensile. For each test condition, four specimens of each type were used in each of the exposure periods: 24, 48, 96, 168, 336, and 504 hours; plus, the control group that was not exposed to any conditions after printing. This scheme allowed for consistent comparison across both testing environments and exposure times, ensuring robust data on the material’s performance while looking at long term degradation. Furthermore, sample coupons were tested for tensile, impact, hardness, SEM, and FTIR. Such testing provides an assessment of UV and humidity-induced degradation: structural, mechanical, and chemical modifications, providing a comprehensive understanding of the material's deterioration and its response to adverse environmental conditions over time. Details of each experiment are as follows.
2.2.1. Humidity Conditions and Water Absorption Methodology
The humidity conditions were created using an ACE UV Accelerated Weathering Test Chamber, model UV-260, at conditions of 50% relative humidity at 22°C using bi-distilled water to avoid possible contamination by foreign ions.
To measure the water absorption of the material, first, the initial mass of the samples was measured using an analytical balance (Pioneer PX OHAUS with readability of 0.001). Samples were extracted every 24, 48, 96, 168, 336, and 504 hours. The percentage moisture content Mt is defined as shown in Eq. (1):
where Wt is the weight of the wet material at moment t, and Wi is the weight of the dry material.
2.2.2. UV
A closed environment was designed and custom-built for UV light exposure using 253.7 nm wavelength UV commercial lamps, meeting the requirements of ISO 9227. The specimens were subjected to the same exposure time to ensure comparability between both conditions. Therefore, in this manuscript, henceforth UV refers to UV-C.
2.4. Impact and Hardness Testing
Hardness was measured with a TIME Group Inc. durometer, model TH210, using a Shore D scale, according to the ASTM D2240 standard.
To assess specimen impact toughness after various exposure durations, an ITC-300 impact pendulum from Physical Test Solutions, calibrated with a 150J hammer, was used. Testing was conducted in compliance with the ASTM D256 standard.
2.5. Tensile Testing
Tensile strength and elongation tests were performed using a Galdabini QUASAR 50 universal testing machine, with a 50 kN load capacity, at a 2 mm/min rate following ASTM D638. From that, the stress vs strain curve was built, and Young's modulus, and maximum strength were extracted.
2.6. FTIR
Fourier transform infrared spectroscopy (FTIR) was employed to analyze the material samples by identifying functional groups and chemical bonds present in the material. The analysis was conducted using a Shimadzu IRAffinity-1S spectrometer in ATR mode (Attenuated Total Reflectance) equipped with a diamond crystal. Data acquisition was done with LabSolutions IR software from Shimadzu. The instrument performed 40 scans for each sample, to average results and ensure accuracy. The characteristic spectra for nylon, in absorption mode, is shown in Figure 3 [23] where one can see its characteristic bands: O-H 3300, N-H 3170 – 3370; 1515 – 1570; 680 - 750, C=O 1630 – 1680 cm^-1.This is the baseline that later was used to evaluate Onyx as it is and Onyx after the humidity and UV treatments. It is important to clarify here that we did not find the FTIR pattern for Onyx, but ther e are several FTIR patterns for nylon [24].
2.7. Microscopy
A JEOL IT 700 HR scanning electron microscope (SEM) was utilized to perform fracture surface and microstructural analysis of the samples. The microscope was operated at 3 kV. The short carbon fiber reinforcement embedded within the matrix made the sample conductive, so no gold plating was required. Analysis provided surface morphology, fracture features, and any microstructural changes that may have occurred due to the experimental variables. This technique is useful for identifying failure mechanisms, such as fiber pull-out, matrix cracking, or interfacial debonding, which are critical for understanding the material's performance and degradation.
3. Results
3.1. Moisture Absorption
The absorbed humidity content in the material over the exposure times, from 0 to 504 hours is shown in Figure 4. A clear rising trend is observed, indicating a gradual increase in moisture absorption as exposure time progresses. At 24 hours, the moisture content is relatively low, around 1%, increasing steadily over the first week, reaching up to 2%. The most significant rise occurs after 168 hours, eventually climbing to around 5.6% after 504 hours. This steady increase suggests that prolonged exposure leads to higher moisture absorption. The moisture absorption over time can be accurately predicted using the exponential relation shown in Eq. (2).
where HR is the moisture content (%) and h is the exposure time in hours. This model provides a high degree of predictability, as evidenced by an R2=0.9523, indicating that over 95% of the variability in moisture absorption can be represented by this equation. The adjusted R^2 is very close, 0.9477, showing that there is no redundant data. The adjusted R^2 penalizes the addition of irrelevant independent variables, providing a more accurate measure of the model's explanatory power than R^2.
3.2. Impact Results
The control samples, for impact testing, are shown in Figure 5a. One can see all of the samples broke with a clearly defined and straight path [25]. On the other hand, none of the humidity-exposed samples broke completely, with a residual ligament keeping the sample together, as shown in Figure 5b. This nonbreaking behavior has been documented before for room [15] and other temperatures [25] which may indicate that humidity did not change impact behavior. On the other hand, UV samples showed non-breaking behavior after 96 hours of exposure. Furthermore, for the most part, the crack path followed the direction perpendicular to the maximum normal stress as induced by the applied load. In cases where it did not (mostly in the humidity-exposed samples), deviation from the preferred path might be attributed to the intrinsic anisotropy induced by the printing process. Garcia et al. [15] also noted that crack started perpendicular to the notch but in some instances deviated from such direction and Guo et al. [26] reported how humidity also affects fatigue performance and crack propagation, especially mode II which dictates how a crack kinks.
Charpy tests are shown in Figure 6. For humidity samples, energy absorption rises and remains about the same up to 96 hours, followed by a gradual decline, indicating moisture-induced weakening in the material. In contrast, UV exposure causes an initial increase in energy absorption, peaking at 24 hours, but rapidly declining after 96 hours, reaching very low levels at 504 hours. This highlights that both UV and humidity exposure induce severe material degradation, likely due to surface effects or cross-linking.
3.3. Hardness Testing Results
Hardness Shore D results are shown in Figure 7, exhibiting an initial average value of 59.7. This value rises in the first 96 hours, reaching a peak of 65.9 and 64.9 for the humidity and UV samples, respectively. After 96 hours, the hardness tends to decrease. Humidity samples for 504 hours of exposure reach a value of 61.8. However, UV samples for 504 hours of exposure reach a maximum value of 66.8. For UV conditions, this behavior indicates an inverse relationship between hardness and impact resistance. Increased Shore-D hardness corresponds to decreased Charpy energy absorption, suggesting that UV exposure makes the material harder but more brittle. In contrast, humidity exposure has a less pronounced effect on hardness, but it gradually reduces impact resistance over time, likely due to moisture-induced weakening of the material’s internal structure. Furthermore, there are exemplary results of indentation size with no exposure are shown in Figure 6b, for 504h of UV exposure in Figure 6c, and for 504 h of humidity exposure in Figure 6d. Finally, the exemplary indentation photographs show that the indentation imprints were done in a defect-free area and their size is not near the size of the material´s structure, validating the measurements.
3.4. Tensile Testing
Figure 8 illustrates Young's moduli progression for samples exposed to UV light and humidity. One can see distinct trends for each treatment. For UV-exposed samples, the modulus steadily increases during the first week and remains stable. Its evolution was adjusted to the time dependent relation shown in Eq. (3).
This increase suggests surface hardening and cross-linking effects, rising stiffness but potentially leading to brittleness, as shown previously in the impact and hardness testing results [3]. On the other hand, samples exposed to humidity exhibit a slight decline, adjusted to the relation shown in Eq. (4). As a comparison, Shirinbayan et al. [11] reported an elastic modulus decrease of about 25%, but for samples submerged in water.
These findings demonstrate how UV and humidity trigger opposing degradation mechanisms, significantly influencing the long-term mechanical performance of the material. Furthermore, these results agree with [3] who documented the influence of humidity on the flexural rigidity change. As comparison, Shirinbayan et al. [11] reported a 20% drop in strength for samples fully submerged in water.
Moreover, results for tensile testing are shown in Figure 9. One can see UV exposure steadily rises strength from 29 ±0.51 MPa to 33.6±0.53 MPa at 504 h, whereas for humidity exposure it presents a little raise as high as 30.6 at 96 h but drops to 27.4 MPa at 504 h.
Tensile results tend to agree with elastic modulus results as both tests measure mechanical properties reflecting how the polymer responds to external loading, albeit measuring a different response. A longer polymer tends to be more rigid, which affects its resistance to plastic deformation. Because it takes more effort to deform or break the chains, this increase in rigidity may lead to a greater resistance to tension.
However, the relationship is not always linear: some strong polymers may be brittle and easily break (having little tenacity or tensile strength), while other, less strong ones may be more resilient and resistant to testing due to their ability to absorb energy before breaking. Both properties are simultaneously impacted by the molecular stiffness, length, and encrustation of the polymer chains and intermolecular forces. For instance, increasing molecular weight and the number of intermolecular bonds often improves strength and usually hardness.
3.5. FTIR
Figure 10 depicts the FTIR spectra obtained from the Onyx sample as it is, whereas Figure 3 shows results for PA6 [23], where one can see both are very similar patterns. Therefore, the effect of the chopped carbon fiber embedded in the matrix does not significantly alter the FTIR spectrum.
Figure 11 shows the absorbance spectra for samples subjected to humidity, showing how the continuous and extended exposure to humidity alters the chemical structure of nylon. The peak observed around 3000 - 3300 cm⁻¹ corresponds to the N–H stretching vibration. O-H stretching region from 3200–3600 cm⁻¹. Peaks from 2800 cm⁻¹ to 2950 cm⁻¹ are attributed to the stretching of –CH₂– groups. The broad peak at 1640 cm⁻¹ is due to C=O stretching (Amide I), while the peaks around 1550 cm⁻¹ are associated with N–H bending and C–N stretching (Amide II) [23,24,27].
In the first 96 h, minimal changes are observed in the spectra, with only slight broadening in the O-H stretching band (3200–3600 cm⁻¹). This suggests initial moisture absorption but no significant chemical alterations in the polymer structure. After 168 h, the increased O-H peak intensity indicates a high level of moisture absorption, likely penetrating deeper into the material as exposure time continues, which coincides with the mass absorption tests. At 336- and 504 h, small changes in the amide and carbonyl region (N-H and C=O) hint at hydrolysis and hydrolytic degradation, breaking down amide bonds in the polymer. This degradation can lead to the formation of new carbonyl-containing groups, which weaken the material. Also, in the fingerprint region (500–1500 cm⁻¹), there is noticeable broadening after 168 h, which may hint at changes in the polymer’s microstructure.
The following is a summary of the spectra evolution.
- There are minor variations in the absorbance values throughout the spectra over the first 24 to 96 hours of humidity exposure. These could point to subtle interactions between the functional groups of nylon and water molecules. The existence of O-H stretching from absorbed water is often indicated by increases in absorbance around 3300–3500 cm^-1.
- The FTIR spectrum exhibits an increase in peak intensities after 168 hours, indicating increased water absorption and possible nylon material expansion. It may become more apparent how water interacts with the amide groups (about 1640 cm^-1 and 1500 cm^-1), signifying H bonding and physical alterations in the nylon.
- Considerable water absorption is indicated by notable variations in the spectra for the 336 and 504 hours. Peaks that correspond to amide I (C=O stretching) at around 1640 cm^-1 and O-H stretching at about 3300–3500 cm^-1 intensified. This would suggest that the water molecules and the nylon polymer chains have formed a stronger hydrogen-bonded network. Furthermore, modifications in the 600–800 cm^-1 area (linked to the C–H bending vibrations) may indicate changes in the molecular interactions within the polymer matrix because of extended exposure to water.
All things considered, the spectra demonstrate how prolonged exposure to humidity progressively changes the nylon´s chemical structure, mostly because of interactions between water molecules and the functional groups of the polyamide. This affects mechanical properties like strength and elasticity.
The FTIR spectra for UV-exposed samples are shown in Figure 12, showing signs of photo-degradation. Shifts in the N-H bending and C-N stretching regions (around 1500–1600 cm⁻¹) at the first 24 h indicate possible alterations to amide bonds that show progressive change. The O-H and C=O regions continue to show increased absorbance at 336 h, suggesting that prolonged UV exposure causes oxidation and the formation of new hydroxyl and carbonyl groups.
A summary of changes is as follows.
- The spectra show slight variations in absorbance throughout the first 24 to 96 hours of UV exposure. Early stages of photodegradation, in which UV radiation breaks chemical bonds in the nylon and modifies peak intensities slightly, may be the cause of these changes. The production of carbonyl groups (C=O stretching), which are common byproducts of photodegradation, may be indicated by modest increases or shifts in absorbance around 1700 cm^-1.
- There are noticeable alterations in the spectra at 336 and 504 hours, indicating significant photodegradation. Significant increases in the carbonyl peaks' intensity (~1700 cm^-1) indicate a substantial buildup of degraded byproducts. Changes in the O-H stretching areas about 3300–3500 cm^-1 could be a sign that hydroxyl-containing groups are forming. Changes may also be seen in areas linked to C-H stretching (~2900 cm^-1) and bending (~1400 cm^-1), which demonstrate the disintegration of the polymer backbone and the creation of smaller molecules.
- There are noticeable alterations in the spectra at 336 and 504 hours, indicating significant photodegradation. Significant increases in the carbonyl peaks' intensity (~1700 cm^-1) indicate a substantial buildup of degraded byproducts. Changes in the O-H stretching areas about 3300–3500 cm^-1 could be a sign that hydroxyl-containing groups are forming. Changes may also be seen in areas linked to C-H stretching (~2900 cm^-1) and bending (~1400 cm^-1), which demonstrate the disintegration of the polymer backbone and the creation of smaller molecules.
In general, nylon's chemical structure deteriorates with extended UV exposure, mostly due to the creation of carbonyl and hydroxyl groups. nylon's mechanical qualities are impacted by this deterioration, which over time makes it less resilient and more brittle. The findings emphasize the substantial degradation of nylon caused by UV radiation, as well as the alteration in mechanical characteristics following extended exposure to UV light.
3.6. Electron Microscopy
The SEM analysis of tensile and impact tests provides clear evidence of the degradation mechanisms induced by UV exposure by showing the fracture surface. At 0 hours, the tensile tests reveal a fractured surface typical of ductile failure mode as seen in Figure 13a, characterized by visible deformation and high energy absorption by means of matrix-fiber debonding and matrix rupture as seen in Figure 13. The matrix exhibits a cohesive interaction with the filaments, allowing significant plastic deformation before rupture, characteristic of a ductile material able to withstand high energy absorption. The impact testing induces a high strain rate; therefore, the failure mode is dominated by rapid crack propagation and a lack of significant deformation in the filaments, as shown in Figure 13c and Figure 13d, where the characteristics of brittle fracture can be seen. The load is applied very rapidly, so the material does not have time to accommodate and absorb energy, producing an unstable rupture.
In contrast, after 504 hours of UV exposure, the tensile samples exhibit a drastically different fracture behavior. The surface shows signs of embrittlement in the matrix as seen in Figure 14a, which limits the ability of the Onyx filaments to absorb energy while the quasi-static load is applied. Instead of the characteristic stretching and tearing observed in ductile failure, the matrix cracks cleanly as seen in Figure 14b, transferring stress more abruptly to the filaments. This brittle failure mode is marked by smoother and more planar fracture surfaces when compared to samples with no UV exposure.
4. Discussion
When R^2 and adjusted R^2 are close, it could mean that the model is not too complicated and that the model's fit to the data is not benefited by the addition of more independent variables beyond what would be predicted by chance as showed in Figure 4. However, there is a saturation point where the material can no longer absorb moisture. Further tests are needed to determine the saturation point of the material under the aging conditions.
Guo et al. [10] showed that the Onyx matrix reaches a saturation water content of 10.3% at 55 hours under temperature-controlled water bath at 60 ± 1℃ [6]. Then, they performed a three-point bending test, where the general trend for flexural properties shows a gradual decline as aging effects become more pronounced. This condition causes water to get in the middle of the fiber-matrix, reducing the adhesion of fiber to matrix, making any fiber more susceptible to interface debonding or pulling out. Bergeret et al. [7] on the other hand, showed saturation as little as 30h but for samples at immersed in water 135 °C. Shirinbayan et al. [11] showed saturation for as little as 75 h approx. but for submerged samples at 70 °C. In the tests performed, saturation was not observed.
Elasticity, Figure 8, and strength, Figure 9, show a similar trends. This could be attributed to photochemically induced reactions that generate crosslinking in the polymer, increasing strength and elasticity, especially in the initial stages or under controlled conditions. Amide bonds (between the carbonyl group (C=O) and the amino group (NH2) in nylon can absorb UV energy, which can cause them to break and lead to the formation of free radicals. In some cases, this is also associated with a change in color. Although color change was not measured, such behavior has been reported for nylon. This could be attributed to the short carbon fiber that was not sufficiently exposed to generate such discoloration.
Except for the hard Shore D, all mechanical tests were lower for humidity exposure. This phenomenon is somehow reversible. Drying nylon samples, at least to some extent, restores mechanical properties. It is a common practice to dry up, not only nylon but other polymers commonly used in FDM as well, when left in humid environments. This process improves printability.
On the other hand, microscopy showed significant embrittlement, corroborating the decrease in tensile strength and impact on energy. Samples exposed to UV after a static test showed the same brittle morphology as impact simples. UV light causes photo-oxidation in nylon, weakening the polymer structure and causing cracks and internal damage visible under microscopy. This damage compromises the nylon’s ability to absorb energy during impact, making samples appear brittle much like mechanically impacted samples that have undergone fracture [18].
A one-way ANOVA was run with normalized values to assess the difference between treatments with an uncertainty of 5%. Normalized values refer to Strength, Elasticity, Hardness, and Impact values divided over their respective maximum. The null hypothesis was that “the averages of the different measurements are equal among them”. Figure 15 shows the comparison of normalized values for mean and standard deviation and Table 1 the relationship among variables.
The result of comparing mean and standard deviation among treatments is as follows:
Impact Charpy vs Hardness Shore: p = 0.00000 (significant)
Impact Charpy vs Strength: p = 0.81626 (not significant)
Impact Charpy vs Young: p = 0.00185 (significant)
Hardness Shore vs Strength: p = 0.00000 (significant)
Hardness Shore vs Elasticity: p = 0.00017 (significant)
Strength vs Elasticity: p = 0.00356 (significant)
This means that normalized average values for strength, Elasticity and Shore D hardness are statistically equal. This suggests that the observed differences between normalized values may be due to manufacturing differences, treatment variability or testing error within groups, and not to a real effect of the factors analyzed.
5. Conclusion
Nylon PA6 with carbon fiber reinforcement demonstrates a significant capacity for water absorption under 50% humidity conditions. The water adsorption was measured through mass absorption test. Moisture content increases progressively from 1.03% ± 0.28% at 24 hours to 5.6% ± 0.48% after 504 hours. FTIR in transmission mode, confirmed such water absorption. It was observed a gradual increase with humidity exposure in C=O (around 1640 cm^-1) and O-H (about 3300–3500 cm^-1) bands. This moisture absorption weakens the material's polymer matrix, leading to a change in tensile strength, elasticity and impact resistance. The progression of moisture absorption in the material over time fits an exponential model capturing the material’s response to long-term humidity exposure up to 504 h exposure. However, under the testing conditions (50 % humidity atmosphere) saturation point was not reached.
Exposure to UV light induces distinct changes in mechanical properties. Initially, the material exhibits hardening, as evidenced by a significant increase in Young’s modulus over time, reaching 505 MPa after 504 hours. This hardening is accompanied by increased Shore-D hardness, peaking at 66.8 ± 2.52 Shore-D after 504 hours. However, this stiffening corresponds to a sharp reduction in Charpy energy absorption, indicating embrittlement possibly due to photo-oxidative degradation.
Humidity induces gradual softening due to moisture absorption, reducing the material's mechanical properties over time. In contrast, UV light exposure accelerates surface-level oxidative cross-linking, increasing stiffness and hardness but leading to embrittlement and reduced impact resistance. These findings demonstrate that environmental exposure to UV is more aggressive in altering the material's mechanical behavior than exposure to humidity. Both exposure mechanisms induced surface changes, producing a change in volumetric measurements. However, depth of such modification could not be measured.
The SEM analysis reveals significant degradation in the mechanical integrity of Onyx samples due to UV exposure. At 0 hours, the material exhibits ductile failure with visible deformation of filaments and plasticity, indicating good energy absorption. After 504 hours, the matrix becomes embrittled, limiting filament deformation and resulting in brittle failure with clean, planar fracture surfaces. This behavior resembles high-speed impact failures, as UV exposure mimics high strain-rate effects by reducing the material's capacity to dissipate energy.
No statistically significant difference with a 5% uncertainty was found between Strength, Elasticity and Hardness.
Author Contributions
Conceptualization, J.G.D.; and E.U.B.; methodology, J.G.D.; E.R.L.; and A.G.C.; software, B.R.F.; validation, all; formal analysis, all.; investigation, J.G.D.; and B.R.F.; resources, J.G.D.; E.U.B. and. E.R.L; data curation, B.R.F.; writing—original draft preparation, B.R.F.; writing—review and editing, all; visualization, B.R.F. and A.G.C.; supervision, J.G.D.; and E.U.B.; project administration, J.G.D.; E.R.L.; and A.G.C.; funding acquisition, E.U.B.; E.R.L. and J.G.D. “All authors have read and agreed to the published version of the manuscript.”
Funding
This research received no external funding.
Institutional Review Board Statement
Not applicable
Informed Consent Statement
Not applicable
Data Availability Statement
Data available upon request
Acknowledgments
The authors would like to thank Mrs. J. I. Quintero and Mr. M. A. Alcaraz for their help while performing the aging and mechanical tests. Also, to Prof. B. García-Ferrara at TEC - CCM for facilitating the SEM access.
References
- Cano-Vicent A, Tambuwala MM, Hassan SkS, et al (2021) Fused deposition modelling: Current status, methodology, applications and future prospects. Addit Manuf 47:102378. [CrossRef]
- Ferreira LM, Aranda MT, Muñoz-Reja M, et al (2023) Ageing effect on the low-velocity impact response of 3D printed continuous fibre reinforced composites. Compos B Eng 267:111031. [CrossRef]
- Morales MA, Lawrence BD, Henry TC (2025) Impact of moisture and temperature on the flexural properties of 3D-printed carbon fiber-reinforced polyamide composites. J Compos Mater. [CrossRef]
- Finazzi D, Seychal G, Raquez J-M, et al (2024) Study of the temperature-humidity equivalence and the time-temperature superposition principle in the finite-strain response of polyamide-6 and short glass fibre-reinforced polyamide-6. Polym Test 141:108653. [CrossRef]
- Nairn JA (2000) Matrix Microcracking in Composites. In: Comprehensive Composite Materials.
- Humeau C, Davies P, LeGac P-Y, Jacquemin F (2018) Influence of water on the short and long term mechanical behaviour of polyamide 6 (nylon) fibres and yarns. Multiscale and Multidisciplinary Modeling, Experiments and Design 1:317–327. [CrossRef]
- Bergeret A, Pires I, Foulc MP, et al (2001) The hygrothermal behaviour of glass-fibre-reinforced thermoplastic composites: a prediction of the composite lifetime. Polym Test 20:753–763. [CrossRef]
- Hernández JLM, d’Almeida JRM (2017) Aging of polyamide 12 in oil at different temperatures and pressures. Polym Adv Technol 28:1778–1786. [CrossRef]
- Díaz-Rodríguez JG, Pertúz-Comas AD, González-Estrada OA (2021) Mechanical properties for long fibre reinforced fused deposition manufactured composites. Compos B Eng 211:108657. [CrossRef]
- Guo K, Ren Y, Han G, et al (2025) Hygrothermal aging and durability prediction of 3D-printed hybrid fiber composites with continuous carbon/Kevlar-fiber and short carbon-fiber. Eng Fail Anal 167:108958. [CrossRef]
- Shirinbayan M, Benfriha K, Ahmadifar M, et al (2024) Effects of hygrothermal aging on the physicochemical and mechanical properties of 3D-printed PA6. The International Journal of Advanced Manufacturing Technology 131:4811–4823. [CrossRef]
- Moreno-Núñez BA, Abarca-Vidal CG, Treviño-Quintanilla CD, et al (2023) Experimental Analysis of Fiber Reinforcement Rings’ Effect on Tensile and Flexural Properties of OnyxTM–Kevlar® Composites Manufactured by Continuous Fiber Reinforcement. Polymers (Basel) 15:1252. [CrossRef]
- Wickramasinghe S, Do T, Tran P (2020) FDM-Based 3D printing of polymer and associated composite: A review on mechanical properties, defects and treatments. Polymers (Basel) 12:1–42. [CrossRef]
- Kikuchi BC, Bussamra FL de S, Donadon MV, et al (2020) Moisture effect on the mechanical properties of additively manufactured continuous carbon fiber-reinforced Nylon-based thermoplastic. Polym Compos 41:5227–5245. [CrossRef]
- García-León RA, Rodríguez-Castilla M, Quintero-Quintero W (2021) Experimental Analysis of Impact Resistance of 3D Polycarbonate and Nylon + Carbon Fiber Specimens. J Mater Eng Perform 30:4837–4847. [CrossRef]
- Paredes AC, Bohórquez O, Pertuz A, et al (2019) Interlaminar tensile strength for composite materials made by additive manufacturing. J Phys Conf Ser 1386:012002. [CrossRef]
- Cuan-Urquizo E, Barocio E, Tejada-Ortigoza V, et al (2019) Characterization of the Mechanical Properties of FFF Structures and Materials: A Review on the Experimental, Computational and Theoretical Approaches. Materials 12:895. [CrossRef]
- Moezzi M, Yekrang J, Ghane M, Hatami M (2020) The effects of UV degradation on the physical, thermal, and morphological properties of industrial nylon 66 conveyor belt fabrics. Journal of Industrial Textiles 50:240–260. [CrossRef]
- Moazzami M, Ayatollahi MR, Akhavan-Safar A, et al (2022) Effect of cyclic aging on mode I fracture energy of dissimilar metal/composite DCB adhesive joints. Eng Fract Mech 271:108675. [CrossRef]
- Blok LG, Longana ML, Yu H, Woods BKS (2018) An investigation into 3D printing of fibre reinforced thermoplastic composites. Addit Manuf 22:176–186. [CrossRef]
- Zakaria Z, Izzah Z, Jawaid M, Hassan A (2012) EFFECT OF DEGREE OF DEACETYLATION OF CHITOSAN ON THERMAL STABILITY AND COMPATIBILITY OF CHITOSAN-POLYAMIDE BLEND. Bioresources 7:. [CrossRef]
- REV 5.0 - 08/01/2021 (2021) Markforged composites mechanical properties. 2024. Available online: http://static.markforged.com/downloads/composites-data-sheet.pdf (accessed on 8 November 2024).
- National Institute of Advanced Industrial Science and Technology (AIST) J (2004) Spectral Database for Organic Compounds, SDBS. In: https://sdbs.db.aist.go.jp/SearchInformation.
- Smith BC (2023) Infrared Spectroscopy of Polymers, XI: Introduction to Organic Nitrogen Polymers. Spectroscopy 14–18. [CrossRef]
- Díaz-Rodríguez JG, Pertuz-Comas AD, Bohórquez-Becerra OR (2023) Impact Strength for 3D-Printed PA6 Polymer Composites under Temperature Changes. Journal of Manufacturing and Materials Processing 7:178. [CrossRef]
- Guo R, Li C, Niu Y, Xian G (2022) The fatigue performances of carbon fiber reinforced polymer composites – A review. Journal of Materials Research and Technology 21:4773–4789. [CrossRef]
- Liu K, Li Y, Tao L, Xiao R (2018) Preparation and characterization of polyamide 6 fibre based on a phosphorus-containing flame retardant. RSC Adv 8:9261–9271. [CrossRef]
Figure 1.
Electromagnetic spectrum.
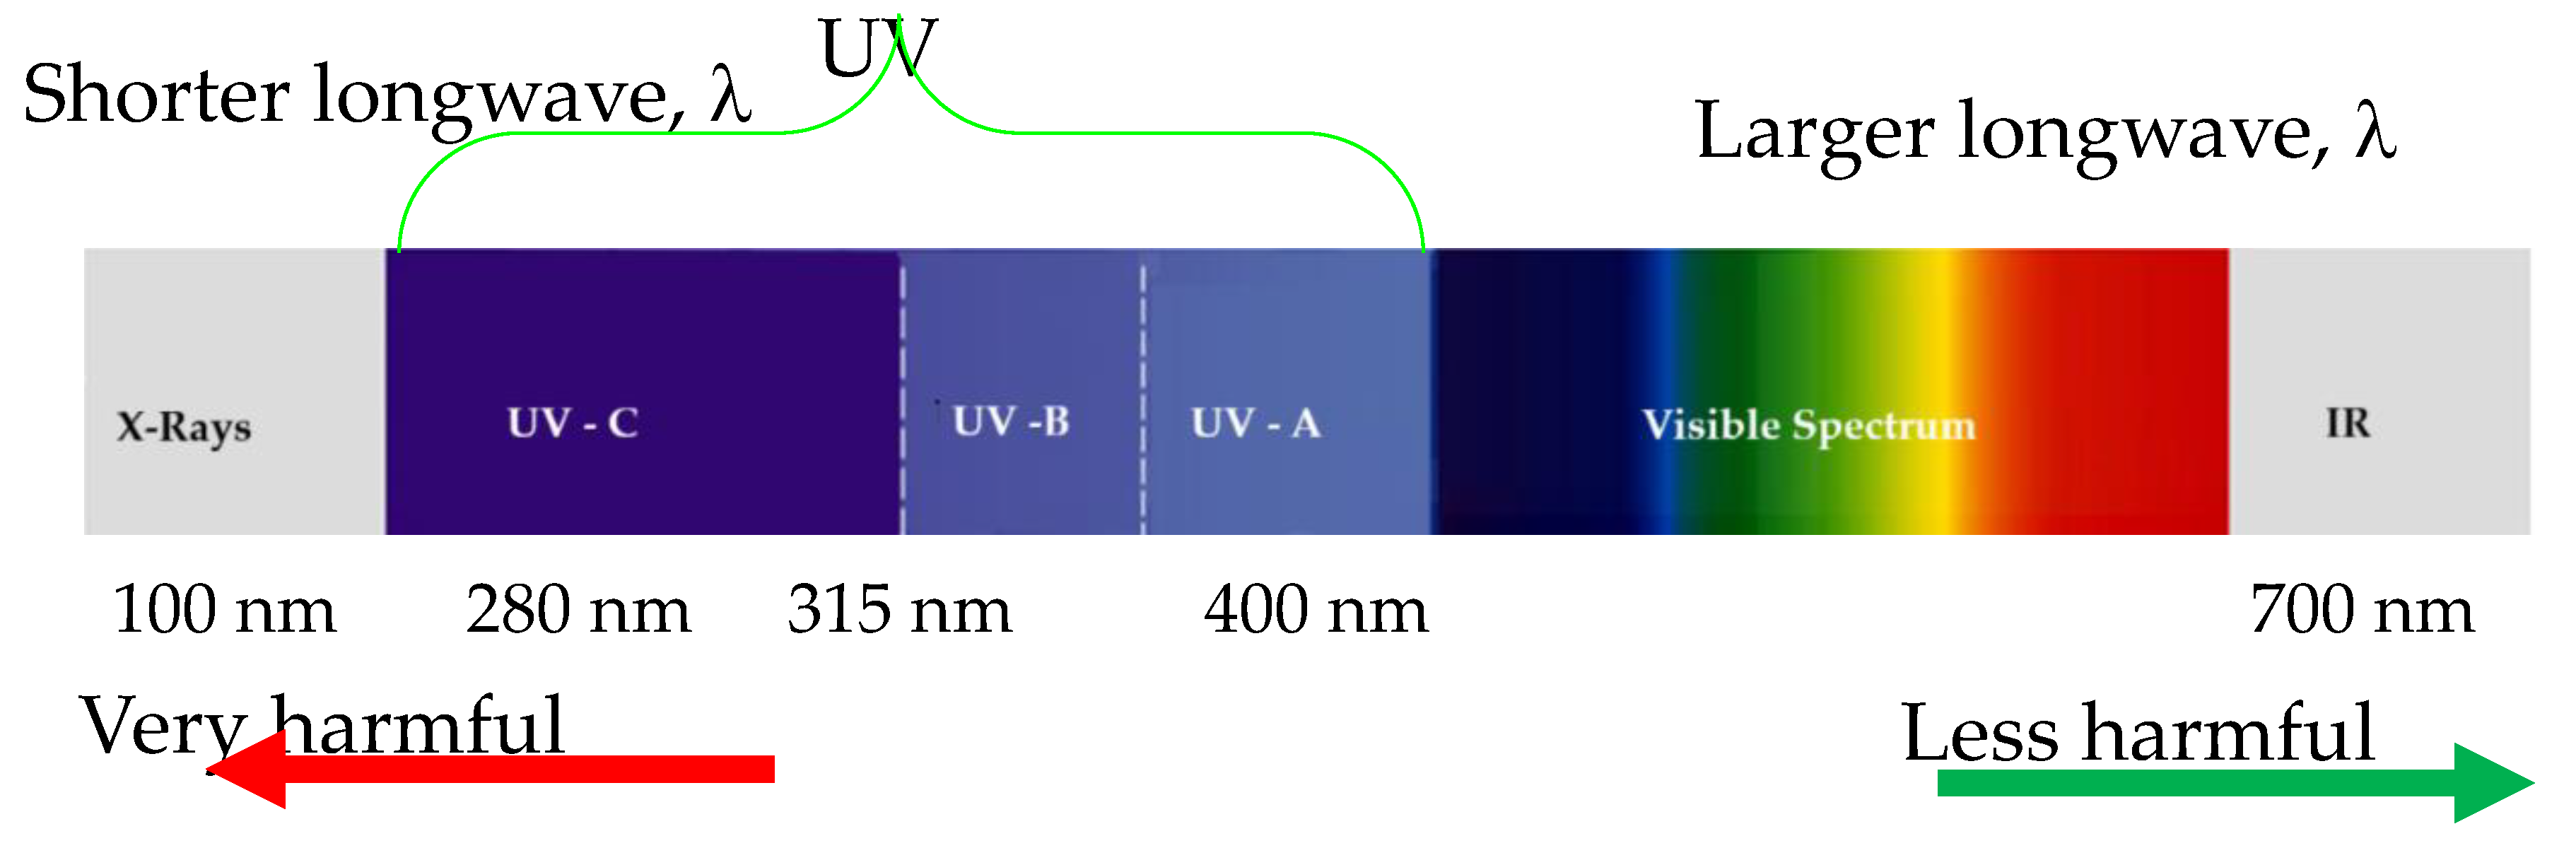
Figure 2.
Testing samples a) tensile, b) impact. Dimensions in mm.
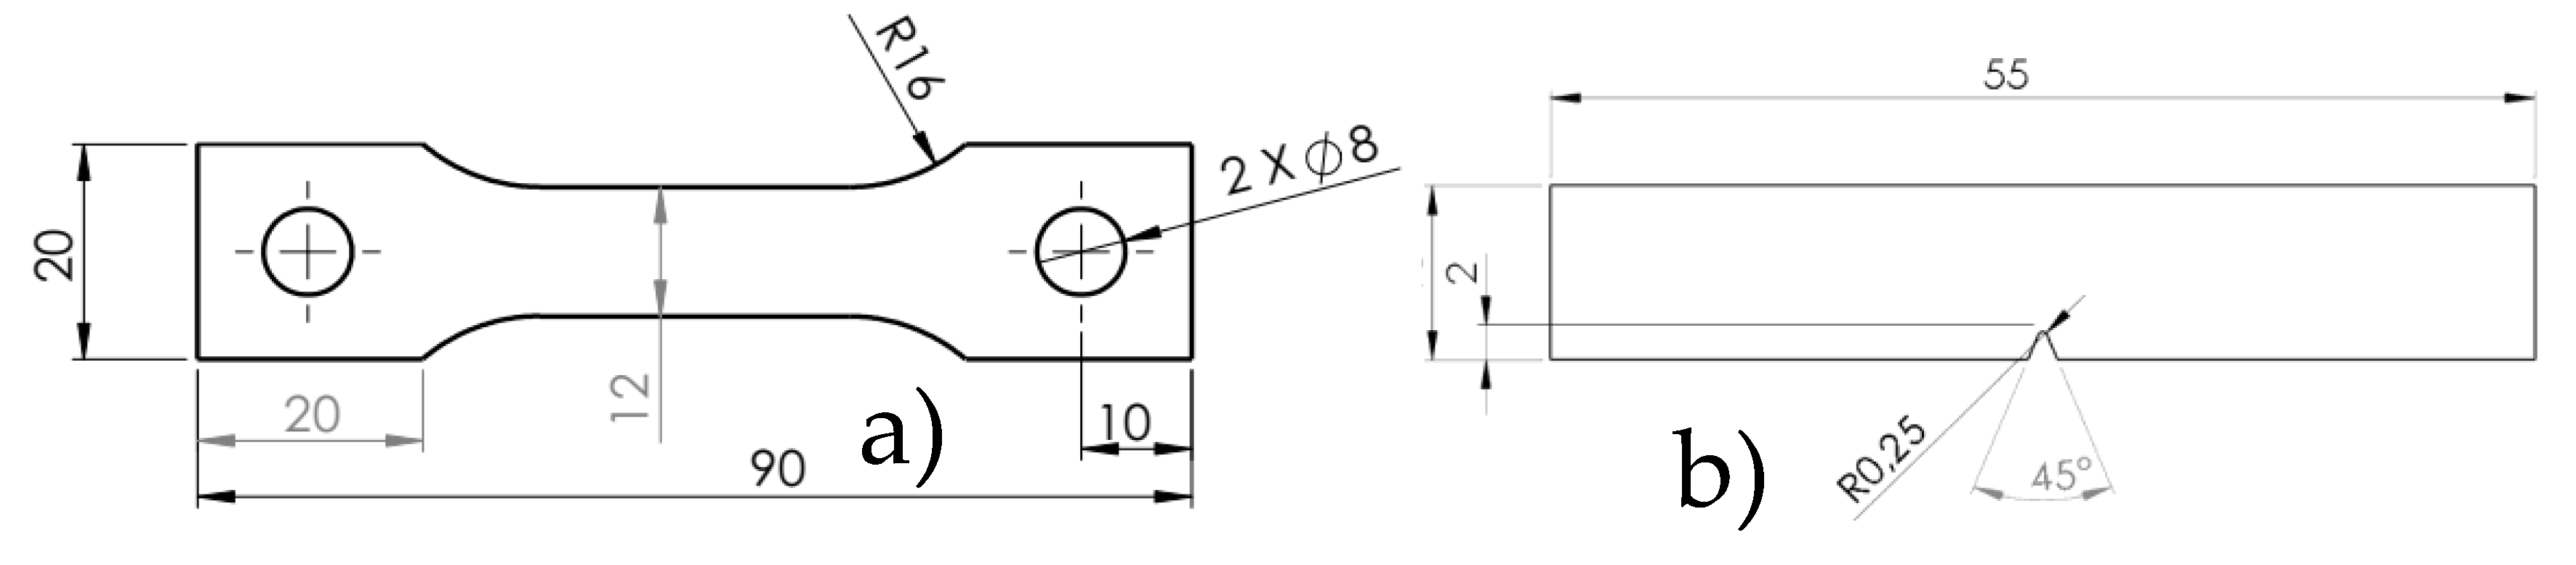
Figure 3.
FTIR pattern for nylon, [23].
Figure 3.
FTIR pattern for nylon, [23].
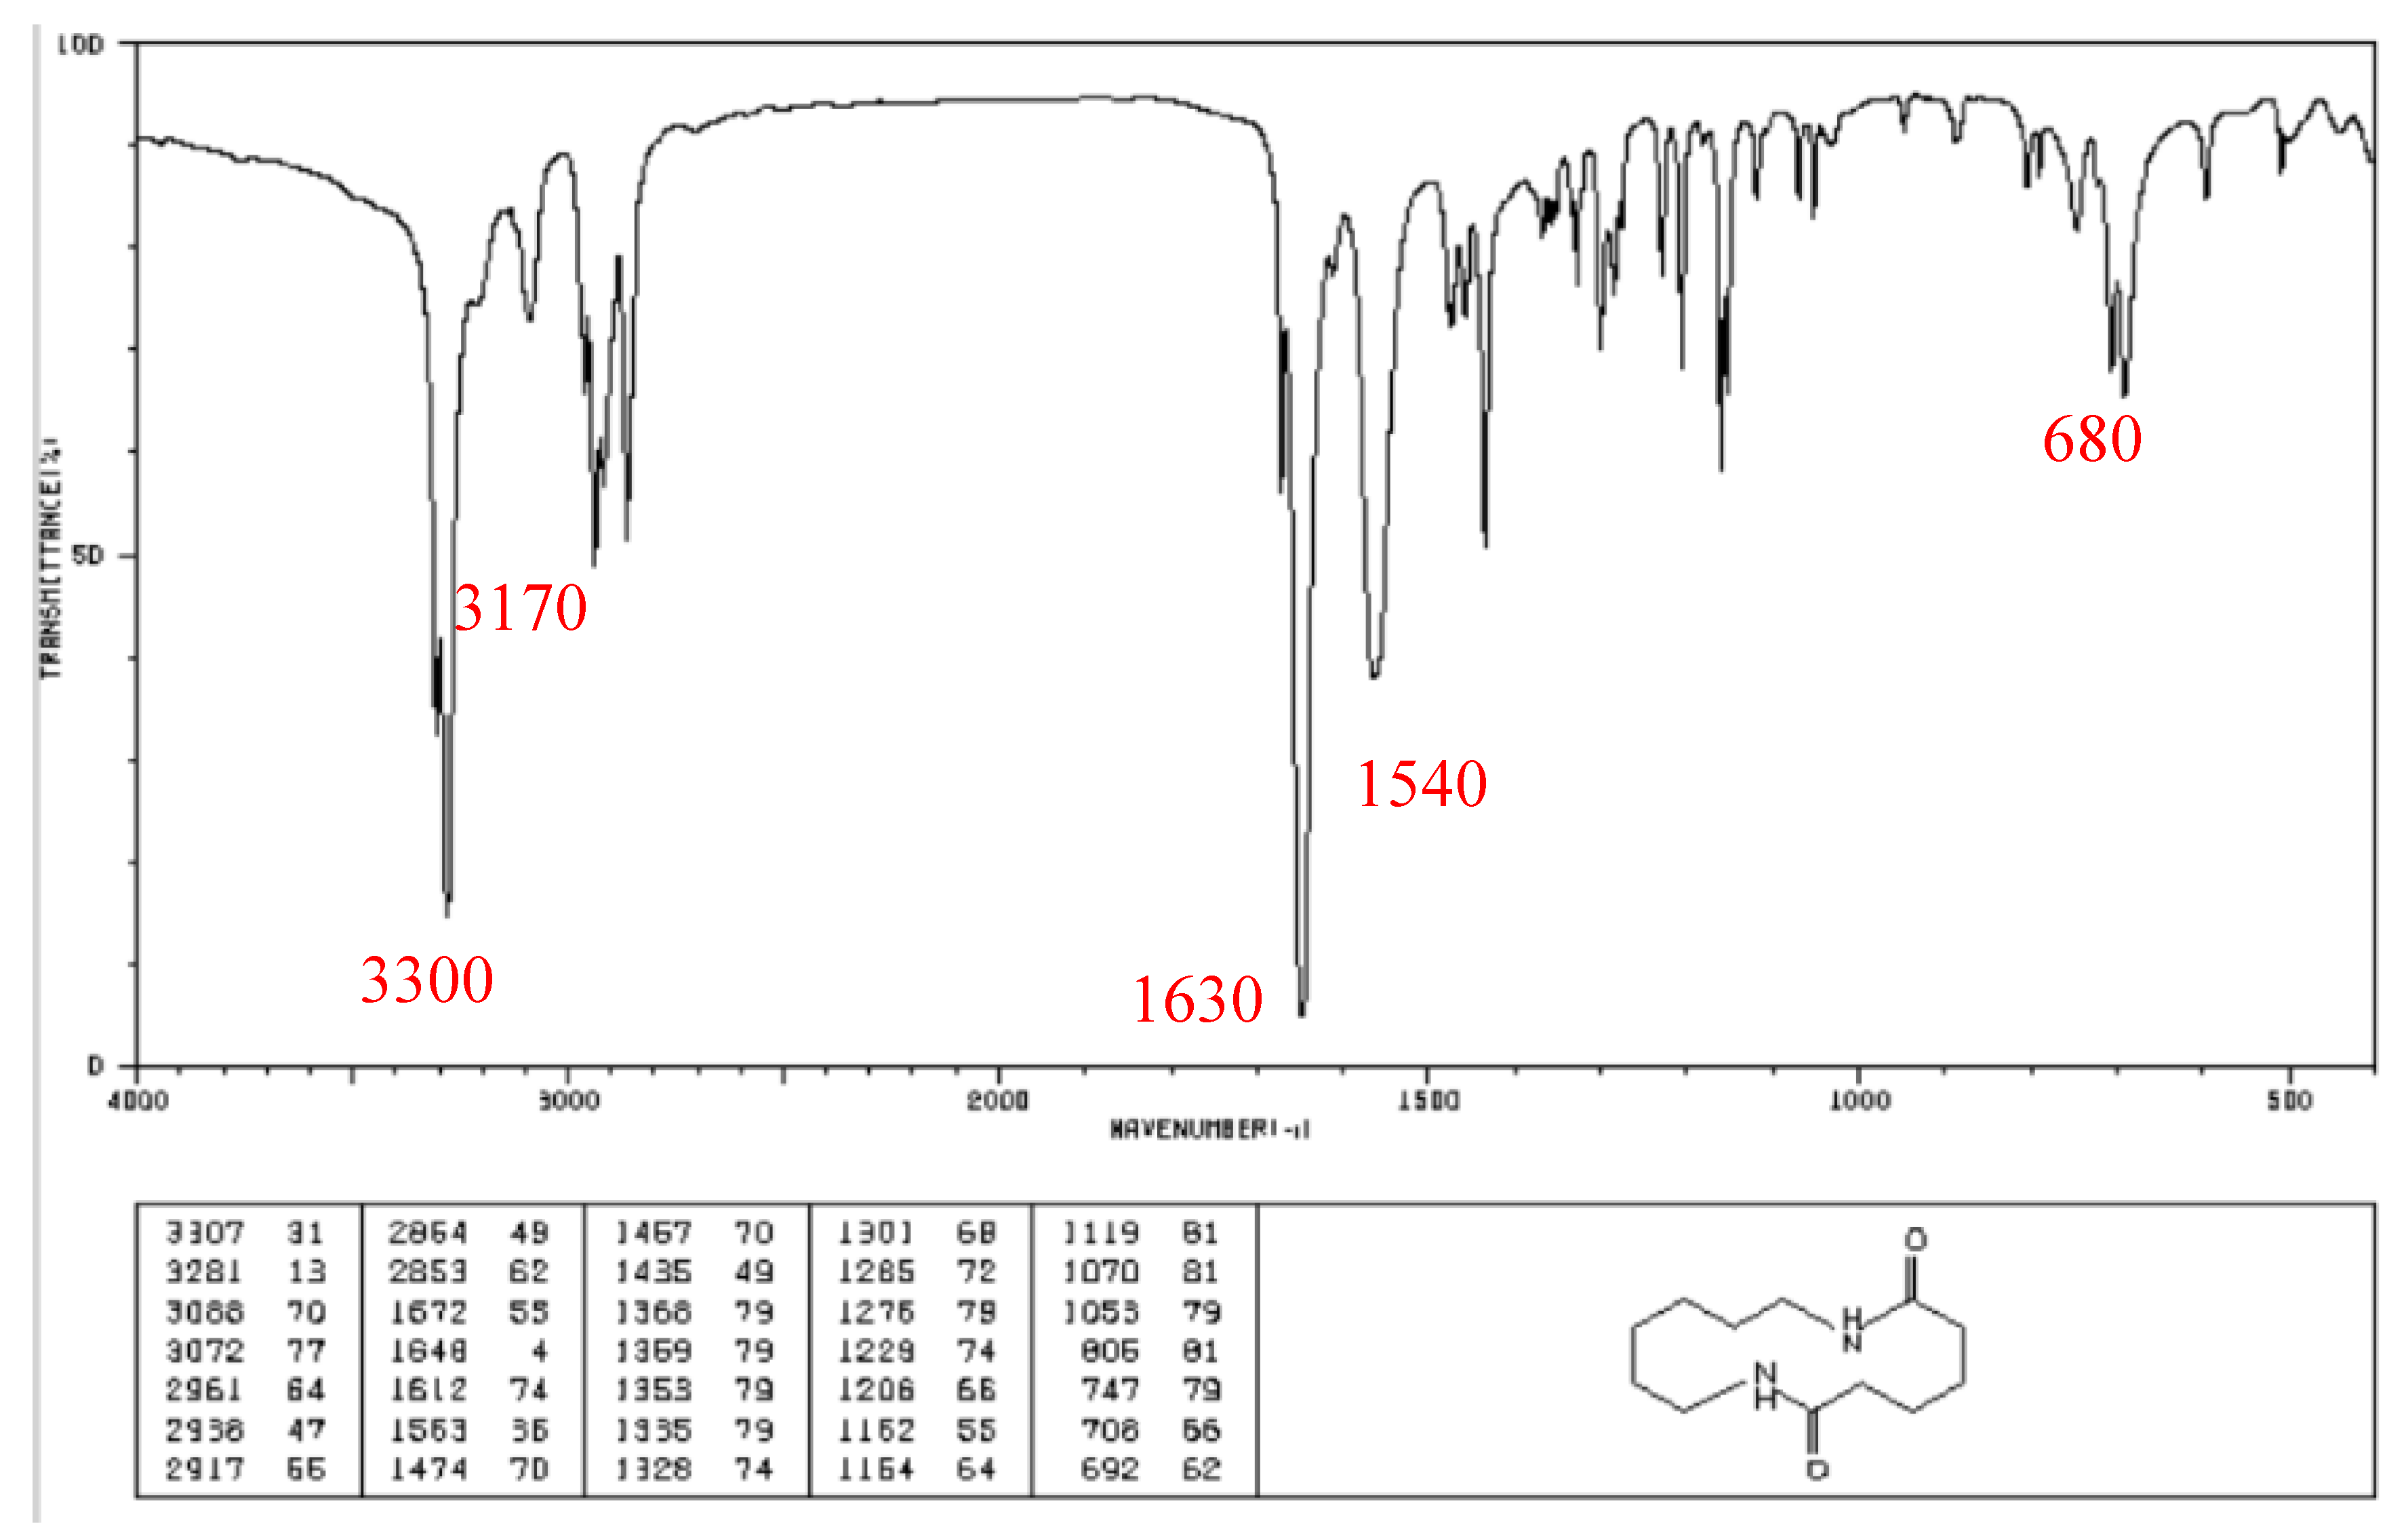
Figure 4.
Moisture absorption over time.
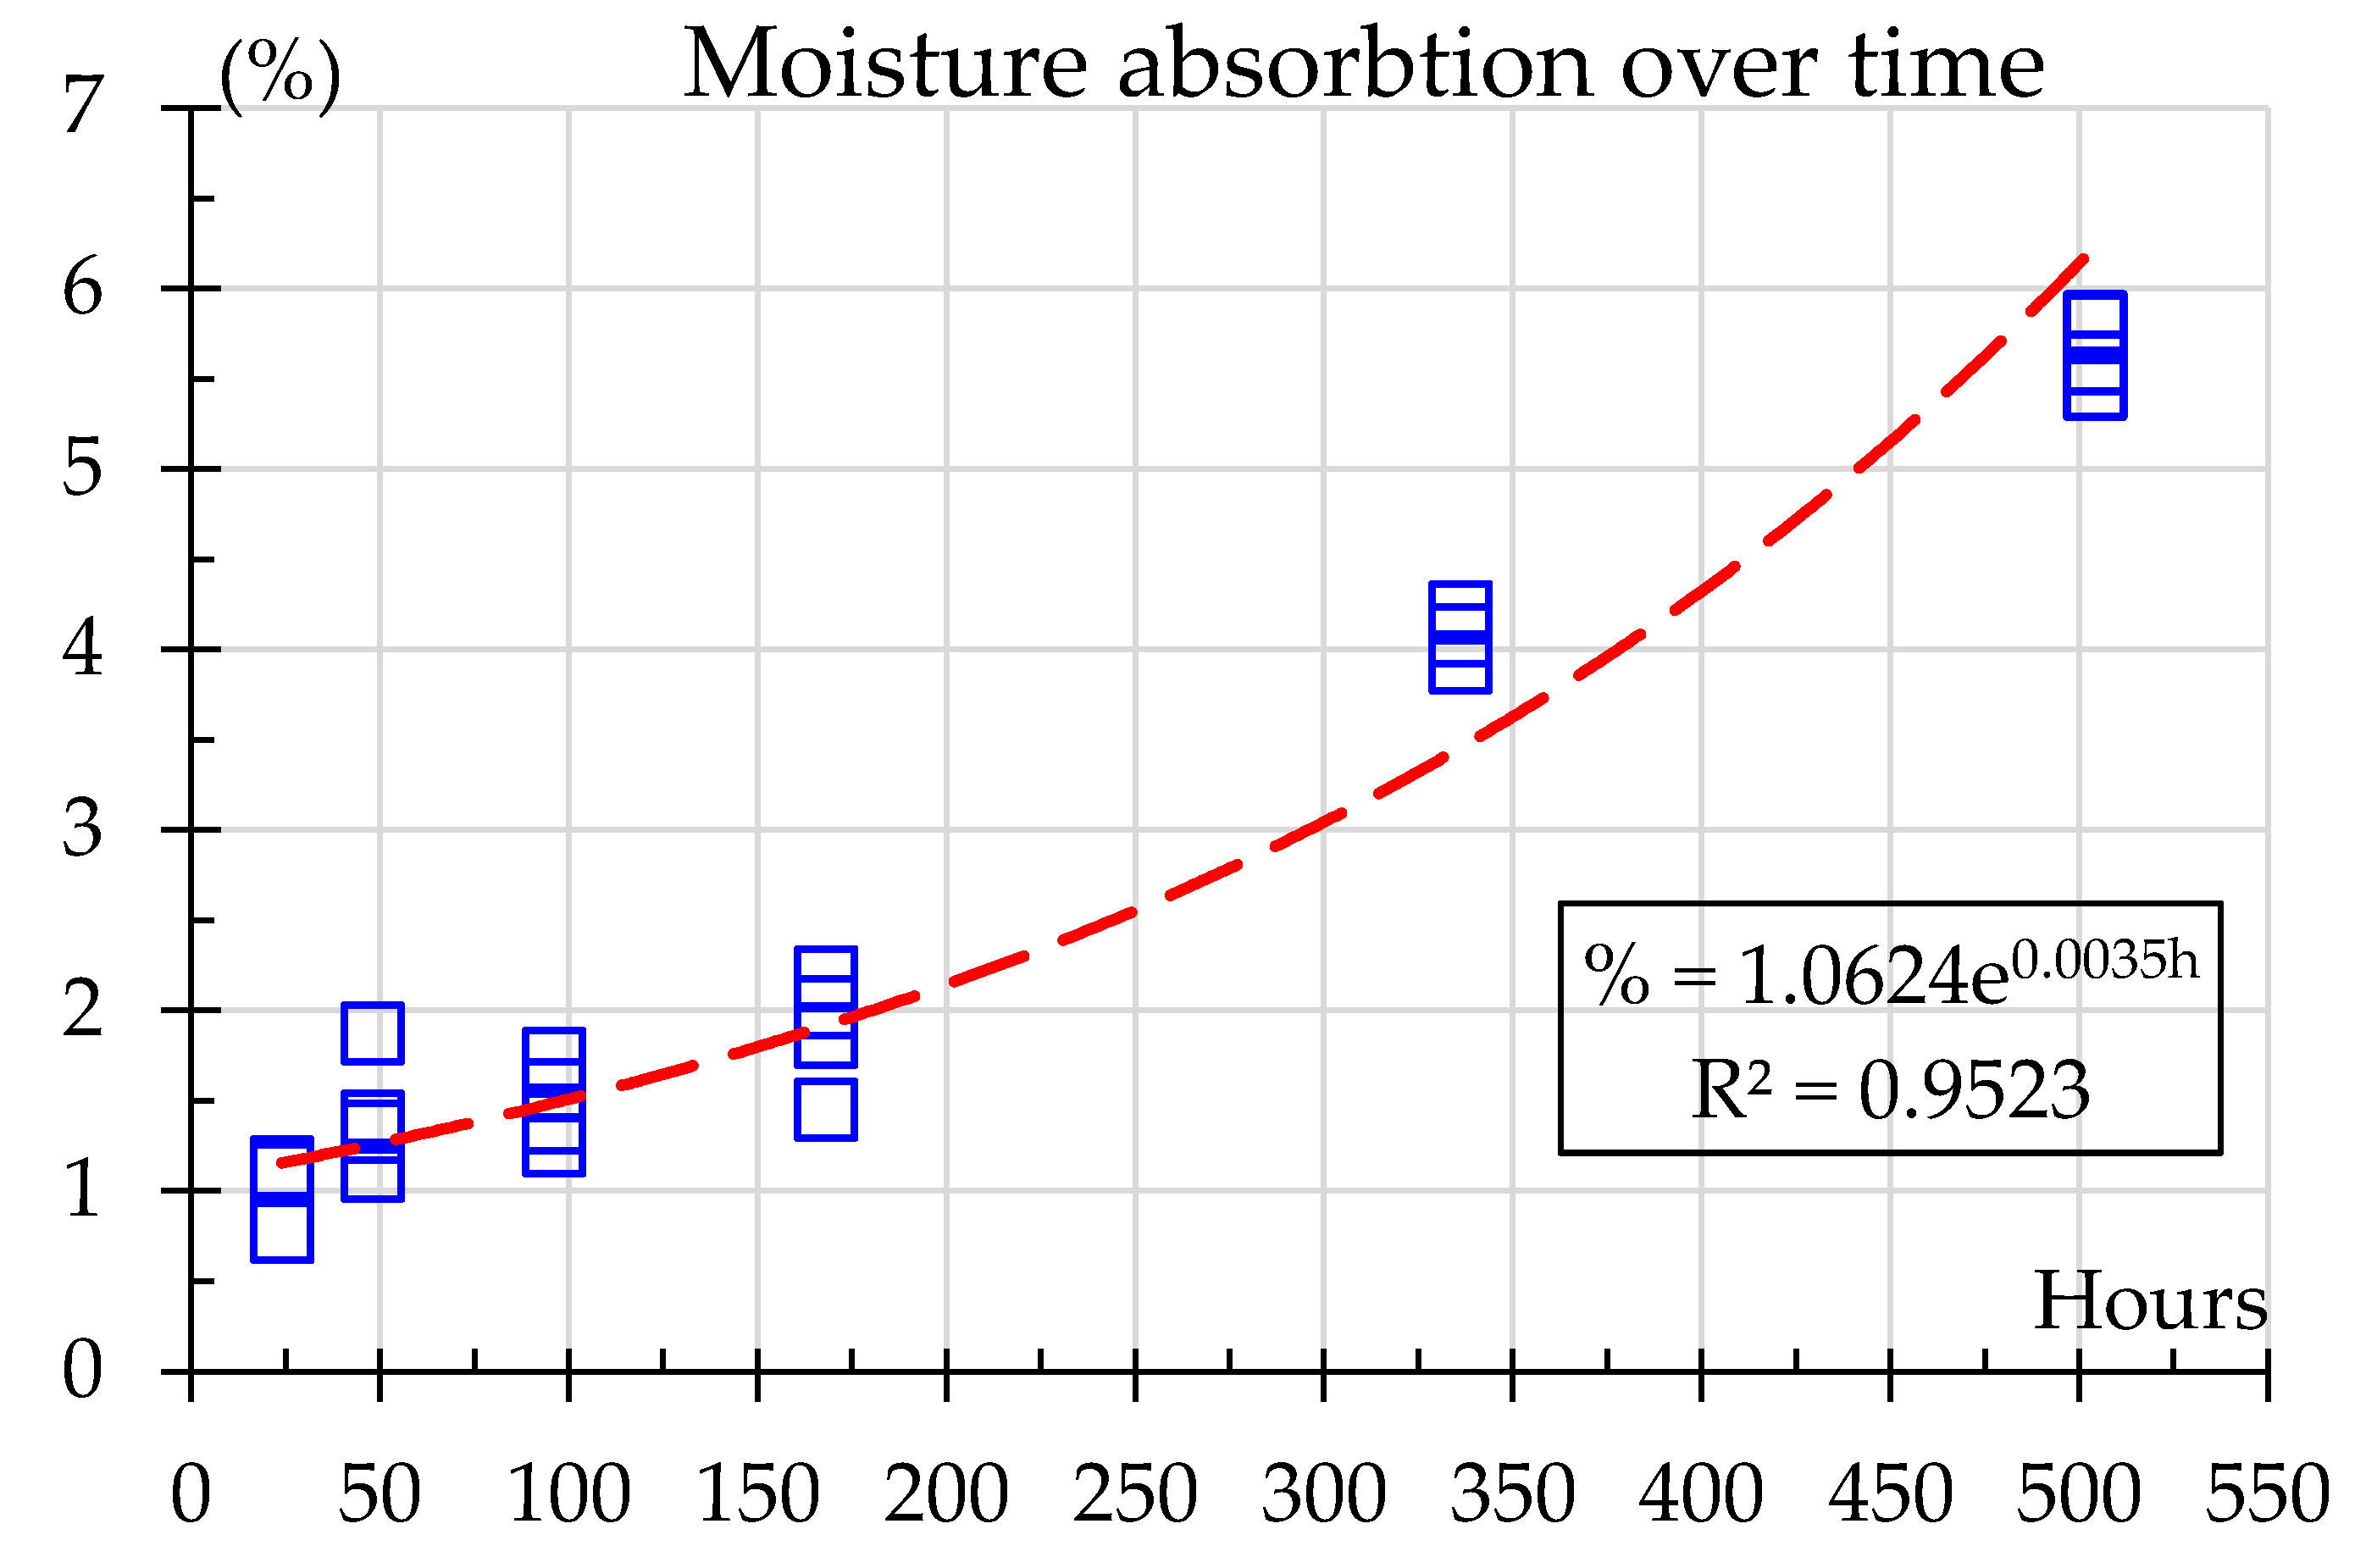
Figure 5.
Morphology of samples after impact testing; a) control, b) %, c) UV.
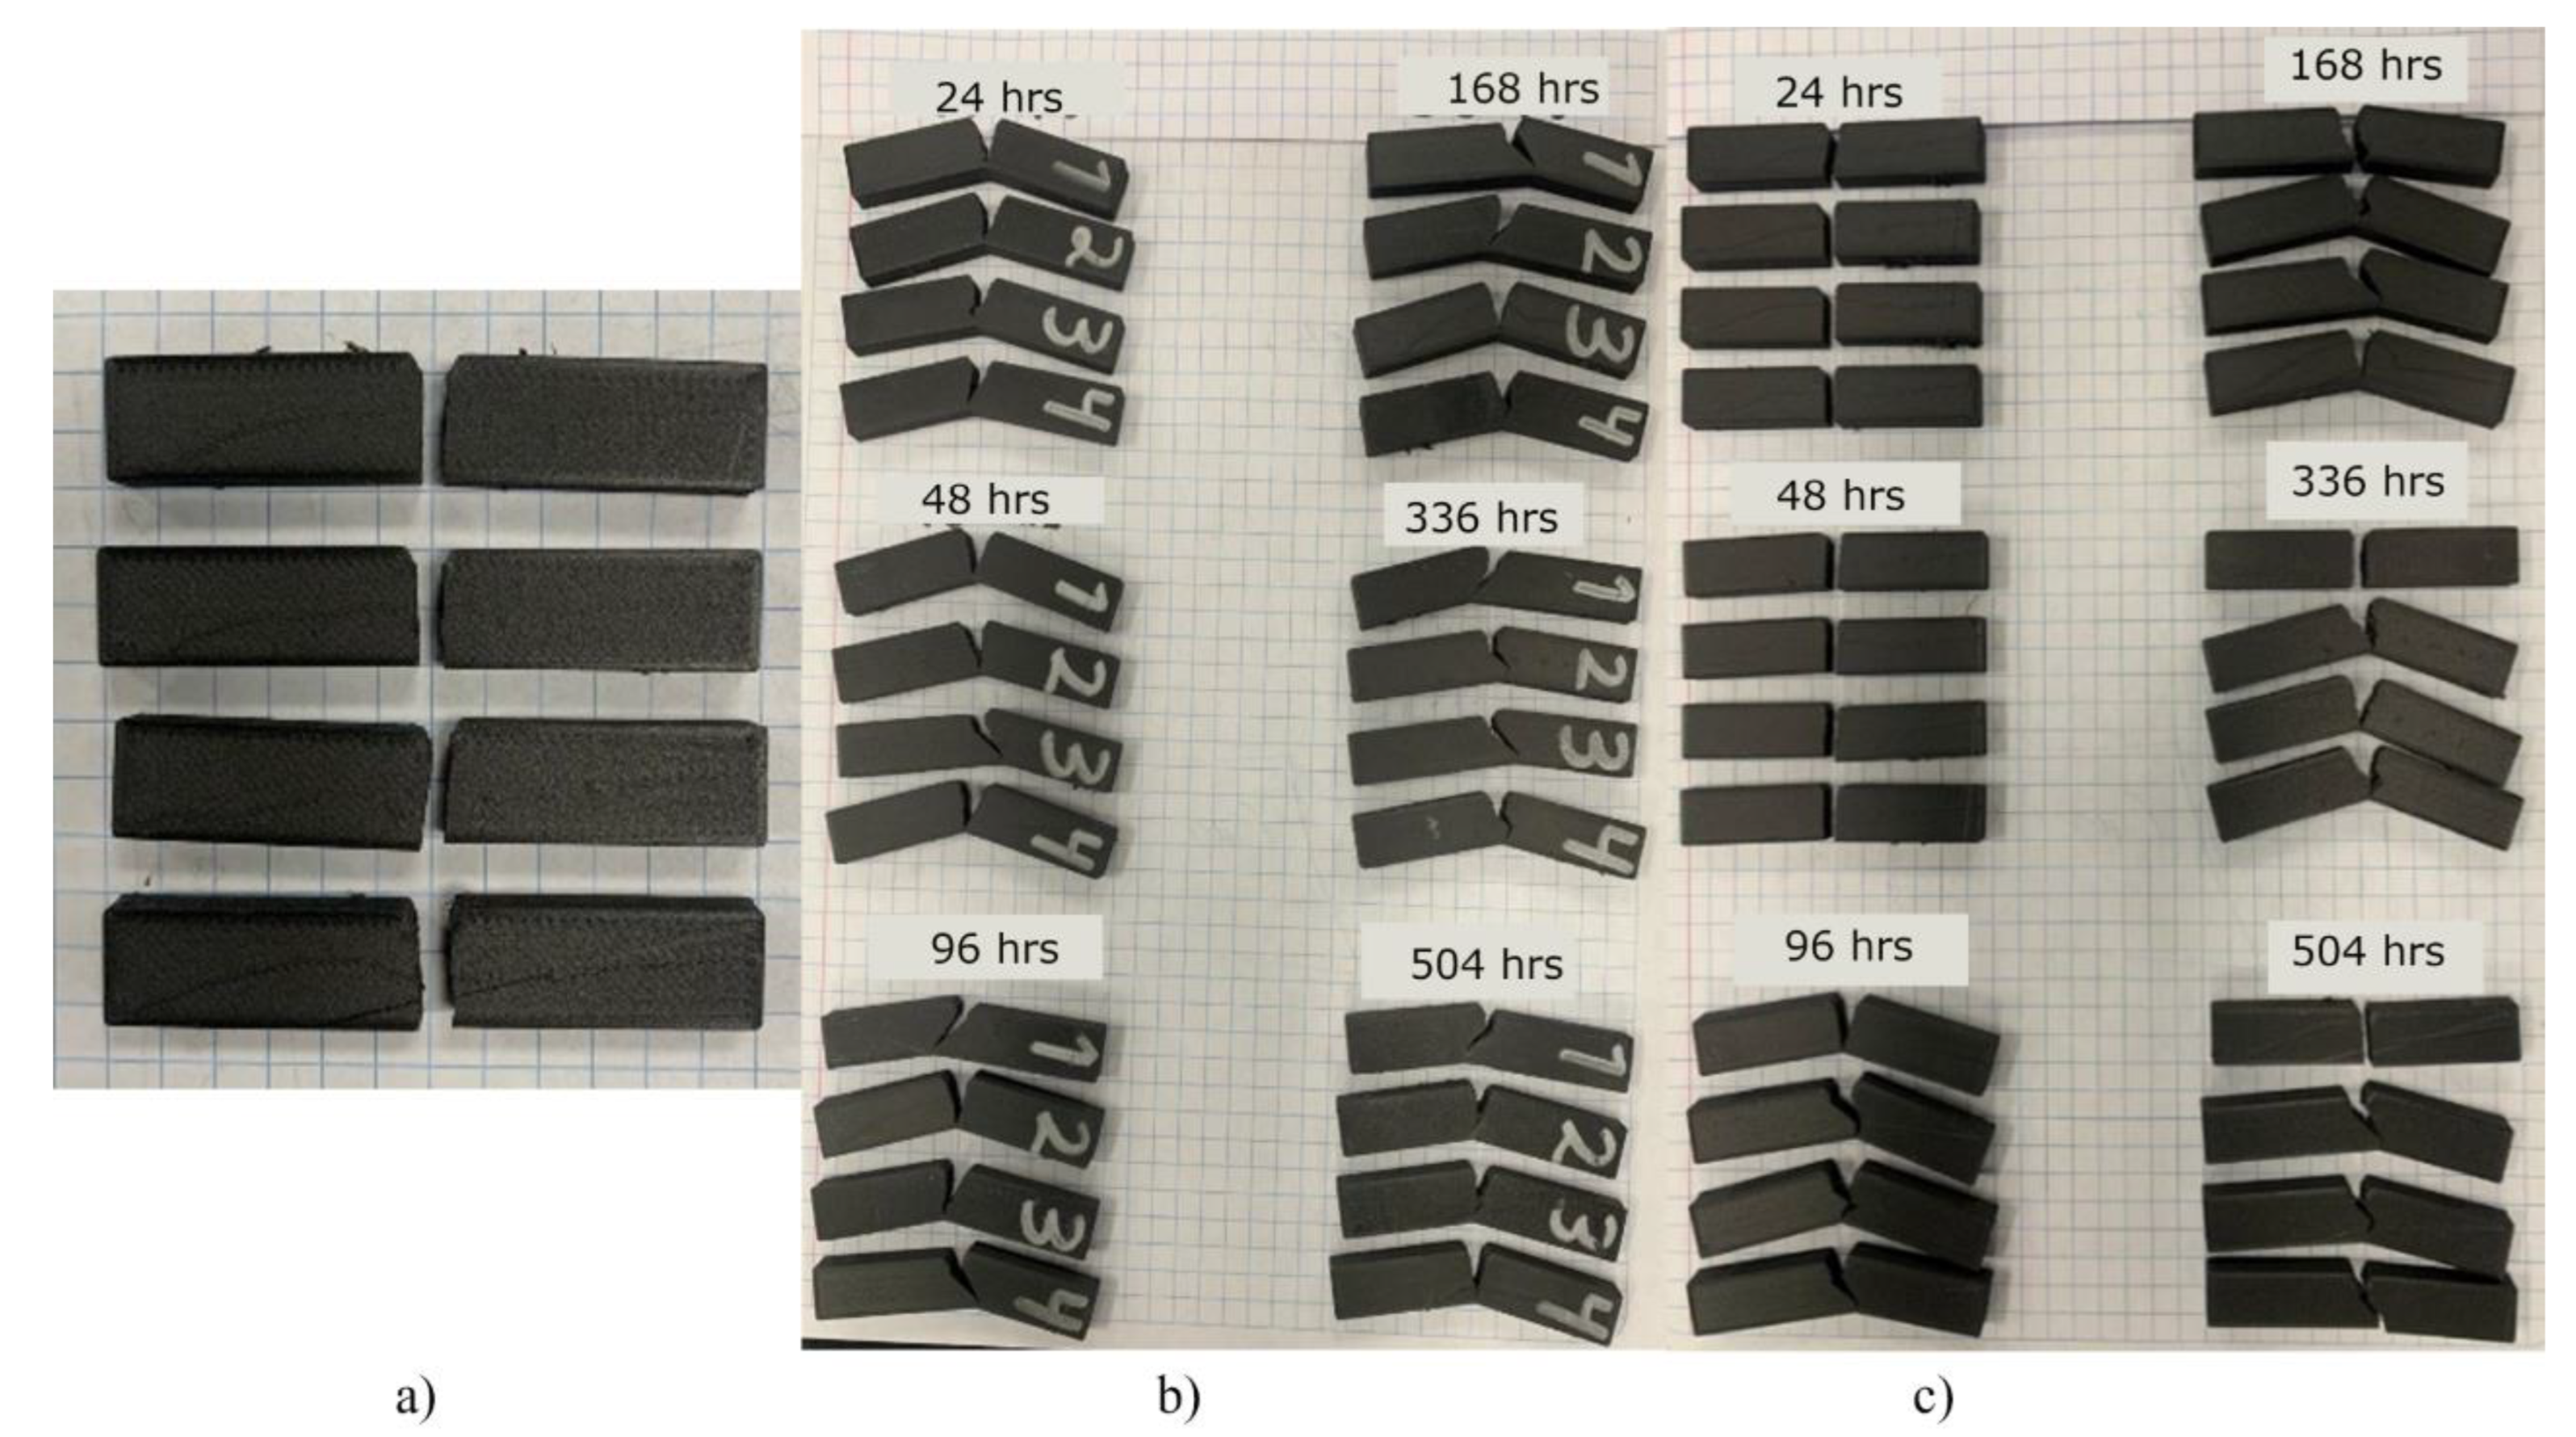
Figure 6.
Charpy impact results.
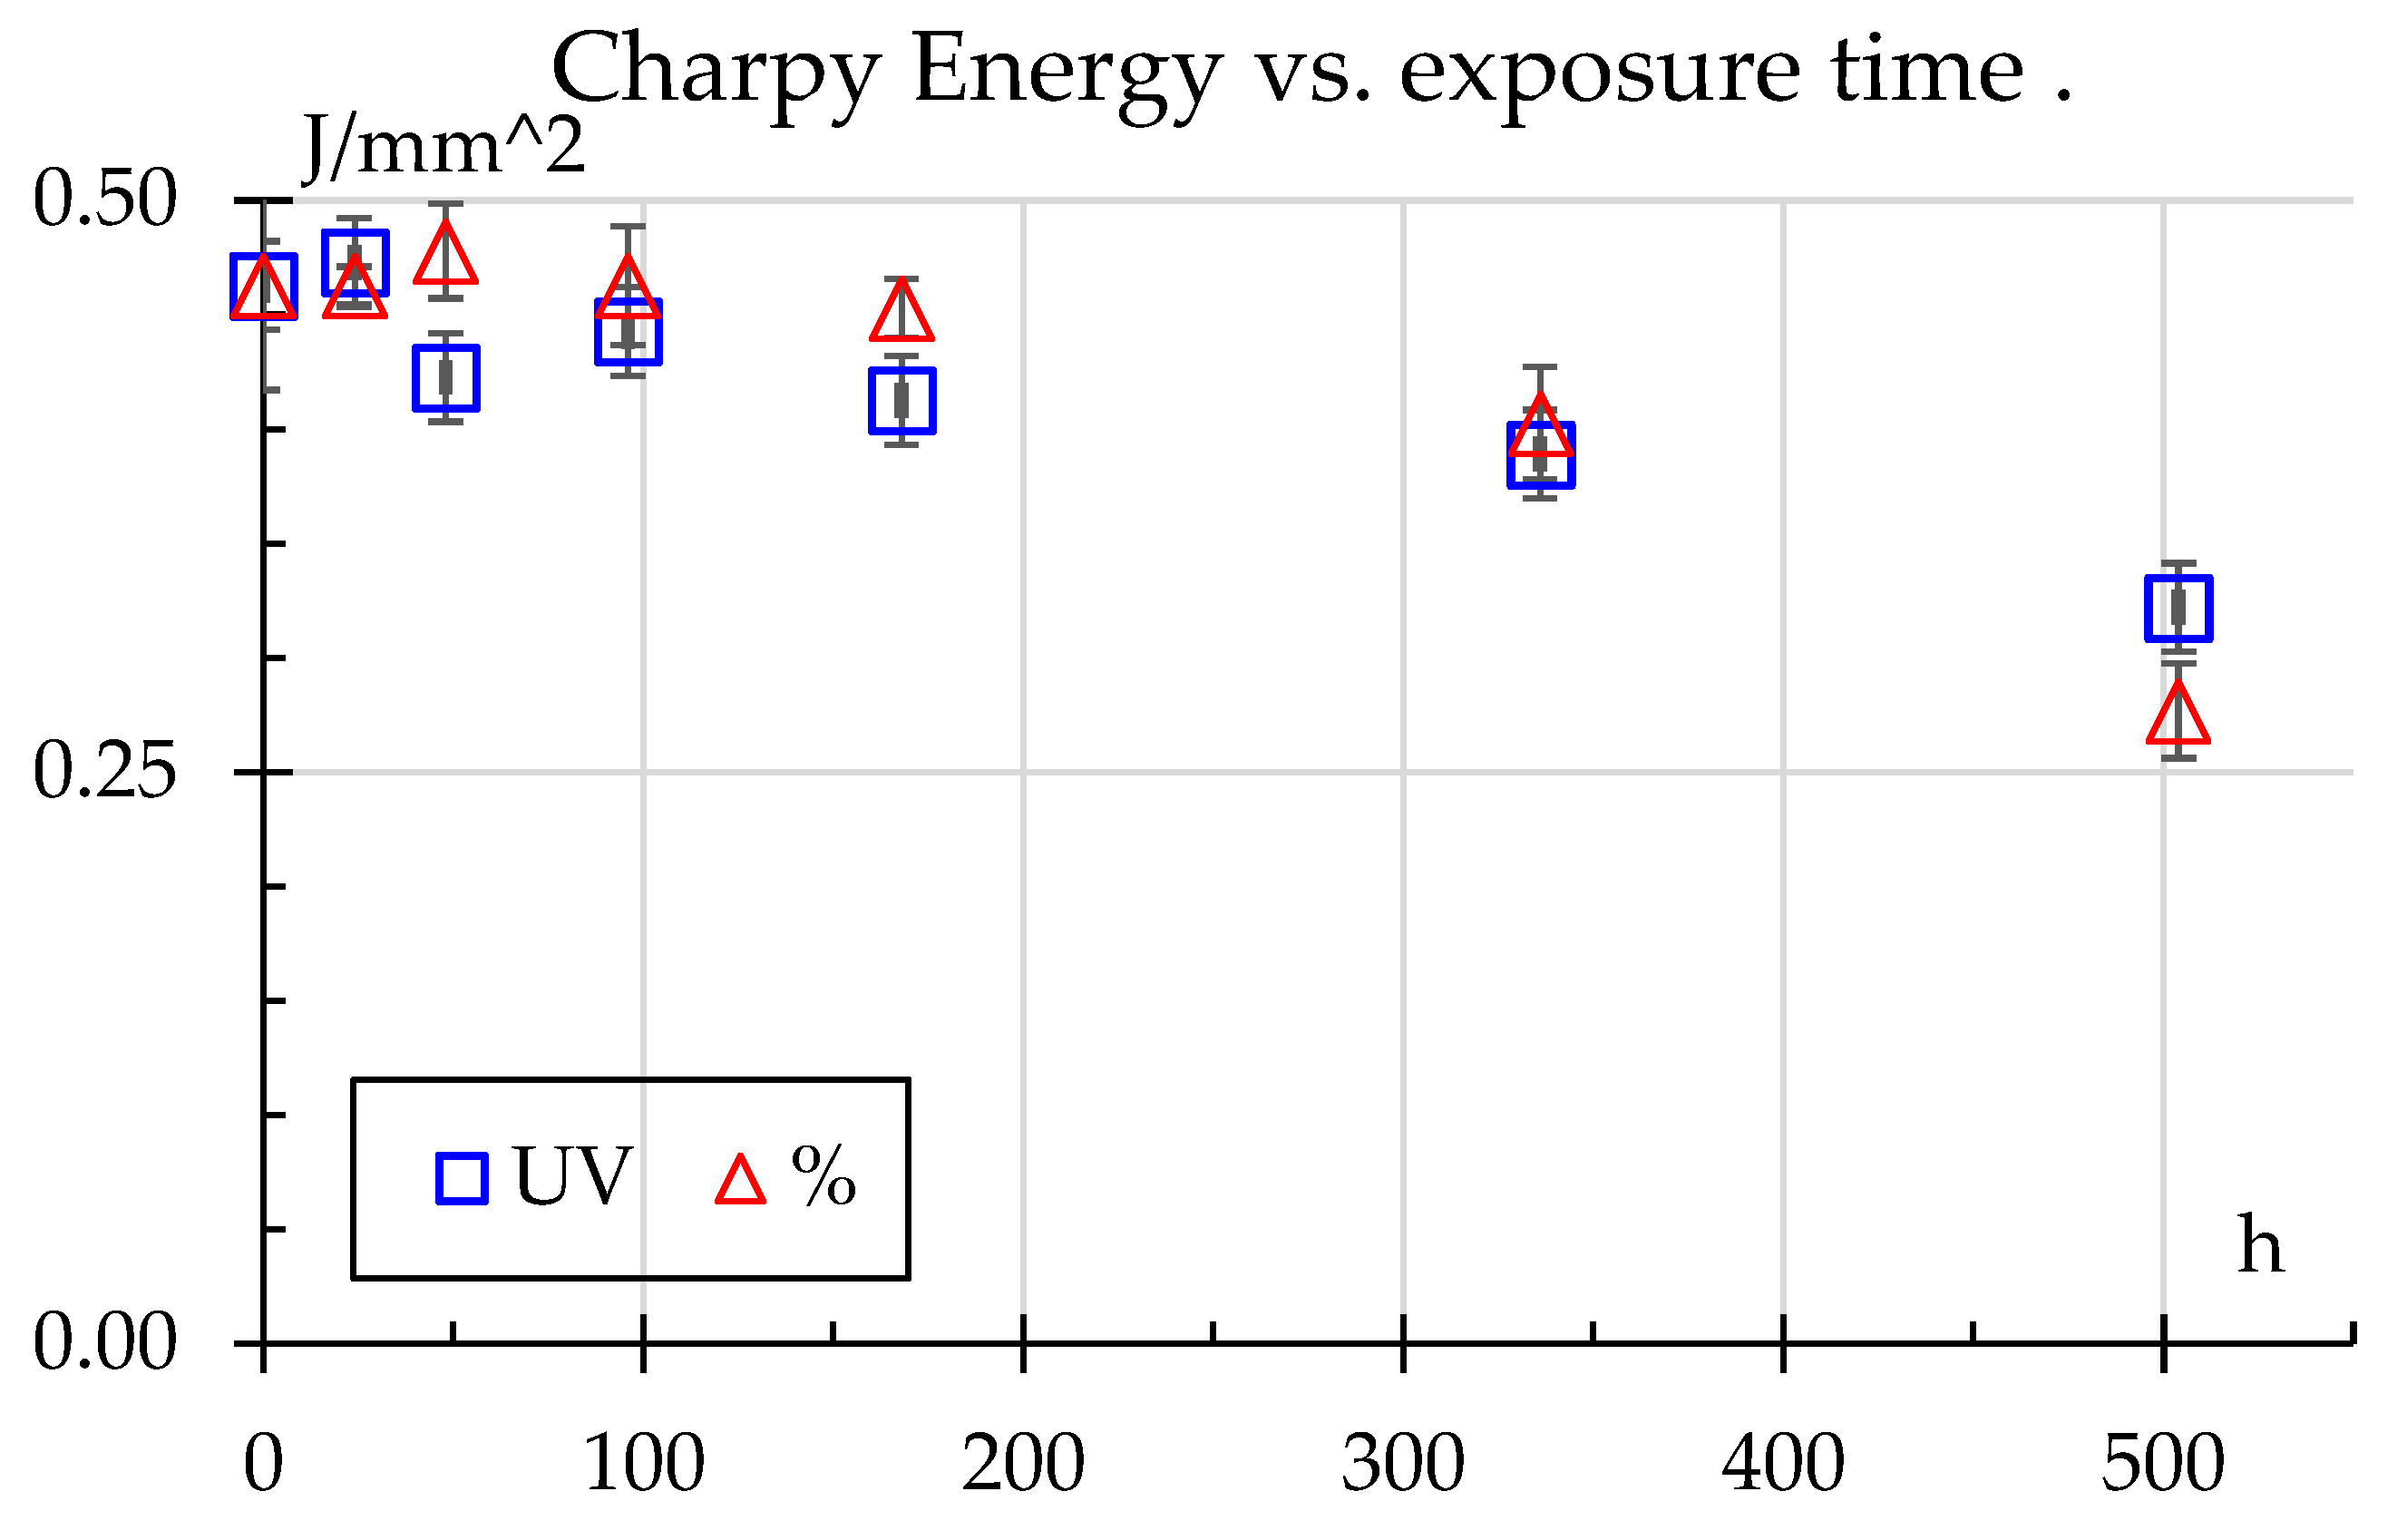
Figure 7.
Shore D hardness results: a) hardness vs exposure time. b) exemplary result of imprint with no exposure, c) exemplary result of imprint after 504 h of UV exposure, d) exemplary result of imprint after 504 h of % exposure.
Figure 7.
Shore D hardness results: a) hardness vs exposure time. b) exemplary result of imprint with no exposure, c) exemplary result of imprint after 504 h of UV exposure, d) exemplary result of imprint after 504 h of % exposure.
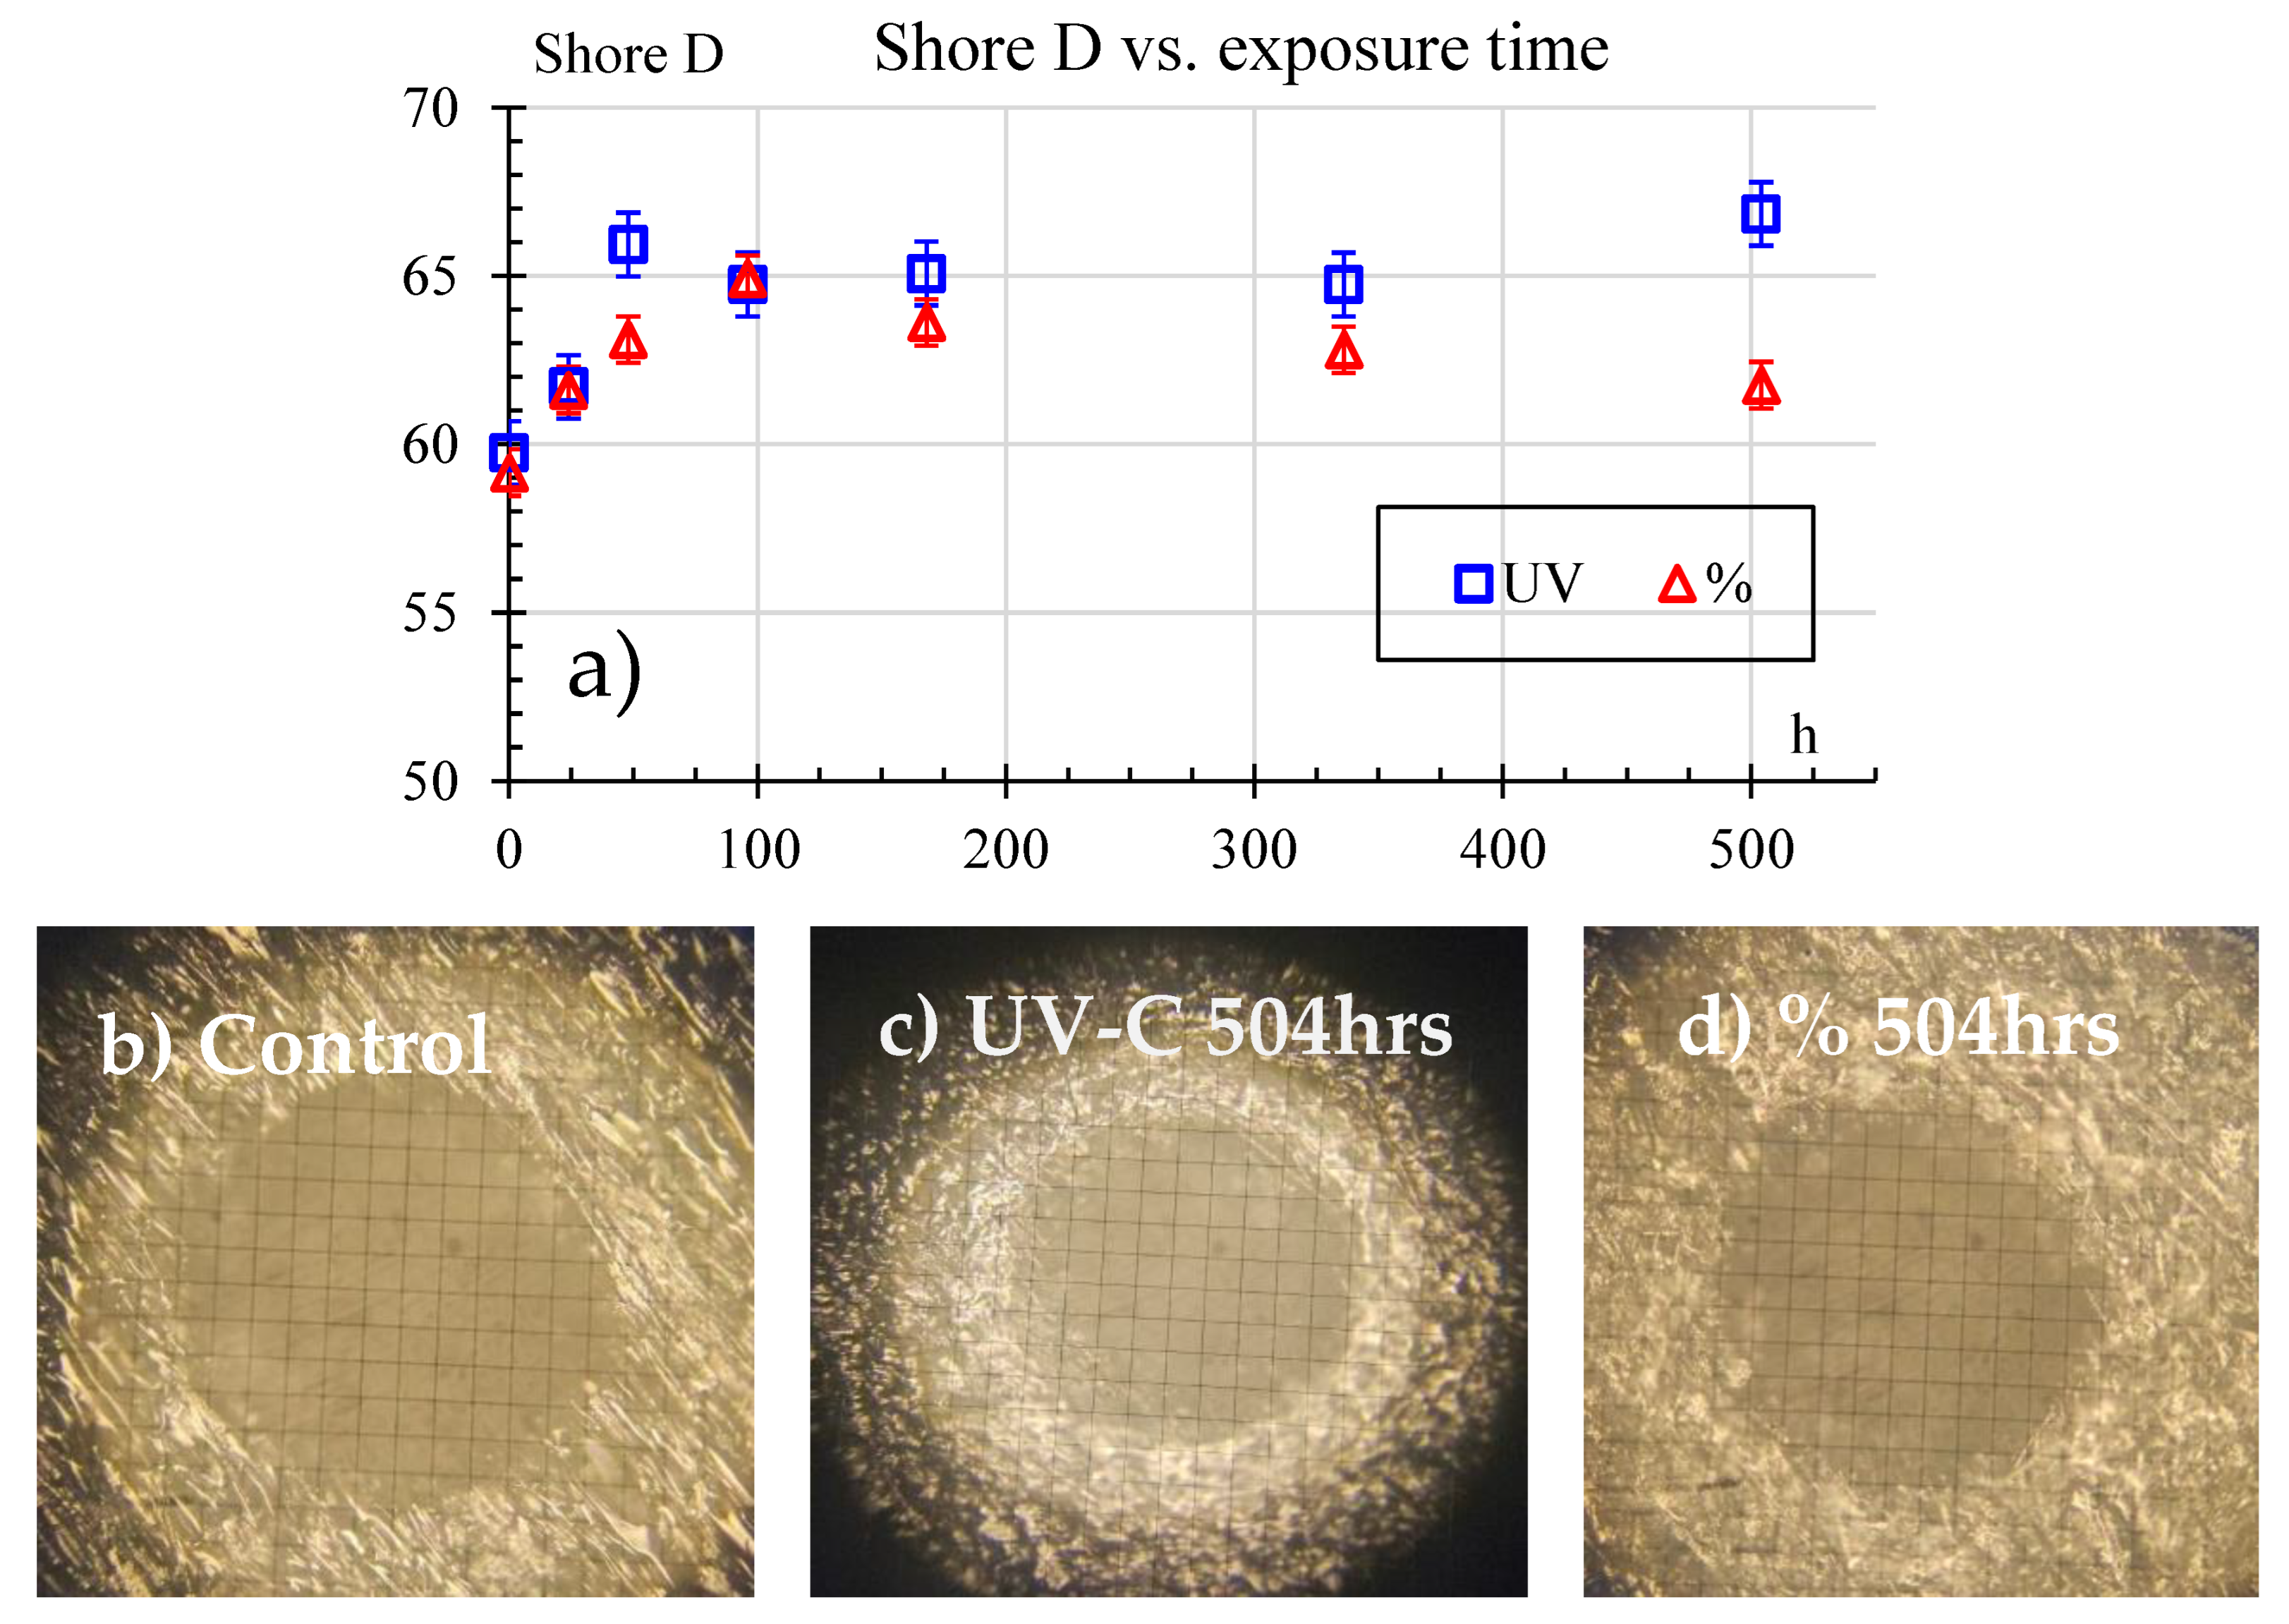
Figure 8.
Young moduli change over exposure time.
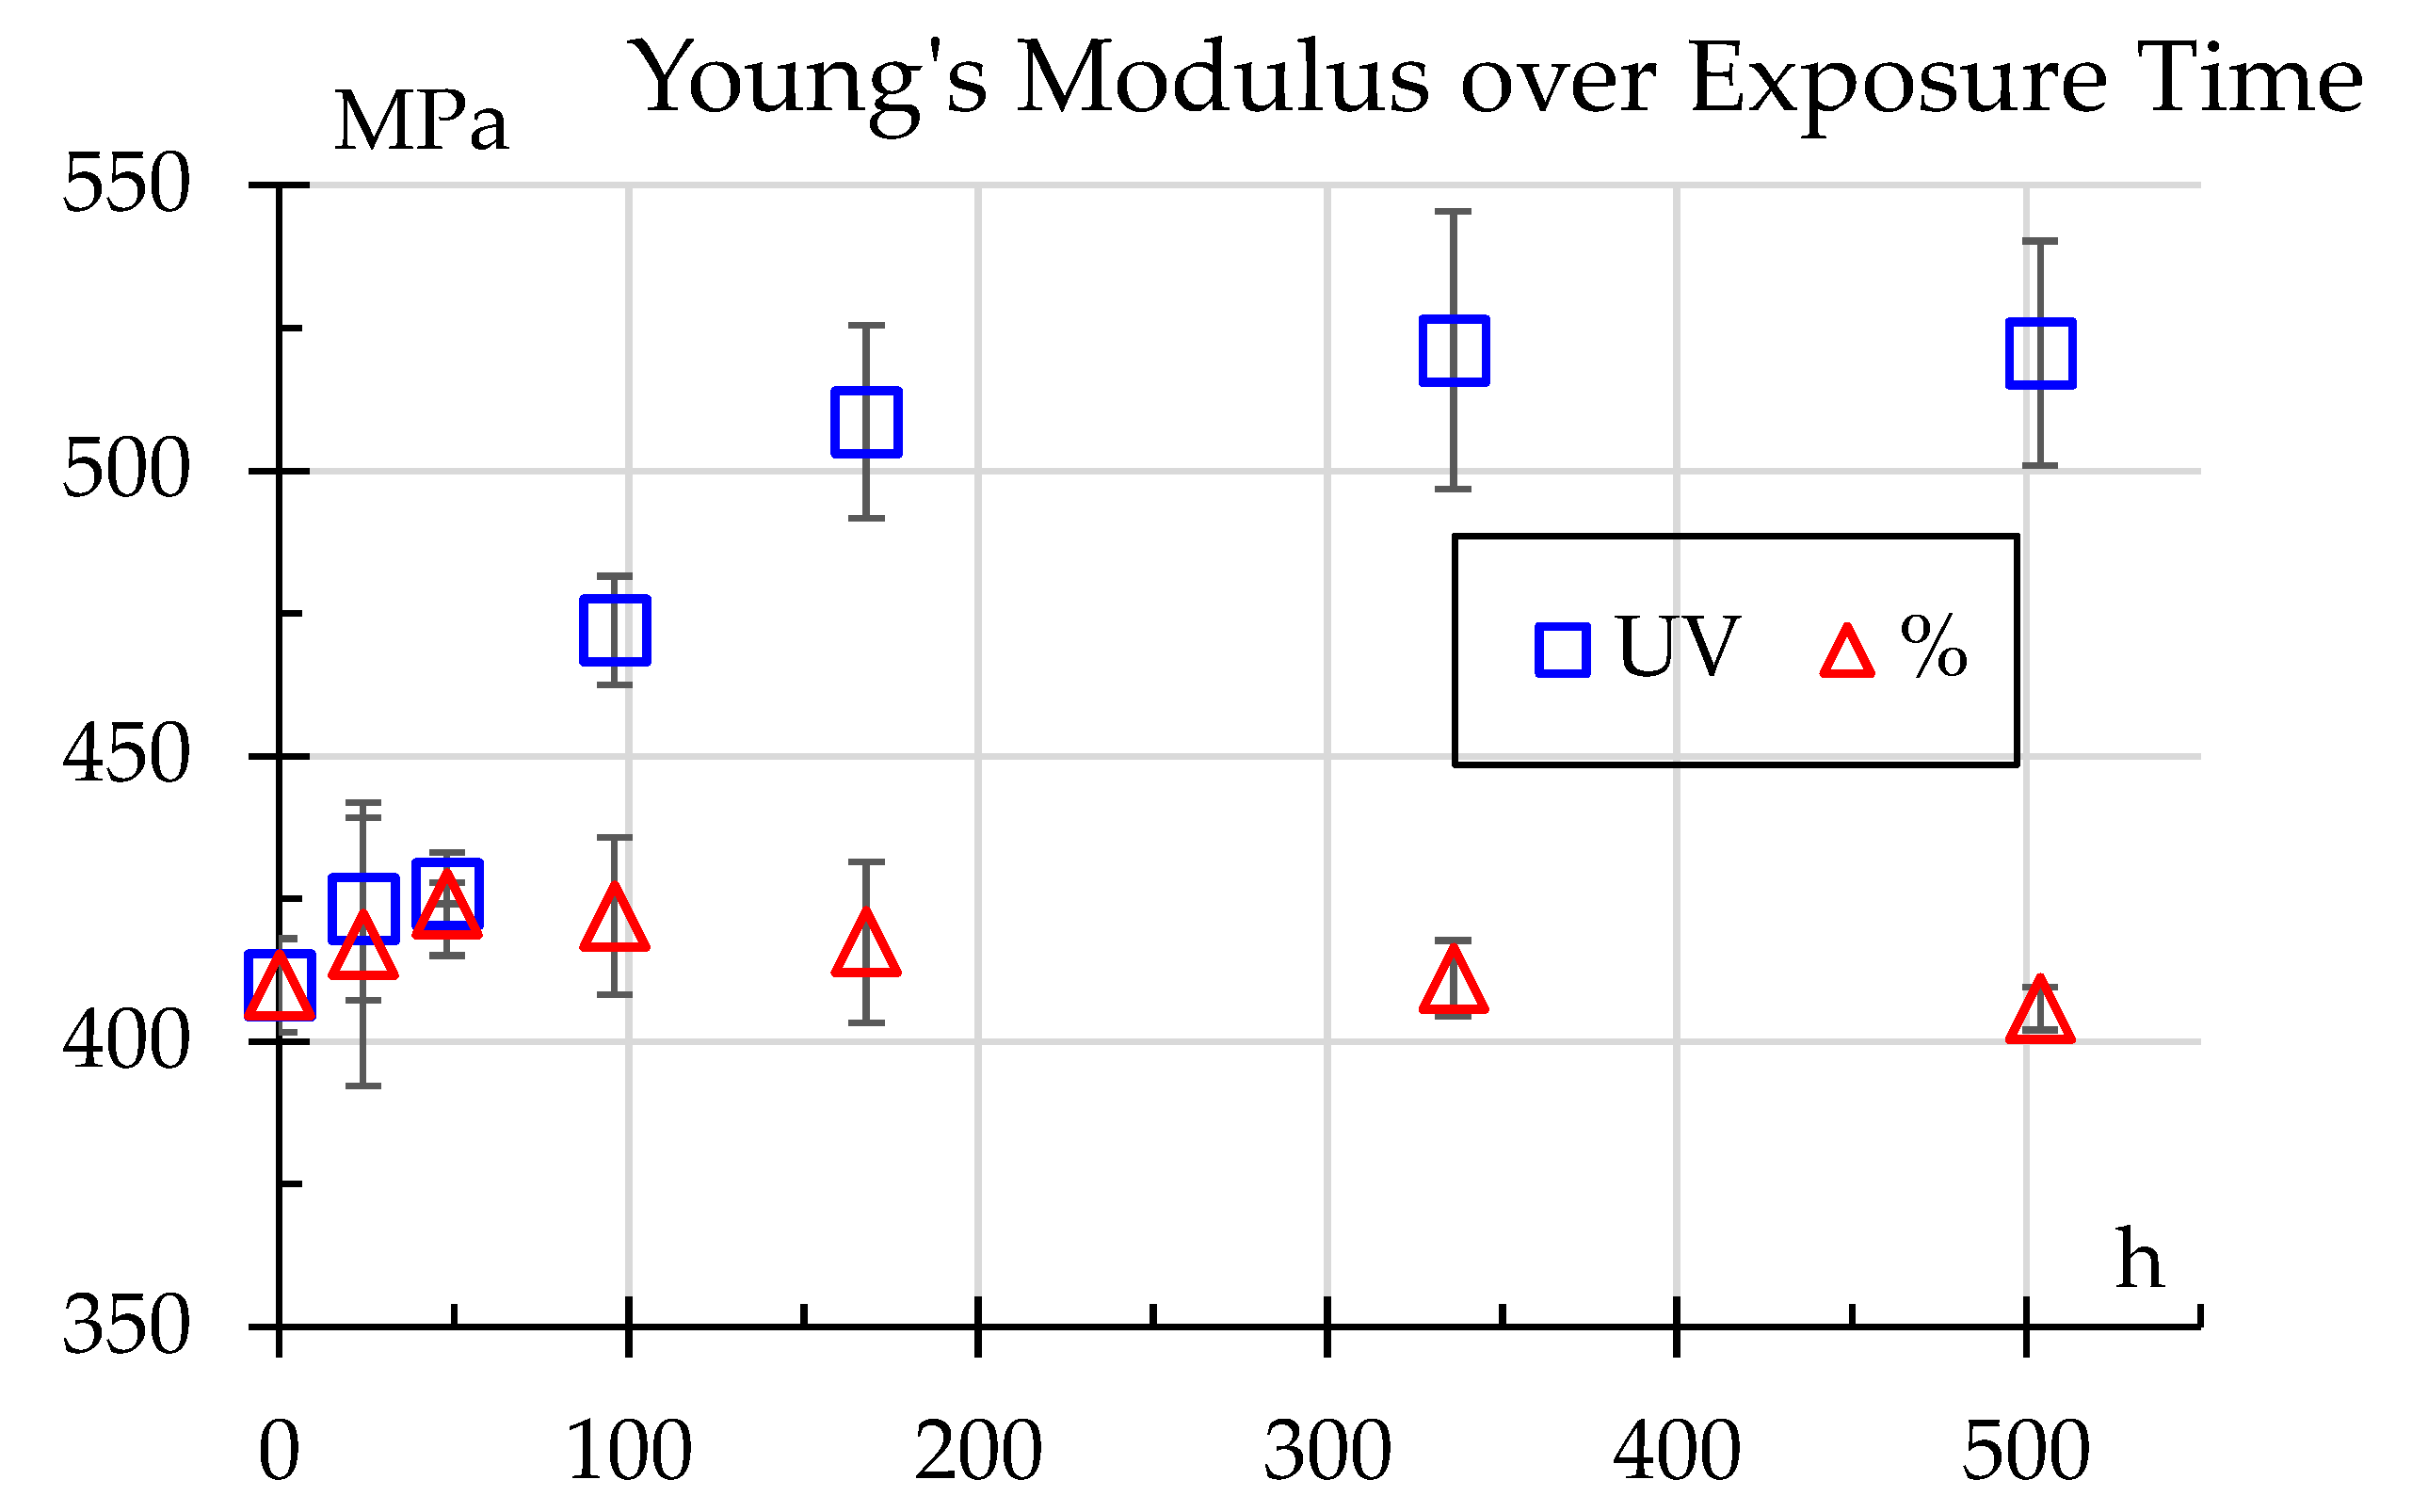
Figure 9.
Strength variation over exposure time.
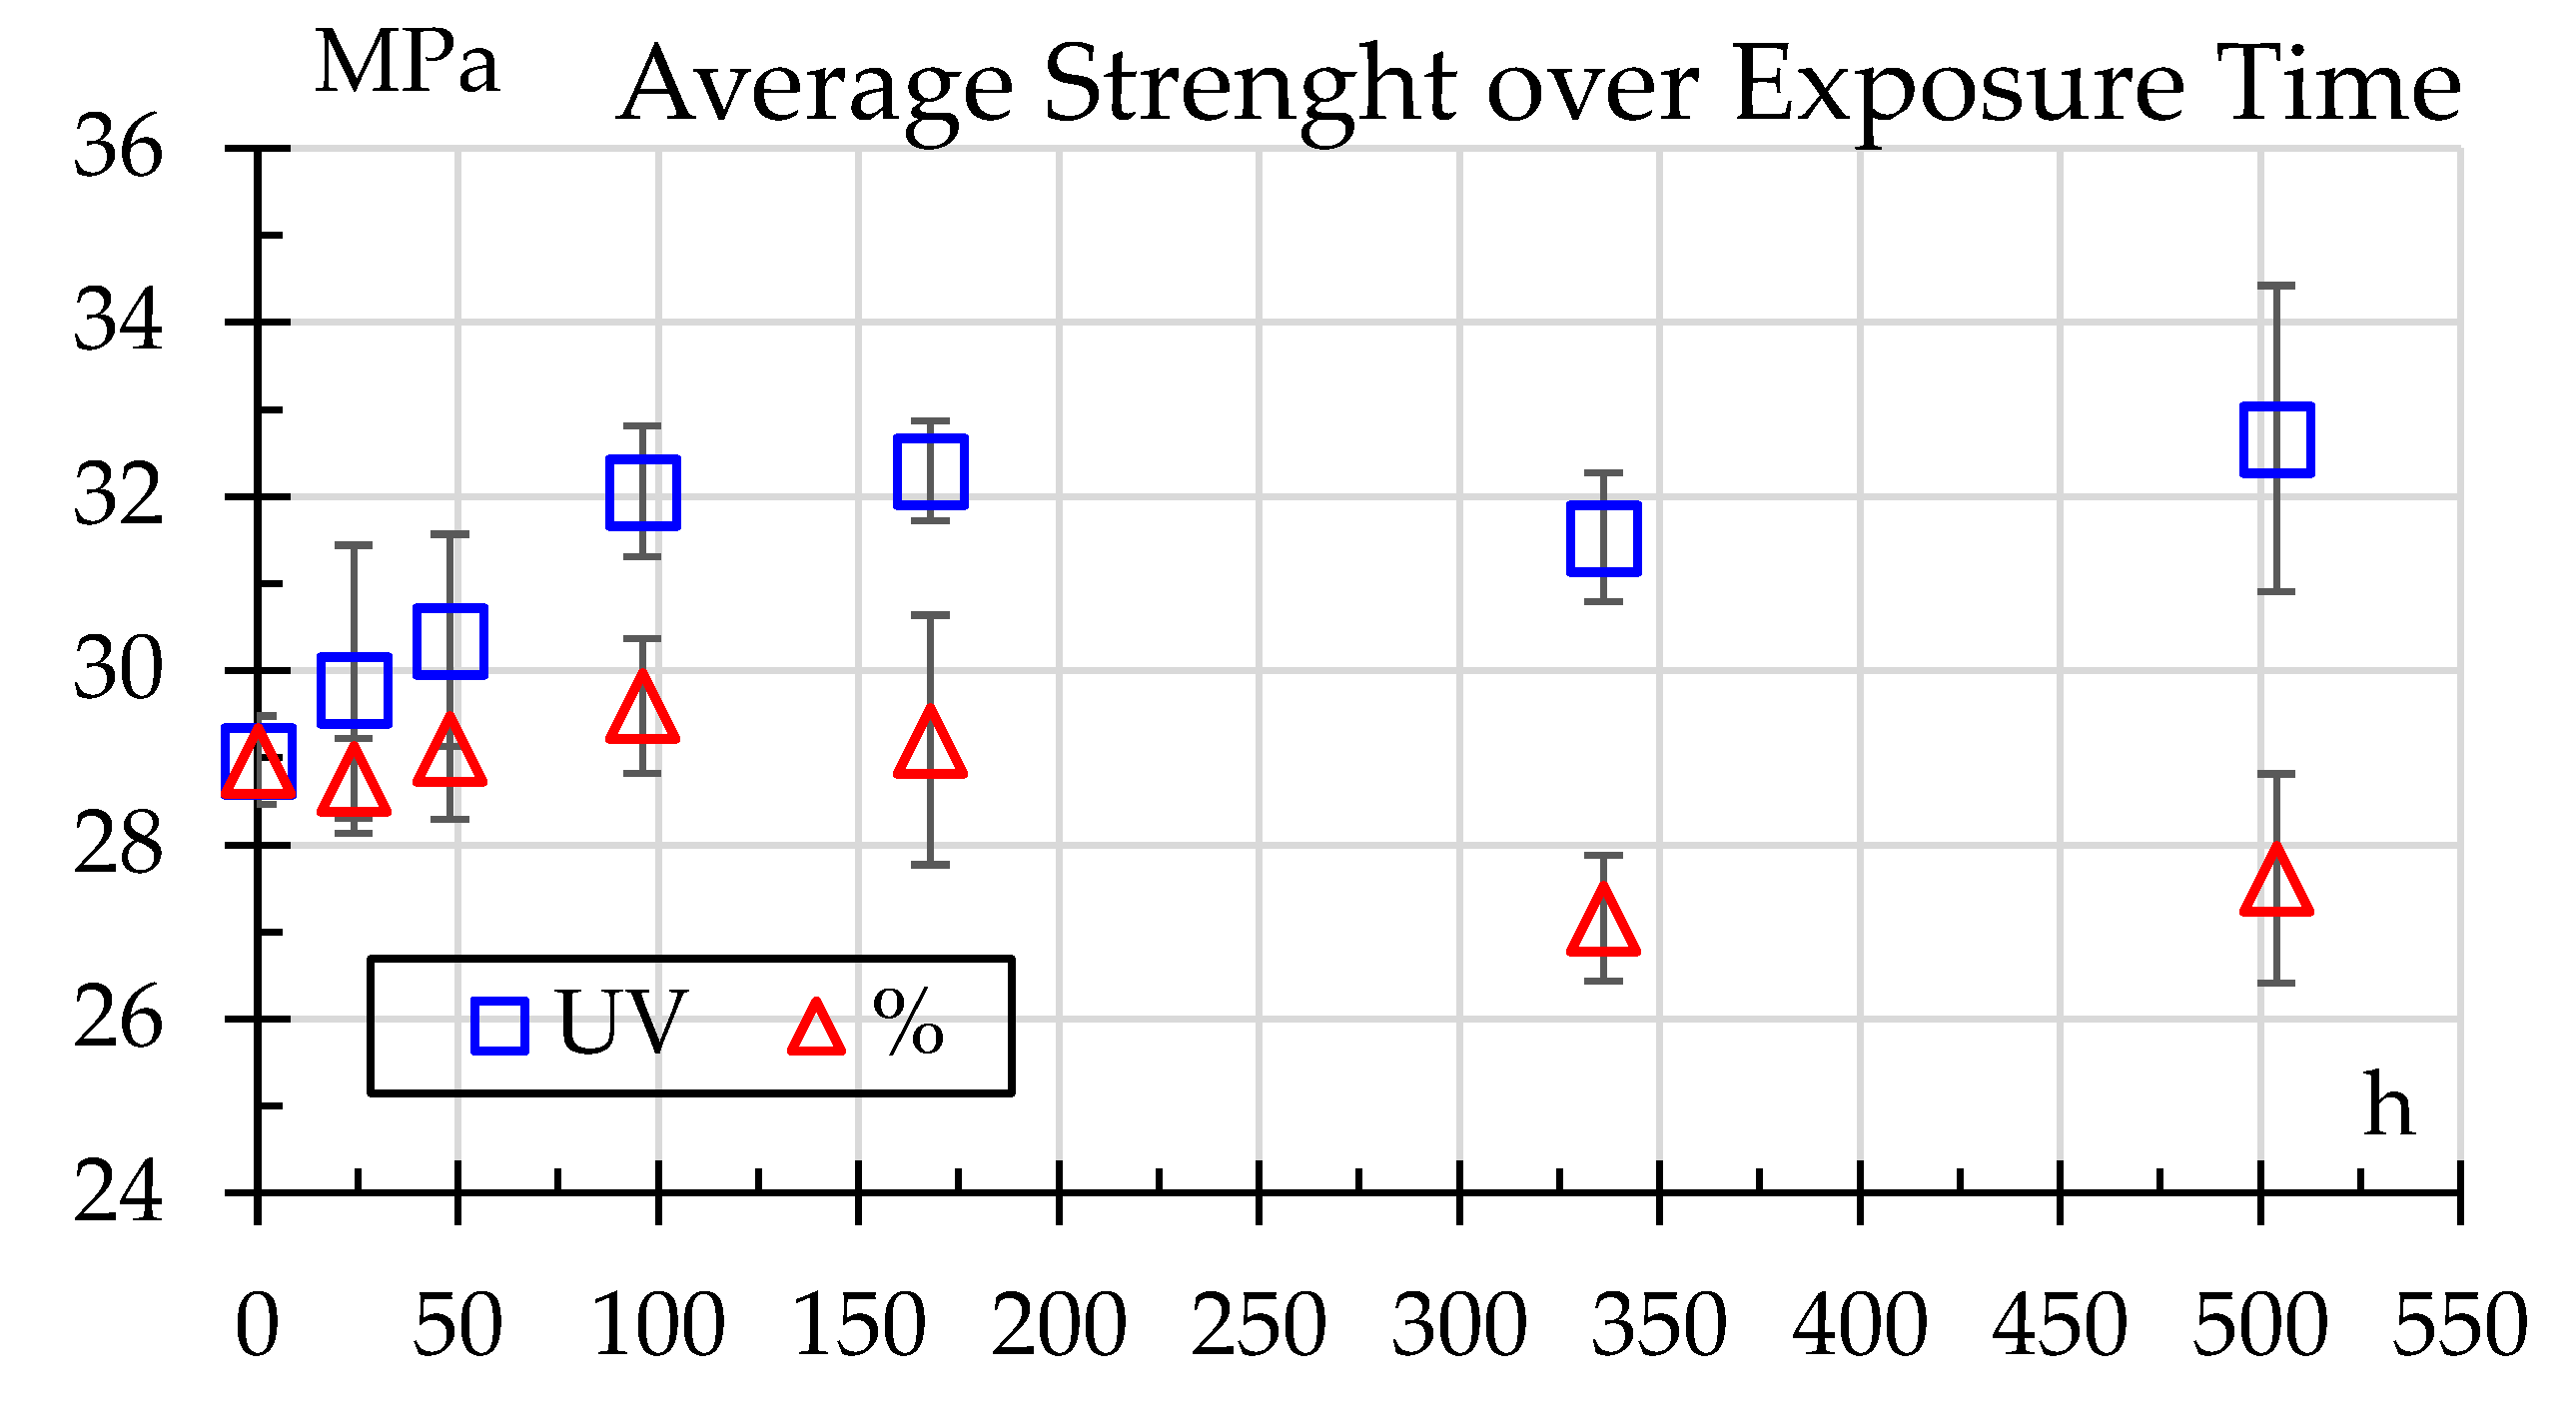
Figure 10.
FTIR pattern for Onyx.
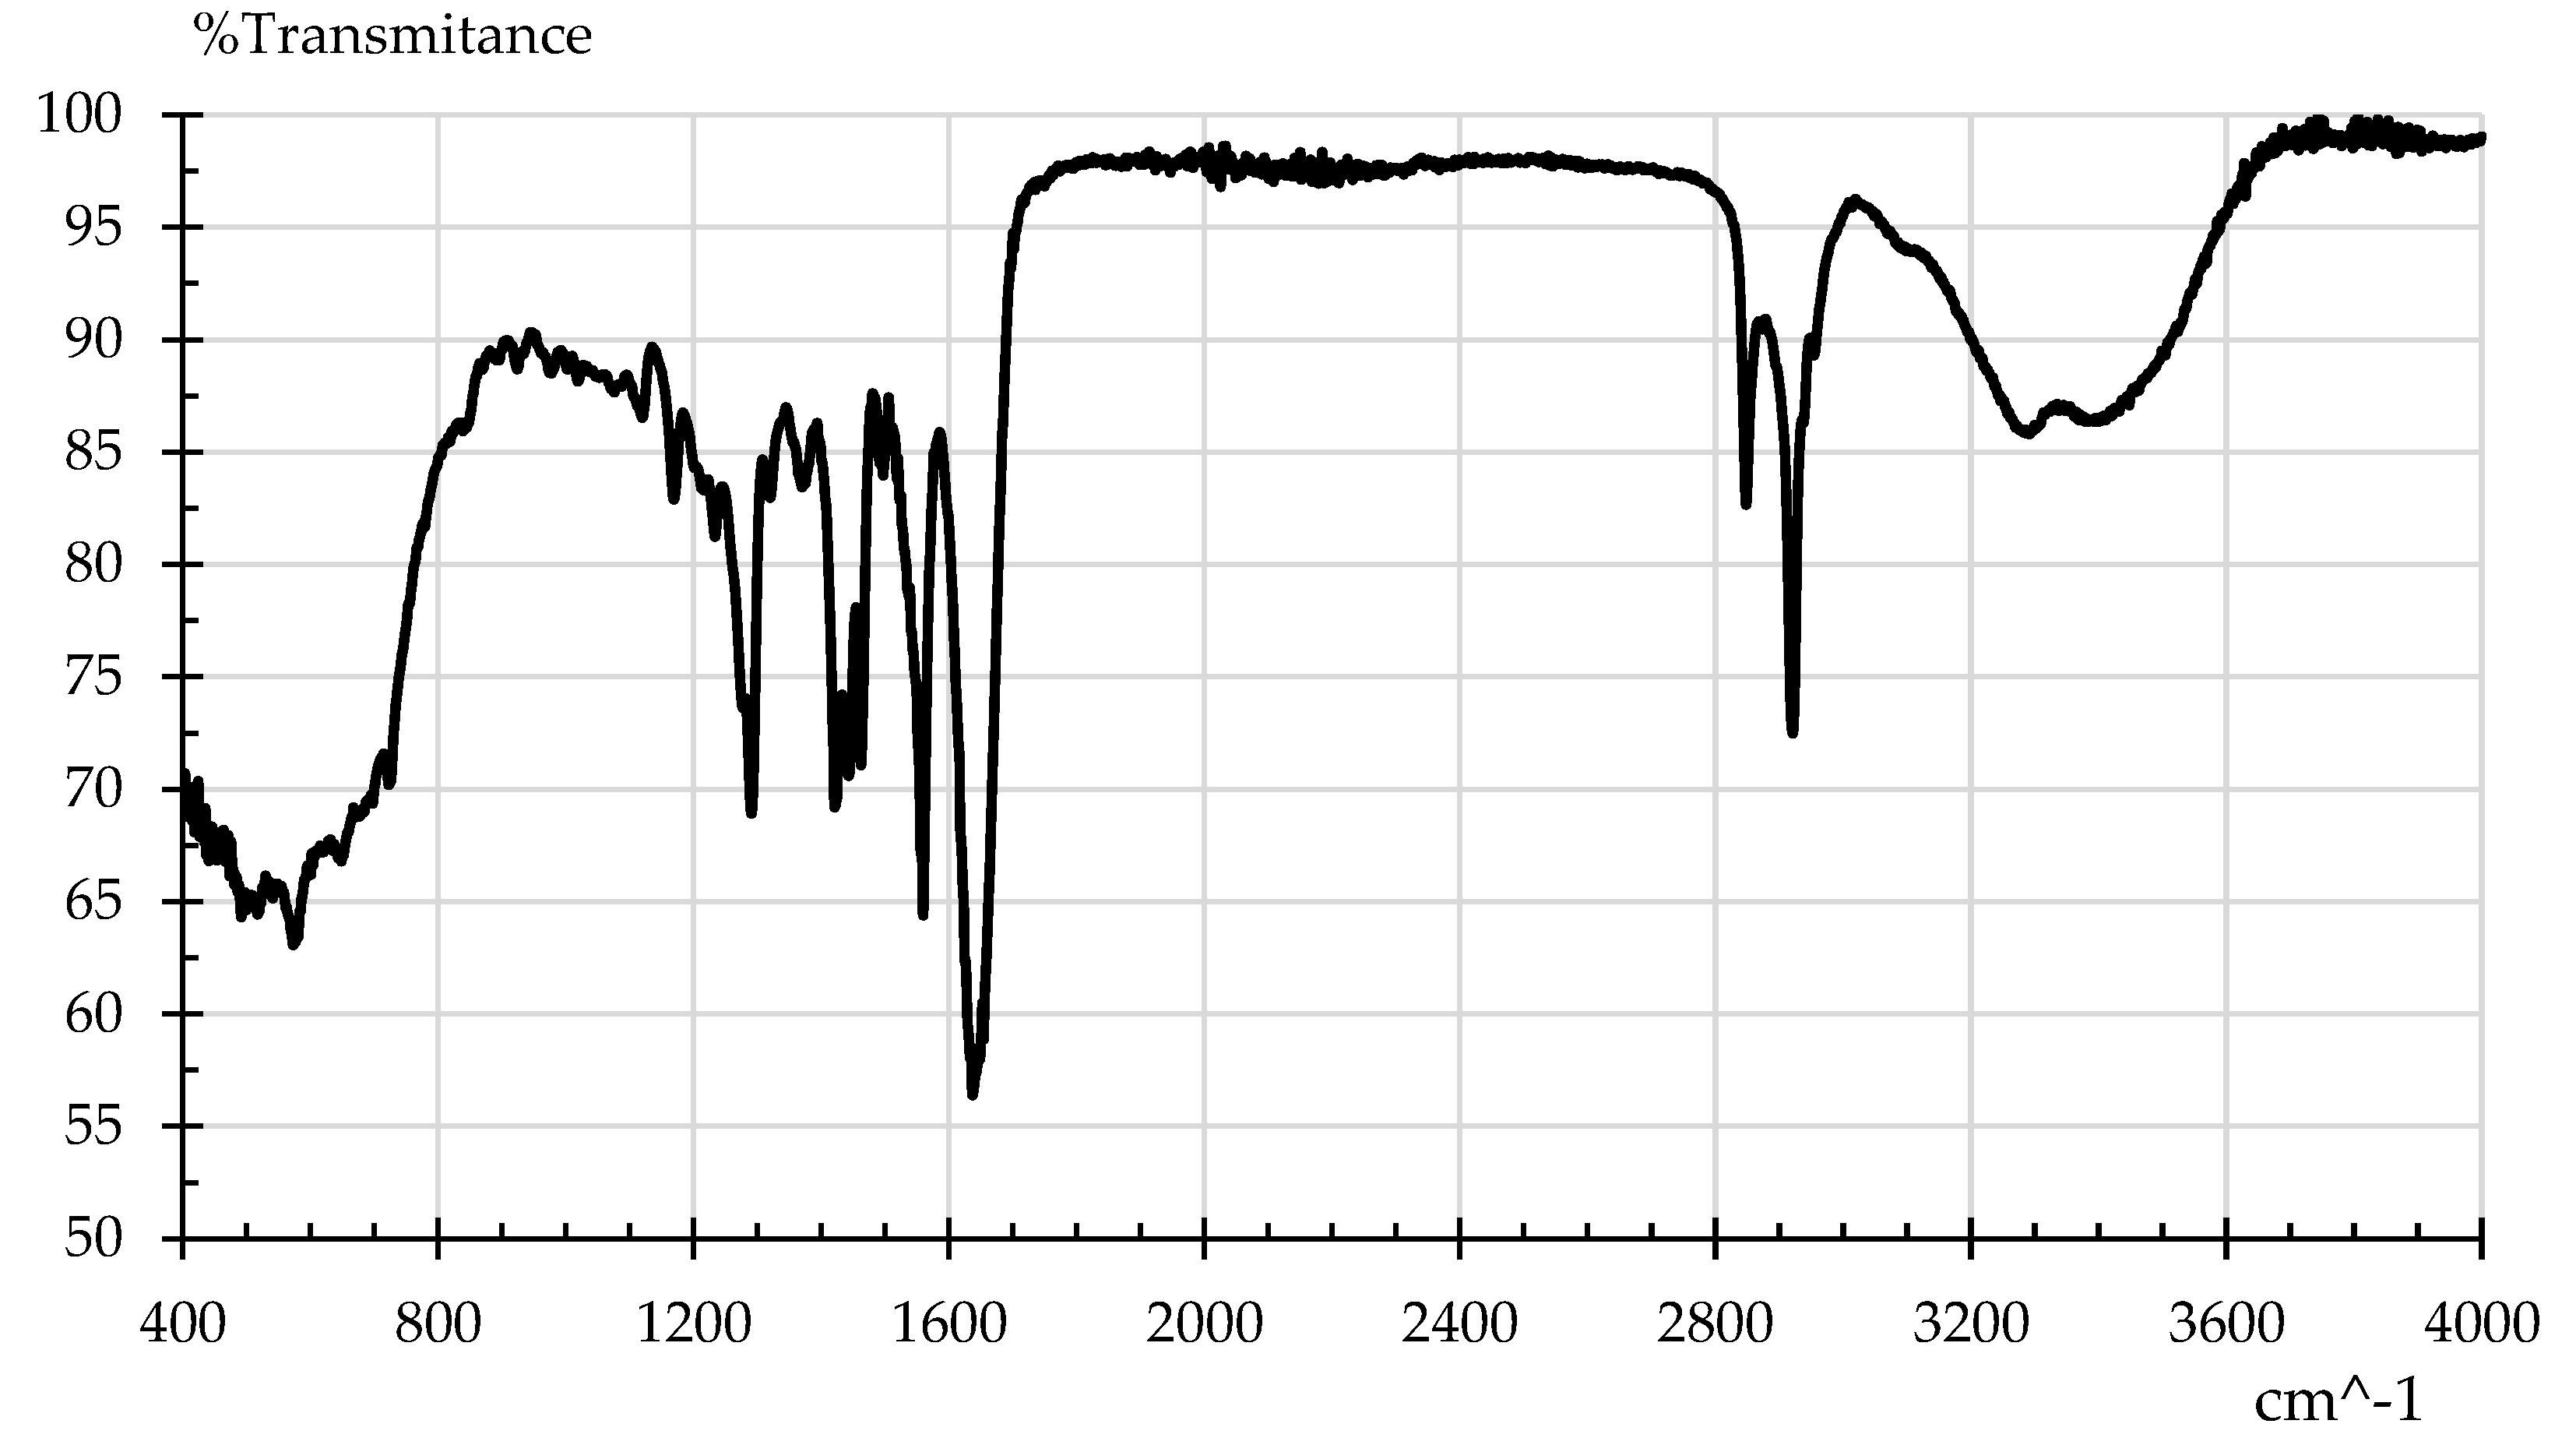
Figure 11.
FITR spectra for samples subjected to different humidity times.
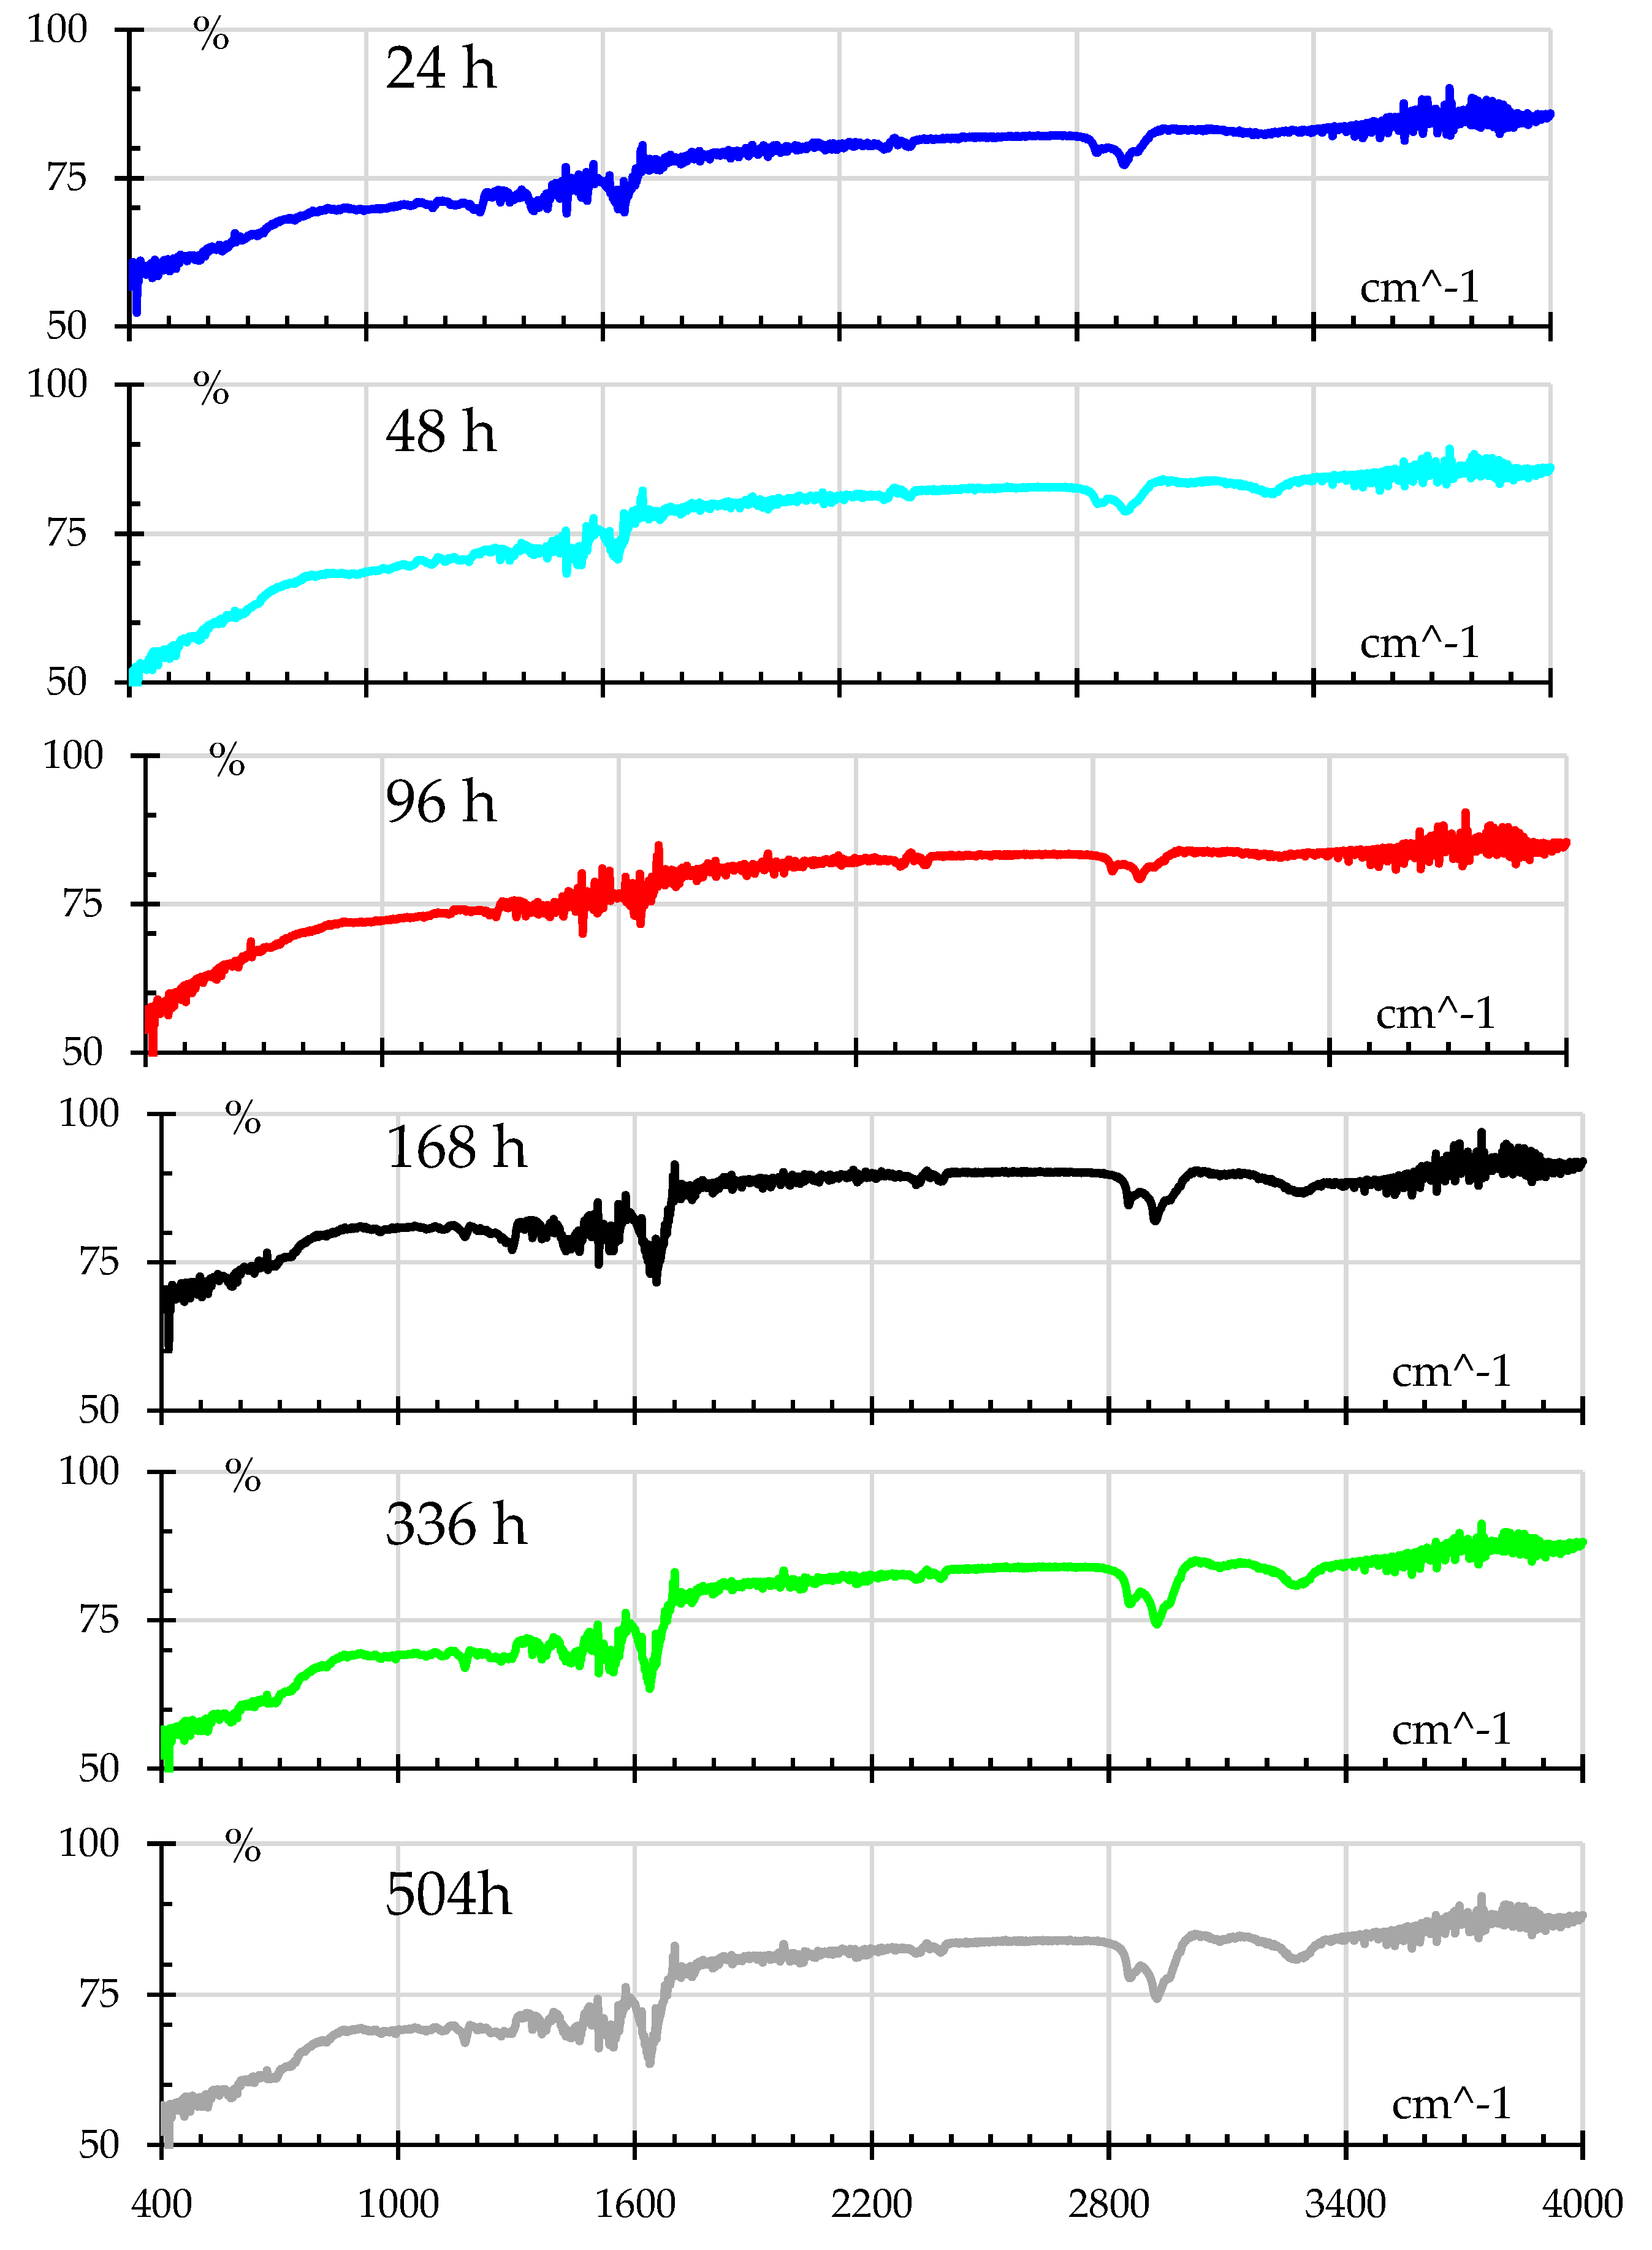
Figure 12.
FITR spectra for samples subjected to different UV exposure times.
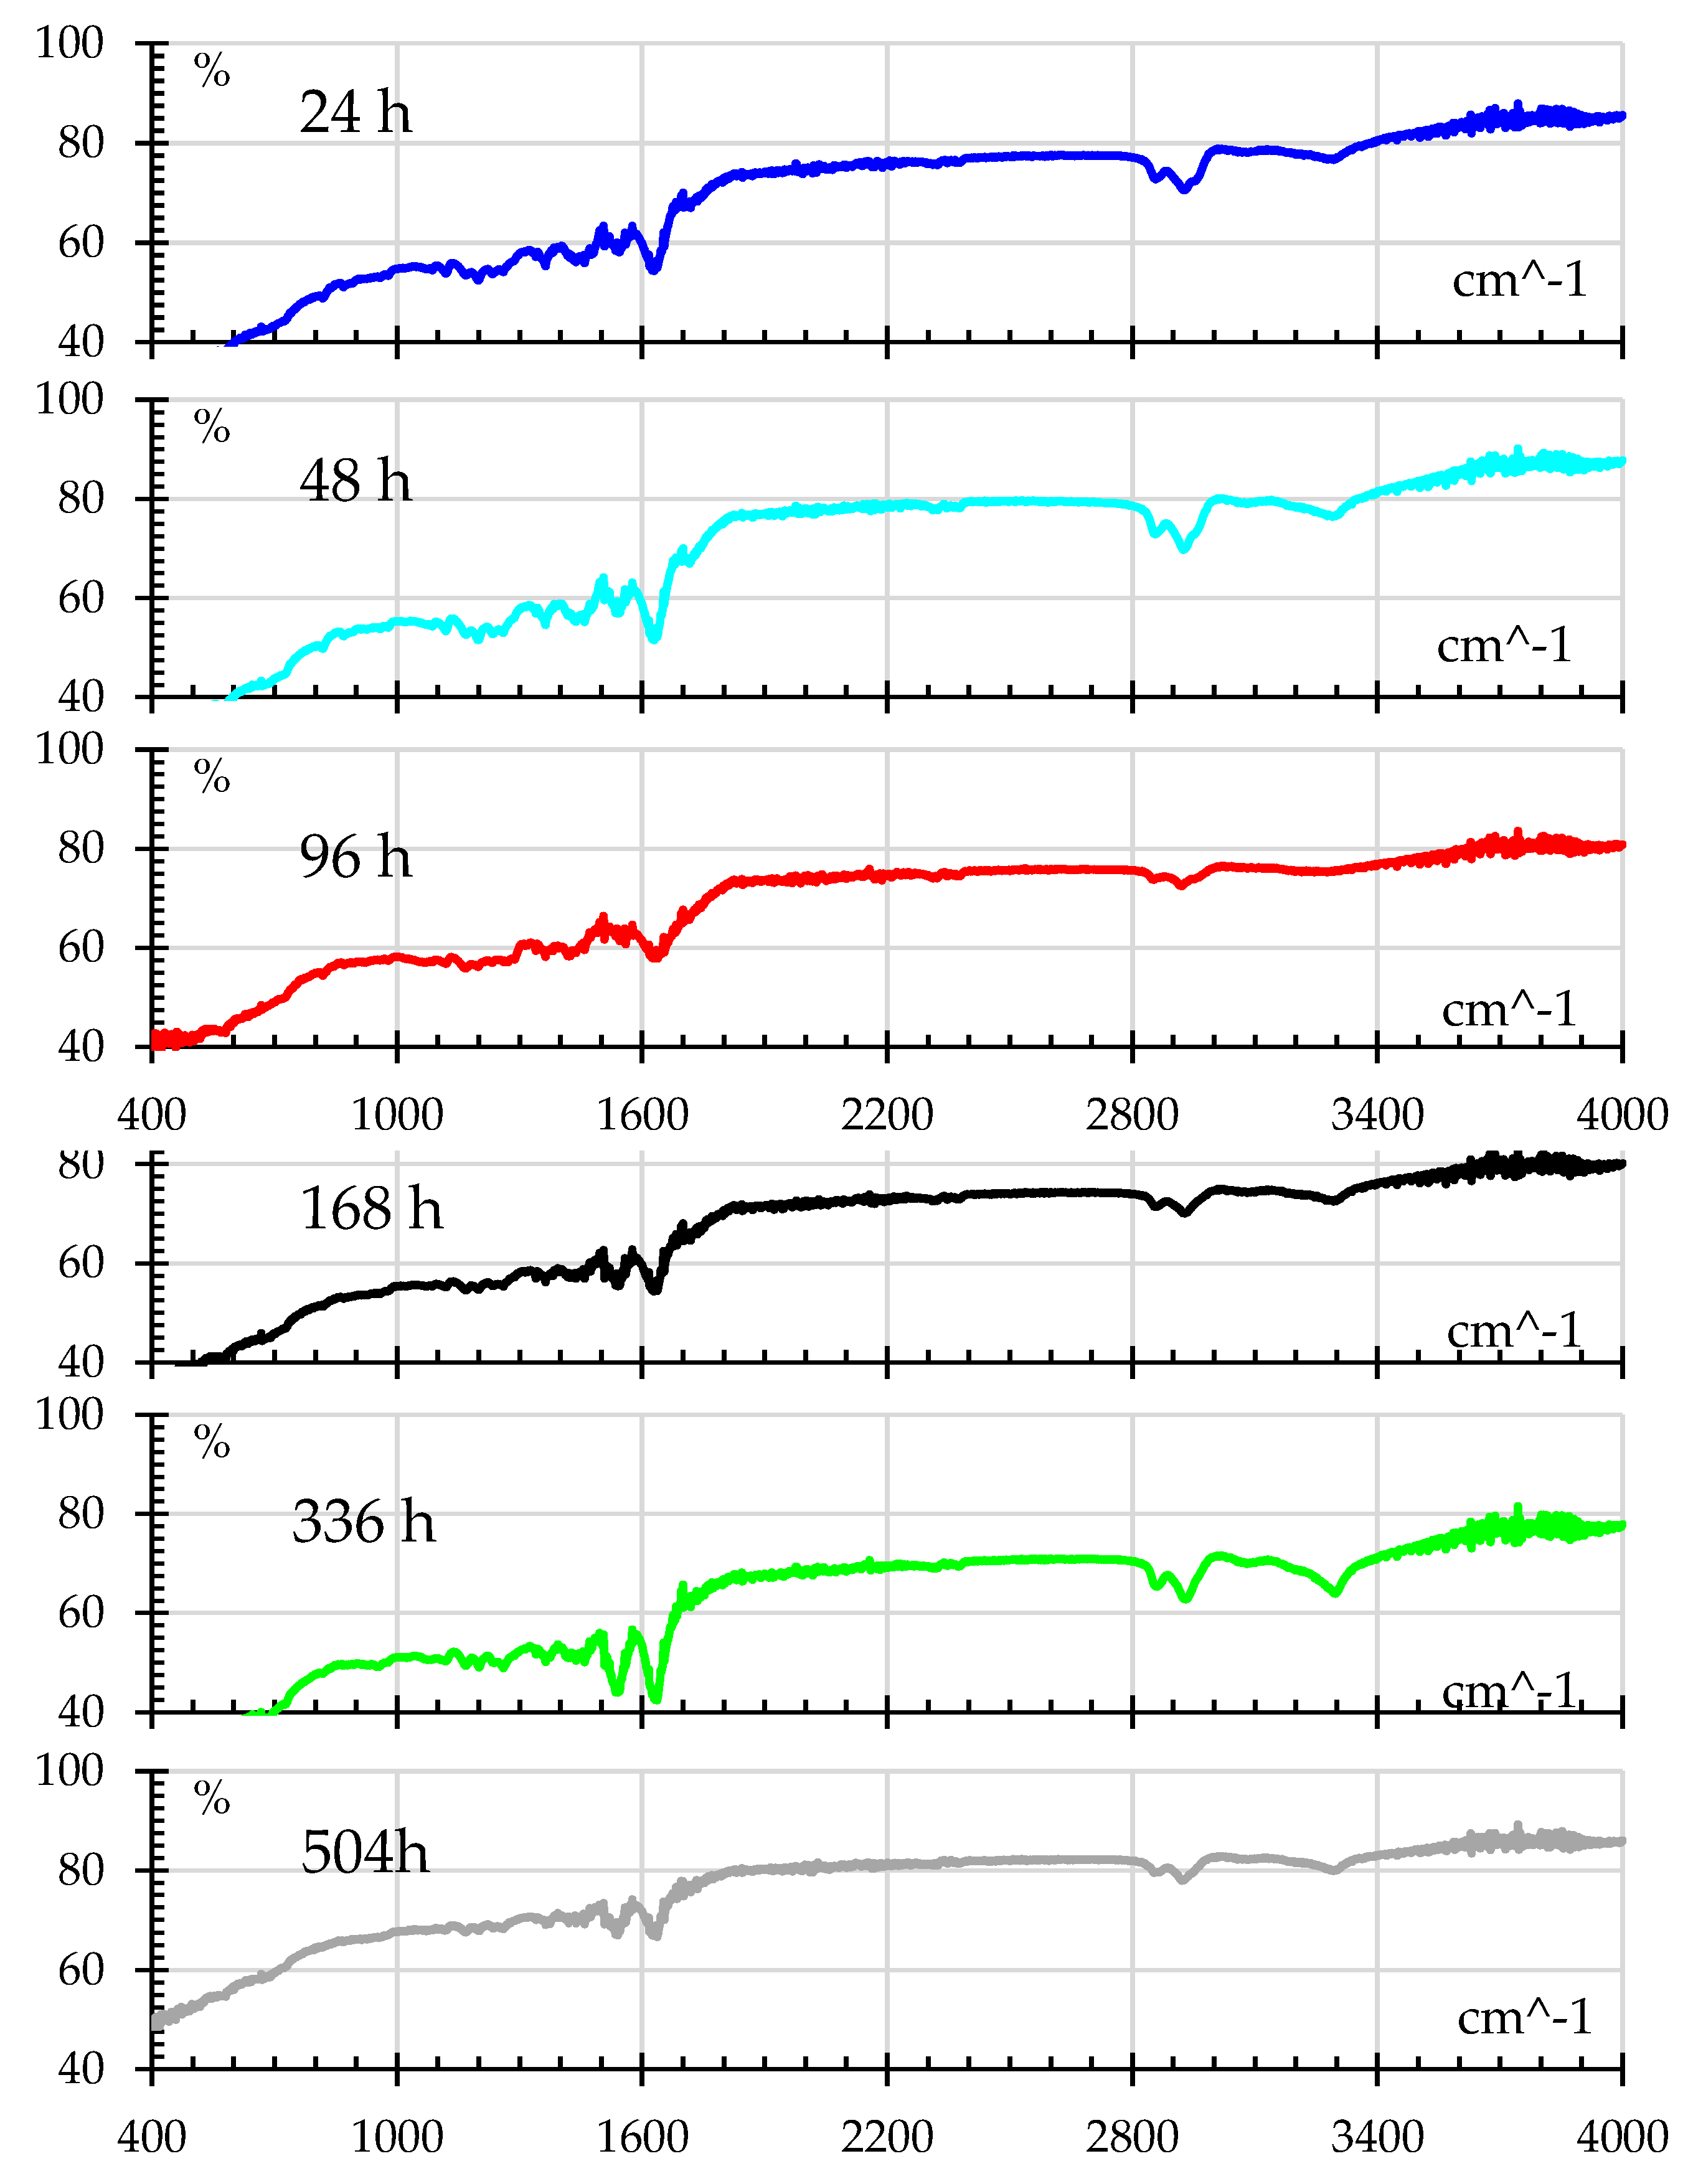
Figure 13.
Failure surface at 0 hr exposure, a) tensile x75, b) tensile x350, c) impact x45, d) impact 100x.
Figure 13.
Failure surface at 0 hr exposure, a) tensile x75, b) tensile x350, c) impact x45, d) impact 100x.

Figure 14.
Failure surface at 504 hr UV exposure a) tensile x80, b) tensile x180, c) impact x140, d) impact 130x.
Figure 14.
Failure surface at 504 hr UV exposure a) tensile x80, b) tensile x180, c) impact x140, d) impact 130x.
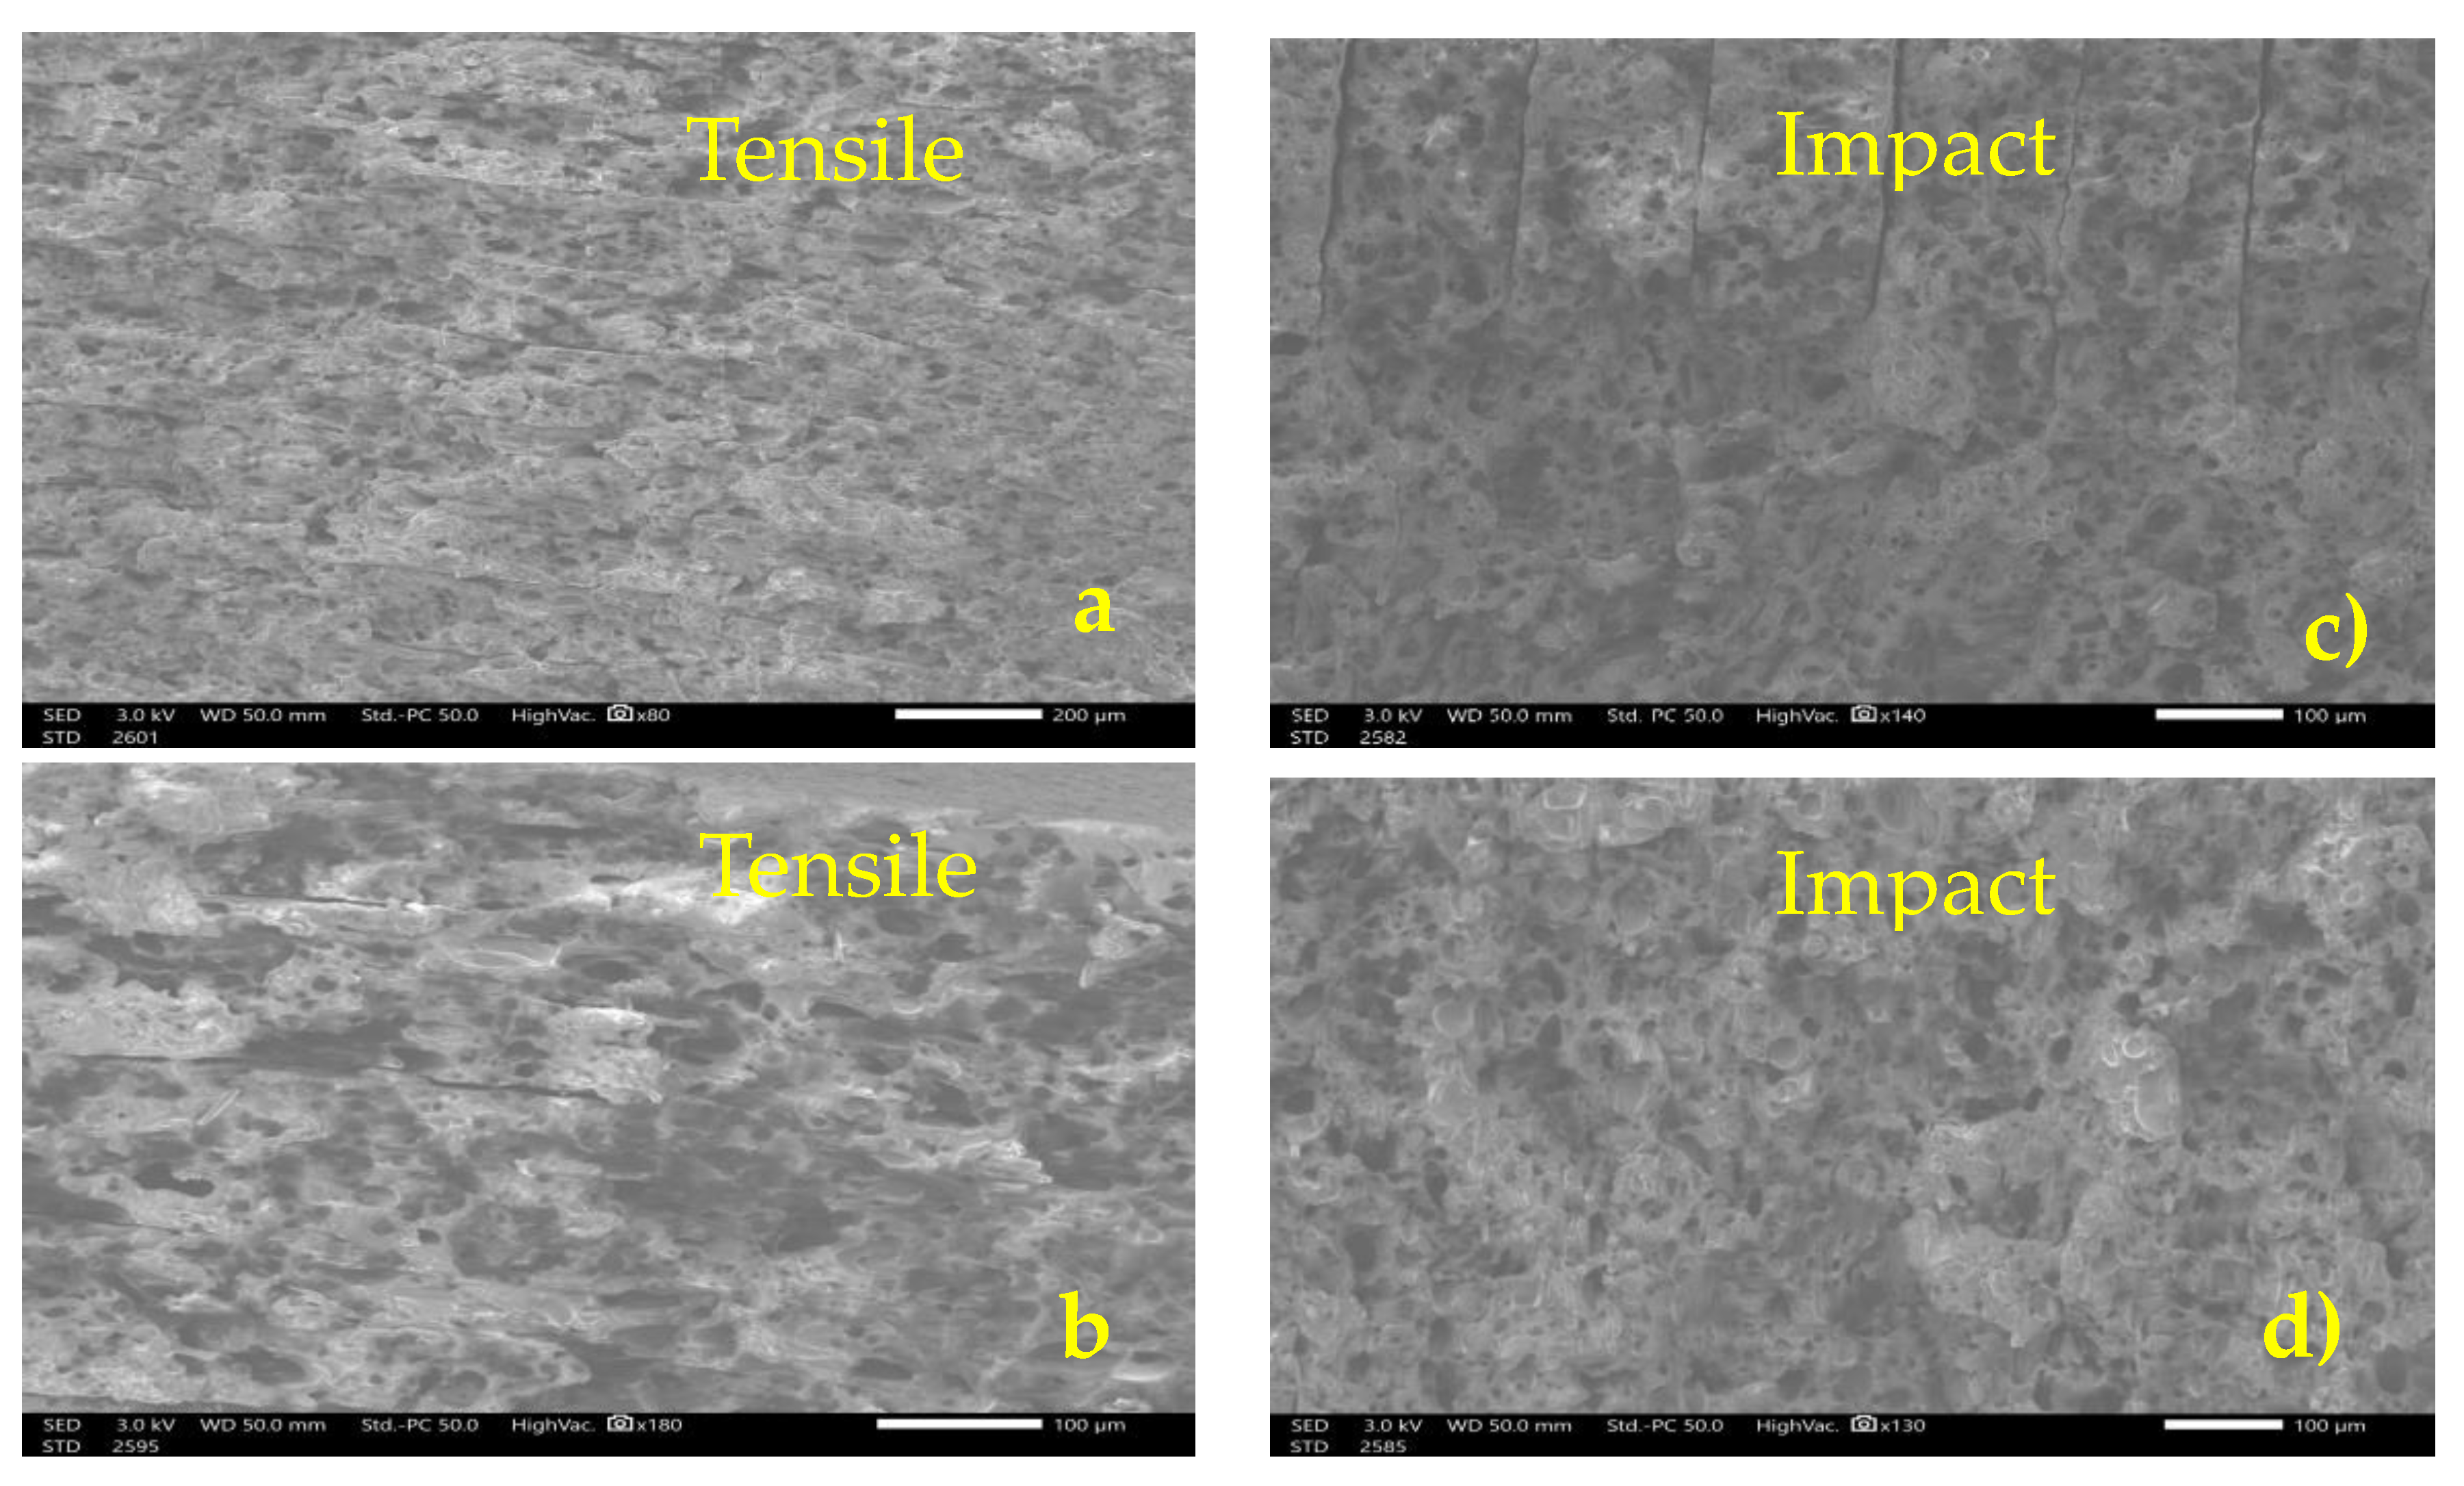
Figure 15.
Normalized mean and standard deviation for humidity exposed samples.
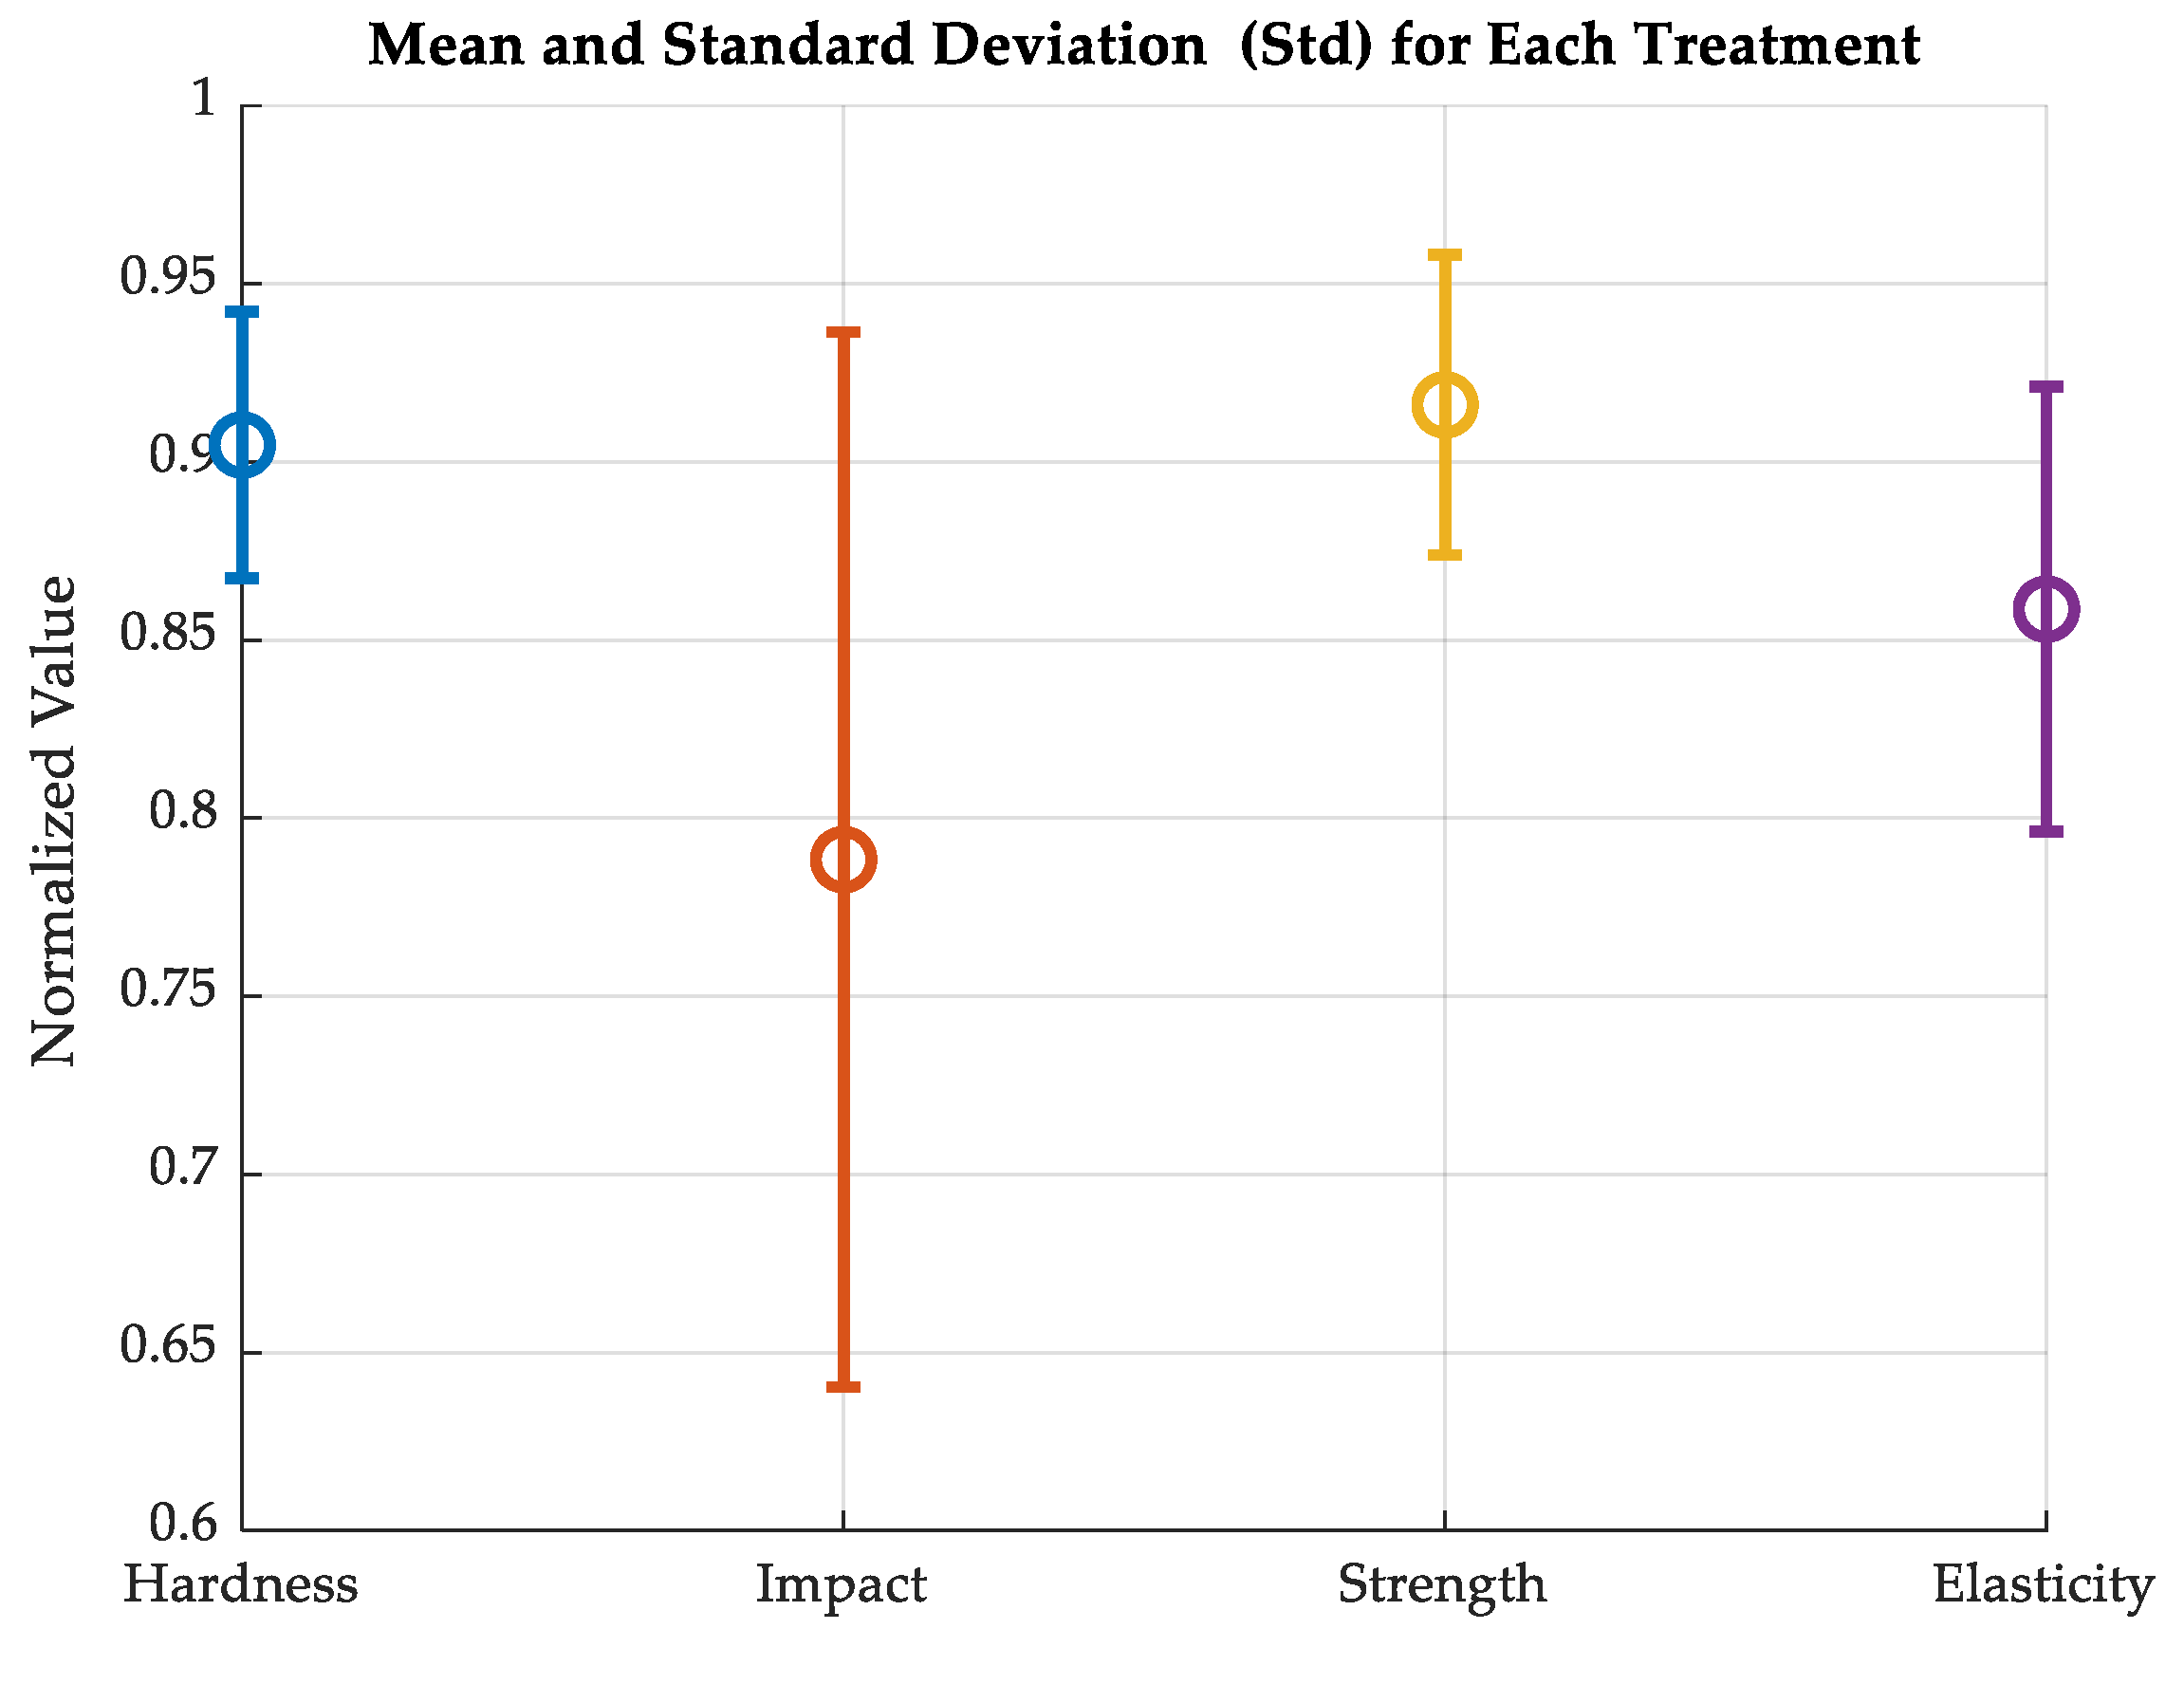

Table 1.
Summary of statistical relationships among the measured variables. The symbols are: + significant relation; - not significant relation.
Table 1.
Summary of statistical relationships among the measured variables. The symbols are: + significant relation; - not significant relation.
| Strength | Elasticity | Hardness | Impact | |
|---|---|---|---|---|
| Strength | + | + | - | |
| Elasticity | + | + | + | |
| Hardness | + | + | + | |
| Impact | - | + | + |
Disclaimer/Publisher’s Note: The statements, opinions and data contained in all publications are solely those of the individual author(s) and contributor(s) and not of MDPI and/or the editor(s). MDPI and/or the editor(s) disclaim responsibility for any injury to people or property resulting from any ideas, methods, instructions or products referred to in the content. |
© 2025 by the authors. Licensee MDPI, Basel, Switzerland. This article is an open access article distributed under the terms and conditions of the Creative Commons Attribution (CC BY) license (http://creativecommons.org/licenses/by/4.0/).
Copyright: This open access article is published under a Creative Commons CC BY 4.0 license, which permit the free download, distribution, and reuse, provided that the author and preprint are cited in any reuse.


