
Submitted:
24 October 2025
Posted:
26 October 2025
You are already at the latest version
Abstract
The presence of fling-step and forward-directivity, as distinctive features of near-fault ground motions, can lead to substantial alterations in the seismic performance of reinforced concrete bridges. This study examines the seismic performance of reinforced concrete bridges with various deck slabs subjected to two distinct sets of earthquake events. One set is of forward-directivity records and the other set is of fling-step records. Three-dimensional finite element models for the analyzed reinforced concrete bridges are constructed using the CSI-BRIDGE software package, incorporating appropriate material and geometric nonlinearities. The developed bridge models are of three spans and have different deck slab systems namely; box-girder, RC girder and hollow-core slab bridges. Extensive nonlinear response time-history analyses of various configurations representing the examined RC bridges are performed to elucidate the impact of seismic loads, including forward-directivity and fling-step records, on the seismic response of supporting columns and deck slabs in the longitudinal direction. The numerical simulations indicate that ground vibrations with fling-step significantly amplify the seismic response demands in both substructure and superstructure elements. Moreover, bridge type substantially influences the induced seismic responses particularly supporting columns and deck slabs.
Keywords:
RC bridges
; deck slabs
; near-fault motions
; forward-directivity
; fling-step
; seismic response
1. Introduction
Bridges, worldwide, provide vital connections to regional and national transportation systems and are essential for economic growth. Many of these bridges are built in areas with noticeable seismic risks. Accordingly, performance of RC bridges to strong earthquake actions is essential for sustaining their structural and functional safety as well as life safety. It has been noted that, structures exposed to near-fault earthquake motions, such as 1999 Kocaeli, Duzce, and 1999 Chi-Chi experience more damage than expected [1]. Extensive structural damage has been attributed to the existence of velocity pulses, as one of the important characteristics of earthquake motions from near-fault regions, which result in long-period responses compared with earthquake motions from far-fault regions [2,3,4].
Ground motions from near-fault regions impose considerable demand on structures due to the existence of velocity pulses. Based on fault rupture, the velocity pulse can be classified as either as forward-directivity or fling-step. The velocity pulse of records with forward-directivity is identified by a sided pulses and has no permanent displacement of the ground. The velocity pulse of the fling-step records is identified by a unilateral pulse in the depicted velocity time-history, resulting in a persistent static displacement of the ground [5]. The existence of such special characteristics in the earthquakes from near-fault regions may result in a substantial damage to structures in their vicinity. The impact of velocity pulses on the induced responses of various structural kinds has been examined. Mahmoud et al. [6] examined the influence of floor systems on the responses of buildings subjected to records from near-fault regions characterized by forward directivity and fling-step effects. The captured structural responses of the modelled buildings under earthquakes with fling-step were found to be significantly higher compared with the corresponding responses to records with forward directivity. Gorai and Maity [7] conducted a comprehensive study on the seismic response of concrete gravity dams subjected to specific earthquake motions from both near-fault and far-fault areas. Linear dynamic analysis together with qualitative assessment of performance and damage levels. Analysis of the obtained results demonstrated that the obtained responses of gravity dams under near-fault motions are substantially different from the corresponding results under far-fault motions.
Park et al. [8] conducted a study to investigate the influence of near-fault records on the Bolu Viaduct under the 1999 Düzce ground motion. The obtained results from the study indicated that existence of velocity pulses resulted in significantly large deformations. Similar studies to investigate the vulnerability of structures exposed to near-fault records and the significant increase in the displacement demand have been carried out [9,10,11,12]. Conducted research works, in the past regarding bridges, revealed that records with pulses generated near to the rapture have significant influences on the induced seismic responses of bridges compared with those responses resulted from bridge excited by far-fault earthquakes [13,14,15,16,17,18,19]. Recently, some research works has been carried out to study the performance of bridges to seismic actions. Chen et al. [20] studied the performance of tall pier bridges to earthquake motions from near-fault regions employing developed analytical models calibrated by shake table tests. The seismic reaction of continuous rigid-frame bridges to specific recordings from near-fault locations has been examined, revealing a significant increase in the seismic response under pulse-like records compared to non-pulse-like records [21]. Near-fault motions of different intensity levels have been utilized to perform simulation analysis of the responses of long-span and asymmetrical suspension bridges to investigate the vibration mechanism of these types of bridges considering the simultaneous effect of soil-structure interaction and velocity pulse [22]. The study demonstrated that installing damper element can significantly minimize the induced displacement of main girder in the longitudinal direction. The shock absorption capacity of the installed dampers differs according to the intensity of the applied earthquakes. Xin et al. [23] explored the behavior of concrete arch bridge with long-span excited by three types of seismic excitations including recorded earthquakes, residual components and idealized pulse models. A finite-element model of the bridge in three dimensions considering geometric and material nonlinearities was developed to perform comparative and parametric analysis to get some insight into the impact of various fling-step record components. The analysis of the results highlighted the substantial impact of the related properties of fling-step records on the induced reaction and performance condition. A number of studies have been undertaken to evaluate the performance of concrete-filled steel tubular arch bridges under various seismic excitations [24,25,26].
The above literature clearly indicates the existence of a large gap between the performance of bridge structures designed considering and ignoring the characteristics of the earthquakes in the vicinity. Following the above cited research works, the scope of current research article is to perform response analysis of RC bridges with different deck slabs under seismic motions with forward-directivity and fling-step. Firstly, numerical analysis models of the considered RC bridges, namely; box-girder, RC girder and hollow-core slab bridges, are developed by the aid of CSI-BRIDGE software package using appropriate material and geometric nonlinearity considerations. Subsequently, fourteen earthquake data, classified into two categories forward-directivity and fling-step motions are used to do simulation analysis based on the produced models. Finally, the recorded seismic reactions of the bridge models to the selected set of data are thoroughly examined.
2. Bridge Modelling
This section introduces the design and configurations of bridge elements as well as the numerical modeling of these elements using CSI-BRIDGE Software Package as one of the available finite element tools [27]. Different models representing a box-girder bridge and two other bridges with RC girders and hollow-core slab are developed. All the developed bridge models have the same span length and deck width.
2.1. Bridge Design and Configurations
Figure 1 presents schematic two-dimensional views of the considered herein bridge models in which the one with box-girder represents a typical symmetrical bridge configuration with three-spans in Damanhur City in northern part of Egypt. The bridge was designed in 2014 and constructed prior to mid of 2017. The bridge was designed to comply with Egyptian Code devoted for reinforced concrete bridges [28]. The selected bridges for the study are of three-spans as shown in Figure 1. All the considered models have the same span of 30.0 m in length and deck width of 11.5 m. The deck has a depth of about 2.0 m. The deck, supporting columns, and abutments are the main structural elements of the bridge where the deck can be either box-girder, hollow core or RC girder. These different deck types, as presented in Figure 2, are considered for response evaluation. The considered bridges are supported by portal frame piers and abutments of dimensions and reinforcement are as shown in Figure 3 and Figure 4, respectively. For the RC girder type bridge, the superstructure of the bridge is composed of a slab of thickness 350 mm carried by girders that are spaced at 1.6 m. Seven cast in situ RC girders are used to form the bridge deck with 2.0 m total depth including the concrete slab. The superstructure part of the bridge stands on elastomeric pads at each supporting abutment and stands monolithically at each supporting pier. The upper portion of the pier is a RC rectangular cap of 6.0 m length and 1.0 m width. Detailed dimensions and reinforcement bars of a typical designed pier are provided in Figure 3.
The utilized bar diameter for longitudinal reinforcement is 32 mm. for the transverse reinforcement, a bar diameter of 12 mm is used. The ratio of longitudinal reinforcement of the pier-column is 2.26% of the cross section gross area. On the other hand, the volumetric reinforcement ratio of the spirals is 0.8%. The lower part of the pier with the configuration shown in the figure is reinforced with 11 Φ 32 distributed around each curved part and 28 Φ 32 around each straight part of the pier. Φ 12@100 mm is installed as transvers spiral reinforcements at the start and end portions of the pier while Φ 12@125 mm is installed as transverse spiral reinforcements at the middle portion as shown in Figure 3. The cap seat length of the supported girder in longitudinal direction is 1.0 m. The designed reinforcement details of the longitudinal and cross-sections of the supporting abutment as well as the geometric configurations are provided in Figure 4. The piers and abutments are supported on deep foundations which consist of circular bearing piles of diameter 1.0 m.
2.2. Finite Element Modelling
Different bridge models have been developed and analyzed for the purpose of investigating the influence of near-fault records with fling-step and forward-directivity on the induced responses. These models are of three-spans and different deck slab systems supported by columns of 12.0 m height. All the developed models have intermediate monolithic piers and two edge abutments with three bearings each. The modelled bridge width provides three traffic lanes. Figure 5 presents the developed three-span bridge models using CSI-BRIDGE Software Package considering the geometric characteristics, boundary conditions, material properties, mass distribution, foundations and all bridge components.
2.3. Modelling of Bridge Elements
The bridge deck has been modeled using the grillage method, in which the deck is idealized as a series of beam elements (or grillages) connected and restrained at their joints. Such a combination of longitudinal and transverse beam elements, is responsible for the longitudinal and transverse stiffness for the continuous deck assuming linear elastic behavior. For each grillage element, the properties of the section are calculated and assigned to linear elastic beam column elements with tributary mass lumped at each node of the grillage system. For the box girder bridge modeling, the deck section is dived into 3 webs as shown in Figure 6.
For the hollow-core bridge modeling, the deck of the bridge is dived into seven webs as can be seen in Figure 7. Similar to the hollow-core bridge, the RC girder bridge deck is also divided into seven RC beams as shown in Figure 8. Each web, segment or girder has its own local axis that passes through its centroid. However, for all types of bridges, the properties of such a segment or web, are calculated with respect to the neutral axis of the whole section. The pier-deck connection is an integrated connection devoid of bearings. A nonlinear three-dimensional beam-column element is utilized to simulate the bridge columns.
In the abutment modeling, a stiff element matching the superstructure width is employed, incorporating three elastomeric bearings to provide lateral and vertical displacements at the expansion joint sites. The performance of the elastomeric bearing is governed by its ability to undergo shear deformations prior to sliding.
3. Material Properties
3.1. Concrete and steel properties
In order to simulate the real concrete behavior during the analysis process, the utilized CSI-Bridge software package requires linear and multilinear isotropic as well as some additional concrete material properties. The concrete properties are established based on the nominal values specified in the construction plans for the preliminary examination of the bridge model. The specified compressive strength of concrete is f_cu=40 MPa for both the superstructure and substructure components of the bridge, with a corresponding elastic modulus of E_c=27828 MPa. The concrete utilized herein has an ascribed tensile strength of around 3.80 MPa and a Poisson's ratio of 0.2.
For steel bars used in reinforcement of concrete elements, a yield strength of 360 MPa is utilized for the main and transverse reinforcement respectively. The modulus of elasticity for the steel reinforcing bars utilized in the analysis was 200,000 MPa.
The employed herein CSI-Bridge software package is capable of handling concrete and steel material models. The produced materials models by the software are presented in Figure 9. The provided model for concrete presents the relation between stress and strain in both compression and tension zones Figure 9a. For the concrete compression part, a parabolic curve simulates the stress-strain relation up to the specified design strength value. The stress-strain relation of steel in both tension and compression shows a linear elastic behavior before reaching the yielding point Figure 9b. The figure also shows that, further increase in the applied stress yields an increase in the induced strain till the formation of strain-hardening region before reaching ultimate strength point.
3.2. Elastomeric bearings
The superstructure of the considered bridge types is seated on elastomeric bearings at each abutment location allowing the bridge to move freely in the longitudinal direction at bearing locations up to the maximum elastomer flexibility. The Elastomeric bearing behavior is controlled by the capacity of shear deformations. During the modelling process of the bridge model, the isolation system is represented by a link element of specified stiffness values. Figure 10 presents the idealized force-deformation relationship of the isolation system in which defines the characteristic strength, represents the stage of elastic stiffness, denotes the stage of post elastic stiffness. The yield force and the corresponding yield displacement for the isolator are denoted by and respectively. Similarly, the maximum force and the maximum displacement induced by the isolator are identified as as and . The isolation period, , can be calculated in terms of the weight carried by the isolator, , the acceleration of gravitational, g, and stiffness, , as:
4. Earthquake Records
The ground motion dataset used in the current study consists of 14 near-fault earthquake records divided into records of and fling-step and forward-directivity characteristics. The main difference between the two classes of records is the existence of a one-sided pulse in the velocity time-history of the fling records, sometimes called reversing form, (see the plotted velocity time-history of Chi-Chi-EW TCU052 in Figure 11). Such a one-sided pulse is responsible for generating a permanent static displacement in ground. However, earthquake motions with forward-directivity contains a two-sided pulse, non-reversing form, in its velocity time-history, as can be seen in velocity time-history of Northridge-RRS presented in Figure 11, and consequently there is no permanent displacement of the ground.
The forward-directivity set of records are collected from different regions namely; Northridge, Loma-Prieta, Cape-Mendocino, Erzincan, and Tabas, with different magnitude. The remaining seven of the set are characterized with fling-step displacement and collected from Chi-Chi Taiwan ground motions with magnitude of 7.6. Peak ground velocity (PGV), peak ground acceleration (PGA), and the PGA/PGV ratio are presented in Table 1 for records of forward-directivity and Table 2 for records with fling-step. The computed ratios of PGA/PGV confirm that nearly all the chosen records possess low-frequency content [29]. For the purpose of simulation analysis, the selected records are scaled to have a PGA of 0.125g to fit Cairo city. The Pacific Earthquake Engineering Research Center (PEER) is the source of all the selected records with forward directivity and fling-step characteristics. A similar set of records have been utilized to investigate the performance of RC buildings [30], building’s response with different floor systems [6], and RC coupled shear walls [31].
5. Verifications of the Grillage Method
For the purpose of authenticity of grillage model reliability and accuracy, a comparison was performed with Box girder, RC beams and hollow-core deck slab bridges 3D Finite Element Models (FEM). Comparison was made to precisely account for the behavior of deck slab elements, diaphragms, substructure and torsional effects. The grillage model determined a total dead load deflection of 16.60 mm, 19.00 mm and 19.70 mm for Box girder, RC beams and hollow-core deck slab models respectively as shown in Figure 12, while the 3D FEM model determined a corresponding deflection of 17.10 mm, 17.90 mm and 19.30 mm as shown in Figure 13. The large percentage between the two models 97.10%, 94.20% and 97.90% reflects the accuracy of grillage method analysis and findings.
6. Results and Discussions
6.1. Column’s Response
The column’s horizontal displacement responses obtained along its twelve-meter height for the considered different bridge models, in terms of box-girder, RC girder and hollow-core slab bridges, under the excitation of forward-directivity and fling-step records are presented in a comparative way in Figure 14. The displacement responses are predominantly governed by the first mode of vibration, exhibiting pronounced peak displacement at the apex of the column height across all examined bridge models and seismic recordings. The captured average peak displacements at top of the column under fling-step records are 78.33mm, 89.70mm and 102.18mm for box-girder, RC girder and hollow-core deck slabs respectively. The corresponding values under the forward directivity records are respectively 50.1mm, 59.54mm and 64.96mm. These findings show that the captured column’s displacement under fling-step records is significantly higher than those induced under records with forward directivity. The figure also reports the mean of the peak values of the column’s displacements obtained for the considered different records. The shown mean values distinctly demonstrate that the fling-step recordings yield larger average deflection values than those derived from the forward-directivity records across all evaluated bridge models. Irrespective of the excitation records, the hollow-core slab bridge exhibits greater susceptibility to seismic loads, resulting in the highest displacement responses, in contrast to the box-girder bridge, which produces the lowest displacement responses. From percentage point of view, the developed average peak column’s deflection of hollow-core slab bridge provides about 30% increase compared with the developed peak column’s deflection of box-girder bridge under either forward directivity or fling-step records. This can be attributed to the fact that the supported deck influences the response of the supporting column through enhancing the stiffness of the structure. For the considered different models of bridges excited by the forward-directivity records, the induced lateral column’s displacements are increased with the decrease of the frequency content represented by the ratio, PGA/PGV, where the Loma-Prieta earthquake with the lowest frequency content ratio among the other forward-directivity records produces the largest deflection values, see Table 1 for near-fault ground-motion records input with forward-directivity. On the other hand, Tabas, and Cape-Mendocino, with the highest frequency content ratios produce the lowest deflection values. However, the induced column’s deflections under fling-step records do not provide consistent results with respect to the change in the earthquake properties (PGA/PGV ratio). The EW and NS records of the Chi-Chi earthquake from station TCU-052 which have low PGA/PGV ratios, but not the lowest compared with TCU-068, produce the largest deflection values compared with the other records particularly Chi-Chi records from station TCU-084 which has the largest PGA/PGV ratio. This also can be due to the pulse period of the records which is considered as another essential characteristic. The pulse period associated with the records of TCU-052 is 13.87 s which is higher than 12.15 s, the one associated with the records of TCU-068 [32]. Moreover, ground motion records from TCU-084 have no clear pulses where the reciprocal of frequency content (i.e., PGA/PGV) is less than 0.2 [33].
The column’s rotation response obtained along the column’s height for all considered different bridge models under the excitation of forward-directivity and fling-step records are computed and presented in Figure 15. The obtained rotation responses show similar trends as the obtained for longitudinal displacement. However, the rotation response curves almost coincide with a sinusoidal shape. The results of the average peaks shown in Figure 15 demonstrate that records with fling-step increase the rotational demand on the supporting columns, regardless of the type of supported deck. For example, the captured average peak rotation values developed due to fling-step records are 7.62 rad, 8.80 rad, and, 10.10 rad for box-girder, RC girder and hollow-core deck slabs respectively while the corresponding values due to forward directivity records are 4.92rad, 5.88 rad, and, 6.55 rad. The data reveal a 50% increase in rotational demand for records displaying fling-step compared to those showing forward-directivity, regardless of the bridge type, highlighting the substantial influence of near-fault records on rotational demands concerning forward-directivity and fling-step.
Figure 16 illustrates the moment profiles of the column, measured along its height, for all examined bridge models exposed to forward-directivity and fling-step records. The peak moment values are documented at both the lower and upper sections of the column, regardless of the bridge type and the relevant data. The moments captured from forward-directed motions are significantly smaller than the moment values caused by fling-step motions. Examining the distribution of the moments over the vertical height of the columns also indicates that the lowest moment value is clearly concentrated at the middle region of the column. The box-girder bridge model produces the lower story moments in response to both excitation records. In comparison to the other two bridge models, the hollow-core slab bridge model generates the greatest story moments. The RC-bridge model yields intermediate values between the two other models. In the assessment of forward directivity records as excitations, the hollow-core slab bridge model increases the generated moment values by roughly 23% and 44% compared to the peak moment values of the box-girder model and the RC-bridge model, respectively. However, with the use of fling-step records as excitation, the corresponding percentages are 14% and 29%, respectively.
AS can be seen from Figure 17, the induced seismic shear forces are almost constant along the column’s height for all the considered bridge types. The range of shear force at bottom and top of column gets slightly lesser with the increase of column height. The alteration of the lowest position is negligible in comparison to the highest one. However, there is a substantial disparity in the values assigned to each bridge type. Furthermore, there exists a significant disparity between the recorded values for the fling-step and those for forward-directivity, irrespective of the bridge type. The plots clearly indicate that the shear response varies depending on the type of earthquake records and the structural system of the bridge as well. For example, the calculated average peak shear value at the column of the box-girder bridge almost 175 tons under forward-directivity records and 275 tons under the fling-step records. The corresponding values for the RC-girder bridge respectively are 190 tons and 290 tons. On the hand, the column of the hollow-core slab bridge experiences average peak shear values of 220 ton and 340 ton under records of fling-step and forward-directivity respectively. Comparison of the calculated shear values of the bridge’s column demonstrates that proposed bridge models with various deck types behave differently under forward-directivity and fling-step earthquake motions. The presence of fling-step in near-fault motions alters the induced shear values considerably, which in turn affects the design specifications.
6.2. Deck’s response
Deck moments of the box-girder, RC girder, and Hollow-core slab bridges are shown in Figure 18 for the considered forward-directivity and fling-step ground motion records. Near-fault ground motions with fling-step induce larger deck moments compared with near-fault ground motions with forward-directivity for all the considered types of bridges. As illustrated in the provided figure, The resulting average deck's moment responses due to records with forward directivity exhibit comparable tendencies to those obtained under records with fling-step. It has also been noted that the peak moment curves for all the considered bridges follow a similar trend under the two sets of records considered herein. The moment results of the deck show an increase up to a certain maximum level, corresponding to the first intermediate pier, and then followed by a decrease trend to a certain minimum value, corresponding to the mid-span of the deck. Such an observation clearly indicates that; the captured peak moments are at the intermediate supporting piers while the lowest moment value is recorded at the mid-span of the deck. Comparing bridge models shows that deck moments vary significantly along the deck length, regardless of the type of records particularly at pier supports. At deck edges, however, the variance in the recorded moments appears to be negligible and varies only slightly depending on the type of record. The box-girder bridge model produces the lowest moment values under the two sets of earthquake motions. However, in contrast to the other two bridge models, the developed hollow-core bridge produces deck moments of greater values. From a percentage point of view, earthquake motions with fling-step increases deck’s moment of box-girder bridge model by about 54% compared with the induced deck moments due to forward-directivity records. The corresponding percentage increase in deck moments of the RC girder bridge model, when subjected to the set of recordings with fling-step compared to the set with forward-directivity, is approximately 48%. For the hollow-core slab bridge model, the calculated percentage increased to 52%. One possible explanation for the higher deck moments in the hollow-core slab bridge model when compared to the other two bridge models is that stiffness as a significant dynamic characteristic parameter. The box-girder model is the stiffest one while the hollow-core slab bridge attains the lowest stiffness.
Deck shear forces of the considered different bridge models are shown in Figure 19 for the considered near-fault motions with forward-directivity and fling-step. Regardless of the records set, the distribution of deck shear forces changes as deck length changes, as shown in the figure. At the middle of the bridge deck models, the variations in deck shear values related to the type of records are noticeable. It is evident that the produced deck shear forces of the developed bridge models exhibit almost similar variation under the excitation records. Earthquake motions with forward-directivity induce responses of smaller values compared with induced responses due to the set fling-step for all the considered bridge models. The box-girder bridge model has the lowest shear force values relative to the other two bridge models for the examined types of ground motion measurements. Among the two constructed bridge models, the hollow-core slab bridge model generates the highest shear force values. This can be attributed to the fact that both models with box-girder and hollow-core slabs have the higher and lower rigidity, respectively. That means, the higher the flexibility of the bridge model, the lower the induced shear forces.
The calculated peak shear for the deck of the box-girder, RC girders, hollow-core slab bridge models, under the excitation records with forward-directivity are 51.0 ton, 66.0 ton, and 87.0 ton, respectively. The associated values in the fling-step dataset are 79.0 tons, 96.0 tons, and 133.0 tons, respectively. These captured deck shear forces show that the set of fling-step magnify the induced shear forces by almost 50% compared with the values obtained under the set of forward directivity. The performed comparison demonstrates that the performance of the developed bridge models having different decks do not perform similar performance under the selected two sets of records. Induced shear forces on the bridge deck resulting from applied seismic action are regarded as a critical factor in earthquake-resistant design phases. Thus, altering the deck type can substantially influence the bridge's design strategy.
7. Conclusions
This study examines the impact of forward-directivity and fling-step ground motions on the seismic performance of reinforced concrete bridges with varying deck slab configurations. Models of bridges with box sections, reinforced concrete girders, and hollow-core slabs are created and exposed to fourteen distinct ground motions, illustrating forward-directivity and fling-step phenomena. All models have identical span lengths and deck widths. The simulation results, evaluated via nonlinear analysis, indicate that the seismic responses induced by forward-directivity records markedly differ from those caused by fling-step records, with the average strain values consistently higher for fling-step records across all bridge models. For the considered different models of bridges excited by the forward-directivity records, the induced columns and deck responses are substantially influenced by the frequency content of the records where records with lowest PGA⁄PGV ratio produces the highest deflection response and vice-versa. However, for fling-step records, the simultaneous effect of both frequency content and pulse period considerably affect the induced deflection response. Regarding the impact of the deck slab type, the simulation results reveal that the deck type substantially affects the bridge's design strategy. More specifically, bridge deck with hollow-core slab is more vulnerable to seismic loads compared with the box-girder one which induces the lowest responses under both types of earthquake records. However, the RC girder bridge model induces intermediate values between the other two models.
Author Contributions
Conceptualization, M.A., S.M. and W.A.; methodology, W.A.; software, M.G.; validation, A.S., M.G. and W.A.; formal analysis, W.A.; investigation, A.S.; resources, M.G.; data curation, S.M.; writing—original draft preparation, S.M.; writing—review and editing, M.A.; visualization, A.S.; funding acquisition, M.A. All authors have read and agreed to the published version of the manuscript.
Funding
The project was funded by KAU Endowment (WAQF) at king Abdulaziz University, Jeddah, Saudi Arabia. The authors, therefore, acknowledge with thanks WAQF and the Deanship of Scientific Research (DSR) for technical and financial support.
Data Availability Statement
The data presented in this study is available on request from the corresponding author.
Conflicts of Interest
The authors declare no conflicts of interest.
References
- Kawashima, K. Damage of bridges resulting from fault rupture in the 1999 Kocaeli and Duzce, Turkey earthquakes and the 1999 Chi-Chi, Taiwan earthquake. Struct. Eng./Earthq. Eng. 2002, 19(2), 179.
- Bray, J.D.; Rodriguez-Marek, A. Characterization of forward-directivity ground motions in the near-fault region. Soil Dyn. Earthq. Eng. 2004, 24(11), 815–828. [CrossRef]
- Makris, N.; Black, C.J. Evaluation of peak ground velocity as a good intensity measure for near-source ground motions. J. Eng. Mech. 2004, 130(9), 1032–1044. [CrossRef]
- Adanur, S.; Altunişik, A.C.; Bayraktar, A. Comparison of near-fault and far-fault ground motion effects on geometrically nonlinear earthquake behavior of suspension bridges. Nat. Hazards 2012, 64, 593–614. [CrossRef]
- Yadav, K.K.; Gupta, V.K. Near-fault fling-step ground motions: Characteristics and simulation. Soil Dyn. Earthq. Eng. 2017, 101, 90–104. [CrossRef]
- Mahmoud, S.; Alqarni, A.; Saliba, J.; Ibrahim, A.H.; Genidy, M.; Diab, H. Influence of floor system on seismic behavior of RC buildings to forward directivity and fling-step in the near-fault region. Structures 2021, 30, 2803–2817. [CrossRef]
- Gorai, S.; Maity, D. Seismic response of concrete gravity dams under near-field and far-field ground motions. Eng. Struct. 2019, 196, 109292. [CrossRef]
- Park, S.W.; Ghasemi, H.; Shen, J.; et al. Simulation of the seismic performance of the Bolu Viaduct subjected to near-fault ground motions. Earthq. Eng. Struct. Dyn. 2004, 33(13), 1249–1270. [CrossRef]
- Shen, J.; Tsai, M.H.; Chang, K.C.; Lee, G.C. Performance of a seismically isolated bridge under near-fault earthquake ground motions. J. Struct. Eng. 2004, 130(6), 861–868. [CrossRef]
- Wang, J.; Zou, X.; Yan, X.; et al. Integrated analysis model for the seismic responses of cable-stayed bridges near active faults. J. Earthq. Tsunami 2015, 9(1), 1550002. [CrossRef]
- Pan, Y.; Shi, S.; Chang, Z.; Hu, S. Quantitative study on amplification effect of base isolated structures subjected to near-fault pulse-like ground motions. China Civ. Eng. J. 2018, 51(11), 8–16.
- Ma, H.; Zhuo, W.; Gu, Y. Displacement response analysis of regular highway girder bridges under near-fault pulse-type ground motions. Chin. J. Highw. Transp. 2017, 30(12), 139–149.
- Liao, W.I.; Loh, C.H.; Wan, S.; Jean, W.Y.; Chai, J.F. Dynamic responses of bridges subjected to near-fault ground motions. J. Chin. Inst. Eng. 2000, 23, 455–464. [CrossRef]
- Liao, W.I.; Loh, C.H.; Lee, B.H. Comparison of dynamic response of isolated and non-isolated continuous girder bridges subjected to near-fault ground motions. Eng. Struct. 2004, 26, 2173–2183. [CrossRef]
- Jónsson, M.H.; Bessason, B.; Haflidason, E. Earthquake response of a base-isolated bridge subjected to strong near-fault ground motion. Soil Dyn. Earthq. Eng. 2010, 30, 447–455. [CrossRef]
- Brown, A.; Saiidi, M.S. Investigation of effect of near-fault motions on substandard bridge structures. Earthq. Eng. Eng. Vib. 2011, 10, 1–11. [CrossRef]
- Jalali, R.S.; Jokandan, M.S.; Trifunac, M.D. Earthquake response of a three-span simply supported bridge to near-field pulse and permanent-displacement step. Soil Dyn. Earthq. Eng. 2012, 43, 380–397. [CrossRef]
- Yasrebi, L.; Ghafory-Ashtiany, M. Inelastic response of a long-span bridge under asynchronous near-field pulse-like and far-field excitations. J. Seism. Earthq. Eng. 2014, 16(2).
- Mosleh, A.; Razzaghi, M.S.; Jara, J.; Varum, H. Seismic fragility analysis of typical pre-1990 bridges due to near- and far-field ground motions. Int. J. Adv. Struct. Eng. 2016, 8, 1–9. https://rdcu.be/dVBmm.
- Chen, X.; Xiang, N.L.; Li, J.Z.; Guan, Z.G. Influence of near-fault pulse-like motion characteristics on seismic performance of tall pier bridges with fragility analysis. J. Earthq. Eng. 2022, 26(4), 2001–2022. [CrossRef]
- Li, J.; Xu, L.H. Seismic response characteristics and whiplash effect mechanism of continuous rigid-frame bridges subjected to near-fault ground motions. Bull. Earthq. Eng. 2023, 21, 3719–3744. [CrossRef]
- Zheng, S.X.; Shi, X.H.; Jia, H.Y.; Zhao, C.H.; Qu, H.L.; Shi, X.L. Seismic response analysis of long-span and asymmetrical suspension bridges subjected to near-fault ground motion. Eng. Fail. Anal. 2020, 115, 104615. [CrossRef]
- Xin, L.; Li, X.; Zhang, Z.; Zhao, L. Seismic behavior of long-span concrete-filled steel tubular arch bridge subjected to near-fault fling-step motions. Eng. Struct. 2019, 180, 148–159. [CrossRef]
- Bi, K.; Hao, H.; Ren, W.X. Seismic response of a concrete-filled steel tubular arch bridge to spatially varying ground motions including local site effect. Adv. Struct. Eng. 2013, 16, 1799–1817. [CrossRef]
- Zhang, D.Y.; Li, X.; Yan, W.M.; Xie, W.C.; Pandey, M.D. Stochastic seismic analysis of a concrete-filled steel tubular (CFST) arch bridge under tri-directional multiple excitations. Eng. Struct. 2013, 52, 355–371. [CrossRef]
- Li, X.; Zhang, D.Y.; Yan, W.M.; Xie, W.C.; Pandey, M.D. Effects of model updating on the estimation of stochastic seismic response of a concrete-filled steel tubular arch bridge. Struct. Infrastruct. Eng. 2014, 10, 1620–1637. [CrossRef]
- Computers and Structures, Inc. CSiBridge: Integrated 3D Bridge Analysis, Design and Rating Software, Version 26.0.0; Computers and Structures, Inc.: Berkeley, CA, USA, 2024. Available online: https://www.csiamerica.com/.
- Egyptian Code of Practice. ECP 2012—Egyptian Code for Calculating Loads and Forces in Structural Work and Masonry, ECP-201; Housing and Building National Research Centre: Cairo, Egypt, 2012.
- Kianoush, M.R.; Ghaemmaghami, A.R. The effect of earthquake frequency content on the seismic behavior of concrete rectangular liquid tanks using the finite element method incorporating soil–structure interaction. Eng. Struct. 2011, 33, 2186–2200. [CrossRef]
- Kalkan, E.; Kunnath, S.K. Effects of fling-step and forward directivity on seismic response of buildings. Earthq. Spectra 2006, 22, 367–390. [CrossRef]
- Elsokkary, H. Nonlinear behaviour of FRP-retrofitted RC coupled shear walls. Structures 2022, 47, 324. [CrossRef]
- Fang, C.; Zhong, Q.; Wang, W.; Hu, S.; Qiu, C. Peak and residual responses of steel moment-resisting and braced frames under pulse-like near-fault earthquakes. Eng. Struct. 2018, 177, 579–597. [CrossRef]
- Loh, C.H.; Wan, S.; Liao, W.I. Effects of hysteretic model on seismic demands: Consideration of near-fault ground motions. Struct. Des. Tall Spec. Build. 2002, 11, 155–169. [CrossRef]
Figure 1.
Longitudinal-sections of the considered bridge models with different decks as (a) box-girder (b) RC girder and (c) hollow-core.
Figure 1.
Longitudinal-sections of the considered bridge models with different decks as (a) box-girder (b) RC girder and (c) hollow-core.
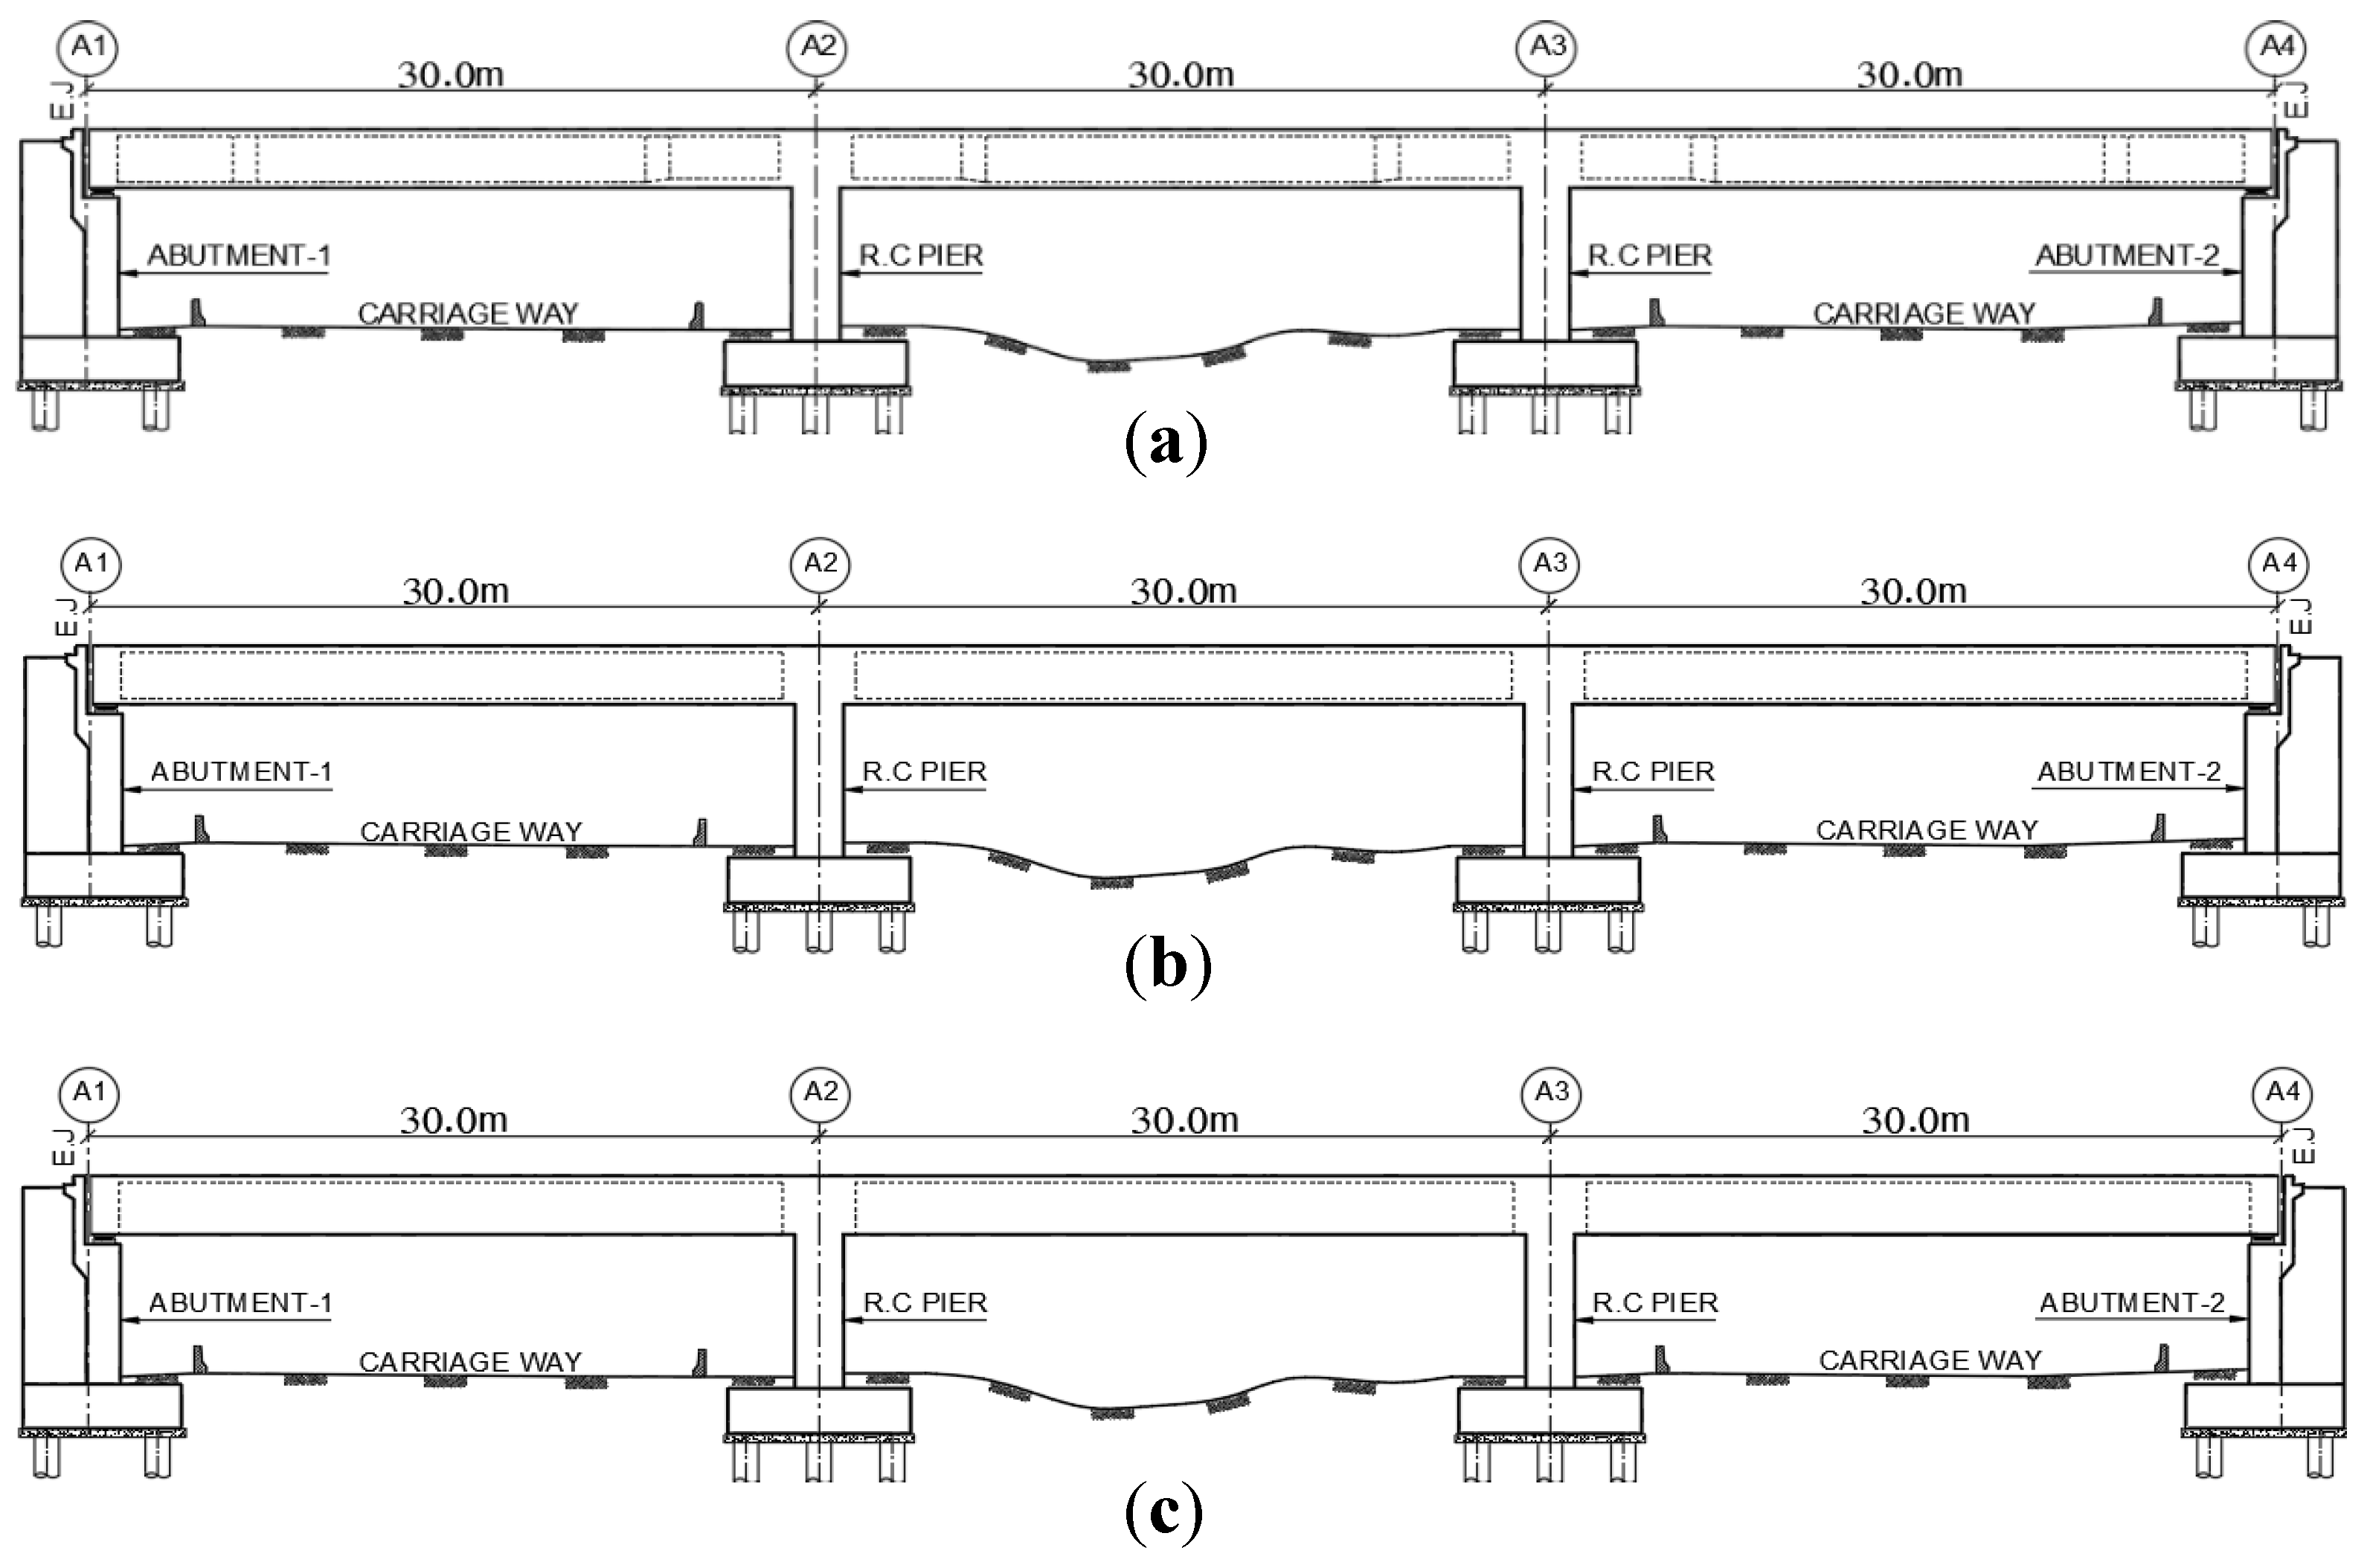
Figure 2.
Cross-sections of the considered different decks as (a) box-girder (b) RC girder and (c) hollow-core.
Figure 2.
Cross-sections of the considered different decks as (a) box-girder (b) RC girder and (c) hollow-core.
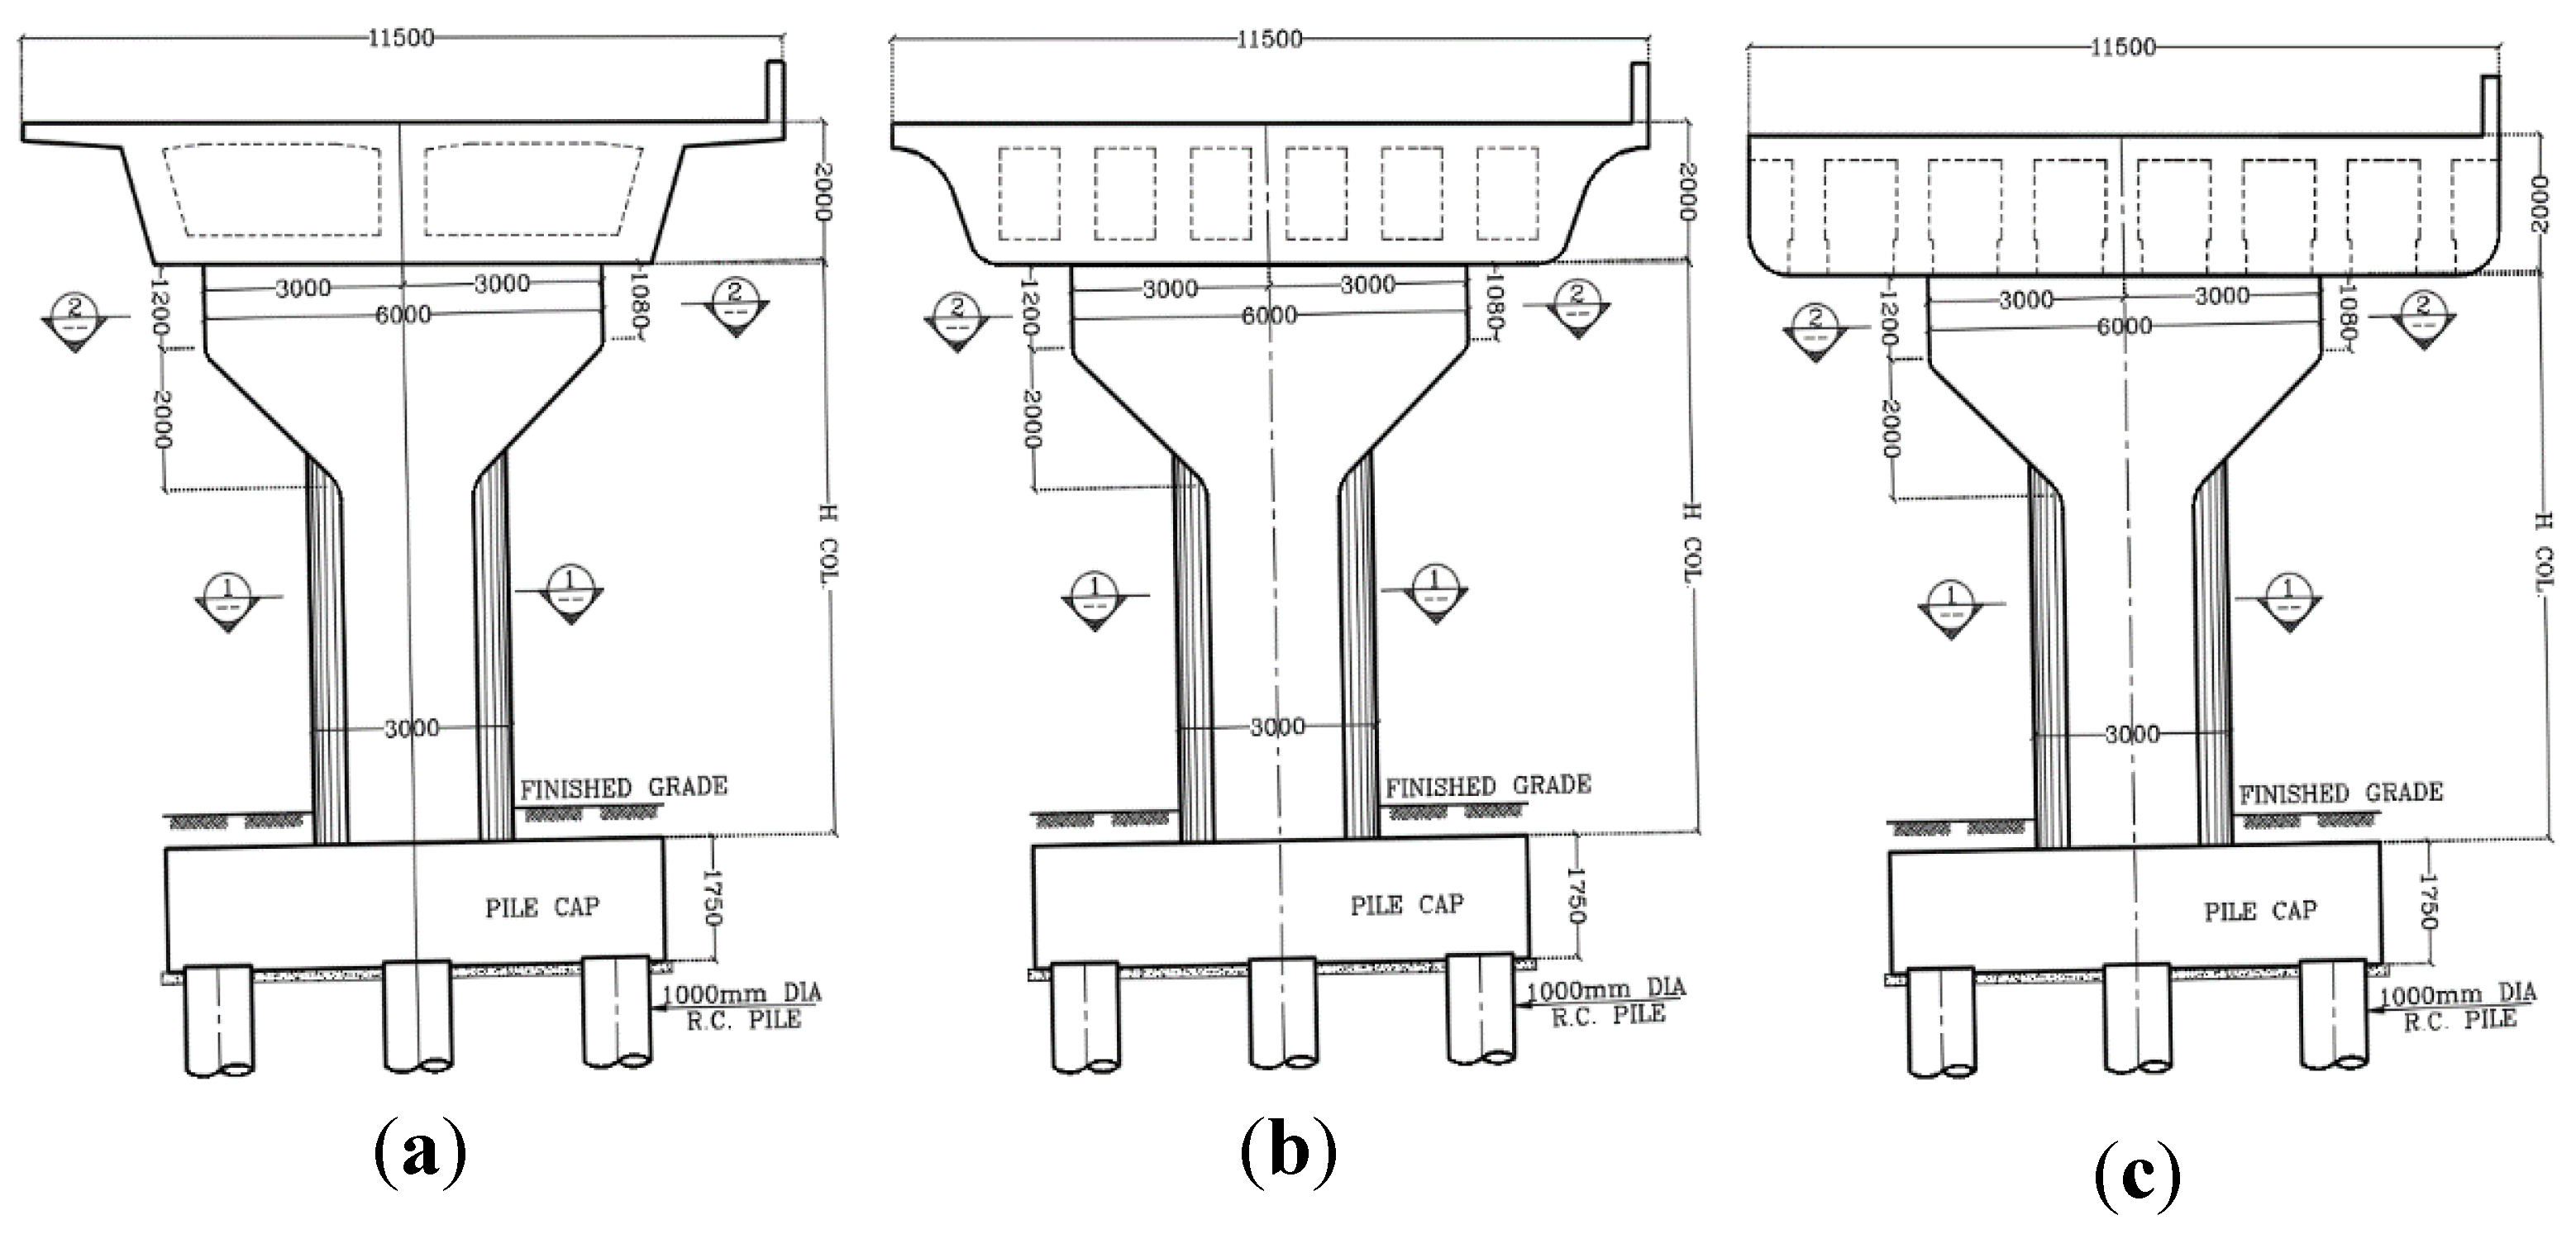
Figure 3.
Schematic diagram of longitudinal and transverse reinforcement of supporting column.
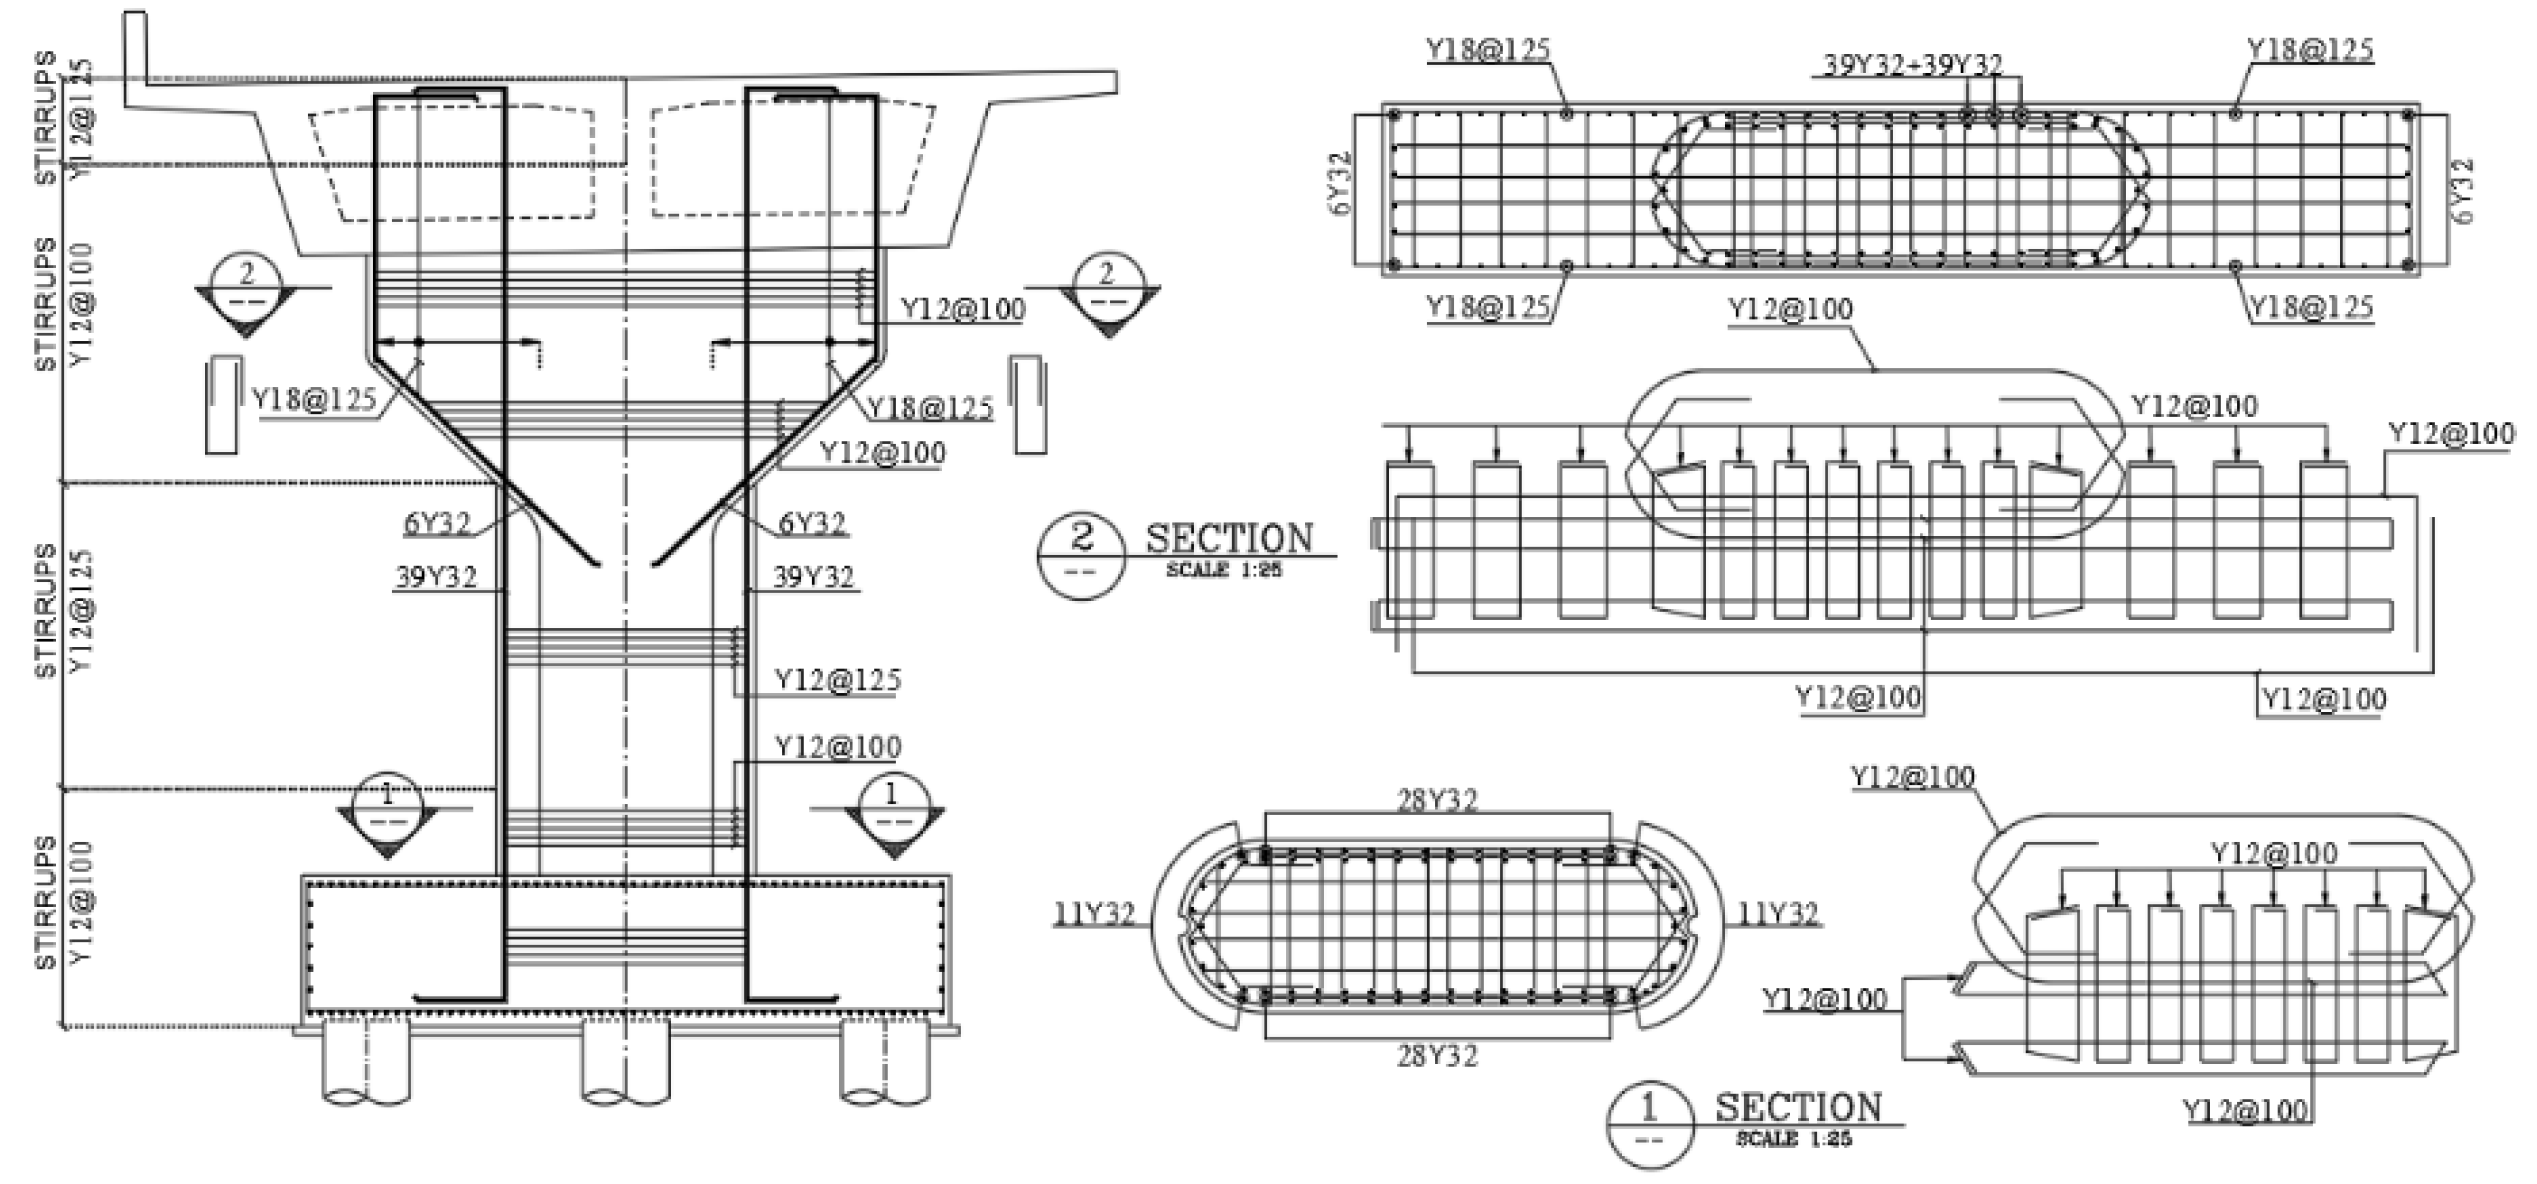
Figure 4.
Schematic diagram of longitudinal and transverse reinforcement of the abutment.
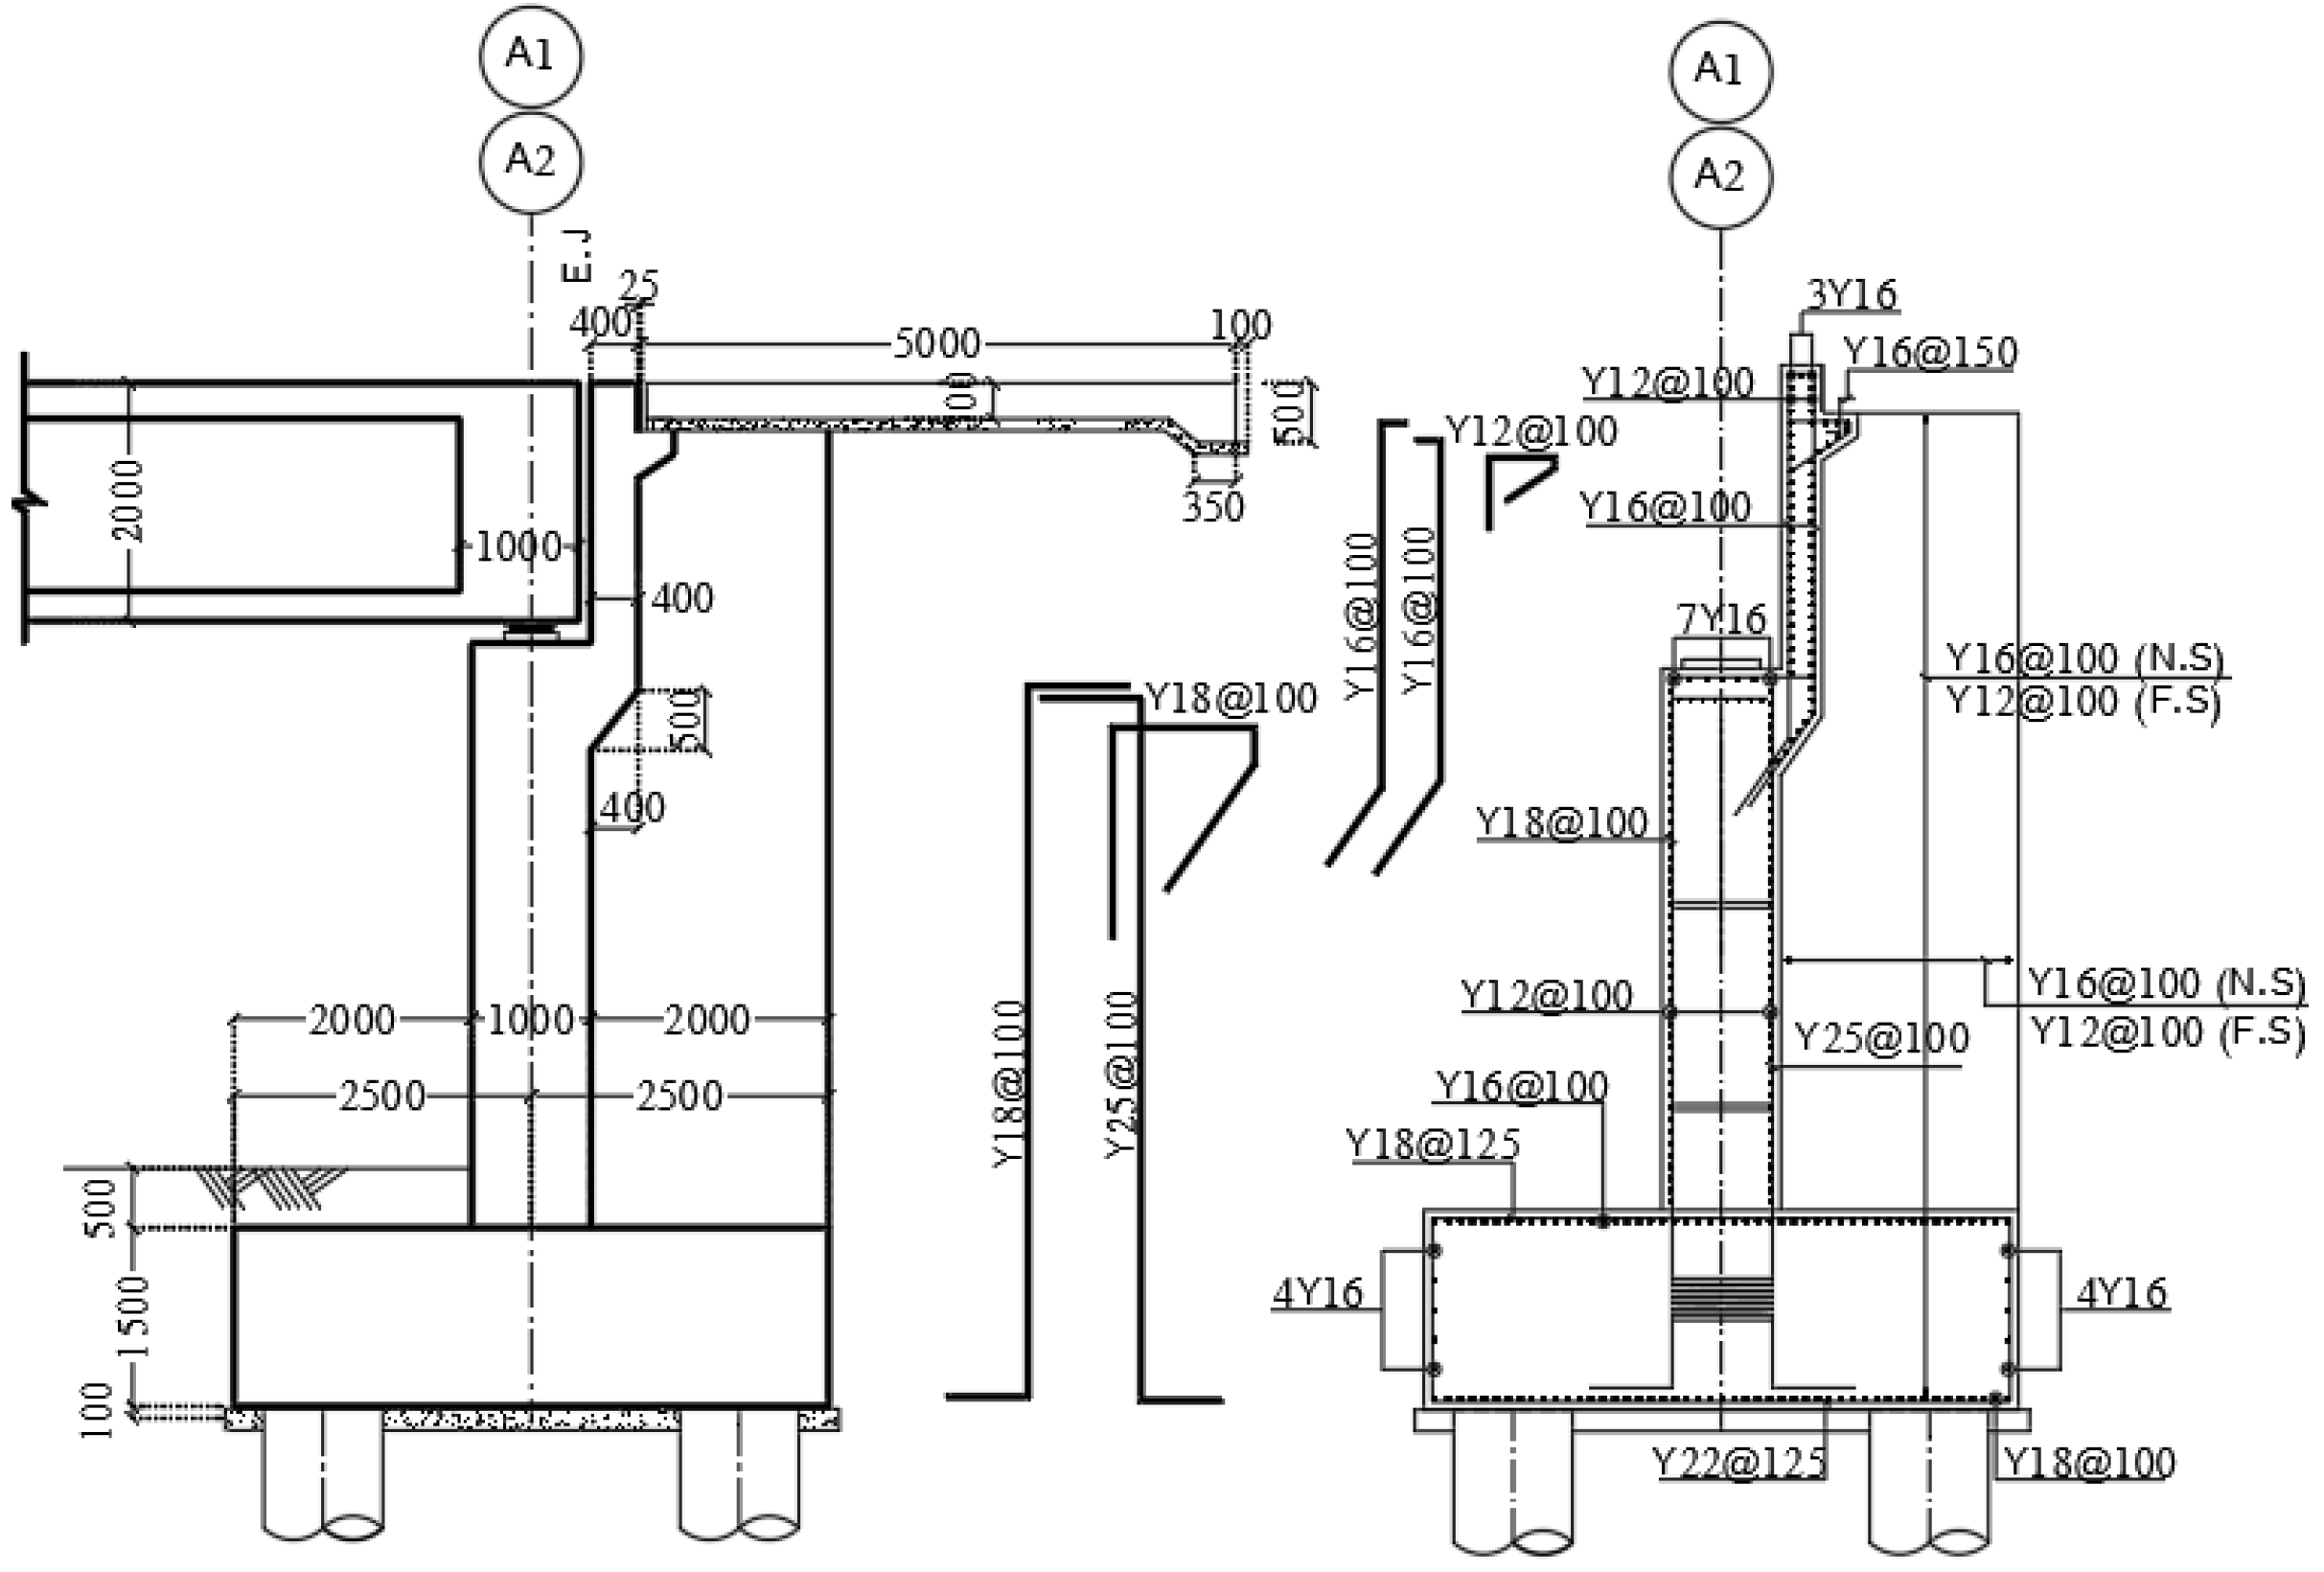
Figure 5.
Developed bridge deck slab system models as (a) box-girder (b) hollow-core and (c) RC girder.
Figure 5.
Developed bridge deck slab system models as (a) box-girder (b) hollow-core and (c) RC girder.
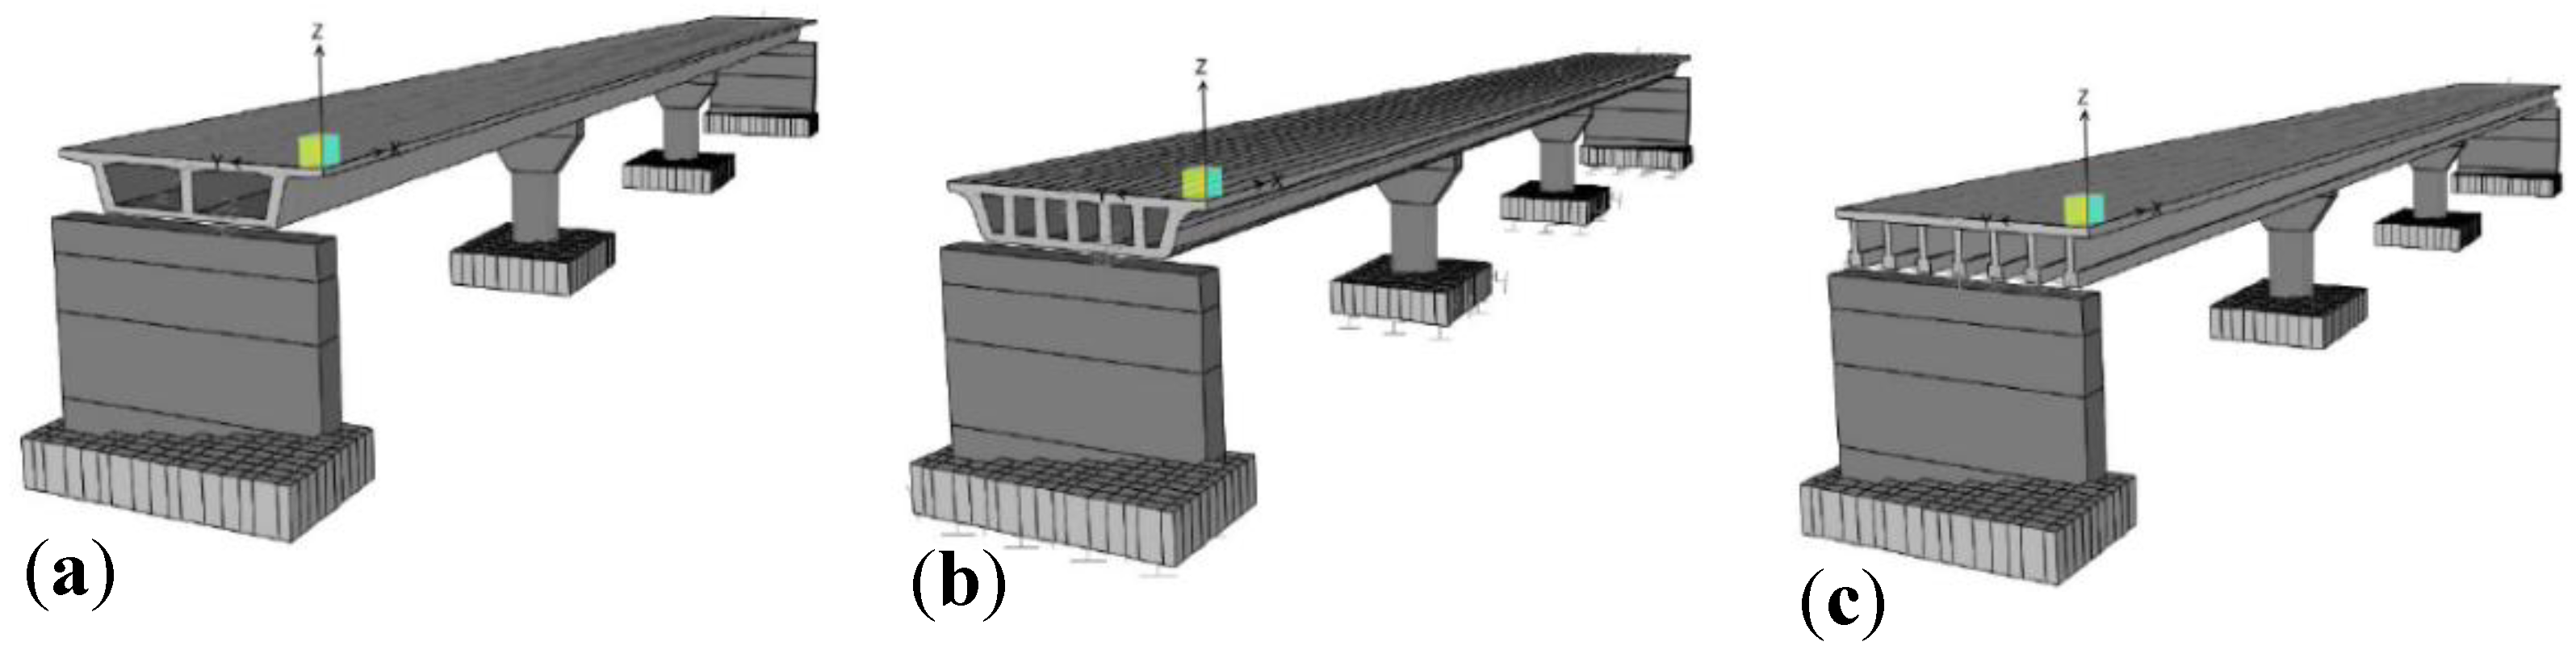
Figure 6.
Grillage model of box-girder bridge.
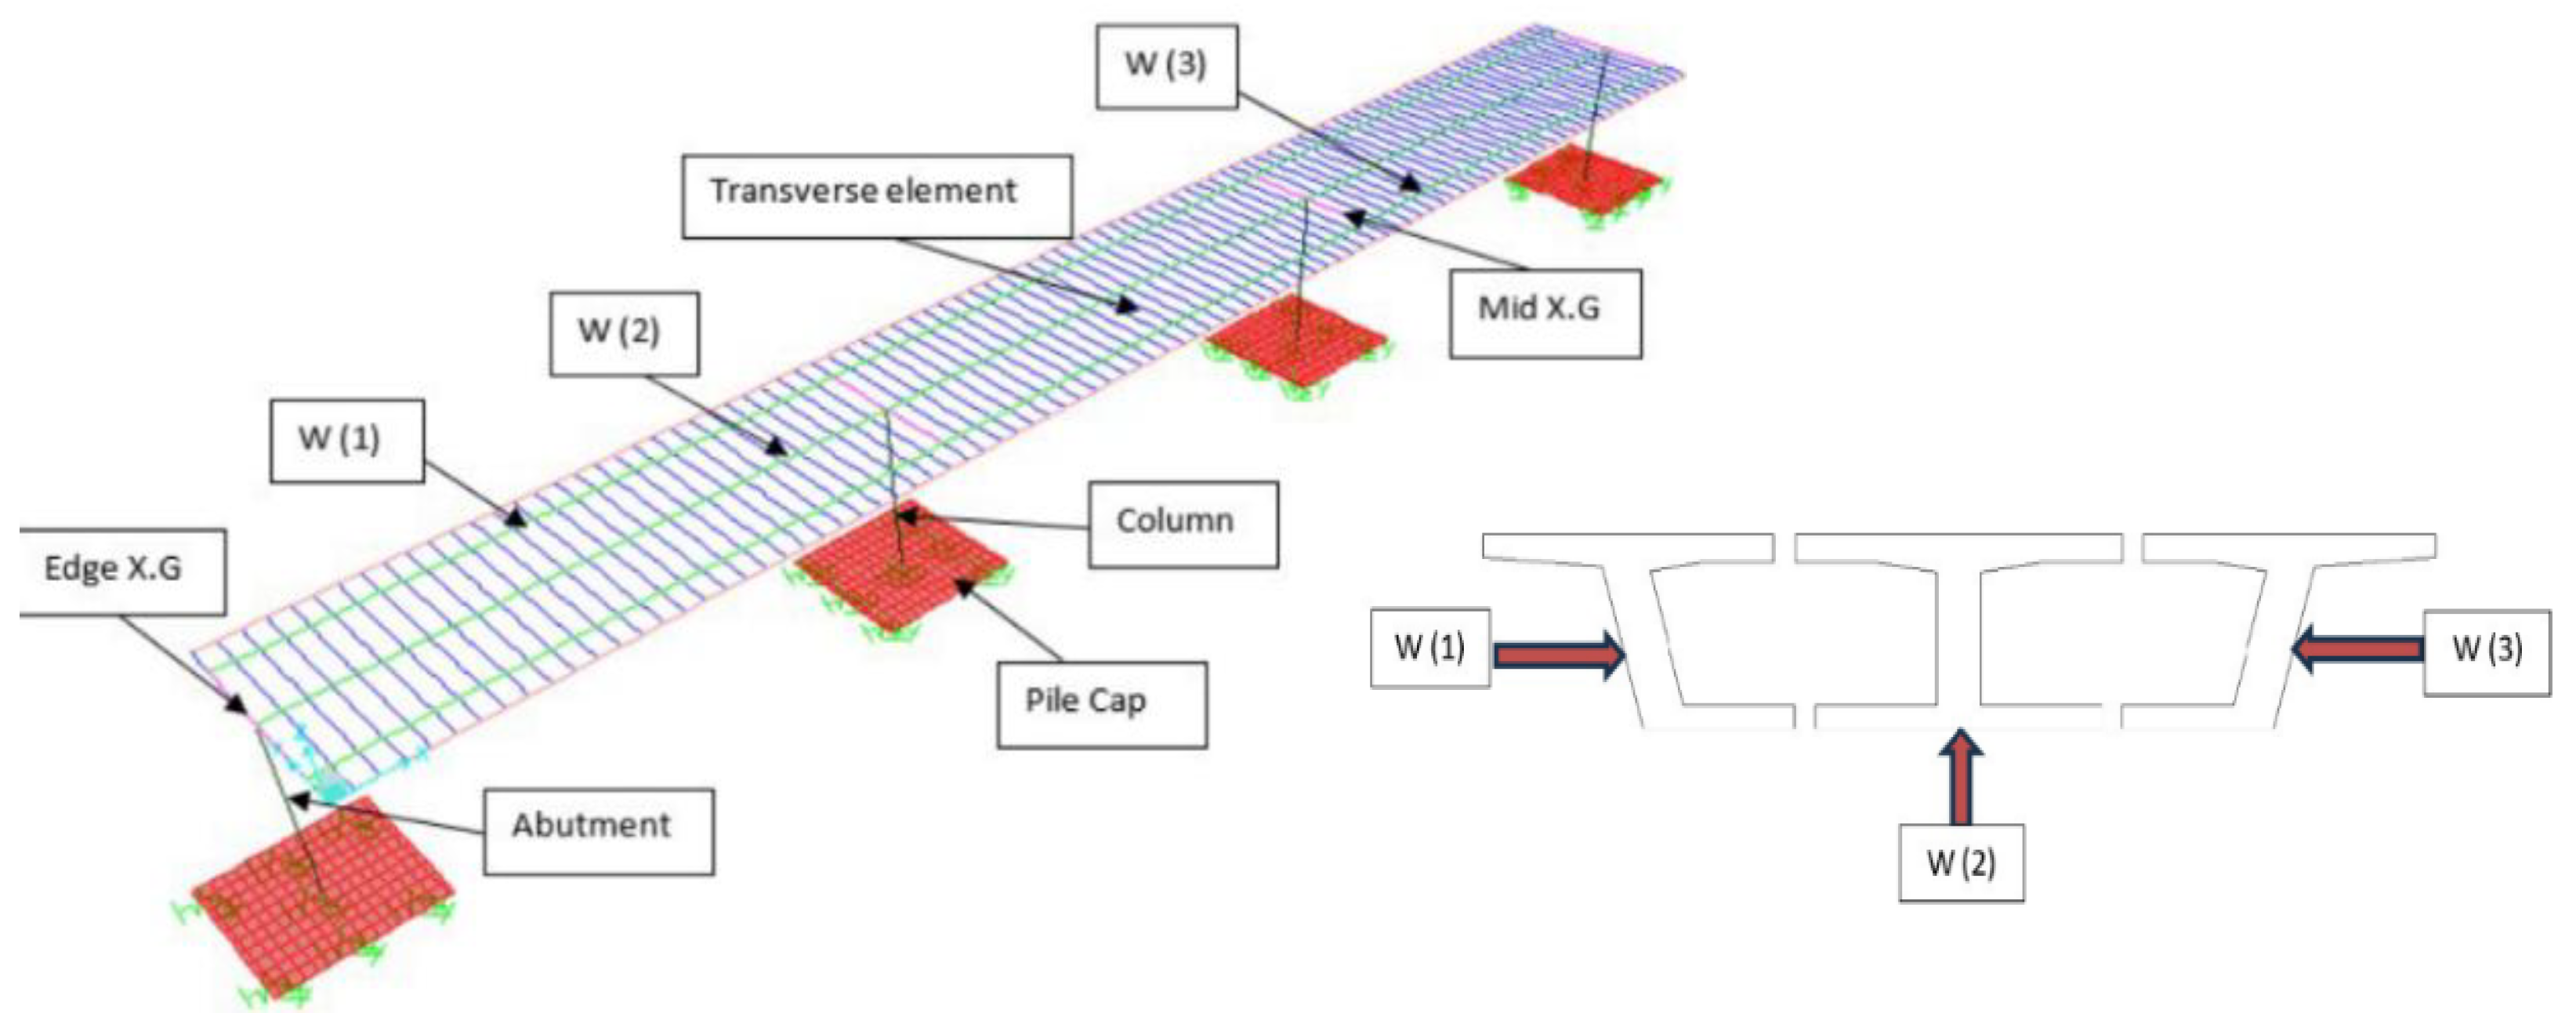
Figure 7.
Grillage model of hollow-core bridge.
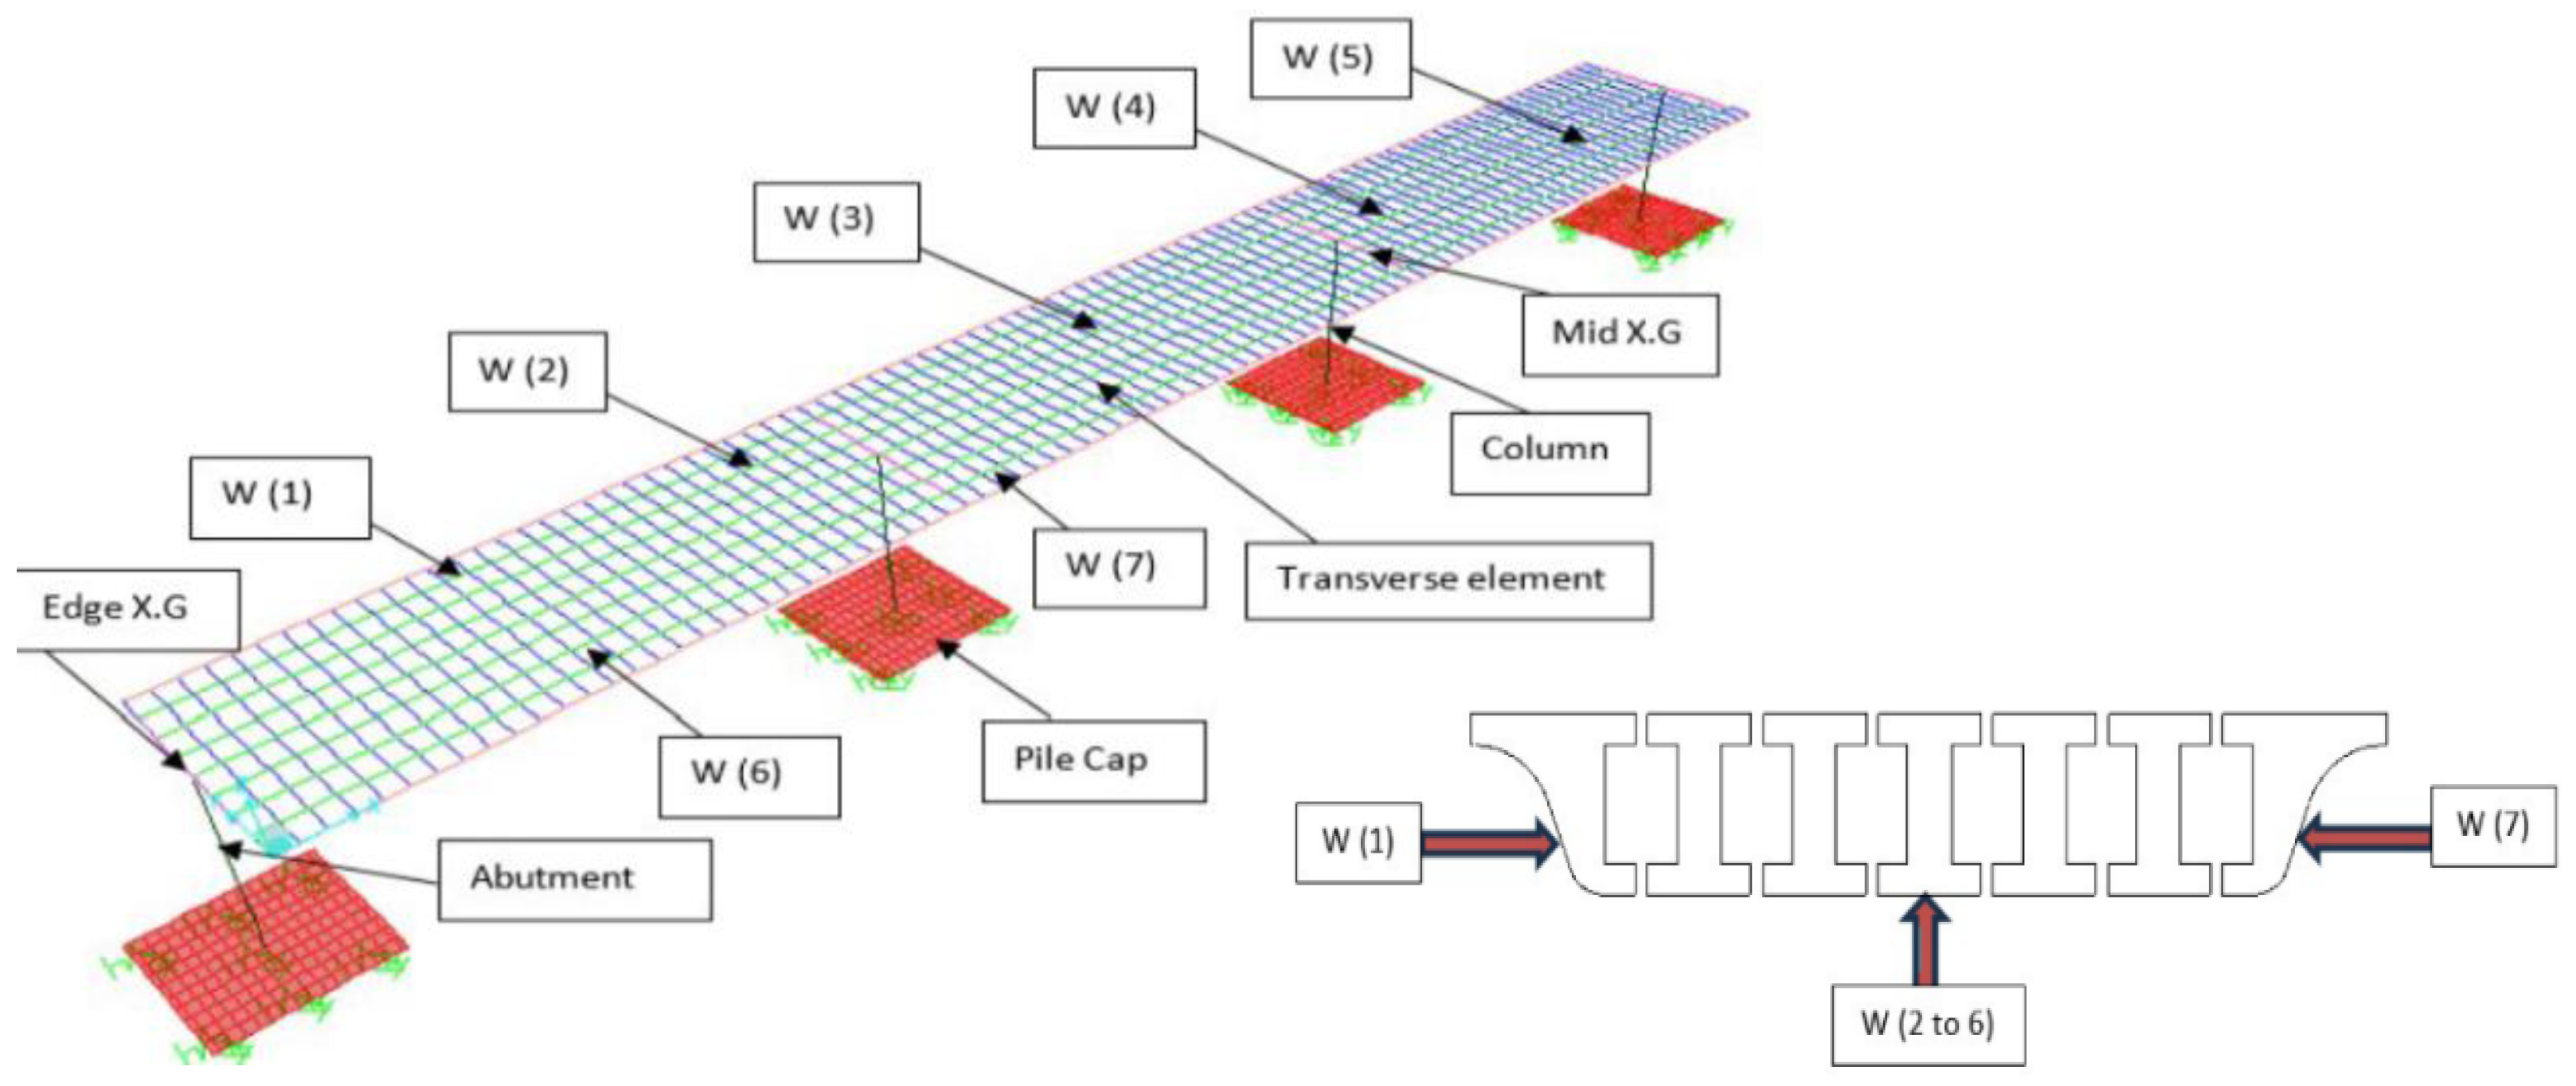
Figure 8.
Grillage model of RC girder bridge.
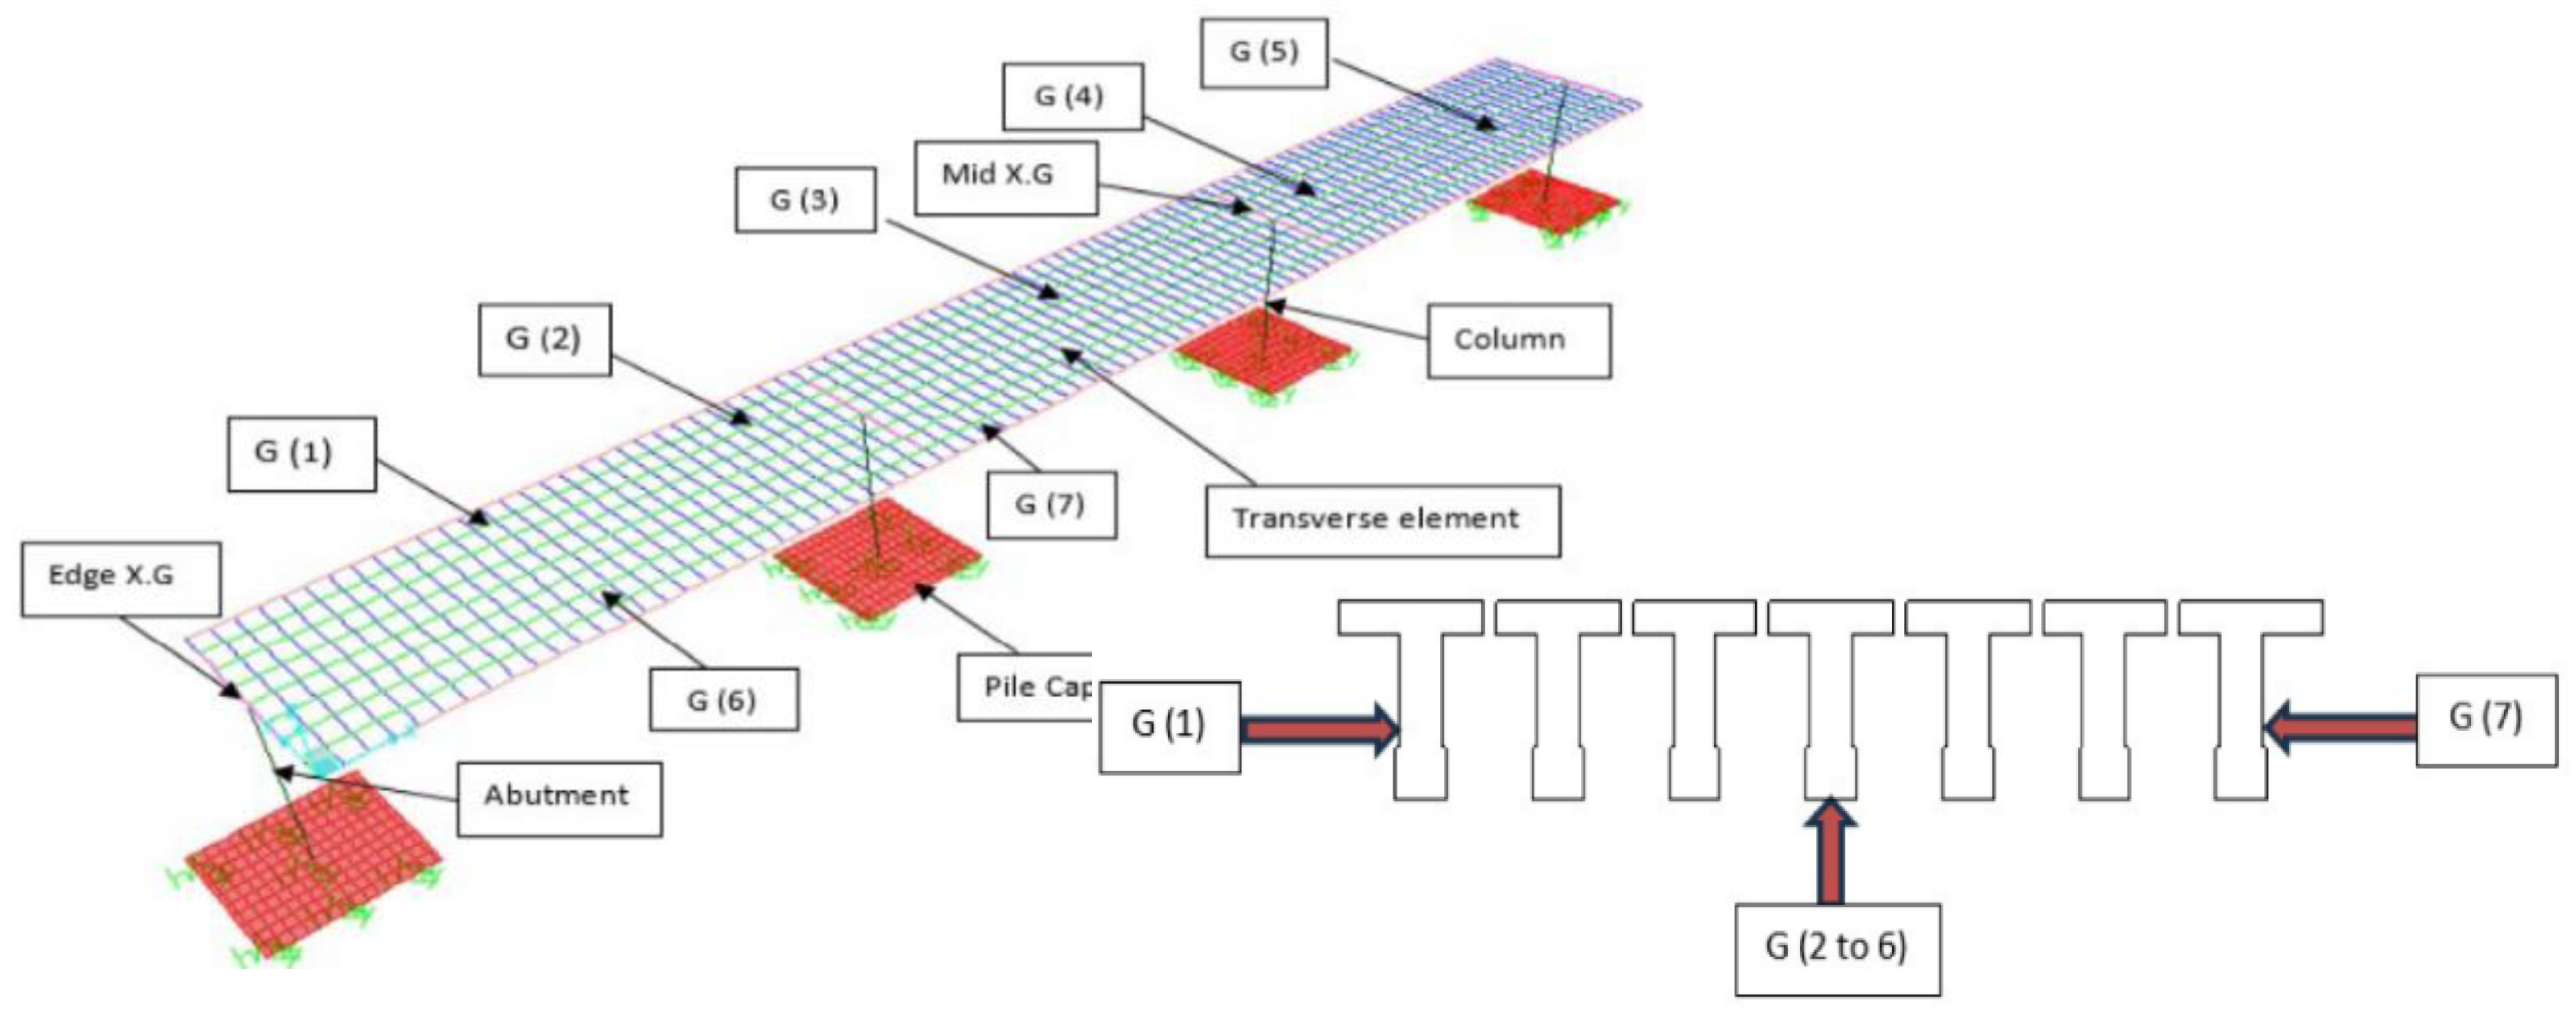
Figure 9.
Stress-strain relation for (a) concrete and (b) steel.
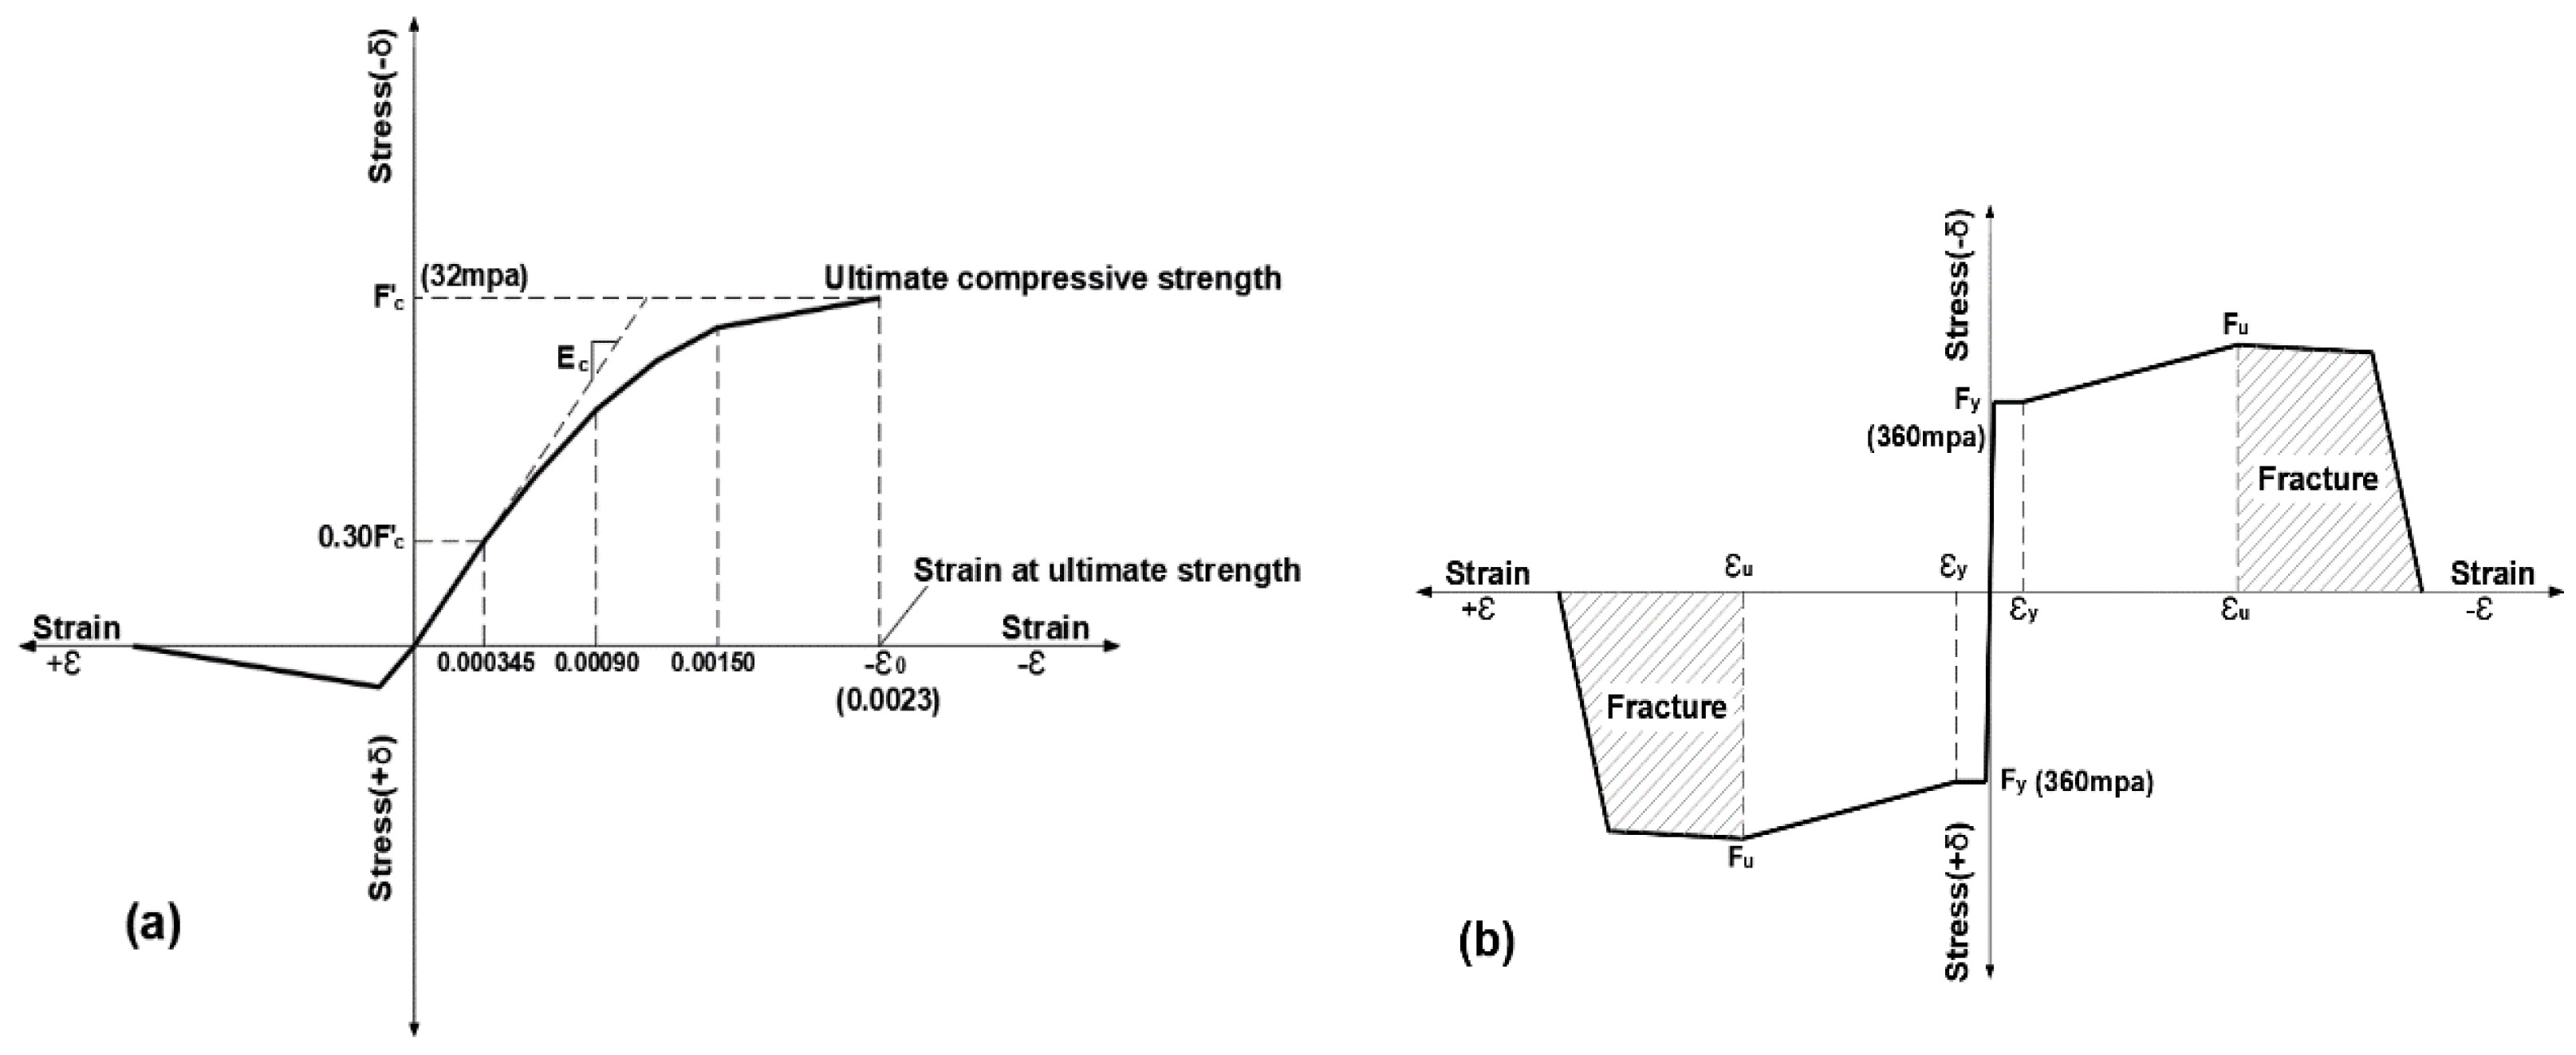
Figure 10.
Idealized force-deformation relationship of the isolation system.
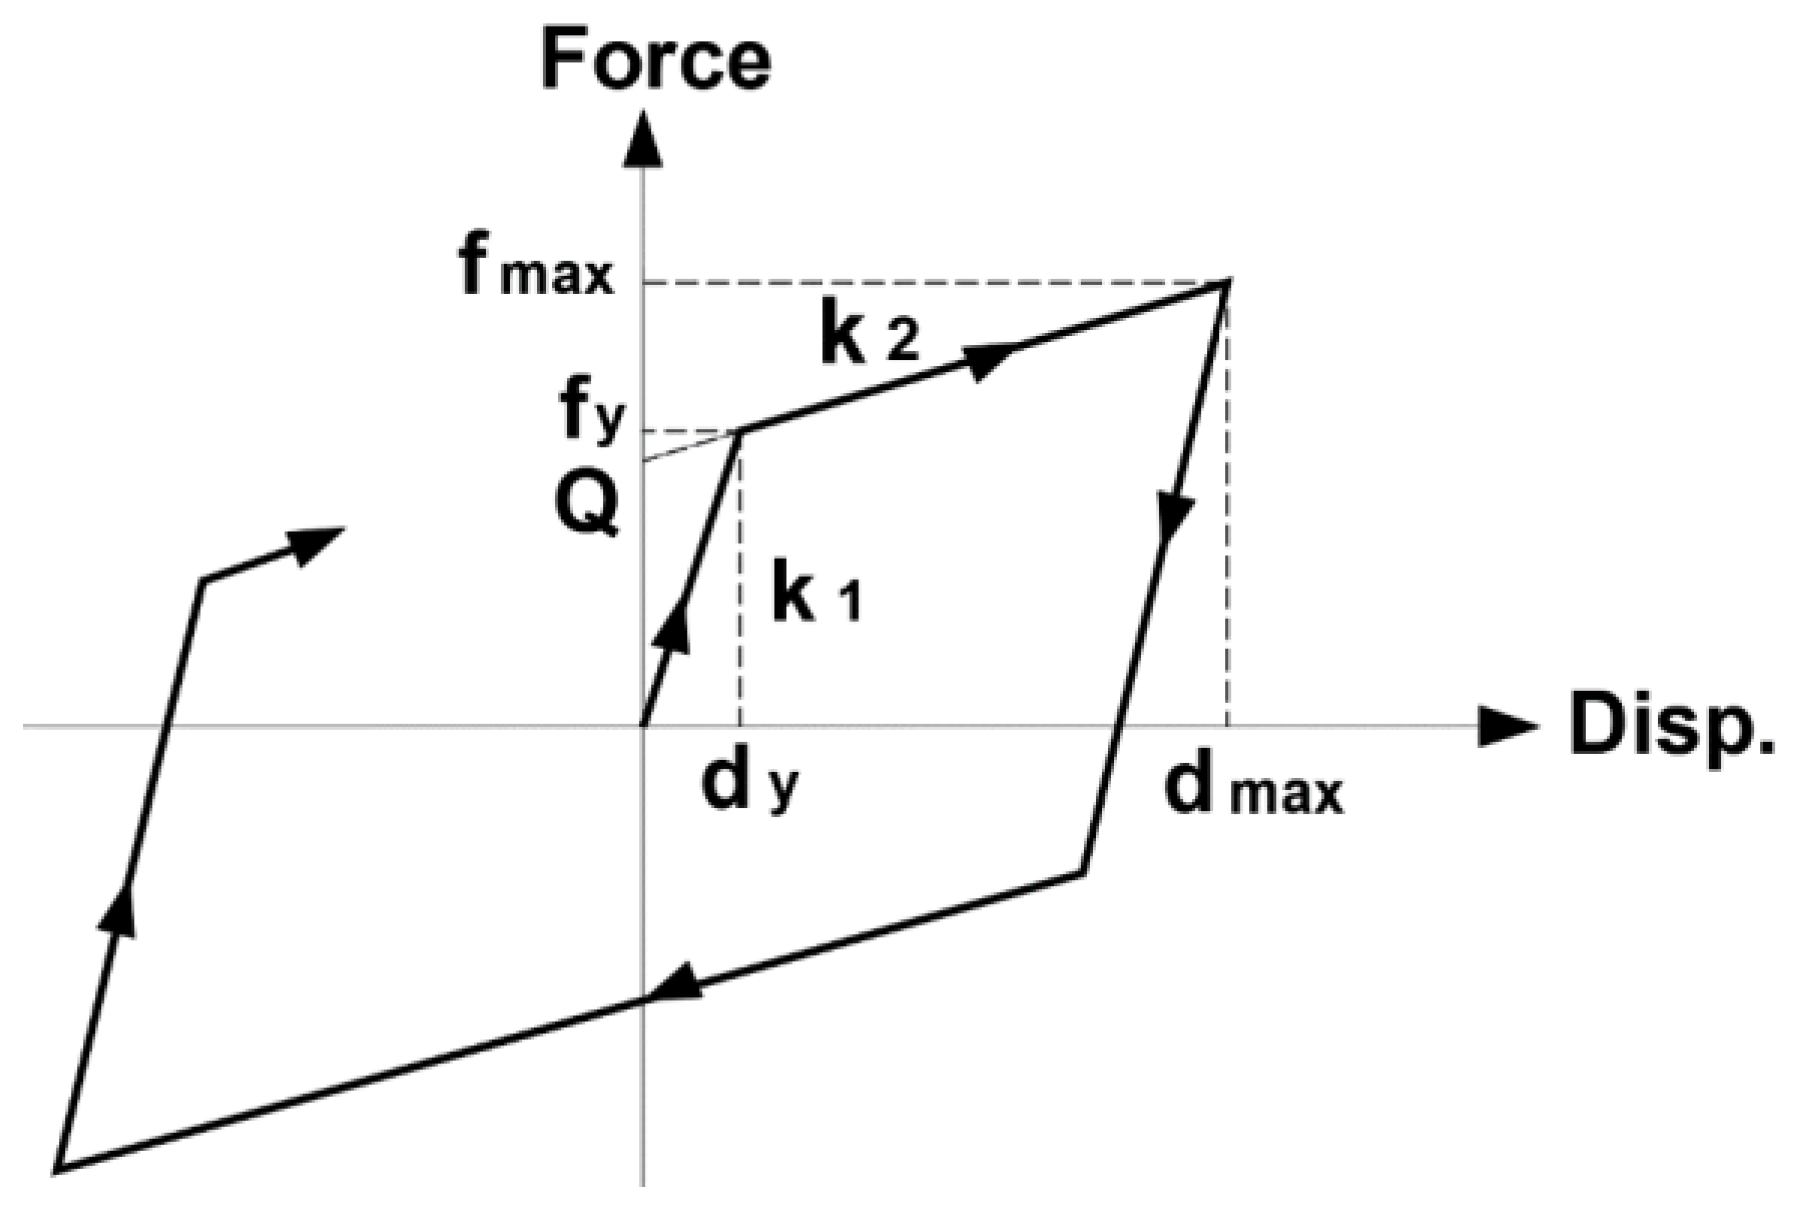
Figure 11.
The Northridge-RRS and Chi-Chi-EW TCU052 acceleration and velocity time history records serve as exemplars of forward directivity and fling-step recordings, respectively.
Figure 11.
The Northridge-RRS and Chi-Chi-EW TCU052 acceleration and velocity time history records serve as exemplars of forward directivity and fling-step recordings, respectively.
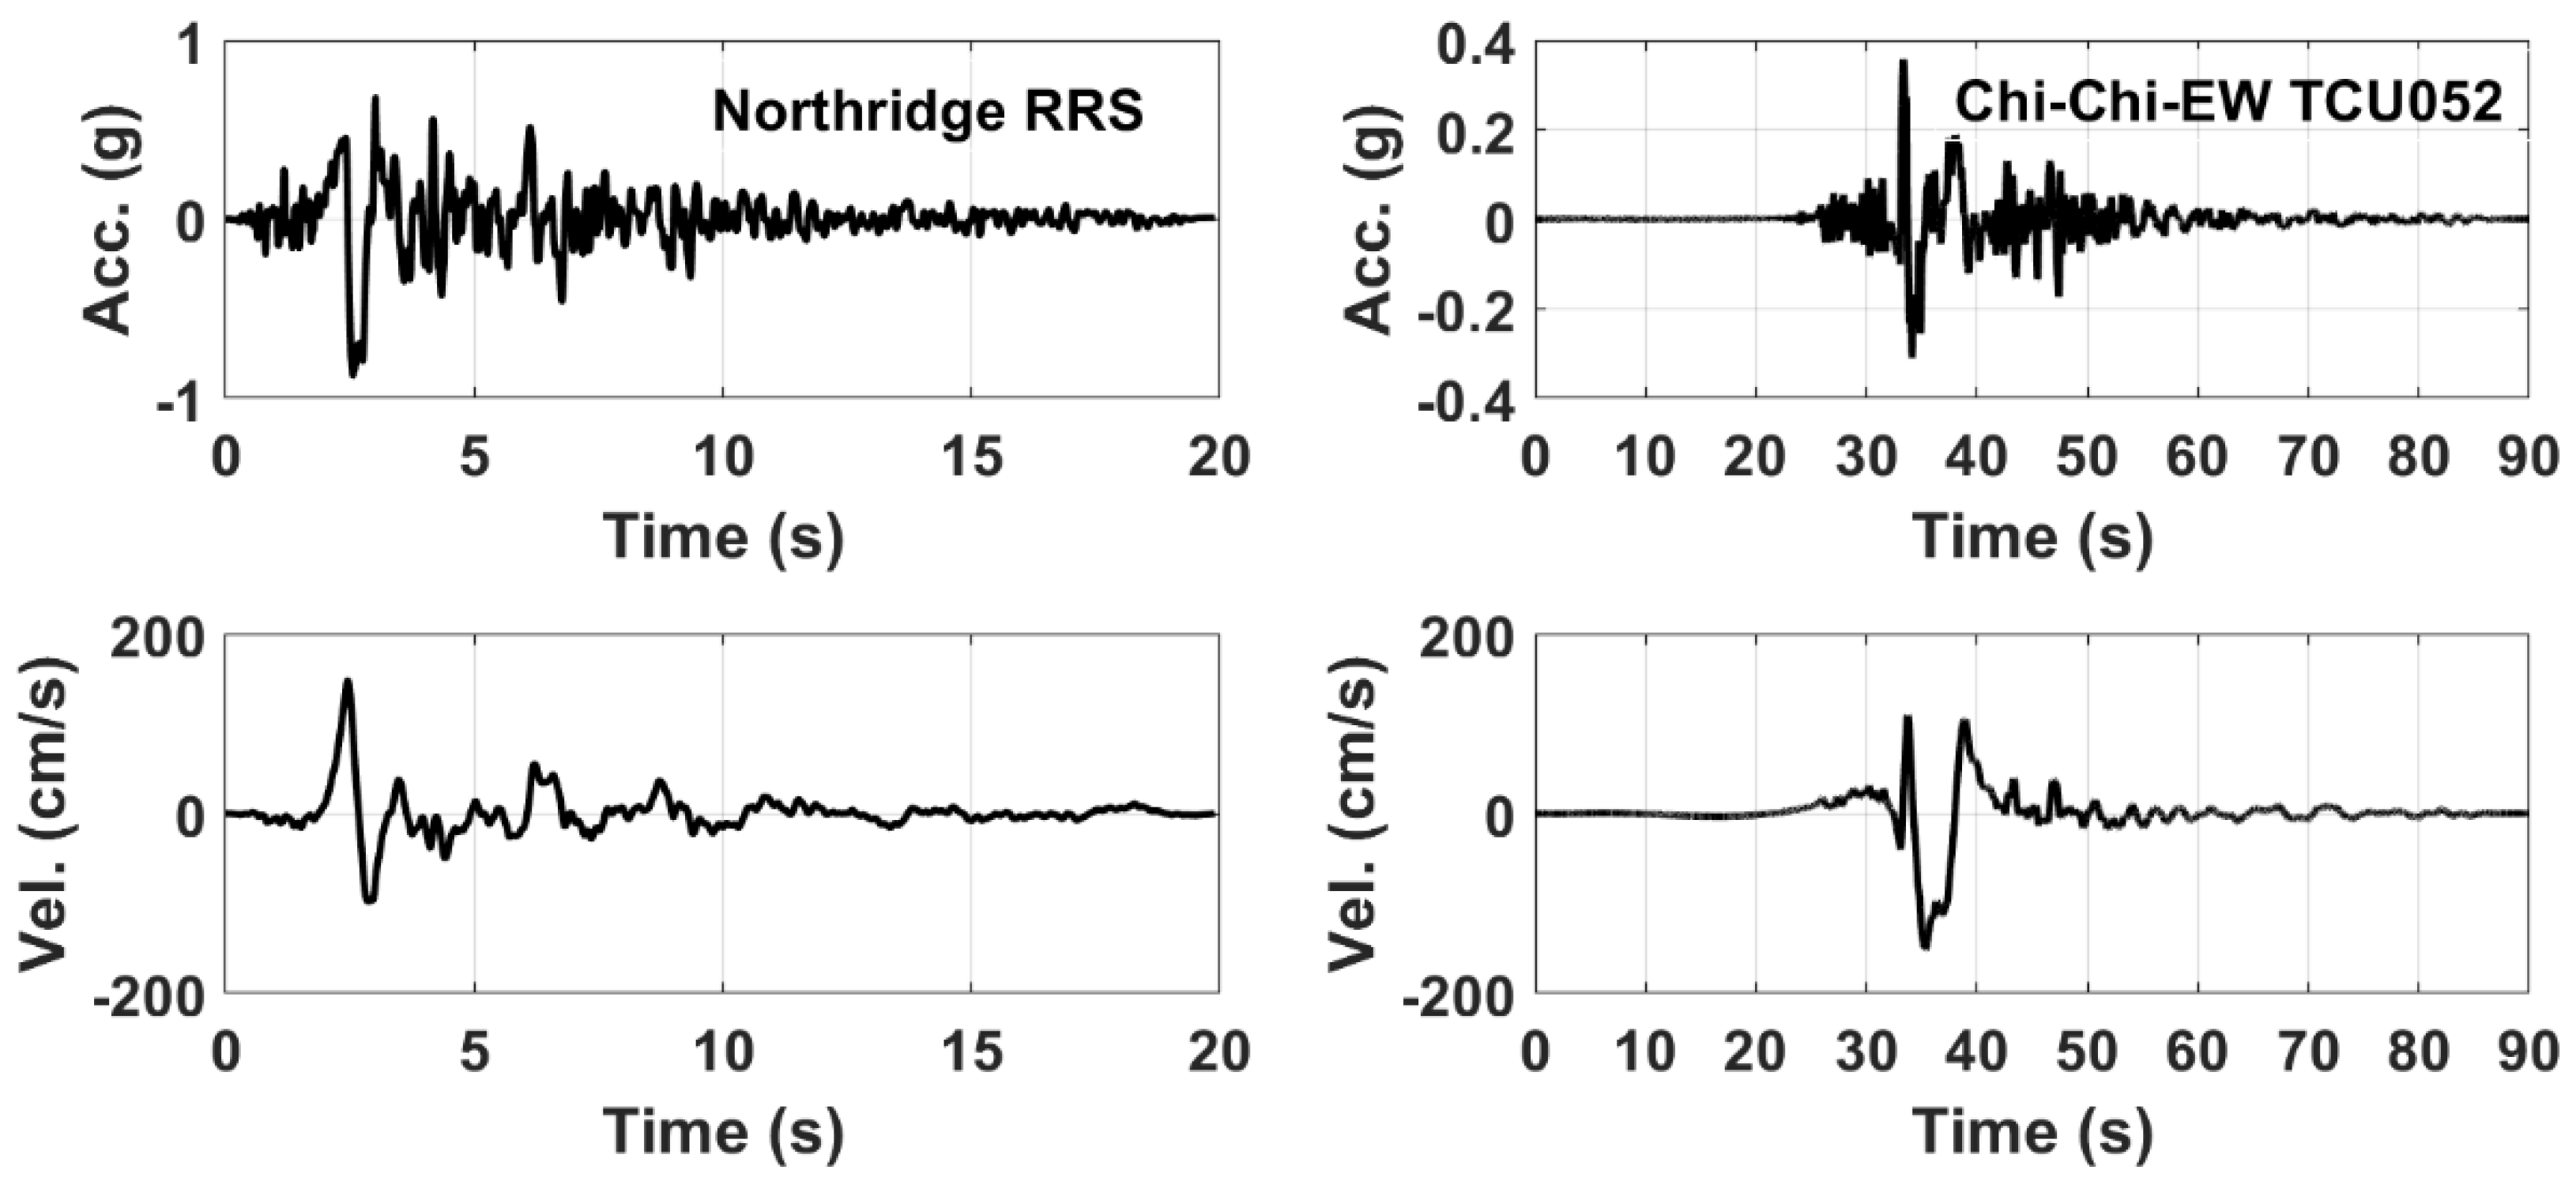
Figure 12.
Grillage model of (a) Box girder, (b) RC beams, and (c) hollow-core deck slab bridges.
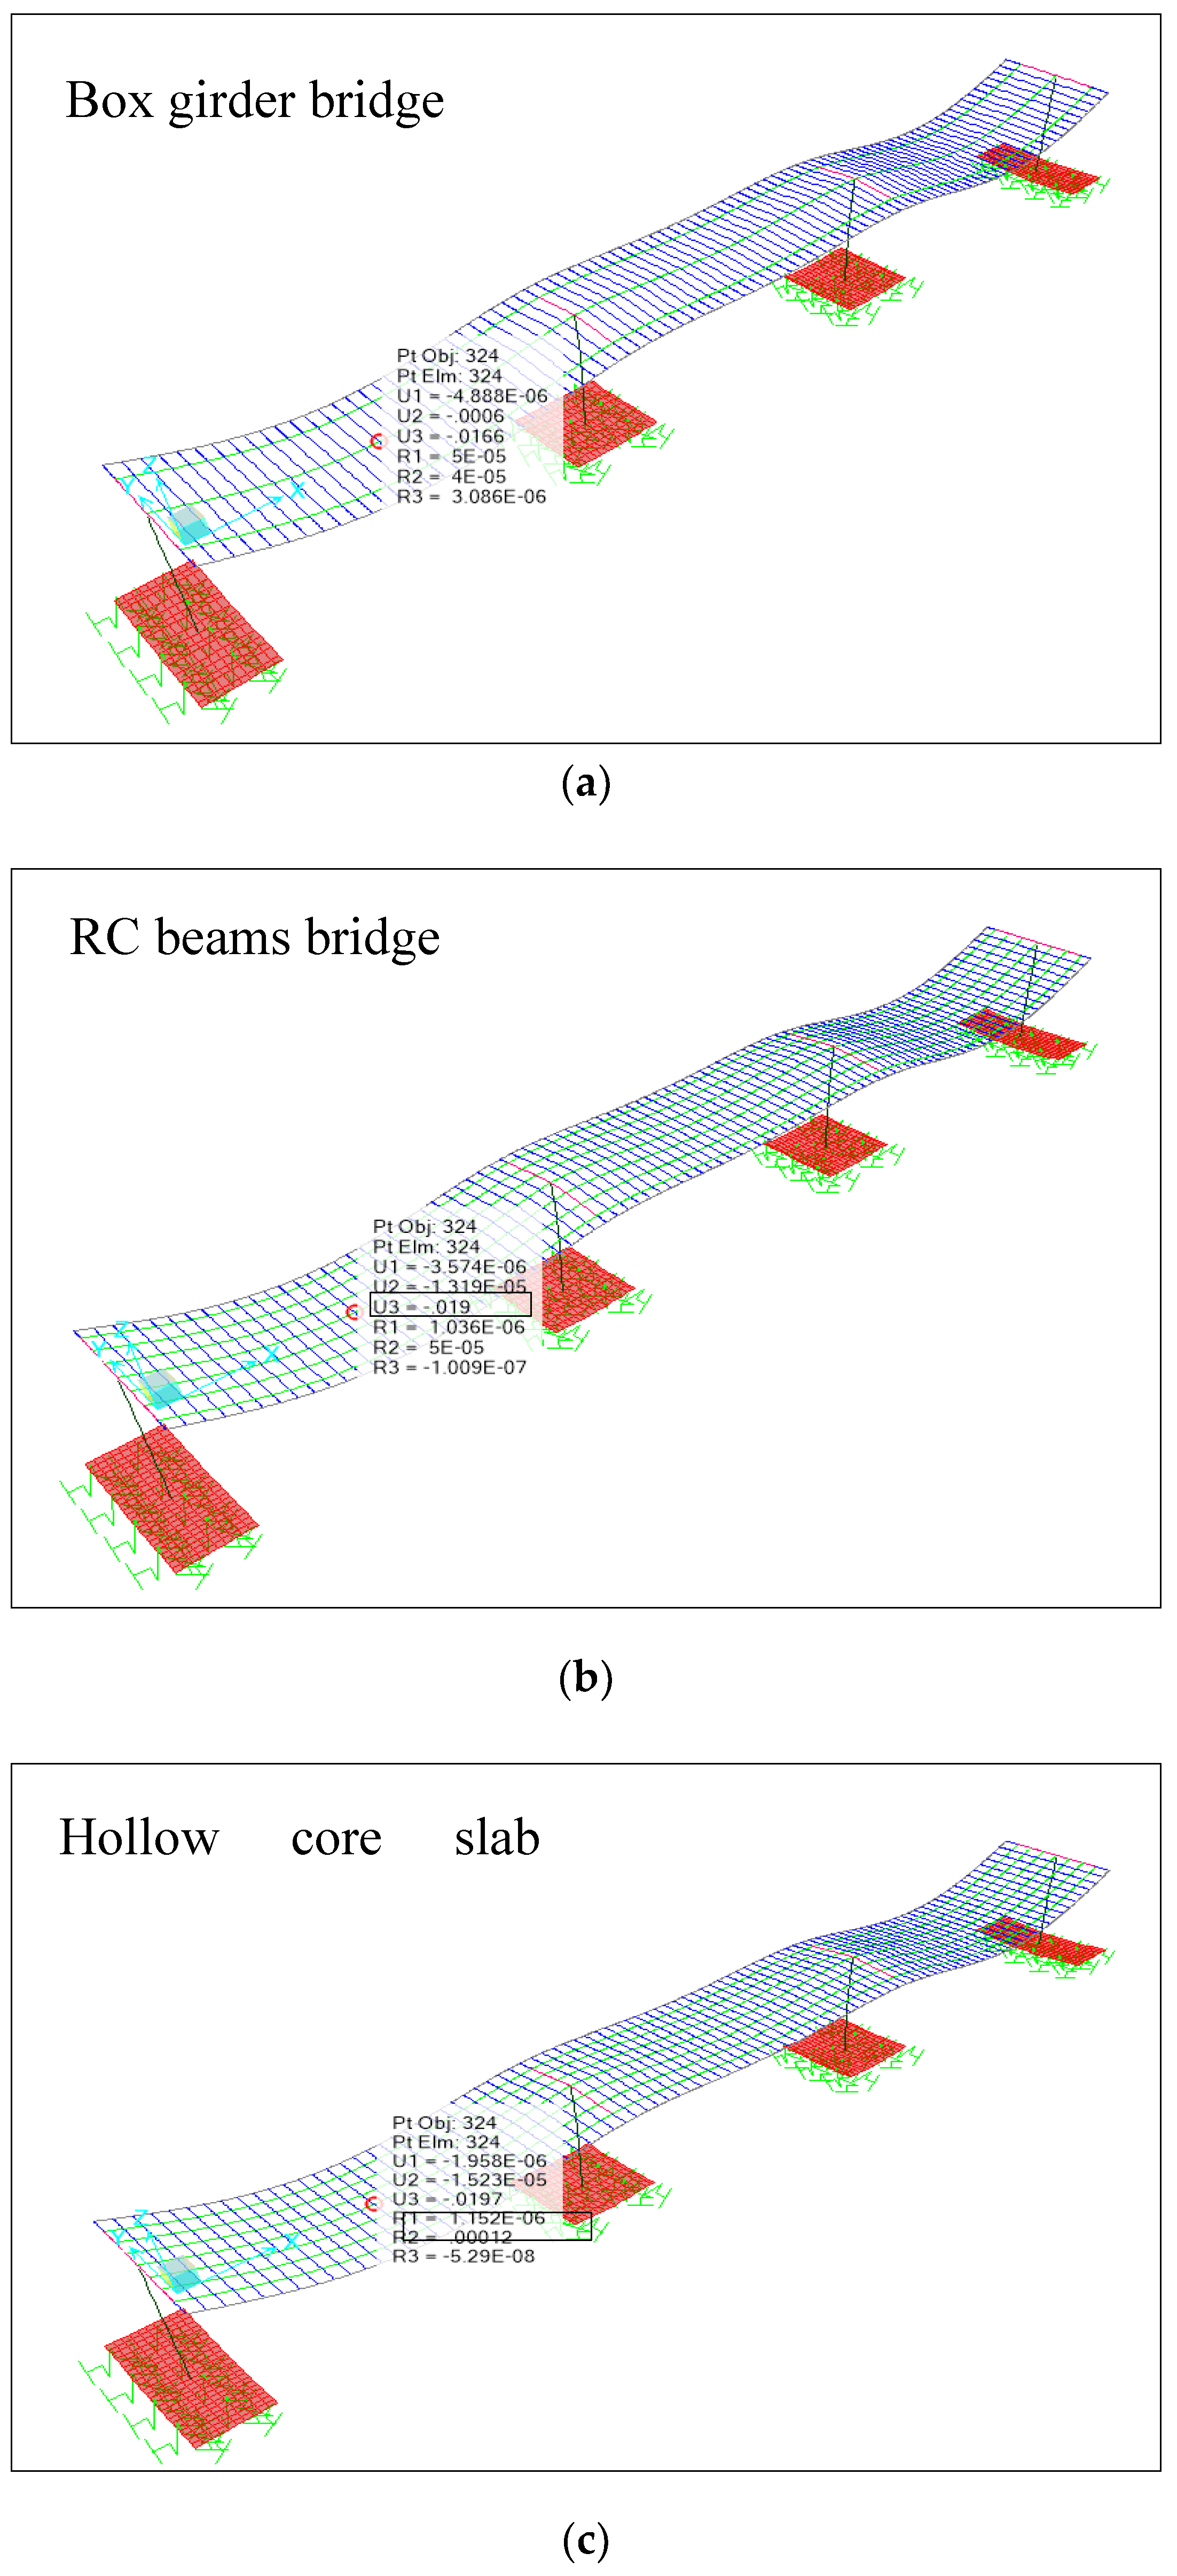
Figure 13.
3D FEM model of (a) Box girder, (b) RC beams, and, (c) hollow-core deck slab bridges.
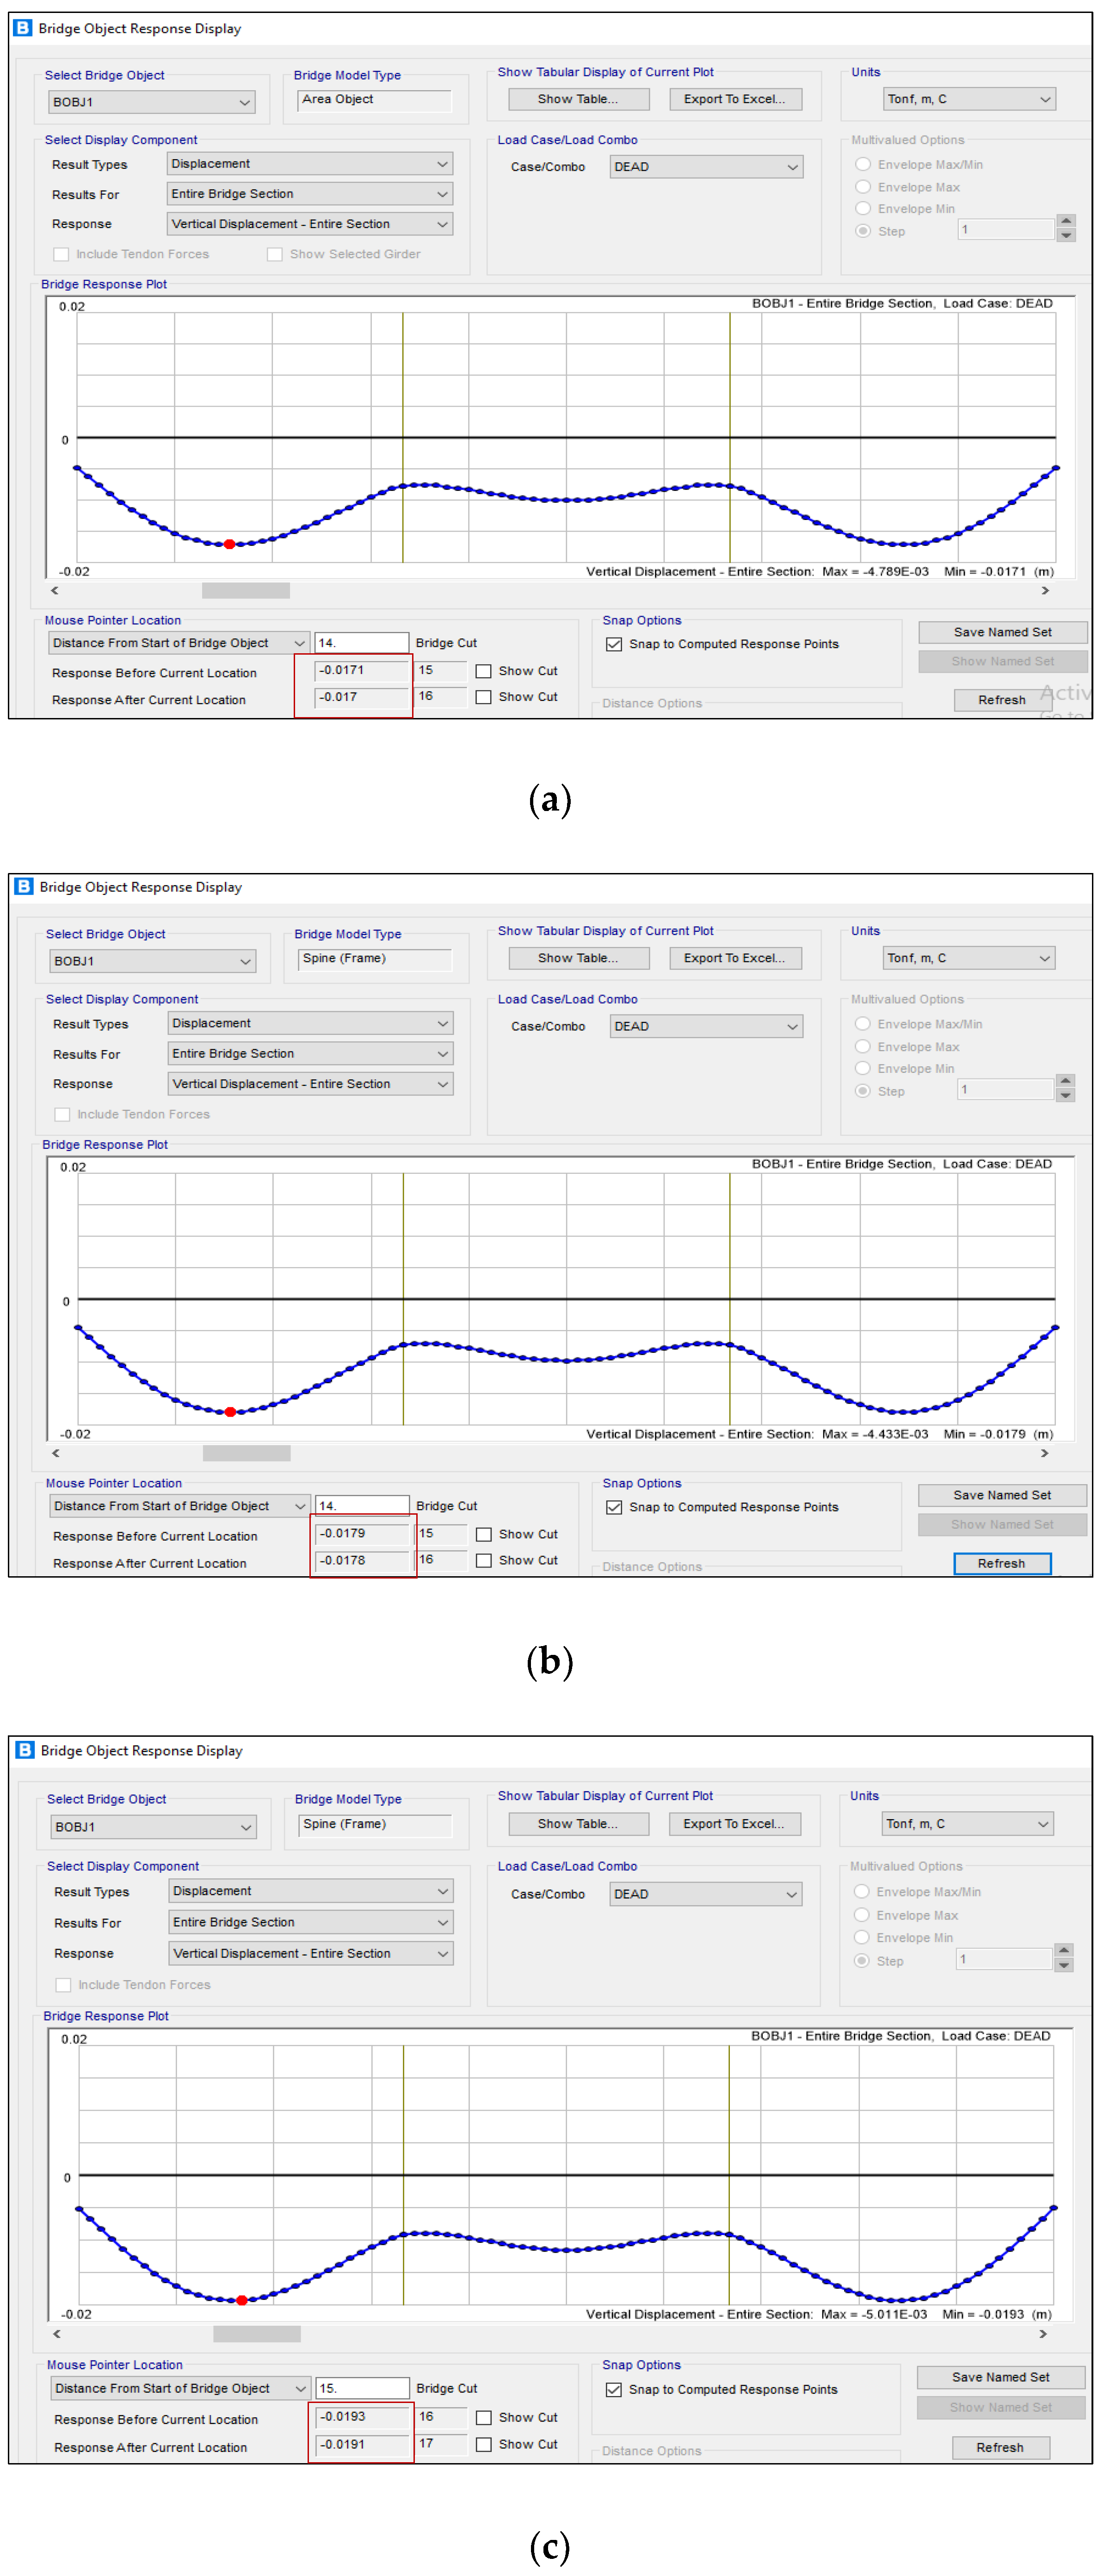
Figure 14.
Peak displacements of columns and the average of these peaks relative to the height of the columns were acquired through forward directivity and fling-step documentation for modeled bridges as (a) box-girder, (b) RC girders and (c) hollow core slab.
Figure 14.
Peak displacements of columns and the average of these peaks relative to the height of the columns were acquired through forward directivity and fling-step documentation for modeled bridges as (a) box-girder, (b) RC girders and (c) hollow core slab.
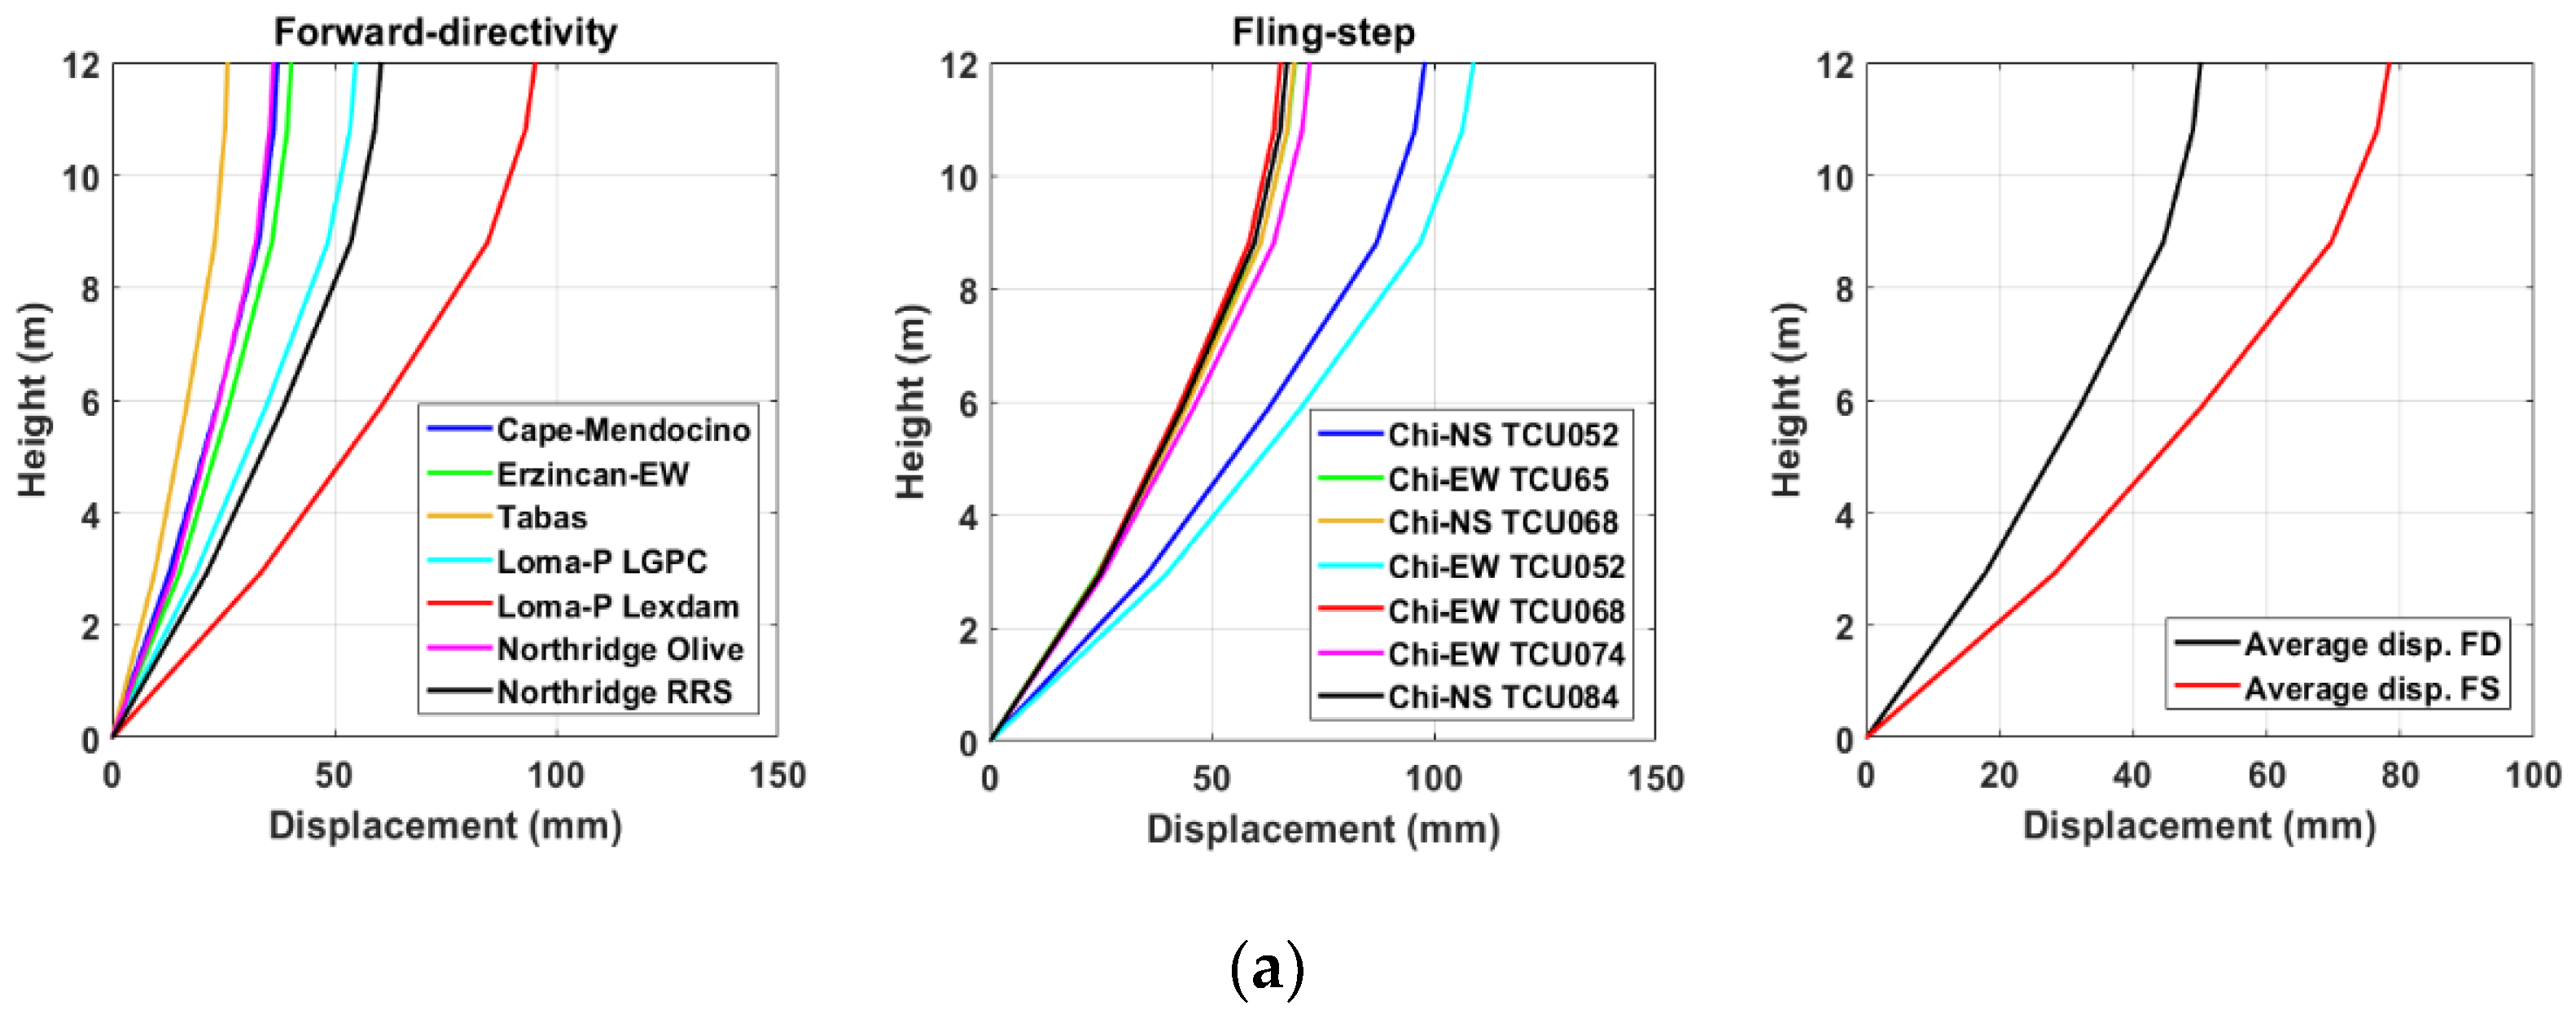
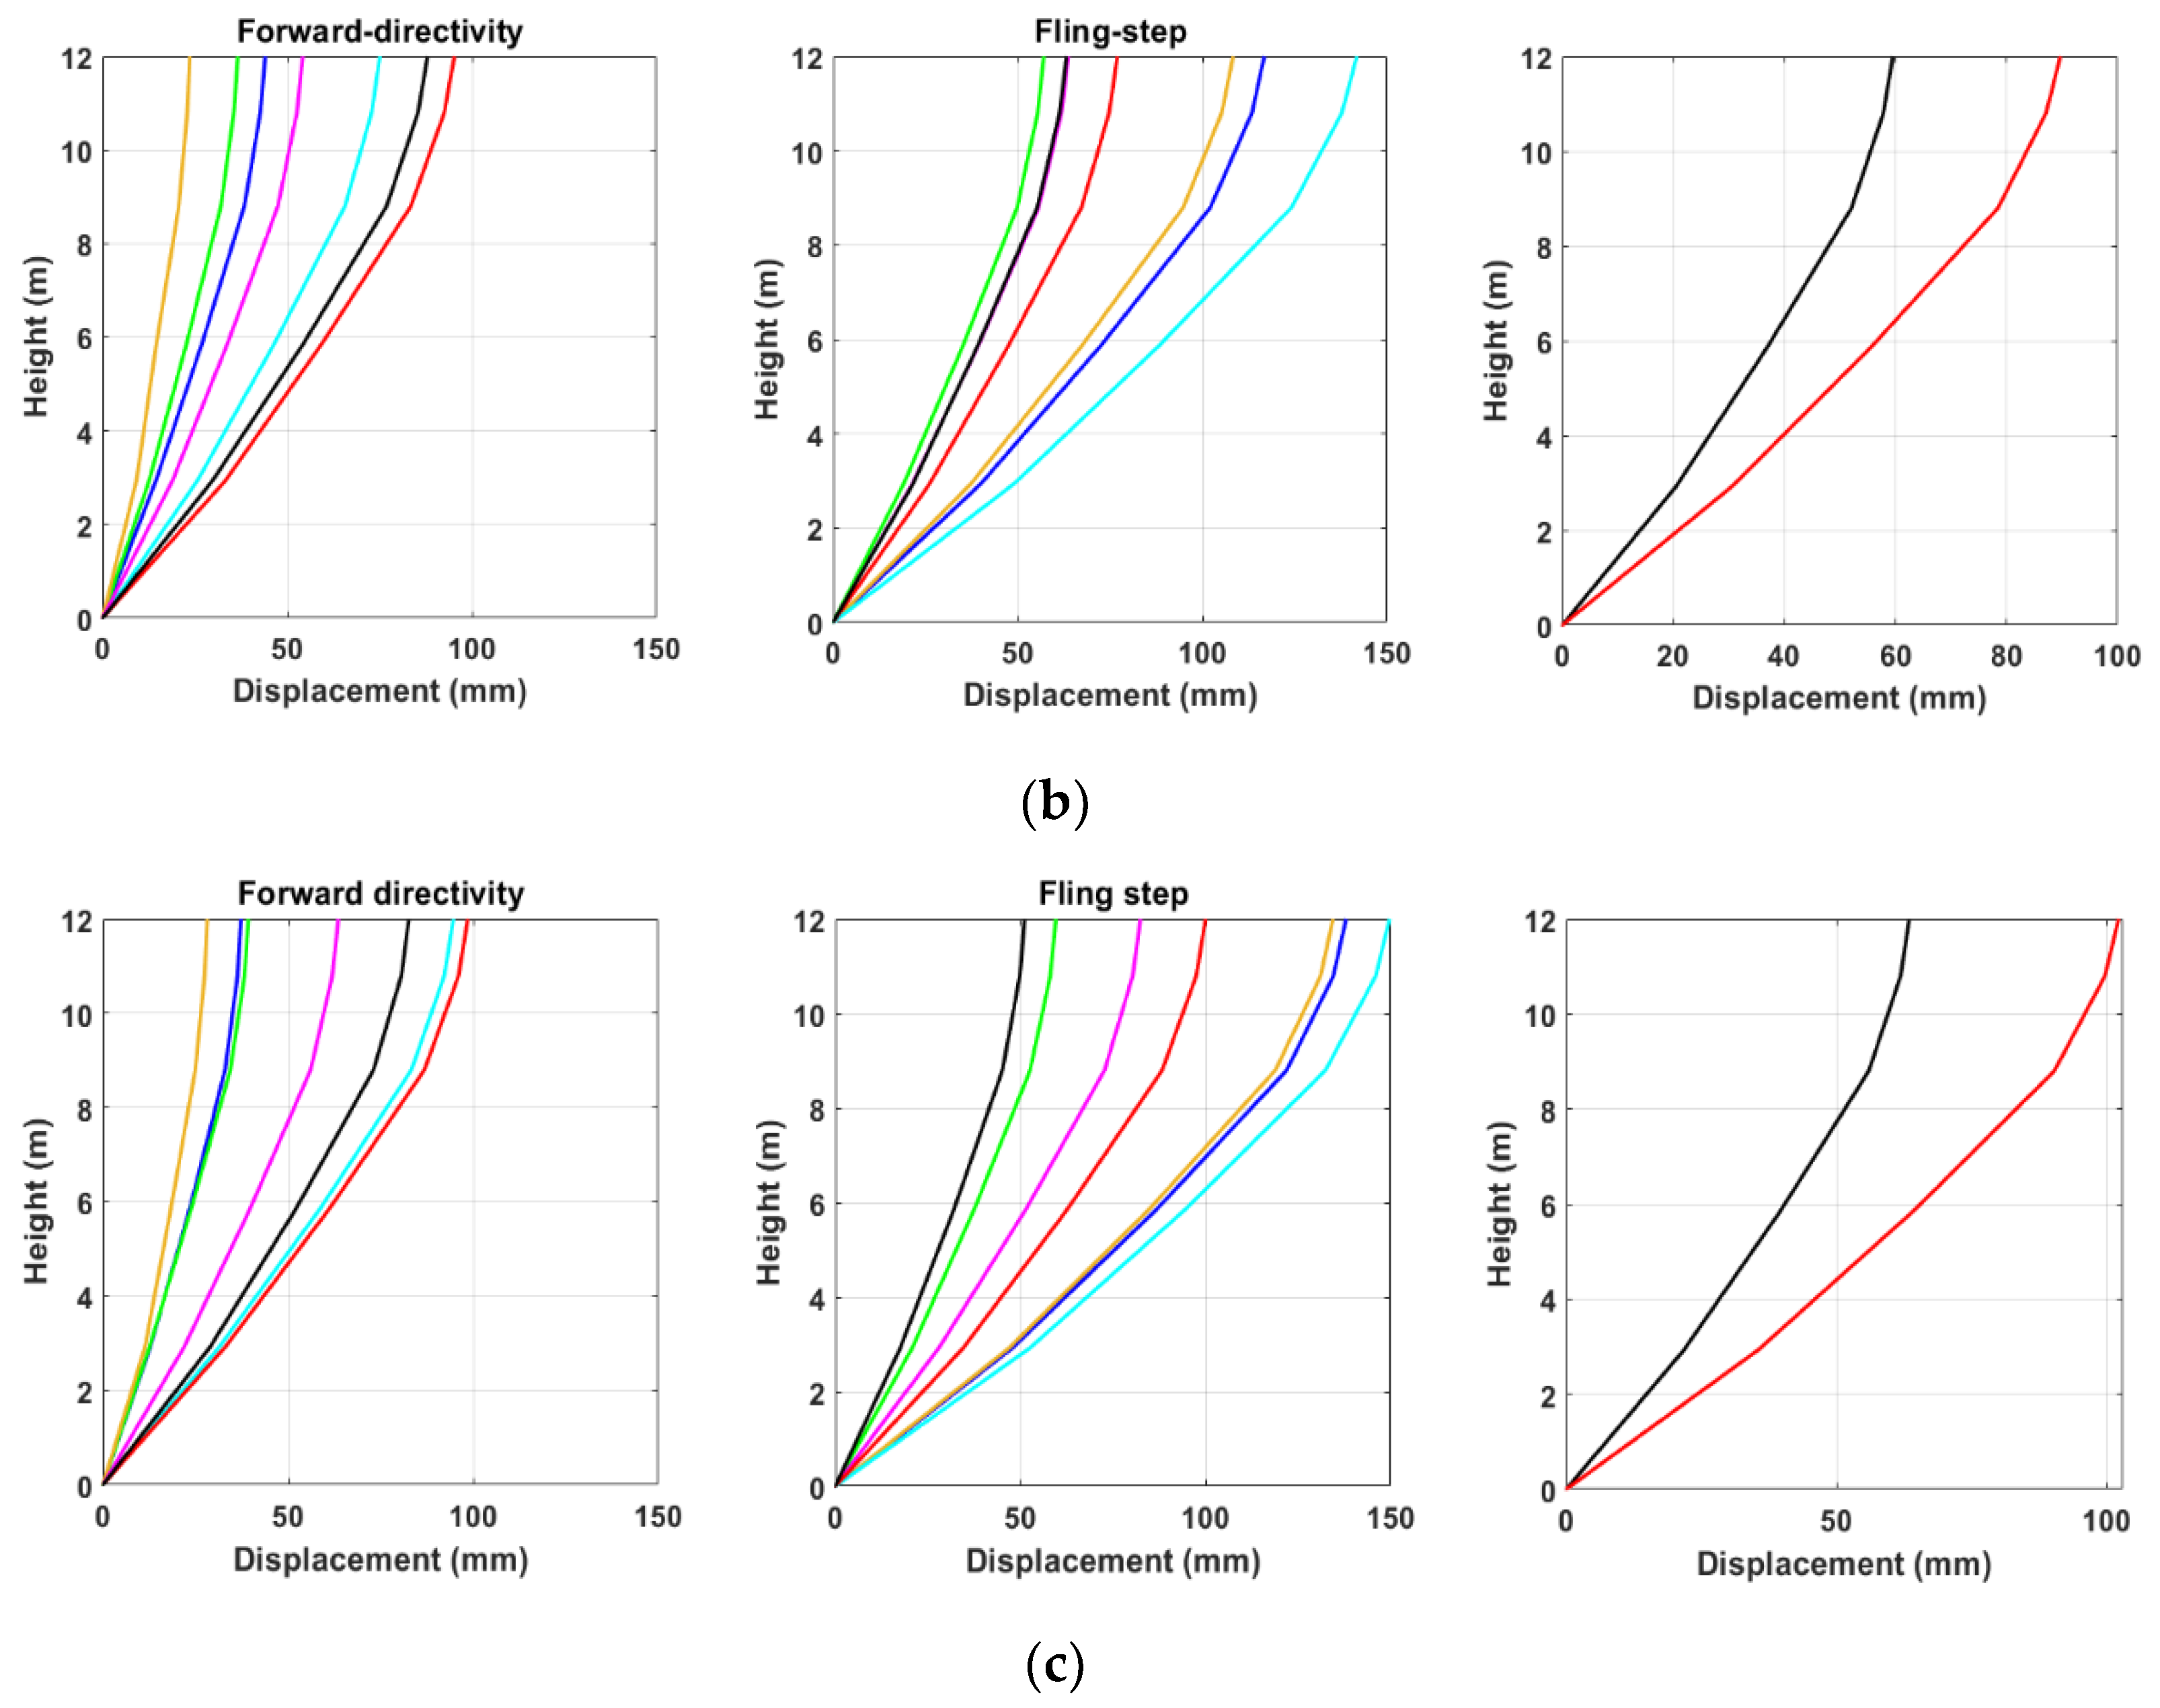
Figure 15.
Peak rotations and average peak values relative to column height were derived using forward directivity and fling-step recordings for modeled bridges as (a) box-girder, (b) RC girders and (c) hollow core slab.
Figure 15.
Peak rotations and average peak values relative to column height were derived using forward directivity and fling-step recordings for modeled bridges as (a) box-girder, (b) RC girders and (c) hollow core slab.
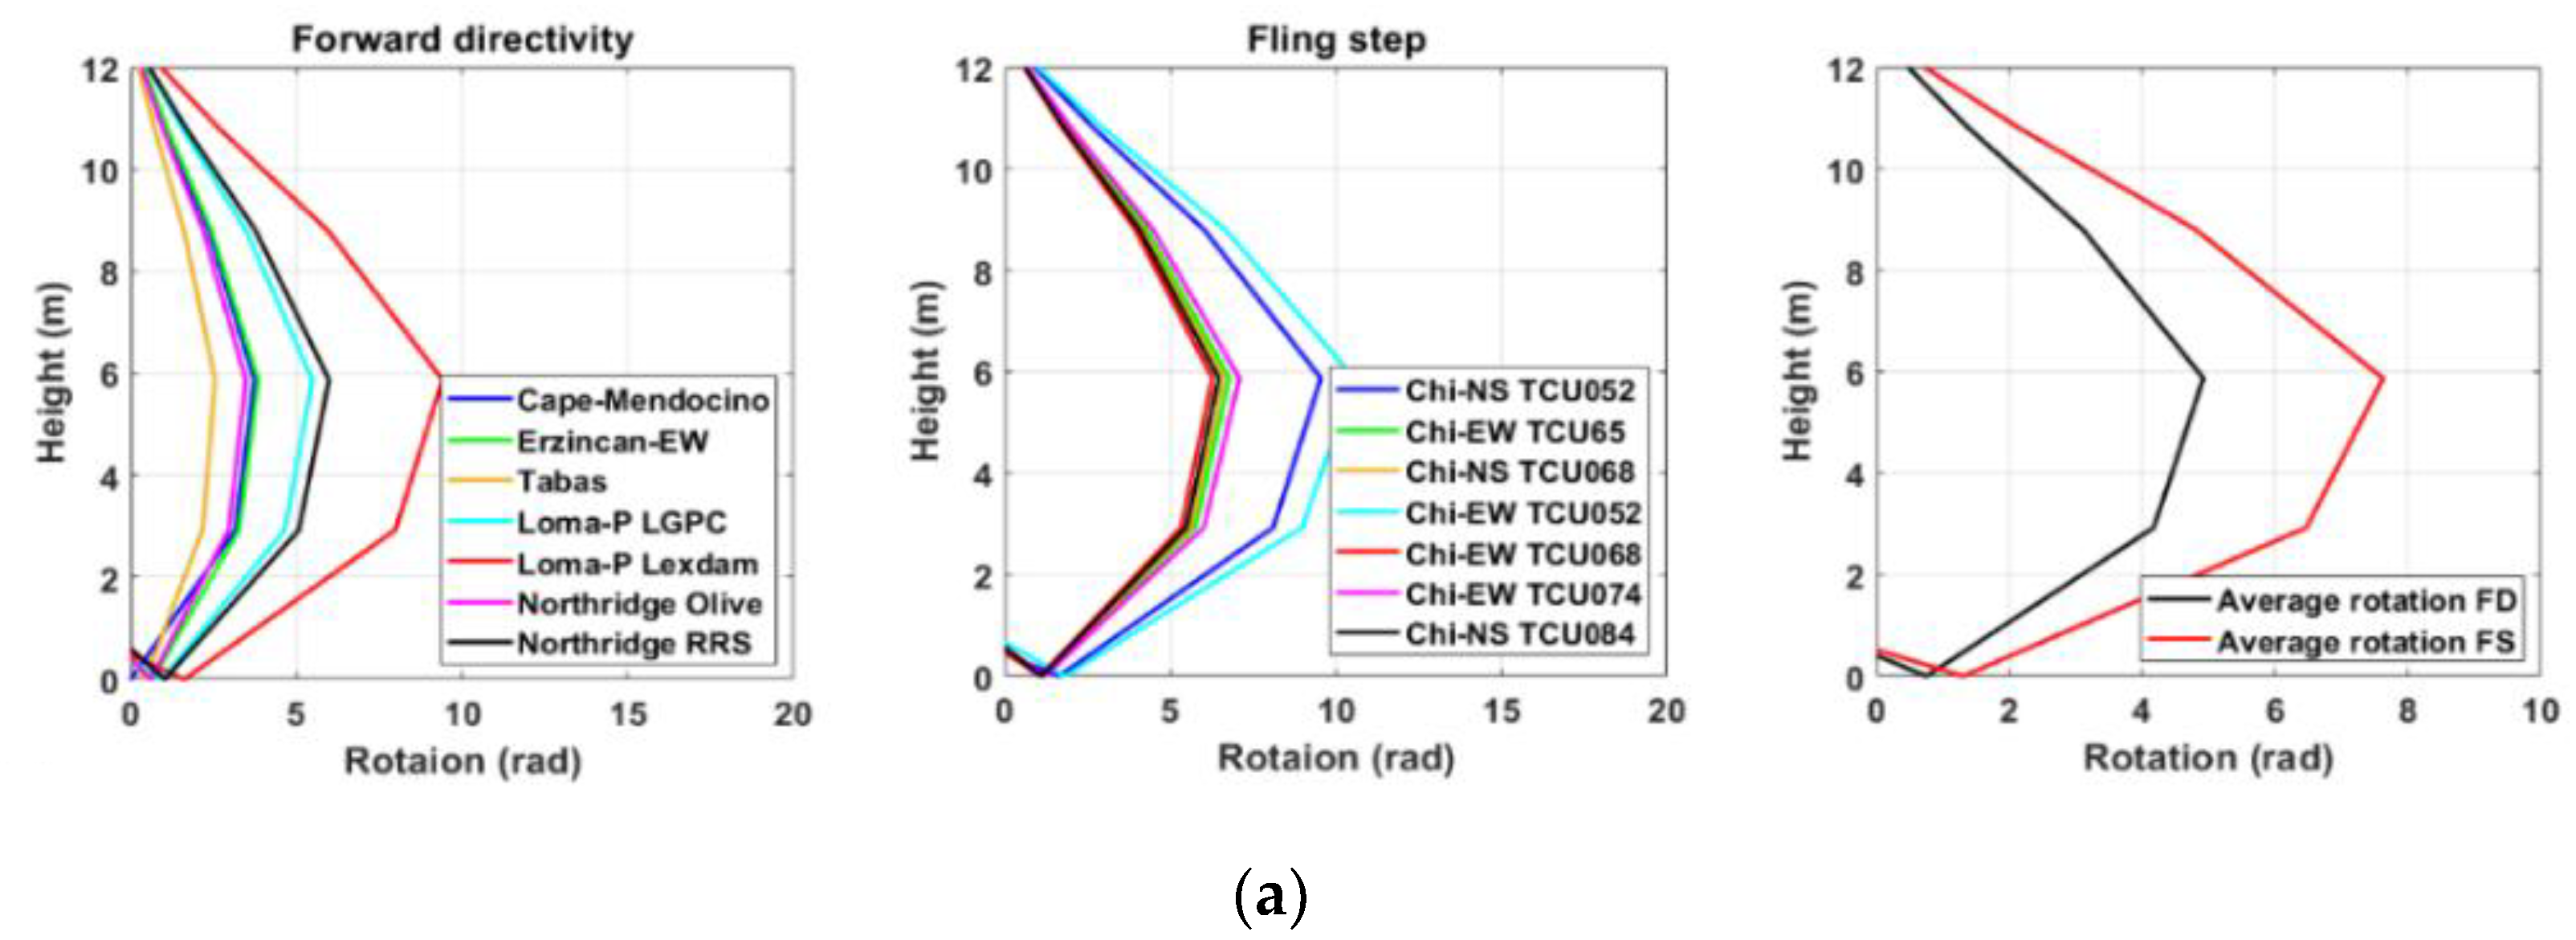
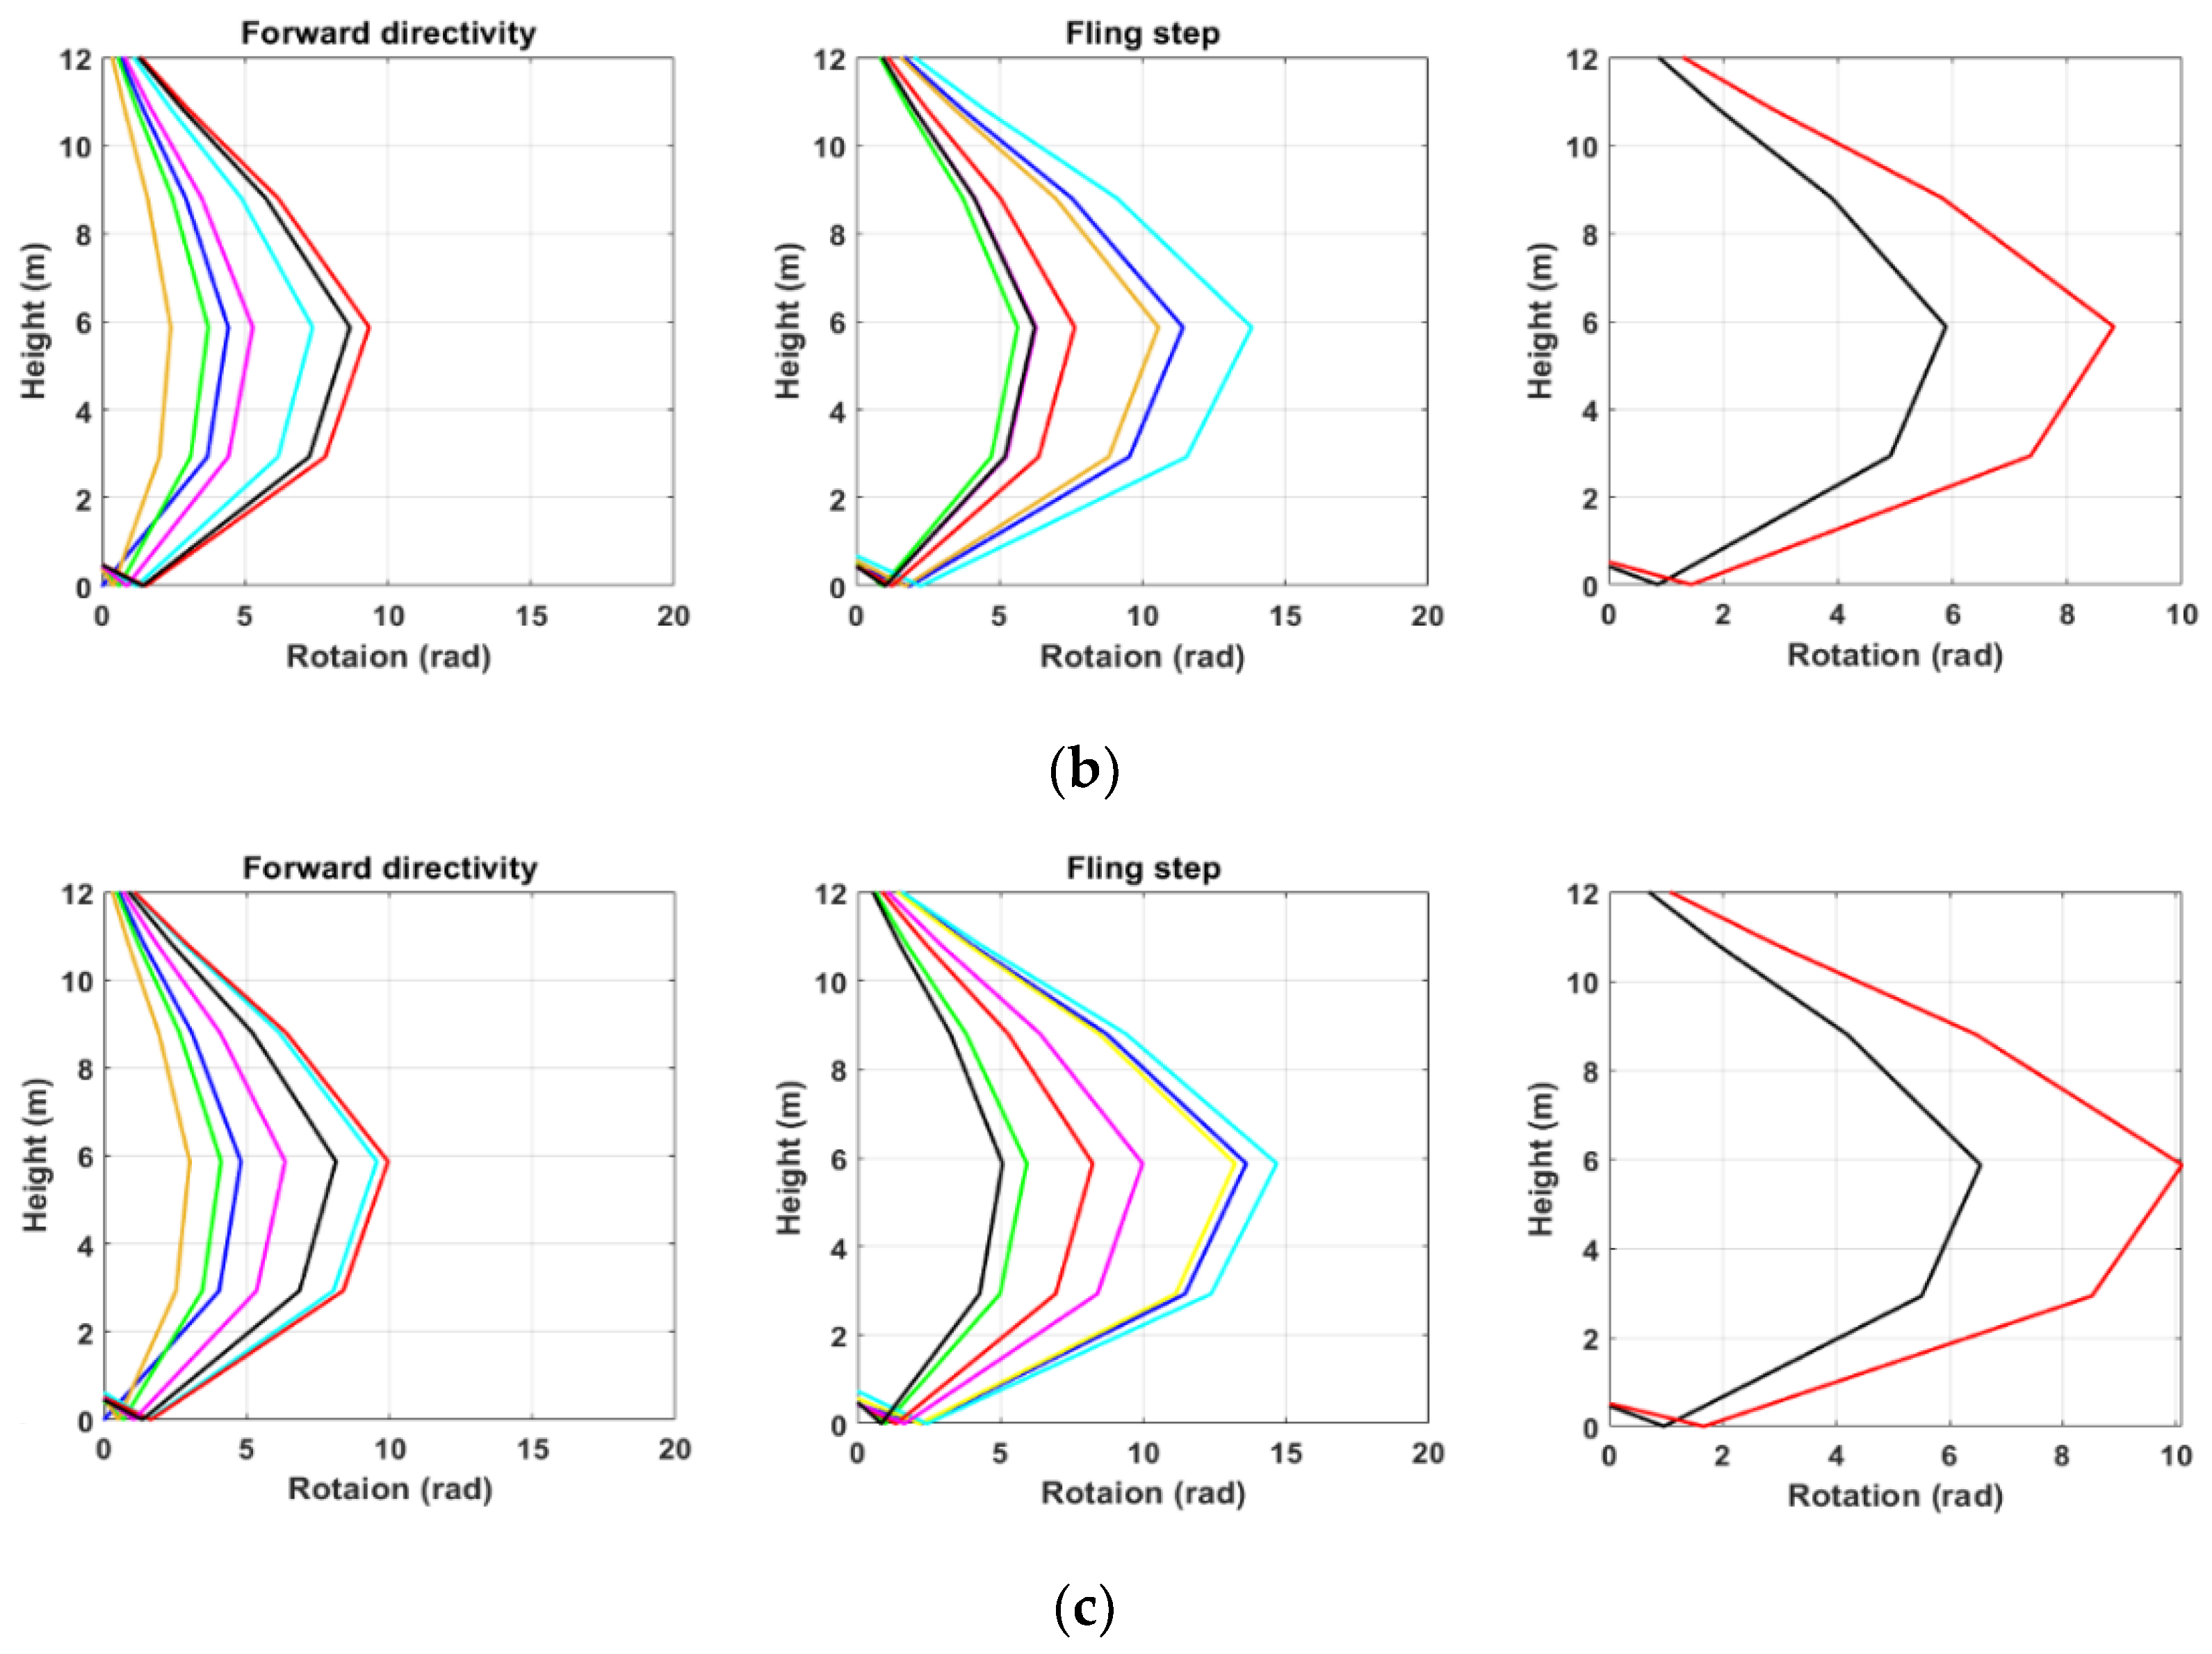
Figure 16.
Column’s mean of peak moments against column’s height obtained under the considered two sets of records for bridges modelled as (a) box-girder, (b) RC girders and (c) hollow core slab.
Figure 16.
Column’s mean of peak moments against column’s height obtained under the considered two sets of records for bridges modelled as (a) box-girder, (b) RC girders and (c) hollow core slab.
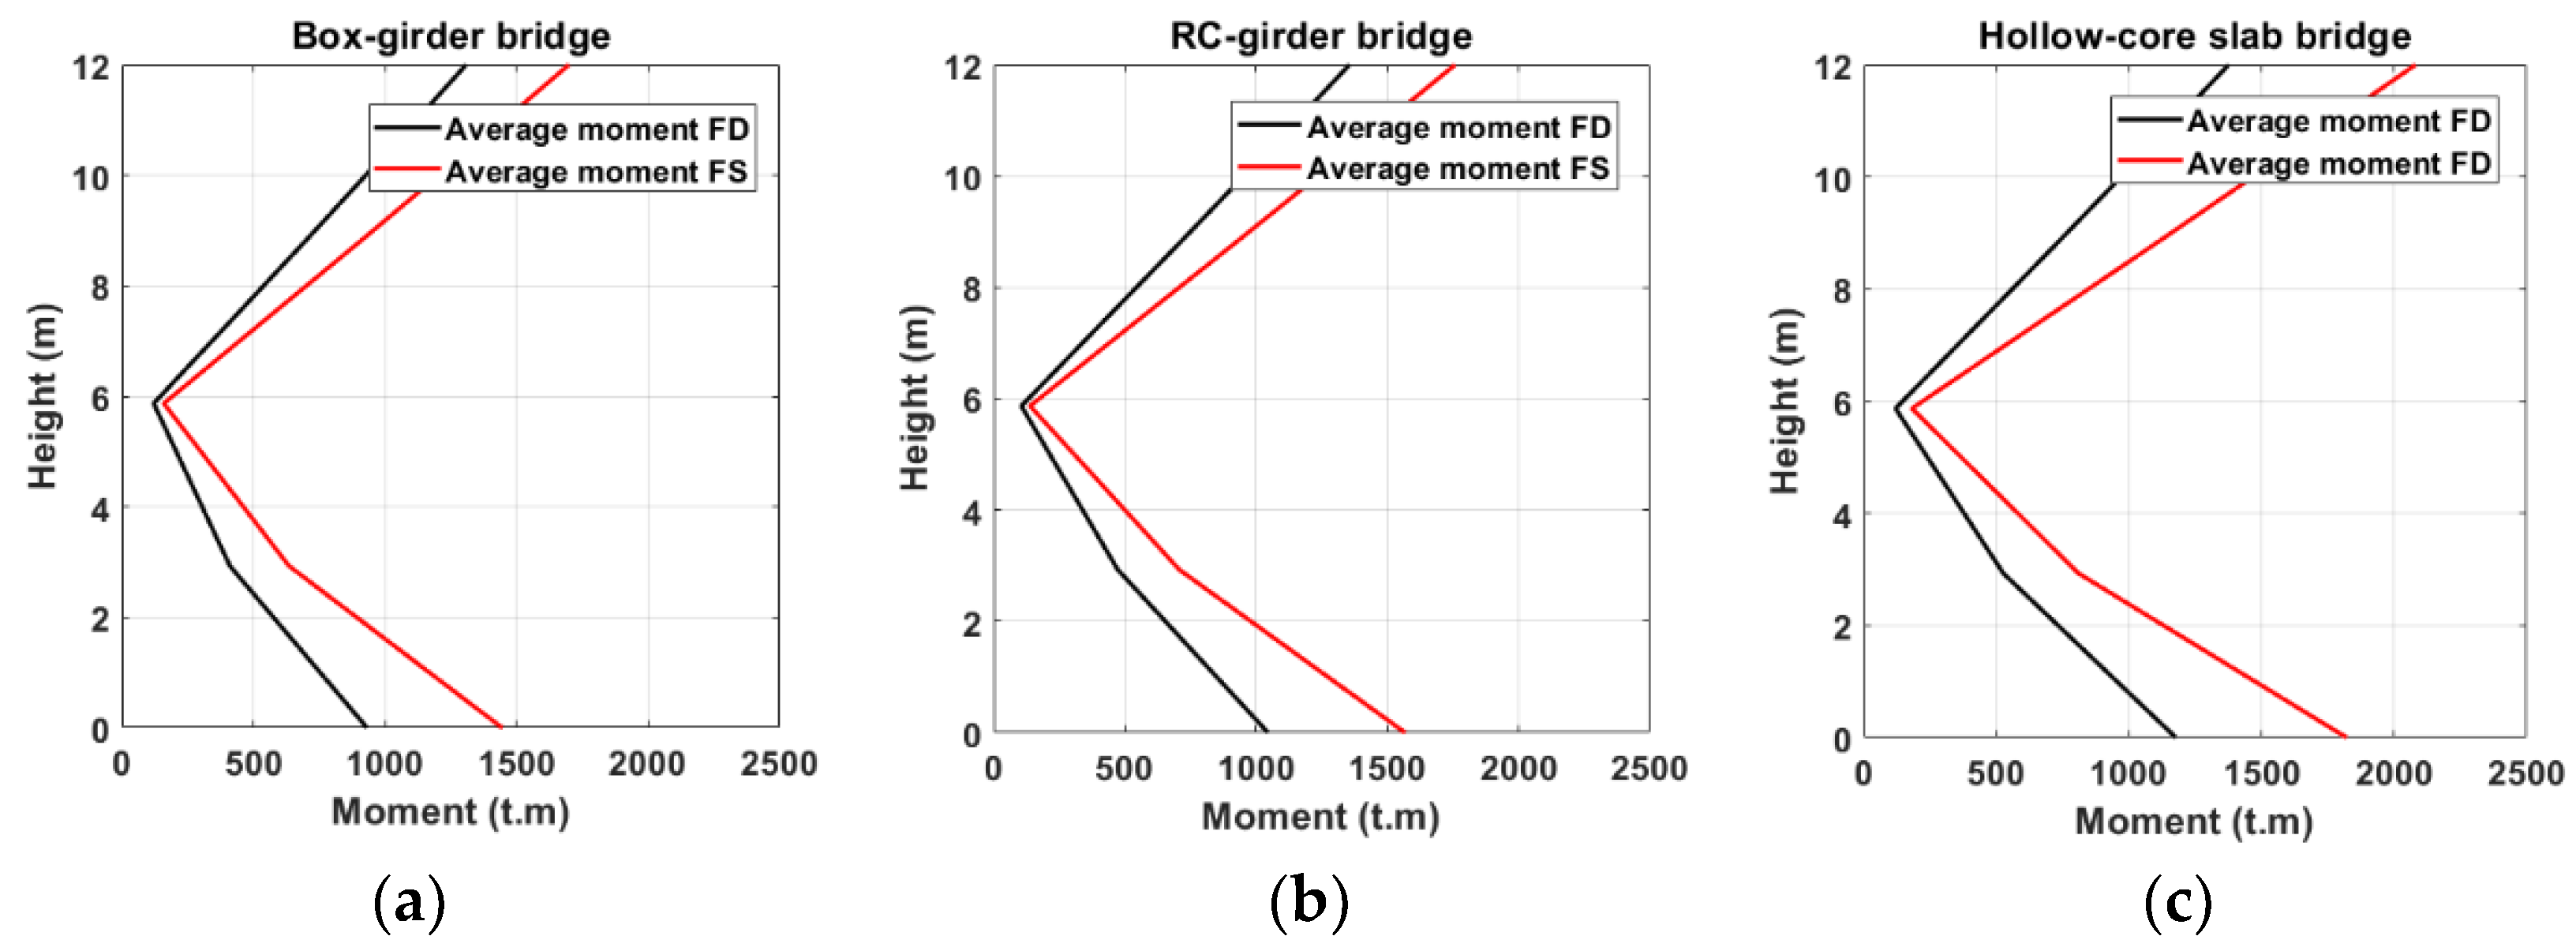
Figure 17.
Column’s average of peak shear forces against column’s height obtained under the considered two sets of records for bridges modelled as (a) box-girder, (b) RC girders and (c) hollow core slab.
Figure 17.
Column’s average of peak shear forces against column’s height obtained under the considered two sets of records for bridges modelled as (a) box-girder, (b) RC girders and (c) hollow core slab.
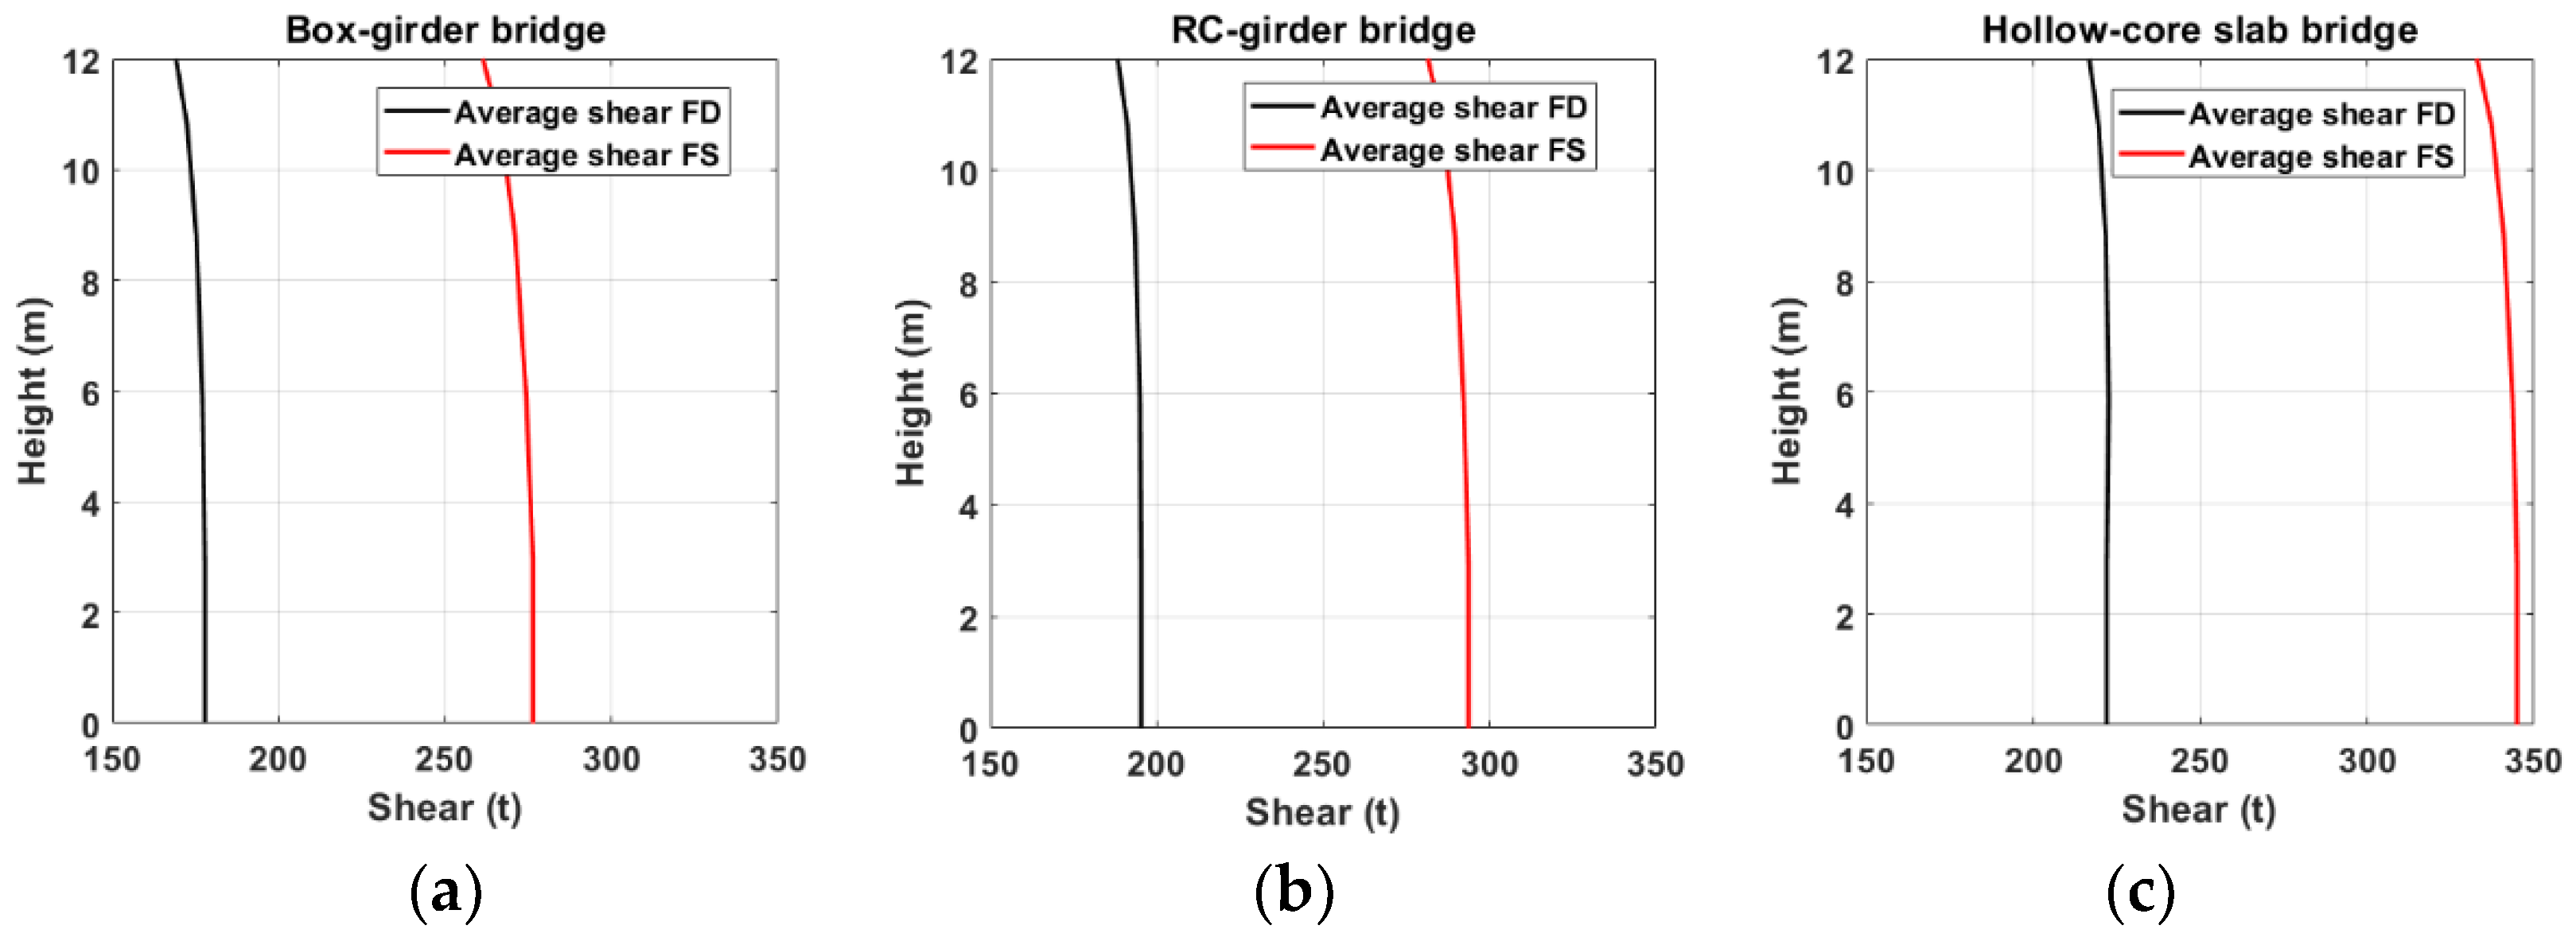
Figure 18.
The average peak moments of the deck relative to deck length were derived using forward directivity and fling-step recordings for modeled bridges as (a) box-girder, (b) RC girders and (c) hollow core slab.
Figure 18.
The average peak moments of the deck relative to deck length were derived using forward directivity and fling-step recordings for modeled bridges as (a) box-girder, (b) RC girders and (c) hollow core slab.
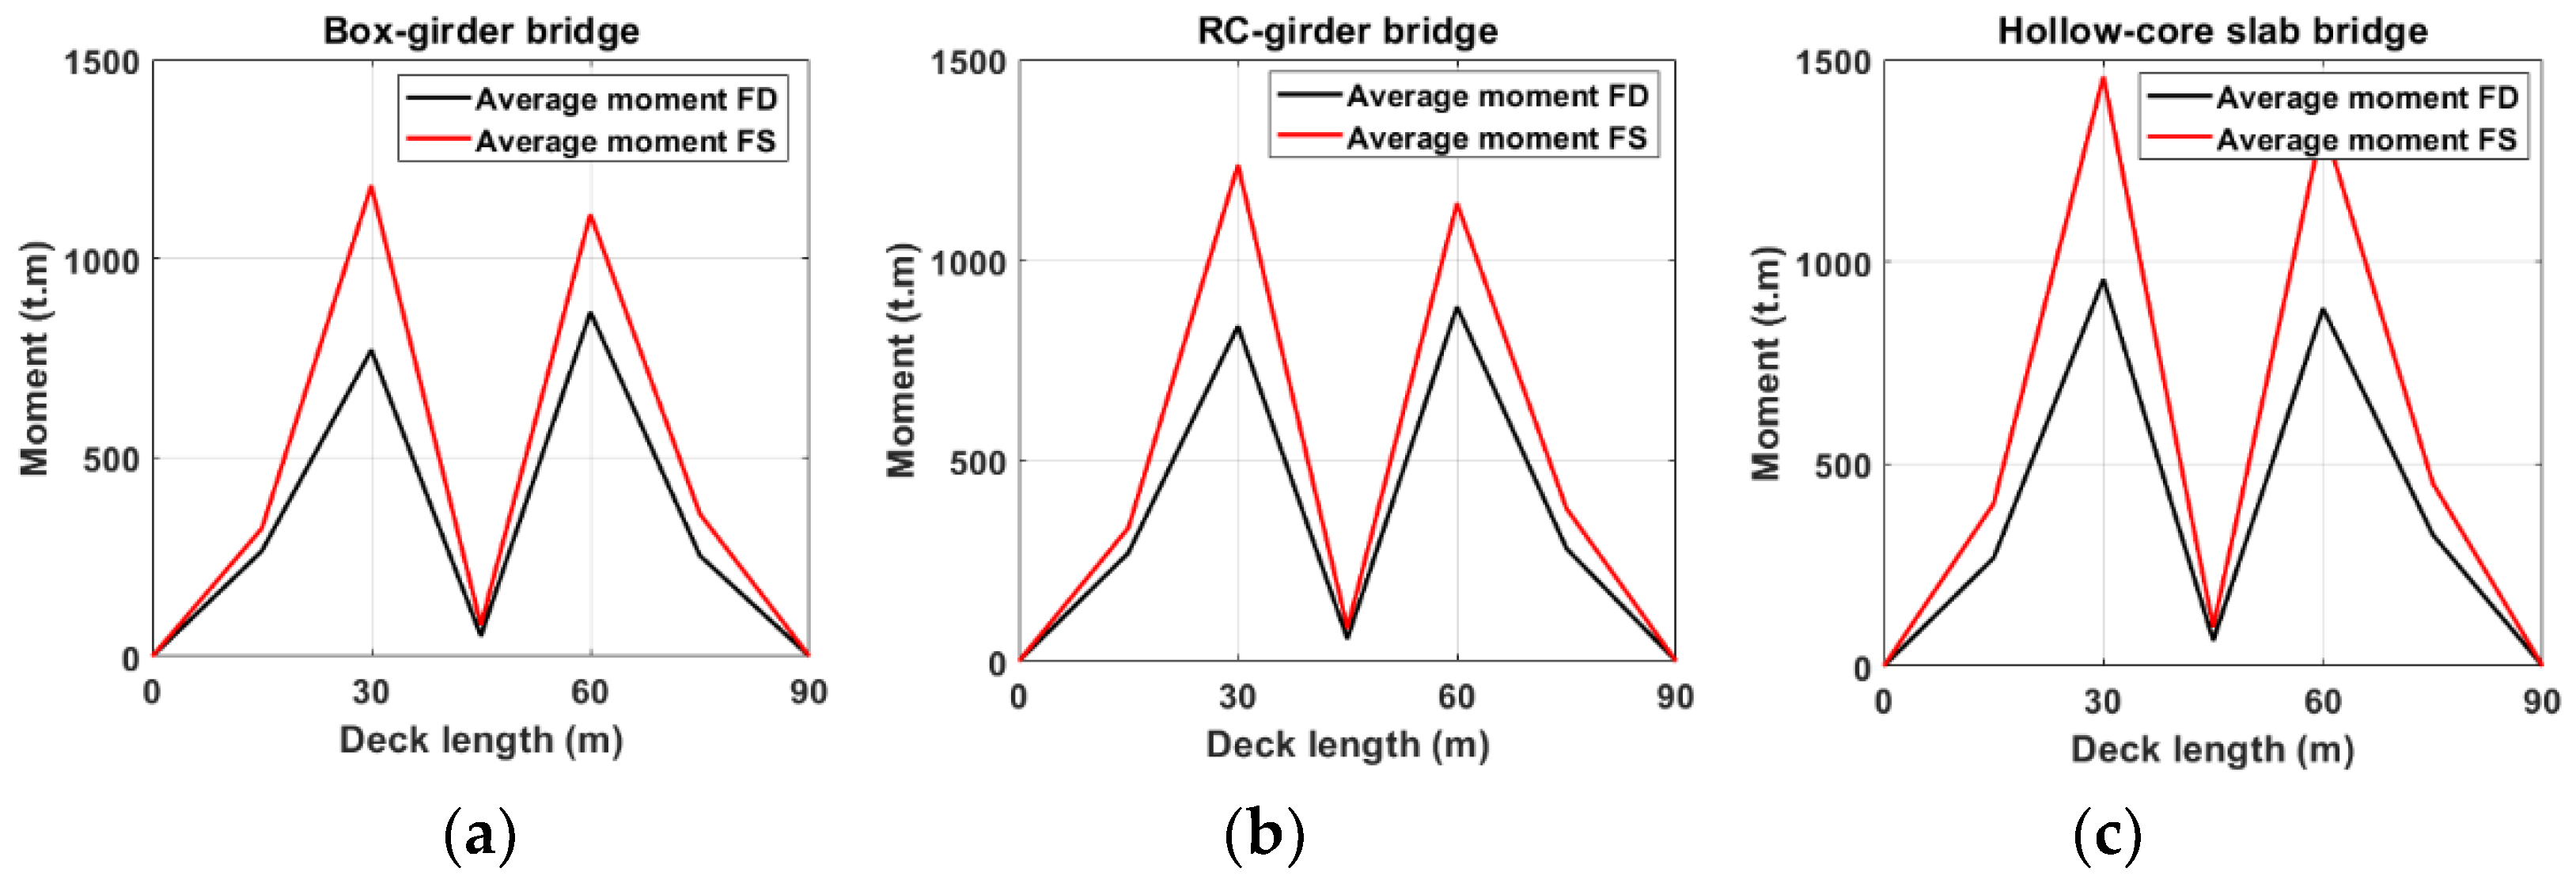
Figure 19.
Average peak shear forces of the deck relative to deck length, derived from forward directivity and fling-step recordings for modeled bridges as (a) box-girder, (b) RC girders and (c) hollow core slab.
Figure 19.
Average peak shear forces of the deck relative to deck length, derived from forward directivity and fling-step recordings for modeled bridges as (a) box-girder, (b) RC girders and (c) hollow core slab.
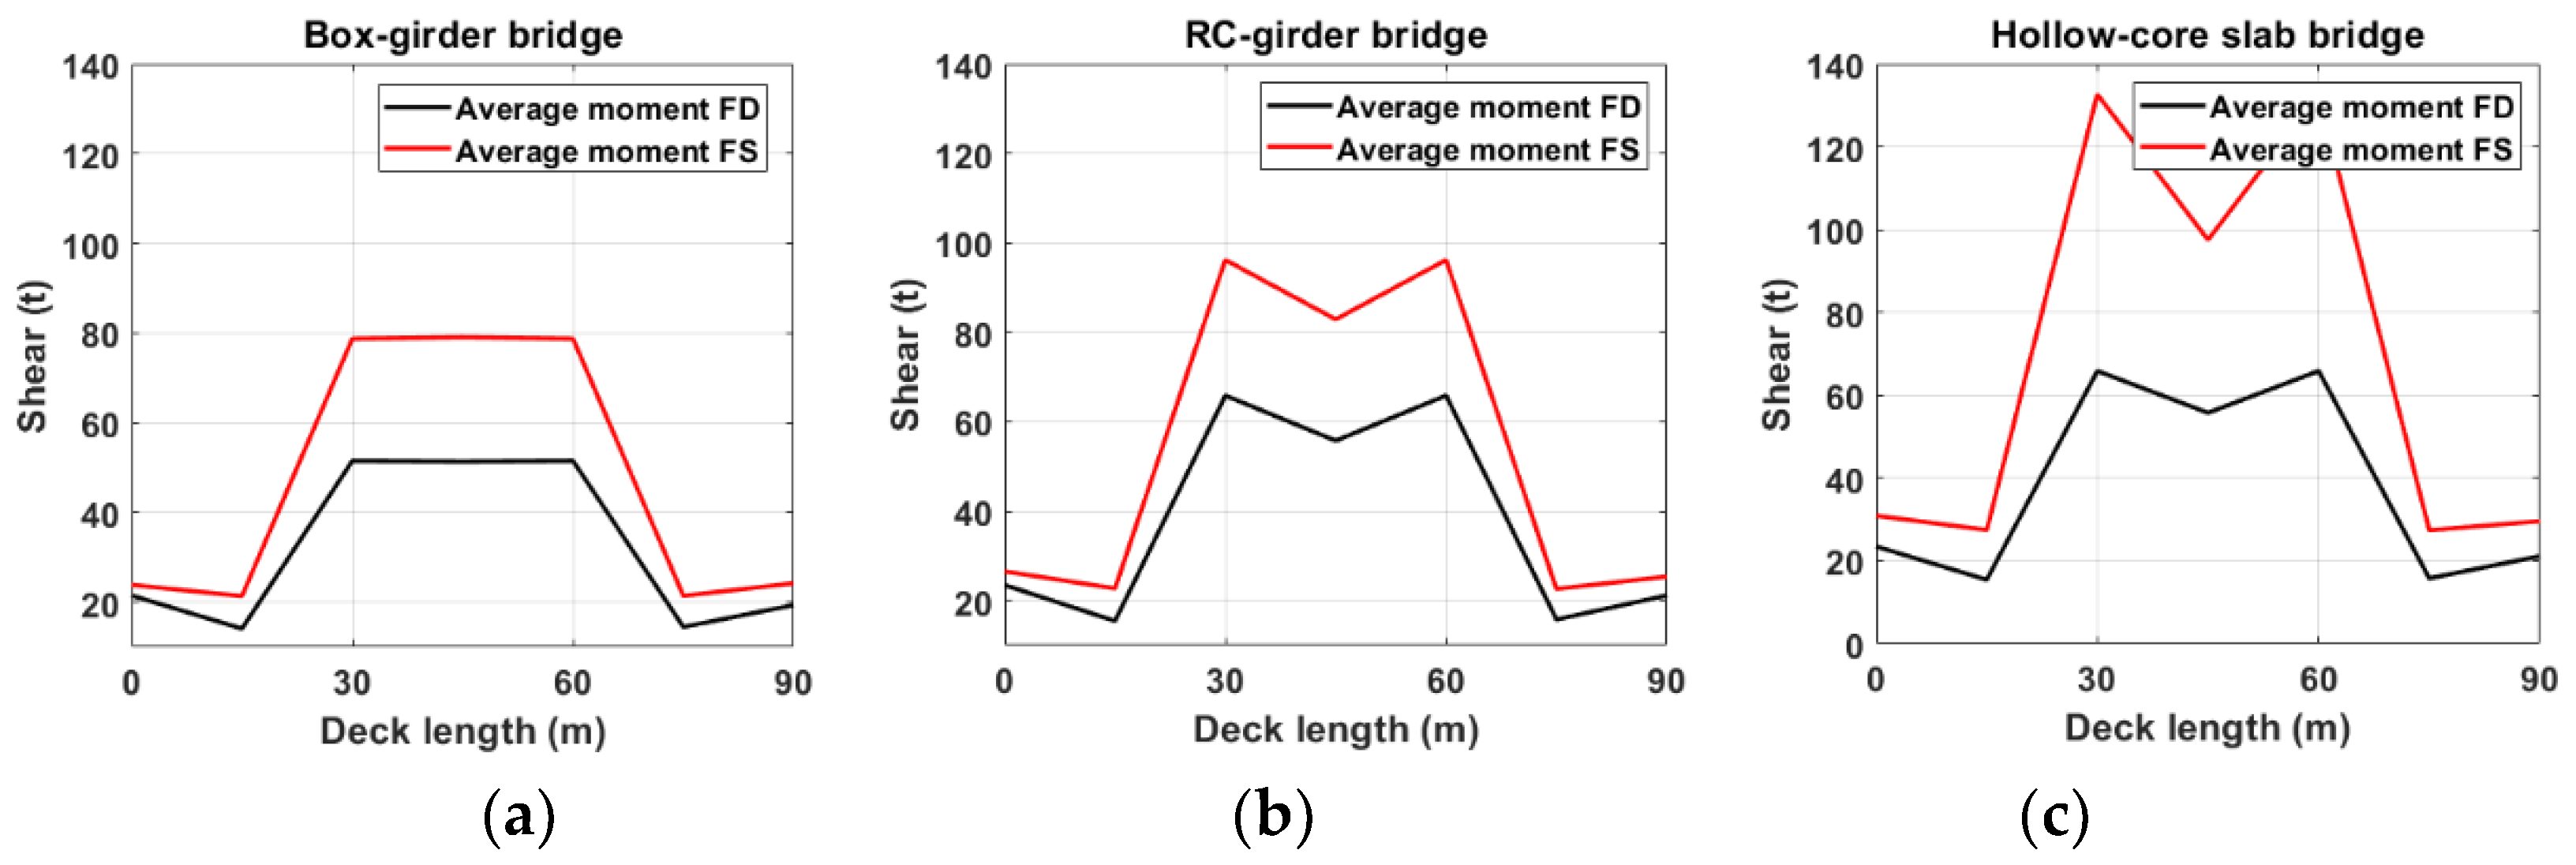

Table 1.
Forward-directivity input records.
| Seismic event (documentation) | Position | PGA (g) |
PGV (cm/sec) |
PGD (cm) |
PGA/ PGV |
|
|
|---|---|---|---|---|---|---|---|
| Cape-Mendocino | Petrolia-90 | 0.66 | 88.5 | 33.2 | 0.75 | 7.0 | 25 |
| Erzincan-EW | Pacoima Dam 279 | 0.50 | 78.12 | 28.02 | 0.64 | 6.7 | 20 |
| Tabas | Ferdows | 0.87 | 123.3 | 93.57 | 0.71 | 7.3 | 32 |
| Loma-Prieta | LGPC-00 | 0.57 | 96.05 | 41.92 | 0.59 | 6.9 | 25 |
| Loma-Prieta | Lexdam-00 | 0.41 | 95.73 | 30.27 | 0.43 | 6.9 | 15 |
| Northridge | Rinaldi-275 | 0.87 | 147.92 | 41.86 | 0.59 | 6.7 | 15 |
| Northridge | Oliveview-360 | 0.84 | 129.31 | 32.11 | 0.65 | 6.7 | 15 |
1 PGD, peak ground displacement; M_w, magnitude; t_d, time duration.
Table 2.
Fling-step input records.
| Seismic event (documentation) | Position | PGA (g) |
PGV (cm/sec) |
PGD (cm) |
PGA/ PGV |
|
|
|---|---|---|---|---|---|---|---|
| Chi-Chi NS | TCU-052 | 0.45 | 172.24 | 226.5 | 0.26 | 7.6 | 90 |
| Chi-Chi EW | TCU-052 | 0.36 | 151.13 | 210.3 | 0.24 | 7.6 | 90 |
| Chi-Chi EW | TCU-065 | 0.79 | 125.28 | 108.7 | 0.63 | 7.6 | 90 |
| Chi-Chi EW | TCU-068 | 0.51 | 248.50 | 297.0 | 0.21 | 7.6 | 90 |
| Chi-Chi NS | TCU-068 | 0.37 | 263.96 | 421.0 | 0.14 | 7.6 | 90 |
| Chi-Chi EW | TCU-074 | 0.59 | 70.33 | 21.31 | 0.84 | 7.6 | 90 |
| Chi-Chi NS | TCU-084 | 0.43 | 48.07 | 20.44 | 0.89 | 7.6 | 90 |
2 PGD, peak ground displacement; M_w, magnitude; t_d, time duration.
Disclaimer/Publisher’s Note: The statements, opinions and data contained in all publications are solely those of the individual author(s) and contributor(s) and not of MDPI and/or the editor(s). MDPI and/or the editor(s) disclaim responsibility for any injury to people or property resulting from any ideas, methods, instructions or products referred to in the content. |
© 2025 by the authors. Licensee MDPI, Basel, Switzerland. This article is an open access article distributed under the terms and conditions of the Creative Commons Attribution (CC BY) license (http://creativecommons.org/licenses/by/4.0/).
Copyright: This open access article is published under a Creative Commons CC BY 4.0 license, which permit the free download, distribution, and reuse, provided that the author and preprint are cited in any reuse.


