
Submitted:
20 October 2025
Posted:
21 October 2025
You are already at the latest version
Preprints on COVID-19 and SARS-CoV-2
Abstract
The coronavirus disease (COVID-19) pandemic in Tocantins, Brazil, exhibited distinct phases between 2020 and 2025, with high mortality concentrated in 2020–2021 and subsequent stabilization at residual levels. Using epidemiological data, statistical modeling, and genomic surveillance, we show that the crisis peaked in 2021, coinciding with the circulation of Gamma and Delta, when health system capacity was severely strained. From 2022 onwards, the spread of Omicron resulted in record incidence but proportionally low mortality, reflecting accumulated immunity, vaccination, and improved clinical management. Vaccination emerged as the turning point, reducing hospitalizations and deaths by over 90% and driving a clear decoupling between incidence and severity. Interrupted time-series and generalized additive model (GAM) analyses confirmed sustained reductions in transmission and severity associated with mass immunization. Genomic sequencing of 3,941 severe acute respiratory syndrome coronavirus 2 (SARS-CoV-2) genomes revealed 166 lineages and successive variant replacements, culminating in the predominance of LP.8.1.4 in 2025. To our knowledge, this is one of the few integrated, long-term analyses (2020–2025) combining epidemiological and genomic data, capturing the full succession of variants up to LP.8.1.4 and highlighting Tocantins as a strategic “variant corridor” linking Brazil’s North and Central-West regions. These findings highlight the dual role of vaccination and genomic surveillance in shaping the epidemic trajectory and underscore the need to sustain both strategies to mitigate future health crises.
Keywords:
COVID-19
; SARS-CoV-2
; vaccination impact
; genomic surveillance
1. Introduction
The emergence of severe acute respiratory syndrome coronavirus 2 (SARS-CoV-2) in December 2019, in Wuhan (China), triggered an unprecedented global health crisis, with millions of cases and deaths in the first months [1]. By mid-2025, more than 775 million cases and approximately 7 million deaths had been reported, highlighting the profound impacts on public health, the economy, and social structures [2]. In Brazil, the first case was confirmed in São Paulo in February 2020. The virus spread rapidly, with community transmission soon recognized nationwide. In the state of Tocantins, the first case was recorded in the capital city of Palmas on March 18, 2020. From there the virus disseminated along major mobility corridors, with strategic high-population-density municipalities, acting as central hubs for viral entry and dispersion into smaller towns and rural areas [3,4].
Belonging to the genus Betacoronavirus and subgenus Sarbecovirus, SARS-CoV-2 has a large RNA genome of approximately 30,000 nucleotides that encodes essential structural proteins. These include the spike (S) protein, which binds to the human angiotensin-converting enzyme 2 (ACE2) receptor, predominantly on respiratory epithelial cells, to mediate viral entry and define its high infectivity [5,6,7,8]. The envelope (E) and membrane (M) proteins are associated with virion assembly and structural stability, respectively, while the nucleocapsid (N) protein, packages the viral RNA and aids in replication regulation [1,9]. Crucially, despite the action of the nsp14 exonuclease error-correcting mechanism, the virus’s replication fidelity allows for meaningful mutation rates. This inherent capacity for genetic variation is a fundamental driver of its diversity and ongoing adaptation [10].
The field of viral genomics relies on precise terminology to track viral evolution. A lineage is a group of viruses with a common genetic ancestor and a characteristic mutation set, used primarily for tracing dissemination. When a lineage accumulates mutations that have meaningful functional consequences, such as enhanced transmissibility, increased virulence, or immune escape, it is termed a variant [1,11]. To assess public health risk, the World Health Organization (WHO), categorizes such variants as variants of interest (VOI) or, for those with demonstrates significant epidemiological impact, variants of concern (VOC) [2,12]. Major VOCs like Alpha, Beta, Gamma, Delta, and Omicron each dramatically reshaped the pandemic dynamics by exploiting these adaptative advantages [10,13,14,15,16,17].
In the state of Tocantins, the spread of COVID-19 was markedly influenced by regional factors, including significant demographic disparities, major transportation corridors like the BR-153 highway (also called Belém–Brasília highway), and unequal access to healthcare. Consequently, the burden of disease was heaviest in areas of high population density and mobility, with vulnerable populations, such as Indigenous, quilombolas, and riverside communities, disproportionately affected [18,19,20,21,22,23]. Although the international public health emergency was declared over in May 2023, the continuous emergence of new SARS-CoV-2 sublineages underscores the critical need for sustained, integrated genomic and epidemiologic surveillance to monitor the virus’s and ongoing impact [2].
Previous studies have stablished a crucial foundation for understanding the COVID-19 pandemic in Tocantins. Epidemiological research has detailed the outbreak’s burden, noting the heightened severity of the second wave [24], and mapped the initial spatial concentration of cases in the capital, Palmas [25]. Complementing this, genomic surveillance efforts have documented the specific circulation of variants, from the P.1.7 sublineage to the later dominance of Omicron sublineages like XBB.1.18.1 [10,23]. At the national level, a recent analysis by Souza et al. (2025) contextualized these efforts, revealing major disparities in genomic surveillance across Brazil. Their work highlighted that while Tocantins did not sequence the highest absolute number of genomes, its proportional sequencing rate was among the nation’s highest, indicating a robust and proactive monitoring program [10].
Specifically, this study aimed to quantify the impact of vaccination and variant dynamics on COVID-19 outcomes in Tocantins between 2020 and 2025 through integrated epidemiological, statistical, and genomic analyses. Therefore, this study provides an integrated, longitudinal analysis of the epidemiological, sociodemographic, and genomic evolution of COVID-19 in Tocantins from March 2020 to May 2025. By correlating the introduction and dominance of key variants (Gamma, Delta, Omicron, and it’s sublineages) with local indicators such as incidence, mortality, hospitalizations, and vaccination coverage, we offer an unprecedented overview of the pandemic’s waves in the state. Importantly, Tocantins emerges not merely as a recipient but as a dynamic corridor for the circulation and dispersion of SARS-CoV-2 variants across Brazil’s North and Central-West regions. This perspective highlights how structural vulnerabilities — including socioeconomic inequality, interstate mobility, and evolving public policies — shaped the five-year trajectory of the pandemic. By consolidating epidemiological and genomic insights, this work provides a robust evidence base to guide more effective public health policies and strengthen genomic surveillance systems in Brazil and beyond.
2. Materials and Methods
2.1. Source Data
Epidemiological data on confirmed COVID-19 cases, deaths, hospital admissions, and vaccination coverage were obtained from the official health surveillance platform of the state of Tocantins, Integra Saúde Tocantins (https://integra.saude.to.gov.br/covid19). Data were aggregated by epidemiological week following the Brazilian national reporting system. The first week of 2020 was defined as January 2–4, with subsequent weeks starting on Sundays. This definition ensured consistency with national public health reporting standards while aligning with the structure of the available dataset.
To reduce short-term fluctuations and emphasize underlying temporal patterns, 7-day centered moving averages (MM7) were calculated for confirmed cases, deaths, hospitalizations, and vaccine doses. The smoothed time series were subsequently aggregated by epidemiological week and calendar year, yielding weekly totals and averages. From these aggregated data, key epidemiological indicators were derived. The incidence rate was defined as the number of confirmed cases per 100,000 inhabitants, assuming an estimated population of 1.6 million for the state of Tocantins. The mortality rate was expressed as the number of deaths per 100,000 inhabitants. Vaccination coverage was estimated as the cumulative number of doses administered divided by the total population, and the vaccine-to-case ratio was calculated as the number of doses administered per confirmed case, reflecting the intensity of immunization efforts relative to disease burden. All indicators were computed in R version 4.5.1 [26] and analyzed across distinct epidemiological phases to evaluate temporal changes in disease burden and public health response.
To evaluate the temporal impact of COVID-19 vaccination on epidemiological indicators, the study period was divided into three phases: (i) the pre-vaccination period (up to epidemiological week 2 of 2021); (ii) the initial vaccination campaign (weeks 3–26 of 2021), corresponding to the early rollout and prioritization of high-risk groups; and (iii) the widespread vaccination phase (week 27 of 2021 onward), reflecting broader population-level coverage. For each phase, weekly data were aggregated and used to assess changes in key indicators, including confirmed cases, deaths, hospitalizations, incidence, mortality, vaccination coverage, and the vaccine-to-case ratio. One-way analysis of variance (ANOVA) was performed for each indicator to test for differences among the three vaccination periods. When ANOVA results were significant (p < 0.05), Tukey’s Honest Significant Difference (HSD) post hoc test was applied to determine pairwise differences between periods. All statistical analyses were conducted in R (version 4.5.1), and visualizations were generated using the ggplot2 package [27].
2.2. Generalized Additive Models for Vaccination Impact Assessment
To investigate the non-linear relationships between weekly COVID-19 vaccine administration and key epidemiological outcomes, we fit generalized additive models (GAMs) using restricted maximum likelihood (REML) estimation. This flexible modeling approach enables the identification of complex associations between predictors and outcomes without imposing strict parametric assumptions.
Separate GAMs were developed for each outcome, smoothed using a 7-week moving average: confirmed cases, deaths, hospitalizations, incidence, mortality, vaccination coverage, and the vaccine-to-case ratio. Each model included three terms: (i) a smooth function of time elapsed since the start of the series (in weeks); (ii) a cyclic smooth for epidemiological week of the year (52 levels) to capture recurring seasonal patterns; and (iii) a smooth function of the weekly average number of vaccine doses administered. Cubic regression splines were applied to continuous time effects, while cyclic cubic splines were used for seasonal terms, ensuring appropriate modeling of both temporal trends and periodic structures.
The significance of smooth terms was evaluated using F-statistics and estimated degrees of freedom (edf), while model performance was assessed by the adjusted coefficient of determination (R²) and the percentage of deviance explained. Assumptions of residual independence and homoscedasticity were verified for all model fits. Partial effects of vaccine administration on each outcome were visualized as central estimates with ±1 standard error confidence interval, allowing interpretation of both the magnitude and direction of associations across the observed range of vaccine coverage. All models were implemented in the mgcv package in R (version 4.5.1), and partial effect plots were generated with ggplot2 to depict the non-linear relationships between vaccination and epidemiological outcomes, accounting for temporal and seasonal components.
2.3. Time Series Analysis of Epidemiological Indicators
To evaluate the temporal impact of the COVID-19 vaccination campaign on key epidemiological indicators in Tocantins, we applied interrupted time series (ITS) analysis through segmented regression models, a standard approach for assessing intervention effects in epidemiological time series. Weekly smoothed values (7-week moving averages, MM7) of confirmed cases, deaths, hospitalizations, incidence, and mortality were modeled independently. The intervention point was set at the third epidemiological week of 2021 (January 17), marking the official start of the vaccination campaign in the state.
For each outcome variable () the model was specified as:
Where: is a continuous variable indicating the week index; is a binary variable indicating whether week t occurred after the intervention (0 = before, 1 = after); counts the number of weeks since the intervention; estimates the intercept (baseline level) at the beginning of the series; estimates the pre-intervention slope; estimates the immediate change in level after the intervention; estimates the change in slope post-intervention, and is the residual error.
Models were fitted using ordinary least squares (OLS) with heteroskedasticity-robust standard errors (HC3). Autocorrelation was assessed through visual inspection of residuals and partial autocorrelation functions. To further disentangle long-term trends, recurrent seasonal patterns, and irregular fluctuations in the COVID-19 epidemiological indicators, we applied seasonal-trend decomposition using loess (STL), originally introduced by Cleveland et al. (1990) [28]. This robust, non-parametric method decomposes time series into three additive components—trend, seasonality, and remainder—while maintaining reliability in the presence of outliers or mild non-stationarity.
Weekly smoothed values (7-week moving averages) were calculated for confirmed cases, deaths, hospitalizations, incidence, mortality, and vaccination coverage to minimize short-term noise and enhance interpretability. All series were aligned with ISO-8601 calendar weeks. STL decomposition was performed under the assumption of an annual seasonal cycle of 52 weeks. To reduce sensitivity to anomalous observations, robust fitting procedures and periodic seasonal windows were applied. Time series were carefully indexed to ensure temporal consistency, and each component—trend, seasonality, and remainder—was visualized using the ggplot2 package to facilitate interpretation. All analyses were performed in R (version 4.5.1).
2.4. Genomic Analysis
SARS-CoV-2 genome sequences and associated metadata were retrieved from the global initiative on sharing all influenza data (GISAID; https://gisaid.org) on 30 June 2025 [29]. Analyses were restricted to samples collected in the state of Tocantins, Brazil, as indicated in the “Location” field in GISAID at the first administrative level (“Brazil / Tocantins”). Records geocoded only at the country level or presenting ambiguous/conflicting location information were excluded from the dataset. We gratefully acknowledge the originating and submitting laboratories for making the data available through GISAID.
SARS-CoV-2 lineages were assigned using pangolin with the pango-designation database available as of 30 June 2025 [30]. For interpretability, assigned lineages were grouped by prefix into “families” (e.g., JN, KP, LP, XBB), with remaining categories aggregated as “other”. To enable comparisons across epidemiological phases, results were summarized across two time windows: January 2020–December 2022 and January 2023–June 2025. Within each window, sequences were aggregated by collection month and lineage. For each aggregation, we report (a) monthly counts and (b) monthly relative frequencies, computed after completing the full month × lineage grid and renormalizing to sum to 100% per month. All figures were generated in R (version 4.5.1) using the ggplot2 package.
2.5. Phylogenetic Analysis
To complement the genomic frequency analyses, we conducted phylogenetic reconstruction using the Nextstrain SARS-CoV-2 workflow (augur/auspice) [31]. This approach enabled us to contextualize the Tocantins genomes within a global phylogenetic framework, employing the Nextstrain Open background dataset (global metadata and sequences; accessed on 30 June 2025: metadata: https://data.nextstrain.org/files/ncov/open/global/metadata.tsv.xz, sequences: https://data.nextstrain.org/files/ncov/open/global/sequences.fasta.xz). Sequence alignment was performed with Nextalign [32] against the Wuhan-Hu-1 reference genome (MN908947.3), applying Nextstrain’s standard masking of terminal regions and community-curated problematic sites. Global contextualization followed Nextstrain’s subsampling strategy (country/month quotas with diversity retention), with all Tocantins genomes forcibly retained. A maximum-likelihood phylogeny was inferred within the pipeline and subsequently converted to a time-scaled tree using TreeTime [33] under the standard SARS-CoV-2 molecular clock prior. Resulting trees and associated summaries were visualized and explored in the Auspice interface (Nextstrain).
3. Results
3.1. Epidemic Dynamics and Vaccination Rollout in Tocantins
The epidemic trajectory of COVID-19 in Tocantins followed a multiphasic pattern, with successive waves of infection and mortality shaping the course of the pandemic. Weekly confirmed case counts were initially low during the early months of 2020 but began to rise steadily by mid-year, culminating in the first major wave between July and September 2020 (Figure 1). A second, more severe wave occurred in early 2021, with sustained high transmission levels between March and May. The most pronounced surge occurred in early 2022 during the Omicron wave, yet mortality remained comparatively lower — a decoupling between incidence and deaths that marked the post-vaccination period. The 7-week moving average clearly delineated the onset, peak, and decline of each wave, providing a smoothed representation of their temporal dynamics (Figure 1).
Weekly COVID-19–related deaths exhibited a similar temporal trend to confirmed cases, though with a slight delay relative to case peaks, consistent with the clinical progression of severe disease (Figure 2). The first mortality peak occurred in August 2020, followed by a sharper and more prolonged peak in April 2021. Notably, while confirmed cases reached their maximum during the 2022 wave, the corresponding rise in weekly deaths was proportionally smaller compared with earlier waves. This decoupling between incidence and mortality in the later stages of the pandemic likely reflects the combined effects of accumulated natural and vaccine-induced immunity, improved access to healthcare, expanded testing capacity, and advances in the clinical management of severe cases.
The COVID-19 vaccination campaign in Tocantins began in early 2021, with a rapid escalation in weekly vaccine administration observed throughout the first semester (Figure 3). Vaccination coverage peaked between May and November 2021, coinciding with the broadening of eligibility criteria and the intensification of statewide immunization efforts. This period was followed by a marked decline in both the incidence of confirmed cases and COVID-19–related mortality, suggesting a significant epidemiological impact of mass vaccination on viral transmission and disease severity. Notably, during the large surge of infections in early 2022—primarily driven by the Omicron variant—a clear decoupling between case incidence and mortality became evident. Despite record numbers of confirmed cases, the mortality burden was substantially lower than in previous waves. This divergence likely reflects enhanced population-level immunity resulting from widespread vaccination combined with prior SARS-CoV-2 exposure, underscoring the pivotal role of immunization in reducing severe clinical outcomes.
3.2. Comparative Analysis Across Vaccination Phases
COVID-19 epidemiological indicators varied significantly across the three vaccination periods defined in Tocantins, Brazil: pre-vaccination (up to epidemiological week 2 of 2021), initial vaccination campaign (weeks 3–26 of 2021), and widespread vaccination (week 27 of 2021 onward). A one-way analysis of variance (ANOVA) was performed for each outcome, and when significant differences were detected, Tukey’s Honest Significant Difference (HSD) test was applied to identify pairwise contrasts (Table 1; Figure S1A-G).
Weekly confirmed cases differed significantly across vaccination periods (F (2, 290) = 35.5, p < 0.001). Average case counts increased from 1,709 in the pre-vaccination phase to 3,921 during the initial campaign, before declining to 848 in the widespread vaccination phase. Post hoc Tukey tests confirmed that all three periods were significantly different from one another (p < 0.05), with the highest burden observed during the initial campaign (Table 1; Figure S1A).
Deaths also varied significantly across vaccination periods (F(2, 290) = 202.0, p < 0.001). Weekly mean deaths rose from 24.6 in the pre-vaccination phase to 77.0 during the initial campaign, before dropping markedly to 3.01 in the widespread vaccination phase. All pairwise contrasts were highly significant (p < 0.001), underscoring the strong temporal association between vaccine rollout and reduced mortality (Table 1; Figure S1B).
Hospitalizations exhibited a comparable trajectory, with significant differences detected across phases (F(2, 290) = 252.0, p < 0.001) (Table 1; Figure S1C). Weekly mean hospital admissions increased from 47.3 in the pre-vaccination period to 133.0 during the initial campaign, then declined to 7.3 in the widespread vaccination phase. Tukey’s test confirmed significant differences among all three periods (p < 0.001).
Incidence rates also varied significantly across vaccination periods (F(2, 290) = 35.5, p < 0.001). Post hoc tests showed that rates were highest during the initial campaign, significantly exceeding both the pre-vaccination (p < 0.001) and widespread vaccination phases (p < 0.001) (Table 1; Figure S1D). Mortality rates mirrored this trend (F(2, 290) = 202.1, p < 0.001), peaking during the initial campaign before showing a pronounced decrease in the widespread vaccination phase (Table 1; Figure S1E).
Vaccination coverage increased markedly over time (F(2, 290) = 1564.0, p < 0.001), with significant differences detected between all three phases (Table 1; Figure S1F). The vaccine-to-case ratio also differed significantly (F(2, 290) = 8.11, p < 0.001), reaching its highest levels during the widespread vaccination period (p = 0.0005 vs. pre-vaccination) (Table 1; Figure S1G).
3.3. Nonlinear Effects of Vaccination Modeled Using GAMs
All fitted GAMs revealed a statistically significant association between weekly COVID-19 vaccine administration and each epidemiological indicator (p < 0.001 for all vaccination smooth terms; Table 2). The model for confirmed cases explained 81.1% of the deviance (adjusted R² = 0.796), with an estimated degrees of freedom (EDF) of 4.66 for the vaccination spline. For deaths, model fit improved, with 89.5% of the deviance explained (adjusted R² = 0.887, EDF = 4.77). The strongest performance was observed for hospitalizations, with 91.4% of the deviance explained (adjusted R² = 0.907, EDF = 5.09) (Table 2).
Slightly lower, though still statistically robust, model fits were observed for incidence and mortality, with adjusted R² values of 0.615 and 0.822, respectively (Table 2). The vaccine-to-case ratio model showed moderate explanatory power (adjusted R² = 0.524), consistent with the higher variability of this composite measure. As expected, vaccination coverage achieved a perfect fit (R² = 1) due to its cumulative nature (Table 2). All models incorporated smooth terms for long-term temporal trends (weeks) and seasonal variation (ISO week), ensuring robust estimation of non-linear effects across the study period.
The estimated smooth functions from the GAMs revealed distinct nonlinear associations between weekly vaccine doses and COVID-19 epidemiological indicators in Tocantins (Figure S2A–G). For confirmed cases, the partial effect initially increased with rising vaccination levels, peaking at approximately 30,000 weekly doses before declining sharply, likely reflecting improved case detection during the early rollout followed by reduced transmission as coverage expanded (Figure S2A). In contrast, deaths and hospitalizations showed pronounced and sustained declines beyond 25,000 doses per week, consistent with the protective effects of vaccination against severe outcomes (Figure S2B and S2C). Similar inverse trends were observed for incidence and mortality rates, reinforcing the role of widespread immunization in reducing overall disease burden (Figure S2D and S2E). As expected, the vaccination coverage curve exhibited a cumulative pattern, while the vaccine-to-case ratio displayed a steady upward trajectory, indicating growing population-level immunity relative to reported infections (Figure S2F and S2G). All plots were adjusted for temporal and seasonal trends, with 95% confidence intervals shown. Collectively, these results highlight the nonlinear, dose–response nature of vaccine impact across epidemiological dimensions and suggest that, beyond a critical threshold, additional weekly doses provide diminishing marginal benefits.
3.4. Interrupted Time Series Analysis of Vaccination Impact
These patterns are consistent with the gradual, cumulative effects captured by the GAM models, confirming a sustained post-vaccination decline across all indicators. The ITS models further quantified these effects, revealing consistent post-vaccination trend reversals across all analyzed COVID-19 indicators in Tocantins (Table 3; Figure 4A–E). Prior to the intervention, confirmed cases increased significantly on a weekly basis (β₁ = +52.44; p < 0.001) (Figure 4A). Although no immediate level change was detected at the start of the vaccination campaign (β₂ = +64.45; p = 0.881), a significant post-intervention trend reversal was observed (β₃ = –70.14; p < 0.001), indicating a sustained and progressive decline in case counts.
Similarly, deaths (Figure 4B) and hospitalizations (Figure 4C) displayed significant upward trends prior to the intervention (β₁ = +0.62 and +0.98; both p < 0.001), followed by marked reversals in slope after the onset of vaccination (β₃ = –0.88 and –1.46; both p < 0.001). As with cases, neither outcome exhibited an immediate level shift, indicating that the impact of vaccination on severe outcomes was progressive rather than abrupt.
For incidence (Figure 4D) and mortality rates (Figure 4E), pre-intervention trends were likewise significantly positive (β₁ = +3.40 and +0.04; both p < 0.001). Immediate level changes were not statistically significant (β₂ = +0.51 and –0.08), but both indicators showed pronounced post-intervention reversals in slope (β₃ = –4.49 and –0.06; both p < 0.001). Taken together, these findings indicate that the vaccination campaign was associated with sustained reductions in COVID-19 transmission and severity, even without abrupt level shifts.
3.5. Temporal Decomposition of Epidemiological Indicators (STL Analysis)
The STL decomposition of epidemiological time series in Tocantins revealed distinct temporal dynamics across COVID-19 indicators (Figures S3A–F). Confirmed cases exhibited a pronounced seasonal component, with recurrent mid-year peaks, and a long-term trend marked by a steady increase until early 2022, followed by a sustained decline (Figure S3A). In addition, the series displayed short-term irregular fluctuations, likely reflecting localized outbreaks or inconsistencies in case reporting during critical phases of the pandemic.
The trajectory of COVID-19–related deaths partially mirrored the trends observed in confirmed cases, albeit with a less pronounced seasonal component (Figure S3B). The long-term trend showed a steep increase in mortality through mid-2021, followed by a gradual and sustained decline. Irregular fluctuations were also evident, suggesting episodic mortality surges potentially associated with health system strain, the circulation of more virulent variants, or delays in death registration during periods of heightened disease burden. Hospitalizations followed a similar trajectory, peaking in early 2022 and subsequently declining (Figure S3C). Seasonal variation was evident, while short-term deviations likely reflected changes in admission practices, access to care, or localized service demands.
The incidence rate displayed a rising trajectory during the early phase of the pandemic, gradually tapering over time (Figure S3D). Seasonal components closely aligned with case data, while short-term variability reflected transient fluctuations in transmission dynamics or surveillance coverage. In contrast, the mortality rate exhibited a smoother and more stable profile (Figure S3E). Its long-term trend increased during the initial stage of the pandemic, followed by a clear and sustained decline from 2022 onward. Seasonal variation was minimal, and only minor residual anomalies were detected, likely attributable to reporting delays or shifts in population vulnerability.
Vaccination coverage exhibited a distinctly regular profile (Figure S3F). The trend component revealed a continuous and sustained increase from early 2021 onward, reflecting the progressive rollout of vaccination campaigns. In contrast to other indicators, this series displayed negligible seasonal or irregular variation, underscoring the structured and consistent implementation of vaccine distribution across the state.
3.6. SARS-CoV-2 Genomic Surveillance and Lineage Dynamics
Between September 2020 and May 2025, a total of 3,941 SARS-CoV-2 genomes were sequenced in Tocantins, of which 168 lacked geographic metadata. The remaining 3,773 genomes were successfully assigned to municipalities across the state. Sequencing efforts were heavily concentrated in Palmas (1,895 genomes), followed by Gurupi (262), Porto Nacional (210), Araguaína (151), and Paraíso do Tocantins (113) (Figure S4; Table S1). Additional municipalities, including Formoso do Araguaia (73), Miracema do Tocantins (65), Miranorte (53), Alvorada (42), and Dueré (39), contributed smaller yet epidemiologically relevant numbers (Figure S4; Table S1).
The spatial distribution, as illustrated in the heatmap, reflects population density, healthcare infrastructure, and the concentration of diagnostic and sequencing facilities across Tocantins (Figure S4). Palmas, the state capital, houses the state’s main hospitals, public health laboratories, and research institutions, which explains its disproportionate contribution to genomic sampling. In contrast, smaller or remote municipalities were underrepresented, a pattern likely driven not only by lower population density but also by logistical barriers to sample transport and the absence of local diagnostic infrastructure—factors that collectively shaped the genomic surveillance landscape.
A total of 166 distinct SARS-CoV-2 lineages were identified among the 3,941 genomes sequenced in Tocantins between September 2020 and May 2025. Of these, 53 lineages (31.9%) were detected only once, reflecting sporadic introductions or isolated transmission events. The most frequently observed lineages were BA.1.14.1 (797 genomes), XBB.1.18.1 (233), AY.99.2 (225), BQ.1.1 (223), and P.1 (151), which together accounted for a substantial proportion of the dataset (Figure S5A).
By early 2025, the genomic landscape in Tocantins was shaped by the circulation of 19 distinct lineages between January and May (Figure S5B). A clear predominance of LP.8.1.4 (62 genomes) was observed, establishing this lineage as the dominant background during the period. In parallel, PD sublineages—notably PD.1 (17 genomes) and PD.1.2 (17 genomes)—emerged as relevant co-circulating variants, while LP.8.1.2 (9 genomes), PD.2 (4 genomes), and JN.1.11 (4 genomes) were detected at moderate frequencies. The remaining lineages, including JN.1.49.1, KP.2.3.12, LP.8.1.1, MC.33.1, KP.1, LF.7.5, LP.7, MC.10.1, NY.1, PD.2.1, XDQ, XEC, and XEC.32, appeared only sporadically (≤ 2 detections each), suggesting restricted local transmission or isolated introductions (Figure S5B).
At the municipal scale, lineage diversity strongly reflected sequencing depth. Palmas, which contributed the largest number of genomes, also displayed the broadest lineage spectrum (132 lineages), followed by Gurupi (57 lineages), Porto Nacional (39 lineages), Araguaína (38 lineages), and Paraíso do Tocantins (33 lineages), albeit at smaller scales (Table S1). This pattern highlights the direct relationship between sequencing effort and the ability to capture viral diversity: municipalities with higher sequencing intensity revealed a wider array of circulating lineages, whereas those with limited sampling often showed only one or two variants, thereby constraining epidemiological resolution.
During 2020, SARS-CoV-2 transmission in Tocantins was dominated by B.1.1 lineages, particularly B.1.1.28 and B.1.1.33, with P.2 emerging toward the end of the year (Figures 5A and 5B). In early 2021, Gamma (P.1) expanded rapidly and maintained dominance throughout the first half of the year, before being progressively displaced by Delta in late 2021. The early months of 2022 were characterized by the Omicron BA.1 wave (including BA.1 and BA.1.14.1), followed by the co-circulation of BA.2 and BA.4, and subsequently by the rise of BA.5 (notably BA.5.1 and BA.5.2.1), reflecting successive within-Omicron lineage replacements (Figure 5A and 5B).
Sequencing throughput varied over time, with more genomes generated during epidemic peaks—most notably during the Gamma wave and the onset of Omicron—and fewer sequences processed between waves. This fluctuation is reflected in the count panels, where epidemic surges correspond to higher bars. In contrast, normalized frequency trajectories demonstrate that lineage turnover was not an artifact of sequencing volume but reflected genuine shifts in viral dominance: from early B.1.1 lineages to Gamma, followed by Delta, and ultimately successive Omicron sublineages.
In early 2023, concurrent circulation of BQ.1/BQ.1.1 and BE lineages was documented, followed shortly by the emergence of XBB, with XBB.1.18.1 as an early representative of this group (Figure 6A and 6B). By mid-2023, JD lineages (e.g., JD.1/JD.1.1) increased in prevalence, while GK appeared only sporadically, reflecting a gradual reshaping of the Omicron landscape. Toward the end of 2023, JN lineages—most notably JN.1.1 and JN.1.29—emerged and, by March 2024, consolidated as the dominant background. Although sequencing throughput fluctuated across months (Figure 6A), the normalized frequency trajectories (Figure 6B) reveal a smooth and orderly progression from BQ/BE to XBB/JD, and ultimately to JN, largely unaffected by variability in sequencing intensity.
From March 2024 onward, JN and its sublineages (JN.1, JN.1.1, JN.1.29) predominated, with only sporadic detection of recombinants such as XDR. During April–May, the MJ lineage (including MJ.1) emerged and co-circulated with JN, while by late 2024 KP was introduced at low to moderate levels and XEC persisted sporadically (Figure 6C and 6D). A major transition occurred in early 2025, when LP.8.1.4 rose to predominance alongside sustained PD activity (PD.1, PD.1.2, PD.2*), coinciding with the decline of JN. Between March and June 2025, LP maintained dominance with intermittent PD and KP activity and residual traces of JN and MC. As in earlier periods, sequencing throughput fluctuated (Figure 6C), yet normalized frequencies (Figure 6D) delineate a coherent within-Omicron succession, robust to variations in sampling intensity.
We reconstructed a time-scaled phylogeny of 8,121 SARS-CoV-2 genomes using the Nextstrain workflow to contextualize Tocantins sequences within a global framework (Figure 7A), and Tocantins genomes were distributed across multiple, geographically diverse clades rather than forming a single monophyletic cluster, indicating repeated introductions followed by local transmission (Figure 7B). Early lineages (2020–2021) were associated with pre-Omicron clades 20A/20B and the Gamma variant (20J). From late 2021 onward, Omicron lineages became dominant, showing successive replacements from 21K (BA.1) to 21L (BA.2) and 22B (BA.5) throughout 2022. During 2023, Tocantins sequences mirrored global trends, following the rise of 22E (BQ.1) and 23A/22F (XBB, XBB.1.5). In line with these dynamics, the phylogeny captures the progressive diversification of Omicron sublineages and their temporal succession in Tocantins.
From late 2023 into 2024, the phylogeny revealed the emergence of clade 23I (BA.2.86/JN.1), followed by 24C (KP.3) and 24D (XDV.1), reflecting ongoing lineage replacement. In early 2025, clade 25A (LP.8.1)—particularly sublineage LP.8.1.4—expanded to predominance, while residual signals of 25B (NB.1.8.1) and 25C (XFG) persisted at lower frequencies. The short internal branches and stepwise turnover across calendar time are consistent with rapid lineage replacement within Omicron, mirroring global patterns while documenting repeated introductions and local diversification in Tocantins. In line with these dynamics, Nextstrain’s “emerging lineages” module flagged XBB.1.9.1, XBB.1.42, FE.1, JD.1, and LB.1 among Tocantins-associated sequences, as highlighted in the root-to-tip regression and time-scaled phylogeny views (Figure S6).
4. Discussion
These findings provide the basis for a broader interpretation of how epidemiological and genomic dynamics shaped the COVID-19 pandemic in Tocantins and beyond. Between 2020 and 2025, the pandemic unfolded in clearly defined phases. The first two years were marked by high mortality, particularly in 2021, when the case fatality rate reached 1.81%. This period coincided with the circulation of Gamma (P.1) and Delta variants, associated with greater clinical severity and high hospitalization demand [11,23,34], leading to the collapse of the state health system. Our results confirm that this was the apex of the health crisis, characterized by hospital overload and pronounced inequality in response capacity among municipalities, consistent with the findings of Cesar et al. (2021), who reported elevated mortality in Tocantins during this phase [24]. Similar patterns were observed nationally and globally, as Gamma and Delta waves produced comparable peaks of morbidity and mortality, reinforcing the broader relevance of the Tocantins case study [9,12,23].
From early 2022 onwards, the epidemiological scenario changed substantially. The arrival of the Omicron variant triggered a record surge in infections but was accompanied by a sharp decline in deaths, with fatality rates dropping to 0.19%. This decoupling between incidence and mortality reflects accumulated population immunity — derived from large-scale vaccination and prior exposures — as well as advances in clinical management and health service preparedness [9,10,12,16]. In Tocantins, the reduction was particularly pronounced, indicating that vaccine coverage had reached protective levels even amid intense viral circulation.
As vaccination expanded and hospital capacity improved, COVID-19 entered a stage of stabilization and endemicity. The time series revealed successive waves of differing intensity, shaped by both biological and contextual factors. The 2021 Gamma–Delta wave represented the apex of severity, whereas the 2022 Omicron wave marked the transition to low-lethality, endemic circulation. This shift underscores the combined effects of immunization, improved clinical care, increased bed availability, and strengthened preventive practices [35,36,37,38].
Spatial analysis revealed important disparities: while Palmas and Araguaína concentrated the largest volume of cases and deaths, small municipalities exhibited disproportionately high fatality rates at the beginning of the pandemic, some exceeding 5%. These findings suggest not only greater severity among diagnosed cases but also underreporting of mild infections and barriers to diagnosis and hospitalization [4,25]. This pattern exposes the structural vulnerability of the state’s more remote regions, consistent with reports of social and health inequalities affecting vulnerable populations [19,39,40].
The progression of epidemic waves contextualizes these patterns. The first wave, in mid-2020, was moderate but sufficient to expose the limitations of the state hospital system and epidemiological surveillance. The peak occurred between March and May 2021, when fatality rates reached their highest levels. The rapid expansion of the Gamma (P.1) variant, followed by the introduction of Delta, accounted for much of the severity of this period [13,23,34]. In addition to greater viral transmissibility, limited vaccine coverage and hospital overload further aggravated the impact, with fatality rates exceeding 3% at certain points [36].
In early 2022, the emergence of the Omicron variant triggered a wave characterized by record infection numbers but proportionally low mortality. This phase reflects the protective effect of accumulated population immunity from vaccination and prior exposures, which substantially mitigated severe outcomes even amid intense viral circulation, as also noted by Salzberger et al. (2021) and Gomes et al. (2024) [9,16].
Between 2023 and 2025, the epidemic curve displayed, only minor oscillations, indicating stable viral circulation, sustained by localized transmission chains and very low lethality [37]. The contrast between the early crisis years and the final endemic stage highlights the combined impact of widespread immunization, expanded healthcare capacity, and adaptation of preventive practices [38].
Previous surveillance data in Tocantins indicated that young adults (20–49 years) concentrated most infections, while mortality disproportionately affected the elderly [41]. This discrepancy reinforces the role of the economically active population as the main vector of transmission, whereas physiological vulnerability and comorbidities in older individuals led to more severe outcomes [42]. At the pandemic’s peak in 2021, this group accounted for the majority of deaths, justifying the prioritization of vaccination among the elderly and immunosuppressed [43]. After 2022, the significant drop in mortality within this group confirmed the protective effect of immunization, consistent with international evidence showing that vaccines markedly reduced mortality in older age groups [44].
Likewise, state-level reports show that women were more frequently diagnosed (56% of cases), while men accounted for most deaths (59%) [45]. This suggests that, although more exposed through occupational and social factors, women sought testing and care more frequently, leading to higher detection rates [46]. Men, in turn, besides having a higher prevalence of comorbidities, exhibited lower adherence to preventive care and vaccination, which may have increased fatality in this group [47]. These differences were most evident in 2020–2021 and decreased after vaccination coverage expanded [16,24].
Annual trends corroborate these patterns: 2021 concentrated the greatest burden of morbidity and mortality, with cases and deaths more than doubling compared to the previous year [48]. From 2022 onwards, despite over 124,000 cases, mortality fell by more than 90% [49]. This pattern persisted in subsequent years, with residual numbers in 2023 and 2025, although 2024 showed a slight increase, possibly linked to Omicron subvariants [10].
Taken together, these results demonstrate that the pandemic unequally affected population groups in Tocantins: young adults were more exposed, the elderly more vulnerable to death, and men at greater risk of severe outcomes [50]. From 2022, sustained immunization and health system adaptation consolidated a low-severity endemic pattern [51]. This underscores the need for continuous protection of older adults and men, and for surveillance capable of anticipating outbreaks in vulnerable subgroups [52].
Vaccination represented the most decisive turning point in Tocantins, consistently altering the trajectory of key epidemiological indicators [53]. In 2021, the rapid expansion of coverage coincided with a progressive decline in mortality — from a weekly average of 77 deaths at the beginning of the campaign to only 3 after large-scale vaccination. Hospitalizations followed the same trend, dropping from 133 to 7.3 weekly admissions, confirming that immunization primarily reduced severe outcomes [16,17]. Even during the Omicron-driven peak of 2022, mortality remained low, highlighting the effectiveness of vaccination in decoupling incidence and lethality, as also demonstrated by Lamarca et al. (2023) and Souza et al. (2025) [10,12].
Statistical analyses solidly confirm this effect. ANOVA and Tukey tests show significant differences between pre-vaccination, initial campaign, and mass vaccination periods for all indicators assessed (p < 0.001) [54]. GAMs reinforce the dose–response association, with greater explanatory power for hospitalizations (adjusted R² = 0.907) and deaths (0.887) [55]. ITS models reveal clear reversals in growth trends after intervention, indicating a sustained vaccination effect even without immediate level changes [56]. Seasonal decomposition (STL) complements this picture, revealing a continuous downward trend from 2022 onwards [57].
This set of analyses demonstrates that vaccination not only reduced COVID-19 severity but also redefined the state’s epidemiological pattern, enabling the transition to a regime of low circulation and endemic impact from 2023 [58]. In addition to confirming findings from the literature, data from Tocantins provide local evidence of vaccination effectiveness in reducing hospital pressure and mortality by over 90% [59]. In summary, the Tocantins experience shows that vaccination was the most impactful intervention in controlling COVID-19, supported by multiple statistical approaches and confirmed by the state’s epidemiological trajectory [60]. These results highlight the importance of maintaining booster strategies and continuous surveillance, essential for containing localized outbreaks and anticipating new variants [61].
Genomic surveillance carried out in Tocantins between September 2020 and May 2025 reveals a diverse and constantly evolving scenario of SARS-CoV-2 circulation. Sequencing of nearly 4,000 genomes enabled the identification of both the wide diversity of lineages and the chronology of viral replacements that accompanied the main milestones of the pandemic [17]. Spatial distribution shows a strong concentration in Palmas, responsible for more than half of the sequences, reflecting its higher population density and centralized health infrastructure. In contrast, smaller or remote municipalities were underrepresented, highlighting logistical weaknesses in sample collection and transport — a situation also reported elsewhere in northern Brazil [25]. This sampling inequality emphasizes the need to decentralize surveillance to increase regional representativeness.
From an evolutionary perspective, the state’s trajectory mirrored the global pattern: B.1.1 and P.2 lineages dominated in 2020, giving way to Gamma (P.1) in 2021, followed by Delta later that year [23,34]. In 2022, the introduction of Omicron triggered the largest wave of cases, with rapid turnover among sublineages (BA.1, BA.2, BA.4, BA.5), evidencing the high adaptive capacity of this variant group [10,12]. In subsequent years, an orderly sequence of transitions occurred within Omicron: in 2023, BQ.1/BQ.1.1 and BE circulated, later replaced by XBB, JD, and JN, which predominated until early 2024. In 2025, a new shift was marked by the rise of LP.8.1.4 and the emergence of PD sublineages, while other variants—such as KP and residual JN lineages—persisted at low frequency.
The detection of 166 lineages, with more than 30% identified only once, highlights Tocantins as a site of both occasional introductions and sustained transmission. The state’s geographic position, connecting the North and Midwest, contributed to this dynamic, functioning as a regional mobility corridor [20,21,23]. These results show that, although Tocantins followed the national pattern of variant replacement, it displayed unique features in the rhythm and intensity of waves, influenced by factors such as population density, hospital infrastructure, and vaccination coverage [62]. The recent predominance of LP.8.1.4 and PD lineages in 2025 underscores the need to maintain active surveillance, given their potential to sustain local transmission chains. Furthermore, the spatial and temporal heterogeneity of sequencing indicates that expanding and decentralizing genomic surveillance is essential to anticipate risk scenarios and guide public health policies in the state [63]. The integration of these findings with epidemiological analyses illustrates how variant succession directly aligned with the severity and volume of cases observed during pandemic waves [64]. Altogether, these results demonstrate how integrated genomic and epidemiological surveillance can inform timely and regionally tailored responses to emerging variants.
This study has some limitations, which should be considered when interpreting the results. First, reliance on officially reported cases and deaths likely underestimates true incidence, particularly in remote areas with limited testing capacity. Second, genomic surveillance, although extensive, was unevenly distributed across municipalities, potentially biasing lineage representation. Third, sociodemographic factors such as occupation, income, and mobility were not explored in depth, which may have contributed to observed disparities. Despite these limitations, integrating epidemiological and genomic data provides a robust picture of the pandemic’s trajectory in Tocantins, offering lessons relevant not only for Brazil but also for other regions facing similar structural challenges.
5. Conclusions
This study demonstrates how Tocantins underwent a marked transition from a high-burden pandemic phase in 2020–2021 to an endemic scenario of low mortality sustained from 2023 onwards. Vaccination was the decisive turning point, reducing hospitalizations and deaths by more than 90% and driving a stable decoupling between incidence and severity. In parallel, genomic surveillance documented successive waves of variant replacement, culminating with the predominance of LP.8.1.4 in 2025, which underscores the adaptive nature of SARS-CoV-2. Together, these findings underscore two complementary lessons: (i) immunization remains the most powerful tool to mitigate morbidity and mortality, and (ii) continuous, decentralized genomic surveillance is essential for anticipating emerging threats and ensuring equitable public health responses.
Supplementary Materials
The following supporting information can be downloaded at the website of this paper posted on Preprints.org. Figure S1. Distribution of key COVID-19 epidemiological indicators across vaccination phases in Tocantins, Brazil (2020–2025). Figure S2. Partial effect plots showing the association between weekly COVID-19 vaccination and key epidemiological indicators in Tocantins, Brazil. Figure S3. Seasonal–trend decomposition using Loess (STL) applied to weekly COVID-19 epidemiological time series in Tocantins, Brazil (January 2020–July 2025). Figure S4. Spatial distribution of SARS-CoV-2 genome sequences obtained in Tocantins, Brazil, from September 2020 to May 2025. Figure S5. SARS-CoV-2 lineages detected in Tocantins, Brazil, from September 2020 to May 2025. Figure S6. Emerging SARS-CoV-2 lineages in Tocantins visualized with Nextstrain/Auspice. Table S1. SARS-CoV-2 genomic surveillance in Tocantins by municipality (study period). Table S2. Data availability. GISAID Identifier: EPI_SET_251017vr.
Author Contributions
Conceptualization: O.d.S.d.C., U.J.B.d.S. and F.S.C.; methodology: O.d.S.d.C., U.J.B.d.S., and F.S.C.; software: O.d.S.d.C. and U.J.B.d.S., validation: O.d.S.d.C., U.J.B.d.S., F.D.P.C., E.E.G. B.M.R., G.R.d.S., R.N.d.A.F., M.G.S., F.R.S. and F.S.C.; formal analysis: O.d.S.d.C., U.J.B.d.S., F.R.S. and F.S.C.; investigation: O.d.S.d.C., U.J.B.d.S., and F.S.C.; resources: E.E.G., F.R.S. and F.S.C.; data curation: O.d.S.d.C., U.J.B.d.S., F.R.S. and F.S.C.; writing—original draft preparation: O.d.S.d.C., U.J.B.d.S., and F.S.C.; writing—review and editing: O.d.S.d.C., U.J.B.d.S., F.D.P.C., E.E.G., B.M.R., G.R.d.S., R.N.d.A.F., M.G.S., F.R.S. and F.S.C.; visualization: O.d.S.d.C., U.J.B.d.S., F.R.S. and F.S.C.; supervision: F.R.S. and F.S.C.; project administration: U.J.B.d.S., F.R.S. and F.S.C.; funding acquisition: F.R.S. and F.S.C. All authors have read and agreed to the published version of the manuscript.
Funding
This work was partially supported with grants from Rede Corona-ômica BR MCTI/FINEP (http://www.corona-omica.br-mcti.lncc.br, accessed on 10 September 2025) affiliated by RedeVírus/MCTI (FINEP = 01.20.0029.000462/20, CNPq = 404096/2020-4). The Federal University of Tocantins, Feevale, and the Federal University of Rio Grande do Sul helped pay for the publishing charges for Open Access articles.
Institutional Review Board Statement
Not applicable.
Informed Consent Statement
Not applicable.
Data Availability Statement
The authors declare that all data supporting the findings of this study are available within the paper. The SARS-CoV-2 genomes were obtained from the GISAID database and were described in Table S2.
Acknowledgments
We thank the entire team at Lacen-TO for their tireless work during the SARS-CoV-2 pandemic. U.J.B.d.S. was granted a post-doctoral scholarship (DTI-A) from CNPq. B.M.R., G.R.S., F.R.S., and F.S.C. are CNPq research fellows. The acknowledgments table for all GISAID sequences included in this study is available in Table S2.
References
- Singh, D.; Yi, S. V. On the Origin and Evolution of SARS-CoV-2. Exp Mol Med 2021, 53, 537–547. [Google Scholar] [CrossRef]
- World Health Organization (WHO) Statement on the Fifteenth Meeting of the IHR (2005) Emergency Committee on the COVID-19 Pandemic. Available online: https://www.who.int/news/item/05-05-2023-statement-on-the-fifteenth-meeting-of-the-international-health-regulations-(2005)-emergency-committee-regarding-the-coronavirus-disease-(covid-19)-pandemic (accessed on 21 August 2025).
- Oliveira, W.K. de; Duarte, E.; França, G.V.A. de; Garcia, L.P. Como o Brasil Pode Deter a COVID-19. Epidemiologia e Serviços de Saúde 2020, 29, e2020044. [Google Scholar] [CrossRef]
- Bessa, K.; Alves da Luz, R. A Pandemia de Covid-19 e as Particularidades Regionais Da Sua Difusão No Segmento de Rede Urbana No Estado Do Tocantins, Brasil. Ateliê Geográfico 2020, 14, 6–28. [Google Scholar] [CrossRef]
- Harvey, W.T.; Carabelli, A.M.; Jackson, B.; Gupta, R.K.; Thomson, E.C.; Harrison, E.M.; Ludden, C.; Reeve, R.; Rambaut, A.; Peacock, S.J.; et al. SARS-CoV-2 Variants, Spike Mutations and Immune Escape. Nat Rev Microbiol 2021, 19, 409–424. [Google Scholar] [CrossRef] [PubMed]
- Moeller, N.H.; Shi, K.; Demir, Ö.; Belica, C.; Banerjee, S.; Yin, L.; Durfee, C.; Amaro, R.E.; Aihara, H. Structure and Dynamics of SARS-CoV-2 Proofreading Exoribonuclease ExoN. Proceedings of the National Academy of Sciences 2022, 119, e2106379119. [Google Scholar] [CrossRef] [PubMed]
- Peacock, T.P.; Penrice-Randal, R.; Hiscox, J.A.; Barclay, W.S. SARS-CoV-2 One Year on: Evidence for Ongoing Viral Adaptation. Journal of General Virology 2021, 102. [Google Scholar] [CrossRef] [PubMed]
- Li, J.; Lai, S.; Gao, G.F.; Shi, W. The Emergence, Genomic Diversity and Global Spread of SARS-CoV-2. Nature 2021, 600, 408–418. [Google Scholar] [CrossRef]
- Salzberger, B.; Buder, F.; Lampl, B.; Ehrenstein, B.; Hitzenbichler, F.; Holzmann, T.; Schmidt, B.; Hanses, F. Epidemiology of SARS-CoV-2. Infection 2021, 49, 233–239. [Google Scholar] [CrossRef]
- Souza, U.J.B. de; Spilki, F.R.; Tanuri, A.; Roehe, P.M.; Campos, F.S. Two Years of SARS-CoV-2 Omicron Genomic Evolution in Brazil (2022–2024): Subvariant Tracking and Assessment of Regional Sequencing Efforts. Viruses 2025, 17, 64. [Google Scholar] [CrossRef]
- Michelon, C.M. Main SARS-CoV-2 Variants Notified in Brazil. Revista Brasileira de Análises Clínicas 2021, 53, 109–116. [Google Scholar] [CrossRef]
- Lamarca, A.P.; Souza, U.J.B. de; Moreira, F.R.R.; Almeida, L.G.P. de; Menezes, M.T. de; Souza, A.B. de; Ferreira, A.C.d.S.; Gerber, A.L.; Lima, A.B. de; Guimarães, A.P. de C.; et al. The Omicron Lineages BA.1 and BA.2 (Betacoronavirus SARS-CoV-2) Have Repeatedly Entered Brazil through a Single Dispersal Hub. Viruses 2023, 15. [Google Scholar] [CrossRef]
- Giovanetti, M.; Fonseca, V.; Wilkinson, E.; Tegally, H.; San, E.J.; Althaus, C.L.; Xavier, J.; Nanev Slavov, S.; Viala, V.L.; Ranieri Jerônimo Lima, A.; et al. Replacement of the Gamma by the Delta Variant in Brazil: Impact of Lineage Displacement on the Ongoing Pandemic. Virus Evol 2022, 8, veac024. [Google Scholar] [CrossRef] [PubMed]
- Alcantara, L.C.J.; Nogueira, E.; Shuab, G.; Tosta, S.; Fristch, H.; Pimentel, V.; Souza-Neto, J.A.; Coutinho, L.L.; Fukumasu, H.; Sampaio, S.C.; et al. SARS-CoV-2 Epidemic in Brazil: How the Displacement of Variants Has Driven Distinct Epidemic Waves. Virus Res 2022, 315, 198785. [Google Scholar] [CrossRef] [PubMed]
- Arantes, I.; Gomes Naveca, F.; Gräf, T.; Miyajima, F.; Faoro, H.; Luz Wallau, G.; Delatorre, E.; Reis Appolinario, L.; Cavalcante Pereira, E.; Venas, T.M.M.; et al. Emergence and Spread of the SARS-CoV-2 Variant of Concern Delta across Different Brazilian Regions. Microbiol Spectr 2022, 10, e02641–21. [Google Scholar] [CrossRef] [PubMed]
- Gomes, B.B.M.; Ferreira, N.N.; Garibaldi, P.M.M.; Dias, C.F.S. de L.; Silva, L.N.; Almeida, M.A.A.L. dos S.; de Moraes, G.R.; Covas, D.T.; Kashima, S.; Calado, R.T.; et al. Impact of SARS-CoV-2 Variants on COVID-19 Symptomatology and Severity during Five Waves. Heliyon 2024, 10, e40113. [Google Scholar] [CrossRef]
- de Souza, U.J.B.; dos Santos, R.N.; Campos, F.S.; Lourenço, K.L.; da Fonseca, F.G.; Spilki, F.R. High Rate of Mutational Events in SARS-CoV-2 Genomes across Brazilian Geographical Regions, February 2020 to June 2021. Viruses 2021, 13, 1806. [Google Scholar] [CrossRef]
- Oliveira, J.F.; Alencar, A.L.; Cunha, M.C.L.S.; Vasconcelos, A.O.; Cunha, G.G.; Miranda, R.B.; Filho, F.M.H.S.; Silva, C.; Gustani-Buss, E.; Khouri, R.; et al. Human Mobility Patterns in Brazil to Inform Sampling Sites for Early Pathogen Detection and Routes of Spread: A Network Modelling and Validation Study. Lancet Digit Health 2024, 6, e570–e579. [Google Scholar] [CrossRef]
- Vitorino, L.C.; de Souza, U.J.B.; Oliveira Reis, M.N.; Bessa, L.A. The Impact of COVID-19 on the Indigenous Peoples Related to Air and Road Networks and Habitat Loss. PLOS Global Public Health 2022, 2, e0000166. [Google Scholar] [CrossRef]
- Souza, U.J.B. de; Macedo, Y. da S.M.; Santos, R.N. dos; Cardoso, F.D.P.; Galvão, J.D.; Gabev, E.E.; Franco, A.C.; Roehe, P.M.; Spilki, F.R.; Campos, F.S. Circulation of Dengue Virus Serotype 1 Genotype V and Dengue Virus Serotype 2 Genotype III in Tocantins State, Northern Brazil, 2021–2022. Viruses 2023, 15. [Google Scholar] [CrossRef]
- Souza, U.J.B. de; Santos, R.N. dos; Giovanetti, M.; Alcantara, L.C.J.; Galvão, J.D.; Cardoso, F.D.P.; Brito, F.C.S.; Franco, A.C.; Roehe, P.M.; Ribeiro, B.M.; et al. Genomic Epidemiology Reveals the Circulation of the Chikungunya Virus East/Central/South African Lineage in Tocantins State, North Brazil. Viruses 2022, 14. [Google Scholar] [CrossRef]
- Carmo, R.F.; Nunes, B.E.B.R.; Machado, M.F.; Armstrong, A.C.; Souza, C.D.F. Expansion of COVID-19 within Brazil: The Importance of Highways. J Travel Med 2020, 27. [Google Scholar] [CrossRef]
- de Souza, U.J.B.; dos Santos, R.N.; de Melo, F.L.; Belmok, A.; Galvão, J.D.; de Rezende, T.C.V.; Cardoso, F.D.P.; Carvalho, R.F.; da Silva Oliveira, M.; Ribeiro Junior, J.C.; et al. Genomic Epidemiology of SARS-CoV-2 in Tocantins State and the Diffusion of P.1.7 and AY.99.2 Lineages in Brazil. Viruses 2022, 14, 659. [Google Scholar] [CrossRef]
- Evaristo Marcondes Cesar, A.; Elena Guerrero Daboin, B.; Cristina Morais, T.; Portugal, I.; De Oliveira Echeimberg, J.; Miller Reis Rodrigues, L.; Cauê Jacintho, L.; Daminello Raimundo, R.; Elmusharaf, K.; Eduardo Siqueira, C. Analysis of COVID-19 Mortality and Case-Fatality in a Low- Income Region: An Ecological Time-Series Study in Tocantins, Brazilian Amazon. Journal of Human Growth and Development 2021, 31, 496–506. [Google Scholar] [CrossRef]
- Rodrigues Araujo, S.; Bezerra Sirtoli, D. Análise Da Distribuição Do Sars-COv-2 Nas Regiões de Saúde Do Estado Do Tocantins. Amazônia Science and Health 2021, 9, 13–20. [Google Scholar] [CrossRef]
- Ripley, B.D. The R Project in Statistical Computing. MSOR connections. The newsletter of the LTSN Maths, Stats & OR Network 2001, 1, 23–25. [Google Scholar]
- Wickham, H. Ggplot2. WIREs Computational Statistics 2011, 3, 180–185. [Google Scholar] [CrossRef]
- Cleveland, R.B.; Cleveland, W.S.; McRae, J.E.; Terpenning, I. STL: A Seasonal-Trend Decomposition. J. off. Stat 1990, 6, 3–73. [Google Scholar]
- Shu, Y.; McCauley, J. GISAID: Global Initiative on Sharing All Influenza Data–from Vision to Reality. Eurosurveillance 2017, 22, 30494. [Google Scholar] [CrossRef]
- O’Toole, Á.; Pybus, O.G.; Abram, M.E.; Kelly, E.J.; Rambaut, A. Pango Lineage Designation and Assignment Using SARS-CoV-2 Spike Gene Nucleotide Sequences. BMC Genomics 2022, 23, 121. [Google Scholar] [CrossRef]
- Hadfield, J.; Megill, C.; Bell, S.M.; Huddleston, J.; Potter, B.; Callender, C.; Sagulenko, P.; Bedford, T.; Neher, R.A. Nextstrain: Real-Time Tracking of Pathogen Evolution. Bioinformatics 2018, 34, 4121–4123. [Google Scholar] [CrossRef]
- Aksamentov, I.; Roemer, C.; Hodcroft, E.; Neher, R. Nextclade: Clade Assignment, Mutation Calling and Quality Control for Viral Genomes. J Open Source Softw 2021, 6, 3773. [Google Scholar] [CrossRef]
- Sagulenko, P.; Puller, V.; Neher, R.A. TreeTime: Maximum-Likelihood Phylodynamic Analysis. Virus Evol 2018, 4. [Google Scholar] [CrossRef] [PubMed]
- Giovanetti, M.; Slavov, S.N.; Fonseca, V.; Wilkinson, E.; Tegally, H.; Patané, J.S.L.; Viala, V.L.; San, E.J.; Rodrigues, E.S.; Santos, E.V.; et al. Genomic Epidemiology of the SARS-CoV-2 Epidemic in Brazil. Nat Microbiol 2022, 7, 1490–1500. [Google Scholar] [CrossRef]
- Santangelo, O.E.; Provenzano, S.; Di Martino, G.; Ferrara, P. COVID-19 Vaccination and Public Health: Addressing Global, Regional, and Within-Country Inequalities. Vaccines (Basel) 2024, 12, 885. [Google Scholar] [CrossRef]
- Lee, S.W.; Ma, D.; Davoodian, A.; Ayutyanont, N.; Werner, B. COVID-19 Vaccination Decreased COVID-19 Hospital Length of Stay, in-Hospital Death, and Increased Home Discharge. Prev Med Rep 2023, 32, 102152. [Google Scholar] [CrossRef]
- Jang, S.Y.; Hussain-Alkhateeb, L.; Rivera Ramirez, T.; Al-Aghbari, A.A.; Chackalackal, D.J.; Cardenas-Sanchez, R.; Carrillo, M.A.; Oh, I.-H.; Alfonso-Sierra, E.A.; Oechsner, P.; et al. Factors Shaping the COVID-19 Epidemic Curve: A Multi-Country Analysis. BMC Infect Dis 2021, 21, 1032. [Google Scholar] [CrossRef]
- Chrissian, A.A.; Oyoyo, U.E.; Patel, P.; Lawrence Beeson, W.; Loo, L.K.; Tavakoli, S.; Dubov, A. Impact of COVID-19 Vaccine-Associated Side Effects on Health Care Worker Absenteeism and Future Booster Vaccination. Vaccine 2022, 40, 3174–3181. [Google Scholar] [CrossRef]
- Takasaki, Y.; Abizaid, C.; Coomes, O.T. COVID-19 Contagion across Remote Communities in Tropical Forests. Sci Rep 2022, 12, 20727. [Google Scholar] [CrossRef]
- Fujita, D.M.; Salvador, F.S.; Nali, L.H. da S.; Luna, E.J. de A. Decreasing Vaccine Coverage Rates Lead to Increased Vulnerability to the Importation of Vaccine-Preventable Diseases in Brazil. J Travel Med 2018, 25. [Google Scholar] [CrossRef]
- Parra, P.N.B.; Atanasov, V.; Whittle, J.; Meurer, J.; Luo, Q.E.; Zhang, R.; Black, B. The Effect of the COVID-19 Pandemic on the Elderly: Population Fatality Rates, COVID Mortality Percentage, and Life Expectancy Loss. Elder Law J 2022, 30, 33. [Google Scholar]
- Mueller, A.L.; McNamara, M.S.; Sinclair, D.A. Why Does COVID-19 Disproportionately Affect Older People? Aging (albany NY) 2020, 12, 9959. [Google Scholar] [CrossRef]
- Pastorino, R.; Pezzullo, A.M.; Villani, L.; Causio, F.A.; Axfors, C.; Contopoulos-Ioannidis, D.G.; Boccia, S.; Ioannidis, J.P.A. Change in Age Distribution of COVID-19 Deaths with the Introduction of COVID-19 Vaccination. Environ Res 2022, 204, 112342. [Google Scholar] [CrossRef]
- de Gier, B.; van Asten, L.; Boere, T.M.; van Roon, A.; van Roekel, C.; Pijpers, J.; van Werkhoven, C.H.H.; van den Ende, C.; Hahné, S.J.M.; de Melker, H.E. Effect of COVID-19 Vaccination on Mortality by COVID-19 and on Mortality by Other Causes, the Netherlands, January 2021–January 2022. Vaccine 2023, 41, 4488–4496. [Google Scholar] [CrossRef] [PubMed]
- Zaher, K.; Basingab, F.; Alrahimi, J.; Basahel, K.; Aldahlawi, A. Gender Differences in Response to COVID-19 Infection and Vaccination. Biomedicines 2023, 11, 1677. [Google Scholar] [CrossRef] [PubMed]
- Nana-Sinkam, P.; Kraschnewski, J.; Sacco, R.; Chavez, J.; Fouad, M.; Gal, T.; AuYoung, M.; Namoos, A.; Winn, R.; Sheppard, V.; et al. Health Disparities and Equity in the Era of COVID-19. J Clin Transl Sci 2021, 5, e99. [Google Scholar] [CrossRef] [PubMed]
- Silaghi-Dumitrescu, R.; Patrascu, I.; Lehene, M.; Bercea, I. Comorbidities of COVID-19 Patients. Medicina (B Aires) 2023, 59, 1393. [Google Scholar] [CrossRef]
- Levitt, M.; Zonta, F.; Ioannidis, J.P.A. Comparison of Pandemic Excess Mortality in 2020–2021 across Different Empirical Calculations. Environ Res 2022, 213, 113754. [Google Scholar] [CrossRef]
- Choi, K.; Jang, M.; Kim, S.; Park, S.J.; Suh, H.S. Impact of COVID-19 on Disease-Specific Mortality, Healthcare Resource Utilization, and Disease Burden across a Population over 1 Billion in 31 Countries: An Interrupted Time-Series Analysis. EClinicalMedicine 2025, 85, 103315. [Google Scholar] [CrossRef]
- McGowan, V.J.; Bambra, C. COVID-19 Mortality and Deprivation: Pandemic, Syndemic, and Endemic Health Inequalities. Lancet Public Health 2022, 7, e966–e975. [Google Scholar] [CrossRef]
- Moraes, L.P.; Raposo, L.M. Impact of Vaccination and SARS-CoV-2 Variants on Severe COVID-19 Outcomes: A Cross-Sectional Study, Brazil, 2021-2022. Epidemiologia e Serviços de Saúde 2025, 34, e20240613. [Google Scholar] [CrossRef]
- Chen, Y.; Klein, S.L.; Garibaldi, B.T.; Li, H.; Wu, C.; Osevala, N.M.; Li, T.; Margolick, J.B.; Pawelec, G.; Leng, S.X. Aging in COVID-19: Vulnerability, Immunity and Intervention. Ageing Res Rev 2021, 65, 101205. [Google Scholar] [CrossRef]
- Machado, B.A.S.; Hodel, K.V.S.; Fonseca, L.M. dos S.; Pires, V.C.; Mascarenhas, L.A.B.; da Silva Andrade, L.P.C.; Moret, M.A.; Badaró, R. The Importance of Vaccination in the Context of the COVID-19 Pandemic: A Brief Update Regarding the Use of Vaccines. Vaccines (Basel) 2022, 10, 591. [Google Scholar] [CrossRef]
- Maltezou, H.C.; Panagopoulos, P.; Sourri, F.; Giannouchos, T. V.; Raftopoulos, V.; Gamaletsou, M.N.; Karapanou, A.; Koukou, D.-M.; Koutsidou, A.; Peskelidou, E.; et al. COVID-19 Vaccination Significantly Reduces Morbidity and Absenteeism among Healthcare Personnel: A Prospective Multicenter Study. Vaccine 2021, 39, 7021–7027. [Google Scholar] [CrossRef]
- Janke, A.T.; Mei, H.; Rothenberg, C.; Becher, R.D.; Lin, Z.; Venkatesh, A.K. Analysis of Hospital Resource Availability and COVID-19 Mortality Across the United States. J Hosp Med 2021, 16, 211–214. [Google Scholar] [CrossRef] [PubMed]
- Wallrafen-Sam, K.; Quesada, M.G.; Lopman, B.A.; Jenness, S.M. Modelling the Interplay between Responsive Individual Vaccination Decisions and the Spread of SARS-CoV-2. Epidemics 2025, 51, 100831. [Google Scholar] [CrossRef] [PubMed]
- Abeln, B.; Jacobs, J.P.A.M. COVID-19 and Seasonal Adjustment. Journal of Business Cycle Research 2022, 18, 159–169. [Google Scholar] [CrossRef]
- Cohen, A.; Reyes, B.; Burola, M.L.; Lomeli, A.; Escoto, A.A.; Salgin, L.; Rabin, B.A.; Stadnick, N.A.; Zaslavsky, I.; Tukey, R.; et al. Real-World Impact of COVID-19 Vaccination, Household Exposure, and Circulating SARS-CoV-2 Variants on Infection Risk and Symptom Presentation in a U.S./Mexico Border Community. Front Public Health 2025, 13, 1497390. [Google Scholar] [CrossRef]
- González Rodríguez, J.L.; Oprescu, A.M.; Muñoz Lezcano, S.; Cordero Ramos, J.; Romero Cabrera, J.L.; Armengol de la Hoz, M.Á.; Estella, Á. Assessing the Impact of Vaccines on COVID-19 Efficacy in Survival Rates: A Survival Analysis Approach for Clinical Decision Support. Front Public Health 2024, 12, 1437388. [Google Scholar] [CrossRef]
- Chen, X.; Huang, H.; Ju, J.; Sun, R.; Zhang, J. Impact of Vaccination on the COVID-19 Pandemic in U.S. States. Sci Rep 2022, 12, 1554. [Google Scholar] [CrossRef]
- Oliveira Roster, K.I.; Kissler, S.M.; Omoregie, E.; Wang, J.C.; Amin, H.; Di Lonardo, S.; Hughes, S.; Grad, Y.H. Surveillance Strategies for the Detection of New Pathogen Variants across Epidemiological Contexts. PLoS Comput Biol 2024, 20, e1012416. [Google Scholar] [CrossRef]
- Zeiser, F.A.; Donida, B.; da Costa, C.A.; Ramos, G. de O.; Scherer, J.N.; Barcellos, N.T.; Alegretti, A.P.; Ikeda, M.L.R.; Müller, A.P.W.C.; Bohn, H.C.; et al. First and Second COVID-19 Waves in Brazil: A Cross-Sectional Study of Patients’ Characteristics Related to Hospitalization and in-Hospital Mortality. The Lancet Regional Health - Americas 2022, 6, 100107. [Google Scholar] [CrossRef]
- Brito, A.F.; Semenova, E.; Dudas, G.; Hassler, G.W.; Kalinich, C.C.; Kraemer, M.U.G.; Ho, J.; Tegally, H.; Githinji, G.; Agoti, C.N.; et al. Global Disparities in SARS-CoV-2 Genomic Surveillance. Nat Commun 2022, 13, 7003. [Google Scholar] [CrossRef] [PubMed]
- Perez-Guzman, P.N.; Knock, E.; Imai, N.; Rawson, T.; Santoni, C.N.; Alcada, J.; Whittles, L.K.; Thekke Kanapram, D.; Sonabend, R.; Gaythorpe, K.A.M.; et al. Epidemiological Drivers of Transmissibility and Severity of SARS-CoV-2 in England. Nat Commun 2023, 14, 4279. [Google Scholar] [CrossRef]
Figure 1.
Weekly evolution of confirmed COVID-19 cases in Tocantins, Brazil. The time series displays the number of confirmed cases reported weekly from early 2020 to mid-2025. Distinct peaks correspond to major epidemic waves, notably those associated with the Gamma variant (early 2021) and the Omicron variant (early 2022). The red line depicts the 7-week moving average, applied to smooth short-term fluctuations and emphasize underlying long-term trends.
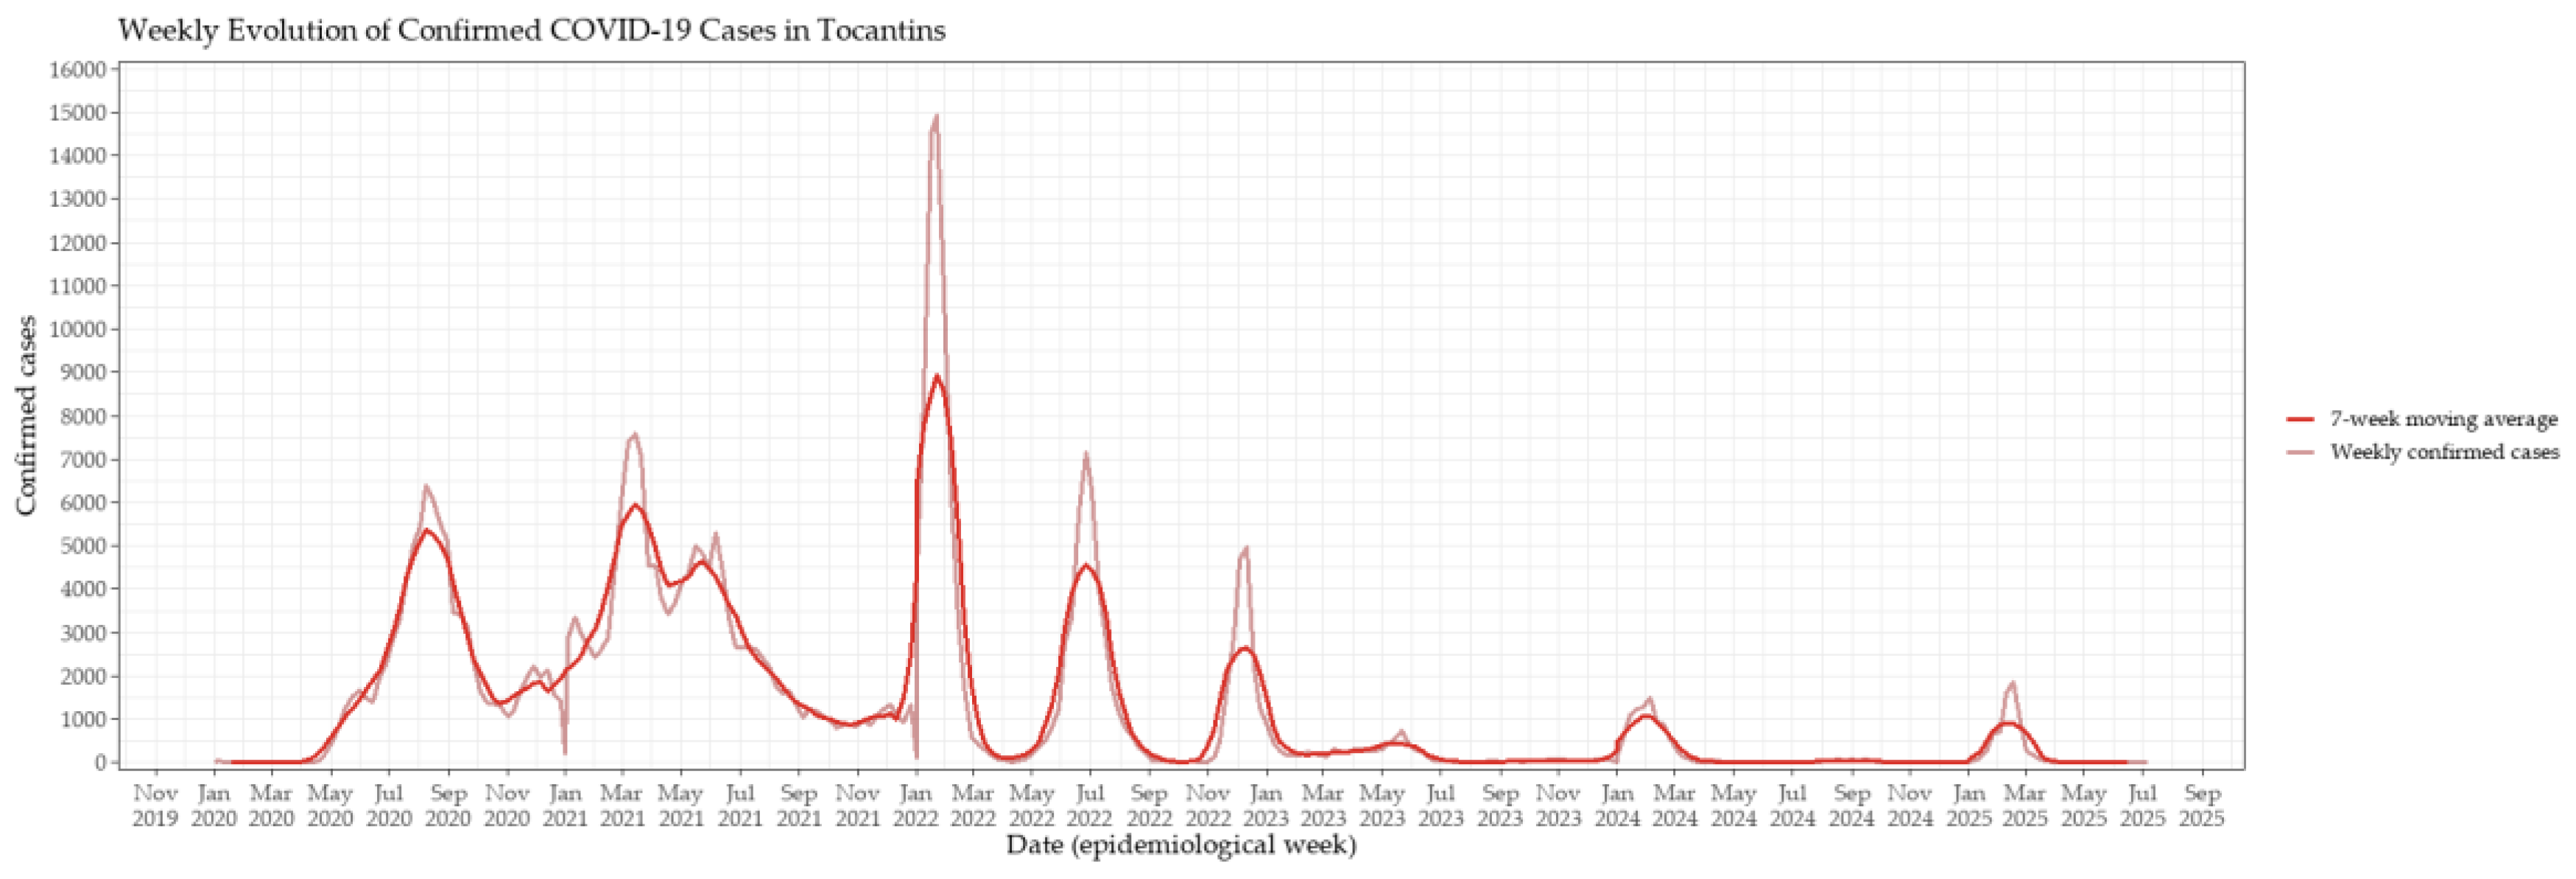
Figure 2.
Weekly evolution of COVID-19–related deaths in Tocantins, Brazil, from 2020 to mid-2025. The light red line represents weekly reported deaths, while the dark red line depicts the 7-week moving average, applied to smooth short-term fluctuations and highlight the temporal dynamics of mortality peaks.
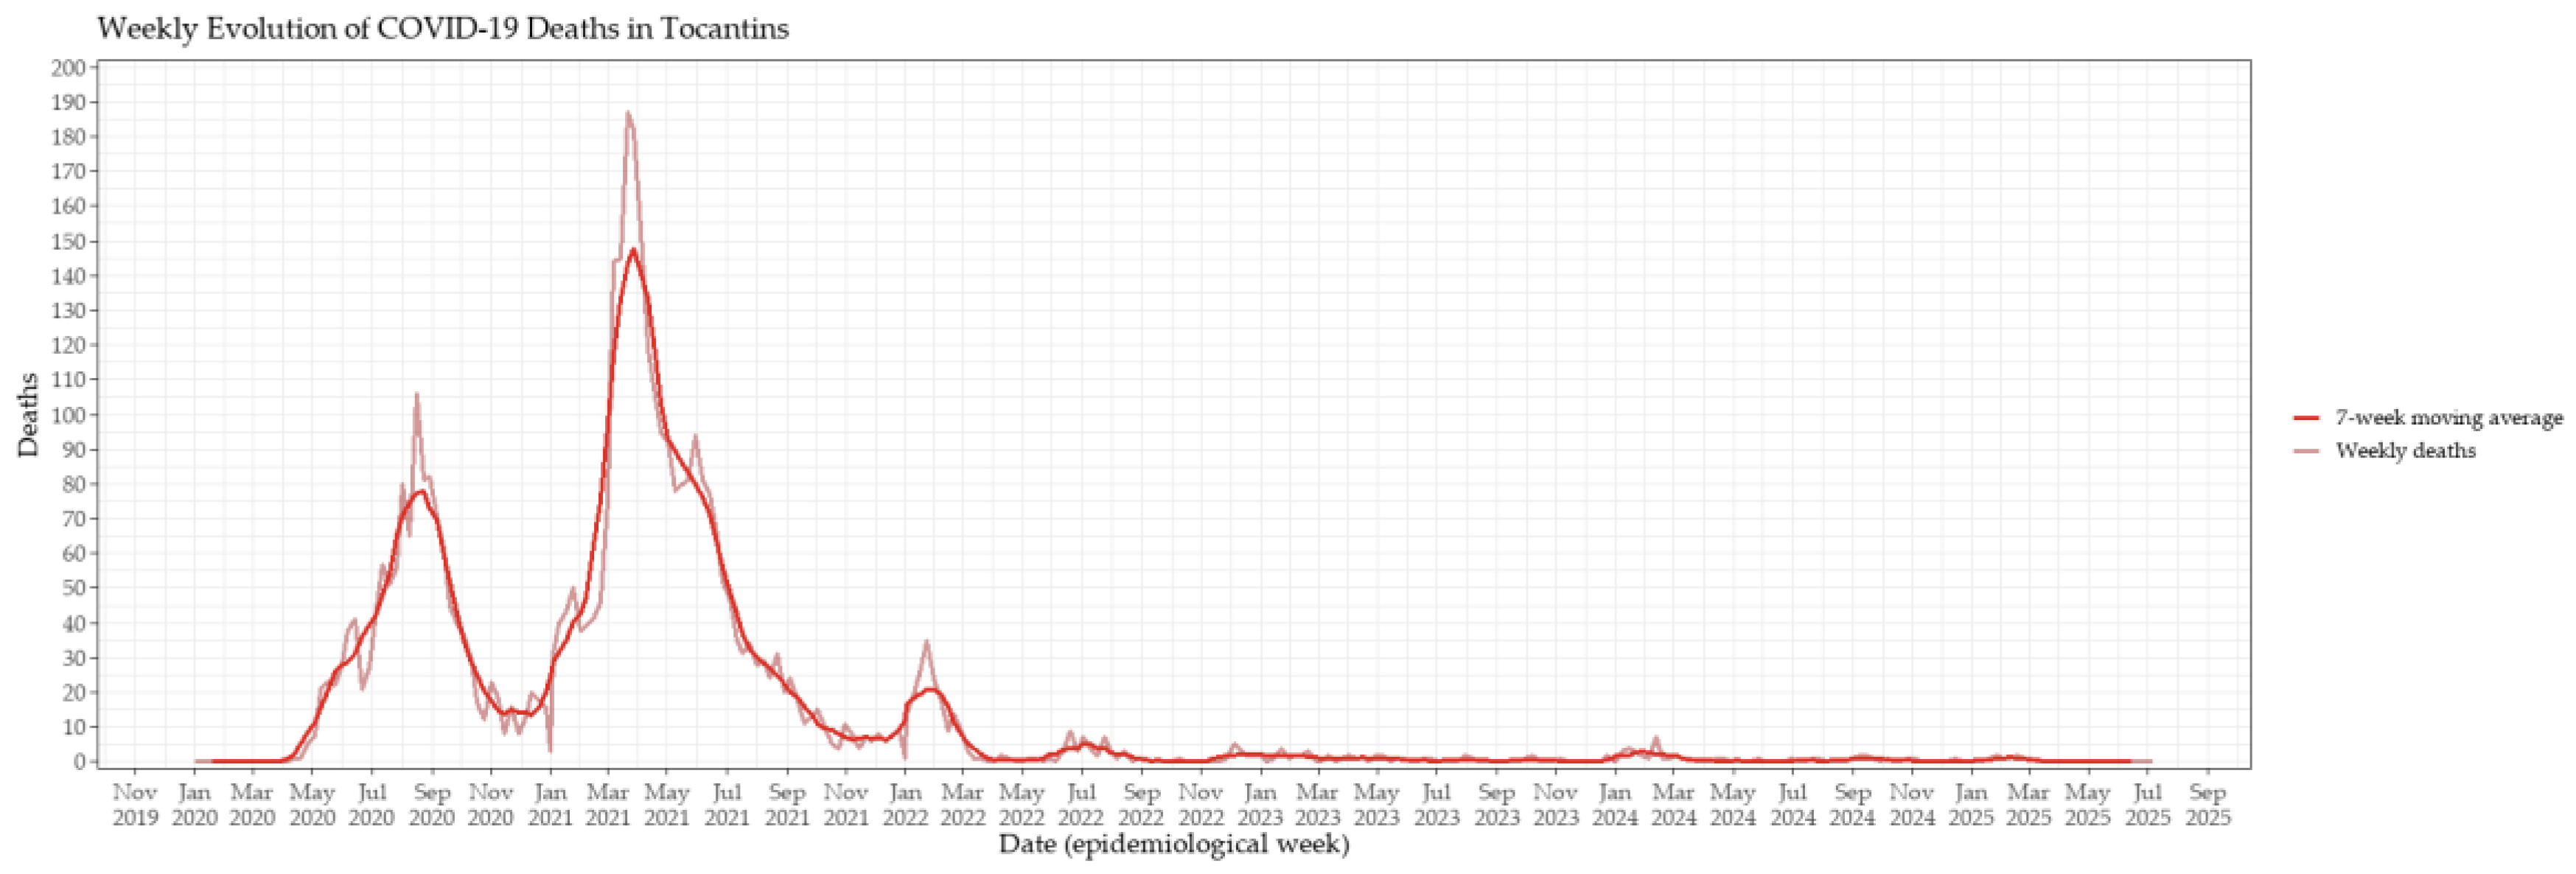
Figure 3.
Weekly evolution of confirmed COVID-19 cases and vaccination coverage in Tocantins, Brazil, from 2020 to mid-2025. The red line represents weekly confirmed cases, while the blue line indicates the number of vaccine doses administered per week, scaled by a factor of 5 to facilitate visual comparison. Peaks in vaccination coincided with subsequent declines in case counts, suggesting that increased coverage contributed to mitigating transmission and reducing incidence.
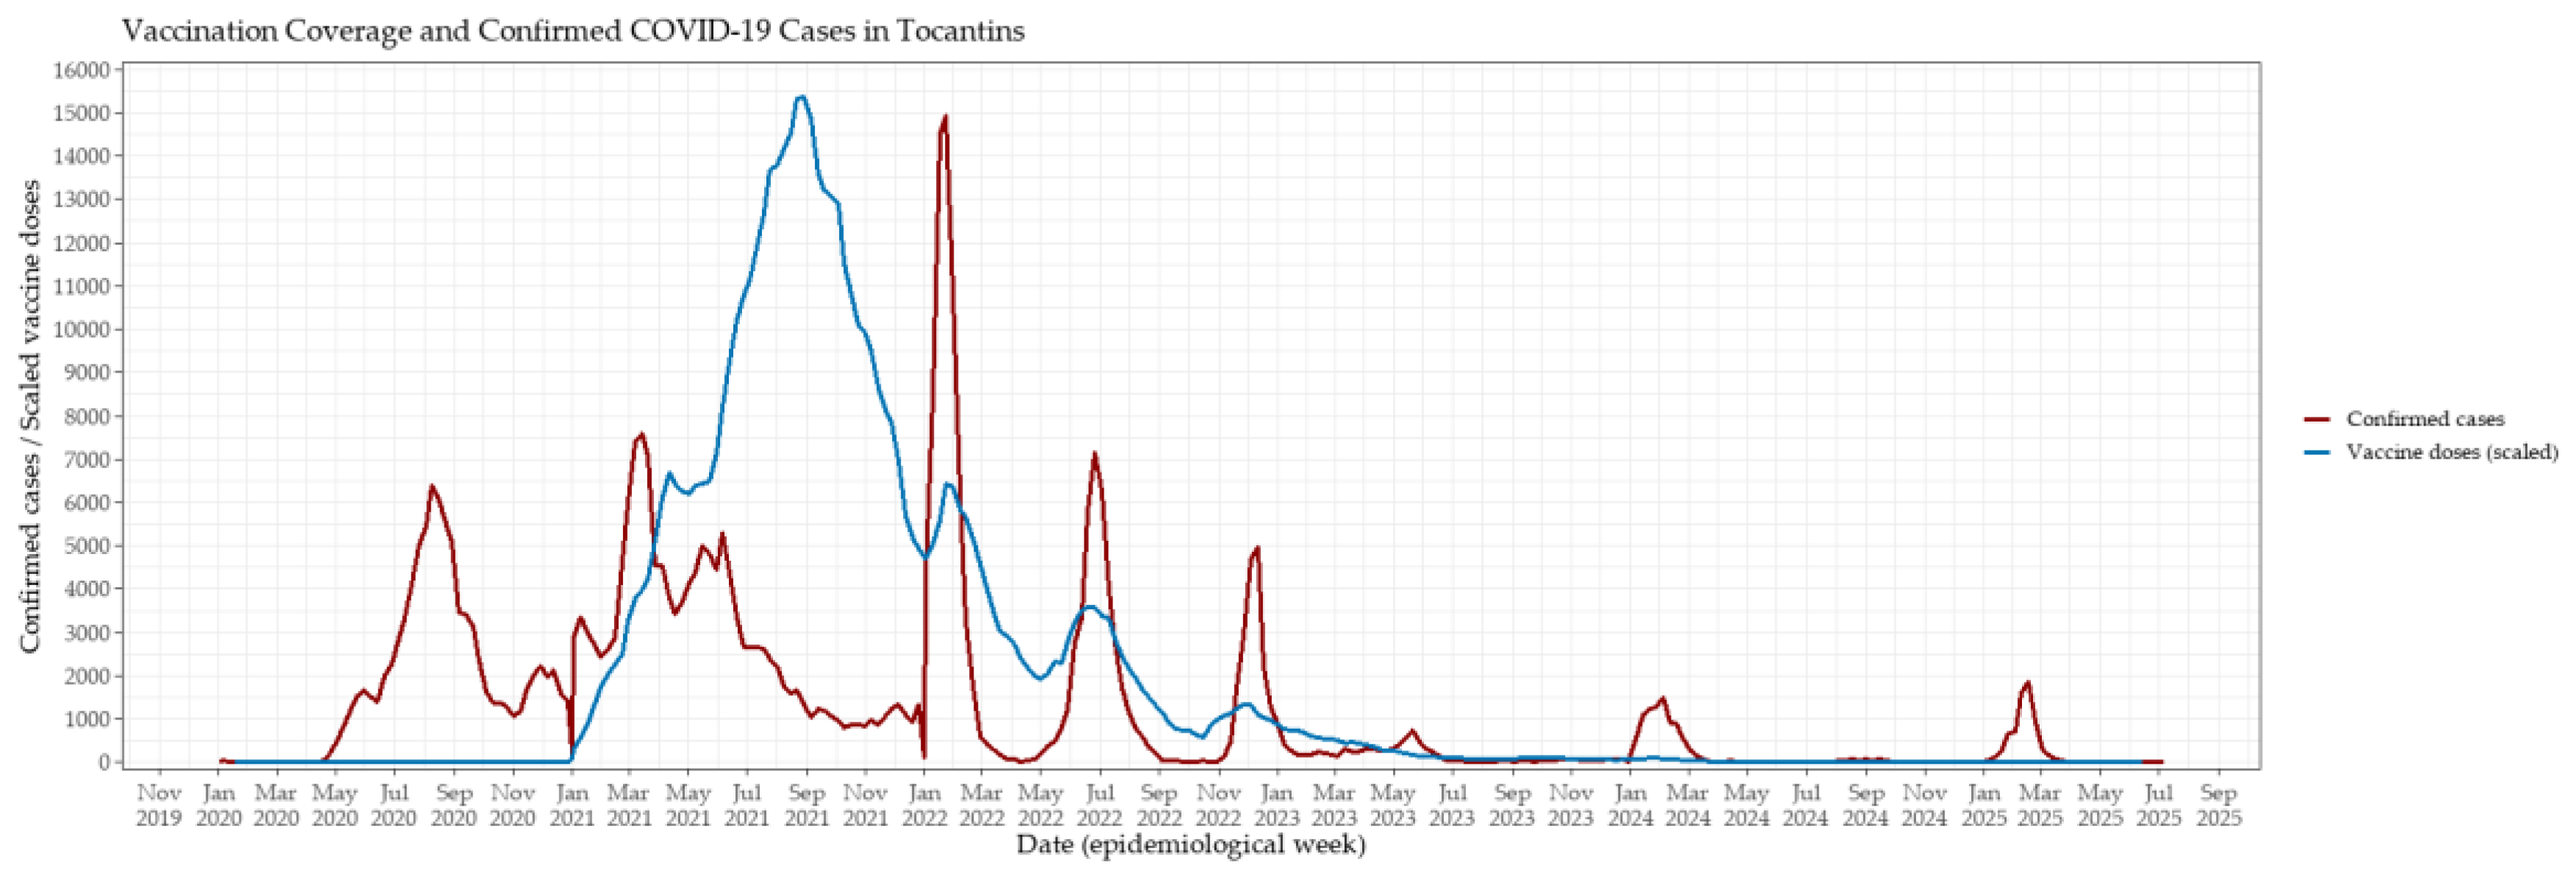
Figure 4.
Interrupted time series (ITS) analysis of key COVID-19 epidemiological indicators in Tocantins, Brazil. Weekly smoothed values (7-week moving averages) are shown as black lines, while fitted segmented regression lines are shown in blue. The vertical dashed red line indicates the intervention point (epidemiological week 3 of 2021), marking the start of the state’s vaccination campaign. Panels show: (A) confirmed cases, (B) deaths, (C) hospitalizations, (D) incidence rate, and (E) mortality rate.
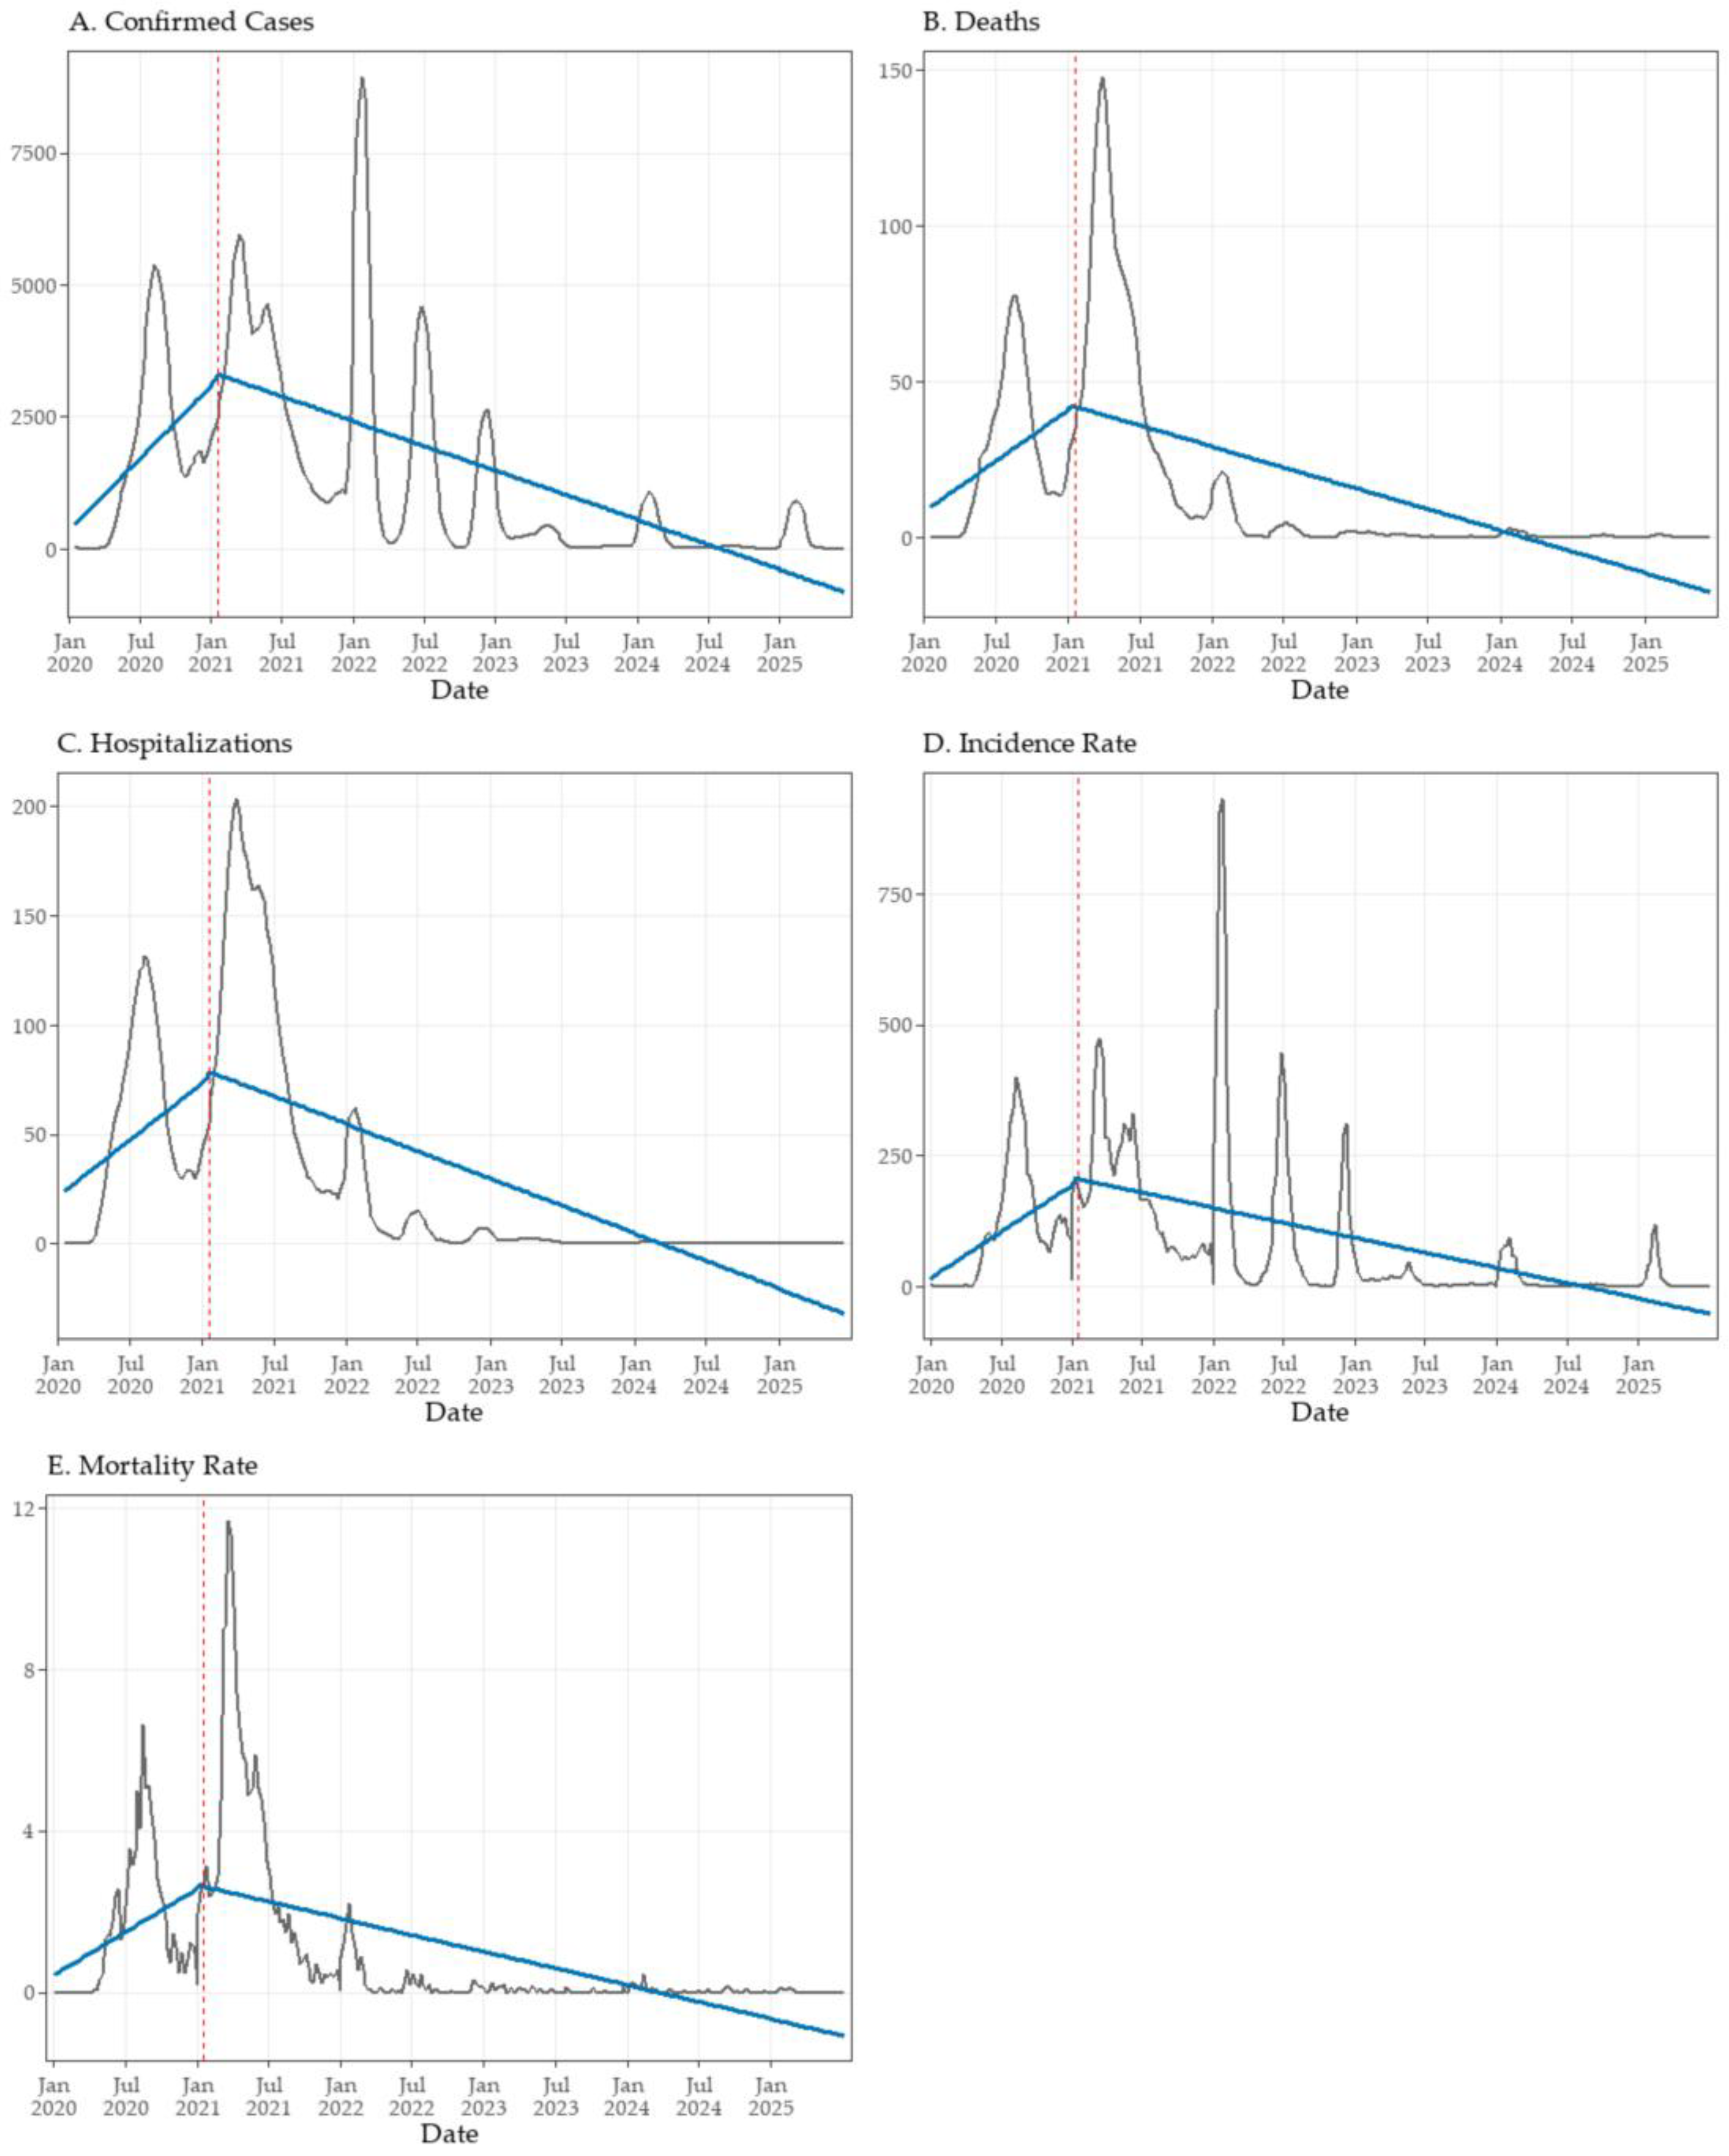
Figure 5.
Monthly dynamics of SARS-CoV-2 lineages in Tocantins, Brazil (2020–2022). (A) Absolute counts of genomes sequenced per month, stratified by Pango lineage. Peaks in sequencing effort coincide with major epidemic waves, particularly during Gamma and the onset of Omicron. (B) Relative monthly frequencies of lineages, normalized to 100%. Colors indicate lineage families, with consistent hues applied to related sublineages. Normalized trajectories highlight successive shifts in viral dominance, independent of sequencing volume.
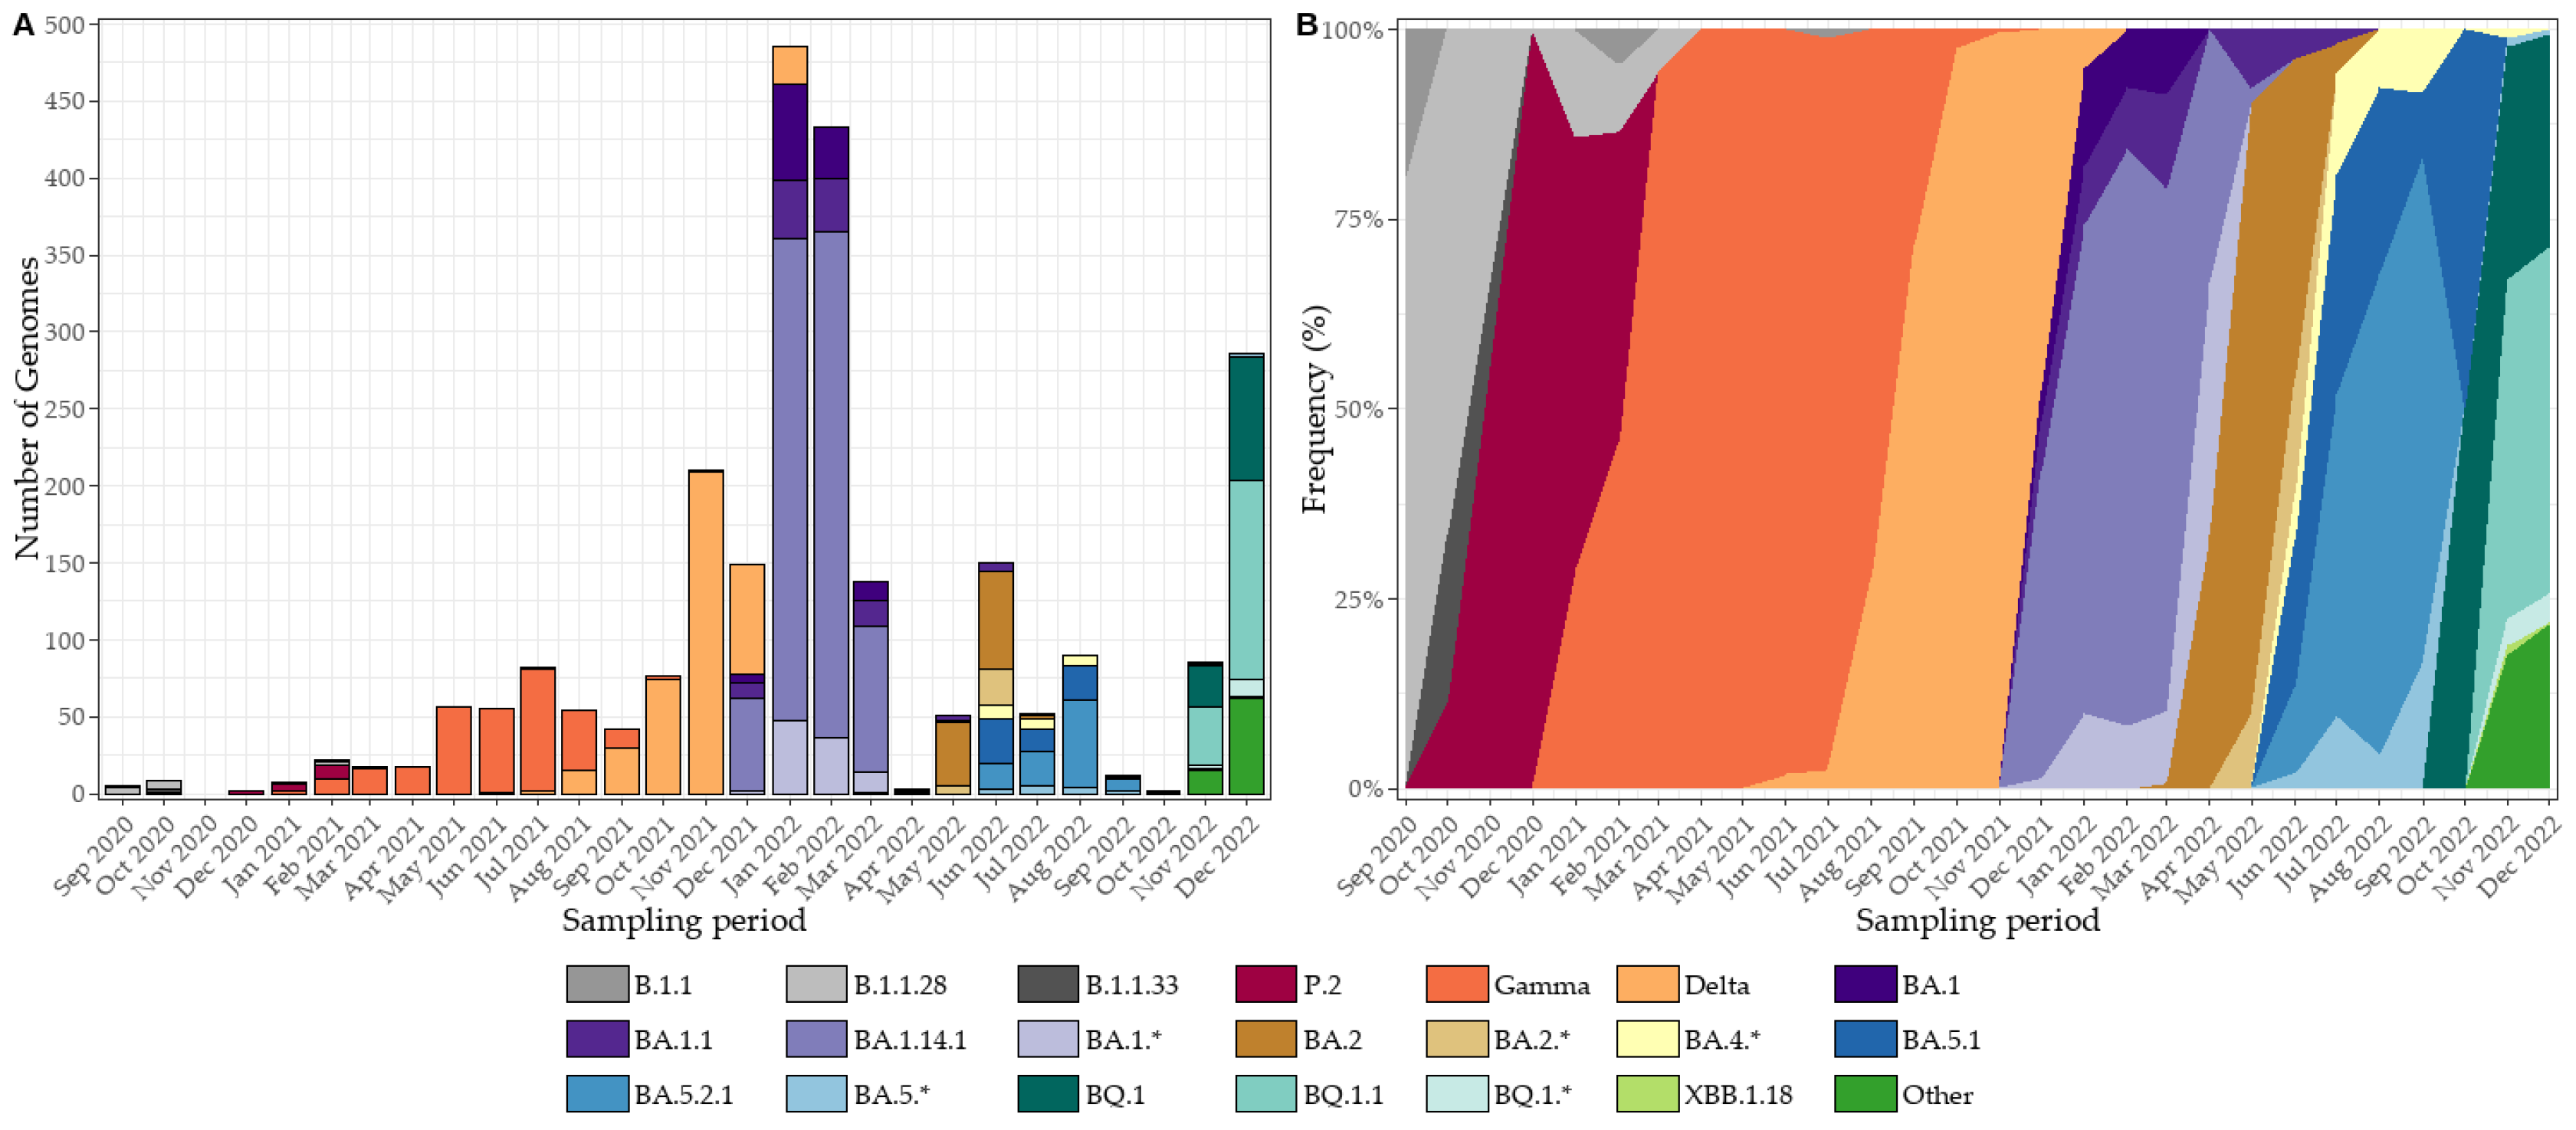
Figure 6.
SARS-CoV-2 lineage dynamics in Tocantins, Brazil, from January 2023 to May 2025. (A) Monthly genome counts, illustrating fluctuations in sequencing throughput, with peaks coinciding with epidemic waves. (B) Normalized lineage frequencies for the same period, showing the orderly replacement of BQ/BE by XBB, JD, and ultimately JN lineages. (C) Monthly genome counts from March 2024 to May 2025, highlighting the expansion of JN sublineages and the emergence of MJ, KP, XEC, and LP/PD lineages. (D) Normalized lineage frequencies for March 2024–May 2025, revealing a coherent within-Omicron succession—from JN dominance to the rise of LP.8.1.4 and sustained PD activity—robust to sequencing variability.
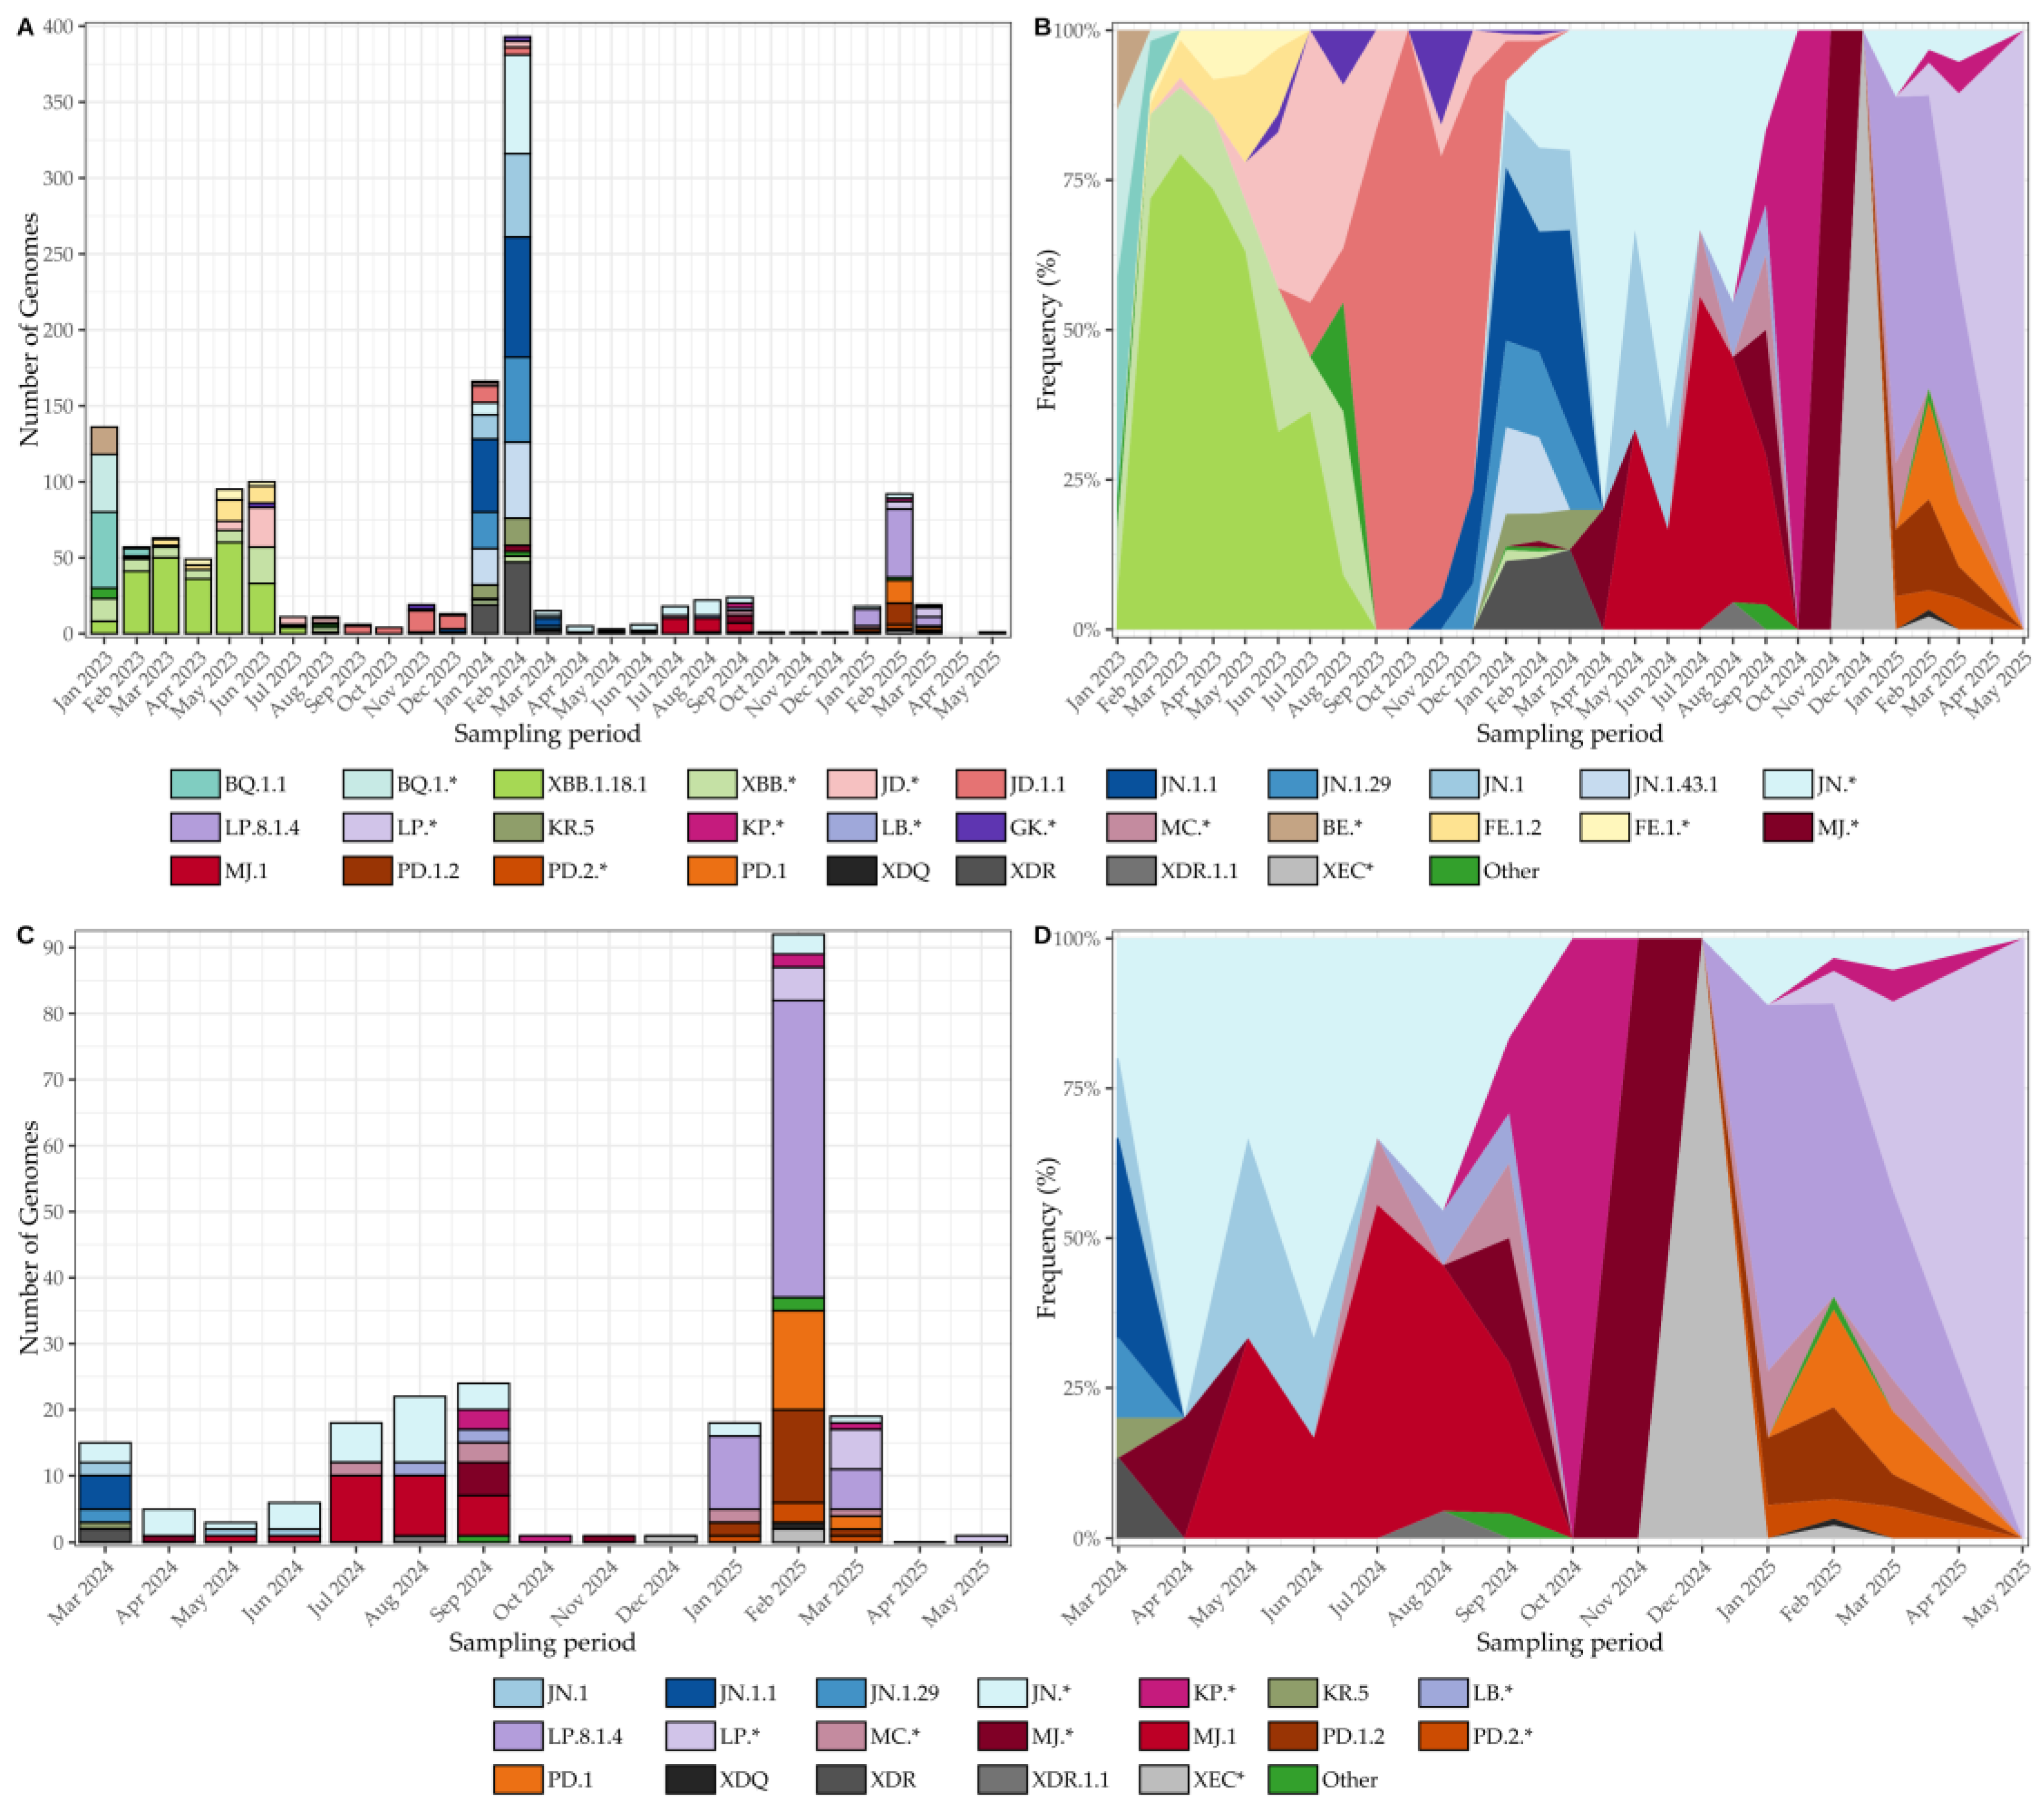
Figure 7.
(A) Global time-scaled phylogeny of 8,121 SARS-CoV-2 genomes colored by Nextclade designation, showing sequential lineage turnover culminating in early 2025 with the predominance of clade 25A (LP.8.1/LP.8.1.4) and residual presence of 25B and 25C. (B) The same phylogeny with Tocantins sequences highlighted, distributed across multiple clades—consistent with repeated introductions followed by local spread (Auspice view, Nextstrain).
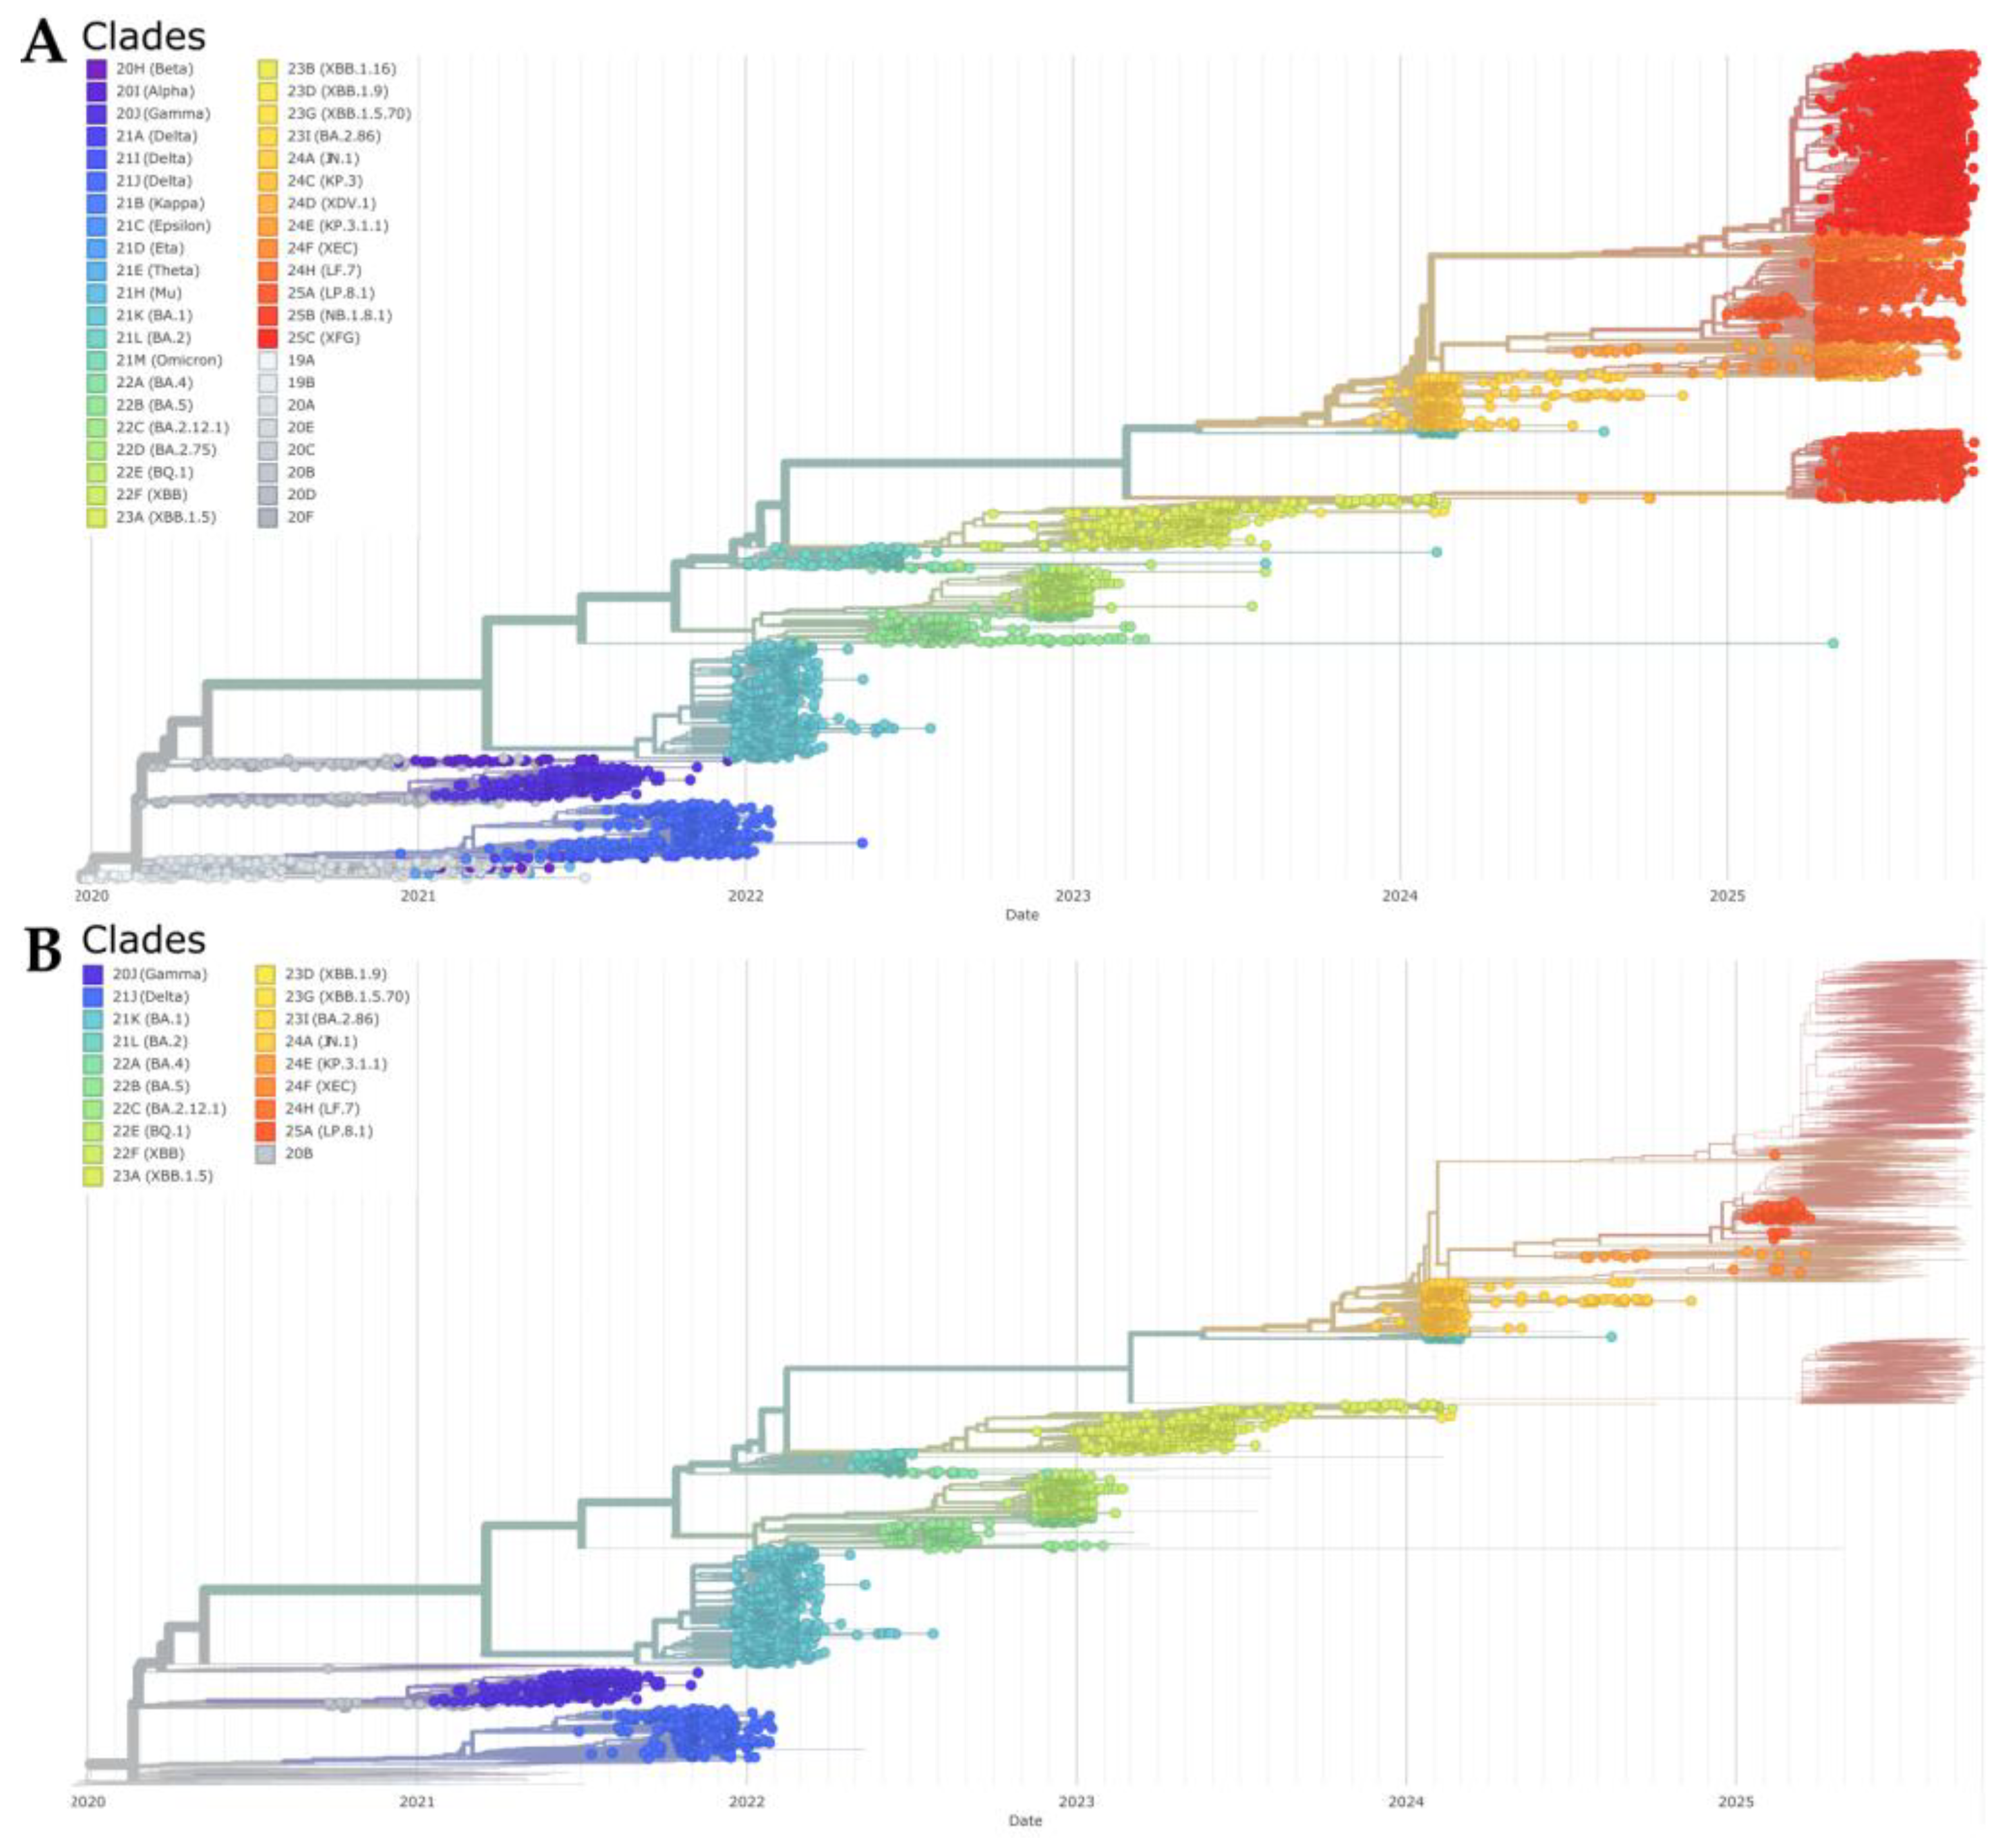

Table 1.
Results of one-way ANOVA and Tukey’s HSD post hoc tests for confirmed COVID-19 cases, deaths, hospitalizations, incidence, mortality, vaccination coverage, and the vaccine-to-case ratio across three vaccination periods in Tocantins, Brazil. Vaccination periods were defined as: pre-vaccination (up to week 2 of 2021), initial campaign (weeks 3–26 of 2021), and widespread vaccination (week 27 of 2021 onward). Abbreviations: PV = Pre-vaccination; IC = Initial campaign; WV = Widespread vaccination.
| Outcome | df (Model/ Residual) |
MS (Model/ Residual) |
F-value | p-value | Significant Comparisons (Tukey HSD, 95% CI) |
|---|---|---|---|---|---|
| Confirmed Cases | 2 / 290 | 1.32x10⁸ / 3.73x10⁶ | 35.5 | <0.001 | IC > PV (p <0.001); WV > PV (p = 0.0106); WV > IC (p <0.001) |
| Deaths | 2 / 290 | 7.71x10⁴ / 3.81x10² | 202.0 | <0.001 | IC > PV (p <0.001); WV > PV (p <0.001); WV > IC (p <0.001) |
| Hospitalizations | 2 / 290 | 2.26x10⁵ / 8.97x10² | 252.0 | <0.001 | IC > PV (p <0.001); WV > PV (p <0.001); WV > IC (p <0.001) |
| Incidence | 2 / 290 | 5.16x10⁵ / 1.46x10⁴ | 35.5 | <0.001 | IC > PV (p <0.001); WV > PV (p = 0.0108); WV > IC (p <0.001) |
| Mortality | 2 / 290 | 3.01x10² / 1.49 | 202.1 | <0.001 | IC > PV (p <0.001); WV > PV (p <0.001); WV > IC (p <0.001) |
| Vaccination Coverage | 2 / 290 | 7.59x10⁵ / 4.85x10² | 1564.0 | <0.001 | IC > PV (p <0.001); WV > PV (p <0.001); WV > IC (p <0.001) |
| Vaccine-to-Case Ratio | 2 / 290 | 9.71x10⁴ / 1.20x10³ | 8.11 | <0.001 | WV > PV (p = 0.0005) |
Table 2.
Generalized additive model (GAM) results assessing the association between weekly COVID-19 vaccination and key epidemiological indicators in Tocantins, Brazil, 2020–2025.
Table 2.
Generalized additive model (GAM) results assessing the association between weekly COVID-19 vaccination and key epidemiological indicators in Tocantins, Brazil, 2020–2025.
| Outcome variable | Adj. R² | Deviance explained (%) | EDF (Vaccination) | F-statistic | p-value |
|---|---|---|---|---|---|
| Confirmed cases | 0.796 | 81.1 | 4.66 | 35.13 | *** |
| Deaths | 0.887 | 89.5 | 4.77 | 47.69 | *** |
| Hospitalizations | 0.907 | 91.4 | 5.09 | 51.11 | *** |
| Incidence | 0.615 | 64.0 | 4.23 | 16.17 | *** |
| Mortality | 0.822 | 83.4 | 4.63 | 30.83 | *** |
| Vaccination Coverage | 1 | 100 | 3.08 | 4.92 | *** |
| Vaccine-to-Case Ratio | 0.524 | 55.6 | 3.69 | 6.38 | *** |
EDF = Estimated degrees of freedom for the smooth term of weekly vaccine doses (7-week moving average). All models include additional smooth terms for time (in weeks) and seasonal variation. Significance levels: p < 0.001.***.
Table 3.
Results of Interrupted Time Series (ITS) analysis for key COVID-19 indicators in Tocantins, Brazil. Outcomes were modeled using segmented linear regression to evaluate changes associated with the start of the vaccination campaign (intervention point: epidemiological week 3 of 2021). β₁ represents the pre-intervention trend (weekly change), β₂ the immediate level change after the intervention, and β₃ the post-intervention changes in slope. Significant negative β₃ values (p < 0.001) across all indicators indicate sustained reductions in transmission and severity following vaccination. Adjusted R² values denote model fit.
| Outcome | β₁ | p-value β₁ | β₂ | p-value β₂ | β₃ | p-value β₃ | Adj. R² |
|---|---|---|---|---|---|---|---|
| Confirmed cases | +52.44 | <0.001 | +64.45 | 0.881 | –70.14 | <0.001 | 0.395 |
| Deaths | +0.62 | <0.001 | –0.81 | 0.919 | –0.88 | <0.001 | 0.345 |
| Hospitalizations | +0.98 | <0.001 | +2.35 | 0.853 | –1.46 | <0.001 | 0.423 |
| Incidence rate | +3.40 | <0.001 | +0.51 | 0.988 | –4.49 | <0.001 | 0.284 |
| Mortality rate | +0.04 | <0.001 | –0.08 | 0.889 | –0.06 | <0.001 | 0.306 |
β₁ = slope before intervention; β₂ = immediate level change after vaccination campaign start (week 3 of 2021); β₃ = change in trend post-intervention.
Disclaimer/Publisher’s Note: The statements, opinions and data contained in all publications are solely those of the individual author(s) and contributor(s) and not of MDPI and/or the editor(s). MDPI and/or the editor(s) disclaim responsibility for any injury to people or property resulting from any ideas, methods, instructions or products referred to in the content. |
© 2025 by the authors. Licensee MDPI, Basel, Switzerland. This article is an open access article distributed under the terms and conditions of the Creative Commons Attribution (CC BY) license (http://creativecommons.org/licenses/by/4.0/).
Copyright: This open access article is published under a Creative Commons CC BY 4.0 license, which permit the free download, distribution, and reuse, provided that the author and preprint are cited in any reuse.


