Submitted:
14 October 2025
Posted:
15 October 2025
You are already at the latest version
Abstract
Autonomous driving is anticipated to increase safety, efficiency, and accessibility of passenger transportation. Passengers are given freedom in the use of travel time through the potential to conduct non-driving related tasks (NDRTs). However, factors such as trust and motion sickness pose challenges to the widespread adoption of this technology. Human-machine interfaces (HMIs) have shown potential in mitigating motion sickness and fostering trust calibration in autonomous vehicles (AVs), e.g., by visualizing upcoming or current maneuvers of the vehicle. The majority of research on such HMIs relies on the passengers’ attention, preventing uninterrupted NDRT execution and thus impeding the automation’s usefulness. In this paper, we present a visual HMI providing AV passengers with information about current driving maneuvers through their peripheral fields of view. This method of information transmission is compared to conventional in-vehicle displays and LED strips regarding perceptibility and distraction. In a controlled laboratory setting, N = 32 participants experienced each HMI condition, indicating their perception of the maneuver visualizations using joystick input while either focusing on a fixation cross to measure perceptibility or solving math tasks to measure distraction. The peripheral HMIs caused better maneuver perception and lower distraction from a visual NDRT than the conventional displays. These results yield implications for the design of HMIs for motion sickness mitigation and trust calibration in AVs.
Keywords:
motion sickness
; HMI
; light-based
; peripheral
; autonomous vehicle
; seating orientation
; rearward
1. Introduction
Autonomous vehicles are expected to bring several advantages, including improved safety and efficiency. However, the adoption of AVs necessitates their users’ acceptance, which has been shown to depend on a variety of factors [1,2,3,4,5,6,7,8,9]. Among them, trust in autonomy is a central prerequisite.
Higher automation levels are accompanied by novel seating layouts, with the "living room seating arrangement" being one of the most prevalent concepts [10,11,12]. This concept encompasses two rearward seats facing two forward seats, enabling eye contact between the passengers and thus fostering social interaction during autonomous rides. However, there is a reluctance towards facing against the direction of travel, with motion sickness being one of the main reasons [13,14]. Motion sickness rises from a sensory mismatch between acceleration registered by the vestibular organs and acceleration that is expected based on a conglomerate of information, e.g. previous experiences, and visual and somatosensory input [15]. This mismatch is more likely to occur in AV passengers when they cannot see the road ahead. Additionally, rearward facing passengers also exhibit less trust in the autonomy, further decreasing their willingness of using this technology and thus benefiting from its advantages [16,17].
Several studies have investigated the use of HMIs to foster trust calibration and motion sickness mitigation in AVs [18,19,20,21]. To this end, visual representation of current and upcoming maneuvers is a common concept to increase the vehicle maneuver transparency. However, most of these HMIs are presented on displays that rely on the passengers’ visual attention to convey the information displayed. Thus, passengers need to disrupt their NDRTs to benefit from these HMIs, which lowers the overall usefulness of the automation [22]. An emerging alternative way of visual information transmission is via interior lighting, e.g. through LED strips [23,24]. As this method is physically limited in the level of detail that information can be displayed in, existing concepts focus on visualizing either lateral [24] or longitudinal acceleration [23,25] and yield mixed results regarding their effectiveness. However, both types of acceleration can occur simultaneously in cars. This raises the question how a simultaneous visualization of longitudinal and lateral acceleration can be achieved. Importantly, increasing the visual load through more complex cues bares the risk of distraction from the NDRT, potentially diminishing the automation’s use, especially in visual NDRTs [26].
Hainich et al. [24] evaluated an indicator animation using LED strips. While this enables anticipation of turning maneuvers, more nuanced maneuver details like acceleration in x and y direction, both relevant for the development of motion sickness, are not communicated. However, simultaneous coding of lateral and longitudinal accelerations is conceivable using LED strips. Adjusting the blinking frequency and / or LED color according to the steering angle might yield additional motion sickness mitigation compared to the results found by Hainich et al. [24]. Nevertheless, this poses a more abstract visualization of lateral vehicle dynamics than extending the optic flow of the vehicles surroundings [23,25], and might thus lead to increased mental load. Using large surfaces in the periphery of the passengers like De Winkel et al. [25] enables this extension of optic flow for both longitudinal and lateral acceleration. This can potentially increase visually perceived self-motion and thus decrease the sensory conflict between visual and vestibular motion cues during car journeys.
The present study compares HMIs in the form of large LED panels, LED strips and conventional displays with regard to their capability to visualize vehicle maneuvers, and the degree to which they distract from a visual NDRT. As rearward facing passengers are at greater risk of motion sickness and undertrust in AVs, and the optic flow reverses in a rearward facing seating orientation, each HMI is evaluated in both seating orientations [13,27].
2. Materials and Methods
2.1. Design
2.2. Design
The LED panels consist of LED matrix arrays and are referred to as "2D". The LED strips consist of single LED vectors and are thus referred to as "1D". The conventional displays show video captured from a vehicles windshield, therefore this HMI condition is referred to as "video". Distraction from a visual NDRT was measured through changes in performance on math tasks, while capability in maneuver visualization was measured with and without distraction. Therefore, participants either conducted math tasks or focused on a fixation cross. This resulted in a 3x2x2 mixed design with HMI condition (video vs. "1D" vs. "2D") and task (fixation cross vs. math) manipulated as within-subjects variables and seating orientation (forward facing vs. rearward facing) as a between-subjects variable.
2.3. Dependent Variables
2.3.1. Motion Perception
Visually perceived vehicle motion was measured via joysticks. The maximum vehicle velocity of 100 km/h corresponded to a joystick placement at the foremost position for forward facing subjects and and the rearmost position for rearward facing subjects. A velocity of 0km/h corresponded to the center joystick position for all subjects, with a linear progression in between. Negative velocities (driving backwards) were not part of the simulated journeys. The maximum steering angle of 540° to the right corresponded to a joystick placement at the rightmost position for forward facing subjects, again inverted for rearward facing subjects. A steering angle of 0° corresponded to the centre joystick position, analogously for steering angles to the left, with a linear progression in between. This was also inverted for rearward facing passengers. The subjects’ joystick input was shown on a coordinate grit at the bottom right of the displays or tablets, depending on the HMI condition, to ensure a constant visual reference frame for the current joystick position [28]. Accuracy of motion perception was operationalised as the subjects’ mean absolute deviation from ideal joystick input during each trial, with lower deviation indicating higher accuracy. The quadrants of the coordinate system used to visualize the joystick input had an edge length of 1, resulting in an average deviation on a scale between 0 and .
2.3.2. Distraction
Distraction was operationalised as the number of math tasks solved correctly during each trial, with lower scores indicating stronger distraction. Additionally, mental demand as an indicator for subjective distraction was measured on a scale from zero (very low) to 20 (very high) via the NASA-TLX after each trial [29].
2.4. Control Variables
As participants were subjected to visually simulated motion without corresponding vestibular stimulation, they were at risk of experiencing simulator sickness, potentially decreasing their performance during math tasks and joystick operation [30,31]. Simulator sickness was assessed on a scale from zero to three via the Simulator Sickness Questionnaire (SSQ, Kennedy et al. [32]).
In order to assess the representativeness of the sample in terms of susceptibility to motion sickness and technology affinity, these constructs were recorded using the Motion Sickness Susceptibility Questionnaire short-form (MSSQ-Short; Golding [33]) and the Affinity for Technology Interaction Scale (ATI; Franke et al. [34]).
To quantify whether the 1D and 2D HMIs were perceived in the peripheral field of view, gaze behavior was measured using eye tracking glasses (Tobii Pro Glasses 3, Tobii Technology GmbH). The proportion of time in which the HMIs were perceived peripherally was operationalised via the proportion of total fixation time on the tablet that displayed the tasks (math tasks or fixation cross).
2.5. Apparatus
The experiment was conducted in a dark laboratory with the interior lighting switched on to ensure a constant ambient luminance of x nits. The setup consisted of a cage made of aluminum profiles modeled on the interior dimensions of a VW Multivan T6. This ensured representative distances between the subjects and the HMIs. The subjects sat on one of four office chairs with the same seat height as the T6 seats. The two front seats were rotated 180° to create a "living room" seating arrangement. Subjects facing forward sat in seat A, while subjects facing backward sat in seat C (Figure 2). Tablets with Android OS (Samsung Galaxy Tab A8, 10.5") were mounted in front of seats A and C using a tablet holder. The tablets’ centres were fixed at 65 cm in front of the seats’ backrests and 84 cm above the cage’s floor. The fixation cross and the math tasks were presented on the tablets. Questionnaires were build using LimeSurvey (Limesurvey GmbH) and answered on a handheld tablet. Conventional 13" LC-displays were placed between the seats in both rows (1920x1080 pixels, Faytech n.d.). The displays’ lower edges were located at 85 cm above the cage’s floor and 7 cm behind the seats’ backrests. The video feed for the video condition was shown on these displays.
Speed and steering angle data were recorded during a previous study from a test vehicle equipped with a steering- and pedal robot. This data served as the basis for the 1D and 2D HMIs, as well as joystick input reference values. Each drive lasted 330 seconds. The course was driven clockwise and counterclockwise. Three of the simulated drives were clockwise and three were counterclockwise, with the order counterbalanced between the test subjects. This was done to reduce learning effects. In the video condition, the displays showed video recordings originating from the aforementioned study, recorded by a webcam trough the windshield of the experimental vehicle. Current maneuvers were additionally visualized through arrows as an overlay on top of the camera recordings (Figure 1).
The cage was lined with RGB LED panels (Model ‘Uslim 2’, Unilumin Germany GmbH, 3.9 mm pixel pitch, 1000 nits peak brightness). Four 500 mm x 1000 mm panels were mounted to the cage’s ceiling, four 250 mm x 500 mm panels on each side and one 500 mm x 1000 mm and two 250 mm x 500 mm panels on the floor. During the 2D condition, all panels were turned on, while only the side panels were turned on during the 1D condition (Figure 2).
Figure 2.
(Side view into the cage. The seats’ centres were located at 39 cm above the floor and 34 cm to the side of the nearest side panels. The canopy panels were fixed at 133 cm above the cage’s floor. Both images show maneuver visualizations while driving straight.a) 1D HMI. (b) 2D HMI.
Figure 2.
(Side view into the cage. The seats’ centres were located at 39 cm above the floor and 34 cm to the side of the nearest side panels. The canopy panels were fixed at 133 cm above the cage’s floor. Both images show maneuver visualizations while driving straight.a) 1D HMI. (b) 2D HMI.
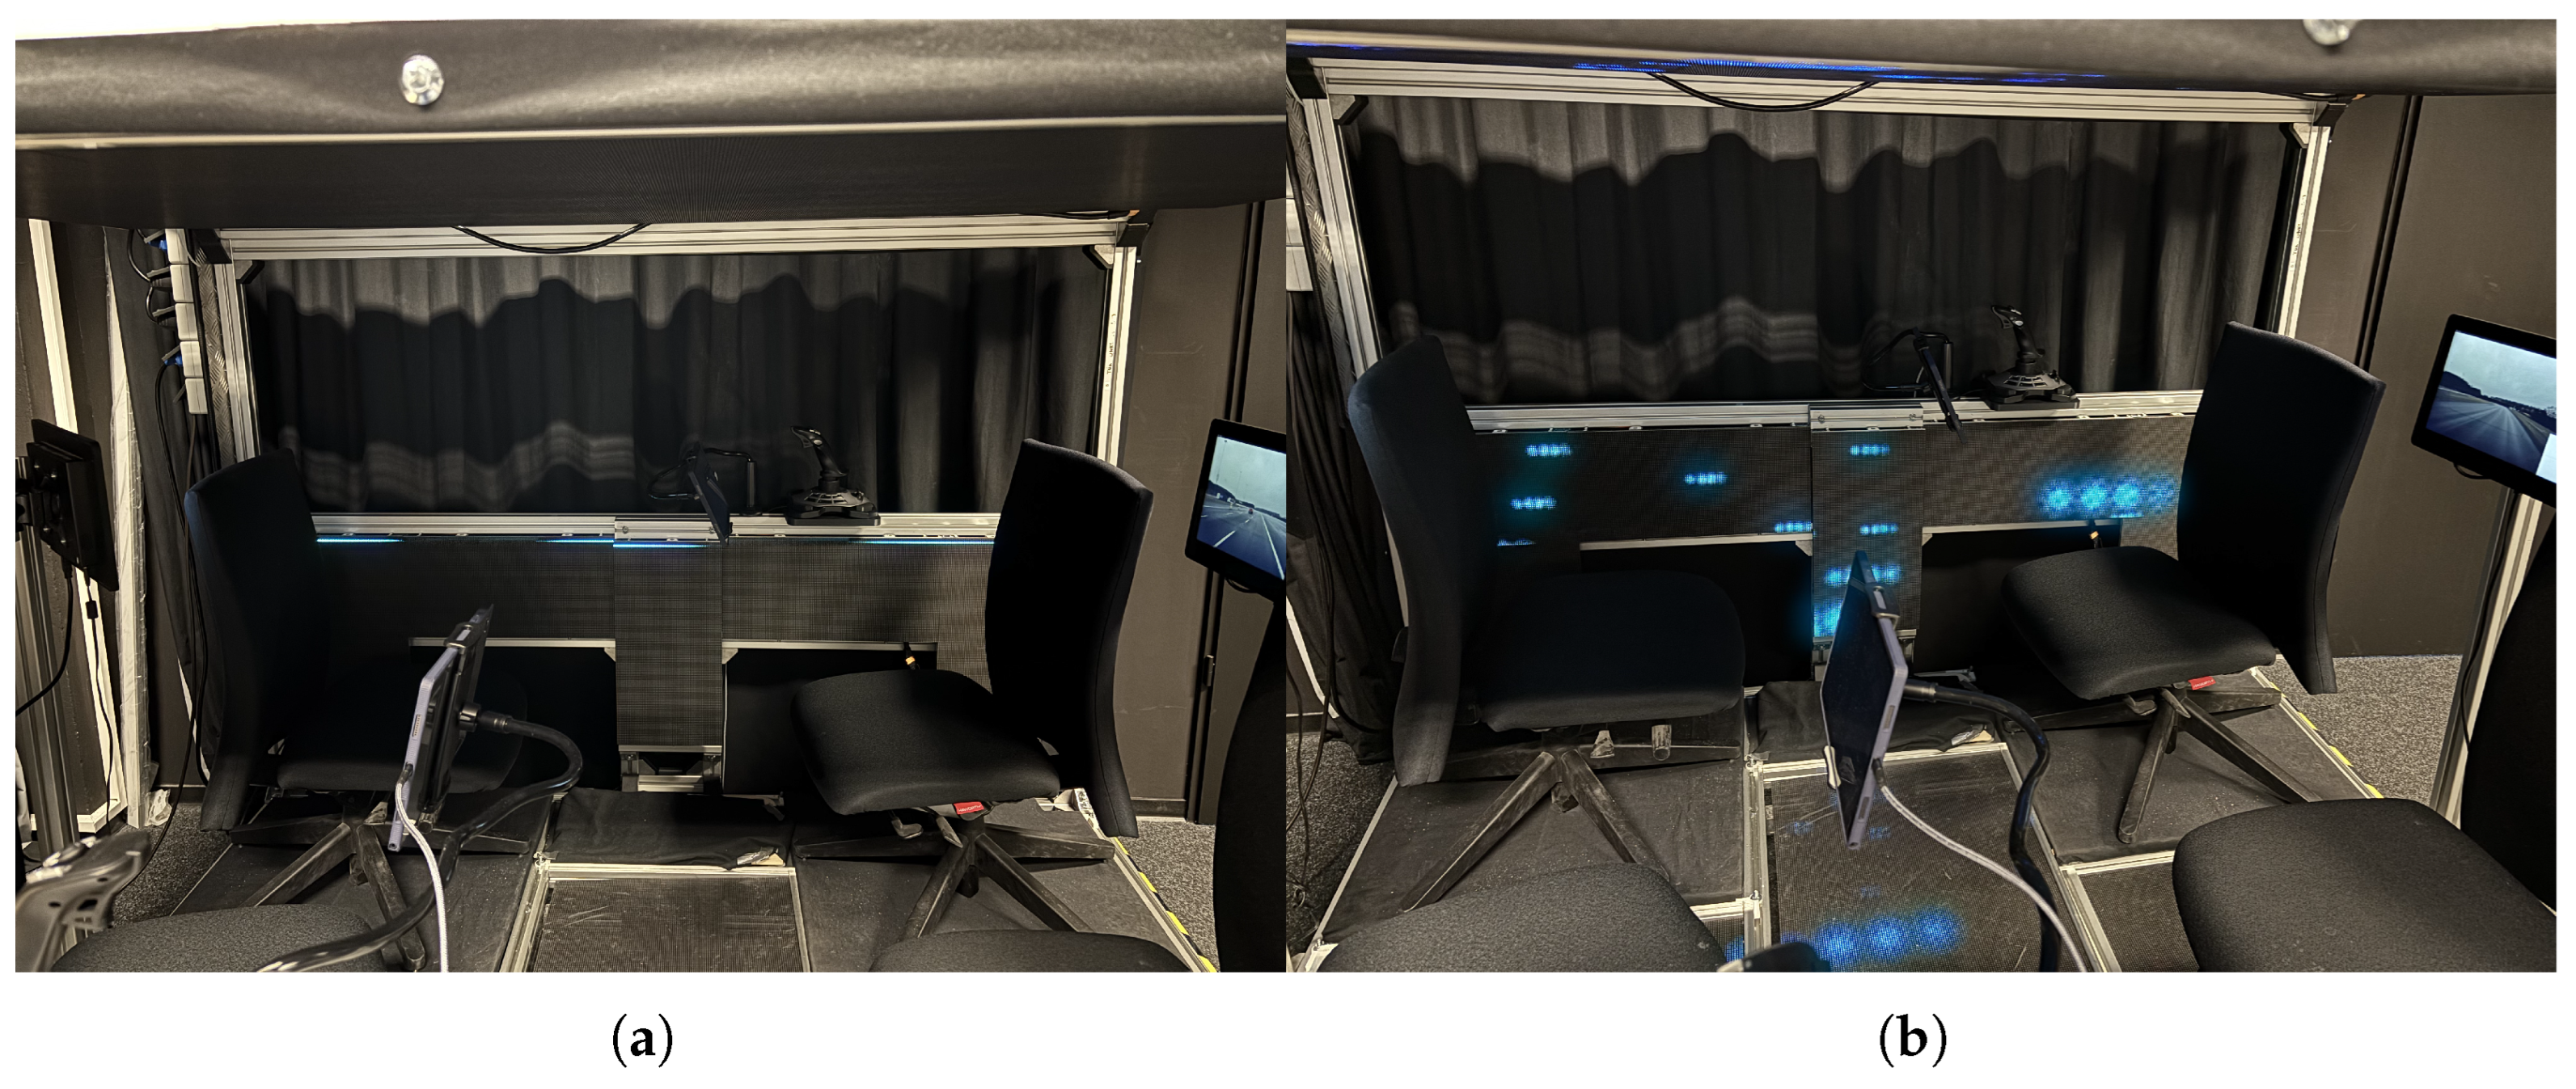
In the 1D condition, vehicle speed and steering angle were visualized using the top row of LEDs on the side panels, just beneath the side windows. The cues consisted of stripes with a length of 70 px and a height of 1 px. As this "one-dimensional" HMI does not allow for the manipulation of light cue flow direction, the pulse frequency of the cues was used to visualize lateral acceleration. A steering angle of 0° corresponded to static light strips (0 Hz) and the maximum steering angle of 300° corresponded to a pulsing frequency of 3 Hz, with a linear interpolation in between. Only the light cues on the inside of each curve pulsed.
In the 2D condition, vehicle velocity and steering angle were coded using light dots (Figure 2). The dots were displayed on three visual layers, with the dots on the front layer being twice as large (20 px diameter) and fast as the dots on the middle layer (10 px diameter). These were, in turn, twice as large and fast as the dots on the rearmost layer (5 px diameter) This creates visual depth and, consequently, motion parallax, which is theorized to reinforce vection [11].
The velocity of the 1D and 2D light cues was determined based by the vehicle velocity. In a previous expert workshop, an average scaling of 17% for the dots in the foremost layer was favored, with the majority of participants preferring a logarithmic scaling [35]. Based on this, the logarithmic scaling used by Bohrmann et al. [23] was adapted such that the average scaling across the velocity range from zero to 100 km/h was 17%:
where:
- is the longitudinal cue velocity in m/s,
- is the vehicle velocity in km/h.
The resulting velocity scaling is visualized in Figure 3.
Lateral acceleration was visualized through the angle at which the dots flowed to the left or right (ceiling and ground) or up or down (sides). It was calculated as the vertical cue velocity in m/s in y-axis in relation to steering wheel angle and vehicle velocity using the following formula:
where:
- is the vertical cue velocity in m/s,
- is the steering wheel angle in degrees,
- is the vehicle velocity in km/h,
- is the product of the pixel pitch (3.9 mm) and a damping factor (0.5).
The resulting angle scaling is visualized in Figure 4.
Preliminary tests showed that these visualizations of lateral vehicle dynamics did not suffice to guarantee peripheral perceptibility for the 1D and 2D condition. Thus, change of the light cues’ color was used additionally. A steering angle of 0° corresponded to cyan (R0G255B255), which transitioned across green, yellow, orange and finally red (R255G0B0) at 300° (Figure 5). Initially, the color spectrum was implemented from cyan to orange because red is often associated with warnings and calls to action [36]. However, the preliminary tests showed that expanding the spectrum to include red greatly increased the peripheral perceptibility of color changes. The color change was applied only to the light cues on the inside of each curve.
Logitech G Extreme 3D Pro joysticks were used (Logitech International S.A.). The joysticks were fixed to 3D-printed mounts to ensure stability. The joysticks’ bases were fixed at 71 cm above the cage’s floor, 44 cm in front of the seats’ backrests and 44 cm right to the backrests’ centres. Joystick input was captured using a self-developed program build with Python and based on DARMA, a software used in previous studies to capture two-dimensional input from test subjects [28].
2.6. NDRT
During the fixation cross trials, subjects were instructed to look at a fixation cross displayed at the centre of the fixed tablets (1D and 2D HMI), or at the video (Figure 1). During the math trials, subjects were instructed to verbally and correctly answer the math tasks presented to them on the fixed tablets. Once an answer was given, the instructor triggered the next math task. The math tasks included all possible additions, subtractions and multiplications between two of the integers from 0 to 10. Four sets of tasks were generated using Python and their order was counterbalanced across the baseline, video, 1D and 2D trials to ensure equal mean difficulties in all conditions.
2.7. Procedure
Prior to the laboratory study, subjects completed an online questionnaire on demographic and control variables. On site, subjects received information about the content and procedure of the study and their participants’ rights. Subjects then gave their informed consent to participate. Subsequently, they answered the SSQ to record baseline simulator sickness. Afterwards, subjects were introduced to the eye tracking glasses and the glasses were equipped. Baseline performance on the math tasks was then recorded for 330 seconds without HMI.
Next, the functionality of the HMis was explained. This was followed by a 90-second test run with both the video HMI and the 1D HMI turned on. The subjects were able to practice operating the joystick in accordance with the maneuver visualizations. During this time, in addition to the visualization of the subjects’ joystick input by a red dot, the ideal joystick input was visualized by a yellow dot on the coordinate cross (Figure 1). This allowed the subjects to establish an internal frame of reference between the visualization of the vehicle maneuvers and the corresponding joystick movements. The 90-second track section was chosen to include both the maximum speed of 100 km/h and the maximum steering angle of 540°. This allowed the subjects to experience the full range of possible visualizations and joystick inputs. Any comprehension questions from the test subjects were answered. The test run was then repeated with the combination of video and 2D HMI.
This was followed by three simulated journeys in which the test subjects were instructed to look at the center of the fixation cross on the fixed tablets (1D and 2D HMI condition) or the video. The order of the HMI conditions within these three runs was counterbalanced across subjects. After each run, the SSQ and the NASA-TLX were queried. These three runs were followed by three runs in which the subjects were instructed to solve the math problems on the fixed tablets. Within these three trials, the order of the HMI condition was also counterbalanced across subjects. Again, the SSQ and NASA-TLX were queried after each trial. Thus, each subject experienced a total of two experimental trials per HMI condition (once with fixation cross, once with math problems). To reduce learning effects, one of these two trials was clockwise and one was counterclockwise, and this order was also counterbalanced between subjects.
A final questionnaire was completed after the last round. Here the subjects indicated which of the panel positions on the 2D HMI contributed to the perceptibility of the driving maneuvers. They were also asked to rank the three HMI conditions in order of preference. Finally, the subjects were asked for suggestions to improve the visualization of the maneuvers, received their compensation of 15 Euros, and were dismissed. Participants could cancel their participation at any time and without justification or adverse consequences.
2.8. Sample
The sample consisted of employees from non-development departments at HELLA GmbH & Co. KGaA, as well as University staff students. 34 subjects participated in the study (15 female, 19 male). Mean age was 36.71 years (SD = 12.86). Motion sickness susceptibility as assessed by the MSSQ-Short had an average score of 10.82 (SD = 11.92, min = 0.00, max = 42.75). This corresponds to the 48.19th percentile of the population tested by Golding [33] (min = 0th percentile, max = 100th percentile). Mean affinity for technology interaction as measured by the Affinity for Technology Interaction Scale (ATI, Franke et al. [34]) was 4.27 (SD = 0.57).
3. Results
Statistical analyses were carried out using R (R Core Team, 2024). The influences of the independent variables (seating orientation: forward vs. rearward, HMI: video vs. 1D vs. 2D and task: fixation cross vs. math) on the dependent variables (motion perception and distraction), as well as on simulator sickness were assessed using mixed ANOVAs. The assumption of sphericity was checked using Mauchly’s test. When this assumption was violated, sphericity corrected p-values are reported. The assumption of normally distributed residuals was checked using Shapiro-Wilk tests, the assumption of homogeneity of between-group variances for seating orientation was checked using Levene tests. If one of these two assumptions was violated, non-parametric aligned ranks transformation (ART) ANOVAs were carried out, instead [37]. Post-hoc t-tests are reported with Bonferroni-Holm corrected p-values. As seating orientation had no significant effect on either dependent variable, graphs include only the effects of HMI and task conditions.
3.1. Motion Perception
The influences of the three independent variables (seating orientation: forward vs. rearward, HMI: display vs. 1D vs. 2D and task: fixation cross vs. math) on accuracy of motion perception were analyzed using a 2*3*2 ART ANOVA. HMI had a significant effect (F(2,160) = 10.91, p < .001, ), with medium effect size [38]. There were no further main effects or interactions. Post-hoc paired t-tests between each HMI condition revealed that joystick deviations were significantly higher in the video condition (M = 0.355, SD = 0.101) than in the 1D condition (M = 0.299, SD = 0.073, t(160) = 4.59, p < 0.001, d = 0.636) and than in the 2D condition (M = 0.315, SD = 0.071, t(160) = 3.02, p = 0.006, d = 0.459). There was no significant difference in joystick deviation between 1D and 2D. Figure 6 shows the mean joystick deviations for each condition.
3.2. Distraction
A 2x4 (seating orientation: forward vs. rearward and HMI: baseline vs. video vs. 1D vs. 2D) mixed ANOVA was carried out to analyze the influence of seating orientation and HMI on mean math scores. HMI showed a significant, large effect (F(3,96) = 44.49, p < .001, ). There was no significant main effect of seating orientation and no significant interaction. Post-hoc paired t-tests between each possible pair from all four HMI conditions revealed that math scores in the baseline condition (M = 160, SD = 34.20) were significantly higher than in the 2D condition (M = 144, SD = 32.9, t(32) = 3.780, p = 0.001, d = 0.652), the 1D condition (M = 141, SD = 30.80, t(32) = 4.713, p < 0.001, d = 0.819) and the video condition (M = 120, SD = 33.70, t(32) = 9.764, p < 0.001, d = 1.69). Math scores in the 2D condition were significantly higher than in the video condition (t(32) = 8.406, p < 0.001, d = 1.46). Math scores in the 1D condition were also significantly higher than in the video condition (t(32) = 7.779, p < 0.001, d = 1.32). There was no significant difference between math scores in the 1D and 2D conditions. Mean math scores for each condition are shown in Figure 7.
A 2*3*2 ART ANOVA revealed a significant, large effect of task on mental demand as assessed by the NASA-TLX mental demand subscale (F(1,160) = 115.93, p < .001, ). This main effect was qualified by a significant interaction with HMI (F(2,160) = 7.19, p = .001, ). Post-hoc paired t-tests revealed that the tasks differed significantly only in the video HMI condition, with higher mental demand in the math task condition (M = 13.9, SD = 5.36) than in the fixation cross condition (M = 7.25, SD = 5.09, t(160) = 3.667, p = 0.005, d = 0.889). Mean mental demand scores are shown in Figure 8.
3.3. Simulator Sickness
Influence of seating orientation, HMI and task on simulator sickness was analyzed using a 2*3*2 ART ANOVA. This revealed a significant but small effect for HMI (F(2,160) = 3.34, p = .038, ) and a significant effect of medium size for task (F(1,160) = 23.06, p < .001, ). These effects were qualified by a significant interaction between HMI and task with small effect size (F(2,160) = 3.59, p = .029, ). Post-hoc paired t-tests revealed no significant differences between any pairs of conditions within this interaction. Figure 9 gives an overview of mean SSQ scores for each condition.
3.4. Peripheral Perception
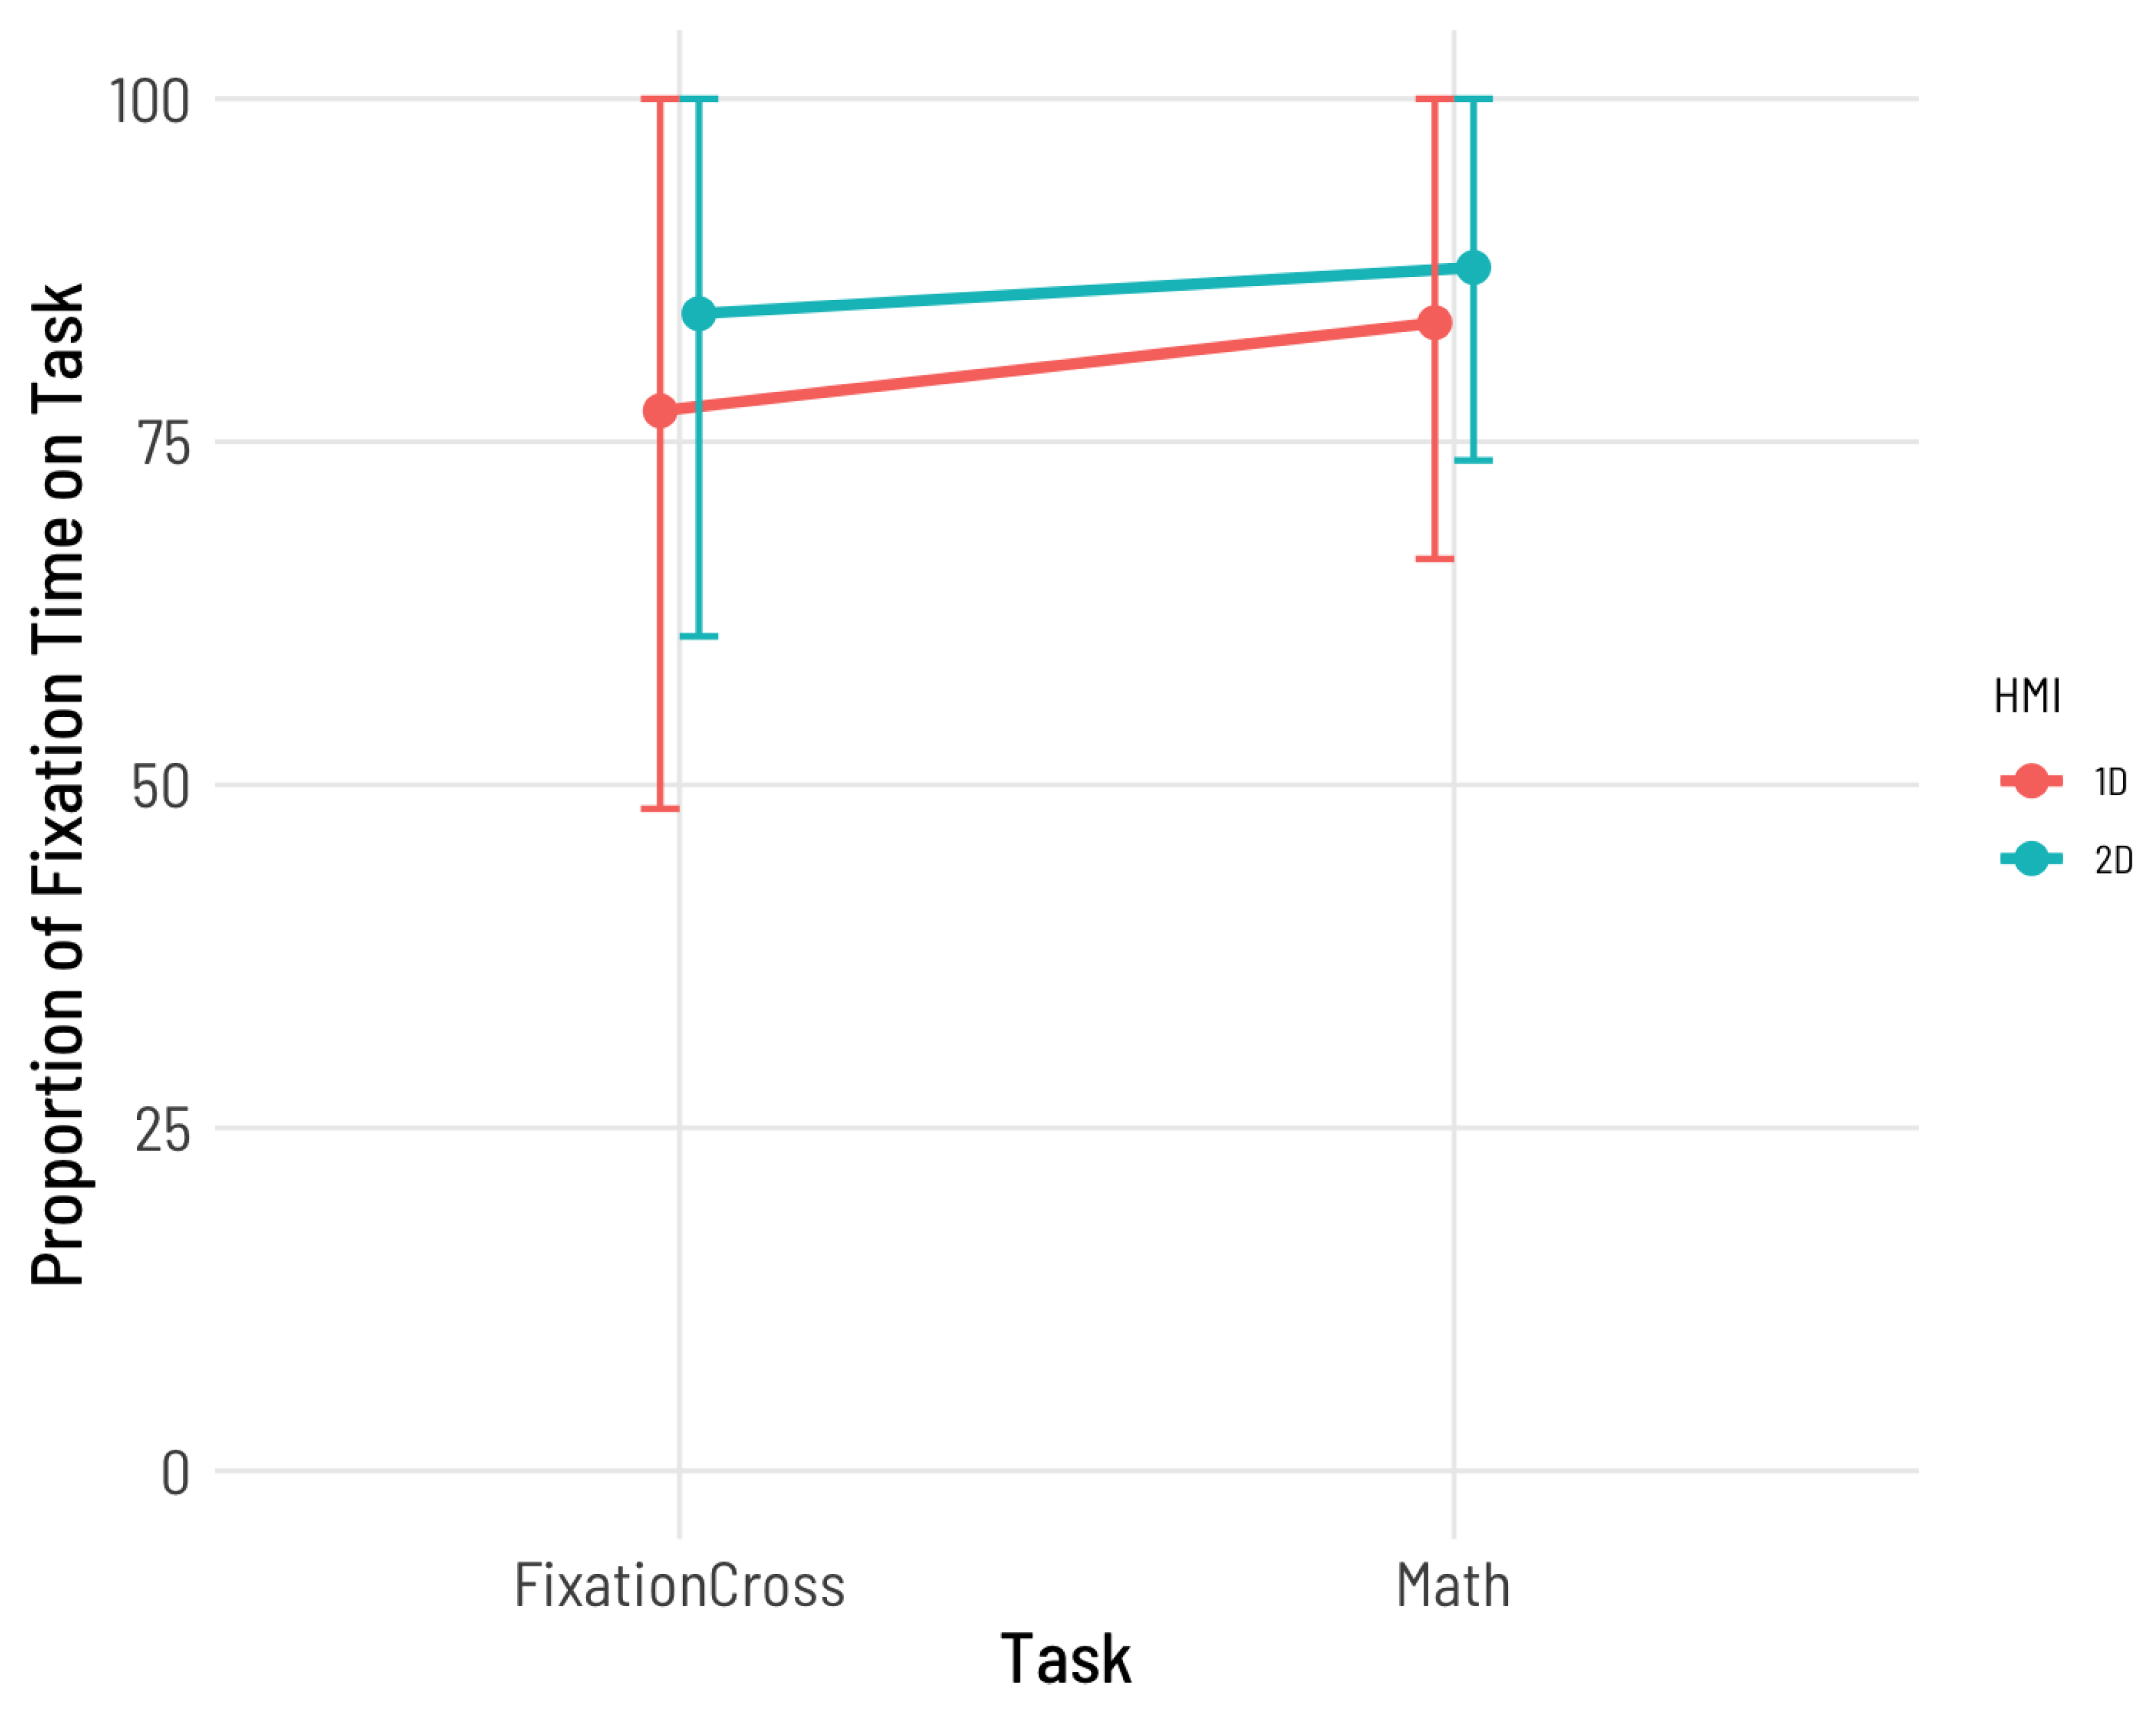
Two participants had to be excluded from the analysis of gaze behavior due to corrupted eye tracking data. A 2x2x2 ART ANOVA was carried out to investigate the effects of seating orientation, task and HMI condition on the proportion of time that the HMIs were perceived peripherally. As participants were allowed to look at the conventional display during the video HMI trials, this condition was omitted from the analysis. A significant effect of medium size for HMI was revealed, with a higher proportion of fixation time on the task during the 2D trials (M = 86.02%, SD = 19.28%) than the 1D trials (M = 80.47%, SD = 23.87%, F(1,87) = 5.72, p = .019, ). Mean proportions are shown in Figure 10.
Ten participants had a proportion of total fixation time on task lower than 70% during at least one of the 1D and 2D trials. As the exclusion of these participants leads to a sample size to low for the respective ANOVAs, the data for this subsample, as well as the full sample is shown descriptively in Appendix A. Correlations between all dependent and control variables are listed in Appendix B.
4. Discussion
One- and two-dimensional light cues for AV maneuver visualization were compared to conventional displays showing a video image with regard to perceptibility and distraction. The peripheral HMIs showed better perceptibility and caused less distraction than the video. There were no differences between the 1D and 2D variant in terms of perceptibility or distraction.
Notably, the peripherally presented light cues enabled more precise maneuver perception than the video, even when the video could be observed foveally without a distracting NDRT. This suggests that such light cues may be capable of mitigating a sensory conflict between visually and vestibularly perceived movements, thereby preventing motion sickness. This is supported by the finding that motion perception is not effected as negatively by eccentricity as acuity [39]. Moreover, there is evidence suggesting that the peripheral field of view is more relevant for the perception of optical flow [40] and is specifically critical for motor response to this optical flow, namely postural control [41]. This is particularly relevant for motion sickness mitigation as a lack of postural control is thought to be a mayor cause for motion sickness [42].
Accuracy of maneuver perception was not negatively effected by the math tasks. For the peripheral cues, this is in line with findings that even subconsciously perceived visual cues can cause correct motor responses [43]. There is mixed evidence on whether time-critical tasks involving foveally perceived stimuli, such as the math task in this study, lead to tunnel vision [44]. If so, such an effect could have been masked by learning effects in this study, as the three trials with math tasks followed the three trials with a fixation cross. Evidence points towards an adaptation to distracting stimuli over prolonged exposure [45]. This could also explain why maneuver perception did not significantly differ between NDRT conditions in the video condition. Another possible explanation is that participants focused more on controlling the joysticks rather than on the math tasks during the video condition. This would also account for the significantly worse math scores compared to the other HMI conditions. However, the peripheral light cues also led to lower math scores compared to the baseline, suggesting that they are not entirely distraction-free either.
The objectively higher distraction caused by the video is also confirmed by the subjective ratings. While mental demand was descriptively higher during the math tasks across all HMIs, this effect was only significant for the video HMI. This suggests that perceiving the maneuvers via video required more cognitive resources, making multitasking more difficult. This could explain why the subjects tended to focus on one task at a time during the video and math condition.
The 2D light cues had a higher proportion of fixation duration on the tablets than the 1D light cues. This is likely due to the larger part of the peripheral field of view that is covered by the 2D cues. However, they did not show significantly better perceptibility than the 1D light cues, as measured by the accuracy of joystick input. Despite the familiarization drives and explanations of the HMIs, test subjects sitting backwards, in particular, expressed confusion regarding the cues displayed peripherally. They mentioned a lack of contextual information, such as vestibular feedback and a view of the vehicle’s surroundings from the windows, as the reason for the interpretation problems. Since the 2D cues are a visual extension of the vehicle environment, the absence of a real vehicle environment could inhibit their comprehensibility [23,46].
Neither accuracy of maneuver perception nor NDRT distraction were significantly influenced by seating orientation. As rearward facing passengers are at particular risk of motion sickness, this suggests that the tested HMIs should be effective in mitigation motion sickness not only on forward facing passengers, but also in rearward facing passengers, who are at particular risk of motion sickness.
4.1. Limitations
The study was conducted in a static laboratory setting to ensure maximum control of environmental influences. However, despite the detailed introduction to the HMIs and the test trials, some subjects had problems understanding the 2D light cues due to a lack of contextual information that would be present during real car journeys. These were particularly pronounced in subjects sitting backwards. As a result, fluctuations in the joystick deviations cannot solely be attributed to the differences in perception of the HMIs, but also reflect different levels of accuracy in their interpretation. However, the correct interpretation of the cues presupposes their perceptibility. The fact that the joystick deviations were higher for the peripheral light cues than for the video, and no subject reported difficulties perceiving the video, therefore indicates that the peripheral cues were certainly perceptible. Nevertheless, to enable a comparison between the HMIs and seating orientations in a more realistic environment, future studies should include contextual information, e.g. by utilizing a dynamic simulator with a 360° visual environment or by using a real vehicle on a test track.
Measuring maneuver perception using joystick input is a new method that, to our knowledge, has not been used in this form before. However, since joysticks are typically used to execute maneuvers (e.g., in flight simulators or for remote operating cars), we consider this method to be suitable. However, translating the visually perceived maneuvers into motor control of the joystick requires conscious processing. It is still unclear to what extend visually perceived movements need to be consciously processed to resolve the sensory conflict responsible for motion sickness. Thus, joystick input accuracy may underestimate motion-sickness-relevant maneuver perception.
Visual information about self-motion without matching vestibular information could have led to vection and thus to motion sickness [47]. This is supported by the fact that the peripheral light cues led to descriptively higher SSQ scores than the video. Simulator sickness and mental demand showed a medium correlation. Thus, higher NASA-TLX scores might have been caused by higher simulator sickness or vice versa.
4.2. Future Research
While we found substantial advantages of visualizing vehicle maneuvers in the peripheral instead of the foveal field of view, this method also entails disadvantages. Displaying future maneuvers instead of current ones may yield additional benefits in motion sickness mitigation, as anticipation plays a mayor role in the development of motion sickness [22]. If the approach of visually expanding the vehicle environment in the interior is pursued, this leads to incongruent visual information and can exacerbate motion sickness. Future research should investigate ways of avoiding this incongruence and address how the two methods can be meaningfully combined.
5. Conclusions
1D and 2D peripheral light cues enabled more accurate vehicle manuever perception and less distraction from an NDRT than conventional displays. This shows that peripheral light cues have great potential in increasing maneuver transparency, thereby increasing trust and reducing the sensory conflict responsible for motion sickness. Research on the effectiveness of such cues has thus far yielded mixed results [23,24,25]. In these studies, only either longitudinal or lateral acceleration was visualized, never both simultaneously. Additionally, none of these studies measured gaze behavior of the subjects, so it cannot be ruled out that the light signals were primarily perceived foveally. To this end, this is the first study that shows the potential of light cues for motion sickness mitigation through peripheral perception of lateral and longitudinal maneuvers.
Author Contributions
Conceptualization, L.R., A.S. and A.J.; methodology, L.R. and A.J.; formal analysis, L.R., A.S.; investigation, L.R.; data curation, L.R.; writing—original draft preparation, L.R.; writing—review and editing, L.R., A.J. and M.V.; visualization, L.R.; supervision, M.N. and M.V.; project administration, L.R.; funding acquisition, M.N. All authors have read and agreed to the published version of the manuscript.
Funding
This work is a result of the joint research project STADT:up (Funding code 19A22006M). The project is supported by the German Federal Ministry for Economic Affairs and Energy (BMWE), based on a decision of the German Bundestag. The authors are solely responsible for the content of this publication. This work was partly funded by HELLA GmbH und Co. KGaA. The authors express their gratitude to their colleagues and research associates for their support and encouragement.
Institutional Review Board Statement
The study was conducted in accordance with the Declaration of Helsinki, and approved by the Ethics Committee of Faculty 2 of the Technische Universität Braunschweig (FV-2024-23, 10.12.2024).
Informed Consent Statement
Informed consent was obtained from all subjects involved in the study.
Data Availability Statement
The data that has been used is confidential.
Acknowledgments
We would like to thank Prof. Dr.-Ing. Jan-Niklas Voigt-Antons and the Immersive Reality Lab at the Hochschule Hamm-Lippstadt for kindly providing the eye-tracking equipment.
Conflicts of Interest
The authors declare no conflicts of interest. The funders had no role in the design of the study; in the collection, analyses, or interpretation of data; in the writing of the manuscript; or in the decision to publish the results’.
Abbreviations
The following abbreviations are used in this manuscript:
| ATI | Affinity for Technology Interaction scale |
| AV | Autonomous Vehicle |
| HMI | Human-Machine Interface |
| MSSQ | Motion Sickness Susceptibility Questionnaire |
| NDRT | Non-Driving Related Task |
| SSQ | Simulator Sickness Questionnaire |
Appendix A. Descriptive Statistics

Table A1.
Descriptive statistics for the complete sample.
| HMI | Task | Seating Orientation | Joystick Deviation | Math Score | Mental Demand | Simulator Sickness | Proportion Peripheral | |||||
|---|---|---|---|---|---|---|---|---|---|---|---|---|
| M | SD | M | SD | M | SD | M | SD | M | SD | |||
| Video | FixationCross | rearward | 0.337 | 0.118 | - | - | 6.294 | 4.254 | 16.060 | 15.910 | - | - |
| Video | FixationCross | forward | 0.370 | 0.129 | - | - | 8.176 | 5.790 | 12.760 | 11.456 | - | - |
| Video | Math | rearward | 0.360 | 0.064 | 114.471 | 35.134 | 14.412 | 5.363 | 44.880 | 39.845 | - | - |
| Video | Math | forward | 0.339 | 0.081 | 125.118 | 32.295 | 13.353 | 5.477 | 31.680 | 26.973 | - | - |
| 1D | FixationCross | rearward | 0.299 | 0.077 | - | - | 8.824 | 5.399 | 28.380 | 24.095 | 66.810 | 37.325 |
| 1D | FixationCross | forward | 0.283 | 0.080 | - | - | 9.882 | 5.600 | 20.4607 | 18.659 | 87.042 | 13.038 |
| 1D | Math | rearward | 0.321 | 0.057 | 139.412 | 32.797 | 13.235 | 5.333 | 36.300 | 34.067 | 79.336 | 21.086 |
| 1D | Math | forward | 0.292 | 0.076 | 142.588 | 29.583 | 13.882 | 4.121 | 34.540 | 30.912 | 87.761 | 11.885 |
| 2D | FixationCross | rearward | 0.316 | 0.067 | - | - | 10.000 | 5.339 | 33.000 | 22.056 | 79.894 | 31.180 |
| 2D | FixationCross | forward | 0.310 | 0.069 | - | - | 11.000 | 5.050 | 29.040 | 28.986 | 88.502 | 12.644 |
| 2D | Math | rearward | 0.327 | 0.086 | 137.176 | 32.765 | 12.765 | 5.032 | 40.260 | 34.189 | 82.226 | 18.258 |
| 2D | Math | forward | 0.308 | 0.062 | 150.118 | 32.713 | 13.824 | 5.114 | 33.220 | 24.413 | 92.849 | 5.107 |
| Baseline | Math | rearward | - | - | 156.647 | 38.839 | - | - | - | - | - | - |
| Baseline | Math | forward | - | - | 163.059 | 29.733 | - | - | - | - | - | - |
Note. Arithmetic means and standard deviations for the complete sample.
Table A2.
Descriptive statistics for 70% peripheral vision subset.
| HMI | Task | Seating Orientation | Joystick Deviation | Math Score | Mental Demand | Simulator Sickness | Proportion Peripheral | |||||
|---|---|---|---|---|---|---|---|---|---|---|---|---|
| M | SD | M | SD | M | SD | M | SD | M | SD | |||
| Video | FixationCross | rearward | 0.288 | 0.079 | - | - | 5.091 | 2.468 | 18.700 | 17.622 | - | - |
| Video | FixationCross | forward | 0.400 | 0.139 | - | - | 8.077 | 5.408 | 13.234 | 12.739 | - | - |
| Video | Math | rearward | 0.350 | 0.074 | 111.091 | 30.015 | 12.909 | 5.718 | 42.160 | 38.798 | - | - |
| Video | Math | forward | 0.326 | 0.089 | 132.692 | 30.261 | 13.923 | 4.804 | 37.975 | 28.023 | - | - |
| 1D | FixationCross | rearward | 0.288 | 0.081 | - | - | 7.182 | 3.737 | 24.820 | 15.535 | 89.882 | 8.887 |
| 1D | FixationCross | forward | 0.283 | 0.089 | - | - | 10.077 | 5.107 | 21.577 | 20.664 | 89.360 | 8.804 |
| 1D | Math | rearward | 0.323 | 0.058 | 134.000 | 31.116 | 11.909 | 5.467 | 32.300 | 30.626 | 93.900 | 5.943 |
| 1D | Math | forward | 0.294 | 0.083 | 149.615 | 30.110 | 14.462 | 3.256 | 40.852 | 32.799 | 91.151 | 8.185 |
| 2D | FixationCross | rearward | 0.320 | 0.072 | - | - | 8.364 | 4.478 | 31.280 | 19.597 | 93.069 | 6.589 |
| 2D | FixationCross | forward | 0.316 | 0.072 | - | - | 11.154 | 4.879 | 31.646 | 31.610 | 93.571 | 5.354 |
| 2D | Math | rearward | 0.314 | 0.077 | 137.091 | 28.137 | 11.364 | 5.464 | 34.000 | 23.740 | 94.872 | 5.615 |
| 2D | Math | forward | 0.307 | 0.057 | 155.769 | 33.799 | 14.308 | 4.590 | 37.400 | 26.180 | 93.165 | 5.841 |
| Baseline | Math | rearward | - | - | 147.091 | 33.851 | - | - | - | - | - | - |
| Baseline | Math | forward | - | - | 165.923 | 32.186 | - | - | - | - | - | - |
Note. Arithmetic means and standard deviations for the 70% peripheral visibility subset.
Appendix B. Correlations
Table A3.
Pearson product-moment correlations between all dependent and control variables.
| Variable | Proportion Peripheral | Joystick Accuracy | Math Score | Simulator Sickness | Mental Demand |
|---|---|---|---|---|---|
| Proportion Peripheral | 1.000 | -0.081 | 0.307* | -0.163 | -0.256* |
| Joystick Accuracy | -0.081 | 1.000 | -0.021 | 0.014 | 0.009 |
| Math Score | 0.307* | -0.021 | 1.000 | -0.297* | -0.256 |
| Simulator Sickness | -0.163 | 0.014 | -0.297* | 1.000 | 0.517* |
| Mental Demand | -0.256* | 0.009 | -0.250 | 0.517* | 1.000 |
Note. Stars indicate statistical significance based on Bonferroni-Holm corrected p-values.
References
- Benleulmi, A.Z.; Blecker, T. Investigating the Factors Influencing the Acceptance of Fully Autonomous Cars. In Proceedings of the Proceedings of the Hamburg International Conference of Logistics (HICL). [CrossRef]
- Nordhoff, S.; Kyriakidis, M.; Van Arem, B.; Happee, R. A Multi-Level Model on Automated Vehicle Acceptance (MAVA): A Review-Based Study. Theoretical Issues in Ergonomics Science 2019, 20, 682–710. [Google Scholar] [CrossRef]
- Nordhoff, S.; Madigan, R.; Van Arem, B.; Merat, N.; Happee, R. Interrelationships among Predictors of Automated Vehicle Acceptance: A Structural Equation Modelling Approach. Theoretical Issues in Ergonomics Science 2021, 22, 383–408. [Google Scholar] [CrossRef]
- Nordhoff, S.; Malmsten, V.; Van Arem, B.; Liu, P.; Happee, R. A Structural Equation Modeling Approach for the Acceptance of Driverless Automated Shuttles Based on Constructs from the Unified Theory of Acceptance and Use of Technology and the Diffusion of Innovation Theory. Transportation Research Part F: Traffic Psychology and Behaviour 2021, 78, 58–73. [Google Scholar] [CrossRef]
- Osswald, S.; Wurhofer, D.; Trösterer, S.; Beck, E.; Tscheligi, M. Predicting Information Technology Usage in the Car: Towards a Car Technology Acceptance Model. In Proceedings of the Proceedings of the 4th International Conference on Automotive User Interfaces and Interactive Vehicular Applications, Portsmouth New Hampshire, 2012. [CrossRef]
- Venkatesh. ; Thong.; Xu. Consumer Acceptance and Use of Information Technology: Extending the Unified Theory of Acceptance and Use of Technology. MIS Quarterly 2012, 36, 157–10.2307. [Google Scholar] [CrossRef]
- Xu, Z.; Zhang, K.; Min, H.; Wang, Z.; Zhao, X.; Liu, P. What Drives People to Accept Automated Vehicles? Findings from a Field Experiment. Transportation Research Part C: Emerging Technologies 2018, 95, 320–334. [Google Scholar] [CrossRef]
- Zhang, T.; Tao, D.; Qu, X.; Zhang, X.; Lin, R.; Zhang, W. The Roles of Initial Trust and Perceived Risk in Public’s Acceptance of Automated Vehicles. Transportation Research Part C: Emerging Technologies 2019, 98, 207–220. [Google Scholar] [CrossRef]
- Zhang, T.; Zeng, W.; Zhang, Y.; Tao, D.; Li, G.; Qu, X. What Drives People to Use Automated Vehicles? A Meta-Analytic Review. Accident Analysis & Prevention 2021, 159, 106270. [Google Scholar] [CrossRef]
- Jorlöv, S.; Bohman, K.; Larsson, A. Seating Positions and Activities in Highly Automated Cars – A Qualitative Study of Future Automated Driving Scenarios. In Proceedings of the IRCOBI Conference Proceedings; 2017; pp. 13–22. [Google Scholar]
- Pettersson, I.; Karlsson, I.M. Setting the Stage for Autonomous Cars: A Pilot Study of Future Autonomous Driving Experiences. IET Intelligent Transport Systems 2015, 9, 694–701. [Google Scholar] [CrossRef]
- Sun, X.; Cao, S.; Tang, P. Shaping Driver-Vehicle Interaction in Autonomous Vehicles: How the New in-Vehicle Systems Match the Human Needs. Applied Ergonomics 2021, 90, 103238. [Google Scholar] [CrossRef] [PubMed]
- Salter, S.; Diels, C.; Herriotts, P.; Kanarachos, S.; Thake, D. Motion Sickness in Automated Vehicles with Forward and Rearward Facing Seating Orientations. Applied Ergonomics 2019, 78, 54–61. [Google Scholar] [CrossRef]
- Metzulat, M.; Metz, B.; Edelmann, A.; Neukum, A.; Kunde, W. Sick of Being Driven? 2025; arXiv:cs/2505.04210]. [Google Scholar] [CrossRef]
- Reason, J.T. Motion Sickness Adaptation: A Neural Mismatch Model. Journal of the Royal Society of Medicine 1978, 71, 819–829. [Google Scholar] [CrossRef]
- Diels, C. Will Autonomous Vehicles Make Us Sick? In Contemporary Ergonomics and Human Factors 2014; Sharples, S.; Shorrock, S., Eds.; Taylor & Francis, 2014; pp. 301–307. [CrossRef]
- Griffin, M.J.; Newman, M.M. Visual Field Effects on Motion Sickness in Cars. Aviation, Space, and Environmental Medicine 2004, 75, 739–748. [Google Scholar]
- Chang, C.C.; Grier, R.A.; Maynard, J.; Shutko, J.; Blommer, M.; Swaminathan, R.; Curry, R. Using a Situational Awareness Display to Improve Rider Trust and Comfort with an AV Taxi. Proceedings of the Human Factors and Ergonomics Society Annual Meeting 2019, 63, 2083–2087. [Google Scholar] [CrossRef]
- Hanau, E.; Popescu, V. Sickness. In Proceedings of the Proceedings of the 9th International Conference on Automotive User Interfaces and Interactive Vehicular Applications Adjunct, Oldenburg Germany, 2017. [CrossRef]
- Kuiper, O.X.; Bos, J.E.; Diels, C. Looking Forward: In-vehicle Auxiliary Display Positioning Affects Carsickness. Applied Ergonomics 2018, 68, 169–175. [Google Scholar] [CrossRef]
- Oliveira, L.; Burns, C.; Luton, J.; Iyer, S.; Birrell, S. The Influence of System Transparency on Trust: Evaluating Interfaces in a Highly Automated Vehicle. Transportation Research Part F: Traffic Psychology and Behaviour 2020, 72, 280–296. [Google Scholar] [CrossRef]
- Diels, C.; Bos, J. Great Expectations: On the Design of Predictive Motion Cues to Alleviate Carsickness. In HCI in Mobility, Transport, and Automotive Systems; Krömker, H., Ed.; Springer International Publishing: Cham, 2021. [Google Scholar] [CrossRef]
- Bohrmann, D.; Bruder, A.; Bengler, K. Effects of Dynamic Visual Stimuli on the Development of Carsickness in Real Driving. IEEE Transactions on Intelligent Transportation Systems 2022, 23, 4833–4842. [Google Scholar] [CrossRef]
- Hainich, R.; Drewitz, U.; Ihme, K.; Lauermann, J.; Niedling, M.; Oehl, M. Evaluation of a Human–Machine Interface for Motion Sickness Mitigation Utilizing Anticipatory Ambient Light Cues in a Realistic Automated Driving Setting. Information 2021, 12, 176. [Google Scholar] [CrossRef]
- De Winkel, K.N.; Pretto, P.; Nooij, S.A.; Cohen, I.; Bülthoff, H.H. Efficacy of Augmented Visual Environments for Reducing Sickness in Autonomous Vehicles. Applied Ergonomics 2021, 90, 103282. [Google Scholar] [CrossRef] [PubMed]
- Wickens, C.D. Multiple Resources and Performance Prediction. Theoretical Issues in Ergonomics Science 2002, 3, 159–177. [Google Scholar] [CrossRef]
- Rottmann, L.; Johannsen, A.; Niedling, M.; Vollrath, M. Influence of Seating Orientation on Motion Sickness in Autonomous Vehicles. Applied Ergonomics 2026, 130, 104643. [Google Scholar] [CrossRef]
- Girard, J.M.; C. Wright, A.G. DARMA: Software for Dual Axis Rating and Media Annotation. Behavior Research Methods 2018, 50, 902–909. [Google Scholar] [CrossRef]
- Hart, S.G. NASA Task Load Index (TLX): Computerized Version - Volume 1.0, 1986.
- De Winkel, K.N.; Talsma, T.M.W.; Happee, R. A Meta-Analysis of Simulator Sickness as a Function of Simulator Fidelity. Experimental Brain Research 2022, 240, 3089–3105. [Google Scholar] [CrossRef]
- Metzulat, M.; Metz, B.; Landau, A.; Neukum, A.; Kunde, W. Too Sick to Take over? - Impact of Car Sickness on Cognitive Performance Related to Driving in the Context of Automated Driving. Transportation Research Part F: Traffic Psychology and Behaviour 2025, 109, 480–500. [Google Scholar] [CrossRef]
- Kennedy, R.S.; Lane, N.E.; Berbaum, K.S.; Lilienthal, M.G. Simulator Sickness Questionnaire: An Enhanced Method for Quantifying Simulator Sickness. The International Journal of Aviation Psychology 1993, 3, 203–220. [Google Scholar] [CrossRef]
- Golding, J.F. Predicting Individual Differences in Motion Sickness Susceptibility by Questionnaire. Personality and Individual Differences 2006, 41, 237–248. [Google Scholar] [CrossRef]
- Franke, T.; Attig, C.; Wessel, D. A Personal Resource for Technology Interaction: Development and Validation of the Affinity for Technology Interaction (ATI) Scale. International Journal of Human–Computer Interaction 2019, 35, 456–467. [Google Scholar] [CrossRef]
- Rottmann, L.; Stang, A.; Johannsen, A.; Niedling, M. Designing a Light-Based Extension of the Vehicle Environment for Motion Sickness Mitigation. In Proceedings of the Proceedings of the 16th International Symposium on Automotive Lighting 2025, Darmstadt, 2025. [CrossRef]
- Künzer, L. ,,Alarmstufe Rot!“ oder,,Alles im grünen Bereich!“ Farben im Kontext von Gefahr und Sicherheit. PhD thesis, Universität Regensburg, 2016.
- Wobbrock, J.O.; Findlater, L.; Gergle, D.; Higgins, J.J. The Aligned Rank Transform for Nonparametric Factorial Analyses Using Only Anova Procedures. In Proceedings of the Proceedings of the SIGCHI Conference on Human Factors in Computing Systems, New York, NY, USA, 2011. [CrossRef]
- Cohen, J. Statistical Power Analysis for the Behavioral Sciences, 2 ed.; Routledge: New York, 1988. [Google Scholar] [CrossRef]
- Levi, D.M.; Klein, S.A.; Aitsebaomo, P. Detection and Discrimination of the Direction of Motion in Central and Peripheral Vision of Normal and Amblyopic Observers. Vision Research 1984, 24, 789–800. [Google Scholar] [CrossRef] [PubMed]
- McManus, M.; D’Amour, S.; Harris, L.R. Using Optic Flow in the Far Peripheral Field. Journal of Vision 2017, 17, 3. [Google Scholar] [CrossRef]
- Hanssens, J.M.; Piponnier, J.C.; Faubert, J. Influence of Central and Peripheral Visual Field on the Postural Control When Viewing an Optic Flow Stimulus. Journal of Vision 2008, 8, 858. [Google Scholar] [CrossRef]
- Riccio, G.E.; Stoffregen, T.A. An Ecological Theory of Motion Sickness and Postural Instability. Ecological Psychology 1991, 3, 195–240. [Google Scholar] [CrossRef]
- Leukel, C.; Lundbye-Jensen, J.; Christensen, M.S.; Gollhofer, A.; Nielsen, J.B.; Taube, W. Subconscious Visual Cues during Movement Execution Allow Correct Online Choice Reactions. PLOS ONE 2012, 7, e44496. [Google Scholar] [CrossRef] [PubMed]
- Vater, C.; Wolfe, B.; Rosenholtz, R. Peripheral Vision in Real-World Tasks: A Systematic Review. Psychonomic Bulletin & Review 2022, 29, 1531–1557. [Google Scholar] [CrossRef]
- Liang, Z.; Wang, Y.; Qian, C.; Wang, Y.; Zhao, C.; Du, H.; Deng, J.; Li, X.; He, Y. A Driving Simulator Study to Examine the Impact of Visual Distraction Duration from In-Vehicle Displays: Driving Performance, Detection Response, and Mental Workload. Electronics 2024, 13, 2718. [Google Scholar] [CrossRef]
- Karjanto, J.; Yusof, N.; Hassan, M.Z.; Terken, J.; Rauterberg, M. An On-Road Study in Mitigating Motion Sickness When Reading in Automated Driving. Journal of Hunan University Natural Sciences 2021. [Google Scholar]
- Keshavarz, B.; Hecht, H.; Zschutschke, L. Intra-Visual Conflict in Visually Induced Motion Sickness. Displays 2011, 32, 181–188. [Google Scholar] [CrossRef]
Figure 1.
Video HMI maneuver visualization during a sharp right turn. The coordinate grid in the bottom right visualizes the subjects’ joystick input (red), as well as the ideal joystick input (yellow, only during test runs).
Figure 1.
Video HMI maneuver visualization during a sharp right turn. The coordinate grid in the bottom right visualizes the subjects’ joystick input (red), as well as the ideal joystick input (yellow, only during test runs).
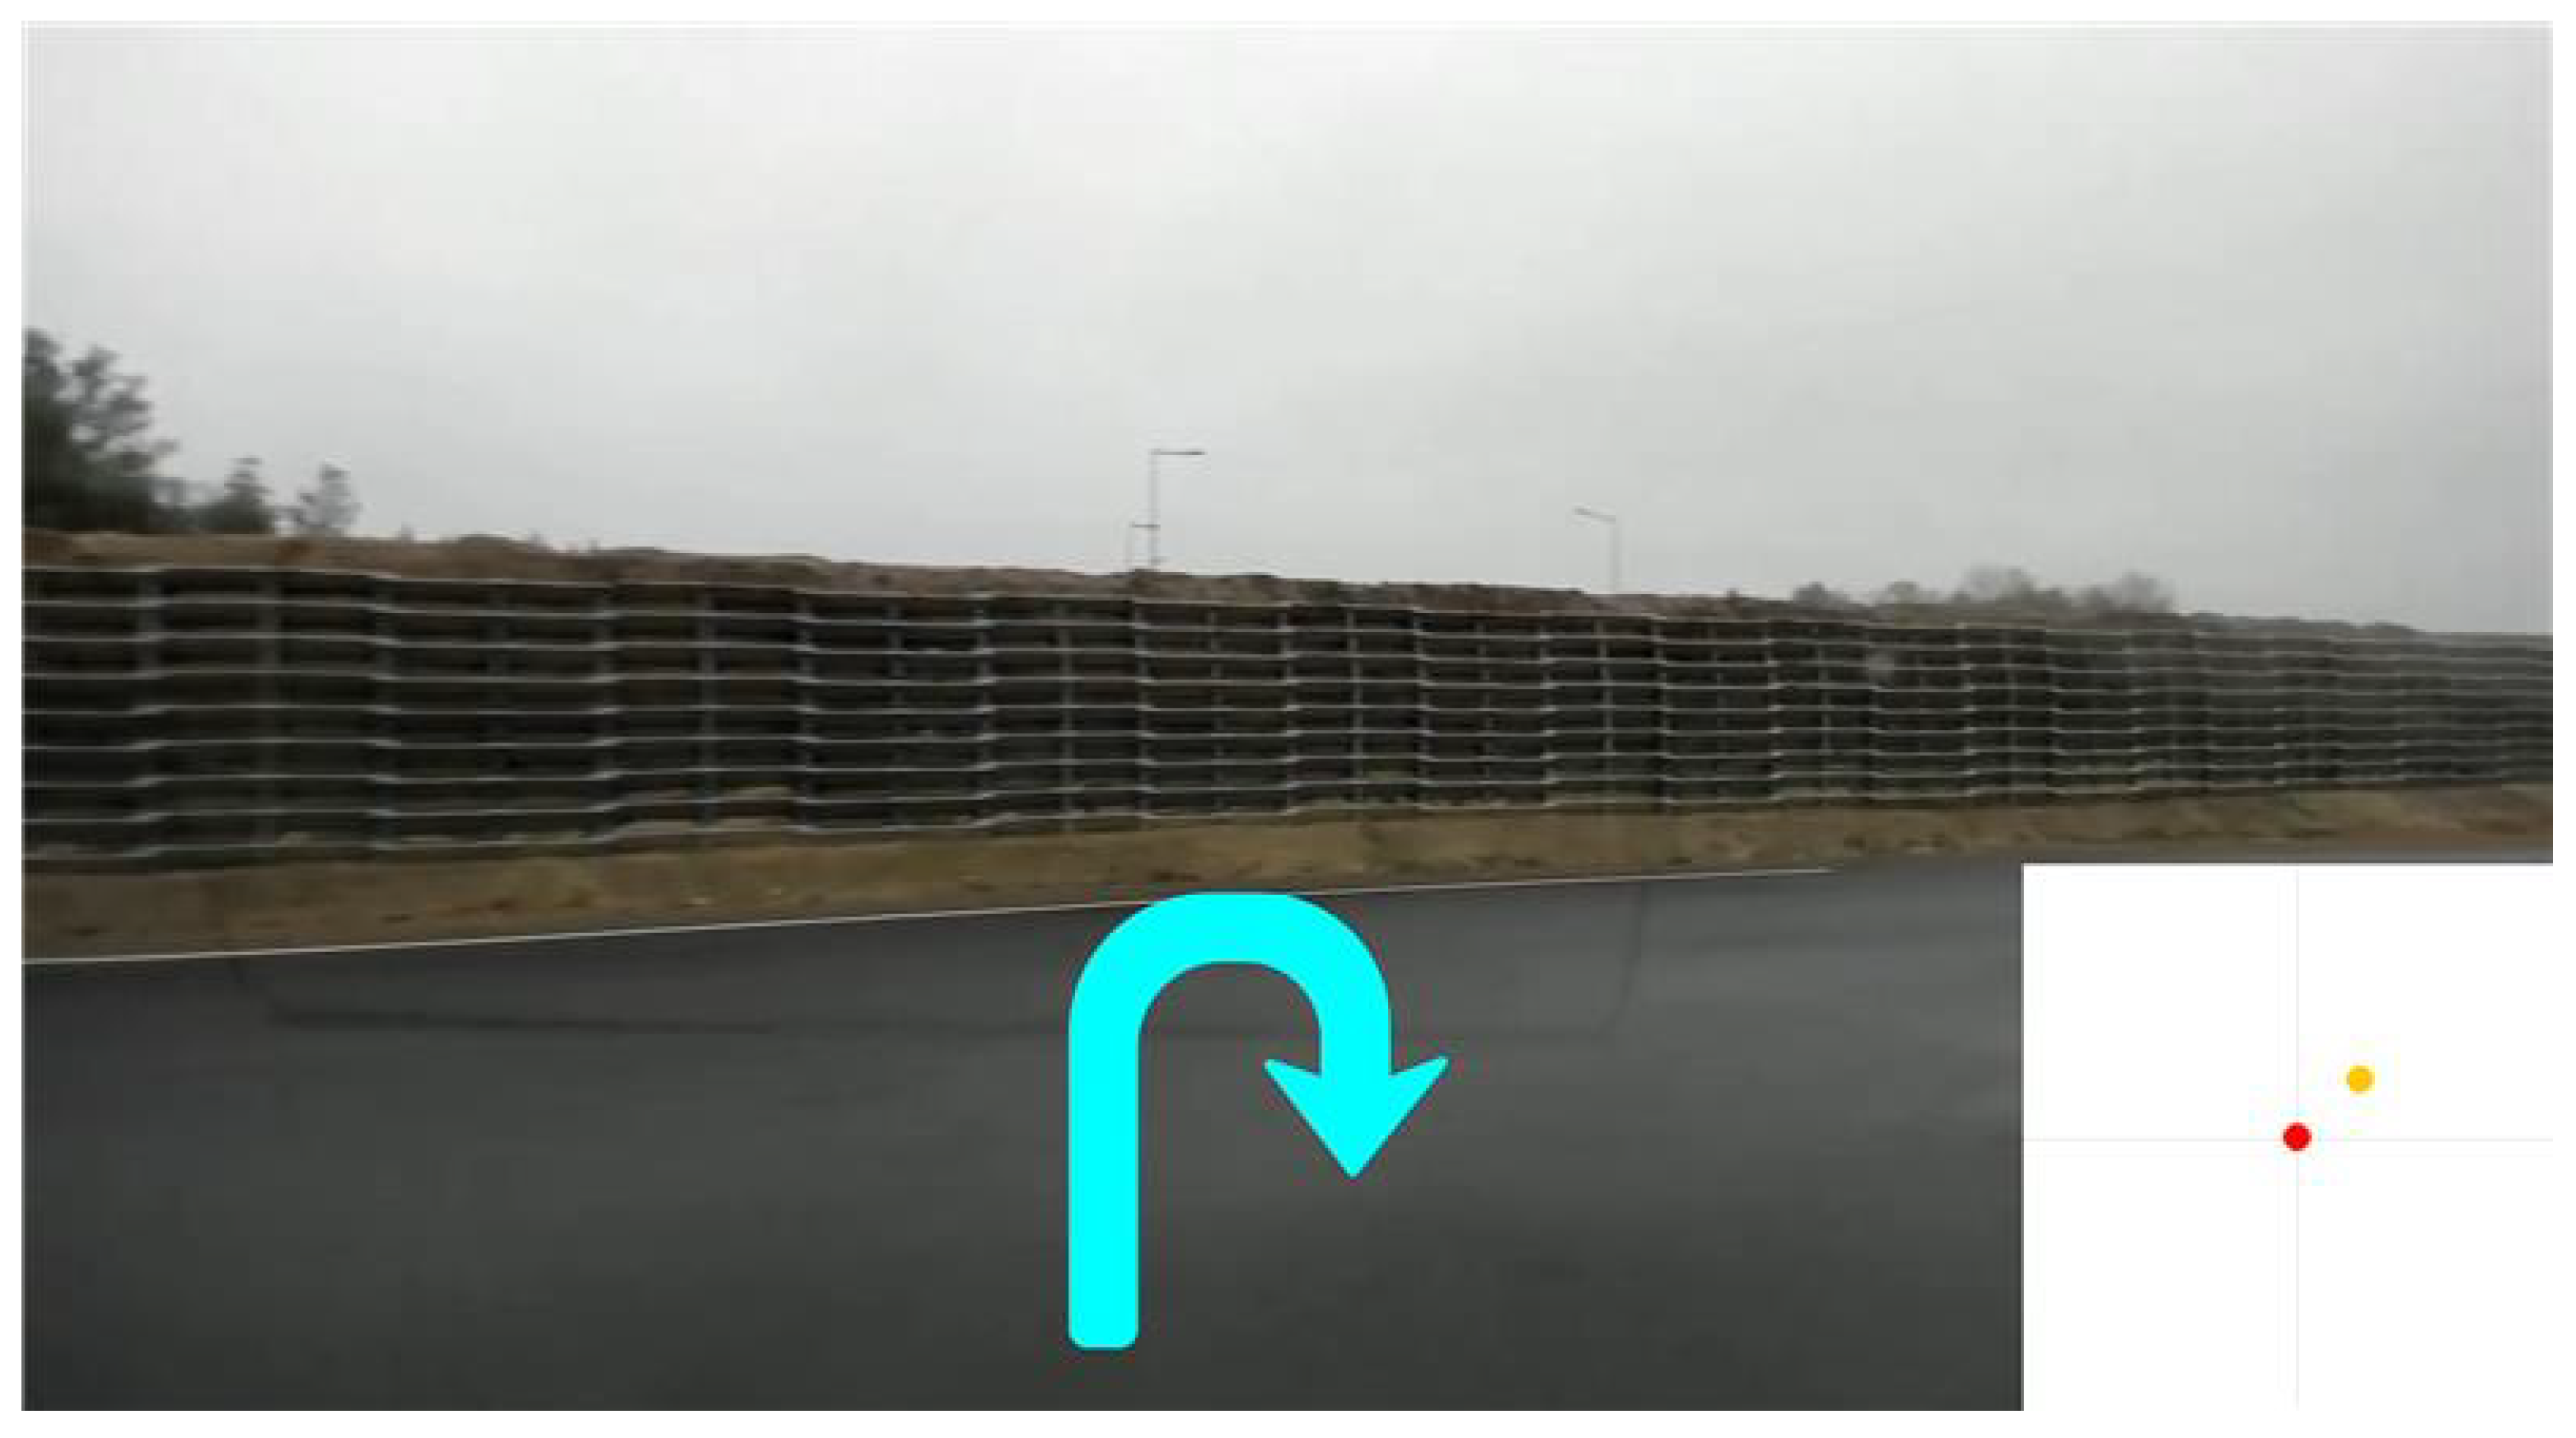
Figure 3.
Logarithmic scaling of cue velocity based on vehicle velocity across the range of zero - 100 km/h. The scaling shown corresponds to the 1D cues and the 2D cues in the foremost layer, whereas 2D cue velocity halved in the centre layer and quartered in the rearmost layer.
Figure 3.
Logarithmic scaling of cue velocity based on vehicle velocity across the range of zero - 100 km/h. The scaling shown corresponds to the 1D cues and the 2D cues in the foremost layer, whereas 2D cue velocity halved in the centre layer and quartered in the rearmost layer.
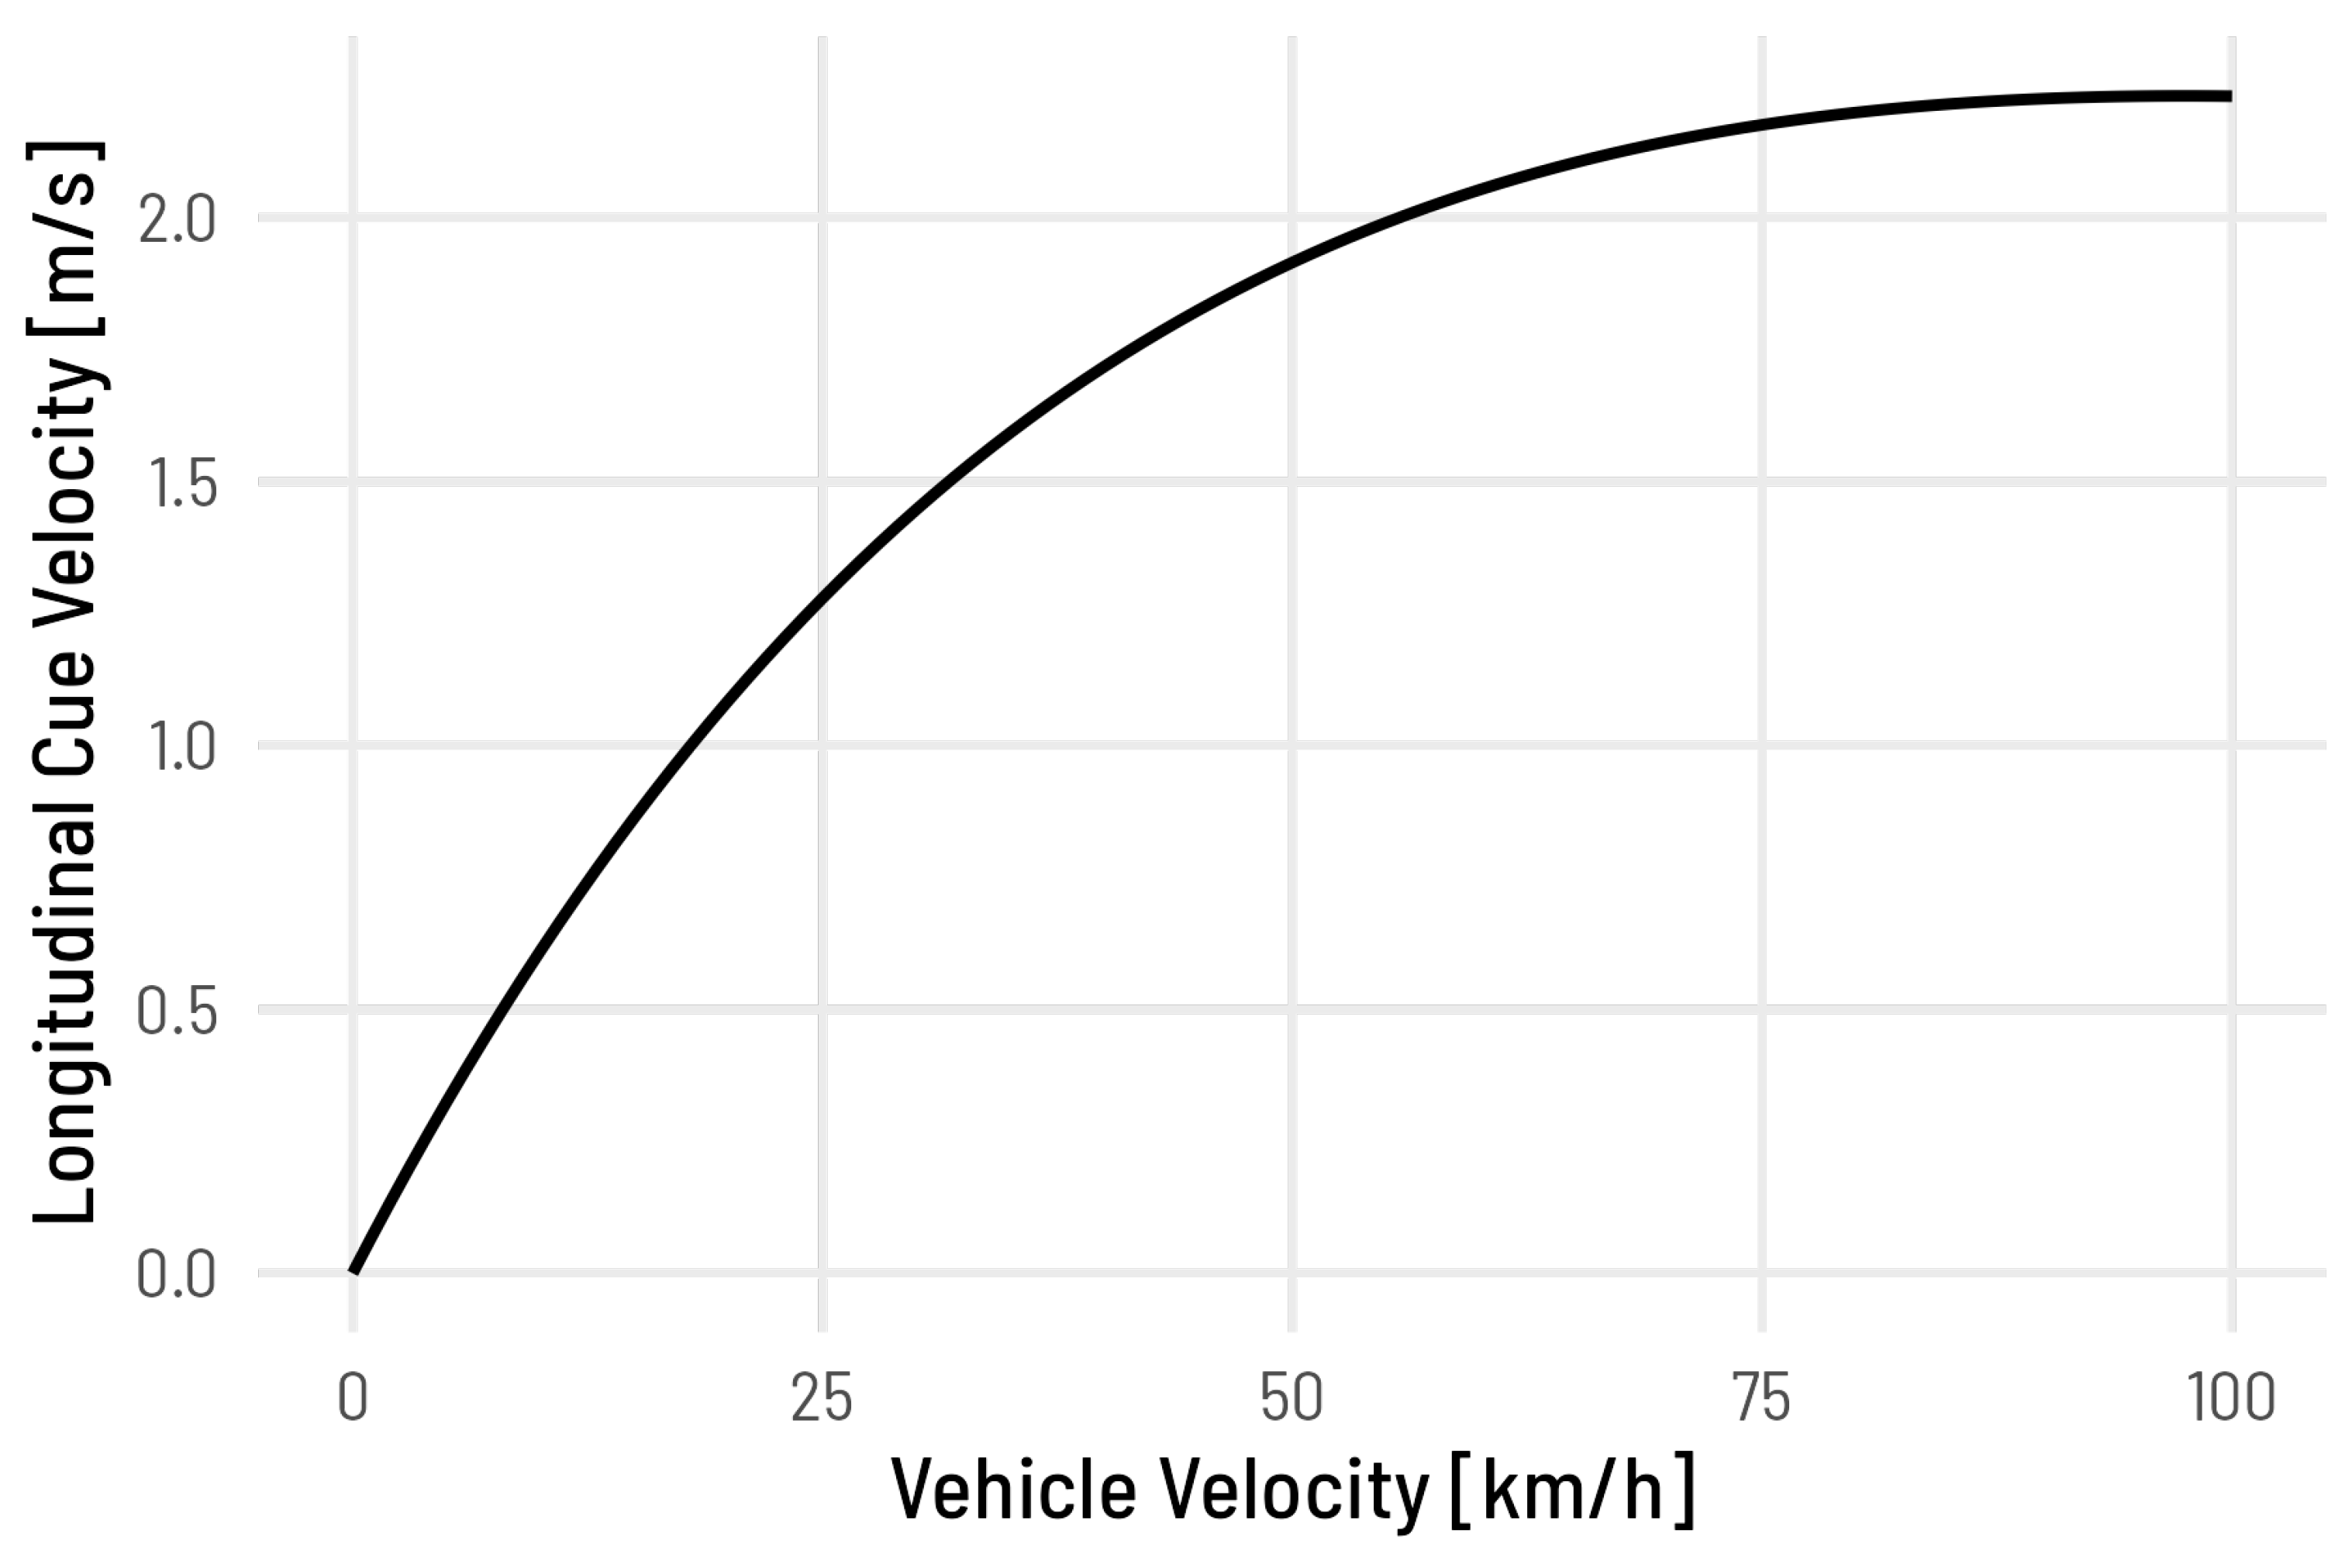
Figure 4.
Scaling of vertical cue velocity based on steering wheel angle and vehicle velocity (only 2D HMI).
Figure 4.
Scaling of vertical cue velocity based on steering wheel angle and vehicle velocity (only 2D HMI).
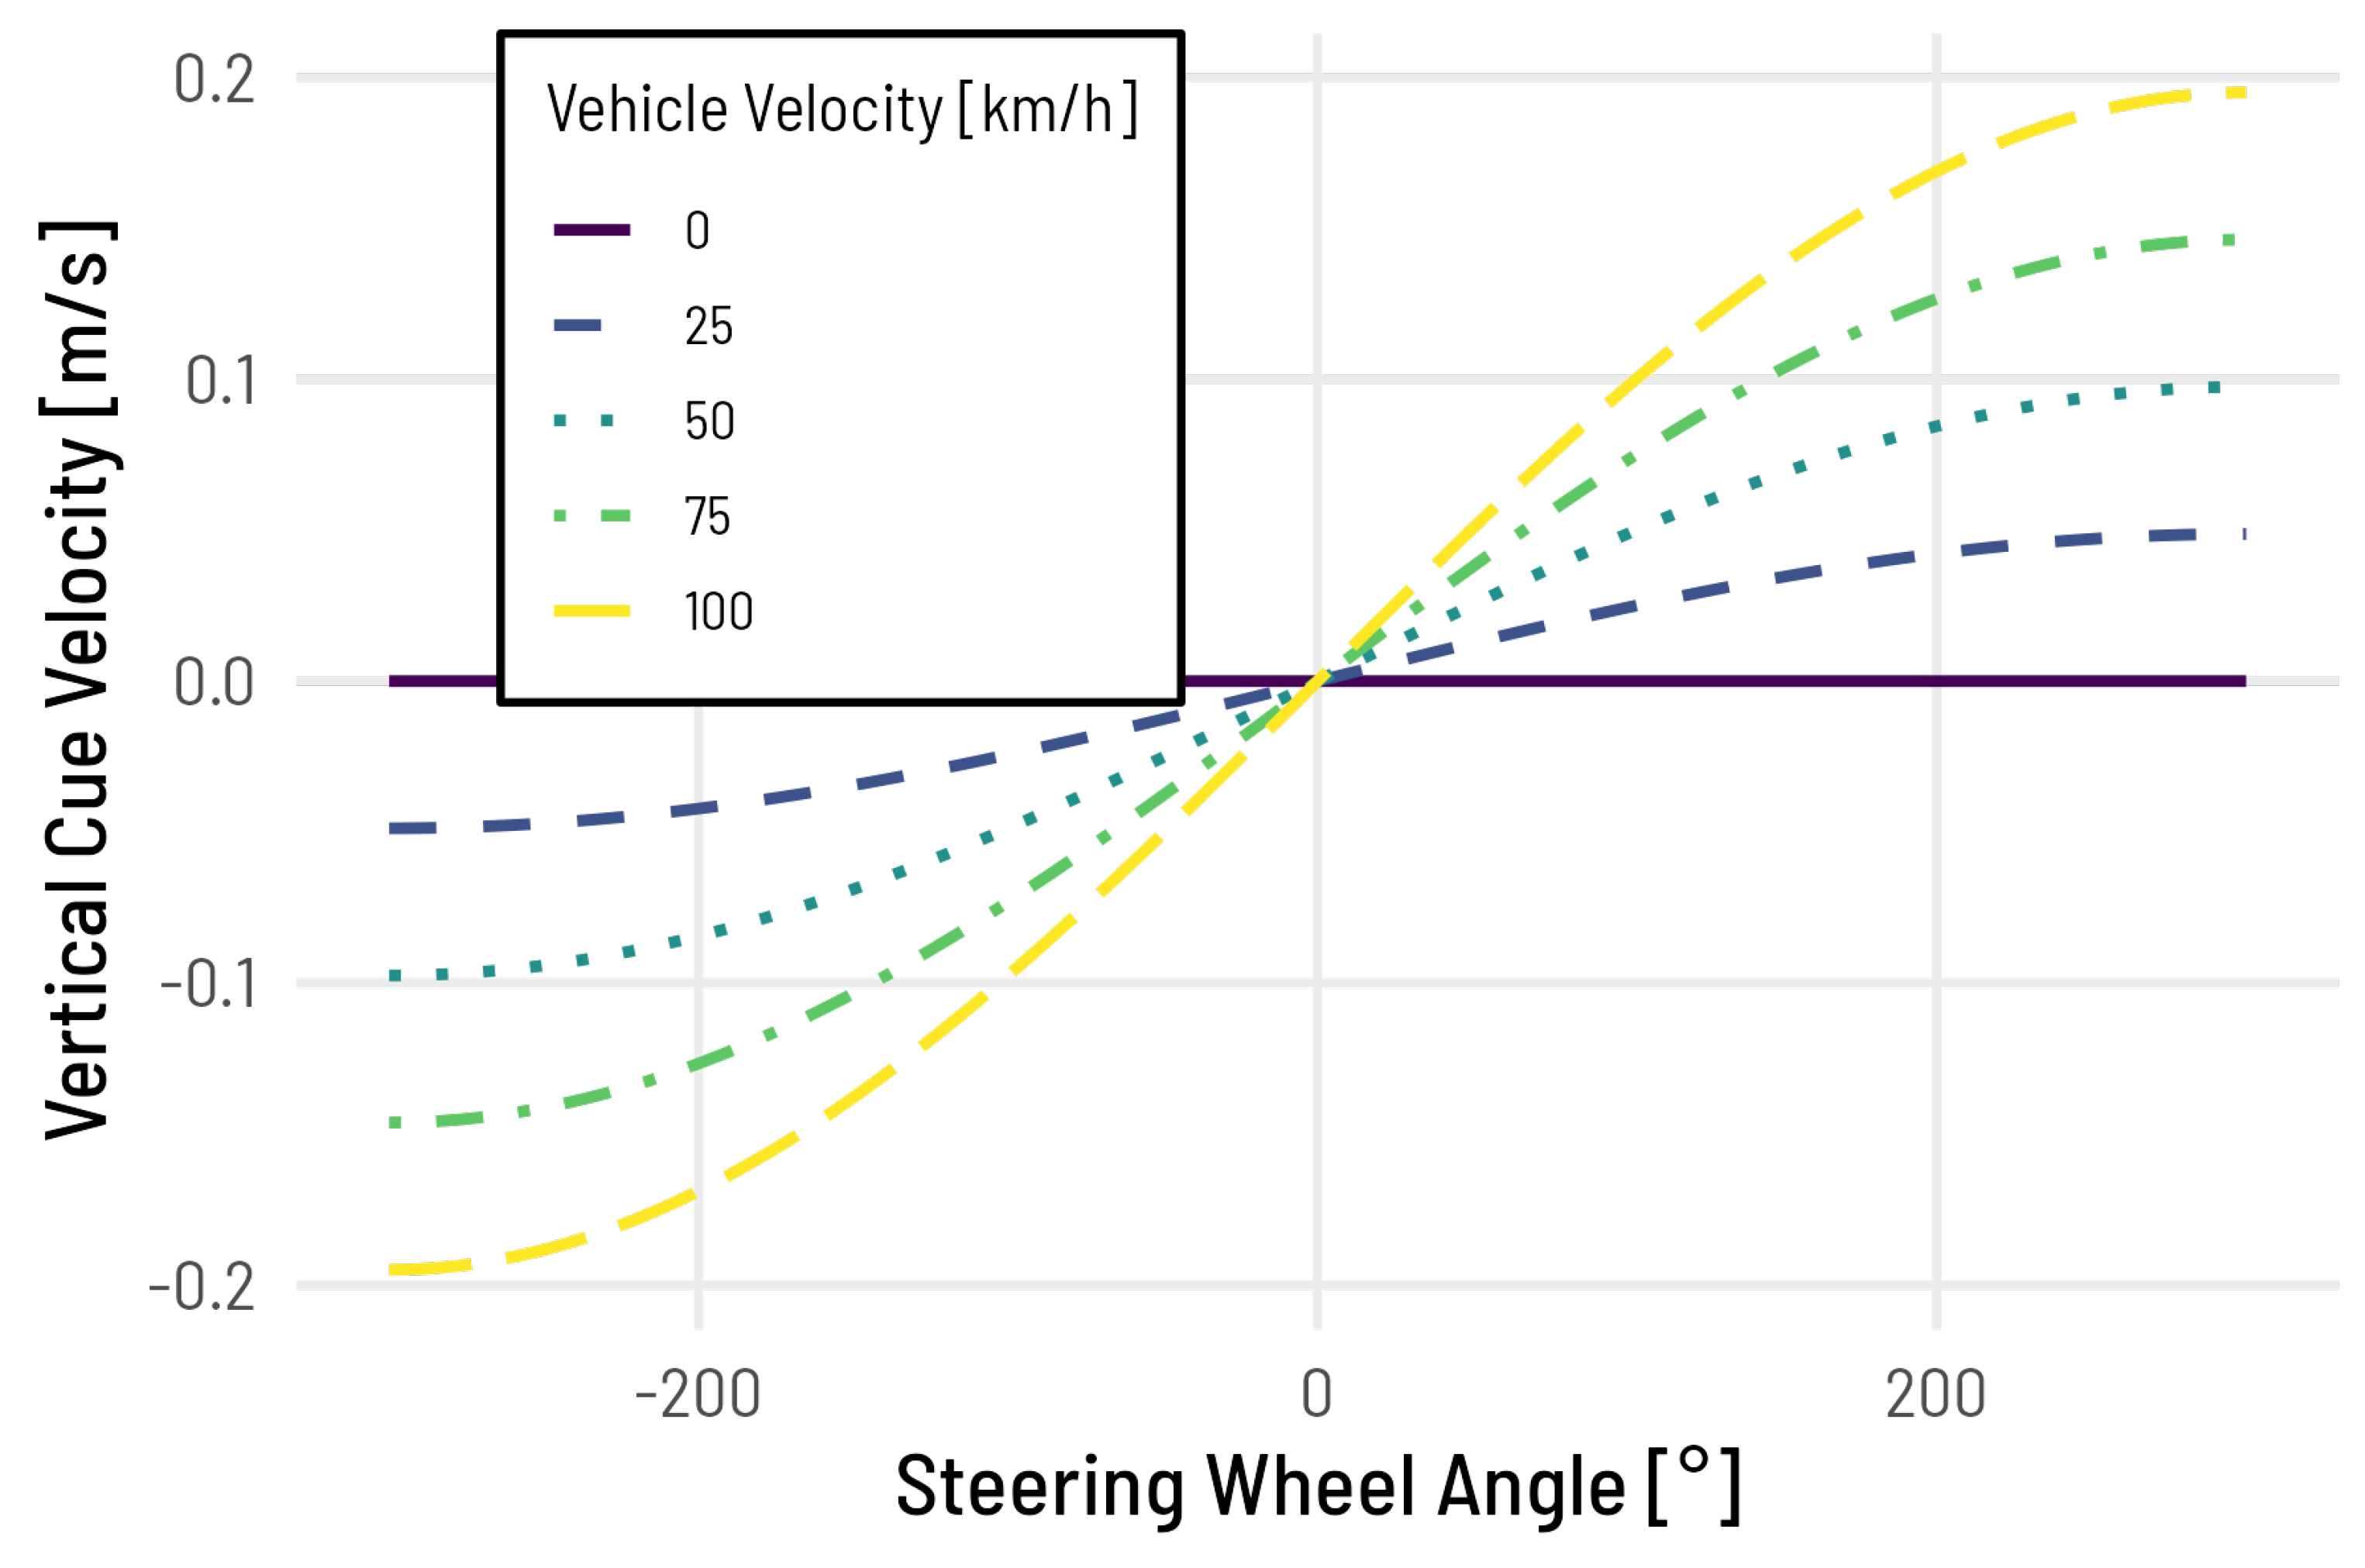
Figure 5.
Scaling of cue color based on steering wheel angle.
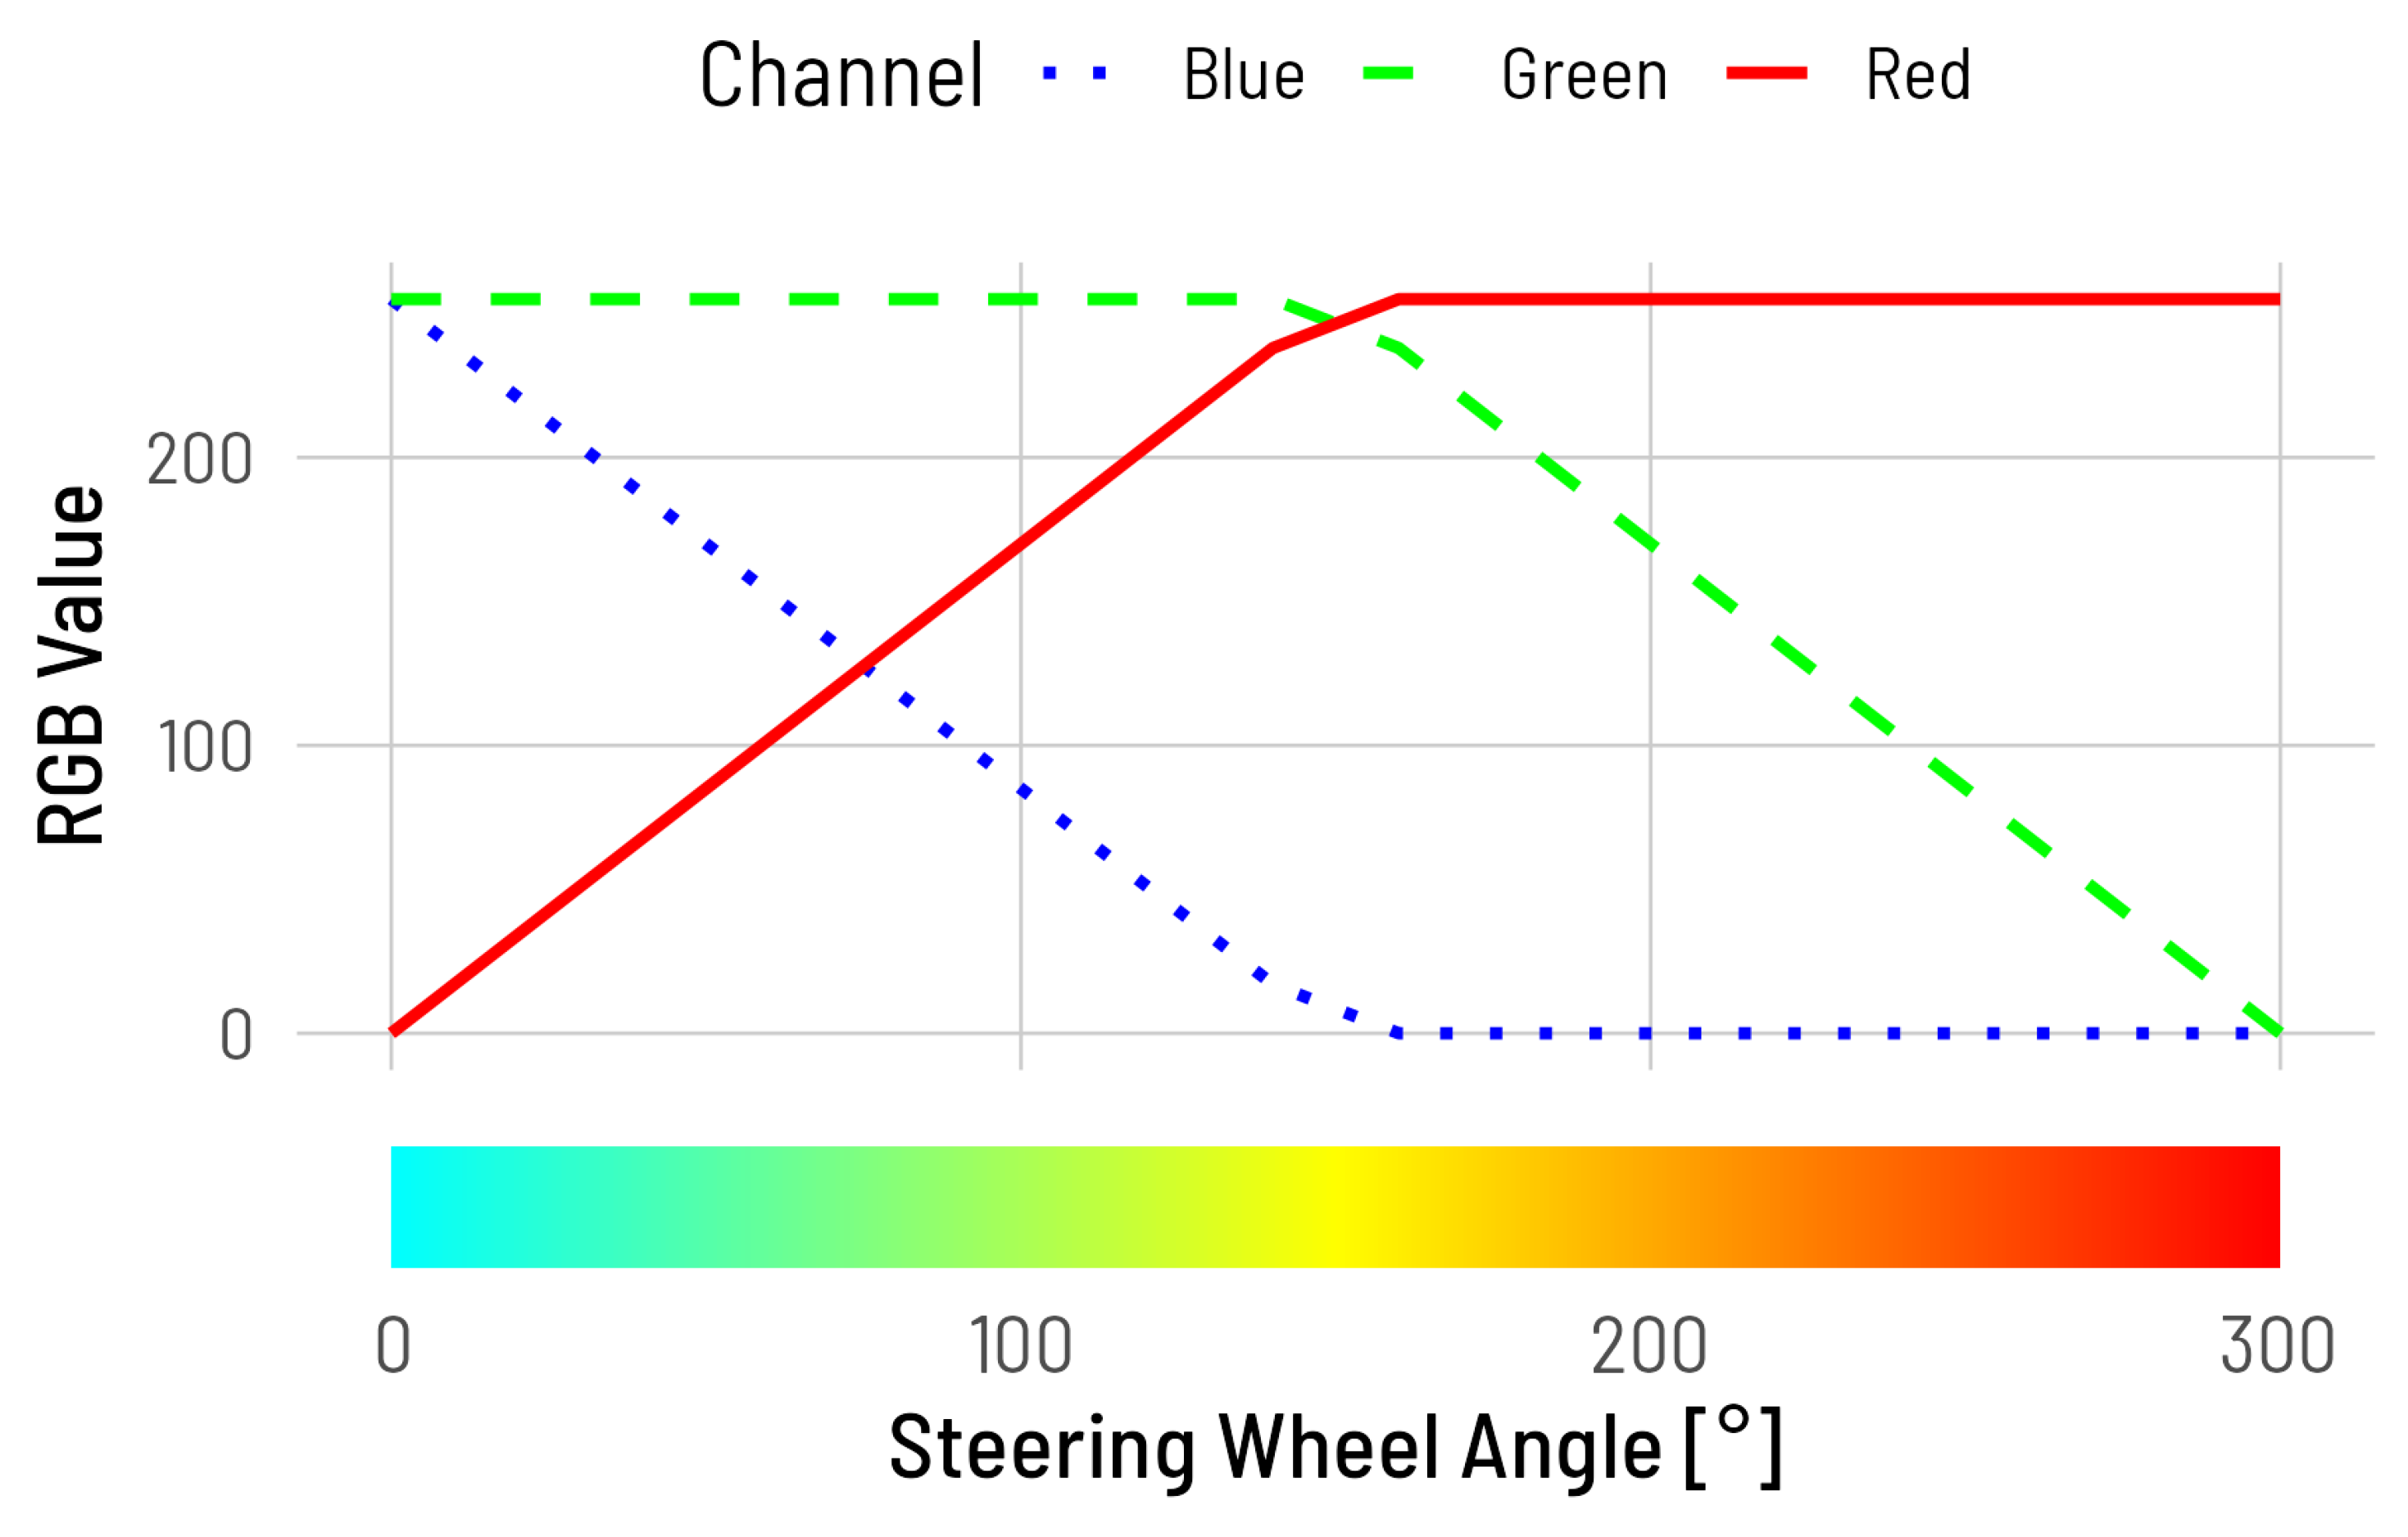
Figure 6.
Mean absolute joystick deviation for each combination of HMI and task conditions. The maximum possible deviation is 2.83 (diagonal of the 2x2 coordinate system). Higher scores indicate lower maneuver perception accuracy.
Figure 6.
Mean absolute joystick deviation for each combination of HMI and task conditions. The maximum possible deviation is 2.83 (diagonal of the 2x2 coordinate system). Higher scores indicate lower maneuver perception accuracy.
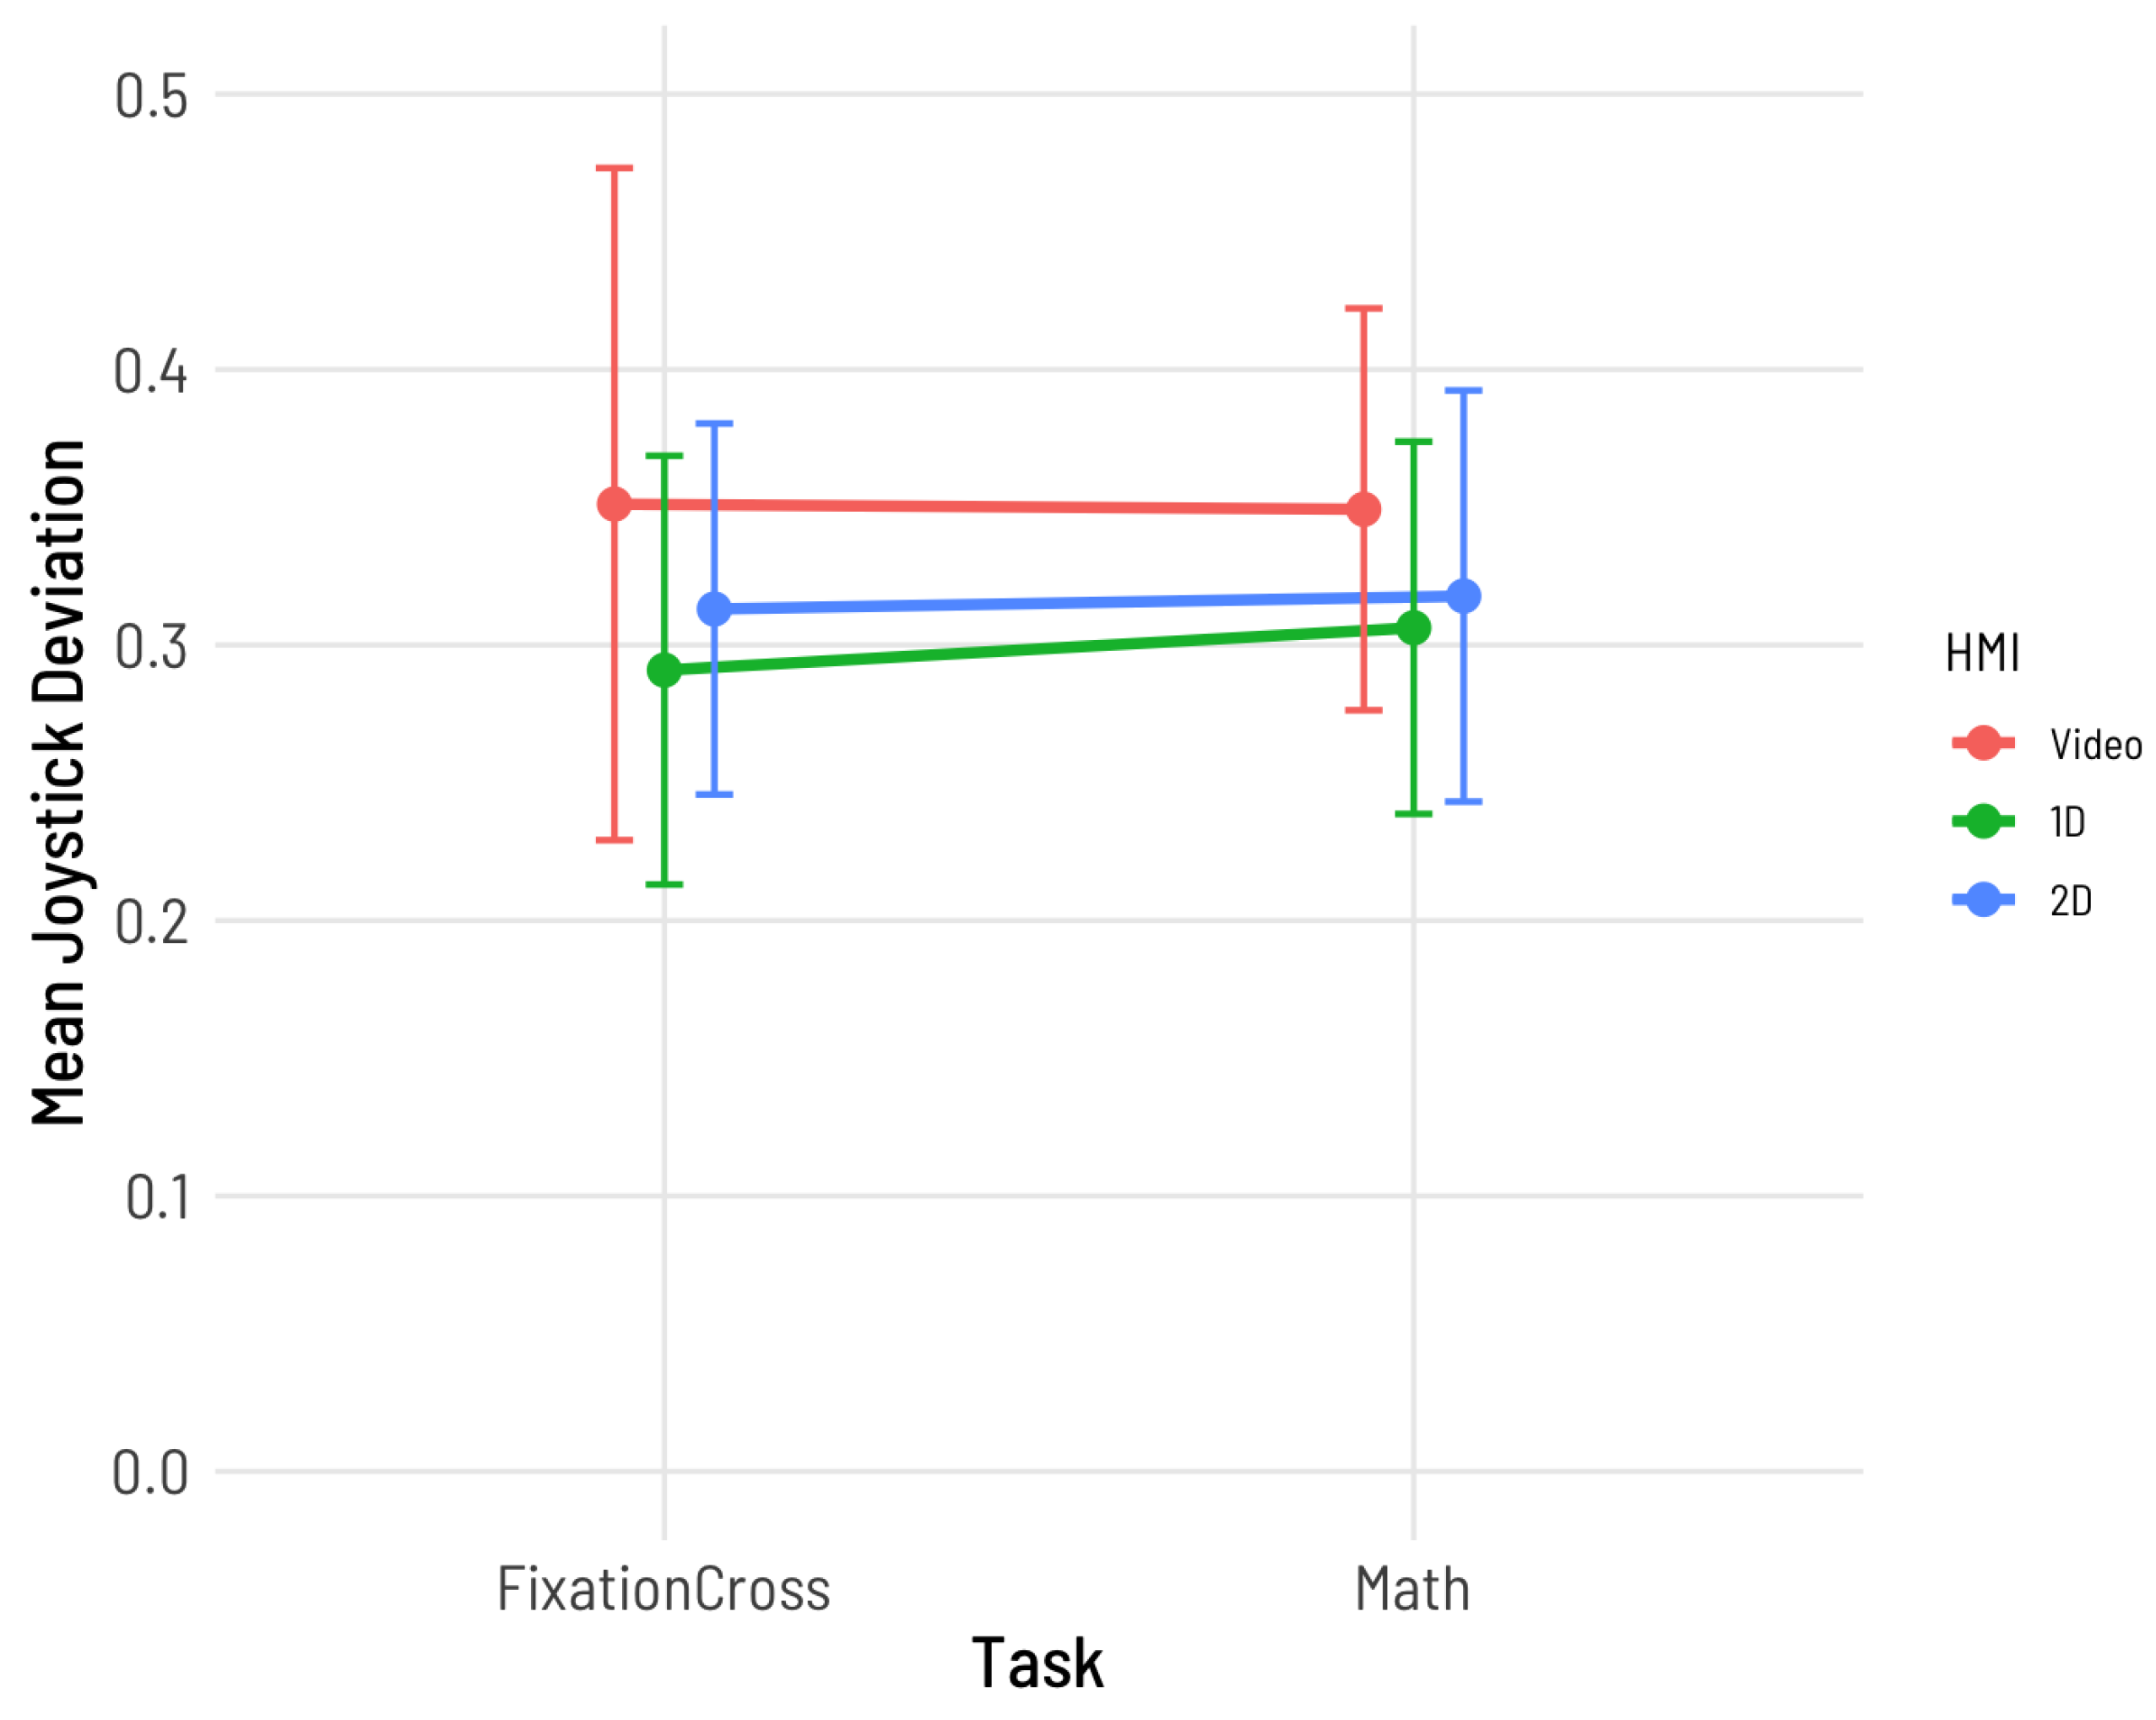
Figure 7.
Mean math scores during baseline trials and each HMI condition.
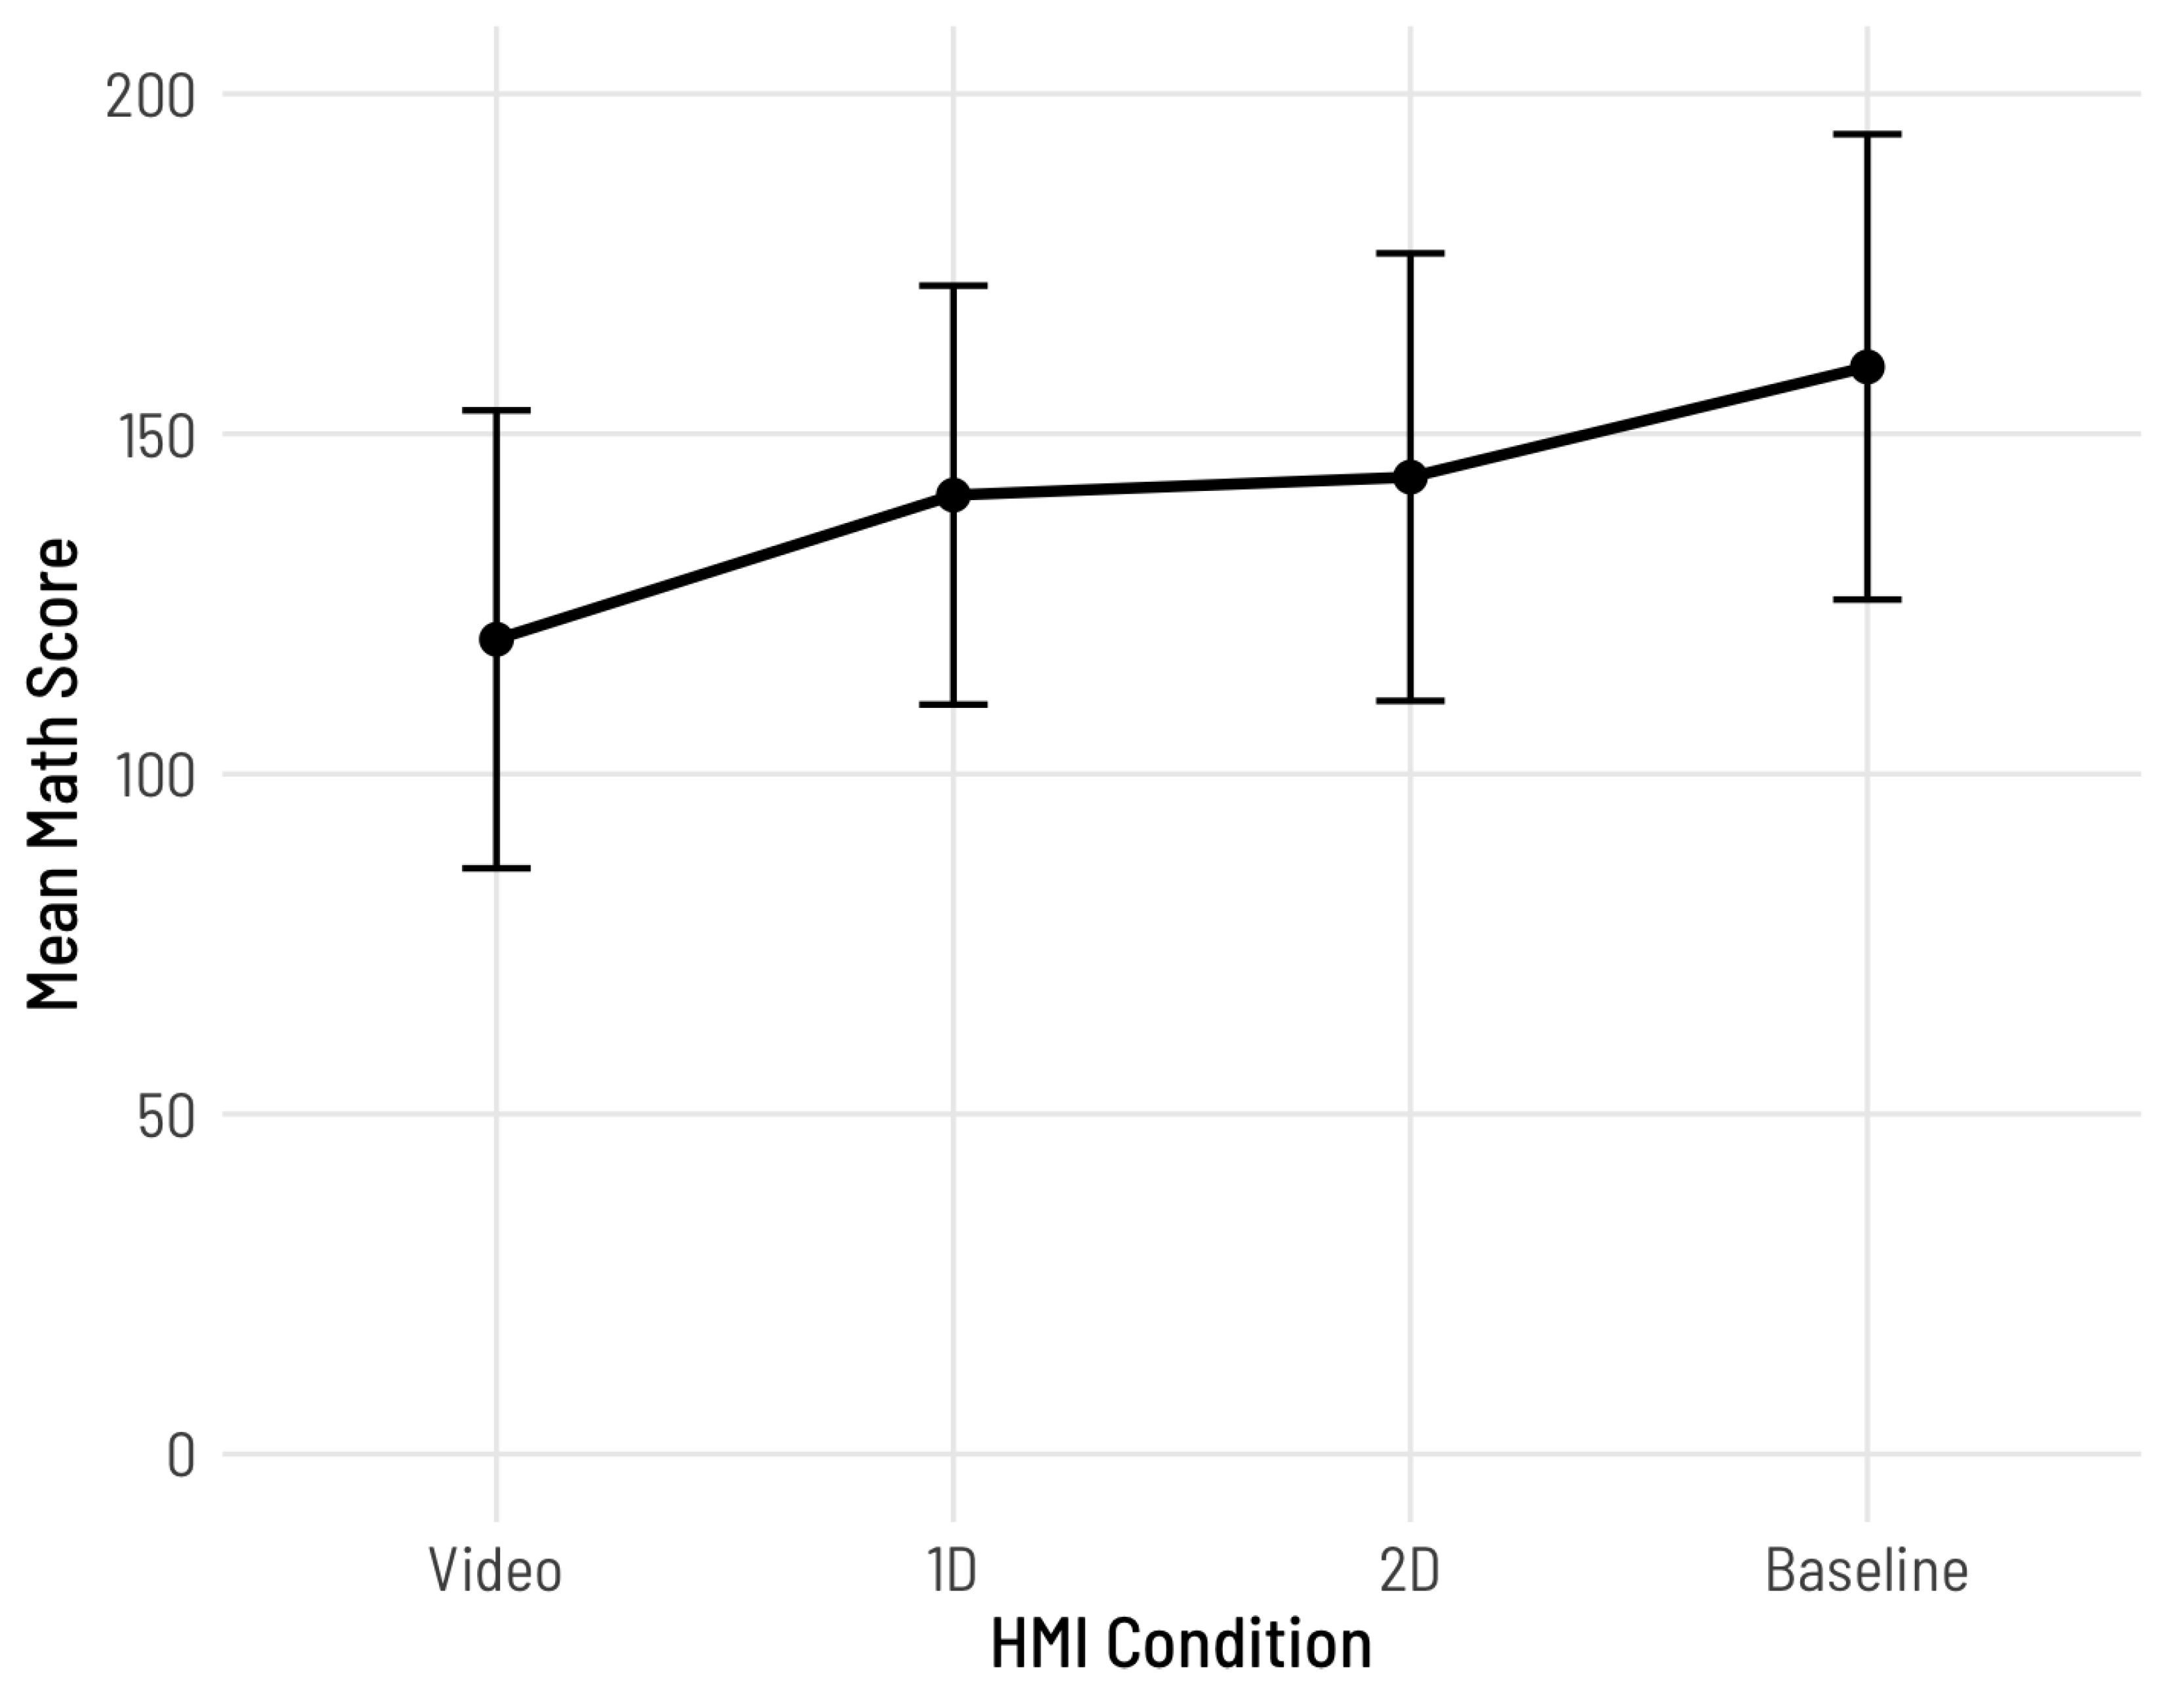
Figure 8.
Mean mental demand for each combination of HMI and task conditions as assessed by the NASA-TLX on a scale from 0 to 20.
Figure 8.
Mean mental demand for each combination of HMI and task conditions as assessed by the NASA-TLX on a scale from 0 to 20.
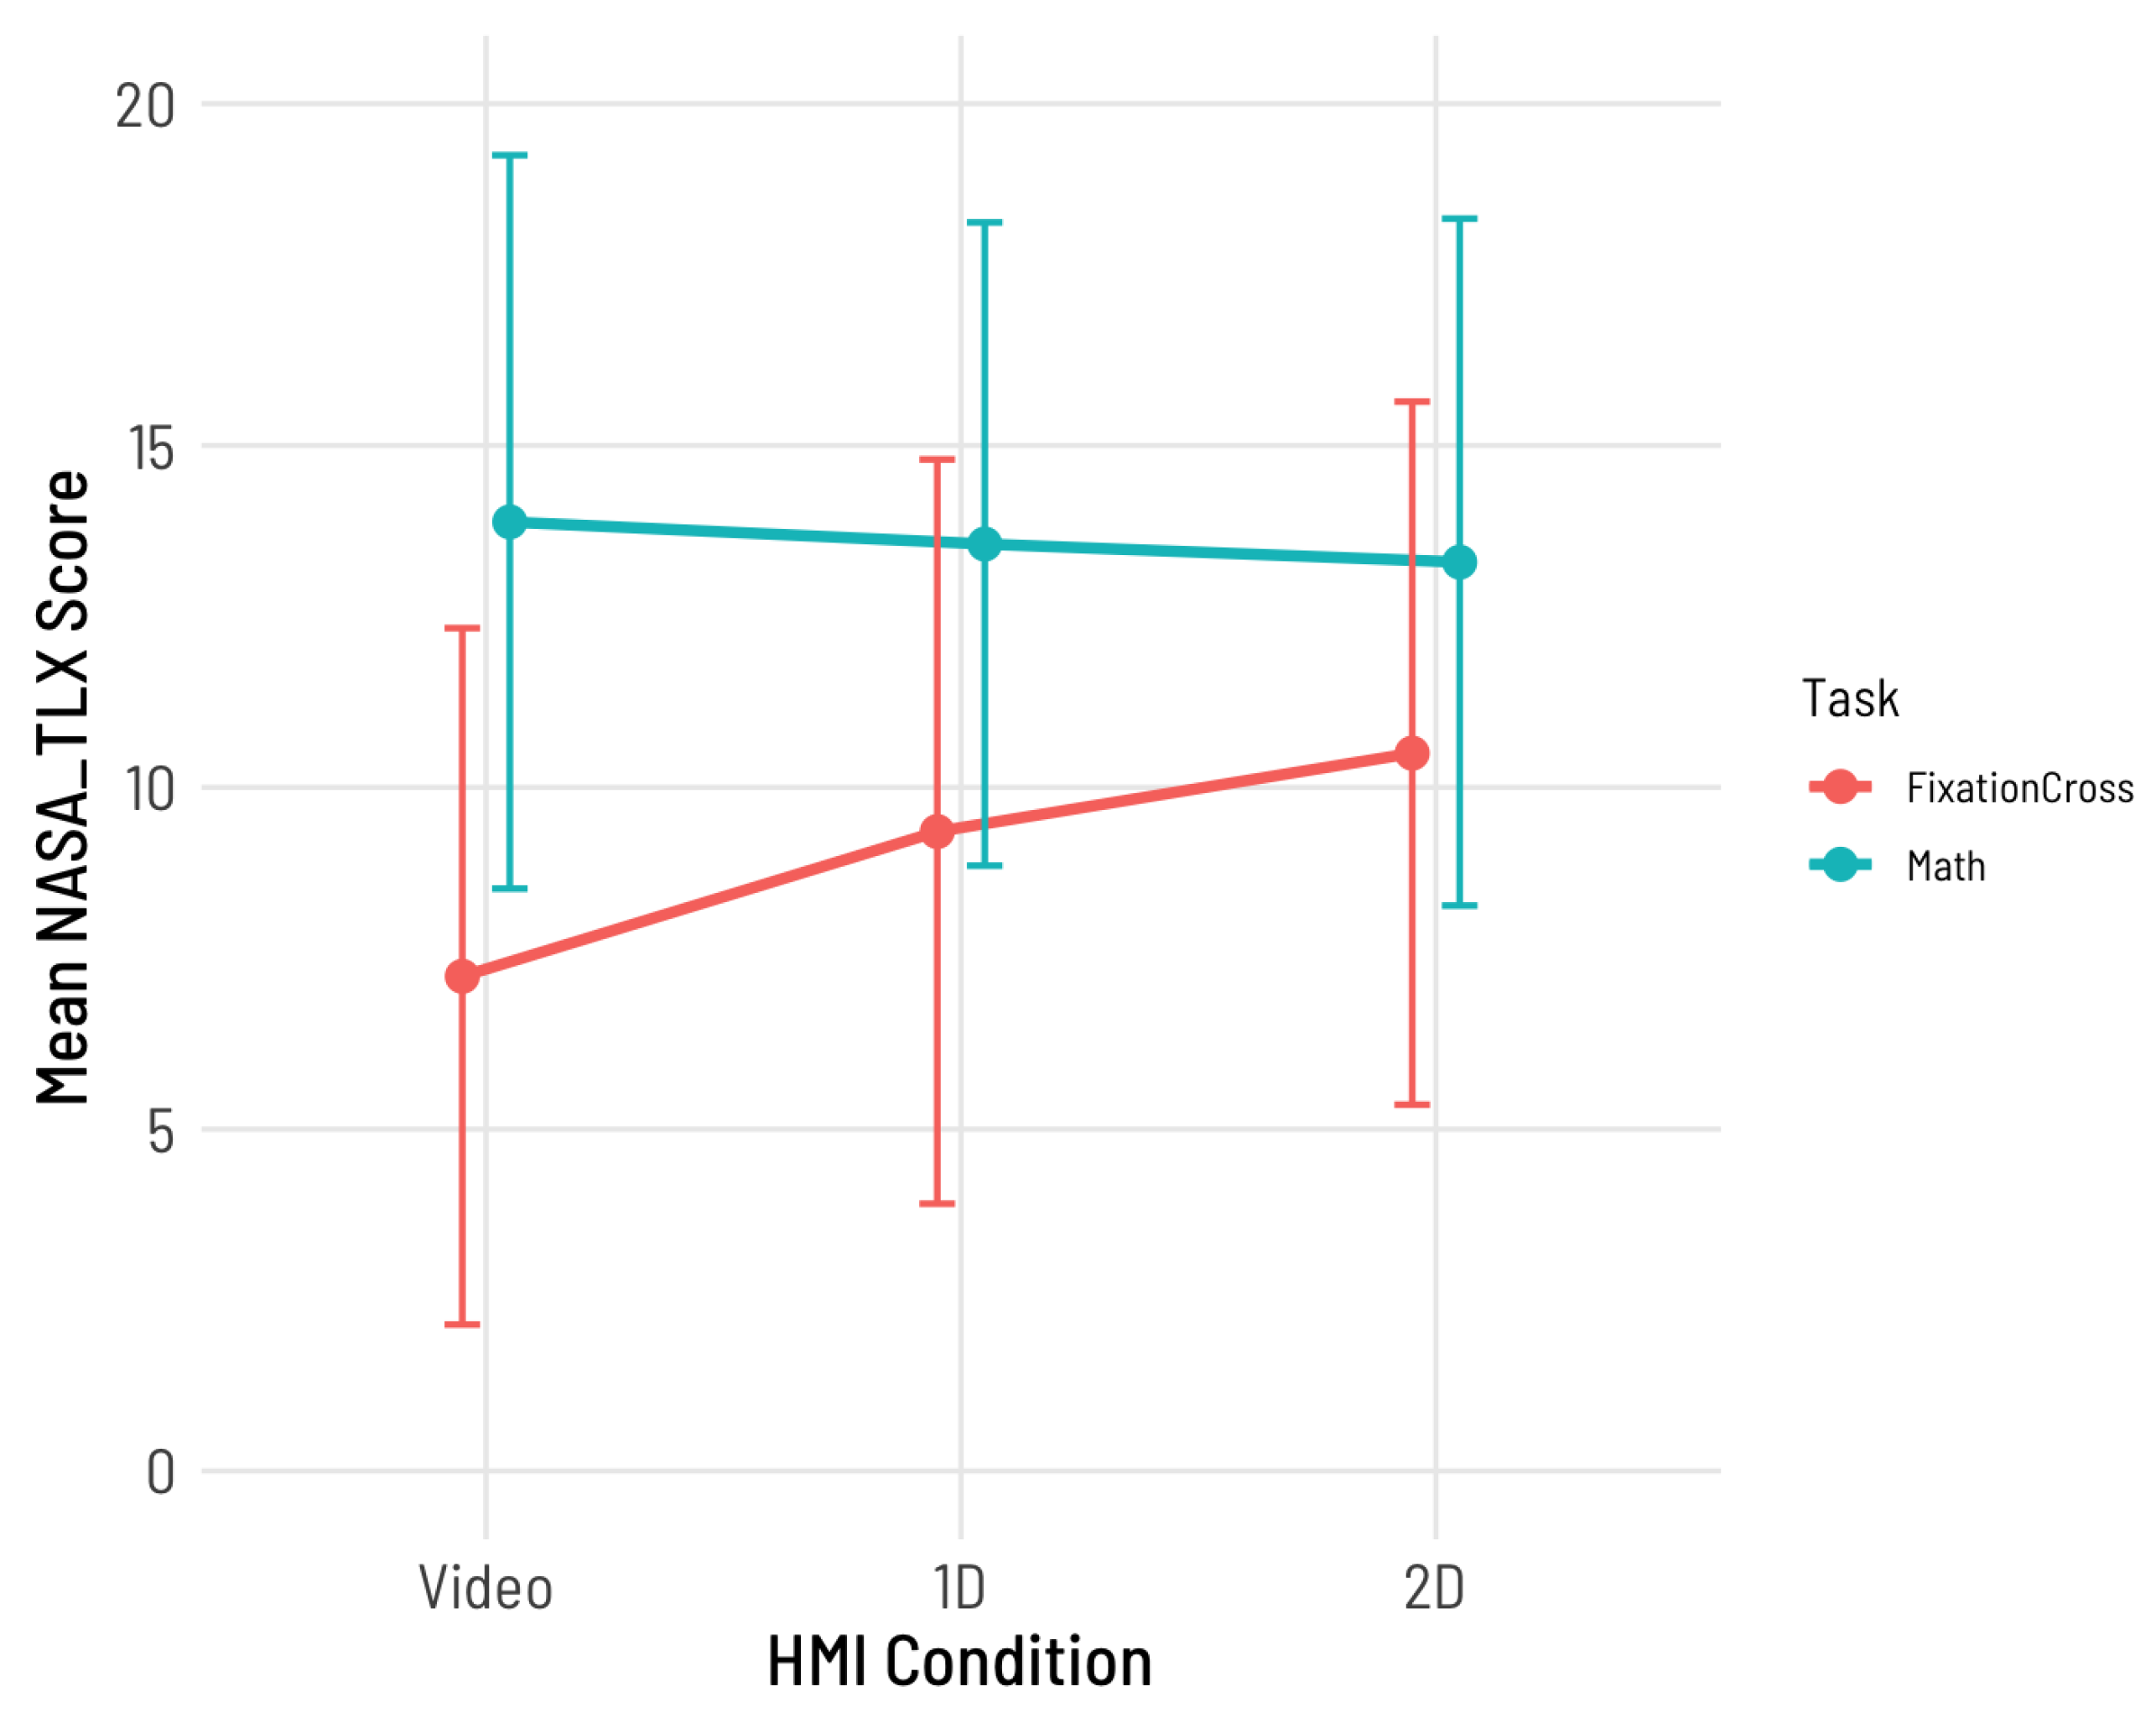
Figure 9.
Mean simulator sickness for each combination of HMI and task conditions. Due to the calculation of total SSQ scores, the maximum possible score is 235.62. For visibility reasons, the scale is only depicted from zero to 80.
Figure 9.
Mean simulator sickness for each combination of HMI and task conditions. Due to the calculation of total SSQ scores, the maximum possible score is 235.62. For visibility reasons, the scale is only depicted from zero to 80.
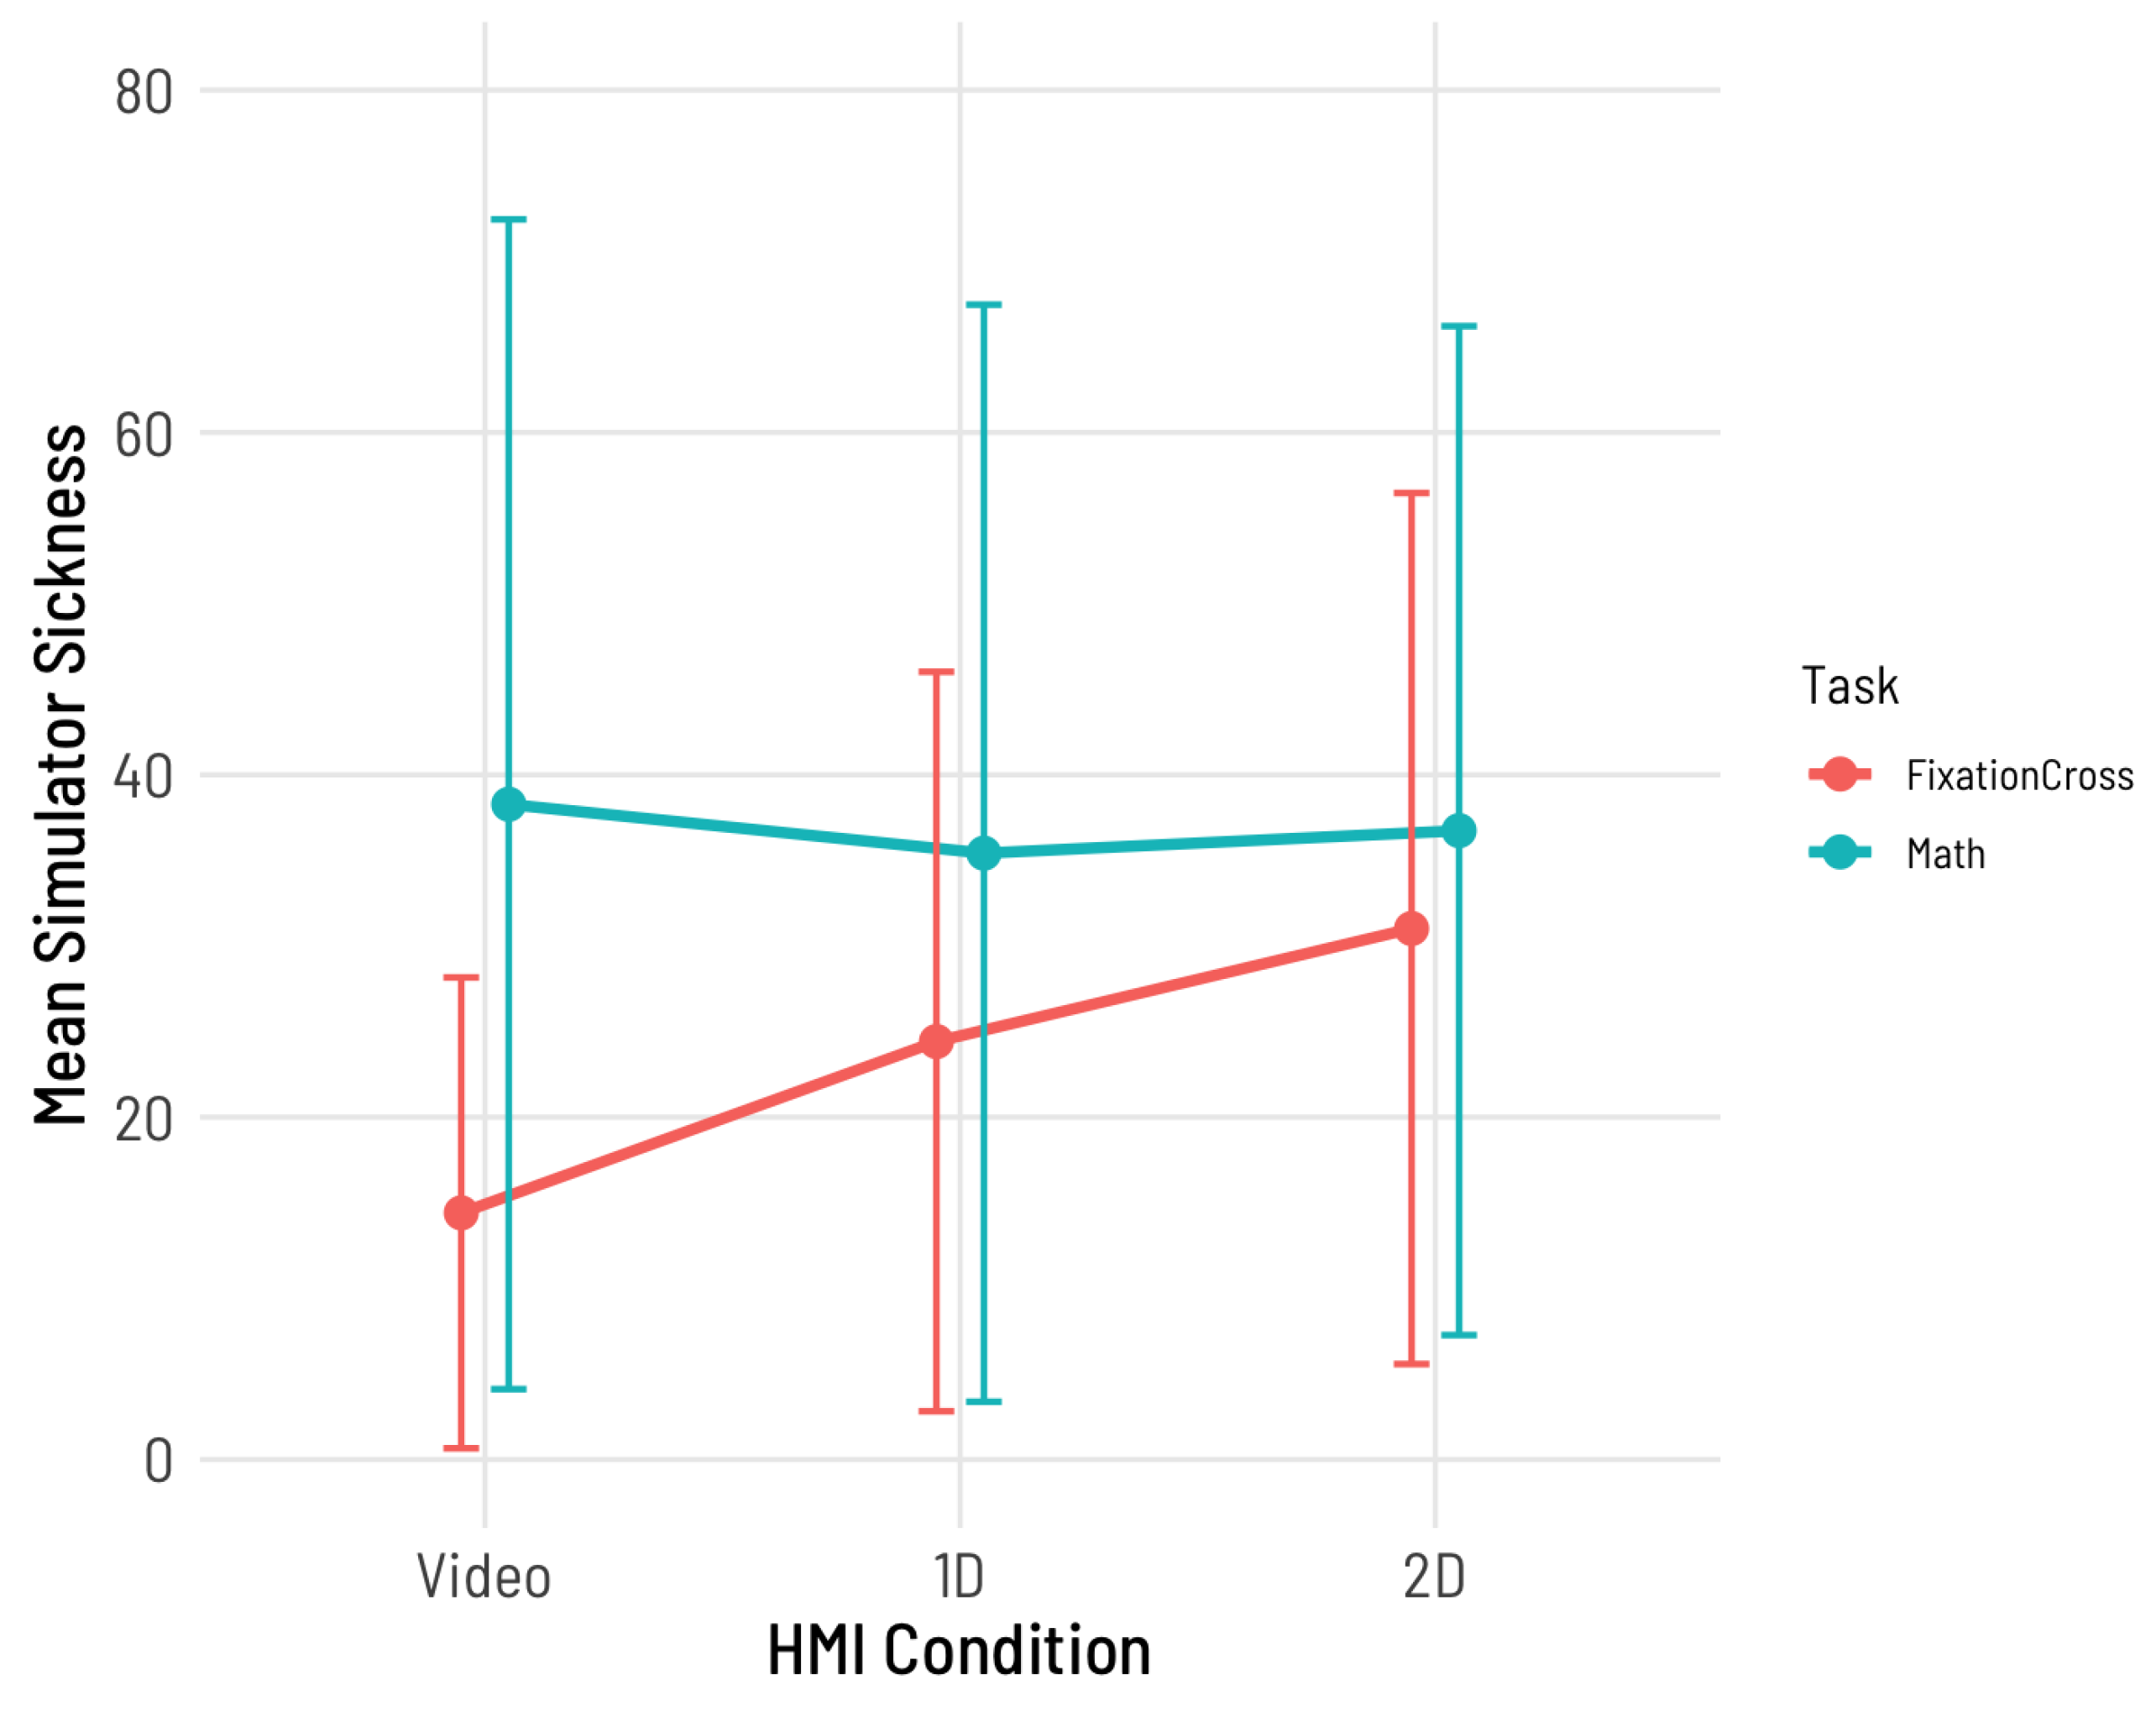
Figure 10.
Mean proportions of fixation time on tablets, which correspond to mean proportions of time in which the HMIs were perceived peripherally.
Figure 10.
Mean proportions of fixation time on tablets, which correspond to mean proportions of time in which the HMIs were perceived peripherally.
Disclaimer/Publisher’s Note: The statements, opinions and data contained in all publications are solely those of the individual author(s) and contributor(s) and not of MDPI and/or the editor(s). MDPI and/or the editor(s) disclaim responsibility for any injury to people or property resulting from any ideas, methods, instructions or products referred to in the content. |
© 2025 by the authors. Licensee MDPI, Basel, Switzerland. This article is an open access article distributed under the terms and conditions of the Creative Commons Attribution (CC BY) license (http://creativecommons.org/licenses/by/4.0/).
Copyright: This open access article is published under a Creative Commons CC BY 4.0 license, which permit the free download, distribution, and reuse, provided that the author and preprint are cited in any reuse.


