Preprint
Article

This version is not peer-reviewed.

From Tumor Pathways to Blood Signature: A Machine Learning-Validated 5-miRNA Signature for the Early Detection of Gastric Cancer

  † These authors contributed equally to this work and share first authorship.

  ‡ These authors also contributed equally to this work.

Submitted:

14 October 2025

Posted:

15 October 2025

You are already at the latest version

Abstract

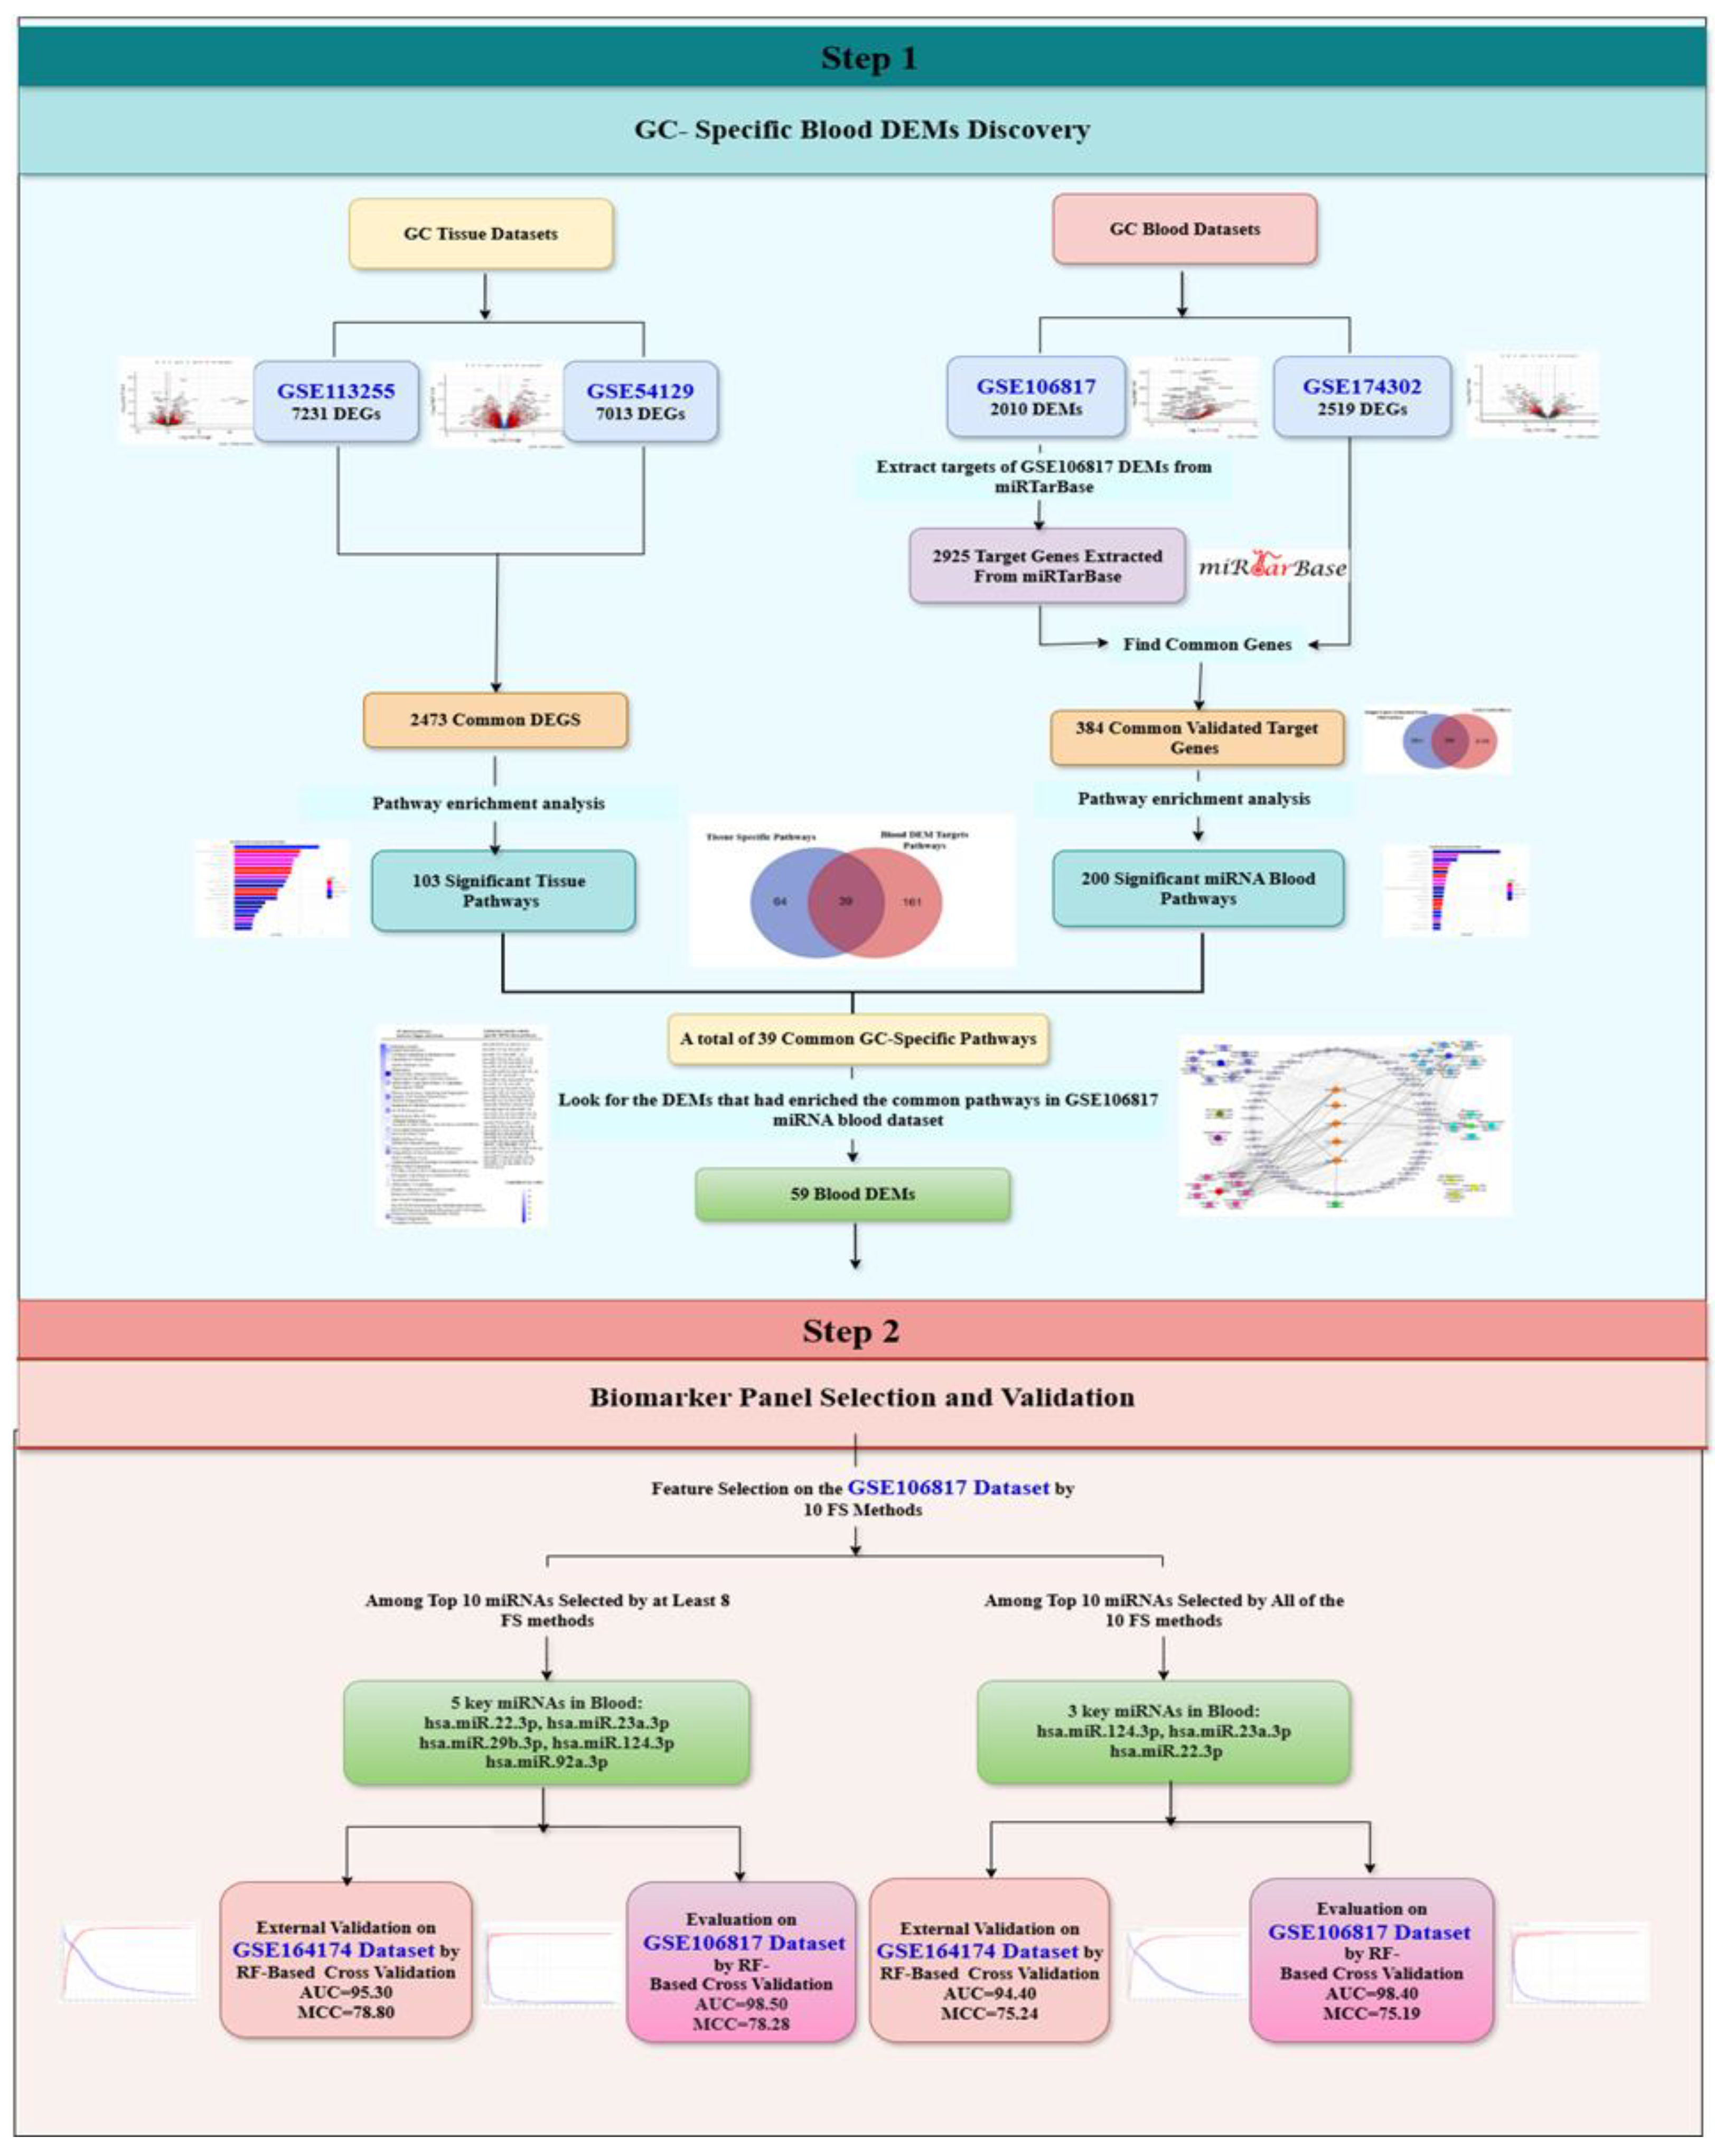
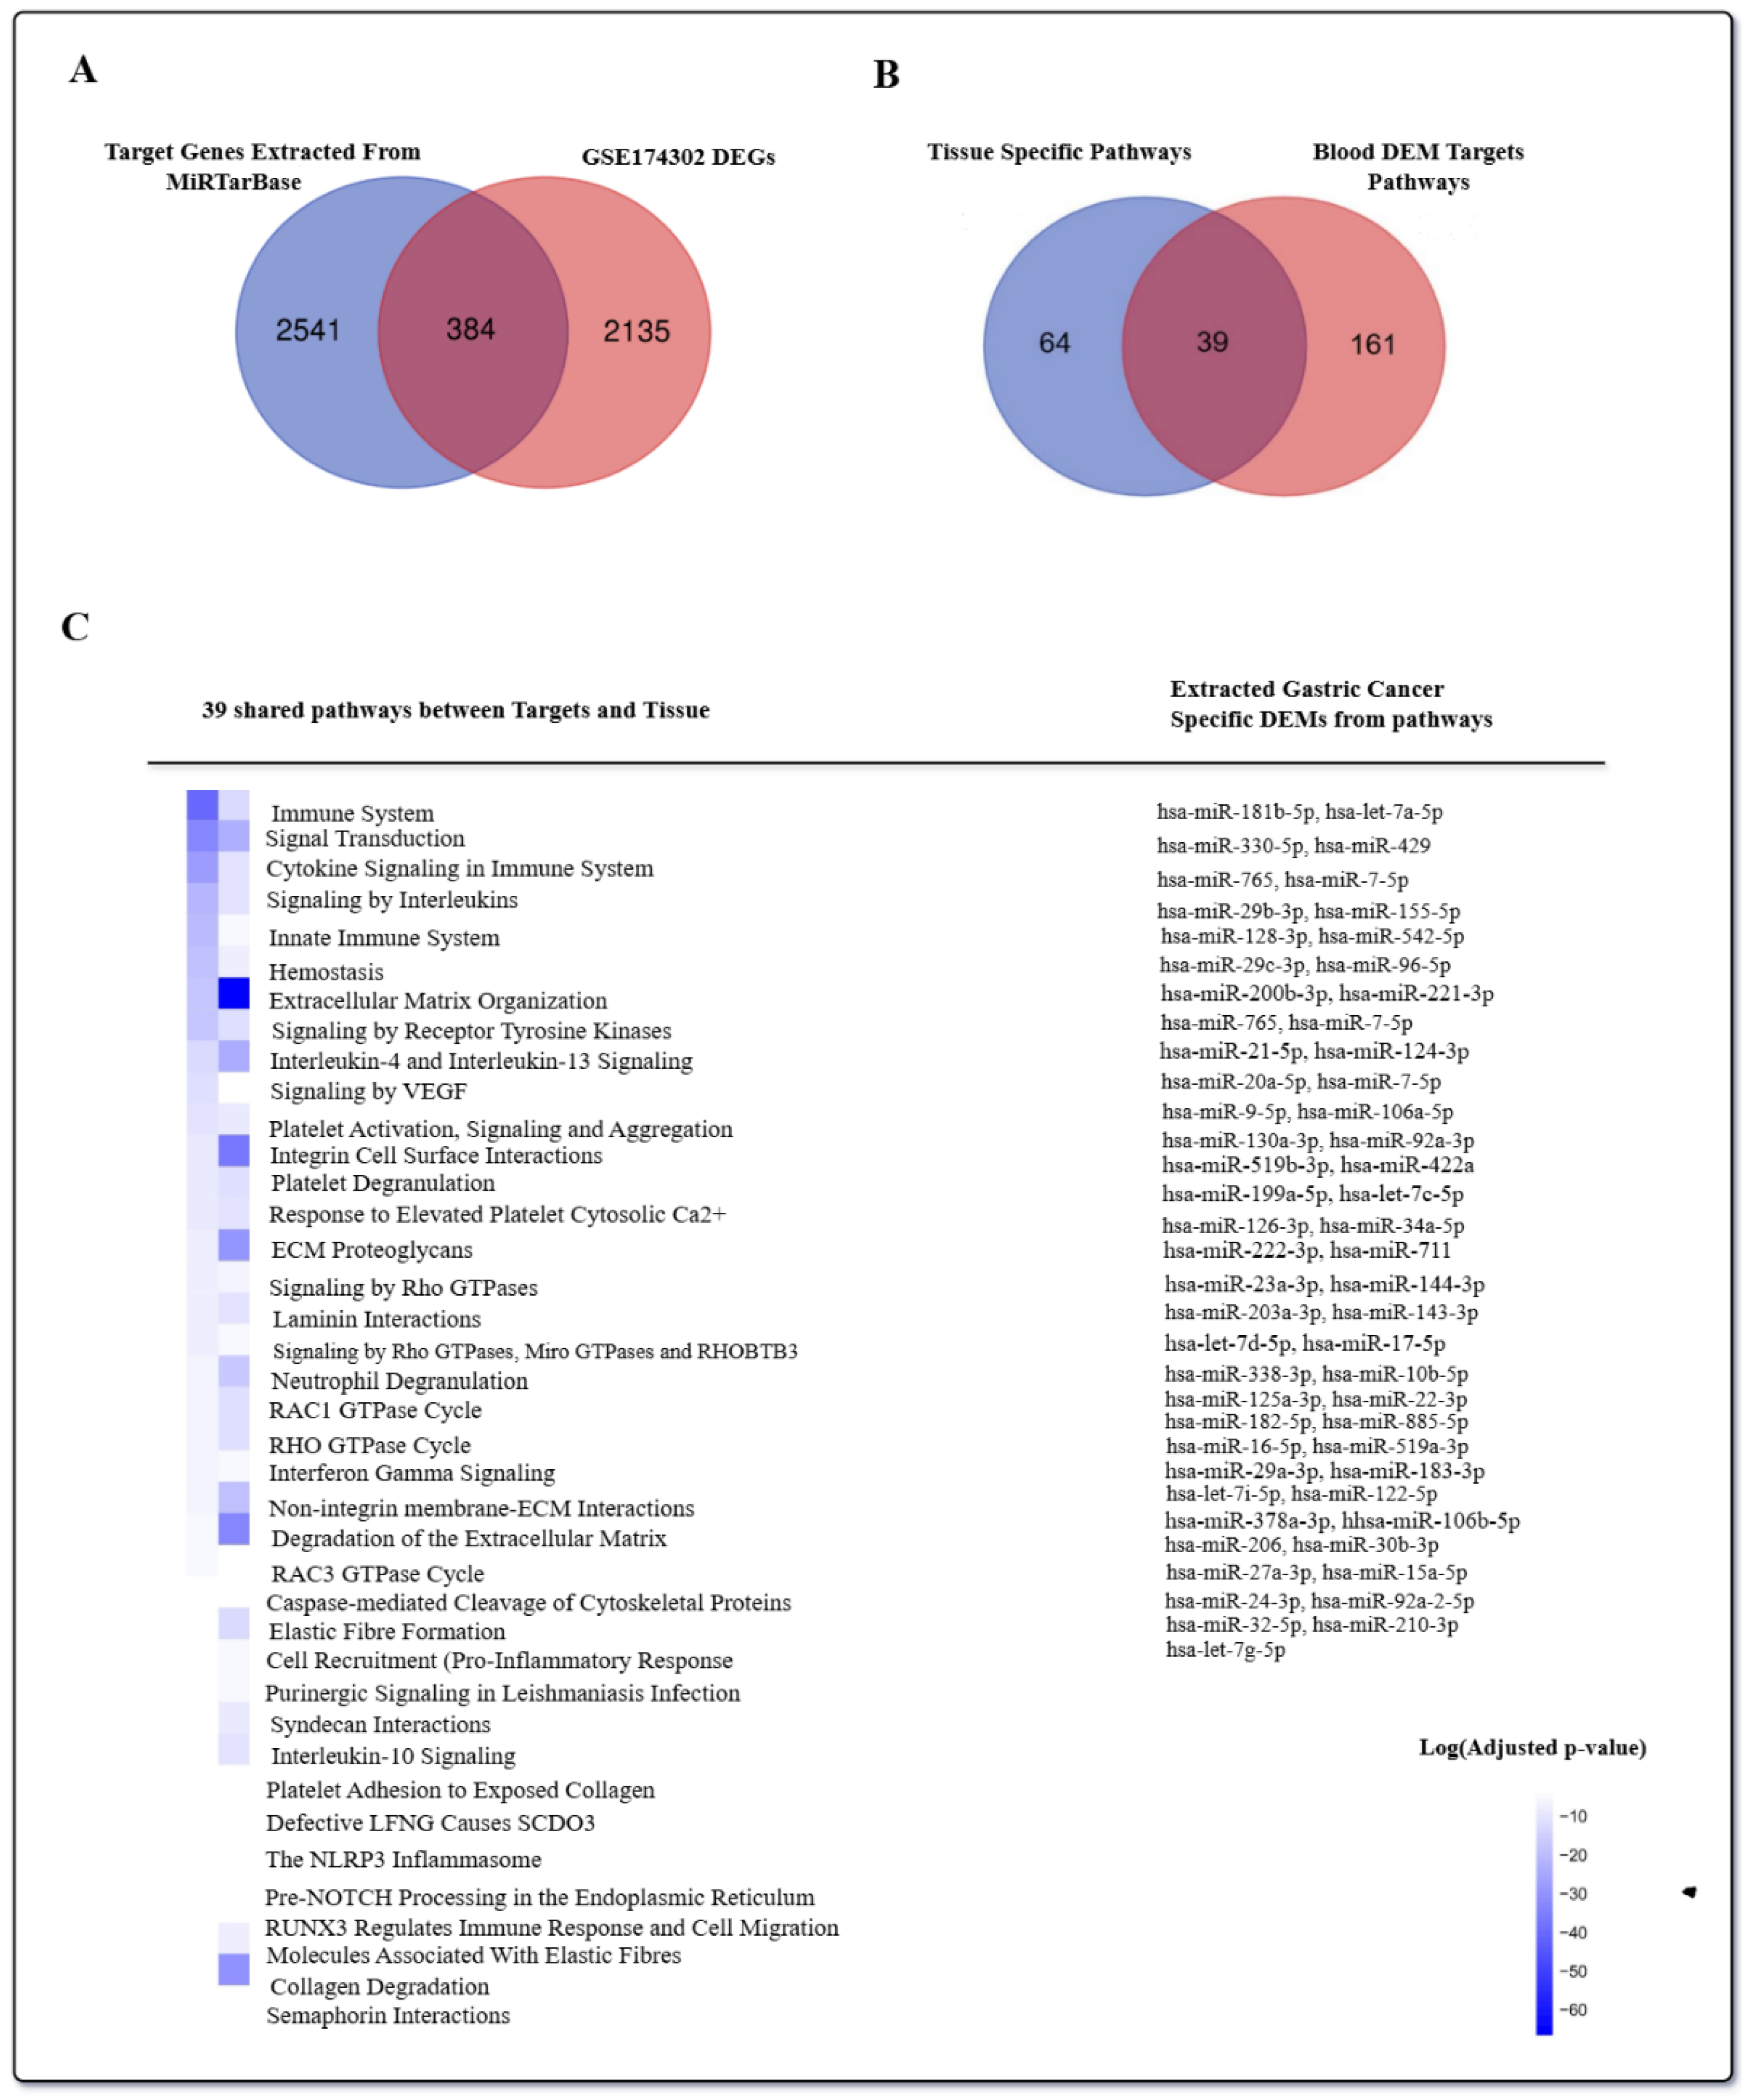
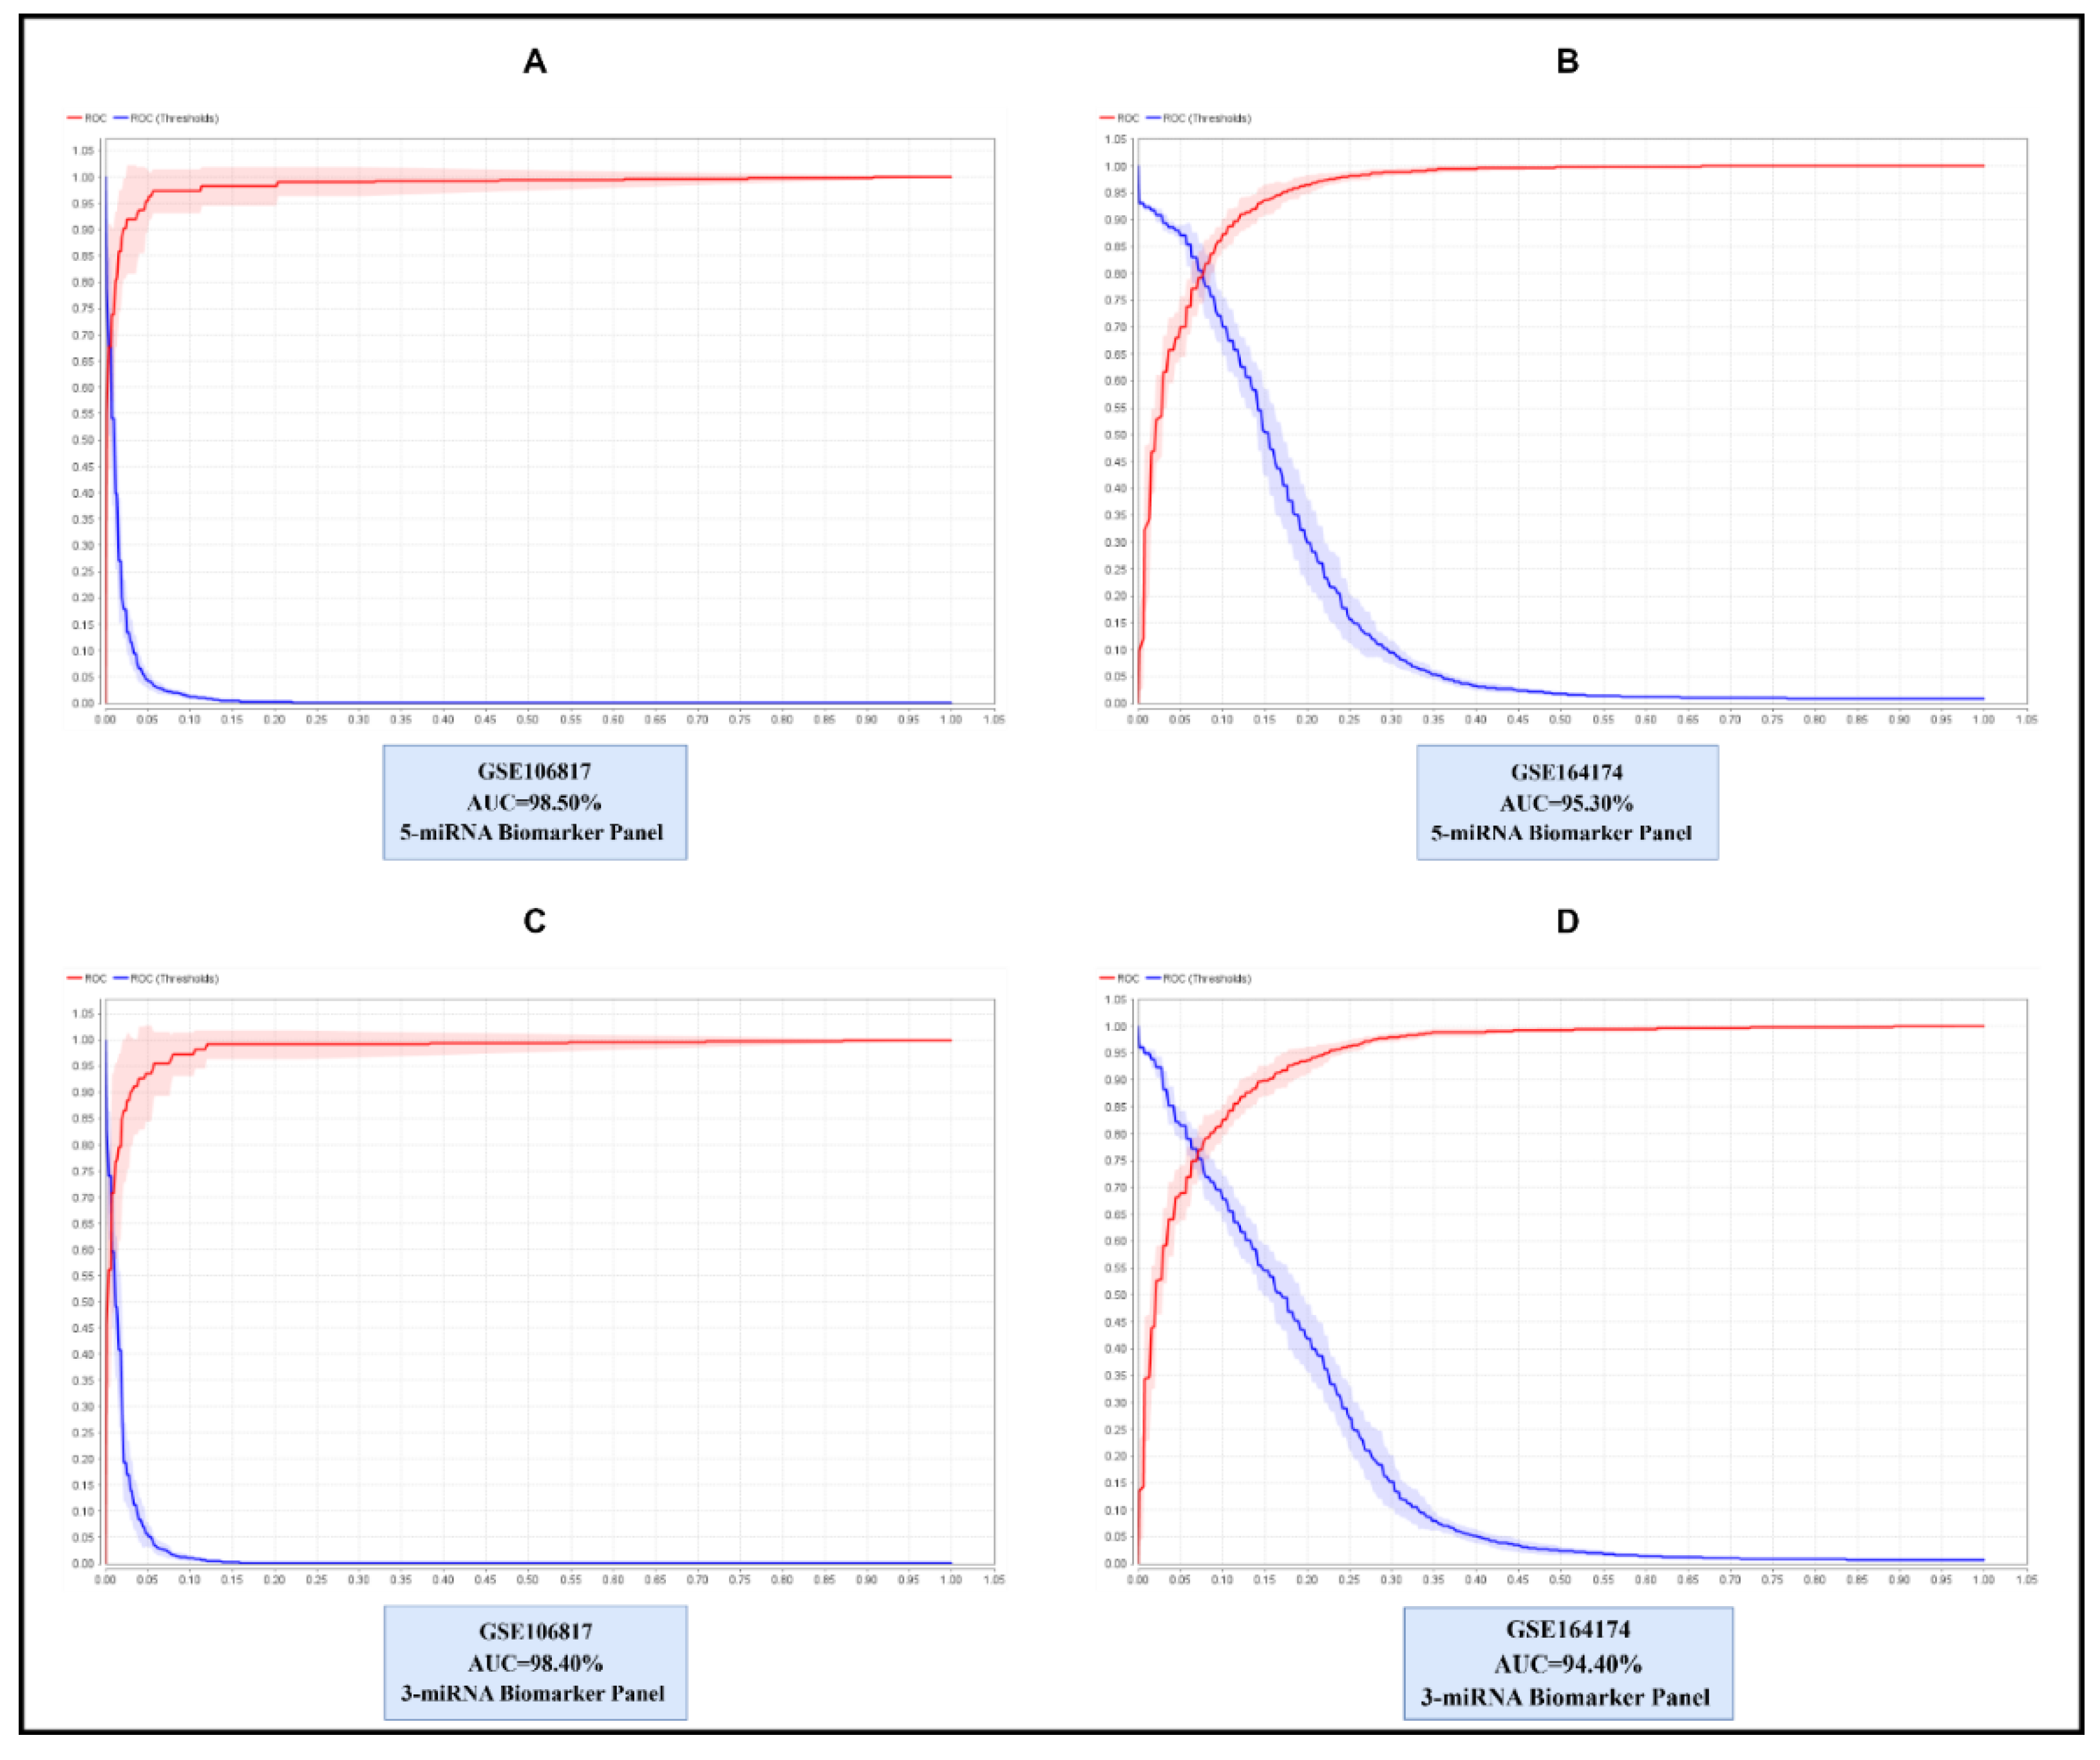
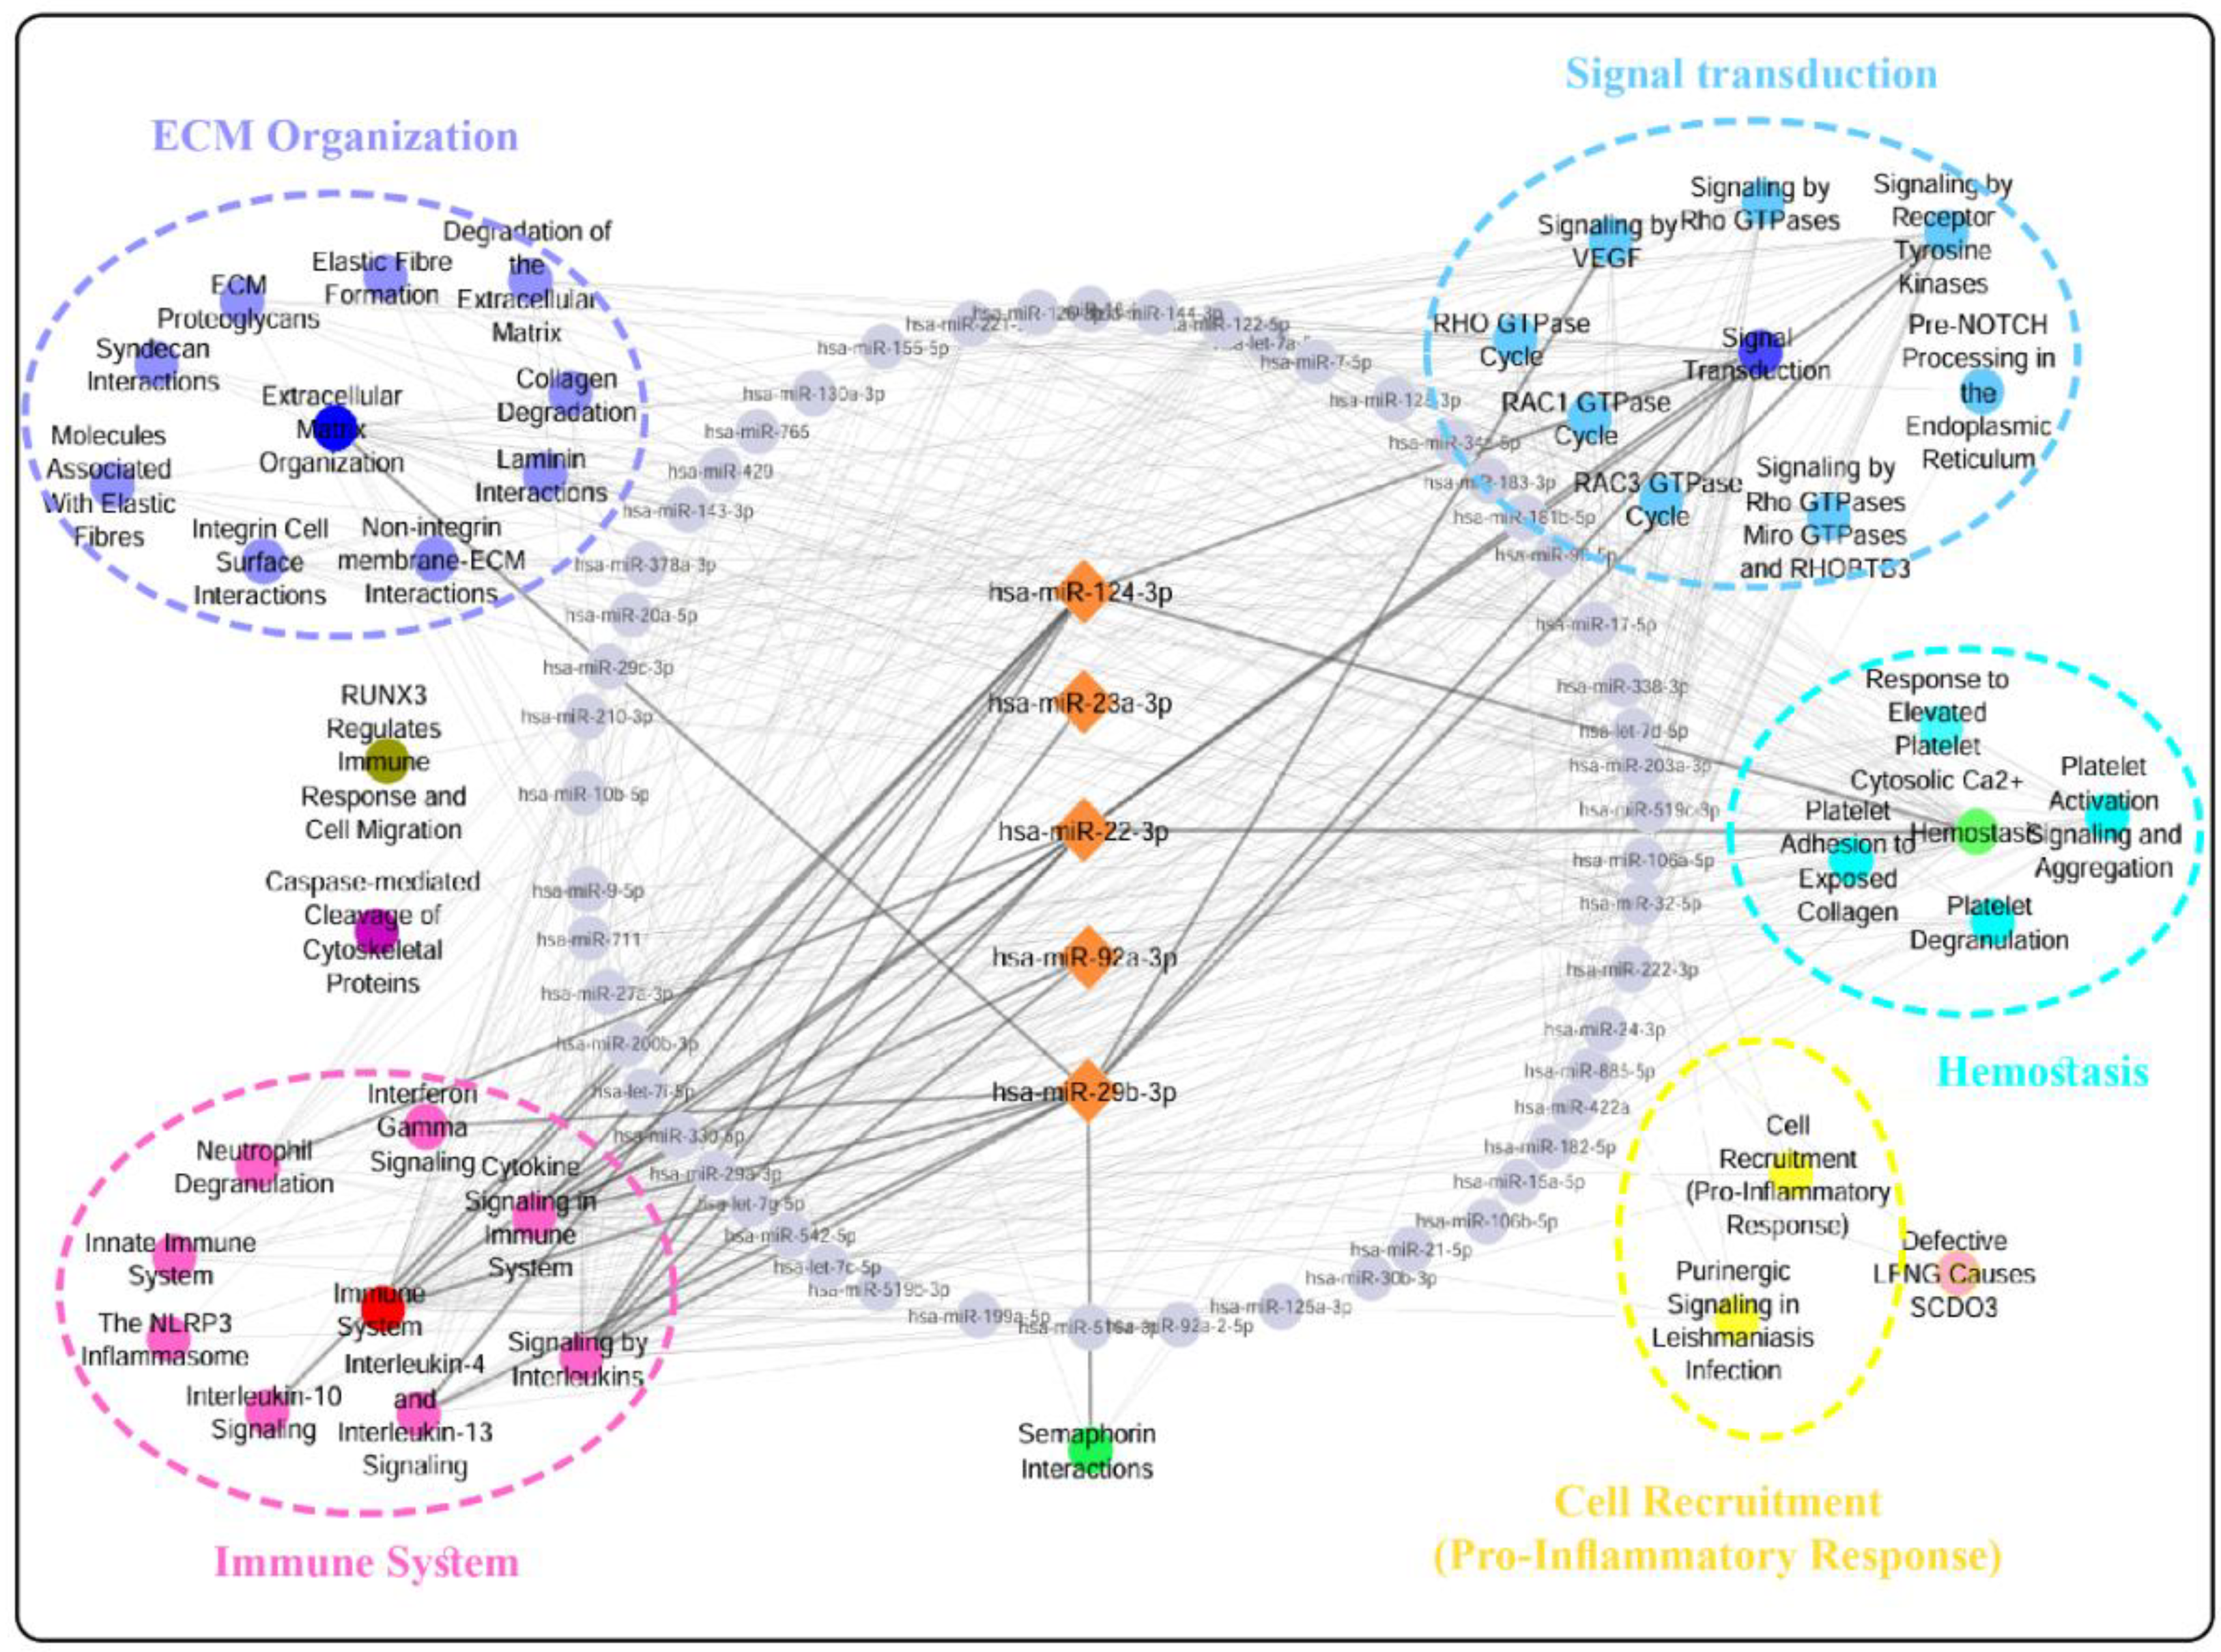
Background: Gastric cancer (GC) remains a leading cause of global cancer mortality, with late-stage diagnosis contributing significantly to poor patient outcomes. Circulating microRNAs (miRNAs) offer promise due to their stability in biofluids and established roles in carcinogenesis. However, existing miRNA biomarker candidates for GC suffer from inconsistent validation across studies, limited specificity, and insufficient mechanistic links to gastric tumor biology. We addressed this by integrating tissue and blood transcriptomics to identify GC-specific miRNAs, which were then validated using machine learning. Methods: Dysregulated genes (DEGs) and miRNAs (DEMs) were identified from tissue mRNA (GSE54129, GSE113255) and blood miRNA/mRNA datasets (GSE106817, GSE174302). Pathway enrichment (Reactome) revealed GC-specific pathways shared between tissue DEGs and blood DEM targets. Targets of 59 DEMs were enriched in these pathways in the blood miRNA dataset. From these, a 5-miRNA panel was selected using 10 machine learning feature selection methods (e.g., Gini Index, Information Gain) and validated using Random Forest and Naïve Bayes classifiers on discovery (GSE106817) and external (GSE164174) datasets. Results: Integration identified 59 GC-specific extracellular miRNAs linked to 39 enriched pathways (e.g., signaling, metabolism). The 5-miRNA panel (hsa-miR-124-3p, hsa-miR-23a-3p, hsa-miR-22-3p, hsa-miR-29b-3p, hsa-miR-92a-3p) achieved near-perfect discovery performance (RF: AUC=98.50%, ACC=98.36%) and high external validation (AUC=95.30%, ACC=89.24%). Conclusion: Our pipeline bridges tissue pathology and circulating miRNA profiles, yielding a highly specific 5-miRNA Blood Signature with clinical diagnostic potential for GC.

Keywords: 
;  ;  ;  ;  ;  

1. Introduction

Gastric cancer (GC) remains a formidable global health challenge, claiming over 769,000 lives in 2020 and ranking among the top causes of cancer mortality [1]. Late diagnosis is the crux of the problem; most cases are detected at advanced stages, when treatment options dwindle and survival rates plummet [2]. Current early detection methods, like endoscopy, are accurate but invasive and costly, limiting their use in routine screening. Blood-based biomarkers, such as CEA and CA19-9, often lack the sensitivity and specificity needed for early-stage detection [3], underscoring the urgent need for better diagnostic tools.
MicroRNAs (miRNAs) are small, stable, non-coding RNAs that regulate gene expression and are gaining popularity as biomarkers due to their detectability in biofluids [4]. Panels of miRNAs have already proven successful in diagnosing complex diseases and cancers [5-8], and early evidence indicates similar potential for GC using blood or gastric juice [4]. Recently, miRNAs have become recognized as components of liquid biopsy [9]; however, ensuring that these miRNAs are specific to GC tumor development remains a challenge. We addressed this by using integrated pathway analysis, linking blood differentially expressed miRNAs (DEMs) with tumor tissue differentially expressed genes (DEGs) in GC to identify molecular markers of the disease. To do this, we hypothesized that specific blood-based miRNAs for GC could be identified by focusing on disease-specific pathways. By finding shared enriched biological pathways between circulating DEMs and tumor DEGs and extracting DEMs from these pathways, we isolated DEMs that are detectable in blood and play a key role in GC progression.
On the other hand, machine learning (ML) can play a pivotal role in our approach, enabling us to navigate the complexity of multi-omics data and pinpoint optimal biomolecule candidates [10-12]. Unlike traditional methods, ML can uncover subtle patterns in high-dimensional datasets, making it ideal for selecting biomarkers that are both accurate and biologically relevant. Recently, machine learning approaches have enabled the non-invasive, efficient, and accurate early detection of various cancers, including GC [13,14]. Feature selection is a powerful machine learning technique that identifies the optimal combination of biomarkers, facilitating the discovery of highly predictive miRNA biomarker panels in blood [15]. Therefore, we used machine learning to refine the selection of blood-based miRNAs, resulting in a biomarker panel with fewer members, which is more practical for clinical testing.
In this study, we present a novel two-step framework for discovering and validating high-specificity circulating miRNA biomarkers in GC. In Step 1, we integrated transcriptomic data from GC tissues and blood to identify DEMs. This involved identifying shared dysregulated pathways between tissue mRNA (GSE54129, GSE113255) and blood-derived miRNA target genes (GSE106817), refined via intersection with blood mRNA data (GSE174302). And finally, extracting DEMs whose targets enrich these GC-specific pathways. In Step 2, we employed a robust machine learning strategy, applying 10 distinct feature selection methods to DEMs from Step 1 to identify a consensus biomarker panel. The performance of the panel was then validated using Naïve Bayes (NB) and Random Forest (RF) classifiers on discovery (GSE106817) and independent validation (GSE164174) datasets. This approach bridges tissue-level pathology with circulating miRNA signals, ensuring biological relevance while leveraging computational rigor to derive a minimally invasive, high-performance diagnostic tool for gastric cancer. Our workflow (Figure 1) began with pathway analysis and culminated in ML-driven miRNA selection, paving the way for a robust diagnostic tool.

2. Materials and Methods

2.1. Dataset Selection

This study utilized several transcriptomic datasets from the Gene Expression Omnibus (GEO) database, including two tissue datasets: GSE54129 (111 Tumor (T), 21 Normal (N)) and GSE113255 (130T, 10N); blood mRNA dataset: GSE174302 (27T, 15N); and two blood miRNA datasets: GSE106817 (115T, 2759N) and GSE164174 (1417T, 1417N). Datasets were selected based on defined inclusion criteria—only those derived from human tumor tissue and blood samples of healthy individuals and gastric cancer patients with adequate sample size, quality, and clinical relevance were included. In contrast, datasets from cell lines or non-human sources were excluded. Table 1 summarizes the sample sizes, characteristics, and specific roles of these datasets in the study.

2.2. Step 1: GC-Specific DEMs Discovery

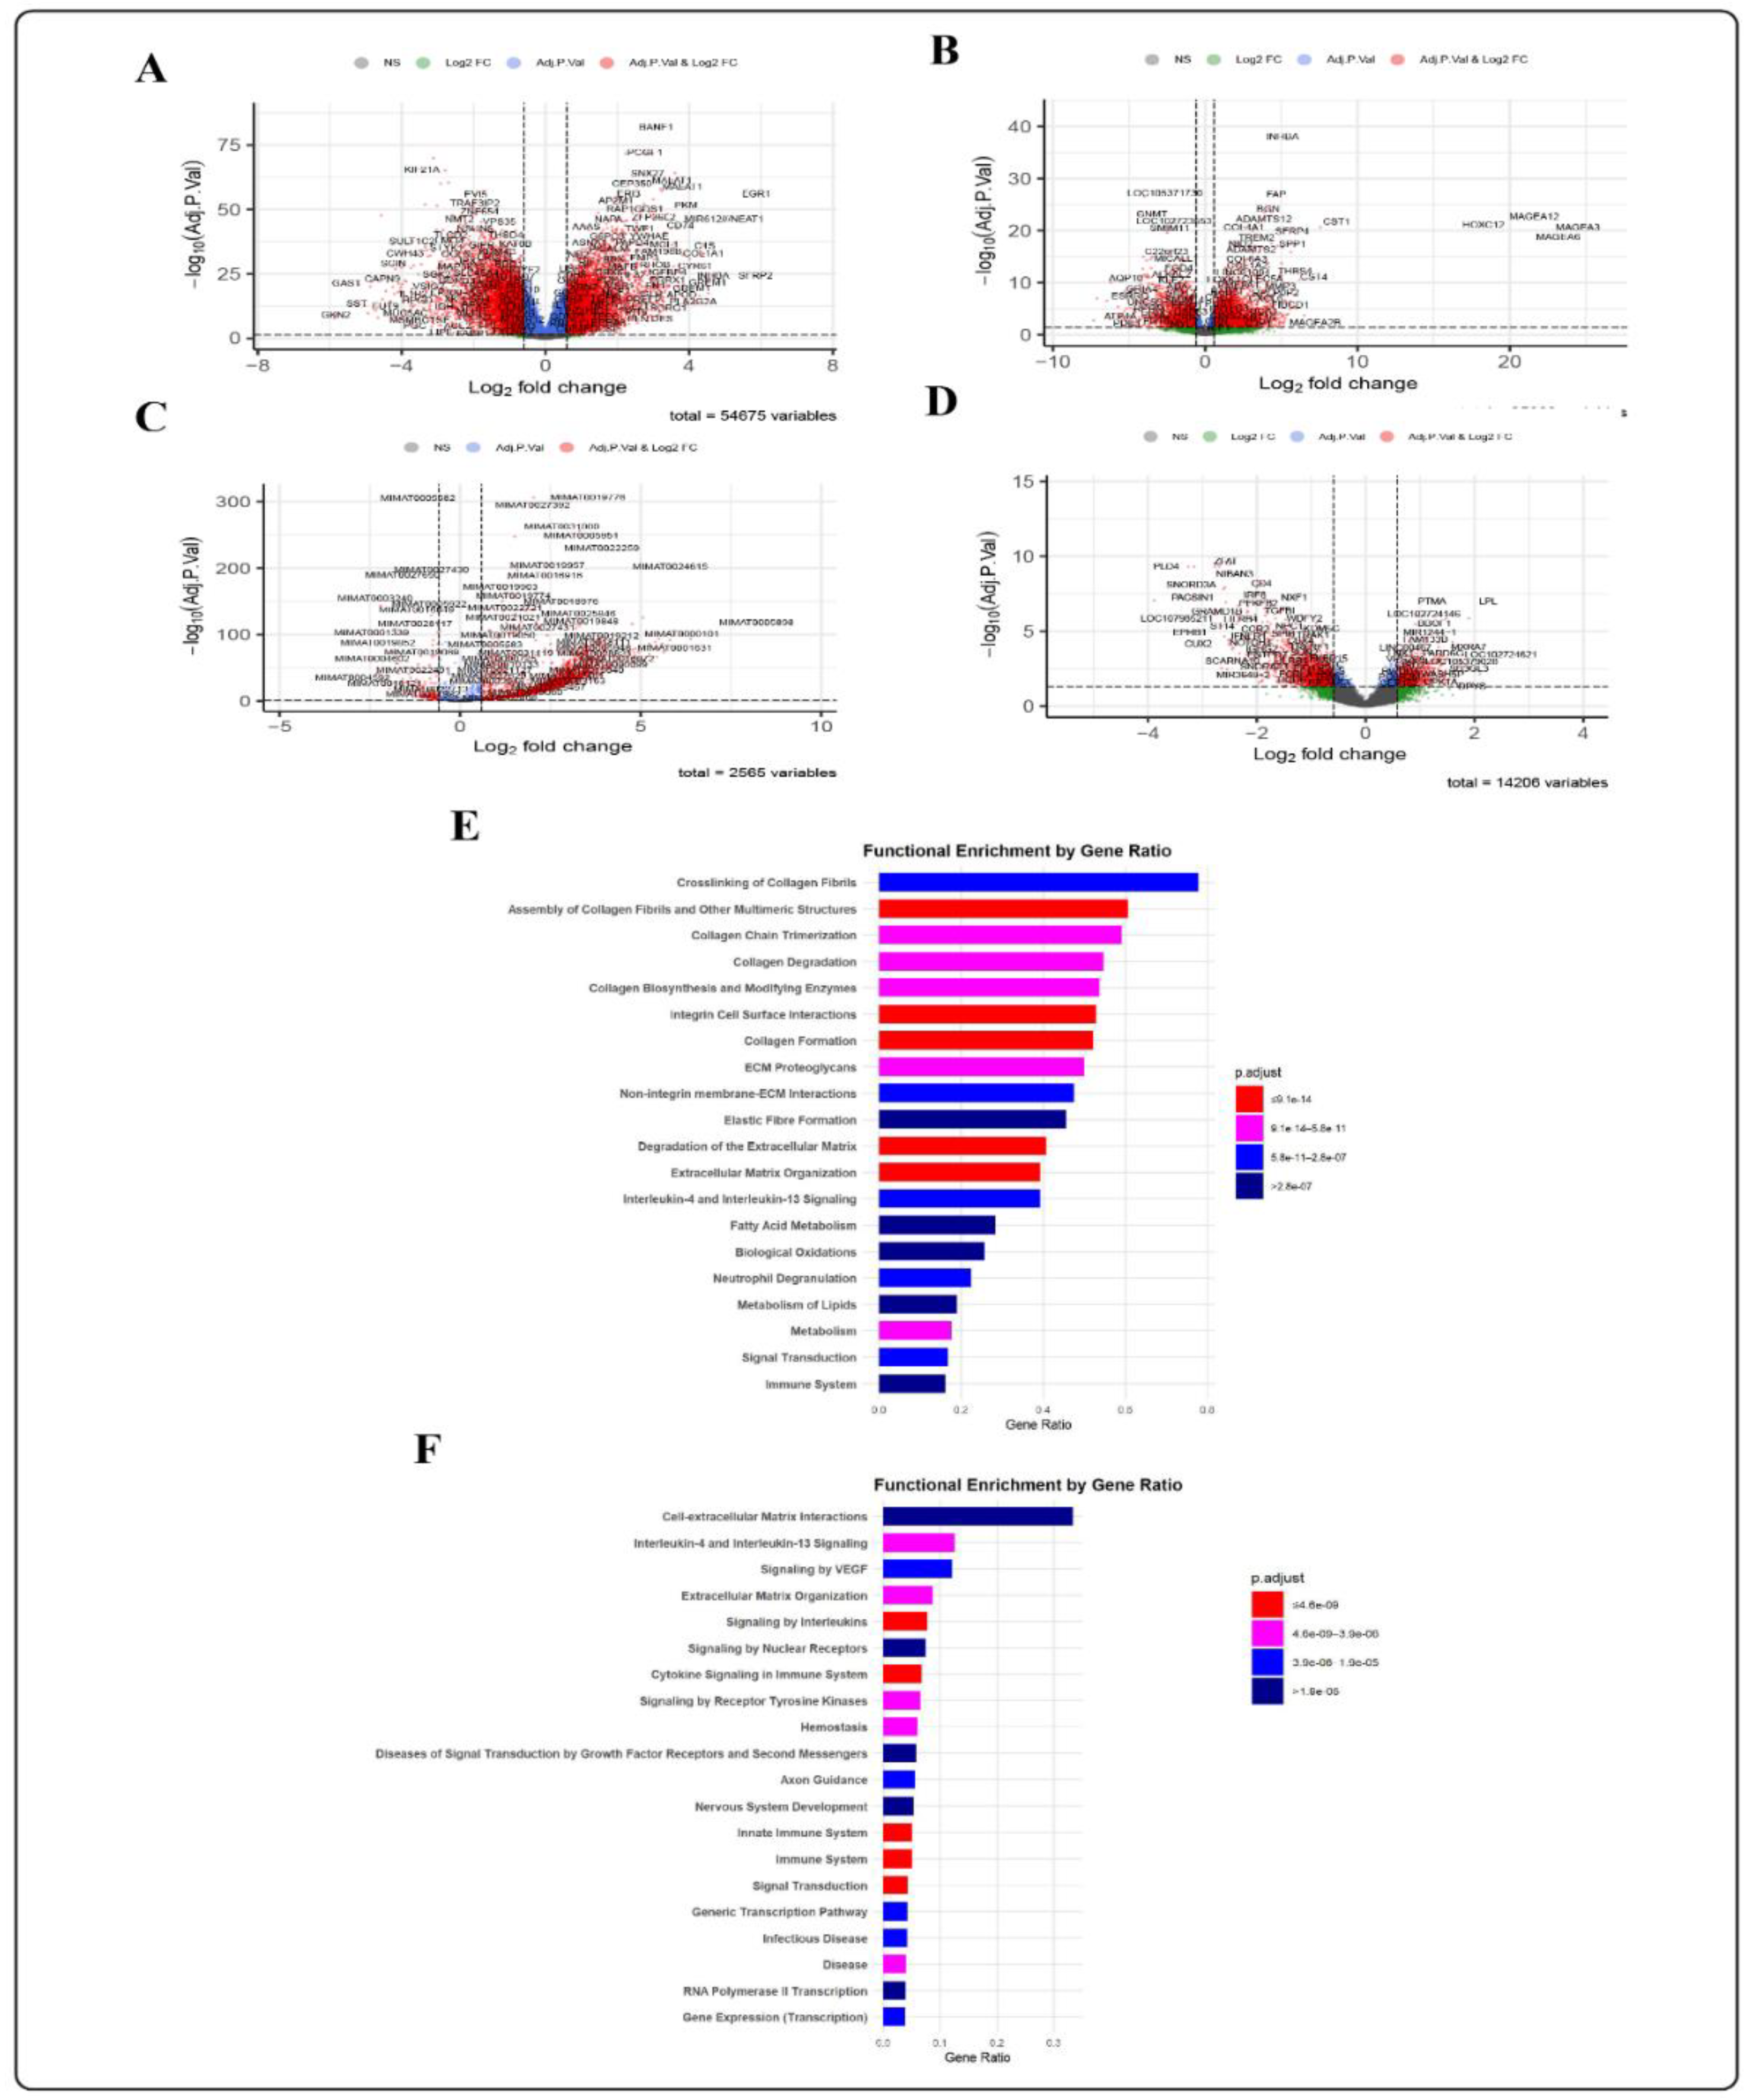
2.2.1. Differential Expression Analysis

Following standard preprocessing, DEGs between cancerous and normal samples were identified from the microarray and RNA-seq datasets using the GEO2R tool. DEGs were defined based on a threshold of |log2FC| > 0.585 (|FC| >1.5) and an adjusted p-value < 0.05 to ensure statistical significance.

2.2.2. Finding GC-Specific DEMs

We identified pathways shared between targets of circulating DEMs and tissue DEGs, and then extracted the DEMs associated with these shared, disease-specific pathways from the blood miRNA dataset.

GC Tissue Pathway Enrichment Analysis

DEGs were identified from two independent GC tissue datasets (GSE54129 and GSE113255). Overlapping DEGs between both datasets were selected to enhance reliability. Pathway enrichment analysis of these DEGs was conducted using the Reactome database via Enrichr to identify GC-specific pathways. The Benjamini-Hochberg correction was used to control for the false discovery rate, and pathways with an adjusted p-value of less than 0.05 were considered significant.

Circulating miRNA Pathway Enrichment Analysis

DEMs from the circulating miRNA dataset (GSE106817) were mapped to their target genes using miRTarBase (2025 updated version). Only strong evidence of miRNA-target interactions from miRTarBase reports was considered. To refine GC-specific miRNA target genes and ensure their specificity to GC, we identified their intersection with GC blood-derived DEGs from the GSE174302 blood dataset. Pathway enrichment analysis was then conducted on these refined targets using the Reactome database via Enrichr. The Benjamini-Hochberg correction was applied to adjust for the false discovery rate, with pathways exhibiting an adjusted p-value of less than 0.05 deemed significant.

Identification of DEMs Associated with Shared Pathways Between Tumor Tissue and Blood

Shared pathways between tumor tissue DEGs and circulating DEMs target genes were selected. Finally, DEMs whose target genes were enriched in these shared pathways in the circulating miRNA dataset (GSE106817) were selected and used for step 2.

2.3. Step 2: Biomarker Panel Selection and Validation

The expression values of identified miRNAs in the previous section were extracted from the circulating miRNA dataset (GSE106817) and used as input features for machine learning analysis.

2.3.1. Feature Selection

To identify a clinically efficient biomarker panel, we applied 10 machine learning-based feature selection methods, including Weight by Gini Index, Information Gain, Information Gain Ratio, Rule, Chi-Squared Statistic, Tree Importance, Uncertainty, Deviation, Correlation, and Relief, to the GSE106817 dataset in RapidMiner. MiRNAs that consistently ranked in the top 10 across all 10 methods were chosen as the primary Biomarker Panel. We also identified a secondary panel comprising the top 10 miRNAs selected by at least 8 methods.

2.3.2. Evaluate Performance and External Validation

Predictive models were then built based on NB and RF algorithms using the selected miRNAs to evaluate the performance of the two biomarker panels on the GSE106817 and independent GSE164174 datasets.
Performance was evaluated using 10-fold cross-validation with five metrics: Accuracy (ACC), Sensitivity (SEN), Specificity (SPE), Matthews Correlation Coefficient (MCC), and Area Under the Curve (AUC). The first four metrics were calculated from the counts of true positives (TP), true negatives (TN), false positives (FP), and false negatives (FN) through specific formulas. Additionally, AUC was derived by graphing a Receiver Operating Characteristic (ROC) curve.
External validation was performed on the GSE164174 dataset by cross-validation. The following parameters were set for the two classifiers of this study:
RF: Number of trees: 100; Criterion: gain_ratio; Maximal depth: 10; Voting strategy: confidence vote; Guess subset ratio: true.
NB: Laplace correlation parameter was set to true.

3. Results

3.1. Step 1: Specific DEMs Discovery

Principal component analysis (PCA) was performed on all five datasets for quality assessment prior to differential expression analysis (Figure S1 (Online Resource 1)). In the tumor tissue datasets, GSE54129 exhibited 7,013 DEGs, while GSE113255 showed 7,231 DEGs (Tables S1–S2 (Online Resource 2); Figures 2A–B). Figure S2 (Online Resource 1) shows the heatmaps of the most significant DEGs of all the datasets of this study. A total of 2,473 common DEGs were identified for pathway enrichment analysis of the tissue datasets, resulting in 103 specific tissue pathways (Tables S3–S4 (Online Resource 2). The top 20 most significant pathways are illustrated in Figure 2E. For the circulating miRNA dataset (GSE106817), 2,010 DEMs were identified, with 2,925 target genes extracted from miRTarBase (Tables S5–S6 (Online Resource 2); Figure 2C). By intersecting these targets with the 2,519 plasma-derived DEGs from GSE174302 (Figure 2D), we identified 384 validated miRNA target genes in the blood of GC patients (Tables S7-S8 (Online Resource 2), Figure 3A). Pathway enrichment analysis of these target genes identified 200 tissue-specific pathways (Table S9 (Online Resource 2)). The 20 most significant pathways appear in Figure 2F.
Intersecting these 200 pathways with those 103 from tissue-derived DEGs resulted in 39 common pathways (Figure 3B), ultimately mapping 59 miRNAs as specific DEMs (Table S10 (Online Resource 2)). These 39 pathways, along with their corresponding DEMs, are presented in Figure 3C. These circulating DEMs were found to have strong mechanistic links to GC.

3.2. Step 2: Biomarker Panel Selection and Validation

Our selection strategy, which identified miRNAs ranked in the top 10 by at least 8 feature selection methods, yielded a biomarker panel comprising hsa-miR-124-3p, hsa-miR-23a-3p, hsa-miR-22-3p, hsa-miR-29b-3p, and hsa-miR-92a-3p. We evaluated this panel by constructing NB and RF models using the GSE106817 dataset (the same dataset employed in step 1 and feature selection). The RF classifier demonstrated superior performance (SEN: 77.39%; SPE: 99.24%; ACC: 98.36%; AUC: 98.50%; MCC: 78.28%), slightly outperforming NB.
To further validate the panel, we applied the RF algorithm with the five selected miRNAs to an independent dataset (GSE164174), which was not used in step 1 and initial feature selection. This model also achieved high performance metrics: SEN (93.79%), SPE (84.69%), ACC (89.24%), AUC (95.30%), and MCC (78.80%) (Table 2; Figure 4A–B).
Notably, three miRNAs, hsa-miR-124-3p, hsa-miR-23a-3p, and hsa-miR-22-3p, were ranked among the top 10 by all 10 feature selection methods. Predictive models built using these miRNAs were evaluated, with RF again showing the highest performance (SEN: 76.52%; SPE: 98.99%; ACC: 98.09%; MCC: 75.19%; AUC: 98.40%), marginally surpassing NB.
External validation of the 3-miRNA panel via RF on the GSE164174 dataset further confirmed robust performance (SEN: 91.88%; SPE: 83.06%; ACC: 87.47%; AUC: 94.40%; MCC: 75.24%) (Table 2; Figure 4B–C).
Performance evaluation through 10-fold cross-validation confirmed the reliability of the biomarker panel on the external validation dataset, supporting its potential as a diagnostic biomarker panel for gastric cancer.

4. Discussion

This study developed an approach to infer changes in GC tissue by analyzing overlapping biological pathways between peripheral blood and tumor tissues related to GC. The aim was to uncover novel, potentially specific blood biomarkers to facilitate earlier detection and improve treatment outcomes for GC. By integrating pathways of tissue-derived DEGs and circulating DEMs, we identified specific DEMs, ensuring the selection of functionally relevant miRNAs. A 5-miRNA blood signature was derived through machine learning-based feature selection and validated using an independent dataset. This panel includes hsa-miR-124-3p, hsa-miR-23a-3p, hsa-miR-22-3p, hsa-miR-29b-3p, and hsa-miR-92a-3p.
Our approach is grounded in the principle that blood closely interacts with all human tissues, including cancerous tissues. Studies highlight that the ability of peripheral blood cells to respond to changes in physiology, microenvironment, and systems biology could serve as a molecular gene expression profile reflecting tissue alterations, revealing significant similarities between the signaling pathways in tissue and blood, and offering potential for blood-based biomarkers to distinguish glioma grades and control samples [16]. Another study combined tissue and serum data from the GEO and TCGA databases and published literature, along with pathway enrichment analysis, to investigate the potential differential expression of miRNAs and their molecular mechanisms in GC [17]. While prior research has examined circulating miRNAs as potential GC biomarkers, few studies have integrated tissue and blood transcriptomic data [12]. Our approach enhances biomarker specificity by ensuring mechanistic relevance to GC pathways.
In our study, fifty-nine DEMs were enriched in thirty-nine significant pathways, highlighting their roles in key biological processes such as extracellular matrix (ECM) organization, signal transduction, immune system regulation, hemostasis, and pro-inflammatory responses. The final 5-miRNA panel exhibited the strongest functional connections and the most comprehensive roles within these pathways (Figure 5), indicating its potential relevance to the biological process of GC.
The ECM organization has been recognized as a significantly enriched pathway in poorly cohesive gastric carcinoma [18]. Ziting Qu et al. highlighted neutrophil ECM organization as having potential prognostic relevance [19]. Additionally, in 2023, 15 hub genes associated with the ECM were identified within the GC circRNA network [20].
Mutations in signal transduction systems are crucial in GC, occurring in about 5% of cases [21]. Notably, the RAS/RAF/MAPK and PI3K/AKT/mTOR pathways are frequently dysregulated in various cancer types, including GC [22,23].
PRDX4 expression in GC promotes tumor development by involving the neutrophil degranulation signaling pathway, a subset of the immune system. It contributes to regulating tumor immunity [24]. Some studies indicate that LPCAT1 may enhance GC through the neutrophil degranulation pathway [25-27].
Systemic activation of hemostasis and thrombosis promotes cancer progression. In GC, platelet counts increase while surface P-selectin decreases, but plasma P-selectin rises, indicating platelet activation and association with metastasis [28]. Chronic overproduction of pro-inflammatory mediators further accelerates tumor growth [29].
Notably, earlier studies have indicated the role of these five biomarkers in GC pathogenesis. For example, hsa-miR-124-3p inhibits GC migration and invasion by targeting ITGB3, playing a crucial role in tumorigenesis and suppressing the carcinogenic process in GC [30, 31].
miR-23a-3p overexpression significantly inhibits proliferation and promotes apoptosis in GC cells, while its inhibition produces the opposite effects. Therefore, miR-23a-3p may be a key target for inducing apoptosis in GC cells. Additionally, miR-23a-3p is thought to suppress GC progression by upregulating CCL22 and downregulating the PI3K/Akt signaling pathway [32].
Similarly, miR-29b-3p (downregulated in GC) targets MAZ, a gene that is overexpressed in GC, to regulate autophagy [33]. In 2018, studies identified miR-29b as a tumor suppressor in GC and revealed the miR-29b/MMP2 axis, providing insights for potential GC gene therapies [34].
In a machine learning study on blood-based miRNA biomarkers in GC, miR-22-3p was identified as one of three predictive markers. As a tumor suppressor, its downregulation is significantly associated with lymph node metastasis and poorer clinical outcomes [35]. Notably, miR-22 has been consistently recognized as a key tumor suppressor in GC across multiple studies [18, 36-39].
Xu Lu et al.'s findings demonstrated that serum exosomal miR-92a-3p serves as a new tumor biomarker, enhancing diagnostic accuracy in GC [40]. The miR-92a family could be valuable biomarkers for diagnosing and predicting cancer. By potentially targeting RGS3, miR-92a demonstrated a high diagnostic value with a sensitivity of 0.93, a specificity of 0.84, and an AUC of 0.96, respectively [41].
We developed a multimodal feature selection framework combining eight filter methods (Gini index, information gain, information gain ratio, chi-squared, uncertainty, deviation, correlation, Relief) and two embedded approaches (tree importance, rule-based weights). This strategy minimizes single-method bias by evaluating features through diverse statistical and heuristic criteria, enhancing generalizability across microarray and RNA-seq data while reducing overfitting. To our knowledge, this is the first study to apply such a comprehensive feature selection framework to gastric cancer transcriptomic data for blood biomarker discovery, addressing a critical gap in identifying robust, clinically applicable biomarkers through the systematic integration of multiple feature evaluation paradigms.
Following feature selection, we built NB and RF models to assess the biomarker panel’s performance. These classifiers, popular in cancer research, offer distinct benefits. RF, an ensemble method, combines predictions from multiple decision trees. It demonstrates strong performance on large datasets, effectively handles classification tasks, detects non-linear feature interactions, manages noisy data, and is resistant to overfitting [42-47]. NB classifier simplifies the learning process by assuming feature independence, making it easy to construct, effective for large datasets, and successful in text classification, system performance management, and medical diagnosis [48,49].
Finally, given the numerous miRNAs linked to GC, relying on a single marker to accurately assess cancer status is impractical. Additionally, using a large number of miRNAs can also be too costly. A panel of 3-5 miRNAs provides a more practical and effective approach, improving sensitivity, specificity, and accuracy in GC diagnostic tests.

5. Conclusions

This study presents a novel biomarker discovery framework that integrates pathway enrichment analysis with machine learning-based feature selection. Unlike traditional differential expression analyses, our method ensures the functional relevance of the selected miRNAs. This study successfully identified a 5-miRNA Blood Signature for GC diagnosis. The successful validation of this signature in an independent dataset highlights its generalizability and potential clinical utility.

Electronic supplementary material

The following supporting information can be downloaded at the website of this paper posted on Preprints.org. The online version of this article contains supplementary material, including Figures S1-S2 and Tables S1–S10, available to authorized users (Online Resource 1 and Online Resource 2), respectively.

Author Contributions

Conceptualization, Maryam Momeni and Alieh Gholaminejad; Data curation, Sorour Hassani, Maryam Siahtiri, Sina Massahi, Shayan Jalali and Saeedeh Salehi; Formal analysis, Sorour Hassani, Maryam Momeni, Maryam Siahtiri, Sina Massahi, Shayan Jalali and Saeedeh Salehi; Investigation, Sorour Hassani; Methodology, Maryam Momeni and Alieh Gholaminejad; Supervision, Maryam Momeni and Alieh Gholaminejad; Validation, Sorour Hassani and Maryam Momeni; Visualization, Sorour Hassani, Maryam Momeni, Maryam Siahtiri, Sina Massahi and Shayan Jalali; Writing – original draft, Sorour Hassani, Maryam Momeni, Maryam Siahtiri, Sina Massahi, Shayan Jalali and Alieh Gholaminejad; Writing – review & editing, Sorour Hassani, Maryam Momeni and Alieh Gholaminejad.

Funding

This research received no external funding.

Data Availability Statement

No human data are directly involved in the present study’s analysis. The data described in this article can be freely and openly accessed at the GEO database on the following links:.GSE54129 [https://www.ncbi.nlm.nih.gov/geo/query/acc.cgi?acc=GSE54129], GSE113255 [https://www.ncbi.nlm.nih.gov/geo/query/acc.cgi?acc=GSE113255], GSE17430 [https://www.ncbi.nlm.nih.gov/geo/query/acc.cgi?acc=GSE174302], GSE106817 [https://www.ncbi.nlm.nih.gov/geo/query/acc.cgi?acc=GSE106817], GSE164174 [https://www.ncbi.nlm.nih.gov/geo/query/acc.cgi?acc=GSE164174].

Acknowledgments

The authors thank the editor and reviewers for their valuable feedback, which greatly enhanced the manuscript.

Conflicts of Interest

The authors declare no conflicts of interest in association with the present study.

Abbreviations

The following abbreviations are used in this manuscript:
GC Gastric Cancer
DEM Differentially Expressed miRNA
DEG Differentially Expressed Gene
GEO Gene Expression Omnibus
RF Random Forest
NB Naïve Bayes
AUC Area Under the Curve
ACC Accuracy
SEN Sensitivity
SPE Specificity
MCC Matthews Correlation Coefficient
ROC Receiver Operating Characteristic
PCA Principal Component Analysis
ECM Extracellular Matrix
TCGA The Cancer Genome Atlas
MAZ Myc-Associated Zinc Finger Protein
MMP2 Matrix Metallopeptidase 2
PI3K/Akt Phosphoinositide 3-Kinase/Ak strain transforming
RAS/RAF/MAPK Rat Sarcoma Viral Oncogene Homolog/Rapidly Accelerated Fibrosarcoma/Mitogen-Activated Protein Kinase
PRDX4 Peroxiredoxin 4
LPCAT1 Lysophosphatidylcholine Acyltransferase 1
RGS3 Regulator of G-protein Signaling 3

References

  1. Sung H, Ferlay J, Siegel RL, Laversanne M, Soerjomataram I, Jemal A, et al. Global cancer statistics 2020: GLOBOCAN estimates of incidence and mortality worldwide for 36 cancers in 185 countries. CA Cancer J Clin. 2021; 71: 209–49. [CrossRef]
  2. Ajani JA, D’Amico TA, Bentrem DJ, Chao J, Cooke D, Corvera C, et al. Gastric Cancer, Version 2.2022, NCCN Clinical Practice Guidelines in Oncology. J Natl Compr Canc Netw. 2022; 20:167-192.
  3. Song Z, Wu Y, Yang J, Yang D, Fang X. Progress in the treatment of advanced gastric cancer. Tumor Biol. 2017. [CrossRef]
  4. Immune checkpoint inhibitor efficacy in advanced head and neck squamous cell carcinoma. Mol Clin Oncol. 2020; 13:87.
  5. Sharifi Z, Talkhabi M, Taleahmad S. Identification of potential microRNA diagnostic panels and uncovering regulatory mechanisms in breast cancer pathogenesis. Sci Rep. 2022; 12:20135. [CrossRef]
  6. Roointan A, Gholaminejad A, Shojaie B, Hudkins KL, Gheisari Y. Candidate microRNA biomarkers in lupus nephritis: A meta-analysis of profiling studies in kidney, blood, and urine samples. Mol Diagn Ther. 2023; 27:141–58. [CrossRef]
  7. Gholaminejad A, Zare N, Dana N, Shafie D, Mani A, Javanmard SH. A meta-analysis of microRNA expression profiling studies in heart failure. Heart Fail Rev. 2021; 26:997-1021. [CrossRef]
  8. Gholaminejad A, Abdul Tehrani H, Gholami Fesharaki M. Identification of candidate microRNA biomarkers in renal fibrosis: a meta-analysis of profiling studies. Biomarkers. 2018;23(8):713–24.
  9. Ignatiadis M, Sledge GW, Jeffrey SS. Liquid biopsy enters the clinic — implementation issues and future challenges. Nat Rev Clin Oncol. 2021; 18:297–312. [CrossRef]
  10. Azari H, et al. Machine learning algorithms reveal potential miRNAs biomarkers in gastric cancer. Sci Rep. 2023. [CrossRef]
  11. Masoudi-Sobhanzadeh Y, Gholaminejad A, Gheisari Y, Roointan A. Discovering driver nodes in chronic kidney disease-related networks using Trader as a newly developed algorithm. Comput Biol Med. 2022. [CrossRef]
  12. Momeni M, Rashidifar M, Balam FH, Roointan A, Gholaminejad A. A comprehensive analysis of gene expression profiling data in COVID-19 patients for discovery of specific and differential blood biomarker signatures. Sci Rep. 2023. [CrossRef]
  13. Zhu SL, Dong J, Zhang C, Huang YB, Pan W. Pan, Application of machine learning in the diagnosis of gastric cancer based on noninvasive characteristics, PLoS One, 2020. [CrossRef]
  14. Gilani N, Arabi Belaghi R, Aftabi Y, Faramarzi E, Edgünlü T, Somi MH. Identifying potential miRNA biomarkers for gastric cancer diagnosis using machine learning variable selection approach, Front. Genet. 2022. [CrossRef]
  15. Augustine J, Jereesh AS. Blood-based gene-expression biomarkers identification for the non-invasive diagnosis of Parkinson’s disease using two-layer hybrid feature selection, Gene. 2022. [CrossRef]
  16. Ponnampalam SN, Rizan Kamaluddin N, Zakaria Z, Matheneswaran V, Ganesan D, Saffari. Hardy. A blood-based gene expression and signaling pathway analysis to differentiate between high and low grade gliomas. Oncol. Rep. 2017; 37:10 22. [CrossRef]
  17. Hu G, Lv Q, Yan J, Chen L, Du J, Zhao K, Xu W. MicroRNA-17 as a promising diagnostic biomarker of gastric cancer. FEBS Open Bio. 2018;8(9):1508-1523.
  18. Tong D, Zhang J, Wang X, Li Q, Liu L, Lu A, Guo B, Yang J, Ni L, Qin H, Zhao L, Huang C. MiR-22 suppresses gastric cancer cell proliferation, Oncogenesis. 2020;9(1):99.
  19. Yen HH, Chen PY, Huang RYJ, Jeng JM, Lai IR. Lai, Clinicopathological features and cancer transcriptomic profiling of gastric carcinoma. J. Pathol Clin Res. 2024. [CrossRef]
  20. Qu Z, Han Y, Zhu Q, Ding W, Wang Y, Zhang Y, et al. A novel neutrophil extracellular traps signature in gastric cancer. J Inflamm Res. 2023; 16:3419-3436.
  21. Yan J, Ye G, Jin Y, Miao M, Li Q, Zhou H. Identification of circRNA biomarkers in gastric cancer. BMC Genomics. 2023. [CrossRef]
  22. Qu JL, Qu XJ, Zhao MF, Teng YE, Zhang Y, Hou KZ, Jiang YH, Yang XH, Liu YP. Gastric cancer exosomes promote tumour cell proliferation. Dig Liver Dis. 2009;41:875-880. [CrossRef]
  23. Tabibzadeh A, Tameshkel FS, Moradi Y, Soltani S, Moradi-Lakeh M, Ashrafi GH, et al. Signal transduction pathway mutations in GI cancers. Sc Rep. 2020. [CrossRef]
  24. Shen B, Li M, Wang H, Xin L, Xie J. Expression and clinical significance of the RAS/RAF/MAPK cell signaling pathway in gastric cancer, Int. J. Clin. Exp. Med., 2018;11:11682 11689.
  25. Zhang L, Wu K, Hou Y, Li X. PRDX4 and TXNDC5 in gastric cancer, Transl. Cancer Res.13 2024;13:81 101. [CrossRef]
  26. Santos EC, Binato R, Fernandes PV, Ferreira MA, Abdelhay E. PPI network in gastric cancer, Cancer Biomark. 2022; 33:83 96.
  27. Chen ZX, Liang L, Huang HQ, Li JD, He RQ, Huang ZG, Song R, et al. LPCAT1 enhances invasion in gastric cancer. Cancer Med. 2023; 12:13438-13454.
  28. Repetto O, De Re V. Coagulation and fibrinolysis in gastric cancer. Ann N Y Acad Sci. 2017; 1404:27–48.
  29. Chang WJ, Du Y, Zhao X, Ma LY, Cao GW. Inflammation-related factors predicting prognosis of gastric cancer, World J Gastroenterol. 2014; 20:4586-4596. [CrossRef]
  30. Wu Q, Zhong H, Jiao L, Wen Y, Zhou Y, Zhou J, Lu X, Song X, Ying B. MiR-124-3p inhibits gastric cancer migration, Pathol Res Pract. 2020. [CrossRef]
  31. Liu F, Hu H, Zhao J, Zhang Z, Ai X, Tang L, Xie L. miR-124-3p suppresses tumor growth in gastric cancer. Biomed Rep. 2018; 8:29 34.
  32. Jiang Z, Chen H, Su M, Wu L, Yu X, Liu Z. MicroRNA-23a-3p in gastric cancer via CCL22/PI3K/Akt axis. Bioengineered. 2021; 12:5454–5465.
  33. 33 Zhao X, Ye N, Feng X, Ju H, Liu R, Lu W. MicroRNA-29b-3p inhibits migration of gastric cancer cells. Onco Targets Ther. 2021; 14:4081–4091.
  34. Wang T, Hou J, Jian S, Luo Q, Wei J, Li Z, Wang X, et al. miR-29b negatively regulates MMP2. J Cancer. 2018; 9:2595-2601. [CrossRef]
  35. Huang Y, Zhu J, Li W, Zhang Z, Xiong P, Wang H, Zhang J. Serum microRNA panel for gastric cancer. Oncol Rep. 2018; 40: 3865-3876.
  36. Tang Y, Liu X, Su B, Zhang Z, Zeng X, Lei Y, et al. microRNA-22 targets metatherian in gastric cancer. Mol Med Rep. 2015; 12:4354-4360.
  37. Zuo QF, et al. MicroRNA-22 inhibits tumor growth in gastric cancer. Cell Death Dis. 2015. [CrossRef]
  38. Li B. et al. miRNA-22 suppresses colon cancer cell migration. Oncol Rep. 2013; 29:103-110.
  39. Zhang S, Zhang D, Yi C, Wang Y, Wang H, Wang J. MicroRNA-22 functions as a tumor suppressor by targeting SIRT1 in renal cell carcinoma. Oncol Rep. 2016;35: 559–567. [CrossRef]
  40. Lu X, Lu J, Wang S, Zhang Y, Ding Y, Shen X, et al. Circulating serum exosomal miR-92a-3p as a novel biomarker for early diagnosis of gastric cancer. Future Oncol. 2021; 17:907-919. [CrossRef]
  41. Jiang M, Li X, Quan X, Li X, Zhou B. MiR-92a family as diagnostic biomarker and Potential Therapeutic Target in Human Cancers. Front Mol Biosci. 2019. [CrossRef]
  42. Dai B, Chen RC, Zhu SZ, Zhang WW. Using random forest algorithm for breast cancer diagnosis, in: Proc. 2018 Int. Symp. Comput Consum. Control (IS3C). IEEE; 2018.1–4.
  43. Liu Y, Bian B, Chen S, Zhou B, Zhang P, Shen L, et al. Identification and validation of four serum biomarkers with optimal diagnostic and prognostic potential for gastric cancer based on machine learning algorithms. Cancer Med. 2025. [CrossRef]
  44. Liu SS, Wan QS, Lv C, Wang JK, Jiang S, Cai D, et al. Integrating trans-omics, cellular experiments and clinical validation to identify ILF2 as a diagnostic serum biomarker and therapeutic target in gastric cancer. BMC Cancer. 2024. [CrossRef]
  45. Kamel H, Abdulah D, Al-Tuwaijari JM. Cancer classification using gaussian naive bayes algorithm, in: Proc. 2019 Int. Eng. Conf. (IEC). IEEE; 2019. 1–5. [CrossRef]
  46. Naorem LD, Muthaiyan M, Venkatesan A. Identification of dysregulated miRNAs in triple negative breast cancer: a meta-analysis approach. J Cell Physiol. 2019;234:11768–11779. [CrossRef]
  47. Ali M, Mansoor Ali H. Performance Analysis of Classification Learning Methods on Large Dataset using two Data Mining Tools. J. Indep Stud Res Comput. 2015. [CrossRef]
  48. Thirunavukkarasu K, Wadhawa M. Analysis and Comparison Study of Data Mining Algorithms Using Rapid Miner. Int J Comput Sci Eng Appl. 2016;6(1):9-21. [CrossRef]
  49. Arunadevi J, Ramya S, Ramesh Raja M. A study of classification algorithms using Rapidminer. Int J Pure Appl Math. 2018;119:15977-15988.
Figure 1. A workflow illustrating the key stages of the current research. The diagram was created using the online tool diagram.net.
Preprints 180926 g001
Figure 2. Volcano plots displaying DEA results: A. GSE54129; B. GSE113255; C. GSE106817; D. GSE174302. Bar plots show the top 20 most significant pathways for E, tissue datasets, and F, blood miRNA dataset.
Preprints 180926 g002
Figure 3. A. Venn diagram representing the overlapping genes between miRTarbase target genes and GSE174302 DEGs; B. Venn diagram representing the number of GC tissue and circulating miRNA target genes pathways; C. Common pathways shared between GC tissue and the circulating miRNA target genes, along with their adjusted p-values from the pathway enrichment analysis, and the compilation of extracted specific DEMs derived from these pathways. The figure was created using RStudio version 2024.12.1-563.
Preprints 180926 g003
Figure 4. RF cross-validation results for the 5-miRNA and 3-miRNA biomarker panels. A. ROC curve showing classification performance of the 5-miRNA panel on the GSE106817 training dataset. B. ROC curve of the 5-miRNA panel on the external validation dataset (GSE164174). C-D. Corresponding ROC curves for the 3-miRNA panel on GSE106817 and GSE164174, respectively. Red lines indicate the Receiver Operating Characteristic (ROC) curves, while blue lines represent threshold variations. Axes show specificity (x-axis) versus sensitivity (y-axis).
Preprints 180926 g004
Figure 5. Interaction network of Reactom pathways shared between GC tissue and blood miRNA datasets, showing DEMs that were enriched in these pathways in the blood dataset. The final 5-miRNA biomarker panel is shown at the center, with connections to its associated pathways.
Preprints 180926 g005
Table 1. Transcriptomic datasets used in this study.
Dataset ID Sample type
Technology/platform/platform ID Sample size (T/N) Usage
GSE54129
GC tissue Microarray/Affymetrix/GPL570 111/21 Pathway enrichment in step 1
GSE113255
GC tissue RNAseq/Illumina/GPL18573 130/10 Pathway enrichment in step 1
GSE174302
GC plasma RNAseq/HiSeq X Ten (Homo sapiens)/GPL20795 27/15 Validation of miRNA targets (pathway enrichment of GSE106817 dataset) in step 1
GSE106817
GC serum miRNA Microarray/3D-Gene Human miRNA V21_1.0.0/GPL21263 115/2759
Pathway enrichment in step 1, Feature selection for finding the biomarker panel, and validation of that in step 2
GSE164174 GC serum miRNA 3D-Gene Human miRNA V21_1.0.0/GPL21263 1417/1417 External validation of biomarker panels in step 2
Table 2. Performance metrics (expressed as percentages) for the RF-based miRNA biomarker panels in blood miRNA datasets.
MiRNA panels Dataset ID SEN SPE ACC MCC AUC
5-miRNA Panel GSE106817 77.39 99.24 98.36 78.28 98.50
GSE164174 93.79 84.69 89.24 78.80 95.30
GSE106817 76.52 98.99 98.09 75.19 98.40
3-miRNA Panel GSE164174 91.88 83.06 87.47 75.24 94.40
Disclaimer/Publisher’s Note: The statements, opinions and data contained in all publications are solely those of the individual author(s) and contributor(s) and not of MDPI and/or the editor(s). MDPI and/or the editor(s) disclaim responsibility for any injury to people or property resulting from any ideas, methods, instructions or products referred to in the content.
Copyright: This open access article is published under a Creative Commons CC BY 4.0 license, which permit the free download, distribution, and reuse, provided that the author and preprint are cited in any reuse.
Prerpints.org logo

Preprints.org is a free preprint server supported by MDPI in Basel, Switzerland.

Subscribe

Disclaimer

Terms of Use

Privacy Policy

Privacy Settings

© 2025 MDPI (Basel, Switzerland) unless otherwise stated