
Submitted:
09 October 2025
Posted:
10 October 2025
You are already at the latest version
Abstract
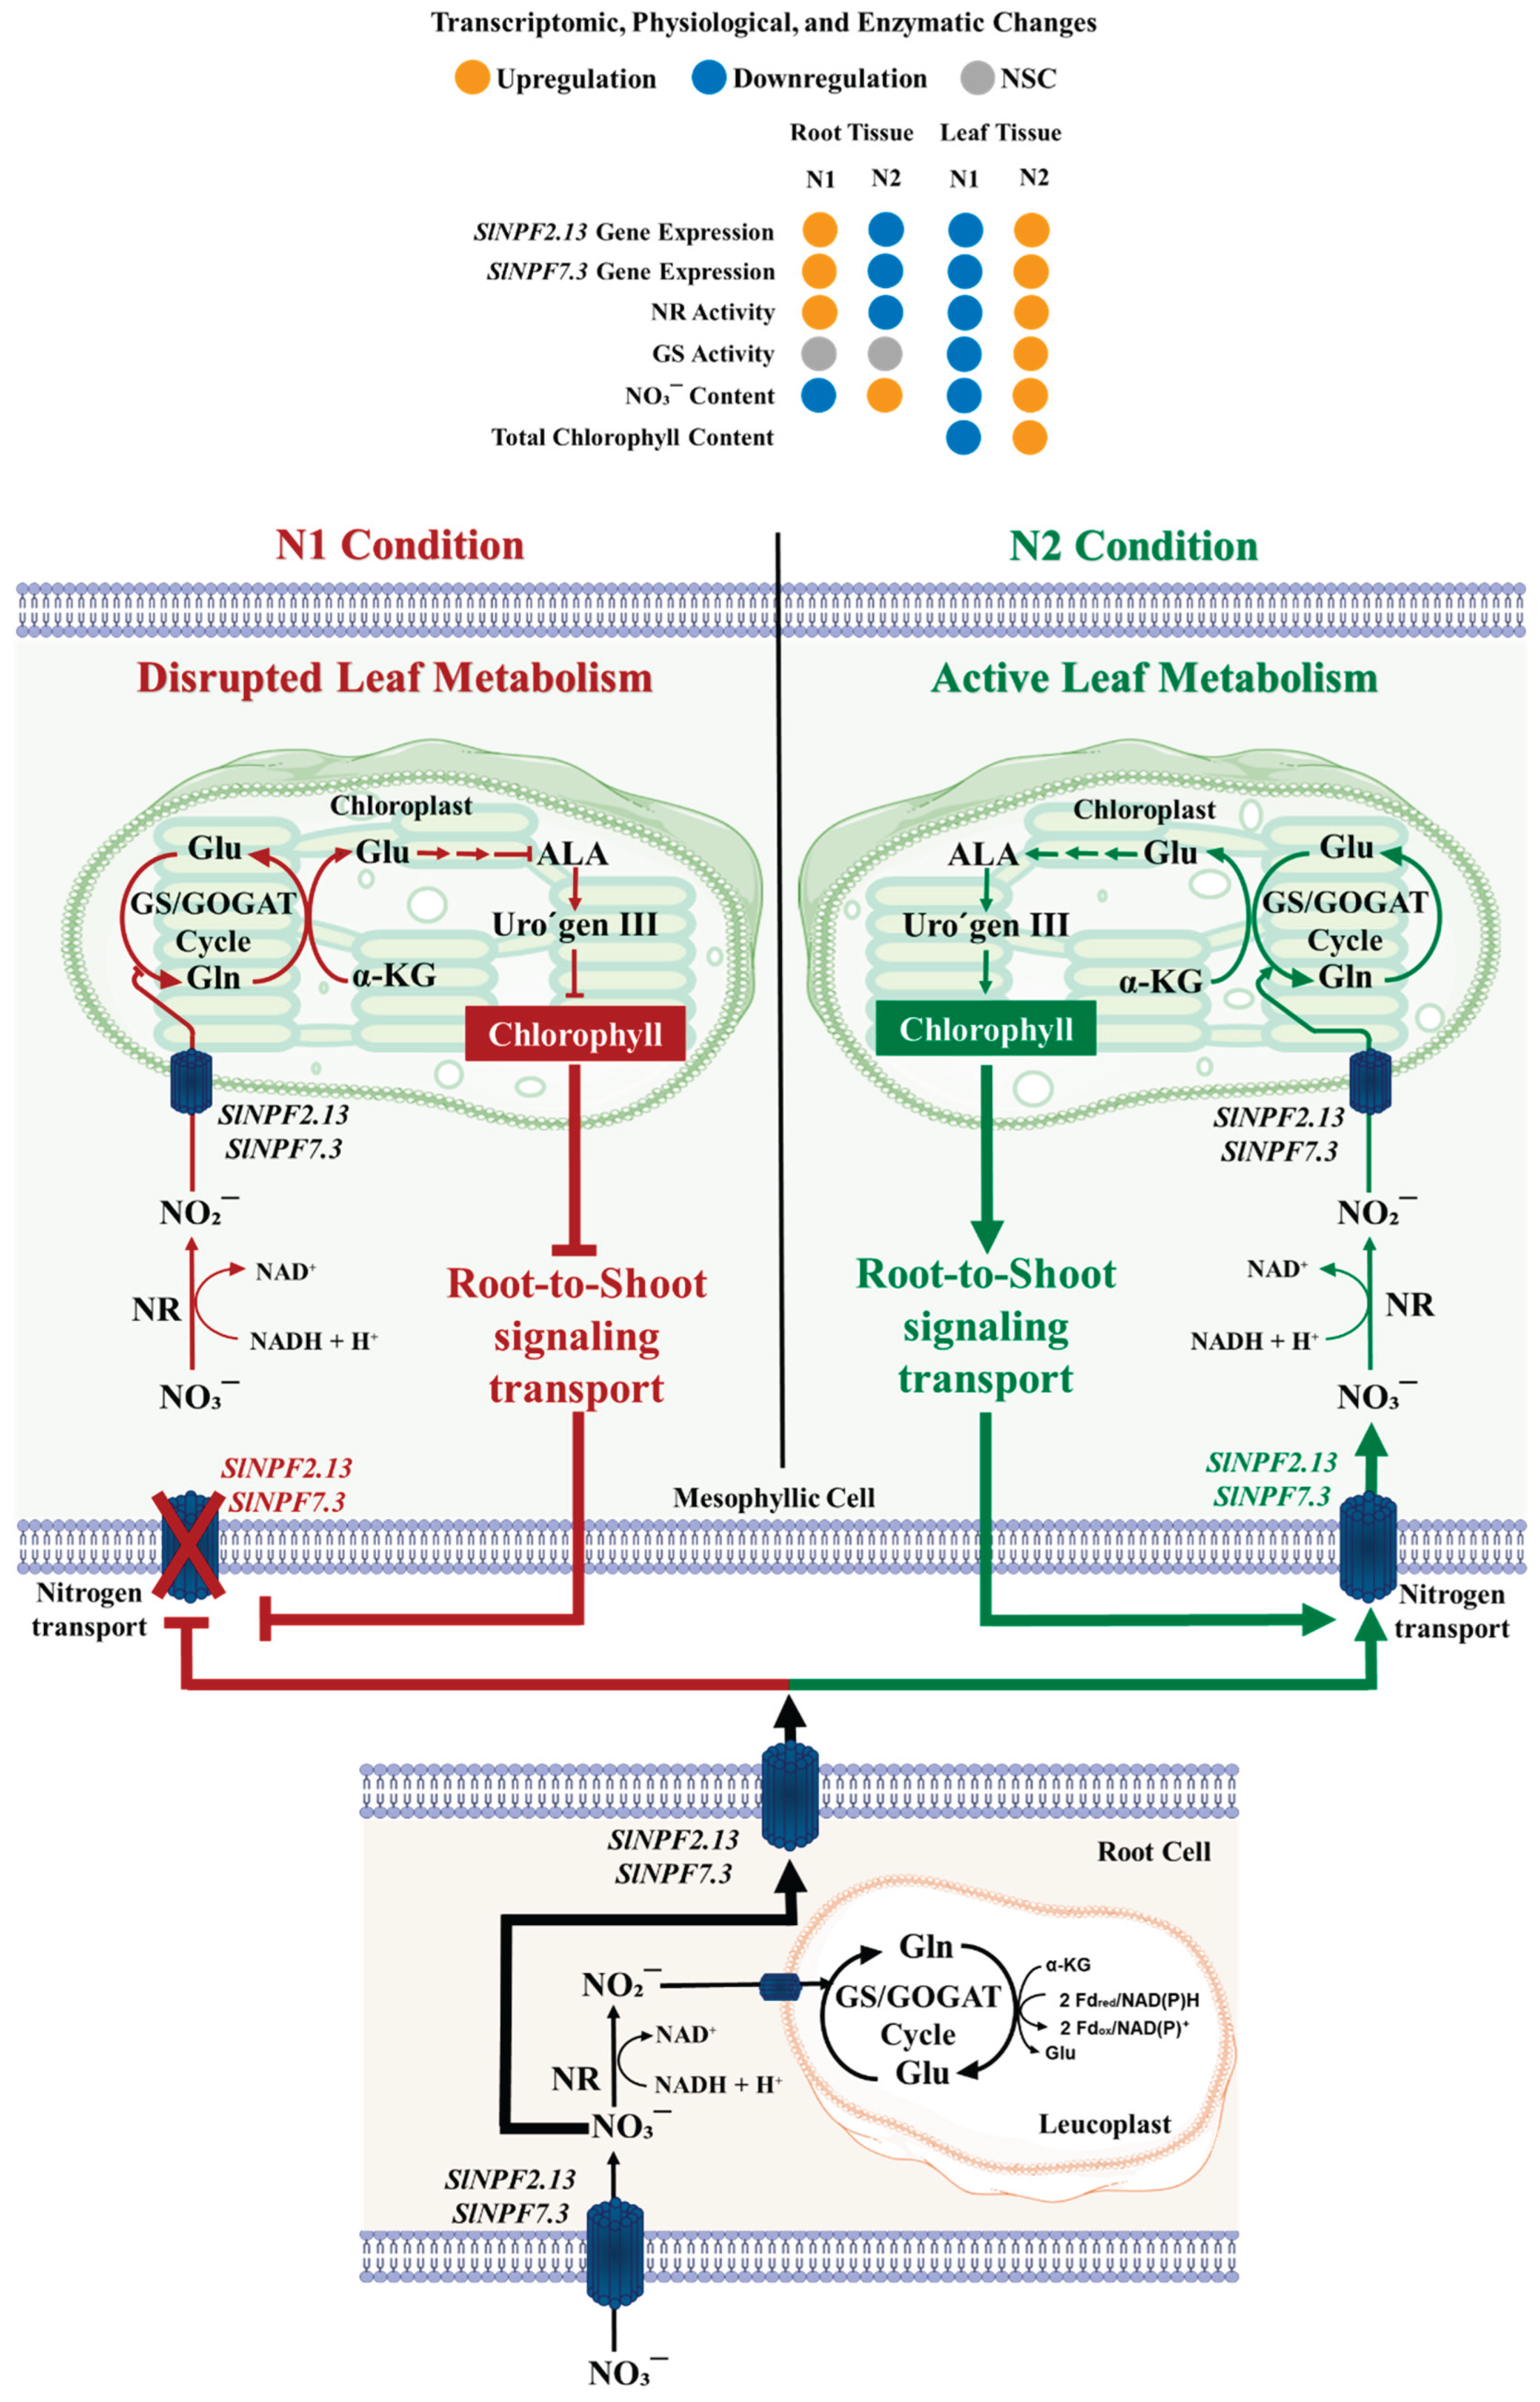
Nitrogen (N) is a critical macronutrient for crop production, however, it has been estimated that 50-70% of N applied is not used by the plant, negatively affecting crop development performance and environmental health. This low Nitrogen Use Efficiency (NUE) represents a major agricultural challenge. To identify the molecular mechanism responsible for NUE regulation, a comprehensive genomic annotation, transcriptomic, and functional analysis of the NPF, NRT2, and AMT transporter families in tomato (Solanum lycopersicum) were performed. The genomic analysis identified 29 SlNPF, 6 SlNRT2, and 4 SlAMT transporter genes. Also, the integrated analysis provided insights into a root-to-shoot signaling mechanism, in which the plant metabolic performance exerts a strong regulation on N transport capacity, under two commercial high-N supply conditions: N1 (11.4 mM NO3- and 2.3 mM NH4⁺) and N2 (10.5 mM NO3- and 0.5 mM NH4⁺). At the leaf level, the N1 condition induced a depressed N assimilation capacity, evidenced by NO3- accumulation (increased by 55.7%) and reduced Nitrate Reductase (NR) and Glutamine Synthetase (GS) activities (54.0% and 43.2% reduction, respectively). These responses were correlated with reduced chlorophyll synthesis capacity (reduced by 42.3%). This reduced metabolic demand consequently triggered the downregulation of the root-to-shoot NPF transporters, SlNPF2.13 and SlNPF7.3. This metabolic restriction limited the long-distance transport and promoted a significant N accumulation at the root level (NO3- increased by 41.8%). Overall, the present study reveals that leaf metabolic performance is the systemic metabolic regulator of N transport and provides evidence for the key role of SlNPF2.13 and SlNPF7.3 transporters as pivotal molecular checkpoints for improving NUE in tomato production.
Keywords:
Nitrogen use efficiency (NUE)
; NPF transporter family
; root-to-shoot signaling
; nitrogen assimilation
; gene expression analysis
; bioinformatic analysis
1. Introduction
Nitrogen (N) is the most critical macronutrient for plant growth and development, playing a vital role in synthesizing essential compounds such as amino acids, hormones, and chlorophylls [1,2,3,4,5,6]. N management strongly influences global agricultural productivity. Unfortunately, the high reliance on N-based fertilizers is associated with a serious problem of Low Nitrogen Use Efficiency (NUE), and an estimated 50-70% of the applied nitrogen is lost during plant development [5,7,8]. These losses cause nutrient leaching to the soils, promote the release of nitrous oxide (N2O), a potent greenhouse gas, and also are associated with a 15-20% of crop yield reduction [8,9]. These challenges underscore the urgent need to enhance NUE for sustainable agriculture.
To achieve NUE optimization, it is crucial to understand the molecular bases of N uptake and internal partitioning. Nitrates (NO3¯) and ammonium (NH4+) are the main inorganic forms in which nitrogen is taken up by plants [10,11]. These are taken up by the root system via specific membrane transport classified as high-affinity (HATS) and low-affinity (LATS) transport systems. LATS is primarily composed of the nitrate transporter 1/small peptide transporter (NPF) family, enabling NO3¯ uptake under high N availability (˃ 0.5 mM). HATS comprises the NRT2 family for NO3¯ uptake and the AMT families (AMT1 and AMT2) for NH4+ acquisition under low N conditions (˂ 0.1 mM and ˂ 1 mM for NO3¯ and NH4+ acquisition, respectively) [6,10,11,12,13,14,15,16,17,18].
These transporter families are recognized as potential targets for improving NUE. However, the precise genomic annotation, comprehensive functional characterization, and evolutionary relationships of their members are often deficient, even in major crop species. Specifically, critical knowledge gaps remain regarding the NPF family´s role in long-distance transport, controversies surrounding its substrate specificity, and, most importantly, how the plant´s shoot system metabolically regulated root N uptake and translocation (shoot-to-root signaling) [19].
In tomato (Solanum lycopersicum), one of the world´s most important horticultural crops, the molecular and physiological responses related to NUE regulation are often unclear and highly variable. Previous studies have shown that high N availability: (1) is associated with reduced transcript levels of LATS (SlNPF1.2, SlNPF2.6, SlNPF2.11, SlNPF7.1, and SlNPF7.3) in both roots and leaves [20]; (2) leads to lower transcript levels of HATS (SlNRT2.1 and SlNRT2.3) in roots [21]; and (3) enhances N uptake efficiency (NUpE) and NO3¯ influx but reduces overall N utilization efficiency (NUtE) [21]. Furthermore, the complexity is highlighted by evidence that SlNRT2.3 plays a dual role in the uptake and long-distance transport [22], that other transporters (SlAMT1;1, SlAMT1;2, SlNPF6.3, and SlNRT2.1) show differentiated responses to the form of N supplied [23], and that some are linked to abiotic stress such as salt tolerance crops [12,18,19,24]. Crucially, while these studies identify individual gene responses, they fail to provide an integrated mechanism linking the shoot´s metabolic state (assimilation capacity) to the transcriptional regulation of these root-to-shoot transporters.
In this study, we conducted a comprehensive analysis of the SlNPF, SlNRT2, and SlAMT gene families in tomato. Our work integrates: (1) whole-genome characterization (evolutionary analysis, duplication, and structure); (2) transcriptomics; and (3) functional validation through metabolic analysis. Our results provide fundamental insights into the mechanism of systemic regulation of N transport, identifying SlNPF2.13 and SlNPF7.3 as key molecular checkpoints for enhancing NUE in tomato production.
2. Results
2.1. Identification and physicochemical characterization of NPF, NRT2, and AMT gene families in tomato
In this study, a comprehensive BLASP search, using the protein sequences of the AtNPF (53 members), AtNRT2 (7 members), and AtAMT (5 members) families from A. thaliana as reference model, lead to the identification of 29 SlNPF, 6 SlNRT2, and 4 SlAMT members in the Solanum lycopersicum genome. The physicochemical characteristics of the identified tomato transporter families, including CDS sequence length, protein sequence length, molecular weight (MW), isoelectric point (pI), and predicted subcellular localization, were systematically evaluated (Supplementary Table S2).
The longest CDS sequence length was found in the SlNPF family, reaching up to 1,961 bp (SlNPF6.1), while the SlNRT2 (SlNRT2.1 and SlNRT2.2) and SlAMT (SlAMT1;2) families exhibited shorter maximum lengths (1,592 bp and 1,544 bp, respectively). Correspondingly, the SlNPF proteins were the largest, with lengths ranging from 537 aa (SlNPF5.8) to 653 aa (SlNPF6.1), and MW values up to 71.92 kDa (SlNPF6.1). In contrast, the SlNRT2 and SlAMT proteins showed shorter sizes, ranging from 458 to 531 aa, which was also associated with lower MW values. Regarding pI, the SlNPF family exhibited the widest variation, ranging from 5.79 (SlNPF8.3) to 9.37 (SlNPF2.11), suggesting functional diversity. Subcellular localization predictions showed that most proteins encoded by the SlNPF, SlNRT2, and SlAMT genes are located at the cell plasma membrane, chloroplast membrane, and vacuole, consistent with their function as transporters (Supplementary Table S2).
2.2. Phylogenetic analysis of NPF, NRT2 and AMT proteins
The interspecific and intraspecific homology, as well as the evolutionary connections among NPF, NRT2, and AMT proteins were explored through a phylogenetic analysis including members from both A. thaliana and tomato. A total of ten distinct clusters were identified in the phylogenetic tree (Figure 1).
For the AMT family, all proteins from both species clustered into a single node (Figure 1). These AMT protein sequences of both biological models showed a high mean homology (78%). A similar clustering pattern was observed for the NRT2 family, where a single node encompassing both A. thaliana and tomato proteins was also identified (Figure 1). The NRT2 family proteins exhibited high homology (67%) between the two species. The topology, defined by the formation of single clusters for both AMT and NRT2 families, indicates a string evolutionary conservation of these genes in tomato and A. thaliana.
The NPF family proteins were clustered into eight distinct subfamilies (NPF1-NPF8) (Figure 1). Unlike the patterns observed for the AMT and NRT2 families, the NPF subfamilies generally showed lower mean interspecific homology levels. The homology exhibited in each subfamily between both biological models was: 56.7% (NPF1), 44.6% (NPF2), 75.4% (NPF3), 41.5% (NPF4), 46.4% (NPF5), 52.1% (NPF6), 71.5% (NPF7), and 67.3% (NPF8) (Figure 1). The clustering of both species within specific NPF subfamilies further highlights the shared ancestry and speciation events between them. Furthermore, the phylogenetic tree clearly showed the conformation of unique nodes for each transporter family, indicating distinct intraspecific gene duplication events within each model.
2.3. Analysis of conserved domain/motif analysis in NPF, NRT2 and AMT proteins and gene structure analysis of NPF, NRT2 and AMT genes
The structural properties of the SlAMT, SlNRT2, and SlNPF gene and protein families were assessed in order to gain insights into their evolution in tomato. The gene structure analysis revealed wide divergence in the observed structural patterns among the three families (Figure 2). The SlAMT family exhibited the least complex structure, with the SlAMT1;3 and SlAMT1,1 genes containing no introns (Figure 2A). Other SlAMT members showed between one (SlAMT1.2) and three (SlAMT2) introns, and between one and four exons in their gene structure (SlAMT1;1 and SlAMT2, respectively) (Figure 2A). In contrast, the SlNRT2 family showed a more complex structure level, with the number of exons ranging from two to four, and the number of introns ranging from one to three (Figure 2A). The SlNPF family displayed the highest structural divergence, with the number of exons ranging from three to seven (Figure 2A). Consistent with this high variability, 37.95% of the SlNPF genes contained five exons in their structure, suggesting a high rate of intron/exon gain or loss throughout the evolution of this family.
Protein motif analysis using the MEME tool identified conserved motif sequences corresponding to Transmembrane Regions (TMRs), as confirmed by InterPro in the three transporter families (Figure 2B). On the other hand, the protein domain analysis revealed that the SlNRT2 and SlNPF families conserve in their structure a single domain: the Major Facilitator Superfamily (MFS) (Figure 2C). Correspondingly, SlNPF and SlNRT2 proteins showed a similar TMR arrangement, generally consisting of up to twelve conserved regions (Figure 2B). Specifically, the SlNPF proteins exhibited slight variation, ranging from 10 TMRs (SlNPF5.8) to 12 TMRs (e.g., SlNPF6.1) (Figure 2B). Similarly, in the SlNRT2 family, while members such as SlNRT2.1, SlNRT2.2, and SlNRT2.3 possessed 12 TMRs, truncated arrangements (9-11 TMRs) were observed in the rest of the proteins, being SlNRT2.7 × 2 the protein with the lower number of TMRs in its structure (9 TMRs) (Figure 2B).
Finally, the SlAMT protein family exhibited the conservation of the Ammonium Transporter Superfamily domain (Figure 2C). Furthermore, the SlAMT proteins contained 11, 12, and 10 TMRs (SlAMT1;1, SlAMT1;2, and SlAMT1;3, respectively), with SlAMT2 showing the most divergent array with only 6 TMRs (Figure 2C).
2.4. Chromosome distribution and evolutionary duplication analysis of SlNPF, SlNRT2 and SlAMT genes in tomato
The 39 identified genes (SlAMT: 4, SlNRT2: 6, and SlNPF: 29) were disproportionately distributed across the 12 chromosomes of tomato (Figure 3A). Chromosome 6 contained the highest proportion of genes (29% of the total), while chromosome 7 contained no mapped genes (Figure 3A). To reveal the gene multiplication patterns and the evolutionary forces driving the size and distribution of these families, gene duplication events were analyzed using the MCScan tool.
The NPF family exhibited a high number of duplication events (285 events) (Figure 3B). Segmental gene duplication events (258 pairs) were the dominant mechanism, significantly exceeding tandem duplication events (27 pairs) (Supplementary Table S3). In addition, to get a better understanding of evolutionary selective pressure, the non-synonymous substitutions (Ka), synonymous substitutions (Ks), and non-synonymous to synonymous (Ka/Ks) ratio were calculated (Supplementary Table S3). These results indicate that segmental duplication drives the chromosome distribution patterns. Furthermore, the observation that all duplicated SlNPF genes pairs showed a Ka/Ks ratio ˂1 provides direct evidence of purifying selection during their evolution, suggesting the functional conservation of the encoded proteins (Supplementary Table S3). For SlNRT2 and SlAMT families, a lower number of intraspecific duplication events were detected, 4 and 3, respectively (Figure 3B). Segmental duplication was the dominant driving force in the SlAMT family, and its duplicated pairs also showed Ka/Ks ratios ˂1 (purifying selection) (Supplementary Table S3). The SlNRT2 family evolution was influenced equally by both tandem and segmental duplication patterns. Only the SlNRT2.7 X1/SlNRT2.7 X2 gene pair had a Ka/Ks ratio ˃1, suggesting that diversifying selection played a secondary role in the evolution of SlNRT2 family (Supplementary Table S3).
2.5. Expression profiles of SlNPF, SlNRT2, and SlAMT genes under nitrogen deficiency conditions
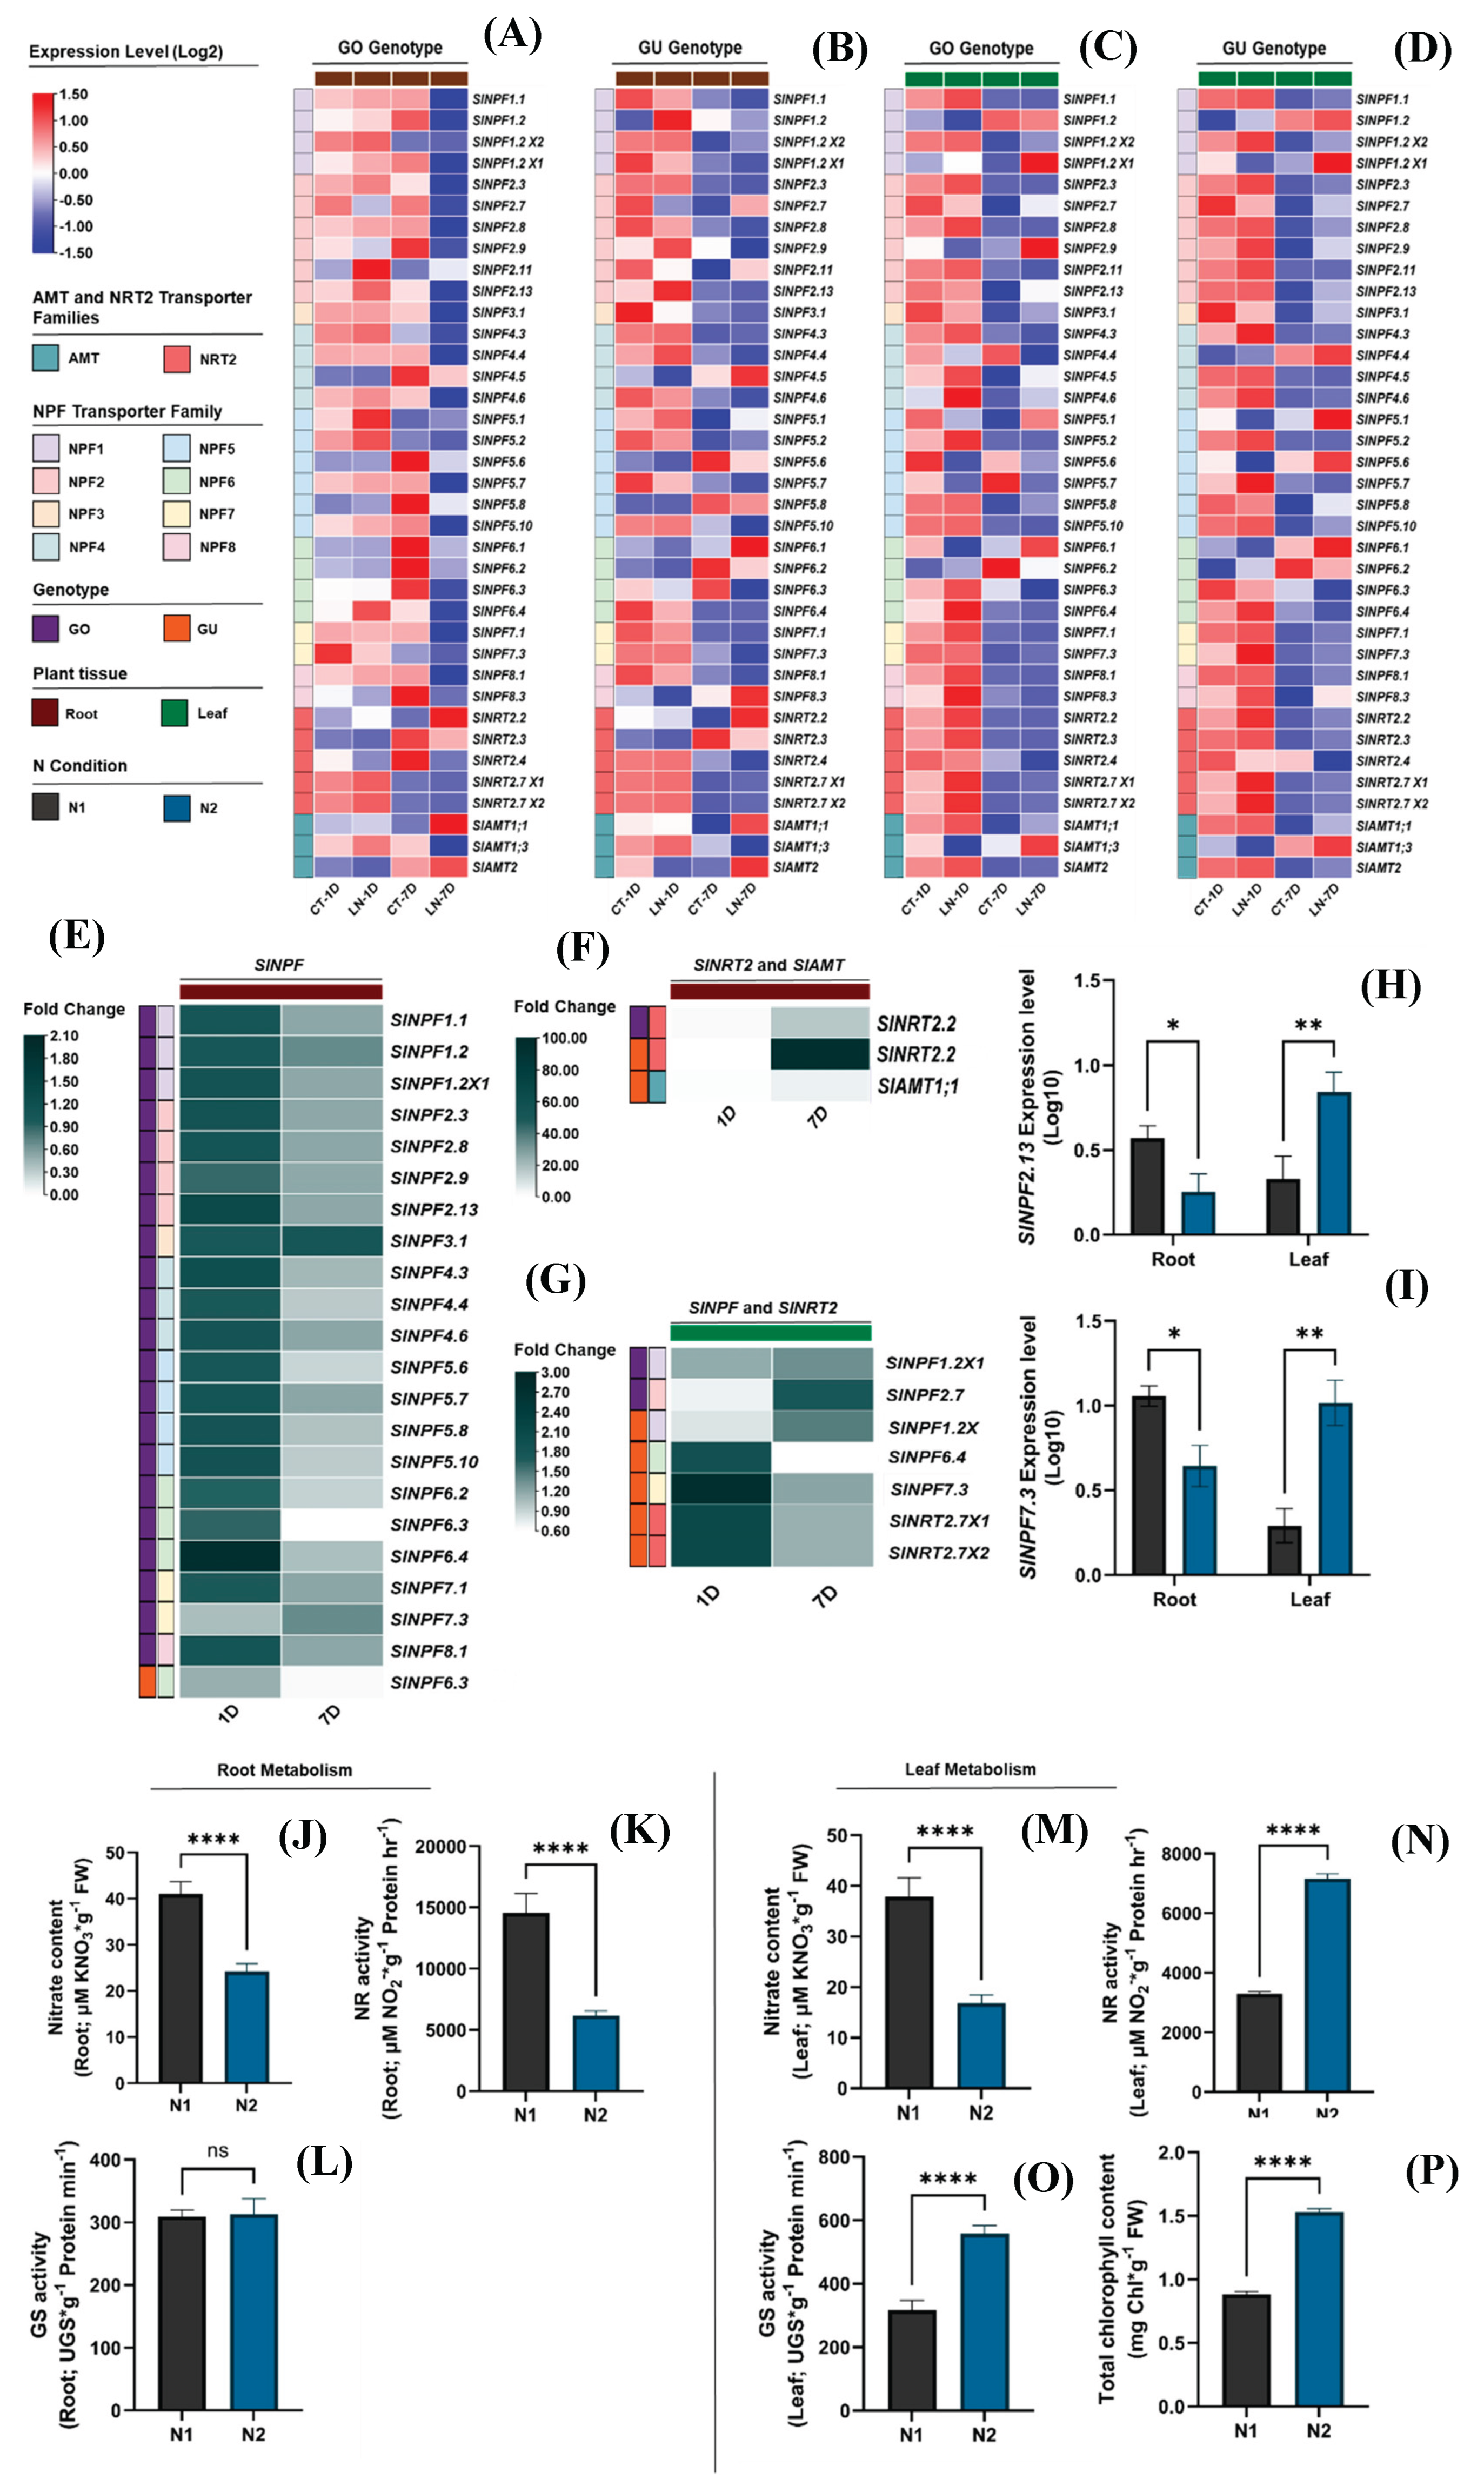
An analysis of RNA-seq data from GEO-NCBI public database (bioProject accession number PRJNA578768) was conducted to characterize the gene expression profiles of SlNPF, SlNRT2, and SlAMT families. The data set included leaf and root samples from two tomato genotypes (GO and GU) subjected to low nitrogen (LN) and optimal nitrogen (CT) supply for 1 and 7 days. From a broad perspective, the results revealed that nitrogen availability, exposure time, and plant genotype had a significant effect on gene expression (Figure 4A-D).
A subsequent statistical analysis was performed to identify genes with expression patterns that respond significantly to nitrogen availability. Heatmaps were then constructed with all significantly responding genes in the root and leaf tissues of the GO and GU genotypes (Figure 4E-G). These heatmaps represent the fold change of gene expression under the LN condition relative to the CT condition at days 1 and 7.
The analysis revealed distinct expression patterns among the three transporter families. The high-affinity SlNRT2 and SlAMT genes showed a clear trend of upregulation in both root and leaf tissues under LN conditions compared to CT (Figure 4F and G). In root tissues, the SlNRT2.2 gene exhibited a notable increase in its expression level at day 7, with transcript levels rising up to a 95.7-fold change, highlighting its critical role in nitrogen uptake under N deficiency conditions. In contrast, a general decrease in expression was observed at day 1. However, these changes were not statistically significant (Figure 4F). For leaf tissues, both SlNRT2.7X1 and SlNRT2.7X2 showed an increase in their gene expression at day 1 (2.1-fold change for each one) (Figure 4G). Conversely, a decrease was observed at day 7, though these changes were not statistically significant (Figure 4G).
Conversely, the low-affinity SlNPF genes exhibited a differentiated response between root and leaf systems. Under LN condition, these genes were downregulated in root tissues at day 7 (0.008-0.693-fold changes) (Figure 4E). This downregulation was most notable in GO genotype. The data showed a general increase in expression at day 1, but these changes were not statistically significant (Figure 4E). Interestingly, in leaf tissues, these low-affinity SlNPF transporters were upregulated under LN condition (Figure 4G). For GO genotype, SlNPF1.2X1 and SlNPF2.7 increased their expression at day 7 (1.348-1.753-fold change, respectively) (Figure 4G). The changes observed at day 1 were not statistically significant. For GU genotype, SlNPF1.2X1 increased its expression at day 7 (1.464-fold change), while SlNPF6.4 and SlNPF7.3 increased their expression at day 1 (1.905 and 2.751-fold change, respectively) (Figure 4G).
Based on these differential expression patterns, a subset of genes with a significant response to LN respect to CT were selected for further analysis in our experimental system, which included two conditions: N1, with higher nitrogen availability (11.4 mM NO3¯ and 2.3 mM NH4+), and N2, with lower nitrogen availability (10.5 mM NO3¯ and 0.5 mM NH4+). The specific genes selected for our study are listed in Supplementary Table S1.
2.6. Gene expression profile analysis of SlNPF, SlNRT2, and SlAMT families in tomato
Functionality validation of the SlNPF, SlNRT2, and SlAMT genes with significant response to nitrogen availability was performed by quantifying their expression levels in our experimental model using qRT-PCR. The genes evaluated are listed in Supplementary Table S1. These genes were evaluated under N1 and N2 conditions.
Interestingly, our results revealed differential expression patterns between root and leaf tissues under N1 and N2 conditions. However, gene expression quantification was only possible for SlNPF2.13 and SlNPF7.3 (Figure 4H and I). In root tissues, both SlNPF2.13 and SlNPF7.3 exhibited a reduced expression level in N2 condition (0.48- and 0.39-fold change, respectively) (Figure 4H and I). Conversely, leaf tissues under N2 condition showed an opposite response, with the expression levels of SlNPF2.13 and SlNPF7.3 increasing up to a 3.3- and 5.3-fold change, respectively (Figure 4H and I).
Furthermore, gene expression quantification of the SlNRT2 and SlAMT genes was not possible. This lack of expression could be related to the high nitrogen availability in N1 (11.4 mM NO3¯ and 2.3 mM NH4+) and N2 (10.5 mM NO3¯ and 0.5 mM NH4+) conditions. In both treatments, the NO3¯ and NH4+ concentrations are higher than the necessary thresholds for SlNRT2 and SlAMT gene activation (˂0.1 mM NO3¯ and ˂1 mM NH4+, respectively) [11,12].
Taken together, the differential expression patterns of these two SlNPF genes in roots and leaves suggest that these genes are key regulators of plant response to high nitrogen content in nutrition solutions, such as those studied in our experimental conditions.
2.7. Integrated analysis of gene expression and physiological response
To functionally validate the role of SlNPF, SlNRT2, and SlAMT genes, we assessed nitrogen metabolism in roots and leaves, as well as chlorophyll synthesis capacity. Our findings revealed a differentiated metabolic performance between root and leaf samples, directly correlating with the observed SlNPF2.13 and SlNPF 7.3 expression patterns.
Leaf samples of plants subjected to the N1 conditions exhibited a reduced metabolic capacity in comparison to those subjected to the N2 condition. NO3¯ content was increased by 55.7% in N1 (Figure 4M). The high nitrate content was related to lower nitrate reductase (NR) and glutamine synthetase (GS) activity (54.0% and 43.2% reduction, respectively) (Figure 4N and O). This suggests a lower conversion rate of nitrate to nitrite, indicating a reduced nitrogen assimilation capacity in leaves from N1 condition.
In addition, this reduced assimilation could be associated with a reduced synthesis of intermediate metabolites, especially those resulting from GS activity, such as glutamic acid, which is the necessary precursor for chlorophyll synthesis. This was corroborated by a less total chlorophyll content, reducing its concentration by 42.3% under N1 condition (Figure 4P).
This lower metabolic capacity suggests a reduced nitrogen demand at the leaf level. This could explain the downregulation of SlNPF2.13 and SlNPF7.3 expression and enzymatic activity under N1 conditions, thereby reducing nitrogen transport from roots to leaves. These responses, in turn, appear to exert a strong regulatory control over root nitrogen uptake and metabolism, which is described next.
Conversely, root of plants growth under N1 condition showed a significant increase in nitrogen uptake and metabolism capacity compared to the N2 condition. NO3¯ content was increased by 41.8% (Figure 4J). This higher metabolite concentration induced a significant increase in NR activity (57.7%) (Figure 4K). While this enhanced uptake is partly driven by the higher N availability in the N1 solution, the higher expression level of both SlNPF2.13 and SlNPF7.3 in roots further facilitated this increased capacity. Critically, these root results, coupled with the reduced assimilation observed in leaves under N1 condition, suggest a severe restriction in nitrogen transport capacity from roots to leaves, resulting in the nitrogen metabolites accumulation within the root tissues (Figure 5).
Figure 4.
Integrated Model Root-to-Shoot signaling mechanism in tomato (Solanum lycopersicum). Scheme showing leaf metabolic performance control over nitrogen long-distance control transport. Under N1 condition (Left side), leaf tissues exhibit a significant reduced metabolism and nitrogen assimilation capacity. This was evidenced by a high NO3¯ accumulation and a concomitant reduction in NR/GS activities and chlorophyll content. This reduced nitrogen demand acts as a key systemic signal, triggering the observed transcriptional downregulation of the SlNPF transporters SlNPF2.13 and SlNPF7.3. These integrated responses caused the restriction of nitrogen long-distance transport, leading to NO3¯ accumulation in root tissues, even with an upregulation of these transporters at root level. Conversely, under N2 condition (right side), a more active metabolism and resulting higher nitrogen demand stimulate nitrogen long-distance transport. The heatmap displays the qualitative change observed for the gene expression levels (SlNPF2.13 and SlNPF7.3), enzymatic activity (NR and GS), and metabolite content (NO3¯ and chlorophyll) under N1 and N2 conditions. Orange indicates high level or upregulation, while blue indicates low level or downregulation. The scheme was created using some graphic components adapted from Servier Medfical Art licenced under Creative Commons Attribution (CC BY 4.0)1.
3. Discussion
Our initial bioinformatics analysis in tomato (Solanum lycopersicum) identified 29, 6, and 4 genes belonging to the SlNPF, SlNRT2, and SlAMT transporter families, respectively. These genes were classified based on their homology, physical/chemical characteristics, and evolutionary relationships. The size of these transporters families has been consistently associated to plant´s ploidy level [25]. For instance, Triticum aestivum, a hexaploid plant shows a larger number of NPF members (211) [26]. This pattern is consistently observed in allotetraploid plants such as G. hirsutum, B. napus, and N. tabacum, which possess 98, 169, and 143 NPF members, respectively. In contrast, diploid models, like tomato (29 members identified in this study), show a lower number of SlNPF genes [17,25,27]. This low number is further supported by comparisons with other diploid species: Z. mays (78 members), G. raimondii (52 members), G. arboreum (51 members), O. sativa (96 members), M. domestica (73 members), and S. oleracea (57 members) [28,29,30,31,32]. A similar trend is evident for the SlNRT2 family, with diploid species such as tomato (6 members identified in this study), Z. mays (7 members), and S. oleracea (9 members) displaying a significant lower count compared to the hexaploid T. aestivum (49 members) [28,31,33]. These genomic comparisons establish tomato as a highly conserved diploid model regarding its nitrogen transporter families.
Structure analysis of the gene and protein sequences of these families gives us insights into their evolutionary history. The gene structure analysis revealed that the SlAMT1 family has the lowest number of intron in its genomic sequence (SlAMT1;1 and SlAMT1;3 have none, and SlAMT1;2 has only one). It is estimated that intron loss rates are generally considered faster than intron gain following gene duplication events [11,34]. This simpler structure suggests that the SlAMT family may be evolutionary younger than the SlNRT2 and SlNPF families. Furthermore, the SlAMT family may have evolved from the SlNRT2 and SlNPF families. This hypothesis is supported by our gene duplication analysis, which detected 51 and 14 duplication events linking SlNPF and SlNRT2 families to SlAMT1 family, respectively. Furthermore, the protein sequence structure analysis confirmed the presence of the conserved Major Facilitator Superfamily (MFS) domain across these families. MFS is one of the oldest and most diverse superfamilies of secondary transporters on Earth, characterized by a conserved structure of up to 12 transmembrane regions (TMR) organized into two segments composed of 6 TMR, connected by a long and flexible intracellular loop [35,36,37]. The structural conservation of the SlNPF and SlNRT2 families is likely maintained through extensive gene duplication, as evidenced by the 350 duplication events identified between them, with segmental duplication (309 events) being the dominant duplication process over tandem duplication (42 events). This high duplication rate, combined with a negative/purifying selection pressure evidenced by the Ka/Ks ratio values, strongly suggests that the evolution of these families has been driven to preserve the essential biological function inherent in the MFS domain.
RNA-seq analysis revealed clear differential expression patterns of the transporter gene families in roots and leaves under nitrogen deficiency. In roots, the downregulation of SlNPF genes was consistent with the expected shift to high-affinity uptake mechanisms (SlNRT2 and SlAMT upregulation). Conversely, leaf samples exhibited an opposite response, with an increase in SlNPF expression. This difference highlights the distinct metabolic demands and physiological roles of different plant organs: roots focus on uptake, while leaves are involved in nitrogen metabolism and redistribution [38].
Our qRT-PCR results confirmed this contrasting pattern, particularly for SlNPF2.13 and SlNPF7.3 under our N1and N2 conditions. The integrated analysis of gene expression and nitrogen metabolism provides functional validation for the finding that nitrate transport is regulated by leaf metabolic performance, which is differentially affected by the nitrogen concentration in the nutrient solutions (N1 and N2). Specifically, in leaves under N1 condition (higher NO3¯ and NH4+ contents), we observed a depressed nitrogen assimilation capacity, evidenced by NO3¯ accumulation and reduced NR and GS activities. This inhibited metabolism suggests a reduced nitrogen demand at the shoot level, a status that is also correlated with lower chlorophyll biosynthesis. This lower demand likely triggered the downregulation of root-to-shoot transporters (SlNPF2.13 and SlNPF7.3), which explains the subsequent metabolite accumulation and enhanced nitrogen metabolism, evidenced by a higher NR activity observed in the roots of plants subjected to N1 condition. The integrated responses provide strong evidence for a restriction in nitrogen long-distance transport, a response strongly regulated by shoot-to-root signaling (Figure 5).
In addition, this strong evidence for long-distance transport gives insights for clarifying the ongoing functional controversy surrounding both SlNPF2.13 and SlNPF7.3. While NPF members, such as AtNPF2.12, AtNPF4.6, and AtNPF7.1, are known for their role in N redistribution [38,39], the specific function of SlNPF2.13 and SlNPF7.3 is widely debated. SlNPF7.3 has been associated with K+ uptake [19], even while other evidence supports its involvement in NO3¯ sensing, root uptake, and transport to aerial organs [20]. Similarly, while SlNPF2.13 was historically associated with NO3¯ remobilization [40], recent findings point to its role as an H+/TM (tunamycin) symporter involved in microbiome-plant interactions [41]. Taken together, our results, derived from the integrated analysis, give insights for supporting their primary involvement in NO3¯ uptake and long-distance partitioning. The ability of these transporters to integrate N-status signals confirms their pivotal role as key molecular checkpoints in the systemic regulation of NUE and promote a balanced redistribution of nitrogen and reach a sustainable agricultural production.
4. Materials and Methods
4.1. Identification and characterization of NPF, NRT2, and AMT families in tomato
To identify the NPF, NRT2, and AMT gene families in tomato, the corresponding reference protein sequences from Arabidopsis thaliana were retrieved from the TAIR2 and GenBank-NCBI3 databases [11]. These A. thaliana protein sequences served as the query set for a BLASTP search analysis against the whole protein sequences collection (CDS translations+PDB+SwissProt+PIR+PRF) archived in the GenBank (801,977,703 sequences; as of september, 2024) of Solanum lycopersicum (taxid:4081). The cut-off values applied for the analysis were as follows: 50% identity, 90% coverage, and E-value threshold of 1e−10. The accession numbers of the proteins sequence best hits were recorded and subsequently used to retrieve the corresponding protein, CDS, and genomic sequences from the GenBank database. Data related to gene and protein sequence length, intron and exon number, and gene chromosome location for A. thaliana and tomato were retrieved directly from the NCBI database. Protein sequences were further subjected to physicochemical characterization: molecular weight (MW), isoelectrical point (pI), and protein length were analyzed using the Expasy ProtParam tool4. Subcellular localization analyses were performed using the complementary prediction tools: WoLF PSORT5 and Cell-PLoc 2.06 [17,26].
4.2. Multiple sequence alignment and phylogenetic analysis
To identify the interspecific and intraspecific homology, as well as to understand the evolutionary connections between SlNPF, SlNRT2, and SlAMT proteins in both, A. thaliana and tomato, a multiple sequence alignment analysis using the full-length amino acid sequences was conducted. This was performed using the ClustalW program with default alignment parameters [42]. Subsequently, an evolutionary relationships analysis was performed by constructing a neighbor-joining phylogenetic tree. This tree was generated based on the aligned protein sequences using the MEGA XI software. The tree construction utilized the Jones-Taylor-Thornton (JTT) model with 1000 bootstrap replications [29,33,43]. Finally, the online tool iTOL7 was used to generate the high-quality phylogenetic tree map.
4.3. Structure, conserved domain, and motif analysis of the SlNPF, SlNRT2, and SlAMT families
To gain insight into the diverse functionality of the SlNPF, SlNRT2, and SlAMT genes and proteins in tomato, a structural analysis was conducted to identify conserved structures associated with their functionality. The exon and intron structures of these genes were analyzed using the Gene Structure Display Server (GSDS)8 online tool. Additionally, conserved protein domains were identified using the online web tools InterPro9 and The Conserved Domain Database (CDD)10 with an E-value threshold ˂0.01. Finally, the most conserved protein motifs (twelve total) were identified using the web tool MEME11 . The analysis was configured to identify 12 conserved motifs and all other default parameters [26,44,45]. The software TBtools12 (v2.096) was used to visualize the conserved protein domains and motifs.
4.4. Chromosomal distribution analysis and gene duplication analysis
The chromosomal locations of the SlNPF, SlNRT2, and SlAMT genes were determined using the web tool MG2C13 (v2.1), utilizing physical chromosome location and length retrieved from NCBI. Gene duplication analysis for tomato was carried out through the MCScanX algorithm, using the software TBtools [26]. For all duplicated gene pairs, the nucleotide substitution parameters Ka (synonymous substitution rate) and Ks (non-synonymous substitution rate) were calculated. For this purpose, first, the corresponding CDS sequences were aligned using ClustalW with the software MegaXI. Subsequently, the Ka, Ks, and the Ka/Ks ratio were assessed using the Nei-Gojobori method (with the Jukes-Cantor substitution model) using the software MegaXI.
4.5. In silico analysis of gene expression responses to nitrogen deficiency
Gene expression profiles of the SlNPF, SlNRT2, and SlAMT families under nitrogen deficiency conditions were analyzed using public available RNA-seq data. The expression values, reported as Fragments Per Kilobase per Million mapped fragments (FPKM) were retrieved from the GEO-NCBI dataset (Shi and Huang, 2019; bioProject accession number PRJNA578768)14. The data set included leaf and root samples from two tomato genotypes (GO and GU) subjected to low nitrogen (LN) and optimal nitrogen (CT) supply for 1 and 7 days. To ensure consistency and comparability, the FPKM values of each gene were used to estimate the relative expression. For this purpose, FPKM values of target genes were normalized against the FPKM value of the reference gene SlACT-41 for each sample. All relative expression values were subsequently subjected to log10 transformation. A heat map was constructed using the software TBtools (v2.096).
4.6. Plant materials and treatments
The present study was conducted in two commercial greenhouses under soilless culture systems (SCSs) from April 2022 to February 2023. Both greenhouses are located in Queretaro, Mexico (20°42′22.5" N 99°56′27.6" W). They are of the gothic type, equipped with polyethylene roofs and side walls for passive ventilation, and are oriented from north to south. The total area of the greenhouses was 5000 m2 and 7500 m2 for N1 and N2 treatments, respectively. After 16 days of germination, seedlings of cultivar “Merlice” were grafted onto the commercial rootstock “Maxifort”. Two weeks later, the grafted plants were transplanted into commercial soilless grow bags (110 cm x 20 cm x 12 cm), which contained sterile coconut fiber as the growing substrate.
A drop irrigation system was used to supply nutrient solutions based on the Hoagland formula. The experiment consisted of two treatments with different concentrations of NO3¯ and NH4+, denominated as N1 and N2. Over 41 weeks after seedling transplantation (AST), the average NO3¯ concentration was 11.4 mM and 10.5 mM for N1 and N2, respectively. The average NH4+ concentration was 2.3 mM for N1 and 0.5 mM for N2. The average of electrical conductivity and pH of the nutrient solution were 2.9 mS cm−1 and 6.1 in the N1 treatment, and 1.9 mS cm−1 and 6.4 in the N2 treatment, respectively. Average day/night temperature, relative humidity, and radiation for both N1 and N2 treatments were 20.9/12.3 °C, 63.2/77.8% and 16,176 J cm−2, respectively.
4.7. Sample collection
Root (n=15 per time point) and leaf (n=15 per time point) samples were collected from plants grown under both N1 and N2 conditions at two distinct time points along the crop development: week 4 AST and week 8 AST. Root samples were collected ~20 cm away from the sprout union and shaken to remove substrate particles. The sixth fully expanded compound leaf was collected, considering the top compound leaf the first one. All individual samples collected at weeks 4 AST (n=15) and 8 AST (n=15) were pooled and subsequently clustered to form the final 3 composite biological replicates for each tissue (root and leaf) and treatment (N1 and N2). Each final composite biological replicate consisted of 10 individual samples, specifically comprising 5 samples from week 4 AST and 5 samples from week 8 AST. Once the biological replicates were prepared, they were placed in sterile sample bags and transported in a cooler (~4 °C) to the laboratory within 1.5 h of collection. Then, in the laboratory, they were immediately frozen with liquid nitrogen and stored at -80 °C.
4.8. Gene expression analysis (qRT-PCR)
4.8.1. RNA extraction, purification, and cDNA synthesis
Total RNA was extracted from the frozen samples of both root and leaf tissues using the Plant/Fungi Total RNA Purification Kit (NORGEN Biotek Crop. Cat. 25800), following the manufacturer´s guidelines. To maximize the RNA yield, the final elution step for RNA recovery was performed twice, as recommended by the manufacturer. RNA concentration and purity were subsequently verified using a NanoDrop spectrophotometer (260/280 nm). In order to remove gDNA residuals, the total RNA was treated with the TURBO DNA-freeTM Kit (Thermo Fisher Scientific. Cat. AM1907), specifically applying the rigorous DNase treatment protocol as per manufacturer´s guidelines. First-strand complementary DNA (cDNA) was synthesized using the Maxima First Strand cDNA Synthesis Kit for RT-qPCR (Thermo Fisher Scientific. Cat. K1641), following the manufacturer´s instructions. RNA concentration and purity were assessed using a NanoDrop spectrophotometer (260/280 nm).
4.8.2. Primer validation and gene expression quantification
Primer sequences for the target genes (SlNPF, SlNRT2, and SlAMT) and the internal reference gene, Actin (SlACT-41), are listed in Supplementary Table S1. Primer specificity and amplicon size were initially validated using standard RT-PCR. The reaction was performed using the Phire Green Hot Strat II DNA Polymerase (Thermo Fisher Scientific. Cat. F122S) using a C1000 Touch System, BIO-RAD. The PCR protocol was as follows: Initial denaturation (One cycle at 98 °C for 30 s), followed by 35 cycles as follows: denaturation (98 °C for 5 s), annealing (57 °C for 5 s), extension (72 °C for 15 s), and a final extension (One cycle at 72 °C for 1 min). PCR amplicons were examined on agarose gel (1.5% w/v) and visualized under UV light.
Gene expression quantification was performed via qRT-PCR using the PowerUpTM SYBR® Green Master Mix (Thermo Fisher Scientific. Cat. A25742) on a CFX96TM Real-Time System, BIO-RAD. The qRT-PCR amplification conditions were as follows: UDG activation (One cycle at 50 °C for 2 min) and polymerase activation (One cycle at 95 °C for 2 min), followed by 40 cycles as follows: denaturation (95 °C for 10 s), annealing (59 °C for 30 s), and extension (72 °C for 30 s). A final dissociation curve (50 to 95 °C) was generated to verify the primer specificity.
Gene expression was quantified using the absolute method based on standard curves, which were generated by plotting the Ct values against the cDNA concentration (ng) templete. The initial amplicon concentration (ng of amplicon) was obtained from the standard curves and used to estimate the number of copies (molecules) (absolute expression). Then, absolute expression was expressed as molecules per ng of total RNA. Relative expression was calculated by normalizing the absolute expression of the target genes to the absolute expression of the internal control gene (SlACT-41). For final data representation, the relative expression values of each gene were further normalized against the lowest recorded expression value across all treatments and tissues to ensure positive values before log10 transformation.
4.9. Physiological and enzymatic analysis
For nitrate content assessment, 0.125 g frozen samples were extracted with 6 mL of 10 mM potassium phosphate buffer (pH 8.2) containing 10 mM EDTA and 5 mM cysteine. The mixture was homogenized with an Ultra-Turrax (IKA, T-25D) at 10,000 rpm for 1 minute and centrifuged (5,100 rpm for 15 min). The reaction mixture consisted of 100 µL filtrate and 200 µL 5% salicylic acid in concentrated H2SO4. After 20 min of cooling at room temperature, 9.5 mL 2 M NaOH was added to raise the pH to 12. After cooling the reaction mixture at room temperature, the absorbance was measured at 410 nm. Nitrate content was measured using a calibration curve with KNO3 as a standard. The results were expressed in mg KNO3 * g−1 FW [46,47].
For nitrate reductase activity (NR) assessment, 0.2 g frozen samples were extracted with 8 mL of 25 mM sodium phosphate buffer (pH 7.4) containing 50 mM cysteine and 1 mM EDTA. The mixture was homogenized with an Ultra-Turrax (IKA, T-25D) at 10,000 rpm for 1 minute and centrifuged (8,000 rpm for 10 min). The reaction mixture consisted of 400 µL filtrate and 1200 µL of 100 mM sodium phosphate buffer (pH 7.5) containing 100 mM KNO3¯ and 400 µL of NADH solution (2 mg mL−1). After incubating at 30 °C for 30 min, 1 mL of 1% (w/v) p-aminobenzene sulfonic acid and 1 mL of 0.2% 1-Naftilamine were added. After cooling the mixture at room temperature for 20 min, the absorbance was recorded at 540 nm. The results were expressed in mg NO2¯ * g−1 Protein * h−1 [48,49,50].
For glutamine synthetase activity (GS) assessment, the extraction procedure was carried out as it was described in NR methodology. The reaction mixture consisted of 700 µL filtrate and 1600 µL of 100 mM Tris-HCl buffer (pH 7.4, 80 mM MgSO4, 20 mM sodium glutamate, 20 mM cysteine, 2 mM EDTA, and 80 mM hydroxylamine hydrochloride) and 700 µL of 40 mM ATP solution. After incubating at 25 °C for 15 min, 1 mL of chromogenic reagent (0.2 M trichloroacetic acid, 0.37 M FeCl3, 0.6 M HCl) was added. After incubating at 25 °C for 15 min, the reaction mixture was centrifuged at 5000 rpm for 10 min at 25 °C. Supernatant was collected, and the absorbance was measured at 540 nm. Reaction mixture without hydroxylamine hydrochloride was considered as the blank. The results were expressed in UGS * g−1 Protein * min−1. Protein content was estimated by the Bradford method [49,51,52,53].
For Chlorophyll content assessment, 0.2 g frozen samples were extracted with 25 mL of alcohol:acetone solution (v/v – 1:1). The mixture was homogenized with an Ultra-Turrax (IKA, T-25D) at 10,000 rpm for 1 minute and centrifuged (10,000 g for 1 min at 4 °C). The absorbance was measured at 663 and 645 nm using a UV-VIS spectrophotometer (PerkinElmer, UV/VIS Lambda 365) to estimate the total chlorophyll content expressed as mg Chl * g−1 FW [51,54].
4.10. Statistical analysis
All data are represented as the mean ± Standard Error (SE) of 3 biological replicates (n=3). The statistical analysis of the public FPKM data (bioProject accession number PRJNA578768) was performed using the statistical package JMP 8. A two-way ANOVA was applied to the log10 transformed expression values to test the main effect of the nitrogen treatment (LN vs. CT), regardless of genotype, tissue, or days of exposure to those conditions. Only genes demonstrating significant response to nitrogen treatment (p ˂ 0.05) were selected as being nitrogen-responsive and the Fold change of LN relative to CT was estimated. Experimental data from qRT-PCR, metabolite content, and enzyme activity were analyzed through the GraphPad Prism 10 package. Differences between N1 and N2 were evaluated within each tissue using the Student´s t-test (p ˂ 0.05).
5. Conclusions
In this study, we performed a comprehensive genomic and functional characterization of the SlNPF, SlNRT2, and SlAMT gene families in tomato. We demonstrated a clear mechanism where the leaf metabolic status regulates the nitrogen transport capacity from the roots through the differential expression patterns of SlNPF2.13 and SlNPF7.3 between roots and leaves. The observed accumulation of root nitrogen metabolites, resulting from a reduced leaf metabolic performance, confirms the role of these SlNPF members as critical nitrogen long-distance transport regulators. This knowledge is vital in the development of strategies to enhance NUE, specifically targeting the SlNPF family to promote a balanced nitrogen redistribution, leading to a more sustainable crop production.
Supplementary Materials
The following supporting information can be downloaded at the website of this paper posted on Preprints.org, Table S1: Sequences of the primer pairs used in the qRT-PCR analysis of the candidate genes; Table S2: Physicochemical properties of NPF, NRT2, and AMT families of A. thaliana and Solanum lycopersicum; Table S3: Ka/Ks values of SlNPF, SlNRT2, and SlAMT gene pairs duplicated genes in tomato; Table S4: Fold change values of SlNPF, SlNRT2, and SlAMT genes in root and leaf tissues with a significant response to LN condition relative to CT condition at days 1 and 7.
Author Contributions
J.P.L.V: Conceptualization, Data Curation, Formal Analysis, Funding Acquisition, Investigation, Methodology, Project Administration, Resources, Validation, Visualization, and Writing – Original Draft; M.I.N.G: Conceptualization, Formal Analysis, Investigation, Methodology, Validation, Visualization, and Writing – Review δ editing; X.G.M.B: Conceptualization, Investigation, Methodology, and Resources; A.R.F.S: Funding Acquisition, and Writing – Review δ editing; J.R.P.A: Conceptualization, Investigation, Methodology, and Resources; G.M.N.M: Conceptualization, Data Curation, Formal Analysis, Funding Acquisition, Investigation, Methodology, Project Administration, Resources, Supervision, Validation, Visualization, and Writing – Review δ editing; E.M.M.S: Conceptualization, Data Curation, Formal Analysis, Funding Acquisition, Investigation, Methodology, Project Administration, Resources, Supervision, Validation, Visualization and Writing – Review δ editing.
Funding
This research was funded by the Secretaría de Ciencia, Humanidades, Tecnología e Innovación (Secihti) through the postgraduate scholarship granted to the first author Juan Pablo Ledesma Valladolid (CVU. 854786).
Data Availability Statement
The authors declare that all relevant data supporting the findings of this study are included in this article.
Acknowledgments
We thanks to Dr. Gerardo Manuel Nava Morales for his mentorship and his invaluable support throughout this project, by facilitating the use of the facilities and equipment of the Molecular Microbiology Laboratory. I would like to express my special gratitude to Dr. Edmundo Mateo Mercado Silva for his invaluable mentorship throughout the realization of the present project. The writing and style of this manuscript was improved with the assistance of IA Gemini (Google).The authors have reviewed and edited the output and take full responsibility for the content of this publication.
Conflicts of Interest
The authors declare no conflicts of interest.
| 1 | Servier Medfical Art: (https://smart.servier.com/) |
| 2 | The Arabidopsis Information Resource (TAIR) database: (https://www.arabidopsis.org). |
| 3 | NCBI GenBank database: (https://www.ncbi.nlm.nih.gov/genbank). |
| 4 | Expasy ProtParam tool: (https://web.expasy.org/protparam/). |
| 5 | WoLF PSORT prediction tool: (https://www.genscript.com/wolf-psort.html). |
| 6 | Cell-PLoc 2.0 prediction tool: (http://www.csbio.sjtu.edu.cn/bioinf/Cell-PLoc-2/). |
| 7 | Online tool iTol: (https://itol.embl.de/). |
| 8 | Gene Structure Display Server (GSDS): (https://gsds.gao-lab.org/). |
| 9 | Online server InterPro: (https://www.ebi.ac.uk/interpro/). |
| 10 | NCBI Conserved Domain Database: (https://www.ncbi.nlm.nih.gov/Structure/cdd/wrpsb.cgi). |
| 11 | Web tool MEME for conserved protein motifs identification: (https://meme-suite.org/meme/tools/meme). |
| 12 | Software TBtools: (https://github.com/CJ-Chen/TBtools-II). |
| 13 | Online tool MG2C for chromosome mapping: (http://mg2c.iask.in/mg2c_v2.1/). |
| 14 | RNA-seq dataset from GEO-NCBI: (https://www.ncbi.nlm.nih.gov/geo/query/acc.cgi?acc=GSE139405). |
References
- Ali, A.; Jabeen, N.; Farruhbek, R.; Chachar, Z.; Laghari, A.A.; Chachar, S.; Ahmed, N.; Ahmed, S.; Yang, Z. Enhancing Nitrogen Use Efficiency in Agriculture by Integrating Agronomic Practices and Genetic Advances. Front. Plant Sci. 2025, 16. [Google Scholar] [CrossRef]
- Ding, L.; Lu, Z.; Gao, L.; Guo, S.; Shen, Q. Is Nitrogen a Key Determinant of Water Transport and Photosynthesis in Higher Plants Upon Drought Stress? Front. Plant Sci. 2018, 0. [Google Scholar] [CrossRef]
- Hong, Y.; Liu, R.; Xiang, W.; Lei, P.; Fang, X. Emergent Plants Improve Nitrogen Uptake Rates by Regulating the Activity of Nitrogen Assimilation Enzymes. Plants 2025, 14, 1484. [Google Scholar] [CrossRef]
- Singh, P.; Kumar, K.; Jha, A.K.; Yadava, P.; Pal, M.; Rakshit, S.; Singh, I. Global Gene Expression Profiling under Nitrogen Stress Identifies Key Genes Involved in Nitrogen Stress Adaptation in Maize (Zea Mays L.). Sci Rep 2022, 12, 4211. [Google Scholar] [CrossRef]
- The, S.V.; Snyder, R.; Tegeder, M. Targeting Nitrogen Metabolism and Transport Processes to Improve Plant Nitrogen Use Efficiency. Front. Plant Sci. 2021, 11, 628366. [Google Scholar] [CrossRef]
- Xuan, W.; Beeckman, T.; Xu, G. Plant Nitrogen Nutrition: Sensing and Signaling. Current Opinion in Plant Biology 2017, 39, 57–65. [Google Scholar] [CrossRef]
- Anas, M.; Liao, F.; Verma, K.K.; Sarwar, M.A.; Mahmood, A.; Chen, Z.-L.; Li, Q.; Zeng, X.-P.; Liu, Y.; Li, Y.-R. Fate of Nitrogen in Agriculture and Environment: Agronomic, Eco-Physiological and Molecular Approaches to Improve Nitrogen Use Efficiency. Biol Res 2020, 53, 47. [Google Scholar] [CrossRef]
- Coskun, D.; Britto, D.T.; Shi, W.; Kronzucker, H.J. Nitrogen Transformations in Modern Agriculture and the Role of Biological Nitrification Inhibition. Nature Plants 2017, 3, 17074. [Google Scholar] [CrossRef]
- Guo, J.; Jia, Y.; Chen, H.; Zhang, L.; Yang, J.; Zhang, J.; Hu, X.; Ye, X.; Li, Y.; Zhou, Y. Growth, Photosynthesis, and Nutrient Uptake in Wheat Are Affected by Differences in Nitrogen Levels and Forms and Potassium Supply. Sci Rep 2019, 9, 1248. [Google Scholar] [CrossRef]
- Aluko, O.O.; Kant, S.; Adedire, O.M.; Li, C.; Yuan, G.; Liu, H.; Wang, Q. Unlocking the Potentials of Nitrate Transporters at Improving Plant Nitrogen Use Efficiency. Front. Plant Sci. 2023, 14. [Google Scholar] [CrossRef] [PubMed]
- Xia, J.; Wang, Y.; Zhang, T.; Pan, C.; Ji, Y.; Zhou, Y.; Jiang, X. Genome-Wide Identification, Expression Profiling, and Functional Analysis of Ammonium Transporter 2 (AMT2) Gene Family in Cassava (Manihot Esculenta Crantz). Front. Genet. 2023, 14, 1145735. [Google Scholar] [CrossRef]
- Abouelsaad, I.; Weihrauch, D.; Renault, S. Effects of Salt Stress on the Expression of Key Genes Related to Nitrogen Assimilation and Transport in the Roots of the Cultivated Tomato and Its Wild Salt-Tolerant Relative. Scientia Horticulturae 2016, 211, 70–78. [Google Scholar] [CrossRef]
- Krapp, A.; David, L.C.; Chardin, C.; Girin, T.; Marmagne, A.; Leprince, A.-S.; Chaillou, S.; Ferrario-Méry, S.; Meyer, C.; Daniel-Vedele, F. Nitrate Transport and Signalling in Arabidopsis. Journal of Experimental Botany 2014, 65, 789–798. [Google Scholar] [CrossRef]
- Léran, S.; Varala, K.; Boyer, J.-C.; Chiurazzi, M.; Crawford, N.; Daniel-Vedele, F.; David, L.; Dickstein, R.; Fernandez, E.; Forde, B.; et al. A Unified Nomenclature of NITRATE TRANSPORTER 1/PEPTIDE TRANSPORTER Family Members in Plants. Trends in Plant Science 2014, 19, 5–9. [Google Scholar] [CrossRef]
- Léran, S.; Muños, S.; Brachet, C.; Tillard, P.; Gojon, A.; Lacombe, B. Arabidopsis NRT1.1 Is a Bidirectional Transporter Involved in Root-to-Shoot Nitrate Translocation. Molecular Plant 2013, 6, 1984–1987. [Google Scholar] [CrossRef]
- Lezhneva, L.; Kiba, T.; Feria-Bourrellier, A.-B.; Lafouge, F.; Boutet-Mercey, S.; Zoufan, P.; Sakakibara, H.; Daniel-Vedele, F.; Krapp, A. The Arabidopsis Nitrate Transporter NRT2.5 Plays a Role in Nitrate Acquisition and Remobilization in Nitrogen-Starved Plants. Plant J 2014, 80, 230–241. [Google Scholar] [CrossRef]
- Liu, J.; Wang, C.; Peng, J.; Ju, J.; Li, Y.; Li, C.; Su, J. Genome-Wide Investigation and Expression Profiles of the NPF Gene Family Provide Insight into the Abiotic Stress Resistance of Gossypium Hirsutum. Front. Plant Sci. 2023, 14, 1103340. [Google Scholar] [CrossRef]
- Xie, X.; Sun, Z.; Zhang, X.; Han, X. Novel Aspects of Regulation of Nitrogen Responses in the Tea Plant (Camellia Sinensis (L.)). Agronomy 2023, 13, 144. [Google Scholar] [CrossRef]
- Martínez-Martínez, A.; Botella, M.Á.; García-Legaz, M.F.; López-Gómez, E.; Amo, J.; Rubio, L.; Fernández, J.A.; Martínez, V.; Rubio, F.; Nieves-Cordones, M. SlNRT1.5 Transporter and the SlSKOR K+ Channel Jointly Contribute to K+ Translocation in Tomato Plants. Plant Stress 2024, 14, 100689. [Google Scholar] [CrossRef]
- Renau-Morata, B.; Molina, R.-V.; Minguet, E.G.; Cebolla-Cornejo, J.; Carrillo, L.; Martí, R.; García-Carpintero, V.; Jiménez-Benavente, E.; Yang, L.; Cañizares, J.; et al. Integrative Transcriptomic and Metabolomic Analysis at Organ Scale Reveals Gene Modules Involved in the Responses to Suboptimal Nitrogen Supply in Tomato. Agronomy 2021, 11, 1320. [Google Scholar] [CrossRef]
- Abenavoli, M.R.; Longo, C.; Lupini, A.; Miller, A.J.; Araniti, F.; Mercati, F.; Princi, M.P.; Sunseri, F. Phenotyping Two Tomato Genotypes with Different Nitrogen Use Efficiency. Plant Physiology and Biochemistry 2016, 107, 21–32. [Google Scholar] [CrossRef]
- Fu, Y.; Yi, H.; Bao, J.; Gong, J. LeNRT2.3 Functions in Nitrate Acquisition and Long-Distance Transport in Tomato. FEBS Letters 2015, 589, 1072–1079. [Google Scholar] [CrossRef]
- Lupini, A.; Princi, M.P.; Araniti, F.; Miller, A.J.; Sunseri, F.; Abenavoli, M.R. Physiological and Molecular Responses in Tomato under Different Forms of N Nutrition. Journal of Plant Physiology 2017, 216, 17–25. [Google Scholar] [CrossRef]
- Akbudak, M.A.; Filiz, E.; Çetin, D. Genome-Wide Identification and Characterization of High-Affinity Nitrate Transporter 2 (NRT2) Gene Family in Tomato (Solanum Lycopersicum) and Their Transcriptional Responses to Drought and Salinity Stresses. J Plant Physiol 2022, 272, 153684. [Google Scholar] [CrossRef]
- Zhang, H.; Li, Z.; Xu, G.; Bai, G.; Zhang, P.; Zhai, N.; Zheng, Q.; Chen, Q.; Liu, P.; Jin, L.; et al. Genome-Wide Identification and Characterization of NPF Family Reveals NtNPF6.13 Involving in Salt Stress in Nicotiana Tabacum. Front. Plant Sci. 2022, 13. [Google Scholar] [CrossRef]
- Puccio, G.; Ingraffia, R.; Giambalvo, D.; Frenda, A.S.; Harkess, A.; Sunseri, F.; Mercati, F. Exploring the Genetic Landscape of Nitrogen Uptake in Durum Wheat: Genome-Wide Characterization and Expression Profiling of NPF and NRT2 Gene Families. Front. Plant Sci. 2023, 14, 1302337. [Google Scholar] [CrossRef]
- Chao, H.; He, J.; Cai, Q.; Zhao, W.; Fu, H.; Hua, Y.; Li, M.; Huang, J. The Expression Characteristics of NPF Genes and Their Response to Vernalization and Nitrogen Deficiency in Rapeseed. IJMS 2021, 22, 4944. [Google Scholar] [CrossRef]
- Jia, L.; Hu, D.; Wang, J.; Liang, Y.; Li, F.; Wang, Y.; Han, Y. Genome-Wide Identification and Functional Analysis of Nitrate Transporter Genes (NPF, NRT2 and NRT3) in Maize. IJMS 2023, 24, 12941. [Google Scholar] [CrossRef]
- Liu, J.; Wang, C.; Peng, J.; Ju, J.; Li, Y.; Li, C.; Su, J. Genome-Wide Investigation and Expression Profiles of the NPF Gene Family Provide Insight into the Abiotic Stress Resistance of Gossypium Hirsutum. Front. Plant Sci. 2023, 14. [Google Scholar] [CrossRef]
- Wang, Q.; Liu, C.; Dong, Q.; Huang, D.; Li, C.; Li, P.; Ma, F. Genome-Wide Identification and Analysis of Apple NITRATE TRANSPORTER 1/PEPTIDE TRANSPORTER Family (NPF) Genes Reveals MdNPF6.5 Confers High Capacity for Nitrogen Uptake under Low-Nitrogen Conditions. Int J Mol Sci 2018, 19, 2761. [Google Scholar] [CrossRef]
- Wang, X.; Cai, X.; Xu, C.; Wang, Q. Identification and Characterization of the NPF, NRT2 and NRT3 in Spinach. Plant Physiology and Biochemistry 2021, 158, 297–307. [Google Scholar] [CrossRef]
- Yang, X.; Xia, X.; Zeng, Y.; Nong, B.; Zhang, Z.; Wu, Y.; Tian, Q.; Zeng, W.; Gao, J.; Zhou, W.; et al. Genome-Wide Identification of the Peptide Transporter Family in Rice and Analysis of the PTR Expression Modulation in Two near-Isogenic Lines with Different Nitrogen Use Efficiency. BMC Plant Biol 2020, 20, 1–15. [Google Scholar] [CrossRef]
- Deng, Q.-Y.; Luo, J.-T.; Zheng, J.-M.; Tan, W.-F.; Pu, Z.-J.; Wang, F. Genome-Wide Systematic Characterization of the NRT2 Gene Family and Its Expression Profile in Wheat (Triticum Aestivum L.) during Plant Growth and in Response to Nitrate Deficiency. BMC Plant Biol 2023, 23, 353. [Google Scholar] [CrossRef]
- Nuruzzaman, M.; Gupta, M.; Zhang, C.; Wang, L.; Xie, W.; Xiong, L.; Zhang, Q.; Lian, X. Sequence and Expression Analysis of the Thioredoxin Protein Gene Family in Rice. Mol Genet Genomics 2008, 280, 139–151. [Google Scholar] [CrossRef]
- Drew, D.; North, R.A.; Nagarathinam, K.; Tanabe, M. Structures and General Transport Mechanisms by the Major Facilitator Superfamily (MFS). Chem. Rev. 2021, 121, 5289–5335. [Google Scholar] [CrossRef]
- Reddy, V.S.; Shlykov, M.A.; Castillo, R.; Sun, E.I.; Saier, M.H. The Major Facilitator Superfamily (MFS) Revisited. FEBS J 2012, 279, 2022–2035. [Google Scholar] [CrossRef]
- Ss, P.; It, P.; Mh, S. Major Facilitator Superfamily. Microbiology and molecular biology reviews : MMBR 1998, 62, 1–34. [Google Scholar] [CrossRef]
- Babst, B.A.; Gao, F.; Acosta-Gamboa, L.M.; Karve, A.; Schueller, M.J.; Lorence, A. Three NPF Genes in Arabidopsis Are Necessary for Normal Nitrogen Cycling under Low Nitrogen Stress. Plant Physiology and Biochemistry 2019, 143, 1–10. [Google Scholar] [CrossRef]
- Almagro, A.; Lin, S.H.; Tsay, Y.F. Characterization of the Arabidopsis Nitrate Transporter NRT1. 6 Reveals a Role of Nitrate in Early Embryo Development. 2008. [Google Scholar]
- Fan, S.-C.; Lin, C.-S.; Hsu, P.-K.; Lin, S.-H.; Tsay, Y.-F. The Arabidopsis Nitrate Transporter NRT1.7, Expressed in Phloem, Is Responsible for Source-to-Sink Remobilization of Nitrate. The Plant Cell 2009, 21, 2750–2761. [Google Scholar] [CrossRef]
- Liu, C.; Hao, D.; Sun, R.; Zhang, Y.; Peng, Y.; Yuan, Y.; Jiang, K.; Li, W.; Wen, X.; Guo, H. Arabidopsis NPF2.13 Functions as a Critical Transporter of Bacterial Natural Compound Tunicamycin in Plant–Microbe Interaction. New Phytologist 2023, 238, 765–780. [Google Scholar] [CrossRef]
- Qian, L.-H.; Wang, Y.; Chen, M.; Liu, J.; Lu, R.-S.; Zou, X.; Sun, X.-Q.; Zhang, Y.-M. Genome-Wide Identification and Evolutionary Analysis of NBS-LRR Genes From Secale Cereale. Front. Genet. 2021, 12, 771814. [Google Scholar] [CrossRef]
- Xi, Y.; Hu, W.; Zhou, Y.; Liu, X.; Qian, Y. Genome-Wide Identification and Functional Analysis of Polyamine Oxidase Genes in Maize Reveal Essential Roles in Abiotic Stress Tolerance. Front. Plant Sci. 2022, 13, 950064. [Google Scholar] [CrossRef]
- Jin, J.F.; Wang, Z.Q.; He, Q.Y.; Wang, J.Y.; Li, P.F.; Xu, J.M.; Zheng, S.J.; Fan, W.; Yang, J.L. Genome-Wide Identification and Expression Analysis of the NAC Transcription Factor Family in Tomato (Solanum Lycopersicum) during Aluminum Stress. BMC Genomics 2020, 21, 288. [Google Scholar] [CrossRef]
- Mo, C.; Wan, S.; Xia, Y.; Ren, N.; Zhou, Y.; Jiang, X. Expression Patterns and Identified Protein-Protein Interactions Suggest That Cassava CBL-CIPK Signal Networks Function in Responses to Abiotic Stresses. Front. Plant Sci. 2018, 9, 269. [Google Scholar] [CrossRef]
- Cataldo, D.A.; Maroon, M.; Schrader, L.E.; Youngs, V.L. Rapid Colorimetric Determination of Nitrate in Plant Tissue by Nitration of Salicylic Acid. Communications in Soil Science and Plant Analysis 1975, 6, 71–80. [Google Scholar] [CrossRef]
- Yu, L.-H.; Wu, J.; Tang, H.; Yuan, Y.; Wang, S.-M.; Wang, Y.-P.; Zhu, Q.-S.; Li, S.-G.; Xiang, C.-B. Overexpression of Arabidopsis NLP7 Improves Plant Growth under Both Nitrogen-Limiting and -Sufficient Conditions by Enhancing Nitrogen and Carbon Assimilation. Sci Rep 2016, 6, 27795. [Google Scholar] [CrossRef]
- Iqbal, A.; Dong, Q.; Wang, X.; Gui, H.; Zhang, H.; Zhang, X.; Song, M. Transcriptome Analysis Reveals Differences in Key Genes and Pathways Regulating Carbon and Nitrogen Metabolism in Cotton Genotypes under N Starvation and Resupply. IJMS 2020, 21, 1500. [Google Scholar] [CrossRef]
- Iqbal, A.; Qiang, D.; Zhun, W.; Xiangru, W.; Huiping, G.; Hengheng, Z.; Nianchang, P.; Xiling, Z.; Meizhen, S. Growth and Nitrogen Metabolism Are Associated with Nitrogen-Use Efficiency in Cotton Genotypes. Plant Physiology and Biochemistry 2020, 149, 61–74. [Google Scholar] [CrossRef]
- Ren, B.; Dong, S.; Zhao, B.; Liu, P.; Zhang, J. Responses of Nitrogen Metabolism, Uptake and Translocation of Maize to Waterlogging at Different Growth Stages. Front. Plant Sci. 2017, 8, 1216. [Google Scholar] [CrossRef]
- Zhong, C.; Cao, X.; Hu, J.; Zhu, L.; Zhang, J.; Huang, J.; Jin, Q. Nitrogen Metabolism in Adaptation of Photosynthesis to Water Stress in Rice Grown under Different Nitrogen Levels. Front. Plant Sci. 2017, 8, 1079. [Google Scholar] [CrossRef]
- Wang, G.; Ding, G.; Li, L.; Cai, H.; Ye, X.; Zou, J.; Xu, F. Identification and Characterization of Improved Nitrogen Efficiency in Interspecific Hybridized New-Type Brassica Napus. Annals of Botany 2014, 114, 549–559. [Google Scholar] [CrossRef] [PubMed]
- Bradford, M.M. A Rapid and Sensitive Method for the Quantitation of Microgram Quantities of Protein Utilizing the Principle of Protein-Dye Binding. Analytical Biochemistry 1976, 72, 248–254. [Google Scholar] [CrossRef] [PubMed]
- Wu, Y.; Li, Q.; Jin, R.; Chen, W.; Liu, X.; Kong, F.; Ke, Y.; Shi, H.; Yuan, J. Effect of Low-Nitrogen Stress on Photosynthesis and Chlorophyll Fluorescence Characteristics of Maize Cultivars with Different Low-Nitrogen Tolerances. Journal of Integrative Agriculture 2019, 18, 1246–1256. [Google Scholar] [CrossRef]
Figure 1.
Phylogenetic tree of NPF, NRT2, and AMT proteins of tomato and A. thaliana. The phylogenetic analysis was generated using the neighbor-joining method of MEGA XI software (1000 bootstrap replicates). The NPF family was divided into eight subfamilies, representing each one by one color.
Figure 1.
Phylogenetic tree of NPF, NRT2, and AMT proteins of tomato and A. thaliana. The phylogenetic analysis was generated using the neighbor-joining method of MEGA XI software (1000 bootstrap replicates). The NPF family was divided into eight subfamilies, representing each one by one color.
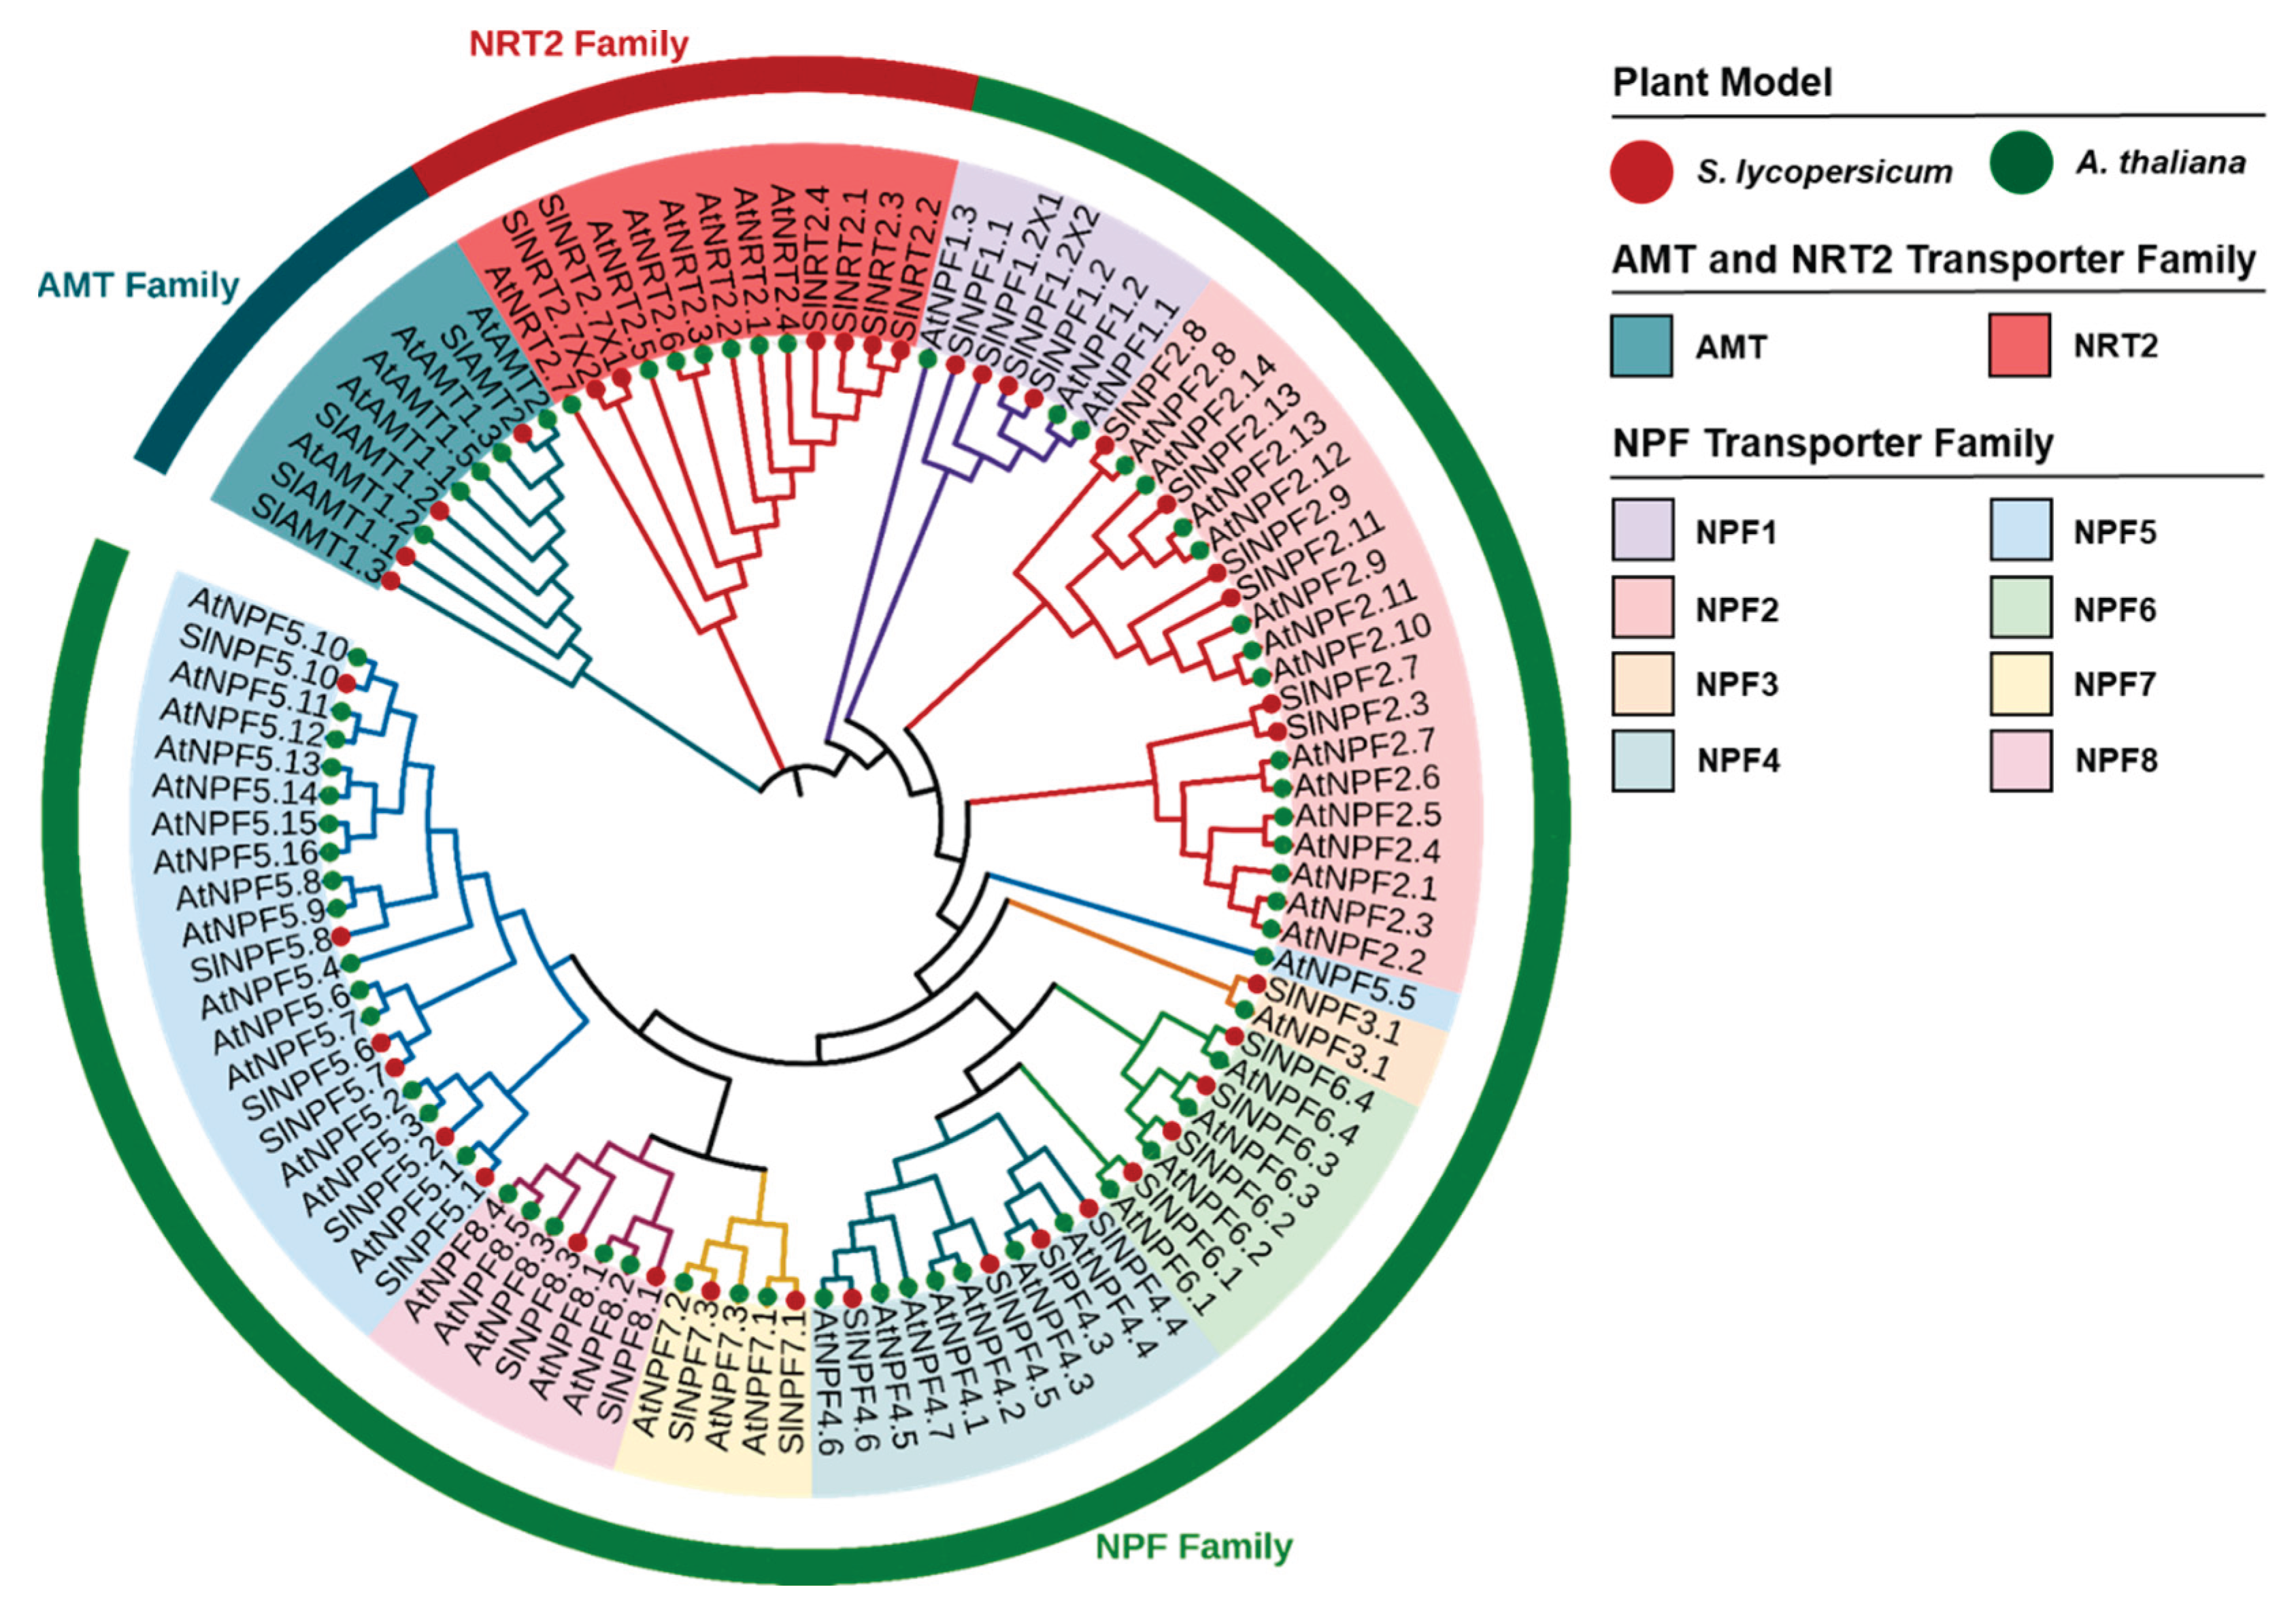
Figure 2.
Phylogenetic relationships, gene structures, protein motif and domain structure analysis of SlNPF, SlNRT2, and SlAMT families. (A) Unrooted phylogenetic tree and exon/intron structure of SlNPF, SlNRT2, and SlAMT genes. (B) Conserved motifs of SlNPF, SlNRT2, and SlAMT proteins. (C) Conserved domains of SlNPF, SlNRT2, and SlAMT proteins. TMR, Transmembrane region protein related to the conserved protein motifs.
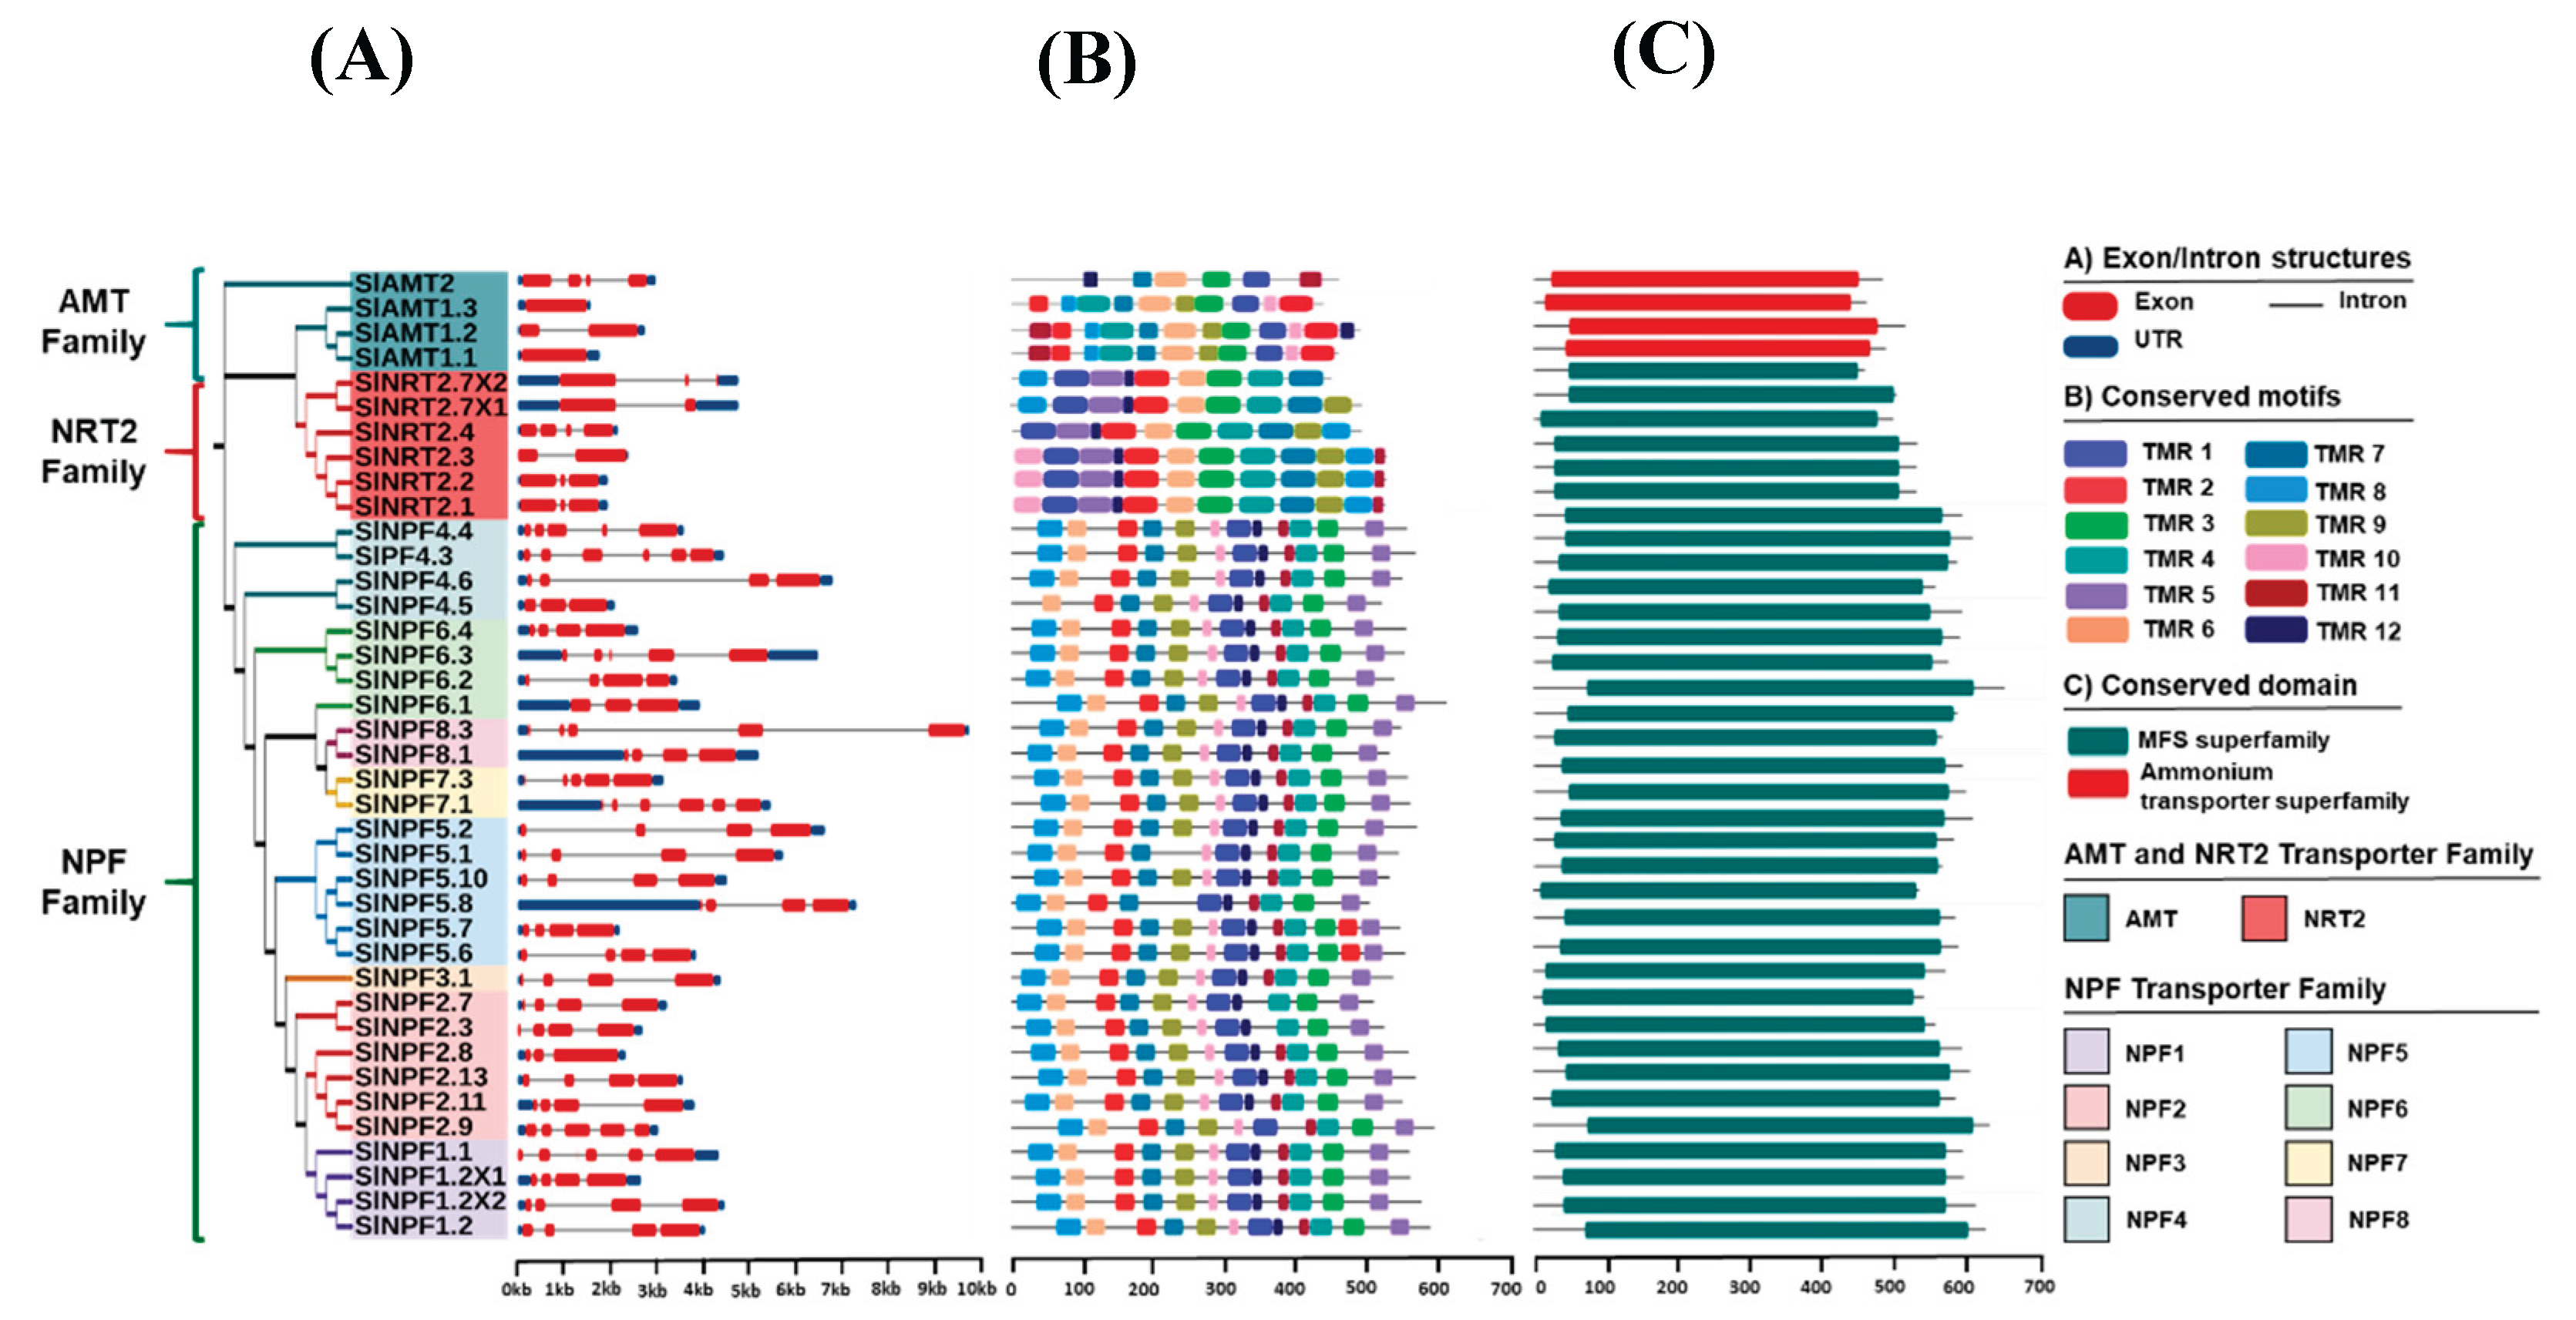
Figure 3.
(A) Distribution of SlNPF, SlNRT2 and SlAMT genes on chromosomes. The names of each chromosome are shown above. The gene names are indicated on the right side of each chromosomes. SlNRT2, SlAMT and SlNPF gene subfamilies are specified by the same color. The chromosome lengths are shown in Mb (Millions of bases). (B) Gene duplication analysis of SlNPF, SlNRT2, and SlAMT genes in S. lycopersicum/S. lycopersicum.
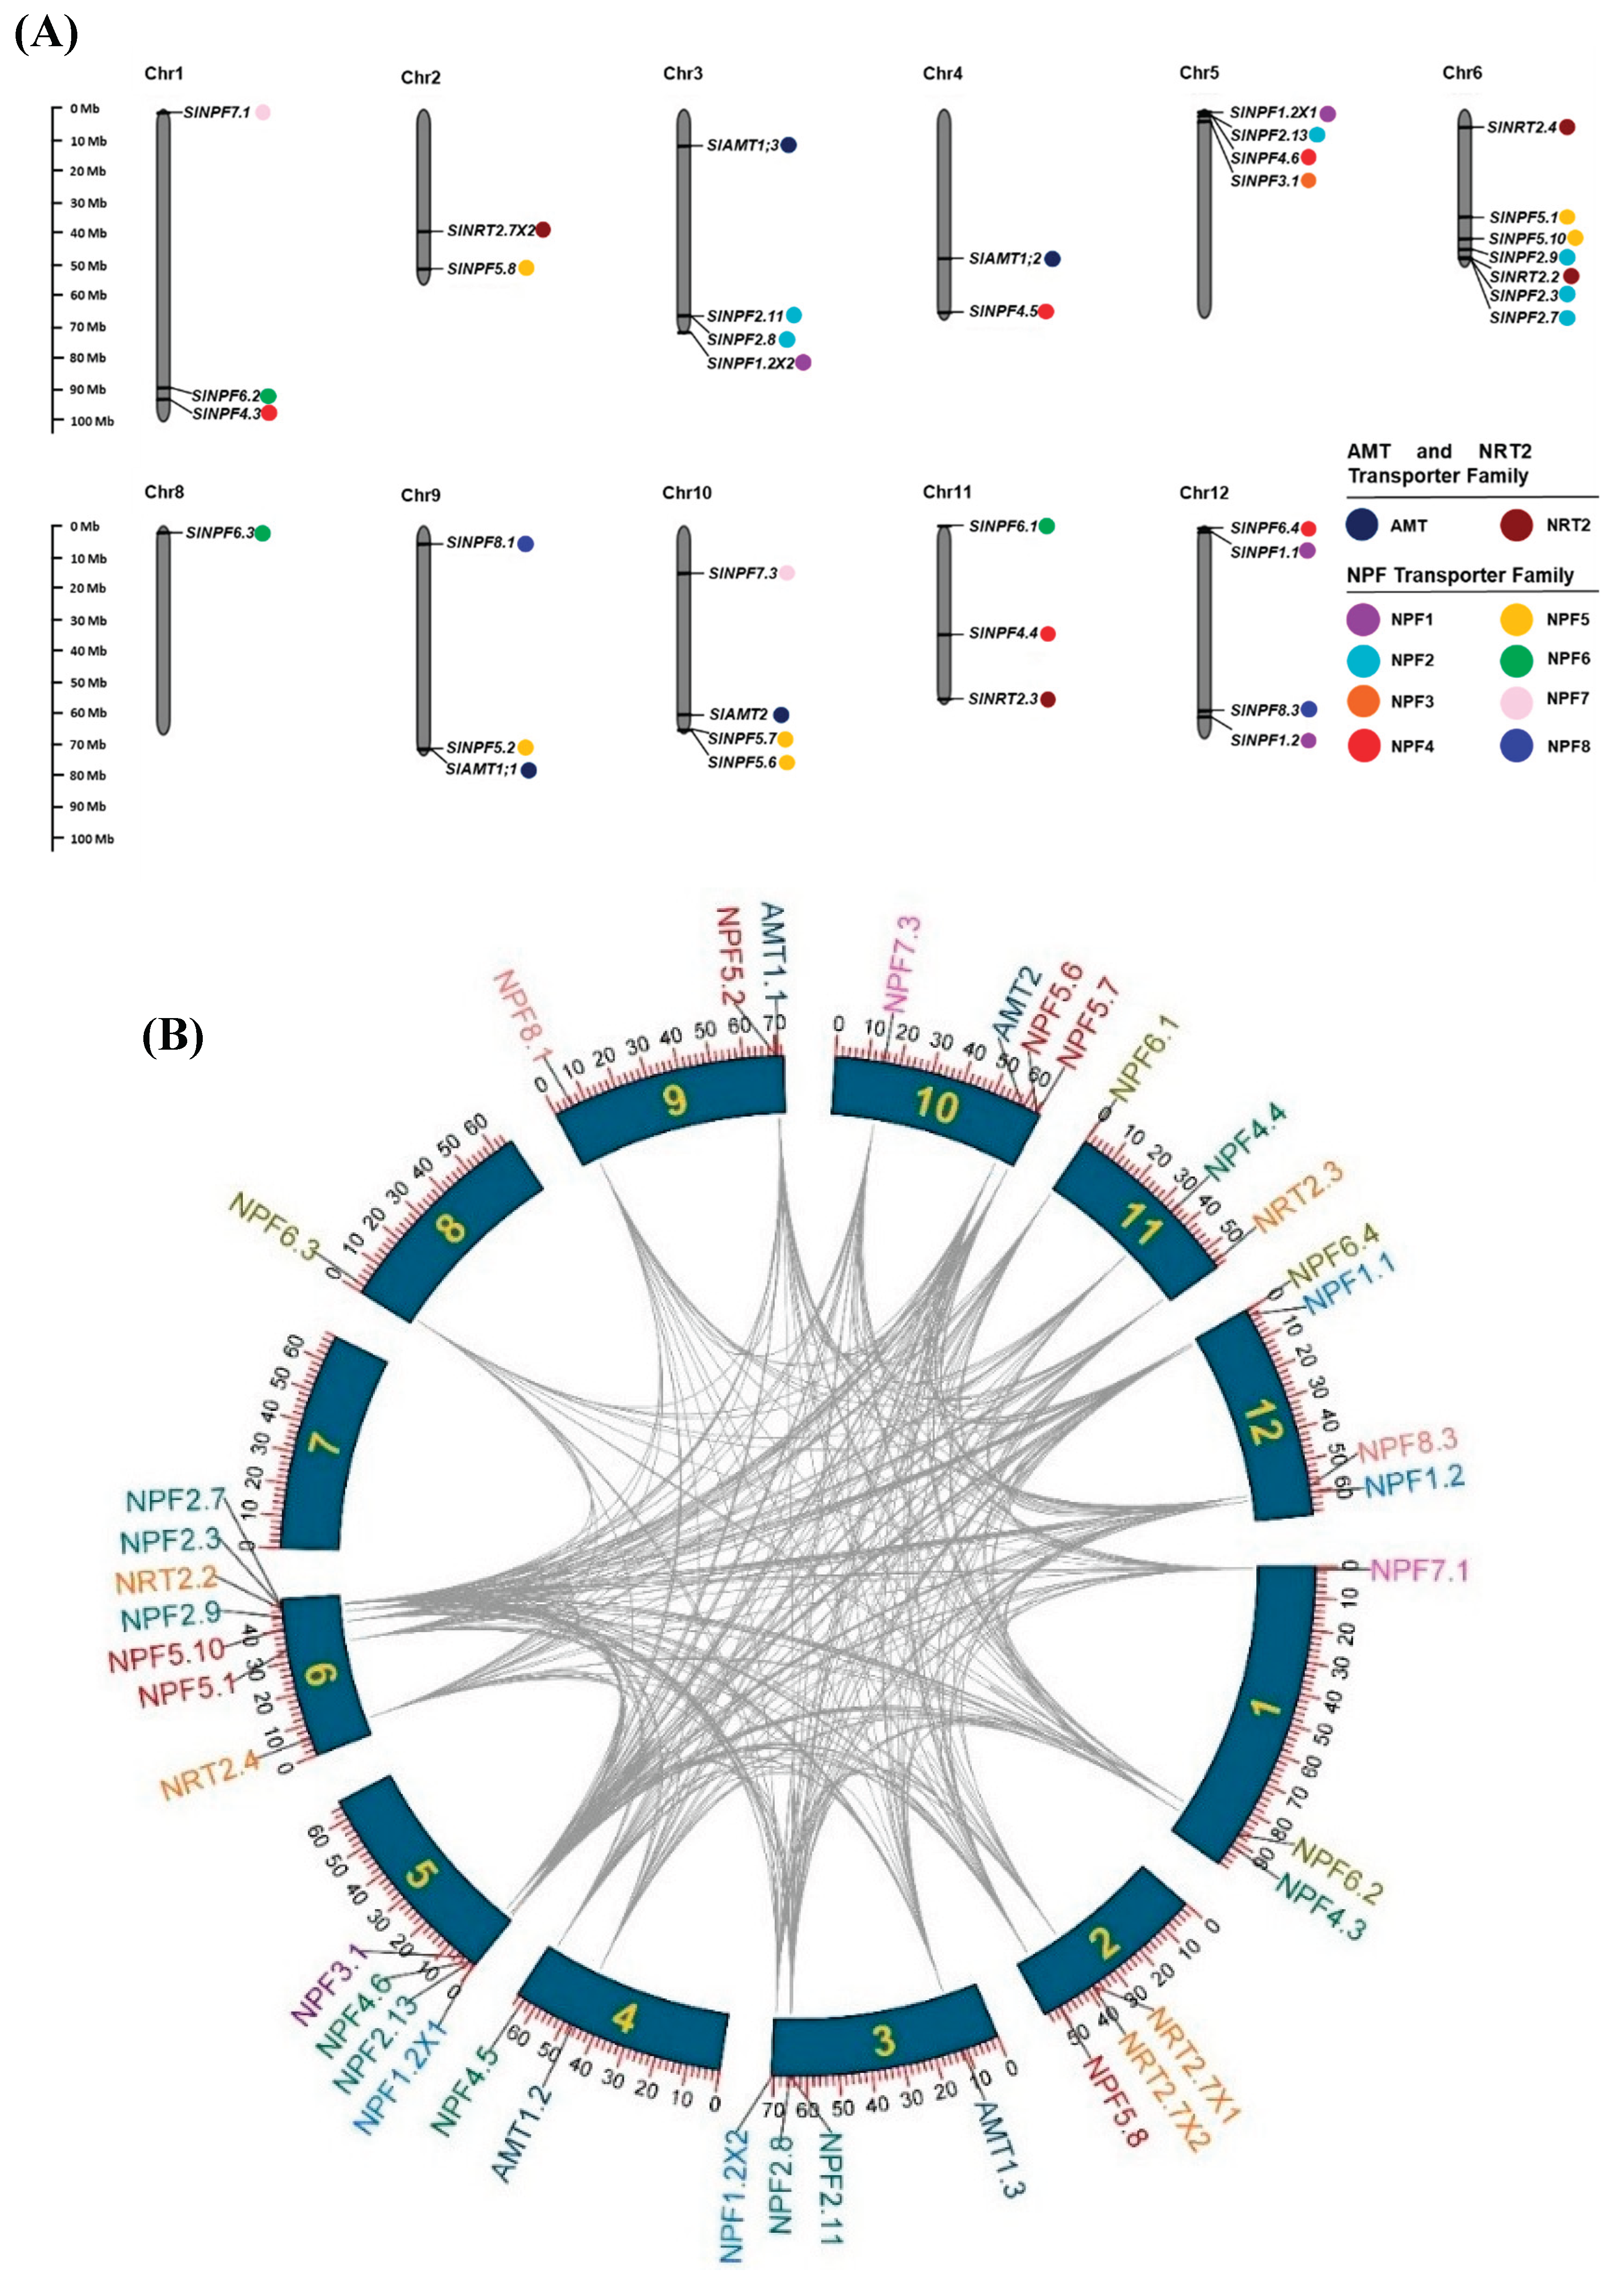
Figure 4.
Integrated transcriptomic and functional characterization of N transporter families (SlNPF, SlNRT2, and SlAMT) and nitrogen metabolism in tomato. (A-D) initial Heat Maps of RNA-seq gene expression profiles (bioProject accession number PRJNA578768), showing the effect of nitrogen availability (LN and CT), time to exposure to treatments (1 and 7 days. 1D and 7D, respectively), and tomato genotype (GO and GU) on the SlNPF, SlNRT2, and SlAMT gene families in root and leaf tissues. FPKM values were normalized in function to Actine (SlACT-41) as internal control and transformed to Log2 values. The gene expression levels range from low gene expression (blue) to high gene expression (red). Each treatment was composed of three replicates and subjected to ANOVA analysis and Tukey test (p≤0.05). (E-G) Show subsequent heat maps representing the Fold Change (LN relative to CT) for genes that responded significantly to N treatment in root and leaf tissues (p≤0.05). (H and I) relative expression patterns of the key SlNPF2.13 and SlNPF7.3 genes, measured by qRT-PCR under two commercial high N conditions (N1 and N2) in root and leaf tissues. (J-P) Integrated physiological and enzymatic analysis in root and leaf tissues: (J and M) NO3¯ content in root and leaf tissues, respectively. (K and N) NR activity in root and leaf tissues, respectively. (L and O) GS activity in root and leaf tissues, respectively. (P) Chlorophyll content in leaf tissues. N1 condition samples are represented by black gray bars and N2 by blue bars. All bar graphs represent the mean ± Standard Error (SE) of three biological samples (n = 3), and statistical significance (p≤0.05) between N1 and N2 treatments within each tissues was determined using Student´s t-test.
Disclaimer/Publisher’s Note: The statements, opinions and data contained in all publications are solely those of the individual author(s) and contributor(s) and not of MDPI and/or the editor(s). MDPI and/or the editor(s) disclaim responsibility for any injury to people or property resulting from any ideas, methods, instructions or products referred to in the content. |
© 2025 by the authors. Licensee MDPI, Basel, Switzerland. This article is an open access article distributed under the terms and conditions of the Creative Commons Attribution (CC BY) license (http://creativecommons.org/licenses/by/4.0/).
Copyright: This open access article is published under a Creative Commons CC BY 4.0 license, which permit the free download, distribution, and reuse, provided that the author and preprint are cited in any reuse.


