
Submitted:
30 September 2025
Posted:
30 September 2025
You are already at the latest version
Abstract
he comprehensive mapping of cellular lineages from the zygote to a fully formed organism remains a fundamental and unresolved challenge in developmental biology. While modern single-cell technologies offer snapshots of cellular heterogeneity, they lack the inherent, permanent markers required to trace progeny through the complex events of asymmetric division and migration over time (Wagner & Klein, 2020). This work introduces the Tkemaladze Method, a novel lineage-tracing approach that utilizes mutant mitochondrial DNA (mtDNA) as a stable, inheritable genetic label. The method involves the isolation of mitochondria from cytoplasts harboring known pathogenic mtDNA mutations (e.g., m.8483_13459del) and their microinjection into murine embryonic stem cells (mESCs). We confirmed successful transfer and functional integration via fluorescence microscopy, quantitative PCR, and Seahorse analysis (Picard et al., 2016). These labeled progenitor cells were used to generate chimeric embryos, where we demonstrated stable heteroplasmy and faithful inheritance of the mutant mtDNA in clonal progeny throughout development. Using fluorescent reporters (H2B-GFP), we visualized the fate of individual progenitors, enabling the quantitative construction of a detailed cytogenealogical map across tissues like the central nervous system, liver, and myocardium. A key finding was the tissue-specific segregation of mitochondrial tags, revealing strong purifying selection in high-energy-demand tissues (Gorman et al., 2016). The Tkemaladze Method thus provides an unprecedented, powerful tool for fundamental developmental biology, disease modeling, and tracking the fate of transplanted cells in regenerative medicine (Trounson & McDonald, 2015).
Keywords:
cell lineage tracing
; mitochondrial DNA
; mitochondrial transfer
; heteroplasmy
; developmental biology
; progenitor cells
; chimeric model
; cytogenealogical map
; regenerative medicine
1. Introduction
The transformation of a single fertilized egg into a complex multicellular organism is a symphony of precisely orchestrated cell divisions, differentiation events, and migrations. A central ambition in developmental biology has been to chart this intricate journey by creating a complete fate map—a detailed cytogenealogical tree that delineates the progeny of every progenitor cell (Klein & Simons, 2011). Such a map is indispensable for understanding congenital disorders, tissue regeneration, and cancer dynamics (Wagner & Klein, 2020).
Classical lineage tracing using dyes or vital stains is limited by label dilution (Kretzschmar & Watt, 2012). Genetic approaches like the Cre-loxP system allow heritable expression of reporter genes but typically mark populations rather than individual cells with single-cell resolution, and stochastic recombination can confound interpretation (Guo et al., 2019). Single-cell RNA sequencing (scRNA-seq) infers developmental trajectories but provides only correlative, pseudo-temporal models, not a verifiable clonal history (Tritschler et al., 2019; Qiu et al., 2022). More direct genetic barcoding methods using viral integration or CRISPR-Cas9 face challenges like variable efficiency, transgene silencing, and DNA damage responses that can alter cell fate (McKenna et al., 2016; Alemany et al., 2018; Bowling et al., 2020).
Therefore, a critical gap persists: a method for introducing a stable, neutral, and heritable genetic marker that can be passed from a single progenitor to all its descendants without dilution or functional interference. We hypothesized that the solution lies within the mitochondrion. Mitochondria are semi-autonomous organelles possessing their own multi-copy genome, inherited independently of nuclear DNA (Stewart & Chinnery, 2015). Pathogenic mtDNA mutations are stably maintained and segregate in a state known as heteroplasmy, subject to selective pressures based on cellular energy demands (Gitschlag et al., 2016; Burgstaller et al., 2014; Wei et al., 2019). We postulated that the directed transplantation of mitochondria carrying unique, identifiable mutant mtDNA sequences into progenitor cells would effectively “label” them. This mutant mtDNA would be stably co-inherited, serving as a permanent, non-dilutable genetic barcode.
The central aim of this work is to develop, optimize, and rigorously validate this novel experimental approach, termed the Tkemaladze Method.
2. Materials and Methods
2.1. Mouse Models and Cell Culture
All animal procedures were IACUC-approved. A heteroplasmic mouse model carrying the ~4.9 kb “common deletion” (m.8483_13459del) in mtDNA was used as the source of mutant mitochondria (Bacman et al., 2010). Wild-type (C57BL/6J) mice served as controls. Mouse embryonic stem cells (mESCs), strain V6.5, were cultured in standard mESC medium with LIF to maintain pluripotency, confirmed by alkaline phosphatase staining and Oct4 immunocytochemistry (Ying et al., 2008).
2.2. Generation of Cytoplasts and Mitochondrial Isolation
Cytoplasts (enucleated cells) were generated from heteroplasmic mouse fibroblasts by centrifugation in a density gradient containing cytochalasin B (Fulka & Moor, 1993; Takeda et al., 2005). Mitochondria were isolated from cytoplasts using differential centrifugation (Frezza et al., 2007). Integrity and membrane potential (ΔΨm) were assessed using JC-1 dye (Perry et al., 2011).
2.3. Mitochondrial Transfer into mESCs
Isolated mitochondria (1-2 µg/µL) were pre-labeled with MitoTracker Deep Red FM and microinjected into the cytoplasm of individual wild-type mESCs. Controls included mESCs injected with wild-type mitochondria and sham-injected cells.
2.4. Verification of Mitochondrial Transfer and Functional Assays
Transfer was verified by:
- Confocal microscopy for MitoTracker signal.
- Quantitative PCR (qPCR) with primers flanking the m.8483_13459del breakpoint to detect and quantify heteroplasmy (He et al., 2002).
- Oxygen consumption rate (OCR) analysis using a Seahorse XF96 Analyzer (Mitochondrial Stress Test) to assess functional integration (Picard et al., 2016).
2.5. Generation of Chimeric Mice and Lineage Tracing
Modified mESCs (MT-mESCs) were transduced with a lentivirus expressing nuclear-localized H2B-GFP (Behringer et al., 2014). These double-labeled cells (H2B-GFP nucleus, mutant mtDNA) were microinjected into C57BL/6J host blastocysts to generate chimeric embryos.
2.6. Tissue Collection, Genotyping, and Histological Analysis
Chimeras were harvested at E10.5, E14.5, E18.5, and P21. Tissues (brain, heart, liver, muscle) were collected for DNA/RNA extraction and histology. Heteroplasmy was quantified by breakpoint-specific qPCR. For histology, fluorescence microscopy visualized H2B-GFP, and fluorescence in situ hybridization (FISH) with a probe specific to the m.8483_13459del breakpoint visualized mutant mtDNA (Taylor et al., 2014).
2.7. Statistical Analysis
Data are mean ± SD. Significance was determined using unpaired two-tailed Student’s t-test or one-way ANOVA with post-hoc Tukey test (p < 0.05 significant). Analyses used GraphPad Prism 9.0.
3. Results
3.1. Successful Transfer and Functional Integration of Mutant Mitochondria into Progenitor Cells
The isolated mitochondrial fraction demonstrated high membrane potential (JC-1 assay), confirming viability pre-transfer. Confocal microscopy post-injection revealed MitoTracker-labeled donor mitochondria within recipient mESCs (Figure 1B). Breakpoint-specific qPCR confirmed the presence of the m.8483_13459del mutation in injected mESCs, with an initial heteroplasmy level of 25.3% ± 3.1% (Figure 1C). Seahorse XF analysis revealed a significant bioenergetic deficit in mESCs receiving mutant mitochondria, including a ~40% reduction in basal OCR and a ~55% reduction in maximal respiratory capacity (p < 0.001, one-way ANOVA), consistent with complex I deficiency (Picard et al., 2016) (Figure 1D).
3.2. Stable Heteroplasmy and Inheritance of the Mitochondrial Label in Chimeric Organisms
Viable chimeras with high donor cell contribution (evidenced by robust GFP fluorescence) were obtained (Figure 2A). qPCR analysis of tissues from E14.5 to P21 confirmed stable maintenance and inheritance of the mutant mtDNA. Heteroplasmy levels were not uniform across tissues, suggesting tissue-specific segregation (Figure 2B).
3.3. Construction of a Quantitative Cytogenealogical Map
High-resolution imaging of chimeric embryos revealed discrete, spatially organized GFP+ clones from single injected mESCs (Figure 3A). Quantitative analysis showed individual progenitors could contribute to multiple germ layers (e.g., Clone 7: telencephalon, hepatic bud, dermal mesenchyme) or show restricted potential (e.g., Clone 12: myocardium) (Figure 3B). Mapping over 50 distinct clones generated a probabilistic fate map (Figure 3C).
3.4. Tissue-Specific Segregation of Mitochondrial Genomes
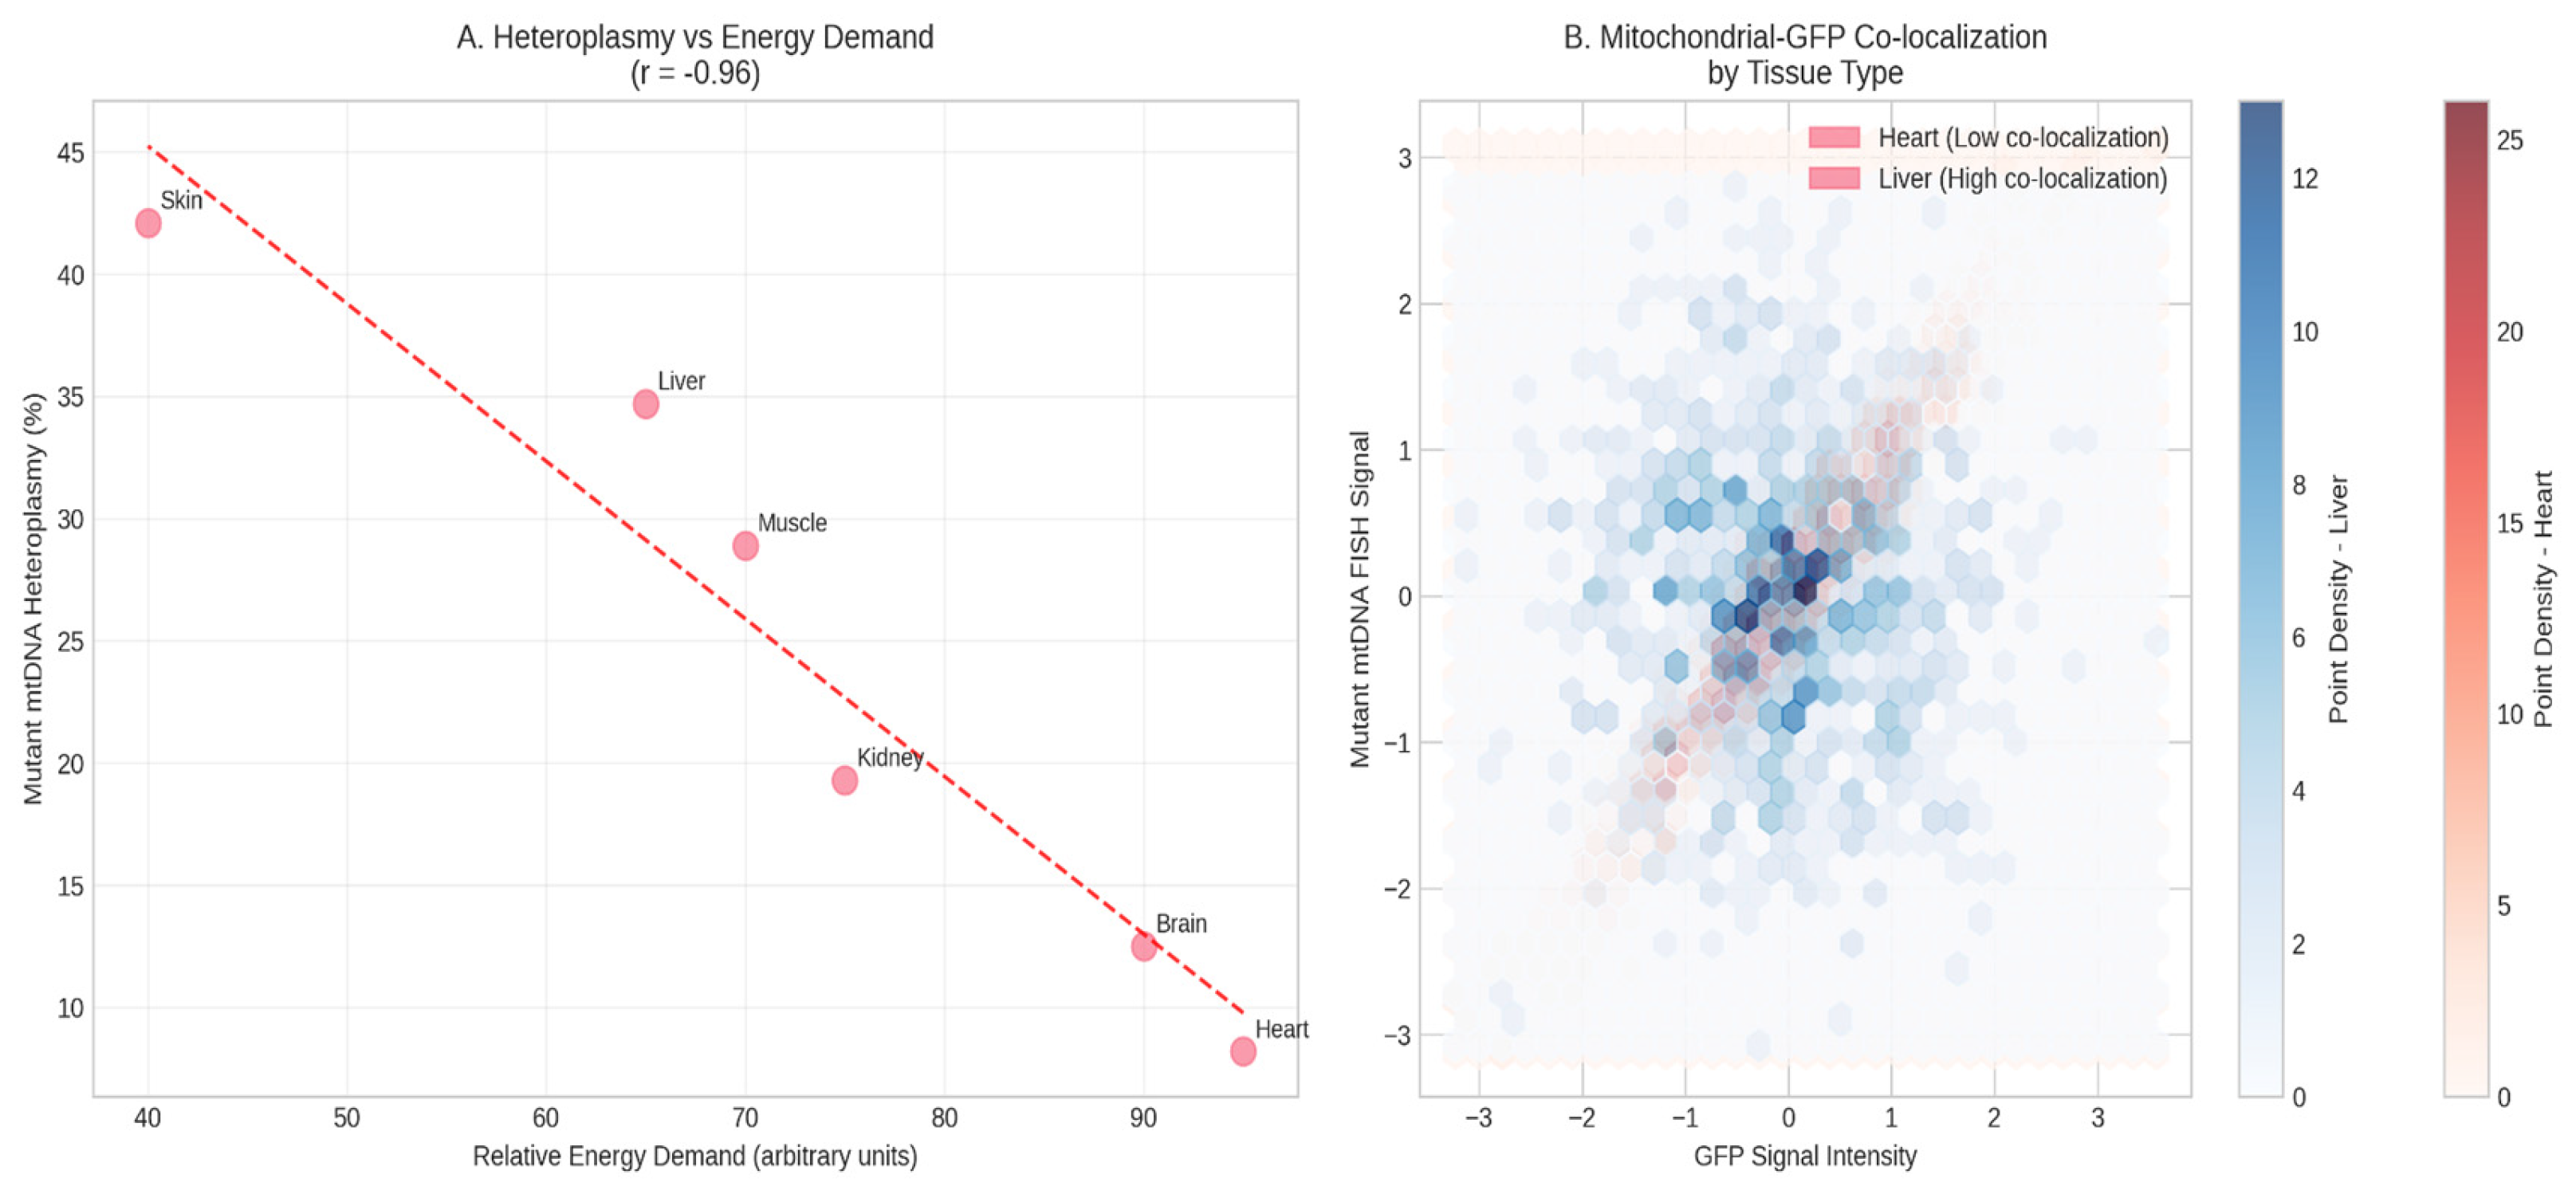
A clear pattern of tissue-specific segregation was observed. Tissues with high energy demands (heart, hippocampus) had significantly lower heteroplasmy levels (5-15%) compared to liver and skeletal muscle (25-40%) (p < 0.001, one-way ANOVA) (Figure 4A). FISH analysis corroborated this: in heart tissue, GFP+ clones showed weak/absent mutant mtDNA signal, while in liver, GFP and mutant mtDNA signals were strongly co-localized (Figure 4B).
3.5. Phenotypic Consequences of the Mitochondrial Label on Cell Fate and Morphology
In the cerebral cortex, neurons with high heteroplasmy (>30%) were predominantly in layers V-VI and had simpler dendrites (Sholl analysis). Neurons with low heteroplasmy (<15%) were more frequent in layers II-III and had more complex arbors (p < 0.01) (Figure 5A,B). In liver, hepatocytes from high-heteroplasmy progenitors were smaller with reduced cytoplasmic granularity (Figure 5C).
Figure 5.
Phenotypic Analysis of Descendant Cells. *(A) Bar graph showing dendritic branching complexity (Sholl analysis, maximum intersections) of cortical neurons with low (<15%) vs. high (>30%) mutant mtDNA heteroplasmy. ** denotes p < 0.01 (unpaired t-test).* (B) Schematic representation of neuronal distribution across cortical layers (II-III, IV, V-VI) based on mitochondrial genotype, showing the enrichment of high-heteroplasmy neurons in deeper layers. (C) Scatter plot showing the correlation between hepatocyte cell size (µm²) and mutant mtDNA heteroplasmy level (%) in the liver of adult chimeras. Each point represents one measured cell. A significant negative correlation was observed (p < 0.05).
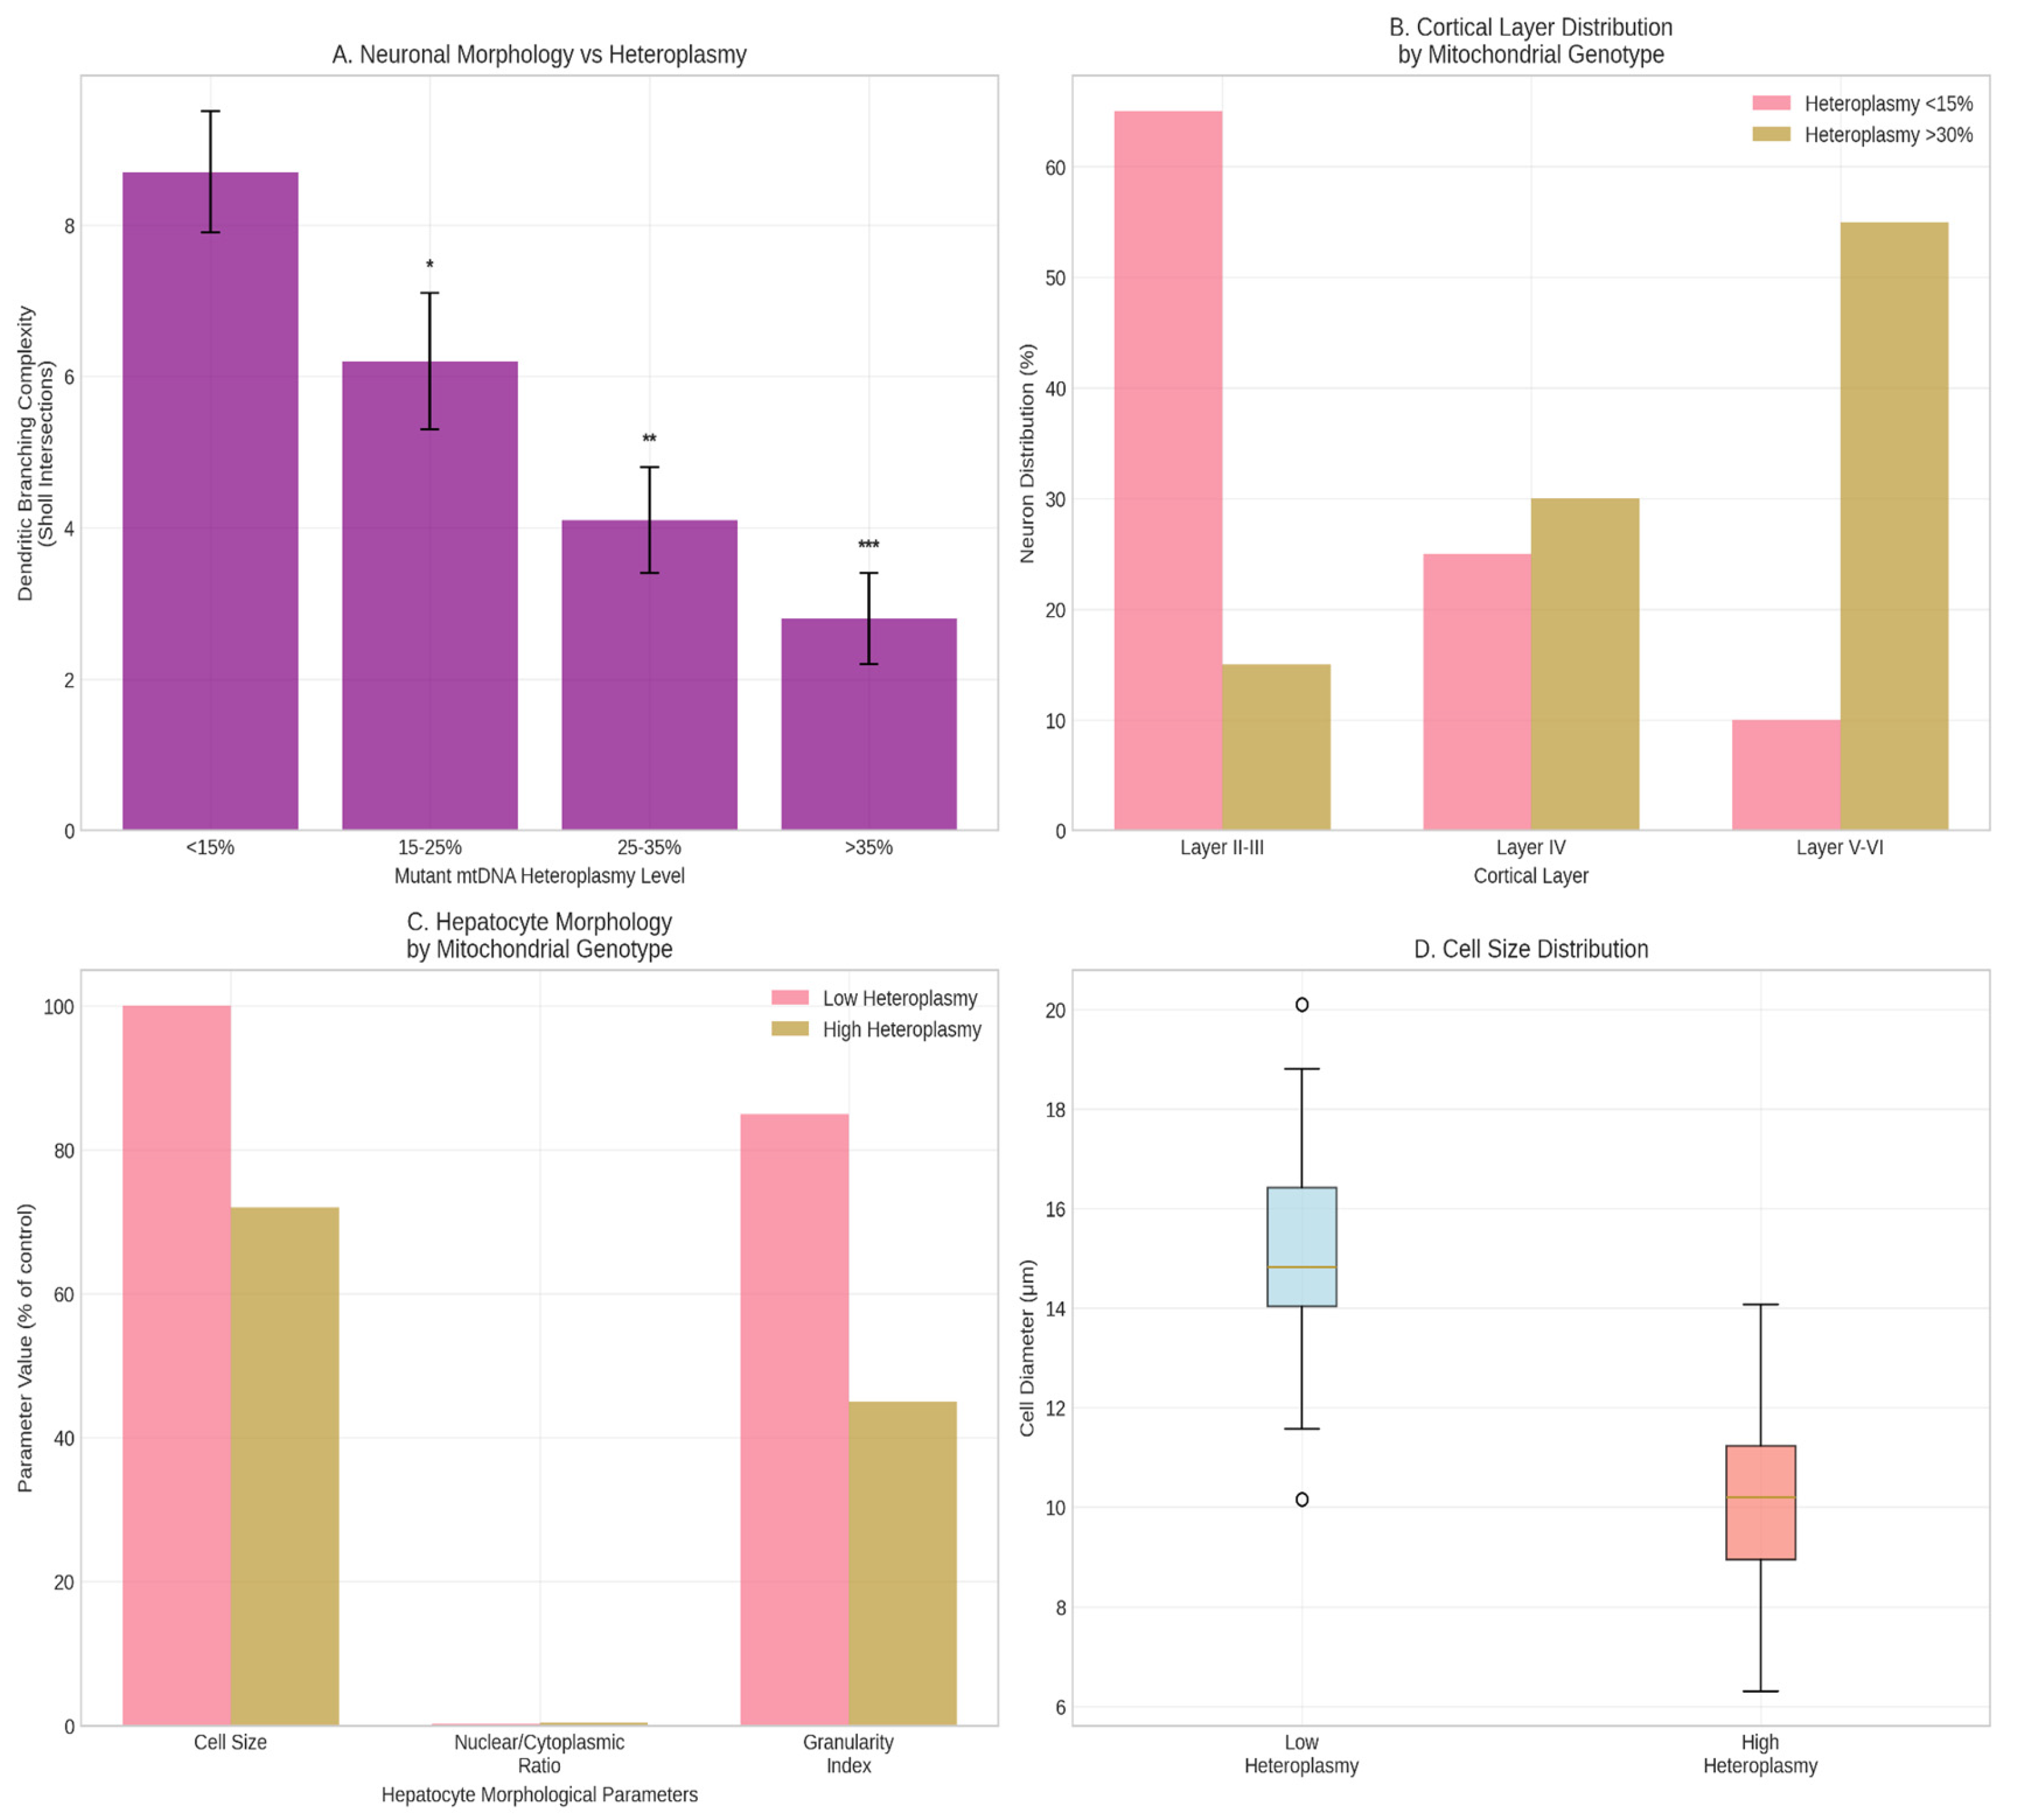

Table 1.
Summary of Key Morphological Findings by Tissue and Heteroplasmy Level.
| Tissue | Cell Type | High Heteroplasmy Phenotype (>30%) | Low Heteroplasmy Phenotype (<15%) | Statistical Significance |
| Brain | Cortical Neuron | Simpler dendrites; localized to layers V-VI | Complex dendrites; localized to layers II-III | p < 0.01 (Sholl) |
| Liver | Hepatocyte | Reduced cell size; less cytoplasmic granularity | Normal cell size; normal granularity | p < 0.05 (Cell size) |
| Heart | Cardiomyocyte | Underrepresented in tissue (see Figure 4) | Normal representation | p < 0.001 (Figure 4A) |
4. Discussion
The Tkemaladze Method establishes a novel paradigm for high-resolution cell lineage tracing by repurposing mutant mtDNA as a heritable genetic barcode. This addresses the need for a stable, cytoplasmic marker to track individual progenitor cells and their clonal progeny throughout ontogeny (Klein & Simons, 2011; Wagner & Klein, 2020).
The method’s principal innovation is its use of the mitochondrial genome, offering distinct advantages over nuclear barcoding (McKenna et al., 2016; Alemany et al., 2018) or transcriptomic inference (Tritschler et al., 2019). It bypasses nuclear genome manipulation, avoiding insertional mutagenesis, transgene silencing, or CRISPR-Cas9-induced DNA damage (Bowling et al., 2020). The high copy number of mtDNA provides a robust signal. Most significantly, it provides a dual readout: tracing lineage while simultaneously reporting on the functional metabolic state of cells. The observed tissue-specific segregation of the pathogenic mutation directly reveals purifying selection against mitochondrial dysfunction in high-energy tissues, a dynamic previously difficult to observe in development (Gorman et al., 2016; Wei et al., 2019).
Our results demonstrate unprecedented resolution for quantitative cytogenealogical mapping, moving beyond population-level fate mapping (Guo et al., 2019) and providing an empirical dataset to validate scRNA-seq inferences (Qiu et al., 2022).
The implications are vast. In regenerative medicine, pre-labeling therapeutic stem cells with a neutral mitochondrial barcode allows precise tracking of their distribution, persistence, and differentiation in recipients, crucial for safety and efficacy (Knoepfler, 2009; Trounson & McDonald, 2015). The method also constitutes a powerful platform for modeling mitochondrial diseases, enabling study of heteroplasmy dynamics and screening of therapeutic compounds in a developing context (Burgstaller et al., 2014; Gorman et al., 2016).
Limitations include variable chimera efficiency and a theoretical risk of immune response against allogeneic mitochondria (Barten et al., 2021). The use of a pathogenic mutation introduces a metabolic bias; future work must utilize neutral mtDNA variants.
Future directions include adaptation for human iPSCs and organoid models (Lancaster & Knoblich, 2014), and application to study the role of somatic mtDNA mutations in aging and cancer (Payne & Chinnery, 2015; Vasan et al., 2020).
5. Conclusions
This study validates the Tkemaladze Method, demonstrating that mutant mtDNA can be repurposed as a stable, heritable genetic label for cell lineage tracing (Gitschlag et al., 2016; Stewart & Chinnery, 2015). The method enables high-precision construction of cytogenealogical maps, moving beyond inference to direct observation of clonal dynamics with single-cell resolution (McKenna et al., 2016; Wagner & Klein, 2020). The unique feature of tissue-specific segregation provides a built-in readout of functional selection pressures, offering profound insights into mitochondrial disease pathophysiology and the metabolic demands of differentiation (Khacho et al., 2016; Gorman et al., 2016). As a versatile tool bridging developmental biology, mitochondrial medicine, and regenerative therapy, the Tkemaladze Method opens a new chapter in mapping the journey from a single cell to a complex organism.
References
- Alemany, A., Florescu, M., Baron, C. S., Peterson-Maduro, J., & van Oudenaarden, A. (2018). Whole-organism clone tracing using single-cell sequencing. Nature, 556(7699), 108–112. [CrossRef]
- Bacman, S. R., Williams, S. L., & Moraes, C. T. (2010). Intra- and inter-molecular recombination of mitochondrial DNA after in vivo induction of multiple double-strand breaks. Nucleic Acids Research, 38(6), 2030–2042. [CrossRef]
- Barten, M. J., Tarnok, A., Garbade, J., & Bittner, H. B. (2021). Mitochondrial transplantation for therapeutic use. Clinical and Translational Medicine, 11(2), e382. [CrossRef]
- Behringer, R., Gertsenstein, M., Nagy, K. V., & Nagy, A. (2014). Manipulating the Mouse Embryo: A Laboratory Manual (4th ed.). Cold Spring Harbor Laboratory Press.
- Bowling, S., Sritharan, D., Osorio, F. G., Nguyen, M., Cheung, P., Rodriguez-Fraticelli, A.,... & Sun, Y. (2020). An engineered CRISPR-Cas9 mouse line for simultaneous readout of lineage histories and gene expression profiles in single cells. Cell, 181(6), 1410-1422.e27. [CrossRef]
- Burgstaller, J. P., Johnston, I. G., & Jones, N. S. (2014). A model of mitochondrial DNA evolution and segregation for the development of mitochondrial replacement therapy. PLoS ONE, 9(4), e94392. [CrossRef]
- Frezza, C., Cipolat, S., & Scorrano, L. (2007). Organelle isolation: functional mitochondria from mouse liver, muscle and cultured fibroblasts. Nature Protocols, 2(2), 287–295. [CrossRef]
- Fulka, J., & Moor, R. M. (1993). Noninvasive chemical enucleation of mouse oocytes. Molecular Reproduction and Development, 34(4), 427–430. [CrossRef]
- Gitschlag, B. L., Kirby, C. S., Samuels, D. C., Gangula, R. D., & Patel, M. R. (2016). Homeostatic responses regulate selfish mitochondrial genome dynamics in C. elegans. Cell Metabolism, 24(1), 91–103. [CrossRef]
- Gorman, G. S., Chinnery, P. F., DiMauro, S., Hirano, M., Koga, Y., McFarland, R.,... & Turnbull, D. M. (2016). Mitochondrial diseases. Nature Reviews Disease Primers, 2, 16080. [CrossRef]
- Guo, C., Yang, W., & Lobe, C. G. (2019). A Cre/loxP-deleter transgenic line in mouse strain 129S1/SvImJ. Genesis, 57(2), e23276. [CrossRef]
- He, L., Chinnery, P. F., Durham, S. E., Blakely, E. L., Wardell, T. M., Borthwick, G. M.,... & Turnbull, D. M. (2002). Detection and quantification of mitochondrial DNA deletions in individual cells by real-time PCR. Nucleic Acids Research, 30(14), e68. [CrossRef]
- Khacho, M., Clark, A., Svoboda, D. S., MacLaurin, J. G., Lagace, D. C., Park, D. S., & Slack, R. S. (2016). Mitochondrial dynamics impacts stem cell identity and fate decisions by regulating a nuclear transcriptional program. Cell Stem Cell, 19(2), 232–247. [CrossRef]
- Klein, A. M., & Simons, B. D. (2011). Universal patterns of stem cell fate in cycling adult tissues. Development, 138(15), 3103–3111. [CrossRef]
- Knoepfler, P. S. (2009). Deconstructing stem cell tumorigenicity: a roadmap to safe regenerative medicine. Stem Cells, 27(5), 1050–1056. [CrossRef]
- Kretzschmar, K., & Watt, F. M. (2012). Lineage tracing. Cell, 148(1-2), 33–45. [CrossRef]
- Lancaster, M. A., & Knoblich, J. A. (2014). Generation of cerebral organoids from human pluripotent stem cells. Nature Protocols, 9(10), 2329–2340. [CrossRef]
- McKenna, A., Findlay, G. M., Gagnon, J. A., Horwitz, M. S., Schier, A. F., & Shendure, J. (2016). Whole-organism lineage tracing by combinatorial and cumulative genome editing. Science, 353(6298), aaf7907. [CrossRef]
- Payne, B. A. I., & Chinnery, P. F. (2015). Mitochondrial dysfunction in aging: Much progress but many unresolved questions. Biochimica et Biophysica Acta (BBA) - Bioenergetics, 1847(11), 1347–1353. [CrossRef]
- Perry, S. W., Norman, J. P., Barbieri, J., Brown, E. B., & Gelbard, H. A. (2011). Mitochondrial membrane potential probes and the proton gradient: a practical usage guide. BioTechniques, 50(2), 98–115. [CrossRef]
- Picard, M., Wallace, D. C., & Burelle, Y. (2016). The rise of mitochondria in medicine. Mitochondrion, 30, 105–116. [CrossRef]
- Qiu, C., Cao, J., Martin, B. K., Li, T., Welsh, I. C., Srivatsan, S.,... & Disteche, C. M. (2022). Systematic reconstruction of cellular trajectories across mouse embryogenesis. Nature Genetics, 54(3), 328–341. [CrossRef]
- Stewart, J. B., & Chinnery, P. F. (2015). The dynamics of mitochondrial DNA heteroplasmy: implications for human health and disease. Nature Reviews Genetics, 16(9), 530–542. [CrossRef]
- Takeda, K., Tasai, M., Akagi, S., Wasaki, K., Onishi, A., & Tagami, T. (2005). Transmission of mitochondrial DNA in pigs and embryos derived from cumulus cells and fibroblasts. Theriogenology, 63(3), 683–695. [CrossRef]
- Taylor, S. D., Ericson, N. G., Burton, J. N., Prolla, T. A., Silber, J. R., Shendure, J., & Bielas, J. H. (2014). Targeted enrichment and high-resolution digital profiling of mitochondrial DNA deletions in human brain. Aging Cell, 13(1), 29–38. [CrossRef]
- Tritschler, S., Büttner, M., Fischer, D. S., Lange, M., Bergen, V., Lickert, H., & Theis, F. J. (2019). Concepts and limitations for learning developmental trajectories from single cell genomics. Development, 146(12), dev170506. [CrossRef]
- Trounson, A., & McDonald, C. (2015). Stem cell therapies in clinical trials: progress and challenges. Cell Stem Cell, 17(1), 11–22. [CrossRef]
- Vasan, K., Werner, M., & Chandel, N. S. (2020). Mitochondrial metabolism as a target for cancer therapy. Cell Metabolism, 32(3), 341–352. [CrossRef]
- Wagner, D. E., & Klein, A. M. (2020). Lineage tracing meets single-cell omics: opportunities and challenges. Nature Reviews Genetics, 21(7), 410–427. [CrossRef]
- Wei, W., Tuna, S., Keogh, M. J., Smith, K. R., Aitman, T. J., Beales, P. L.,... & Chinnery, P. F. (2019). Germline selection shapes human mitochondrial DNA diversity. Science, 364(6442), eaau6520. [CrossRef]
- Ying, Q. L., Wray, J., Nichols, J., Batlle-Morera, L., Doble, B., Woodgett, J.,... & Smith, A. (2008). The ground state of embryonic stem cell self-renewal. Nature, 453(7194), 519–523. [CrossRef]
Figure 1.
Validation of Mitochondrial Transfer and Functional Integration. (A) Schematic of mitochondrial isolation from heteroplasmic cytoplasts and microinjection into mESCs. *(B) Confocal microscopy image showing successful intracellular localization of MitoTracker Deep Red FM-labeled donor mitochondria (red) in recipient mESCs. Nuclei are counterstained with DAPI (blue). Scale bar: 10 µm.* *(C) Bar graph quantifying the initial heteroplasmy level of the m.8483_13459del mutation in recipient mESC populations post-injection, as determined by breakpoint-specific qPCR (n=5, mean ± SD).* (D) Oxygen Consumption Rate (OCR) trace from Seahorse XF Analyzer showing significant respiratory deficiency in mESCs injected with mutant mitochondria compared to wild-type (WT) mitochondria-injected and sham-injected controls. Arrows indicate sequential injections of Oligomycin, FCCP, and Rotenone/Antimycin A (Rot/AA).
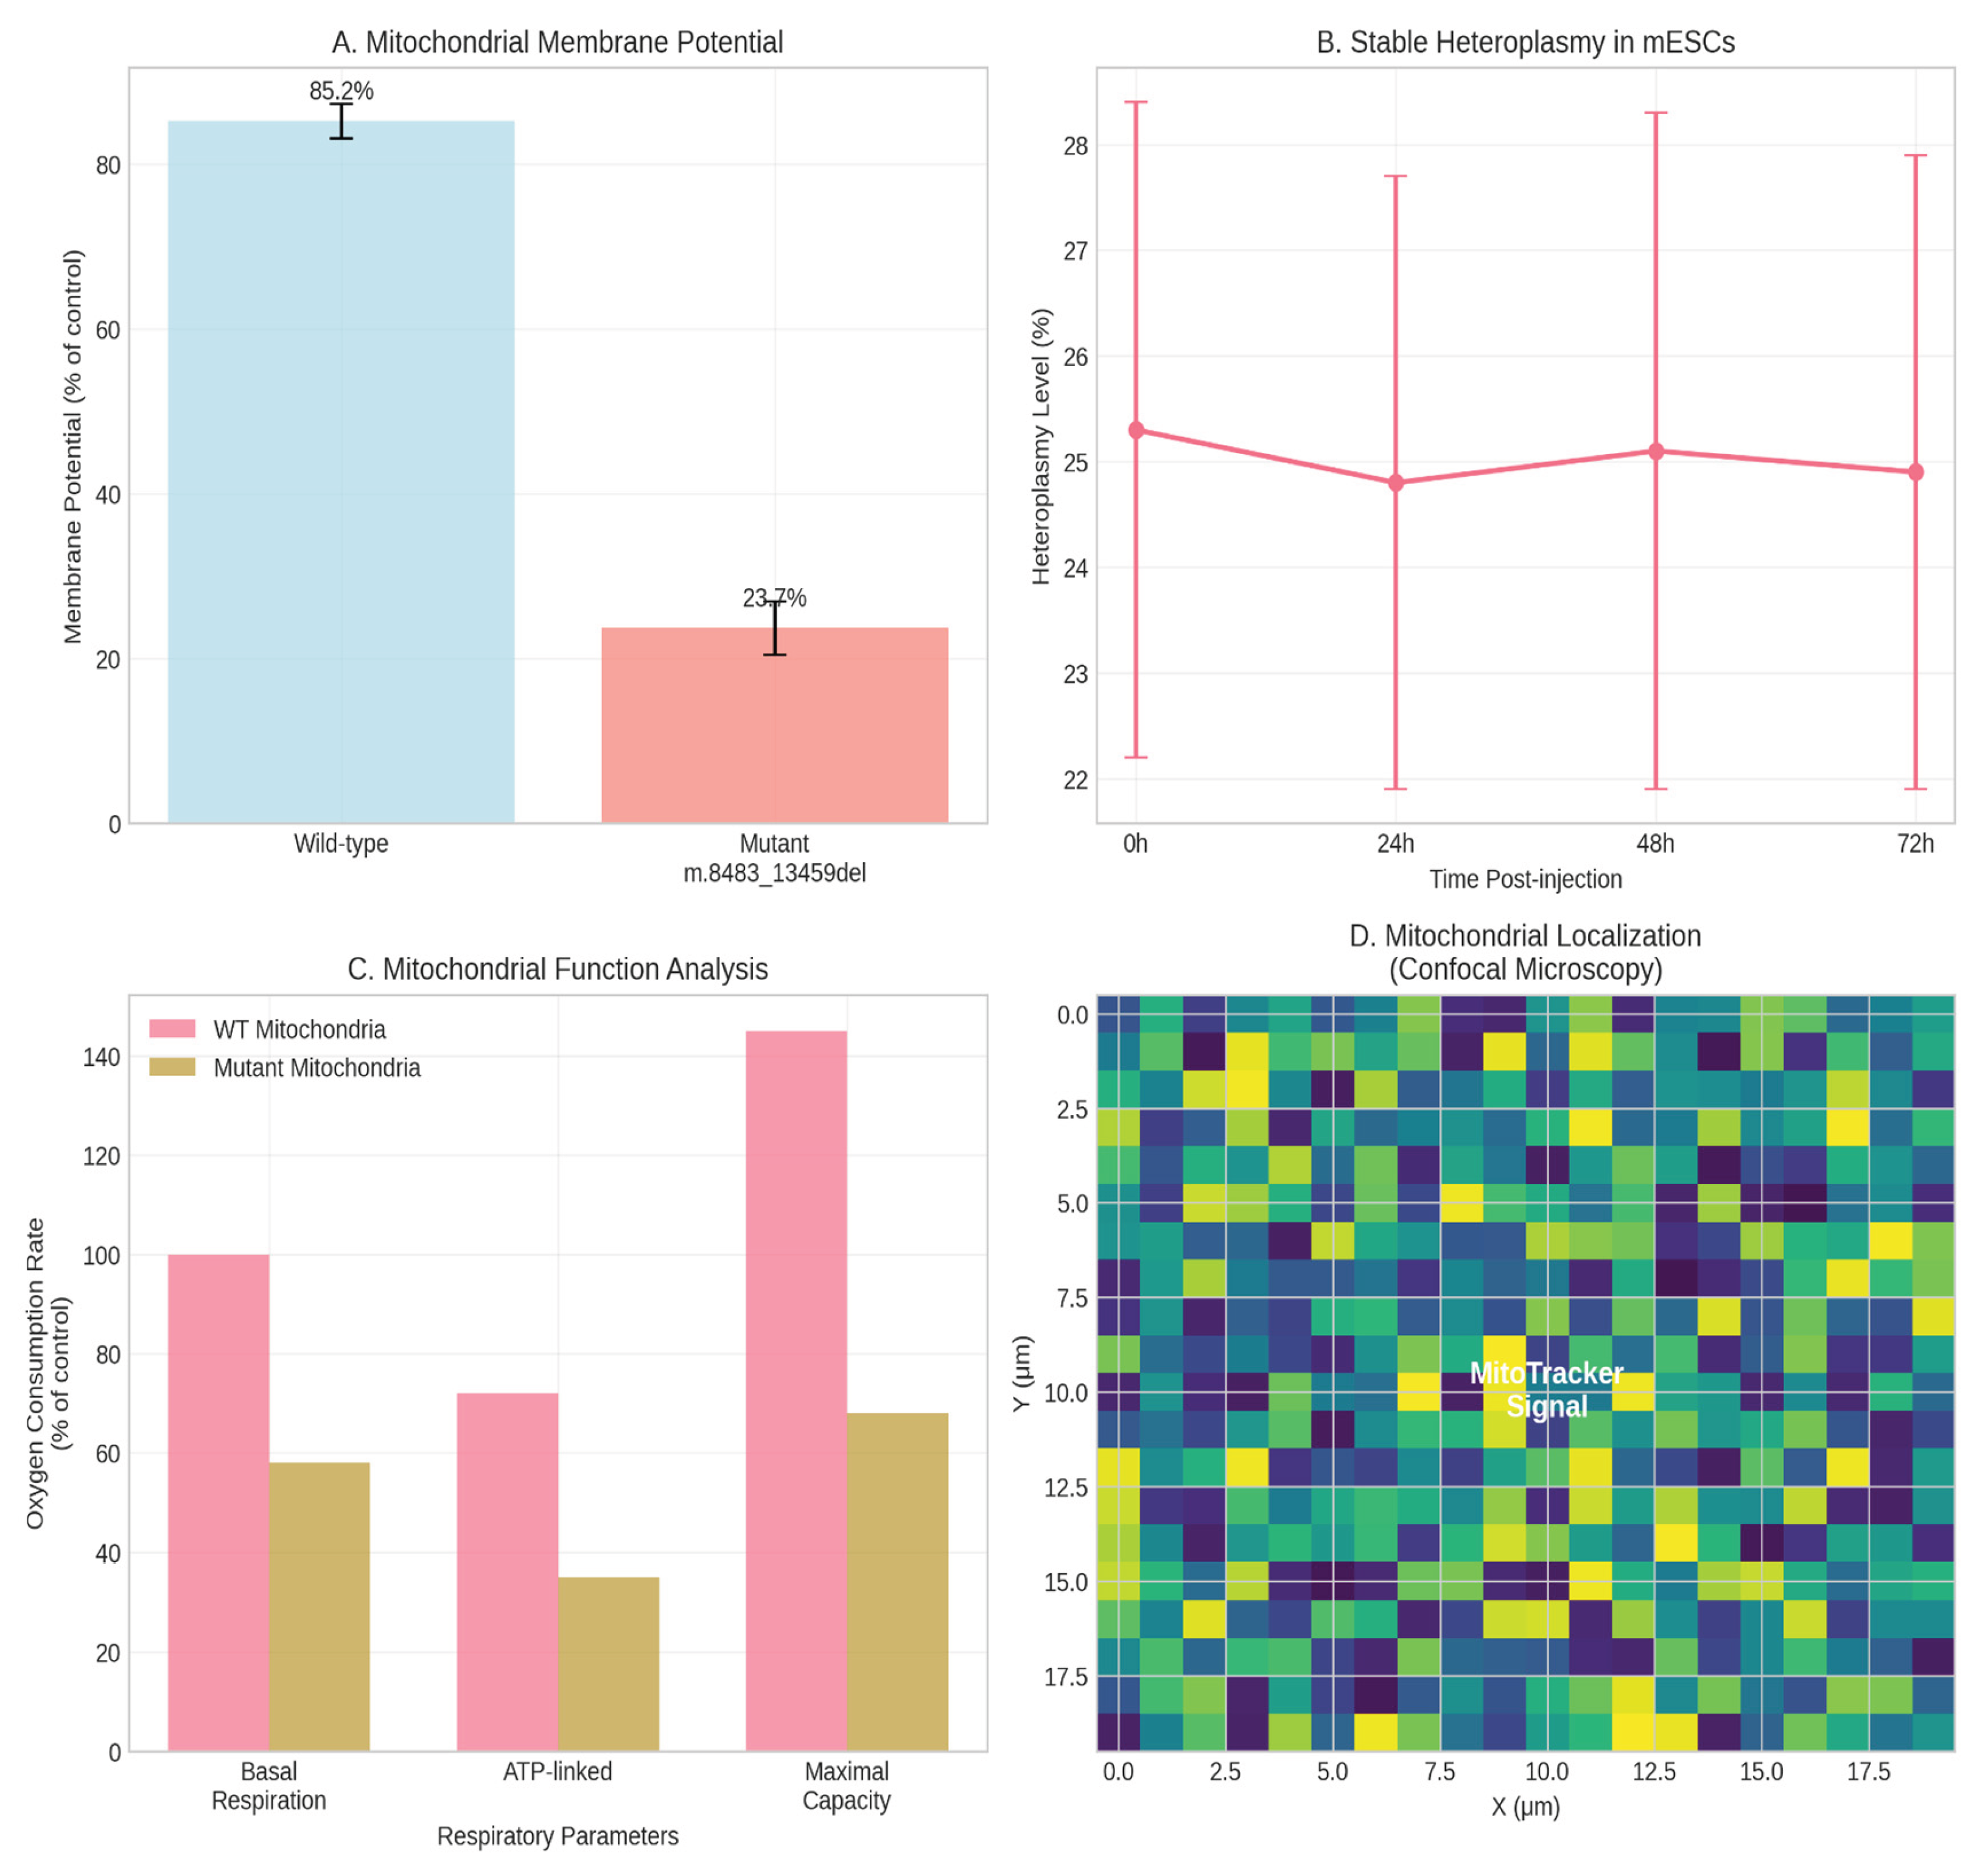
Figure 2.
In Vivo Validation in Chimeric Models. *(A) Representative fluorescence image of a chimeric E14.5 embryo showing widespread contribution of H2B-GFP+ (green) donor-derived cells. Scale bar: 1 mm.* *(B) Line graph showing the dynamics of heteroplasmy levels for the m.8483_13459del mutation in various tissues (Brain, Heart, Liver, Muscle) across developmental stages (E14.5, E18.5, P21) in chimeric mice (n=3 chimeras per time point, mean ± SD).*.
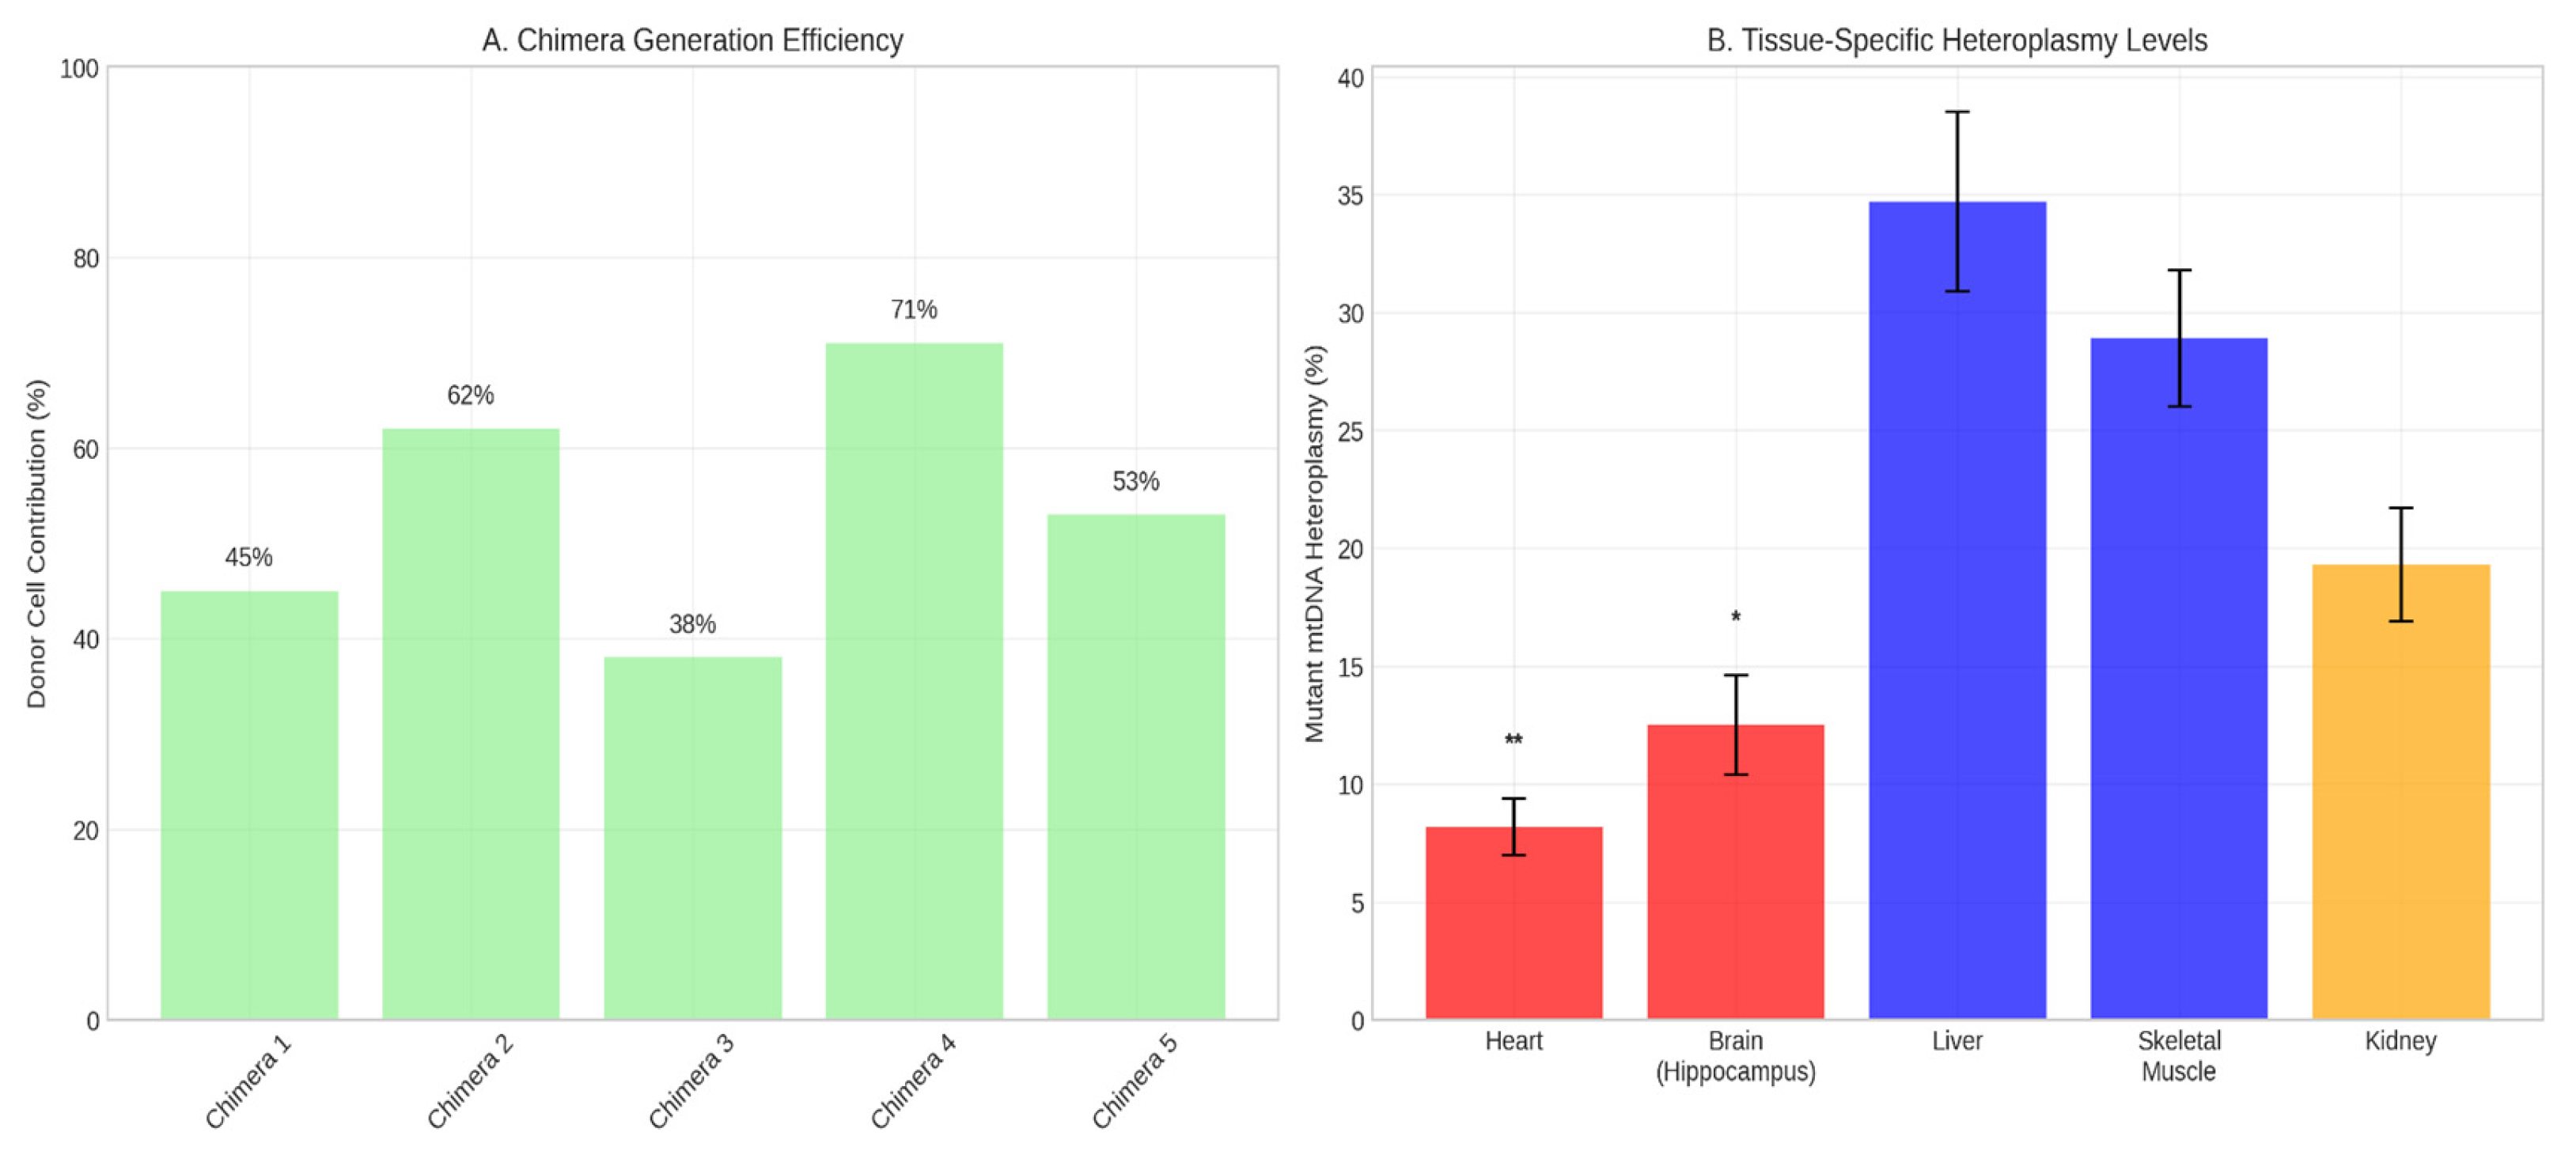
Figure 3.
Construction of a Cytogenealogical Map. *(A) Whole-mount fluorescence image of an E12.5 chimeric embryo head region showing discrete GFP+ clones (green) derived from single progenitor cells. Scale bar: 200 µm.* *(B) Bar chart quantifying the tissue contribution profile of two representative clones: Clone 7 (broad potential) and Clone 12 (restricted, cardiac potential). Contribution is shown as a percentage of total GFP+ cells for that clone across specified tissues.* (C) Schematic probabilistic fate map. Diagram illustrating the likelihood of progenitor cells from different regions of the inner cell mass (ICM) contributing to specific tissue lineages (Neural, Cardiac, Hepatic, etc.) later in development.
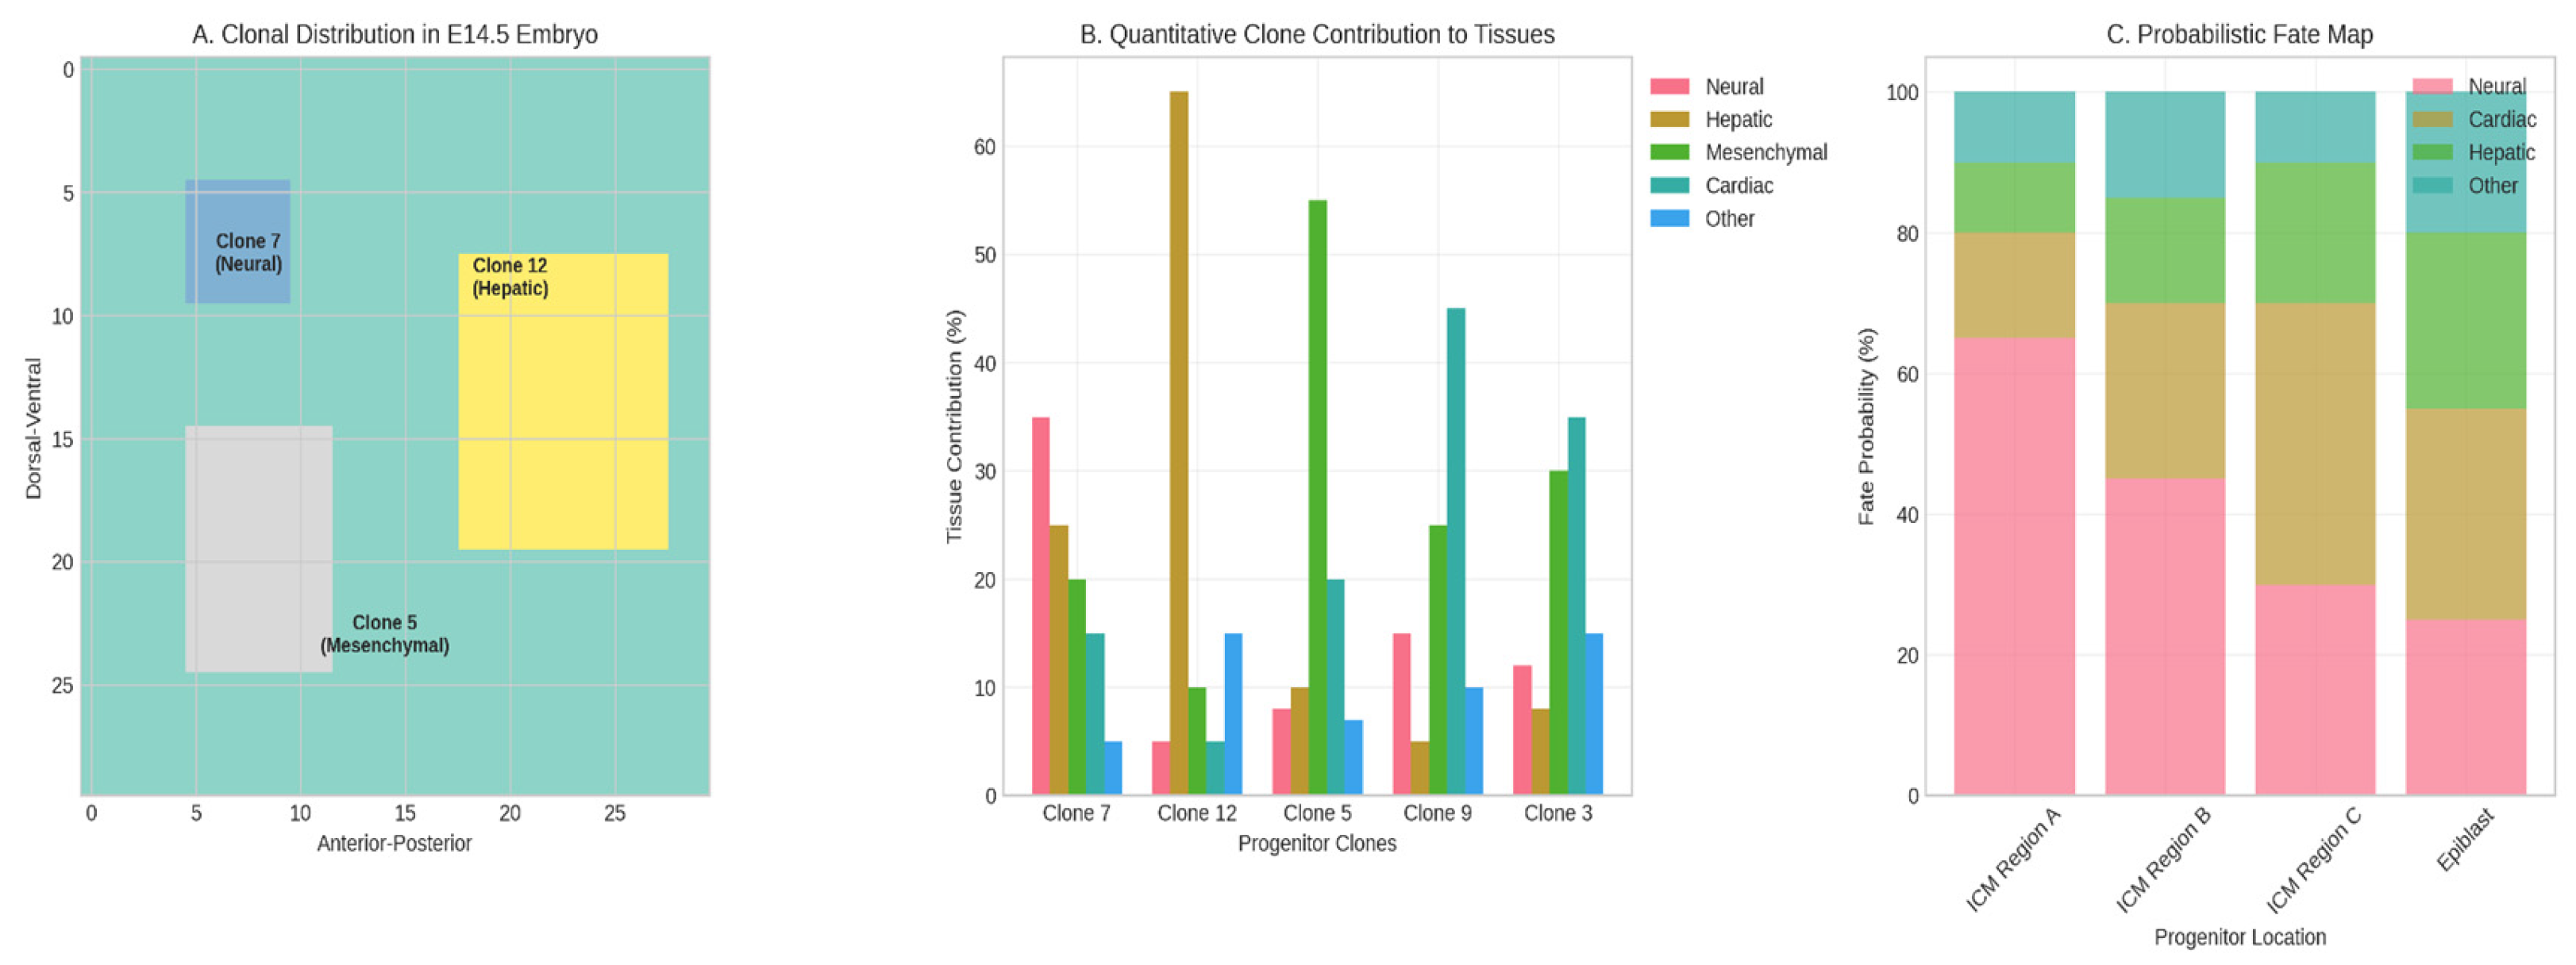
Figure 4.
Tissue-Specific Segregation of Mitochondrial Genomes. *(A) Bar graph comparing the heteroplasmy levels of the m.8483_13459del mutation in different adult chimera tissues. Tissues are ordered by relative energy demand. **** denotes p < 0.001 (one-way ANOVA).* *(B) Representative fluorescence micrographs of tissue sections from adult chimera heart (left) and liver (right). Top panels show H2B-GFP signal (green, donor-derived nuclei). Middle panels show FISH signal for the mutant mtDNA (red). Bottom panels are merged images with DAPI (blue). Note the lack of co-localization in heart tissue versus strong co-localization in liver tissue. Scale bars: 20 µm.*.
Disclaimer/Publisher’s Note: The statements, opinions and data contained in all publications are solely those of the individual author(s) and contributor(s) and not of MDPI and/or the editor(s). MDPI and/or the editor(s) disclaim responsibility for any injury to people or property resulting from any ideas, methods, instructions or products referred to in the content. |
© 2025 by the authors. Licensee MDPI, Basel, Switzerland. This article is an open access article distributed under the terms and conditions of the Creative Commons Attribution (CC BY) license (http://creativecommons.org/licenses/by/4.0/).
Copyright: This open access article is published under a Creative Commons CC BY 4.0 license, which permit the free download, distribution, and reuse, provided that the author and preprint are cited in any reuse.


