1. Introduction
The increasing and serious concerns regarding the spread of antimicrobial resistance (AMR) in both human and veterinary medicine have renewed interest in developing new approaches to prevent and control infectious diseases, including enhancing innate immune responses [
1,
2,
3,
4]. These aspects are not new in the context of the bovine mammary gland. Indeed, interest in the immune response of the mammary gland and ways to improve it have been evident since the 1990s [
5,
6,
7,
8]. Unfortunately, despite the large number of studies on this topic, there have been no practical applications [
8]. This may be related to the difficulty of measuring cow immune status, and especially cellular immunity, in a practical and sustainable way, impairing the assessment of the efficacy of the different approaches. Indeed, while a number of tests for innate immunity at blood level are available [
9], these tests, in the food-producing animals contest are generally expensive and time-consuming. Therefore, only studies involving a limited number of animals are feasible, and it could be questionable to generalize their results to the cow population. These problems become even more severe when these markers are measured in milk. Most tests used for blood analysis are not suitable for milk due to its composition, particularly the presence of fat. Although some markers of the innate immune response are available, they are either expensive or inapplicable under field conditions as well [
6,
10]. Among the very few markers available, somatic cell count (SCC) is sustainable, and it is very accurate in diagnosing subclinical mastitis, but performs poorly as a marker of cellular immunity [
11,
12]. Much effort has been devoted to investigating differential cell counts in milk because the leukocyte formula, as demonstrated in blood, is a highly useful and consistent marker of cellular immunity [
9]. However, until recently, investigations on milk differential cell count (DSCC) were limited by the poor reproducibility and high cost of available methods. This limited their application to studies with relatively small sample sizes [
11,
13,
14,
15].
The development of a high-throughput tool for performing DSCC has paved the way for sustainable exploration of cow innate immunity under field conditions. Most of these studies aimed to apply DSCC in the diagnosis of subclinical mastitis and/or an increased risk of mastitis, and the results confirmed the usefulness of this approach [
16,
17,
18,
19,
20,
21,
22]. The "classical" approach is based on the definition of a threshold and involves applying either SCC or DSCC as markers. Values of SCC and DSCC over the specific threshold indicate the presence of subclinical mastitis [
23,
24].
The presence of neutrophils in the milk of healthy glands seems to correlate inversely with a risk of intramammary infections or a reduction in the severity of clinical mastitis [
5,
25,
26]. However, the same measurements may indicate the opposite condition: the presence of an insufficient amount of polymorphonuclear neutrophils (PMN) [
27,
28]. Indeed, in the healthy gland, PMN have the capability to migrate from peripheral blood through endothelial gaps in mammary epithelium to milk. Thus, the normal uninfected mammary gland is supplied with a constant source of PMN, stemming from cells maturing in the bone marrow, then released into the circulation, where they spend approximately 9 hours before migrating into tissue [
5,
8]. In healthy cows, production and destruction of PMN is tightly regulated, which keeps their number in blood, milk and tissue constant. Since the number of PMNs in milk, in the absence of an inflammatory process, is regulated by their concentration in the bloodstream and their release from the bone marrow, very low levels may be a sign of transient or chronic immune impairment [
9].
Several experimental studies have shown an association between innate immunity impairment and metabolic parameters, particularly during the periparturient period [
29,
30,
31]. However, at the best of our knowledge, no study has been conducted under field conditions on the association between low levels of PMN and a higher disease frequency. This information is lacking due to the inability to measure PMN in milk, as described before, as well as the difficulty of objectively assessing the disease frequency based of herd records.
In an attempt to address this knowledge gap, this study aims to demonstrate the existence of an association between the prevalence of milk PMN values below a defined thresholds, as measured by monthly milk test record samples (MTR), and the frequency of antimicrobial treatments based on compulsory treatment recording practices in Italy.
2. Materials and Methods
2.1. Herd and Cow Selection
This study considered 6,209 cows from 20 dairy herds in Lombardy that are enrolled in the Italian Breeder Association (AIA) monthly individual DHI MTR. The herd size was in the range 84-900 lactating cows and 95% of the cows were Italian Friesian.
2.2. Sample Collection
Individual cow samplings were performed by certified methods by the means of Lactocorder™ (WMB AG, Balgach, CH), and delivered refrigerated to Regional Breeders Association of Lombardy (ARAL) labs the same day, and analyzed within 30 h from sampling.
2.3. Cellular Marker Analyses
Milk analyses on MTR samples included SCC and DSCC and were carried out on Fossomatic™ 7DC (Foss A/S, Hillerød, DK). The DSCC was assessed by the method described by Damm et al. [
16]. This method allows us to identify within a milk sample the macrophages and the combination of PMN and lymphocytes (LYM). DSCC is expressed as the combined proportion (%) of PMN and LYM in the overall count of milk cells. Cow and MTR data collected in 2024 for all the 20 herds considered were recorded in a database.
2.4. Treatment Records
All the treatments applied to dairy cows in Italy must be compulsory recorded (Regulation EU 2019/6 of the European Parliament and of the Council) in an electronic database included in Classyfarm, an integrated surveillance system of Italian livestock farms [
32]. From this database all the antimicrobial treatments applied in 2024 in the 20 herds were retrieved and the data combined with the database related to MTR data.
2.5. Statistical Analysis
The final database includes: herdID, cowID, number of antimicrobial treatments, SCC and DSCC, and a variable named PLCC calculated by multiplying SCC×DSCC . This variable represents the total number of PMN+LYM/mL [
17,
18]. Since the variability of this marker is mainly due to changes in the proportion of PMN, while the proportion of LYM is relatively constant [
16,
20] this parameter is considered to describe the changes in milk PMN proportion. SCC and PLCC have a non-normal distribution; therefore, their values were log-transformed.
The statistical analyses included correlation, liner regression analysis, and ROC curve, they were all performed using the related procedures of SPSS 29.0.1 (IBM Corp, USA).
For what concern ROC curve the following parameters were calculated for any specific threshold of AMT frequency:
- Accuracy, expressed as a proportion of correctly classified subjects [true positive (TP) + true negative (TN)] among all subjects.
- Sensitivity (Se): the proportion of TP / [TP + false positive (FP)]
- Specificity (Sp): the proportion of TN / [false negative (FN) + TP]
- Positive predictive value (PPV): TP /( TP+FN)
- Negative predictive value (NPV): TN /(TN+FP)
- Positive likelihood ratio (LR+): [TP/(TP+FN)/FP/(FP+TN)]
- Negative likelihood ratio (LR-): [FN/(TP+FP)/[TN/(TN+FP)]
3. Results
3.1. Data Description
Overall, 58,090 valid MTR and more than 83,000 recorded treatments were available. Among these latter ones, 12,014 concerned antimicrobial treatments (AMT), and they were considered for this study. Within the AMT, 4212 were related to mastitis treatment during lactation. Antimicrobial treatments at drying-off were not considered into the study.
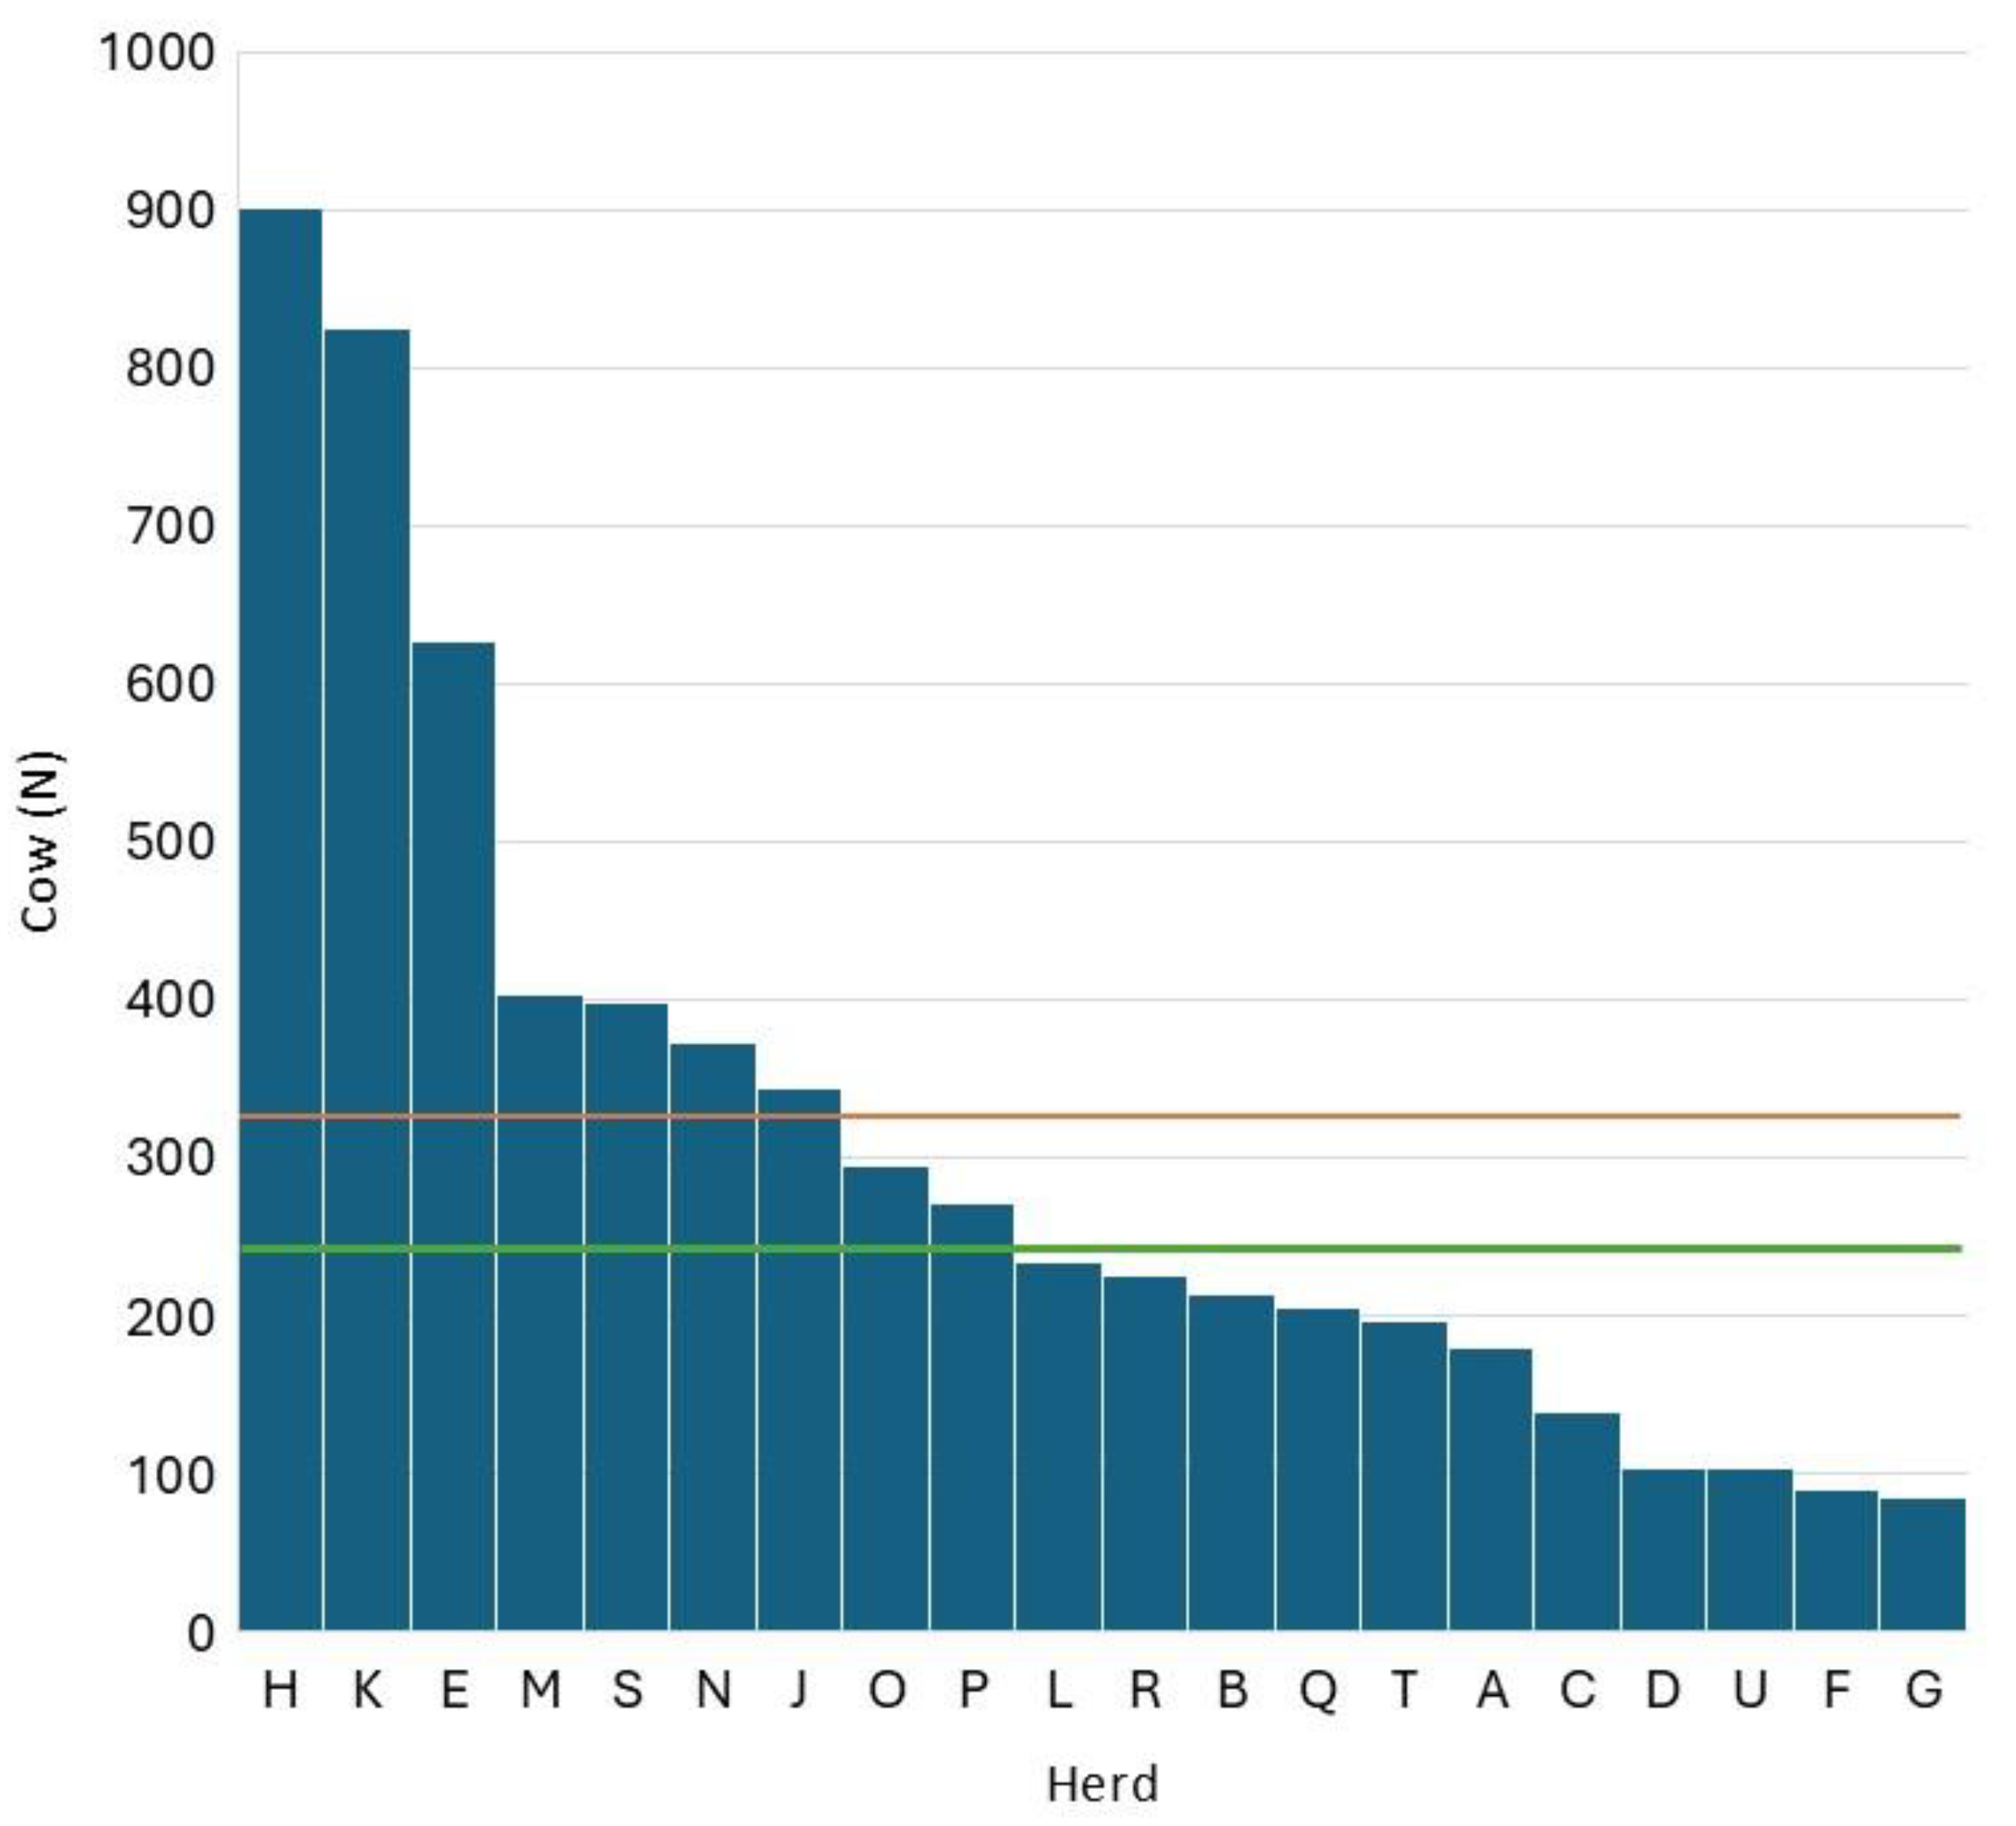
Figure 1 reports the distribution of herd size in the 20 herds considered. The mean herd size was 310 cows/herd which is higher than the Lombardy average at the end of 2024 (108 lactating cows/herd). The difference between the two means is due to the characteristics of the herds enrolled in ARAL that include most of the largest and most efficient herds of the region.
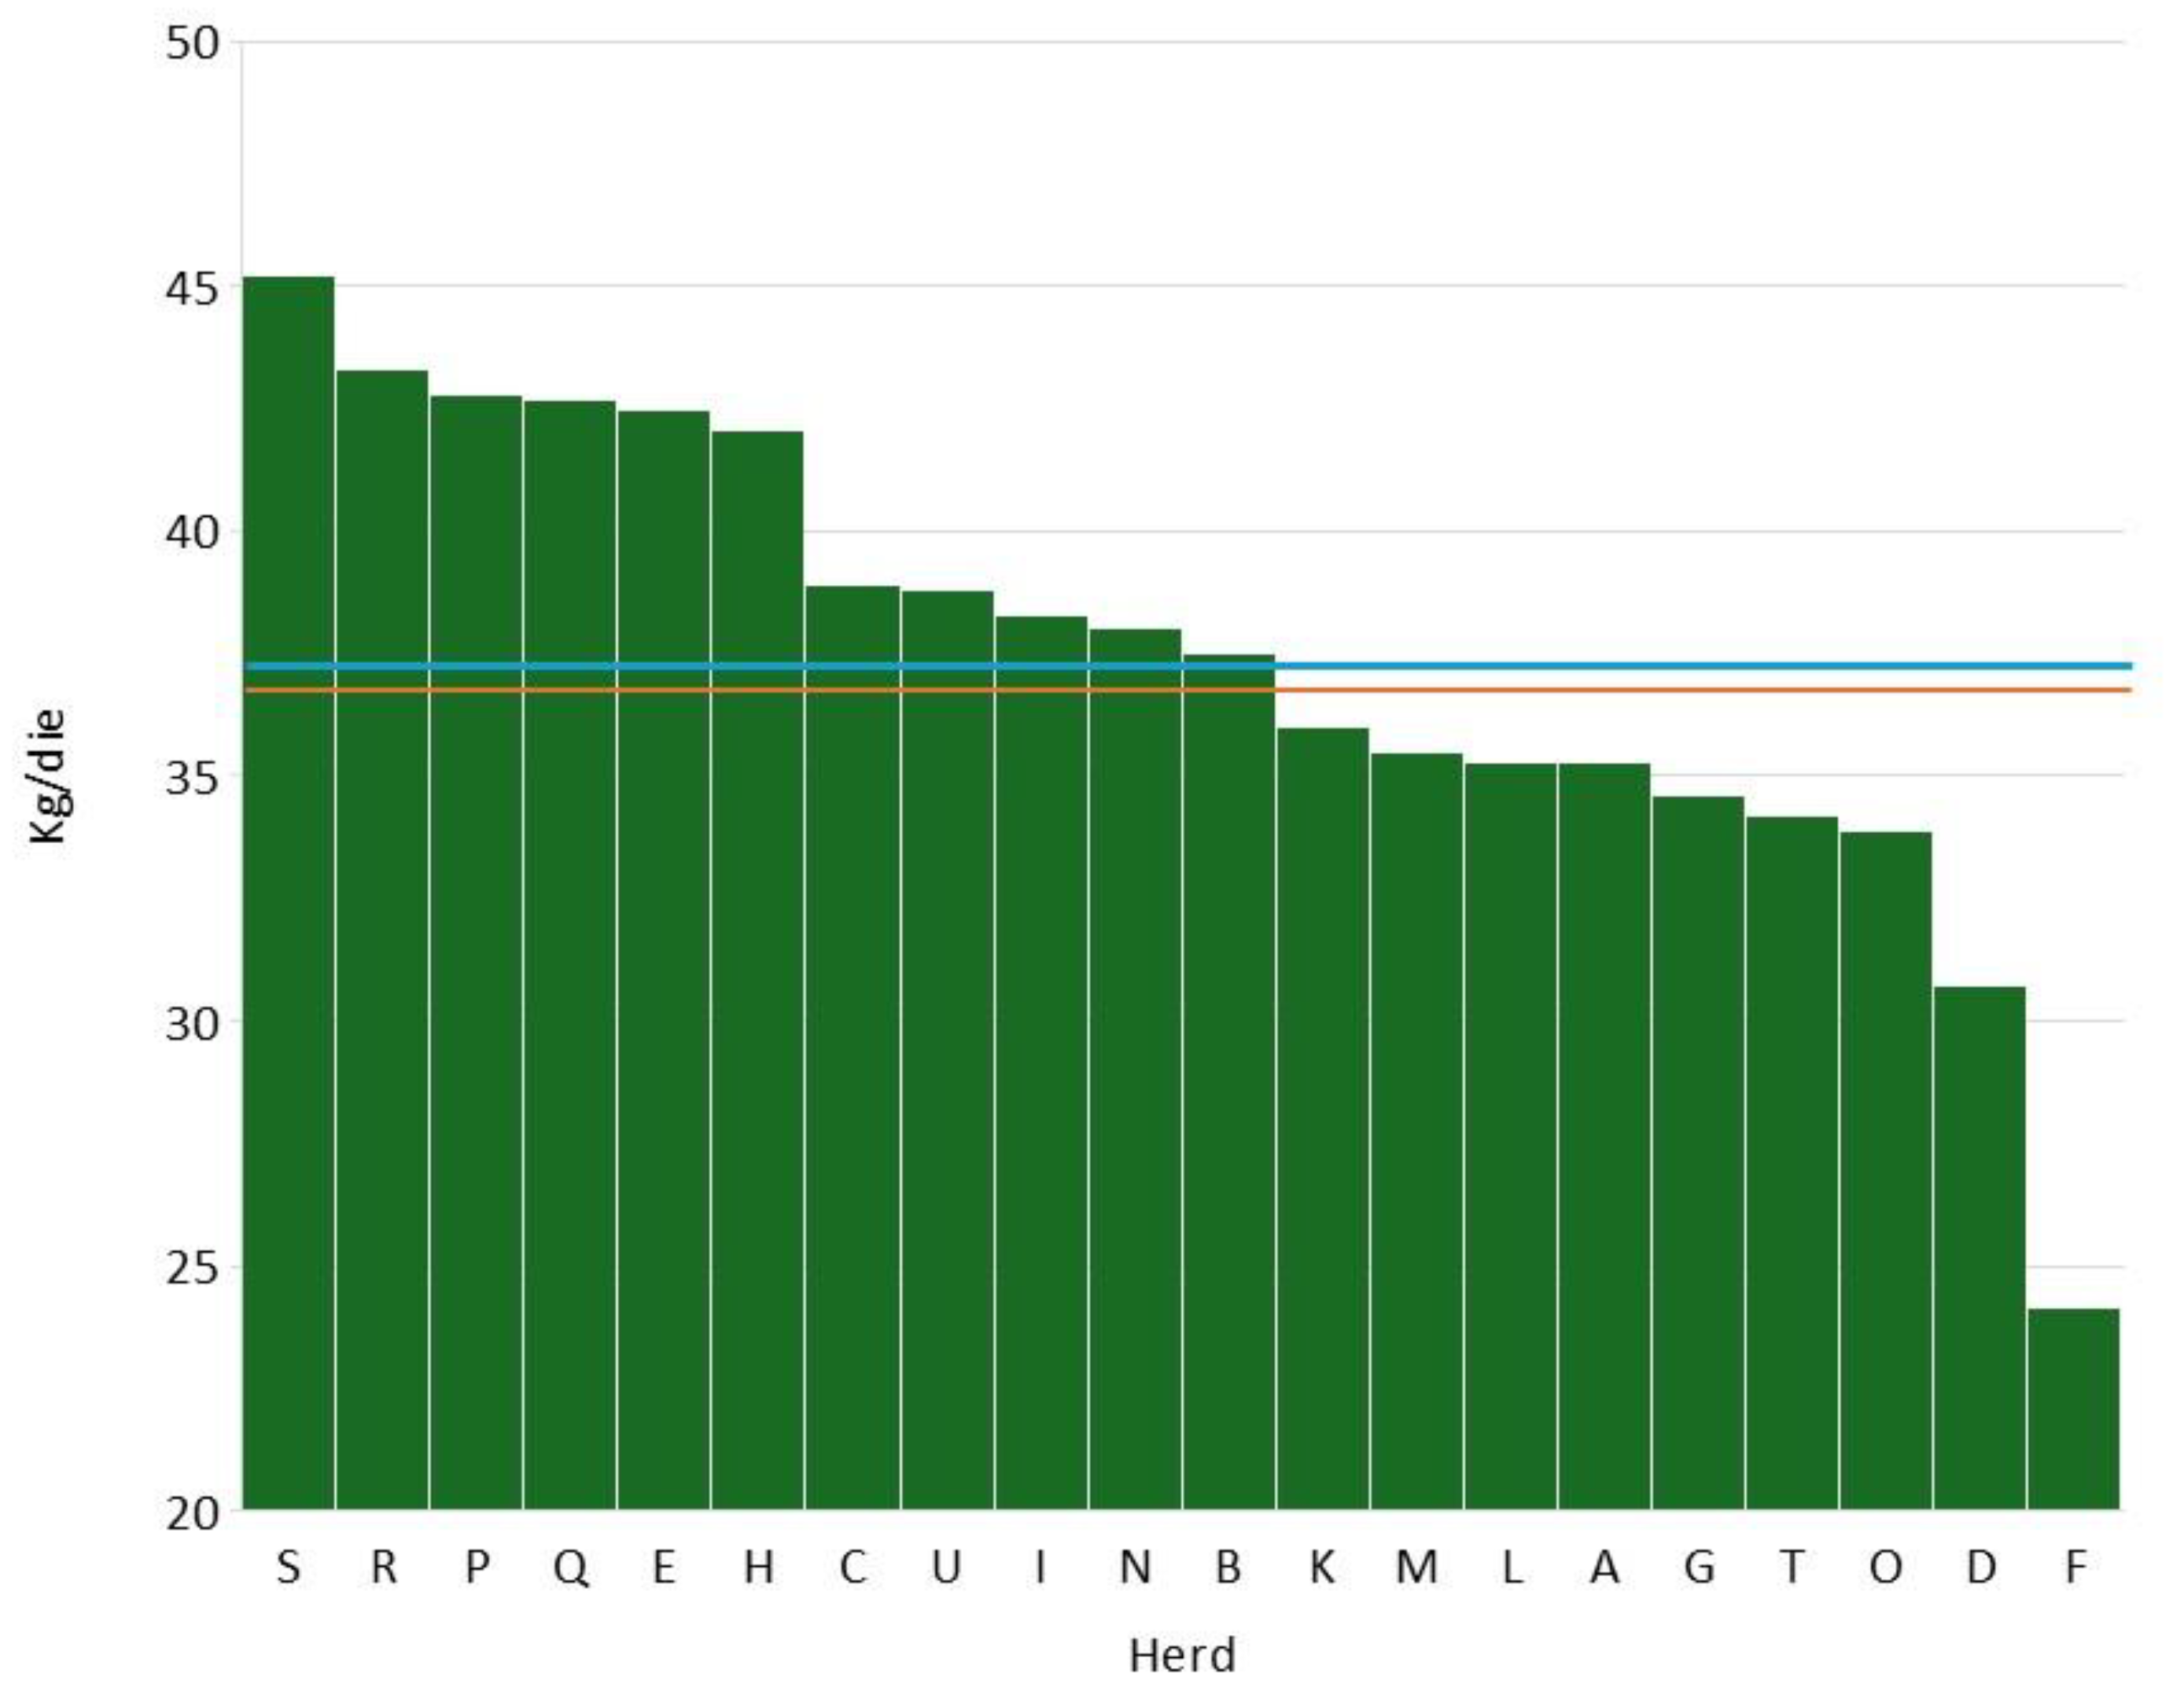
Figure 2 describes the distribution of average daily milk yield during year 2024. The mean was 37.5 kg/d, a value very close to the median (37.8 kg/d). Also, in this case the values are higher than the Lombardy average (28.9 kg/d).
Table 1 summarizes the distribution of SCC, DSCC and PLCC variables in the 20 herds considered, showing a maximum mean value for SCC of 5.13 Log
10 cells/mL (≈135,000 cell/mL) and a minimum of 4.62 Log
10 cells/mL (≈33,000 cell/mL). DSCC varied between 55.94% and 66.44%, while PLCC range was between 4.22 Log
10 cells/mL (≈16,500 cell/mL) and 4.98 Log
10 cells/mL (≈95,500 cell/mL). The values of these markers suggest that the 20 herds considered have good herd management and good level of udder health.
3.2. Antimicrobial Treatments
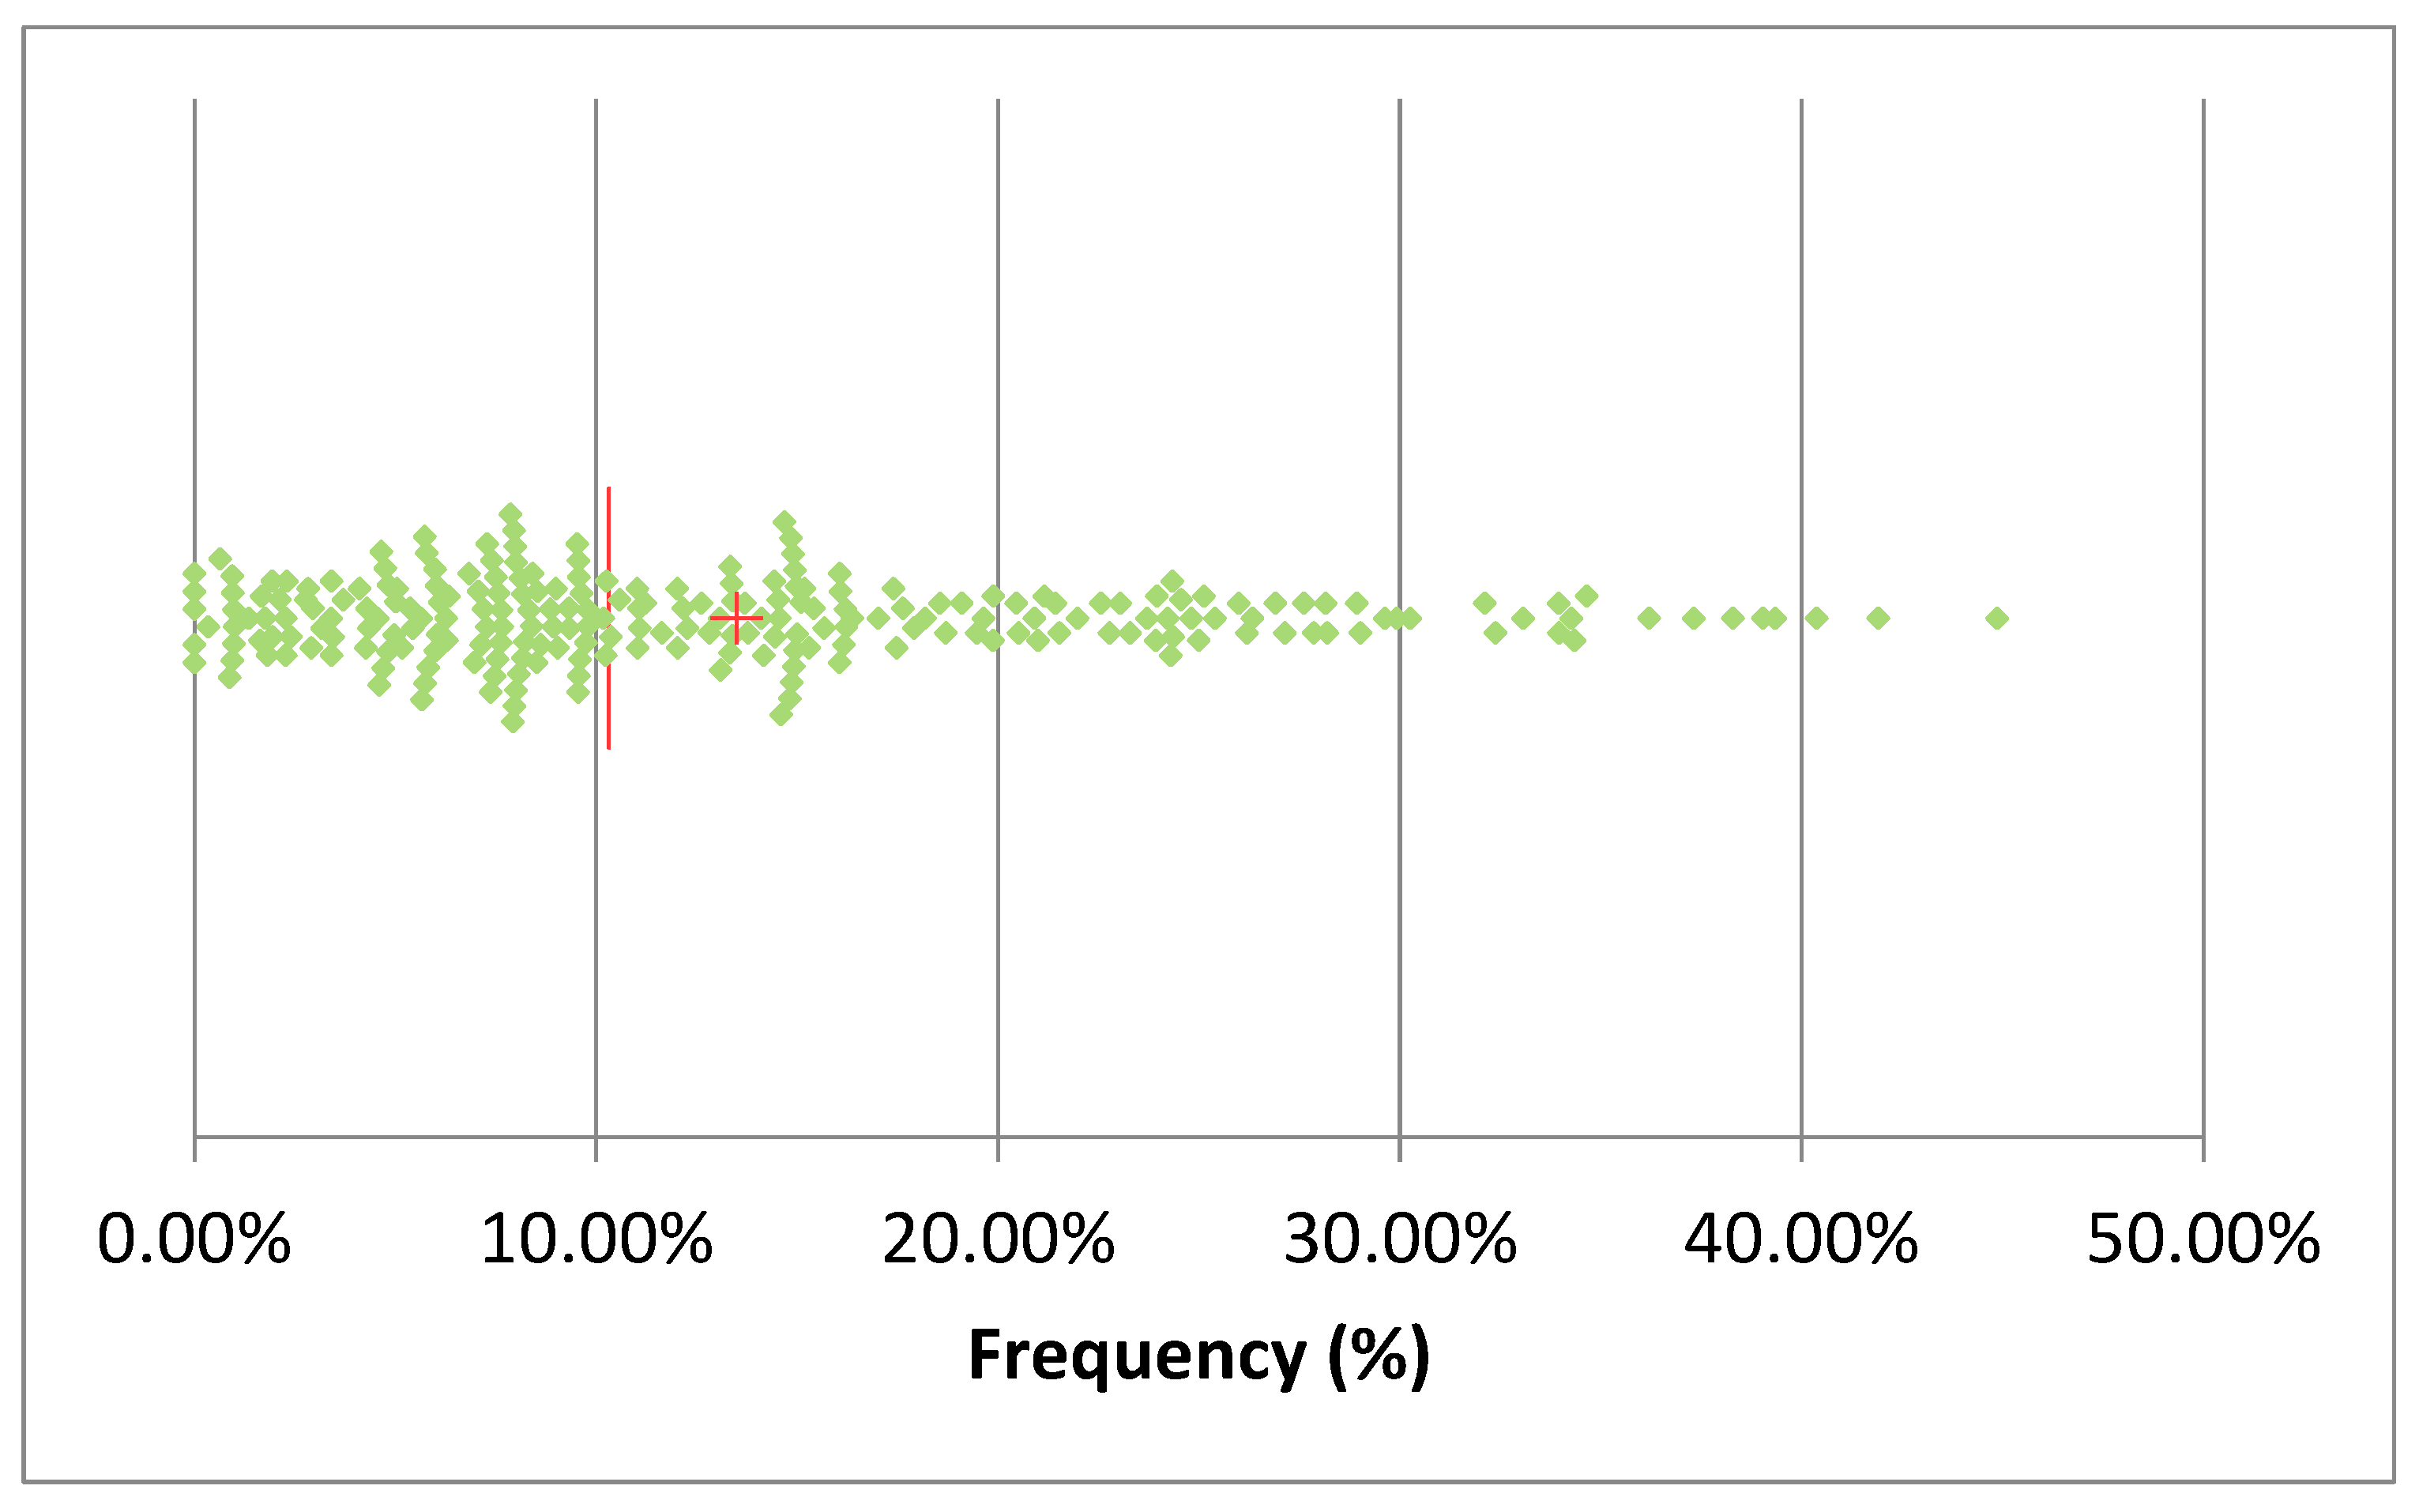
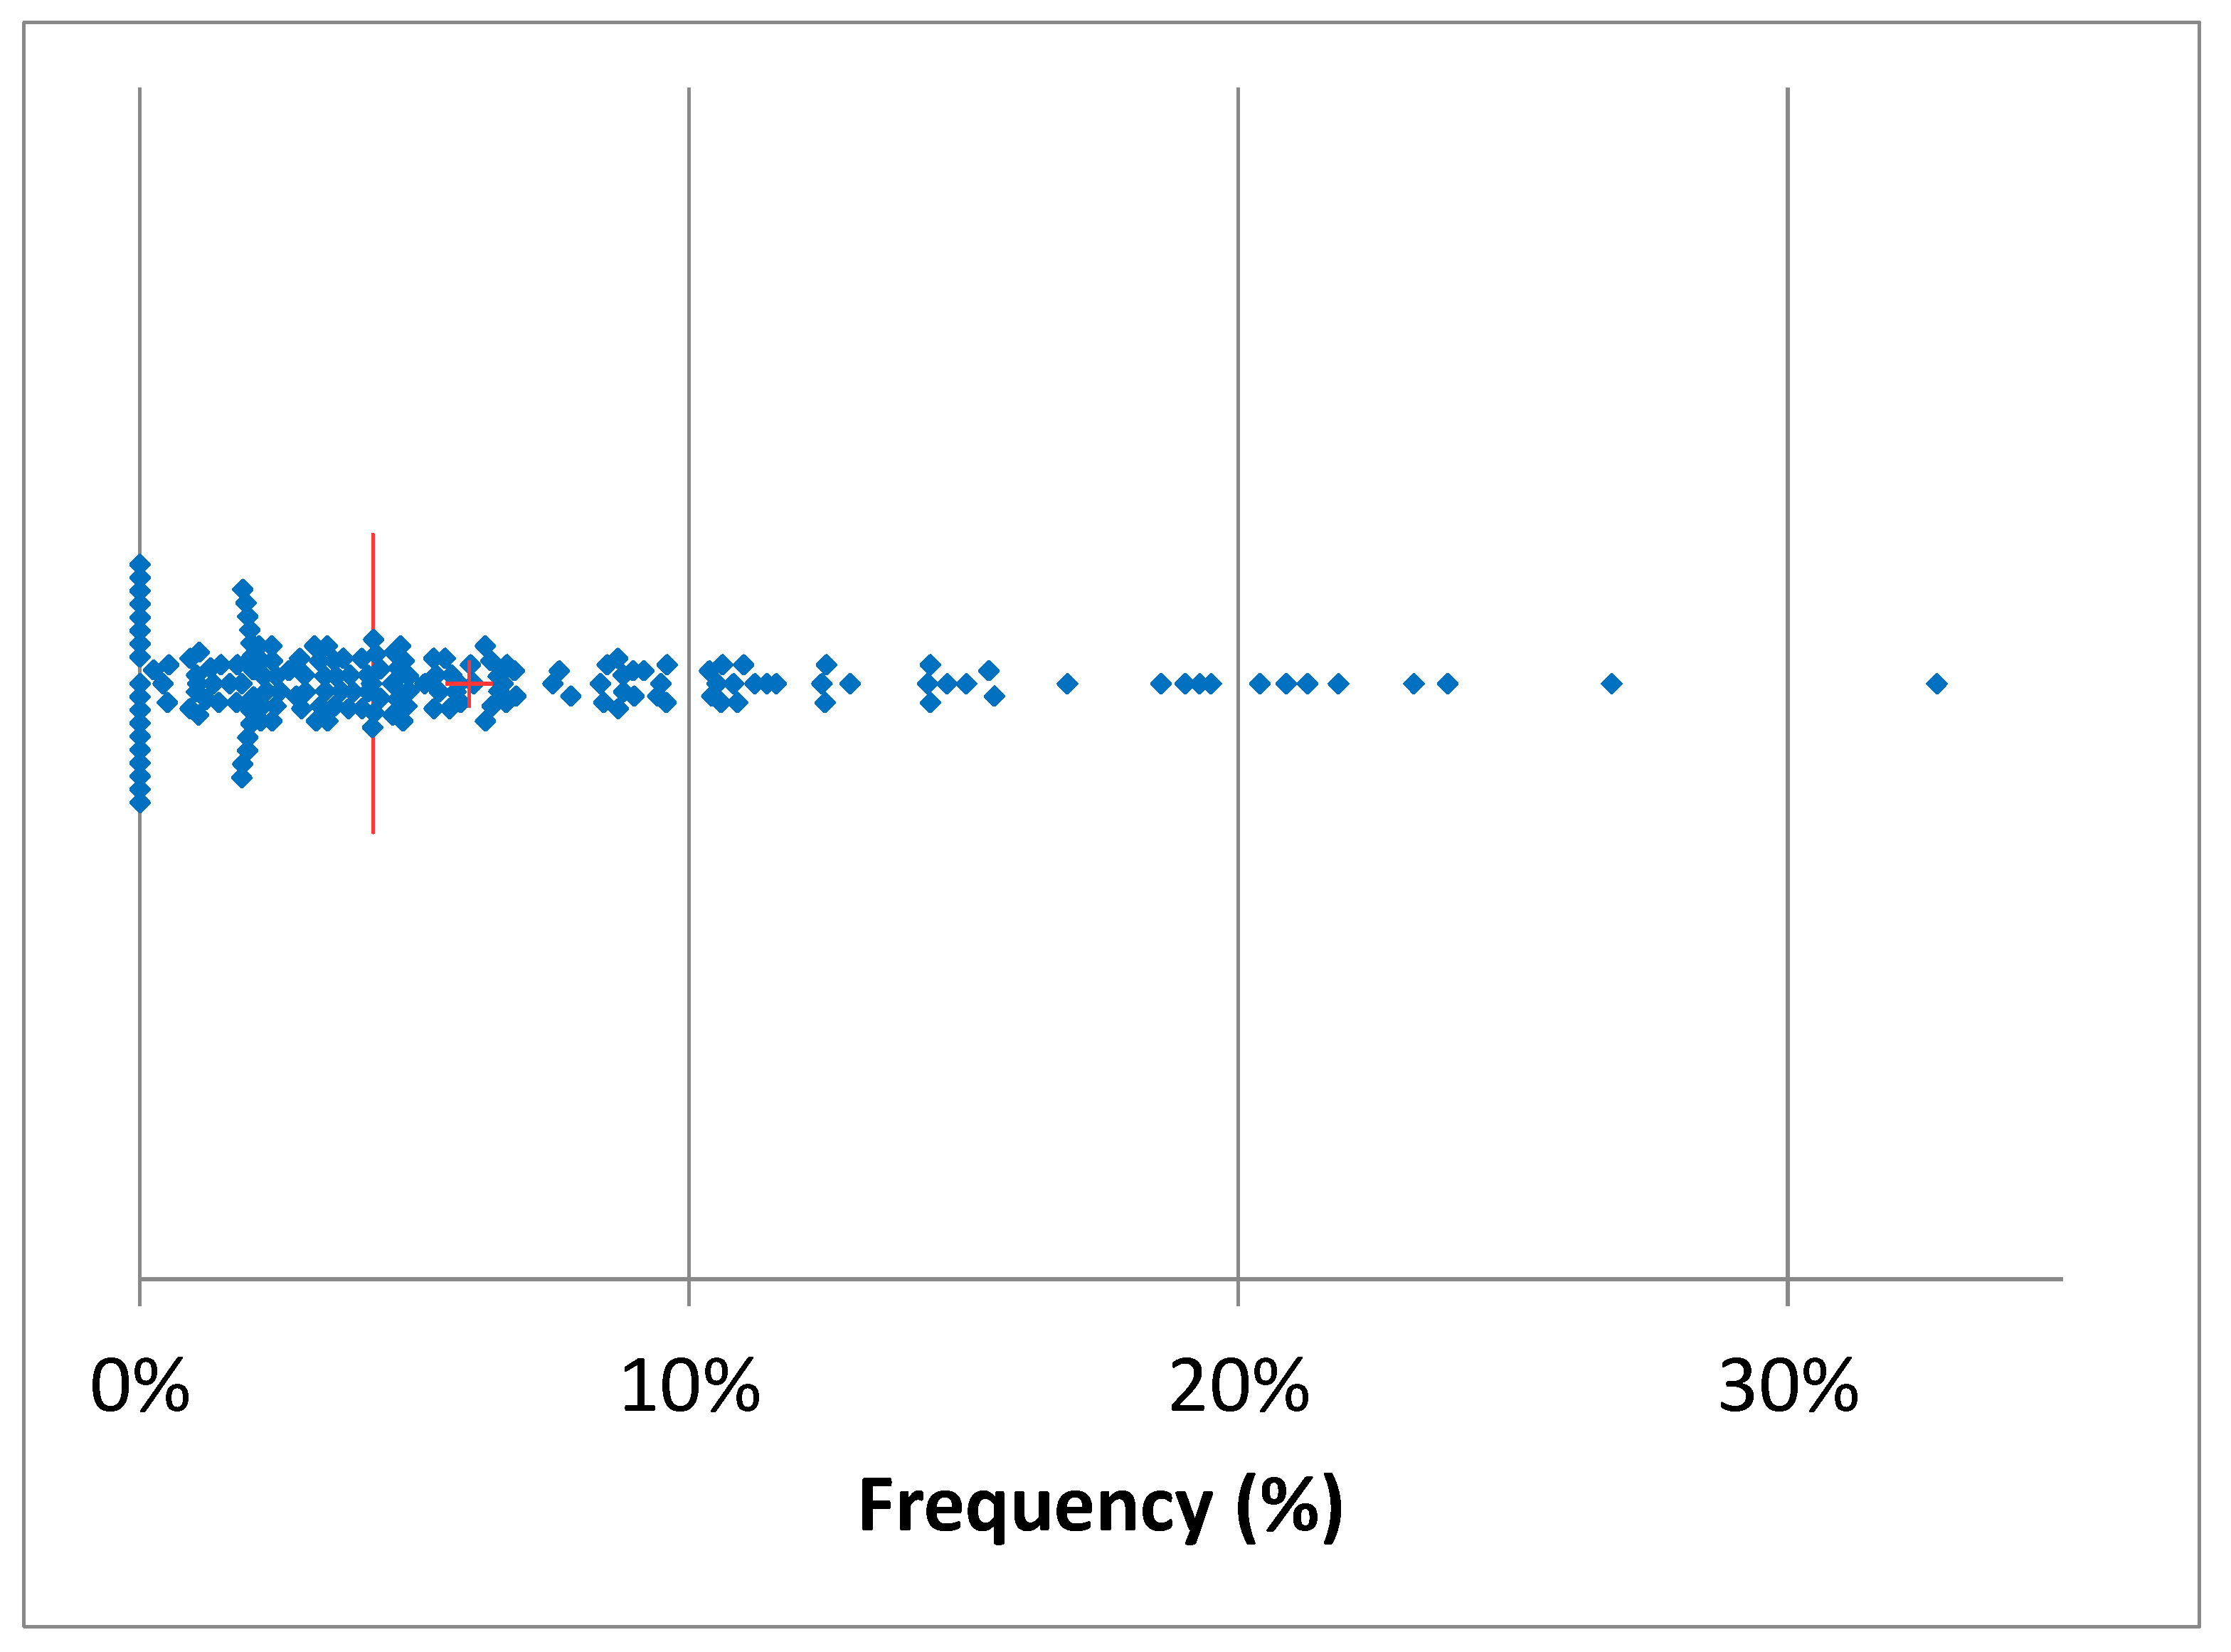
Table 2 summarizes the number of total AMT in 2024 and the proportion of mastitis treatments among them. The total AMT varied between 17 (herd U) and 2695 (herd K), while mastitis antimicrobial treatment (MAT) frequency during lactation varied between 4% (herd K) and 96% (herd R) of the total AMT. The median of mastitis antimicrobial treatments was 55%, while in the 25% the herds the MAT frequency was below 35% of the total AMT. The monthly median of the frequency of AMT per cows in the herd (AMT/CH) was 10.3% (
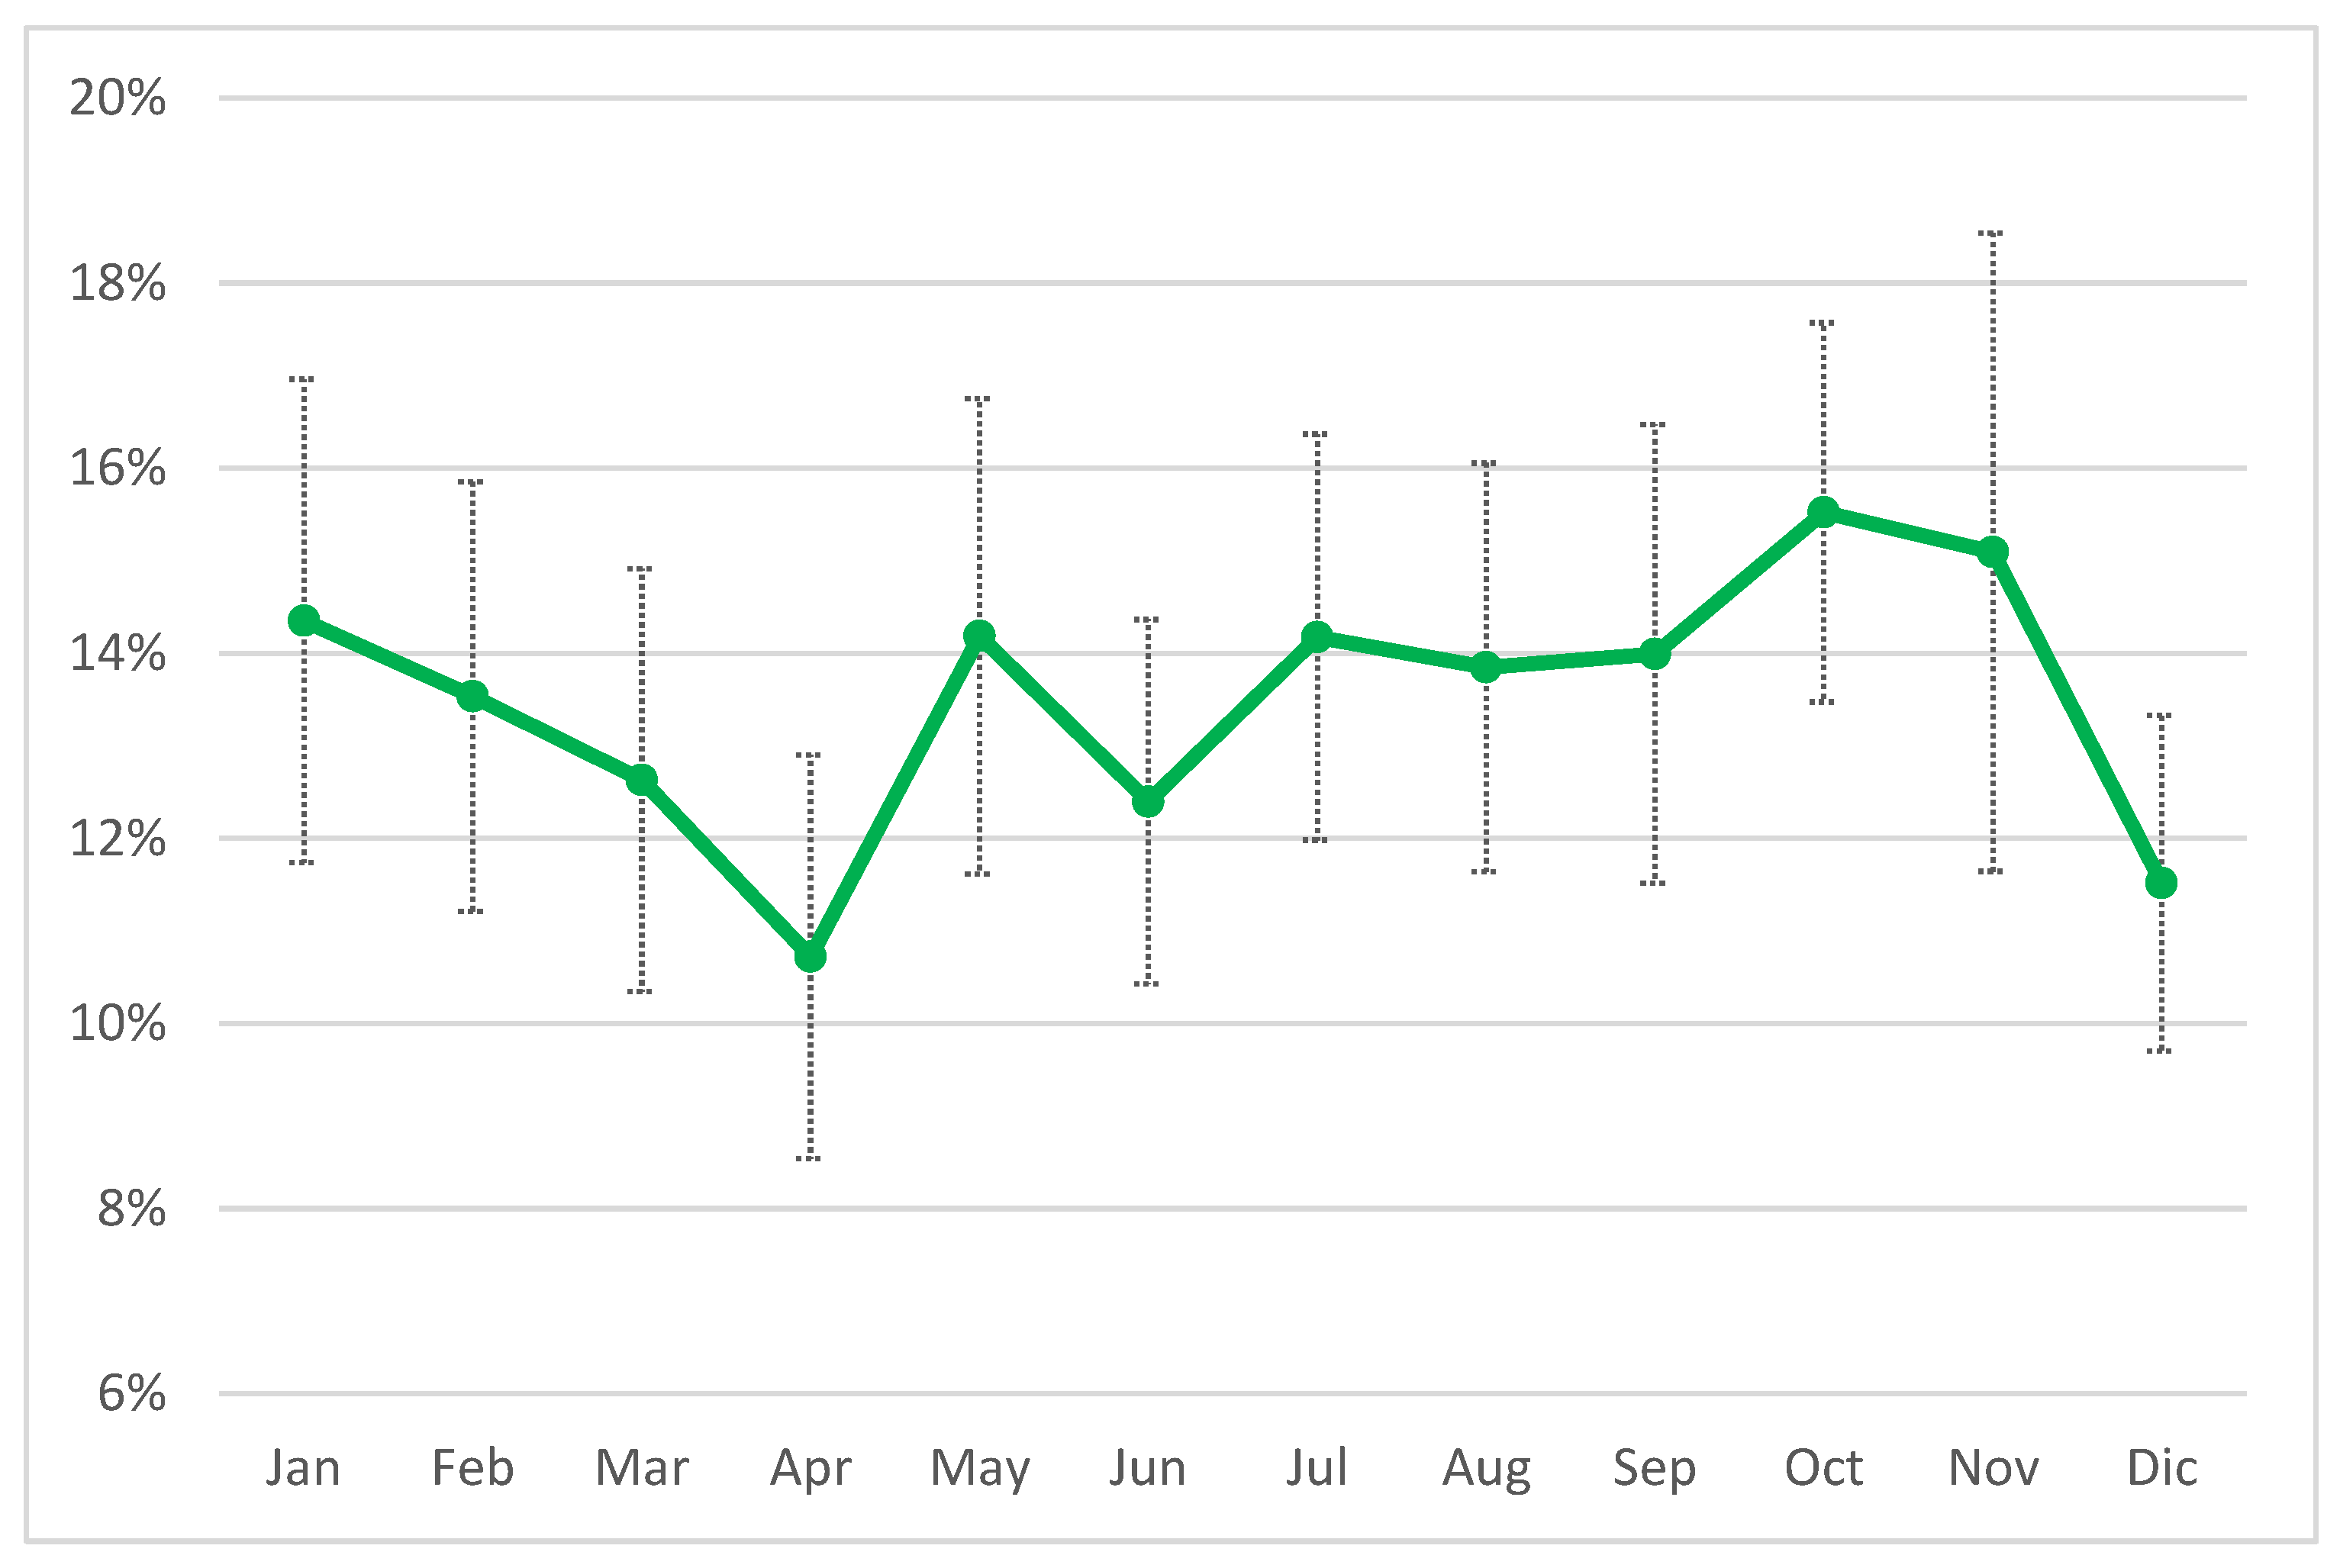
Figure 3) and in 50% of the herds AMT/CH frequency was in the range 12-70%. The mean was, obviously, higher (13.5%), and the first quartile was 6%, while the third was 18.8%, suggesting that the overall frequency of AMT/CH was relatively low, on monthly basis. This observation was confirmed by the distribution of treatment by month of the year ranging between 10% and 16% (
Figure 4), with lower values in April and December, while the higher values were observed in October and November.
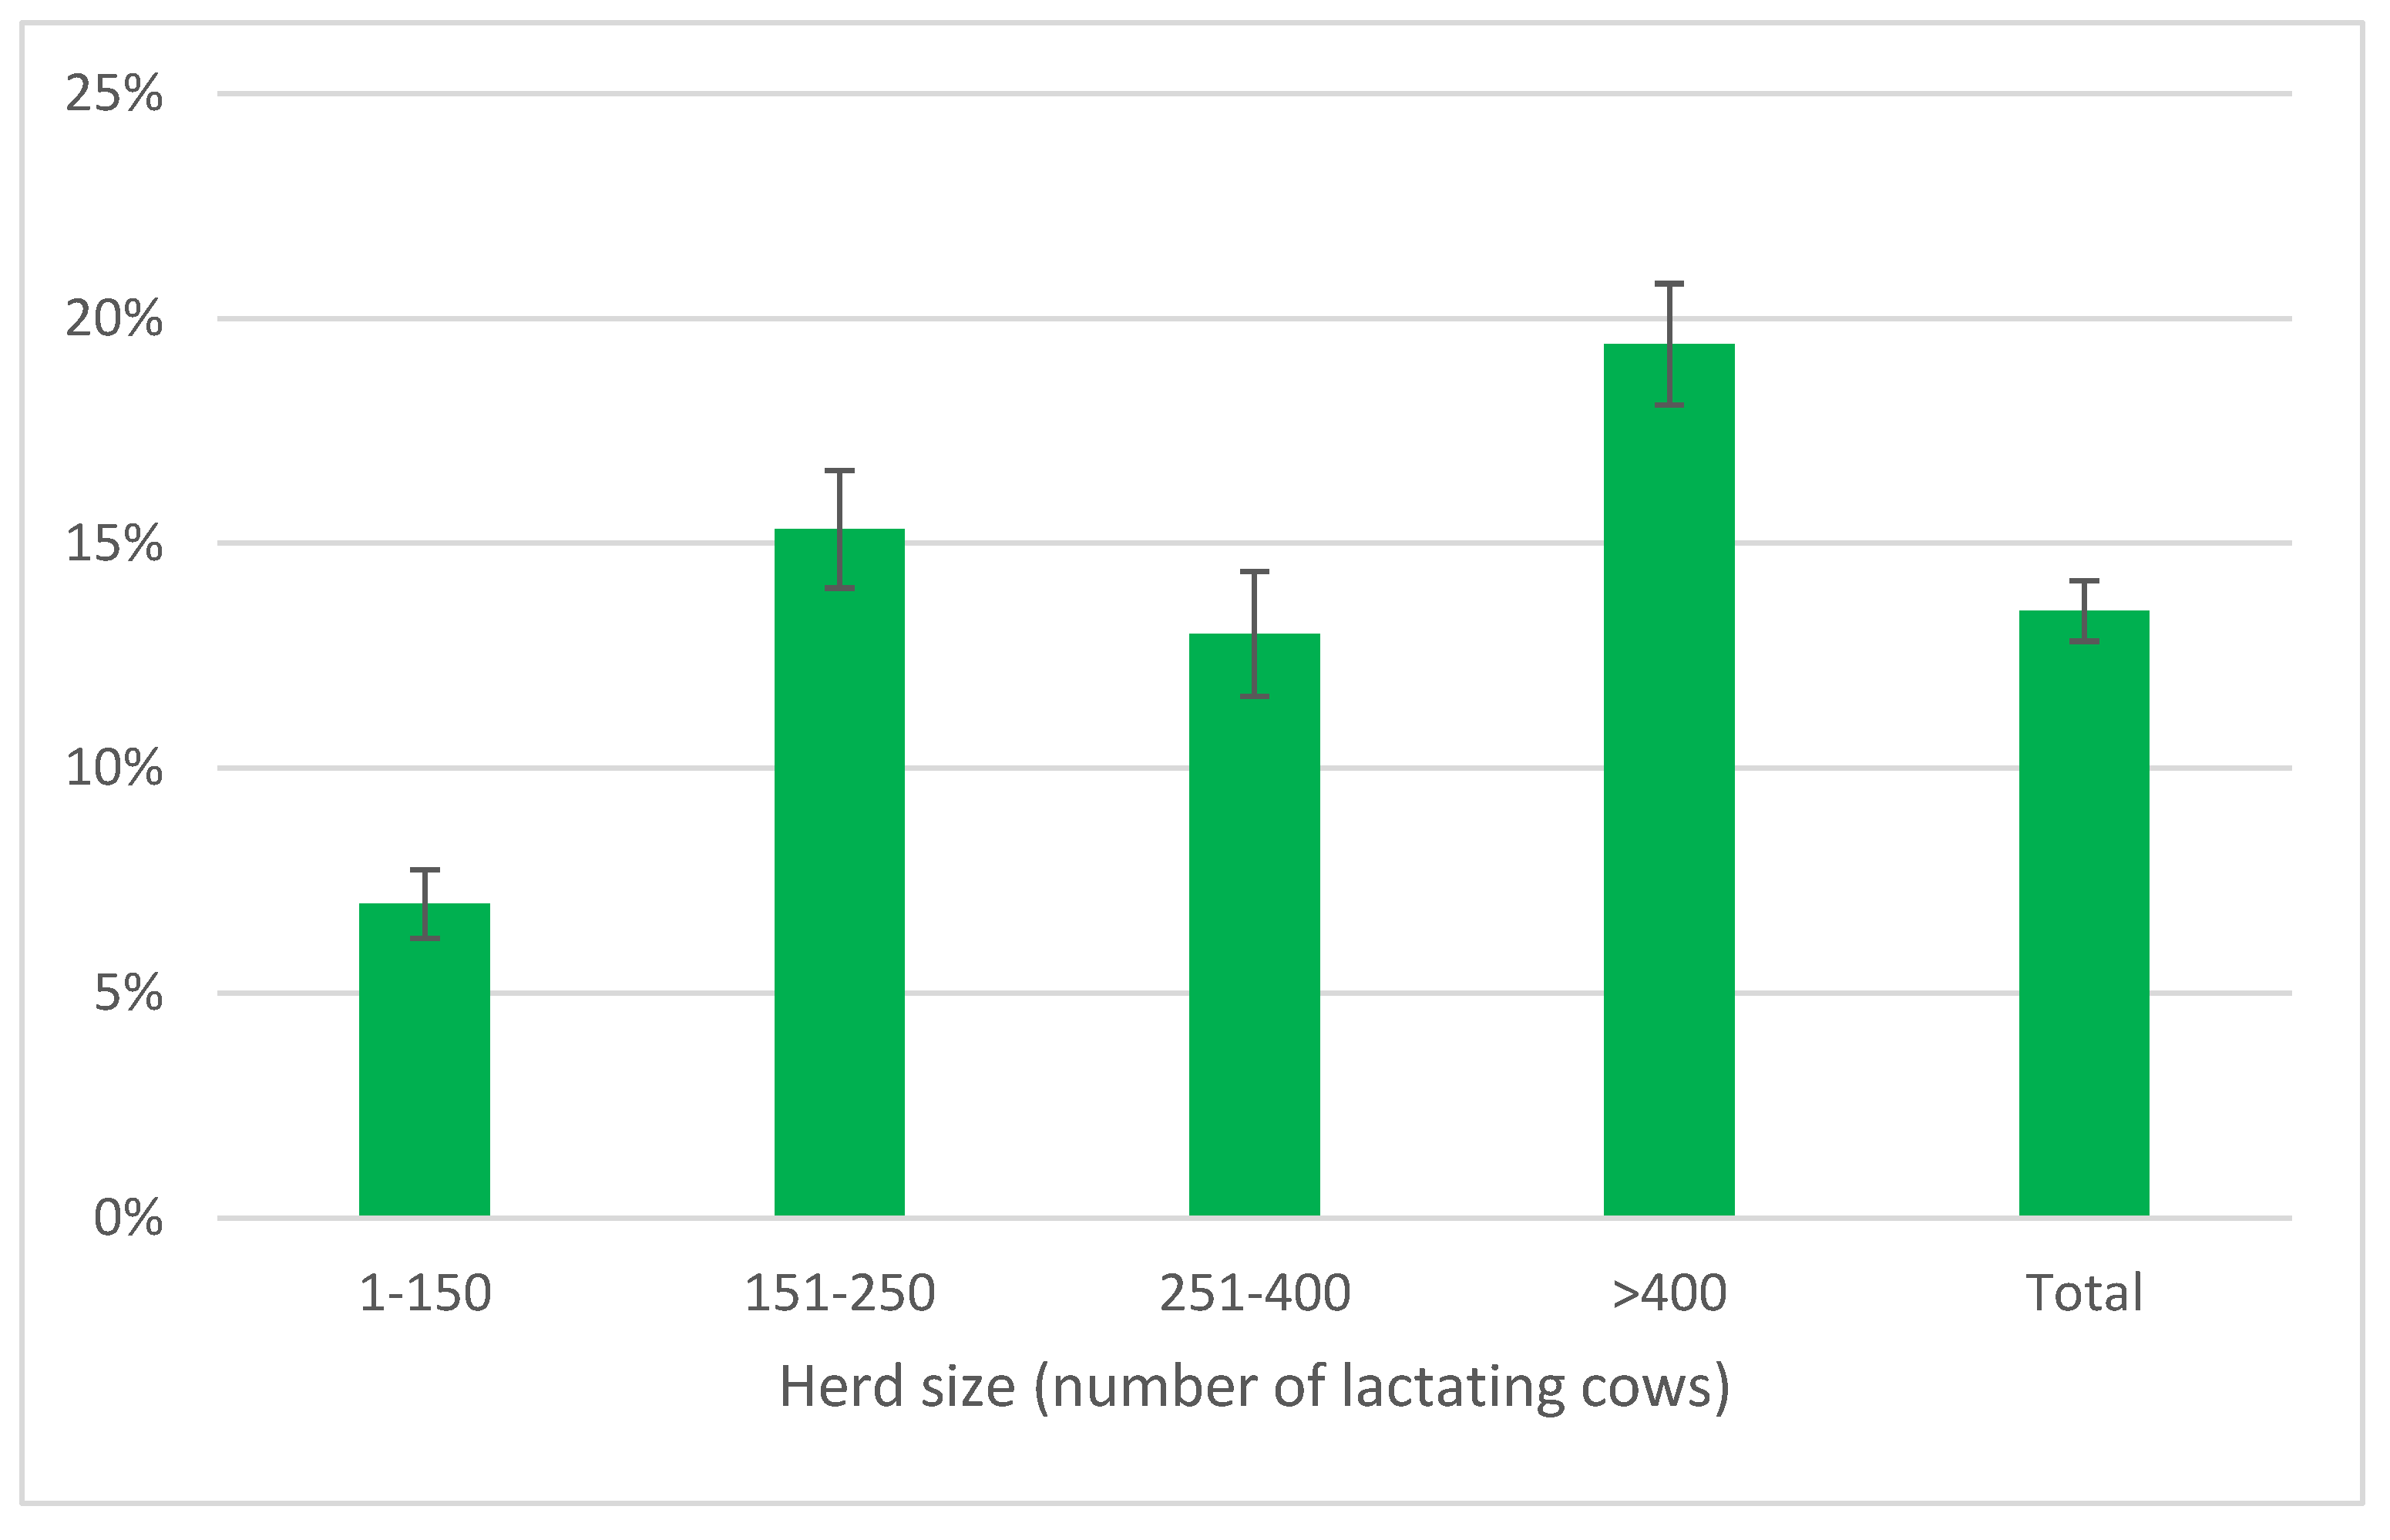
The distribution of AMT/CH by herd size (
Figure 5) showed as the smaller herds had the lowest mean frequency (7.0%±0.8%), while in larger herds the values were always over 10% with the highest one in largest herds (19.45±1.3%).
3.3. Definition and Description of Herd Immune Status
The variable PLCC was used to define the immune status of the herd. This variable represents the amount of PMN in milk, since the variability of this marker is mainly due to changes in the proportion of PMNs, while the proportion of LYM is relatively constant [
16,
20].
If we define a healthy cow as having a SCC in the range of 10,000–50,000 cells/mL and a DSCC of 60% [
20], the PMN concentration will be approximately 6,000–30,000 cells/mL. In both human and veterinary medicine, neutropenia is defined as a PMN level below baseline values [
33,
34]. Based on these considerations, we assume that a PLCC value below 5,000 cells/mL is a conservative threshold for defining cows at risk of having an inadequate level of PMN (neutropenia), and this level was considered for further analysis.
The distribution of the frequency of cows below the value of PLCC <5000 cells/mL was reported in
Figure 6. The median of the distribution is 4.2%; therefore 50% of the herds had higher frequency of cows below the threshold and 25% of them had a frequency ≥ 8.6%.
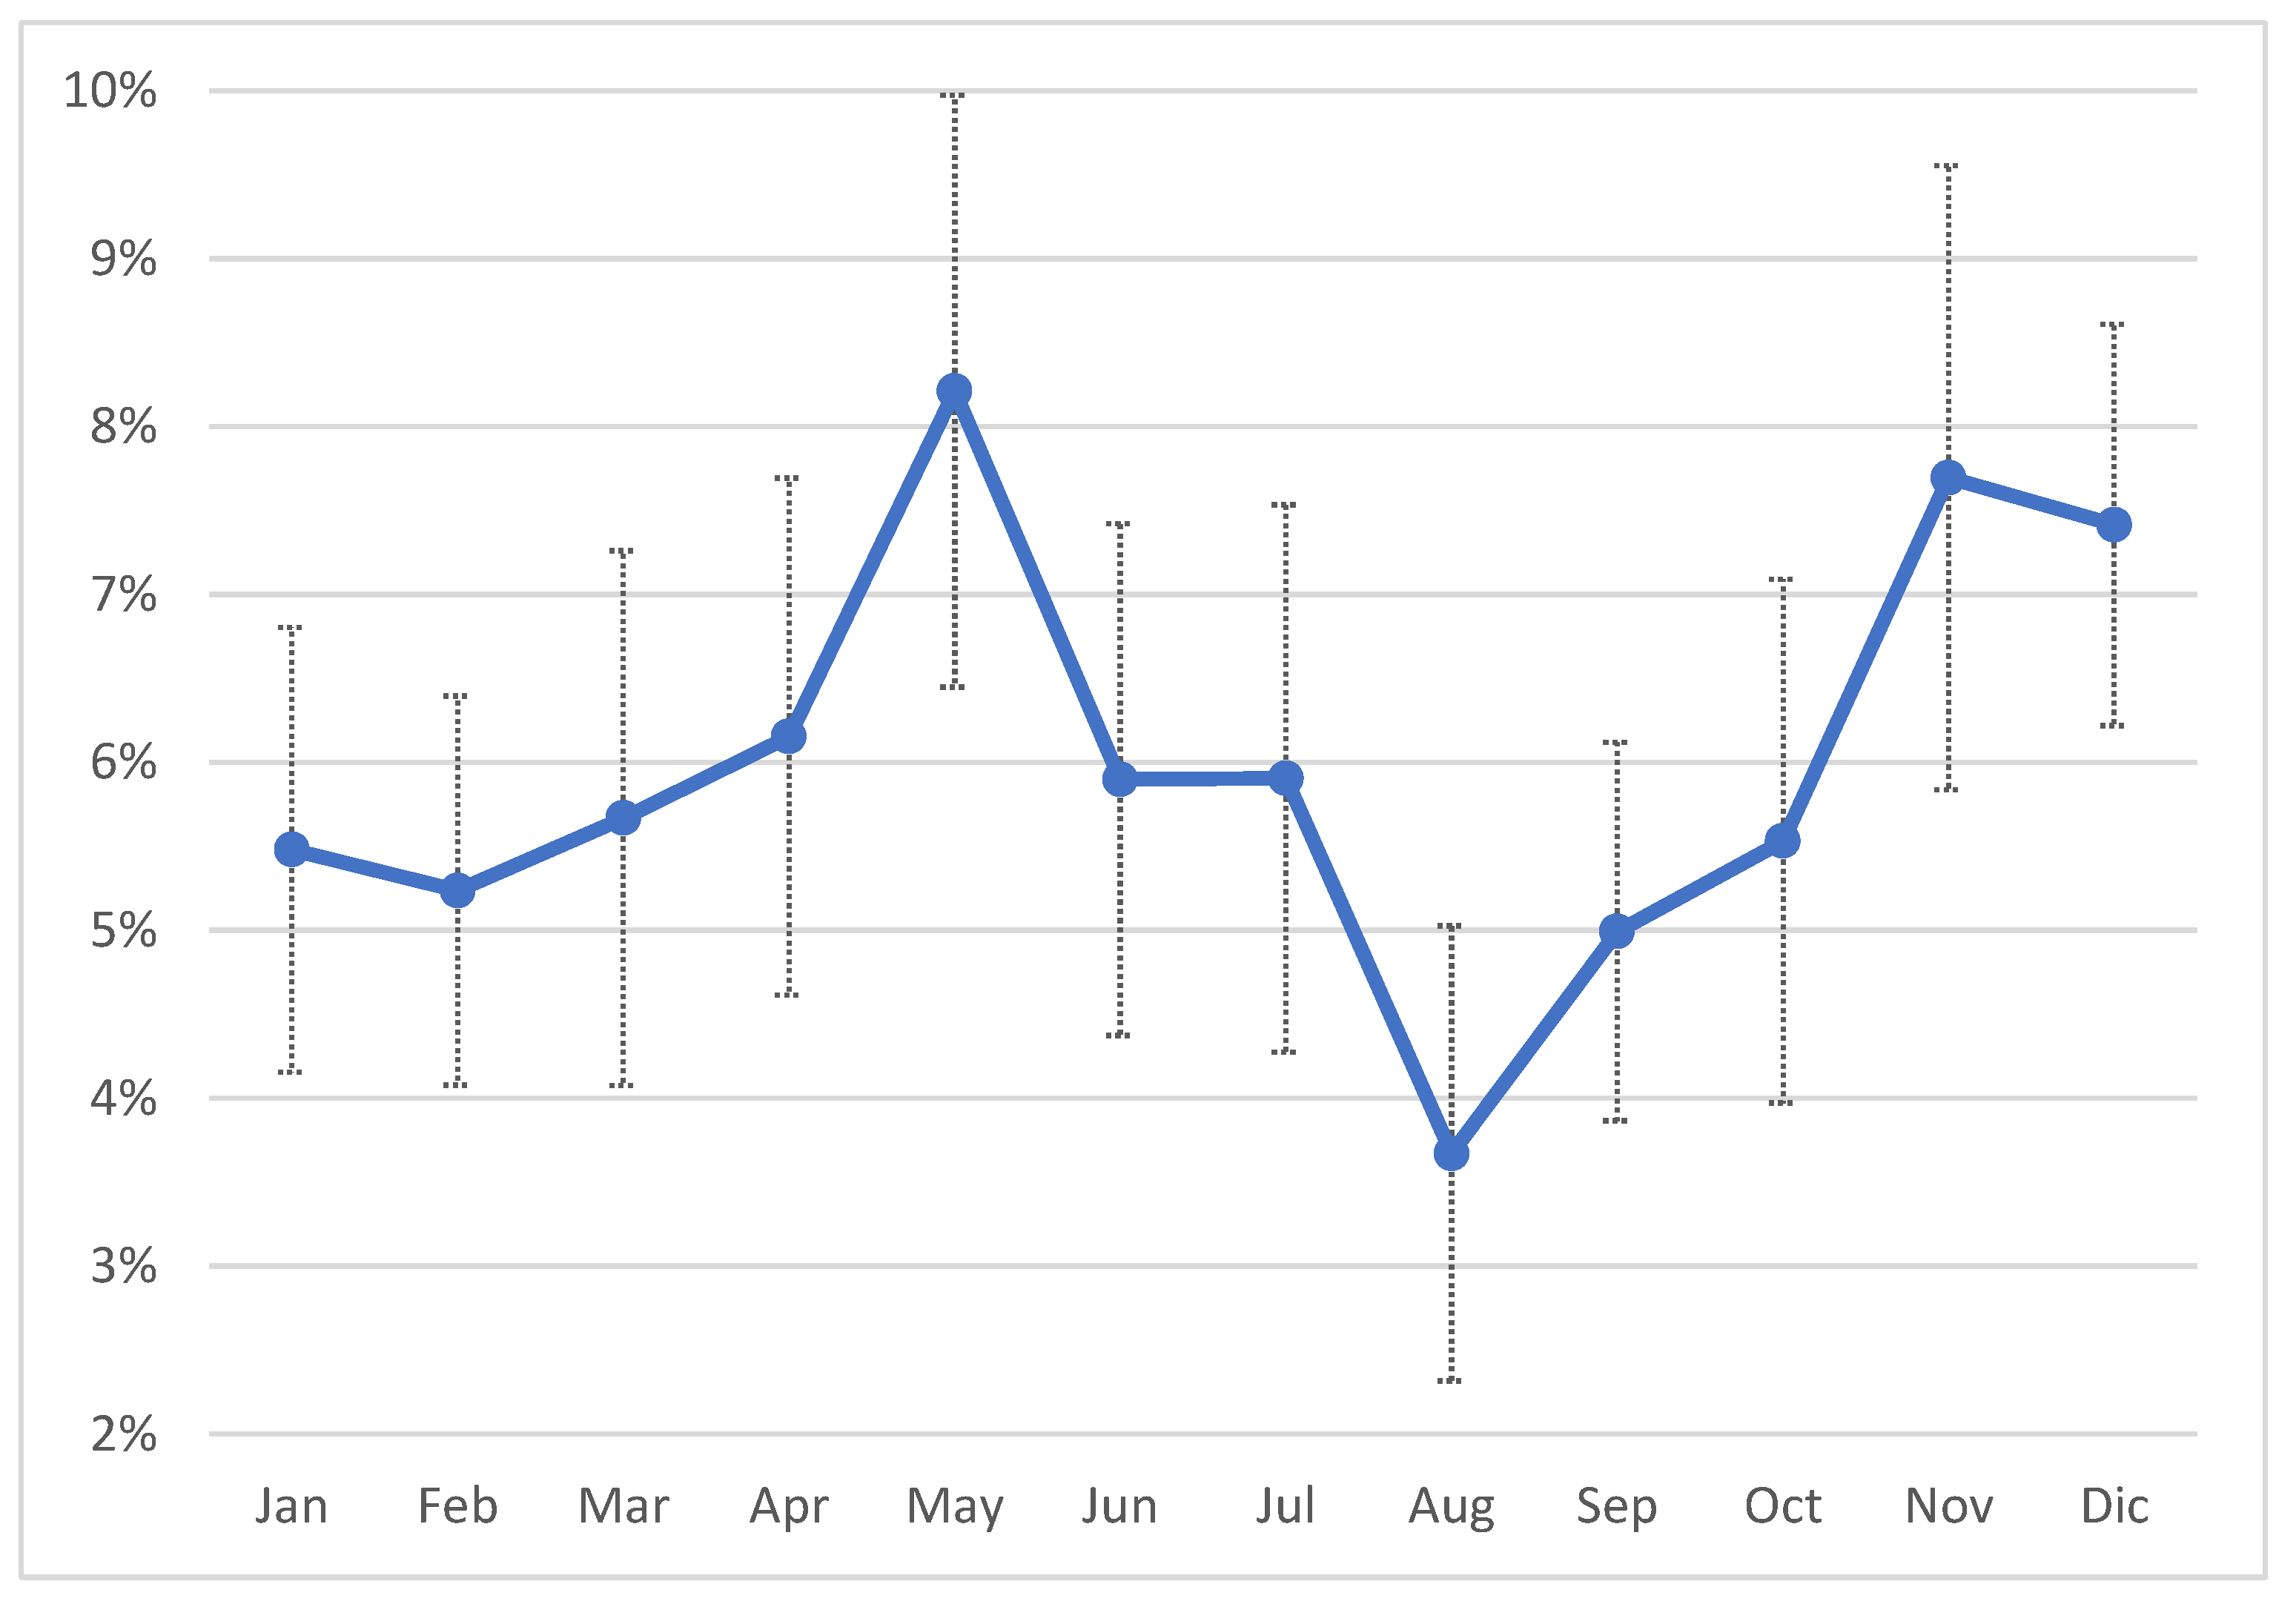
During 2024 the frequency of cows below the threshold varied between 3.7% (August) and 8.2% (May), with higher frequencies during winter months (November and December) (
Figure 7).
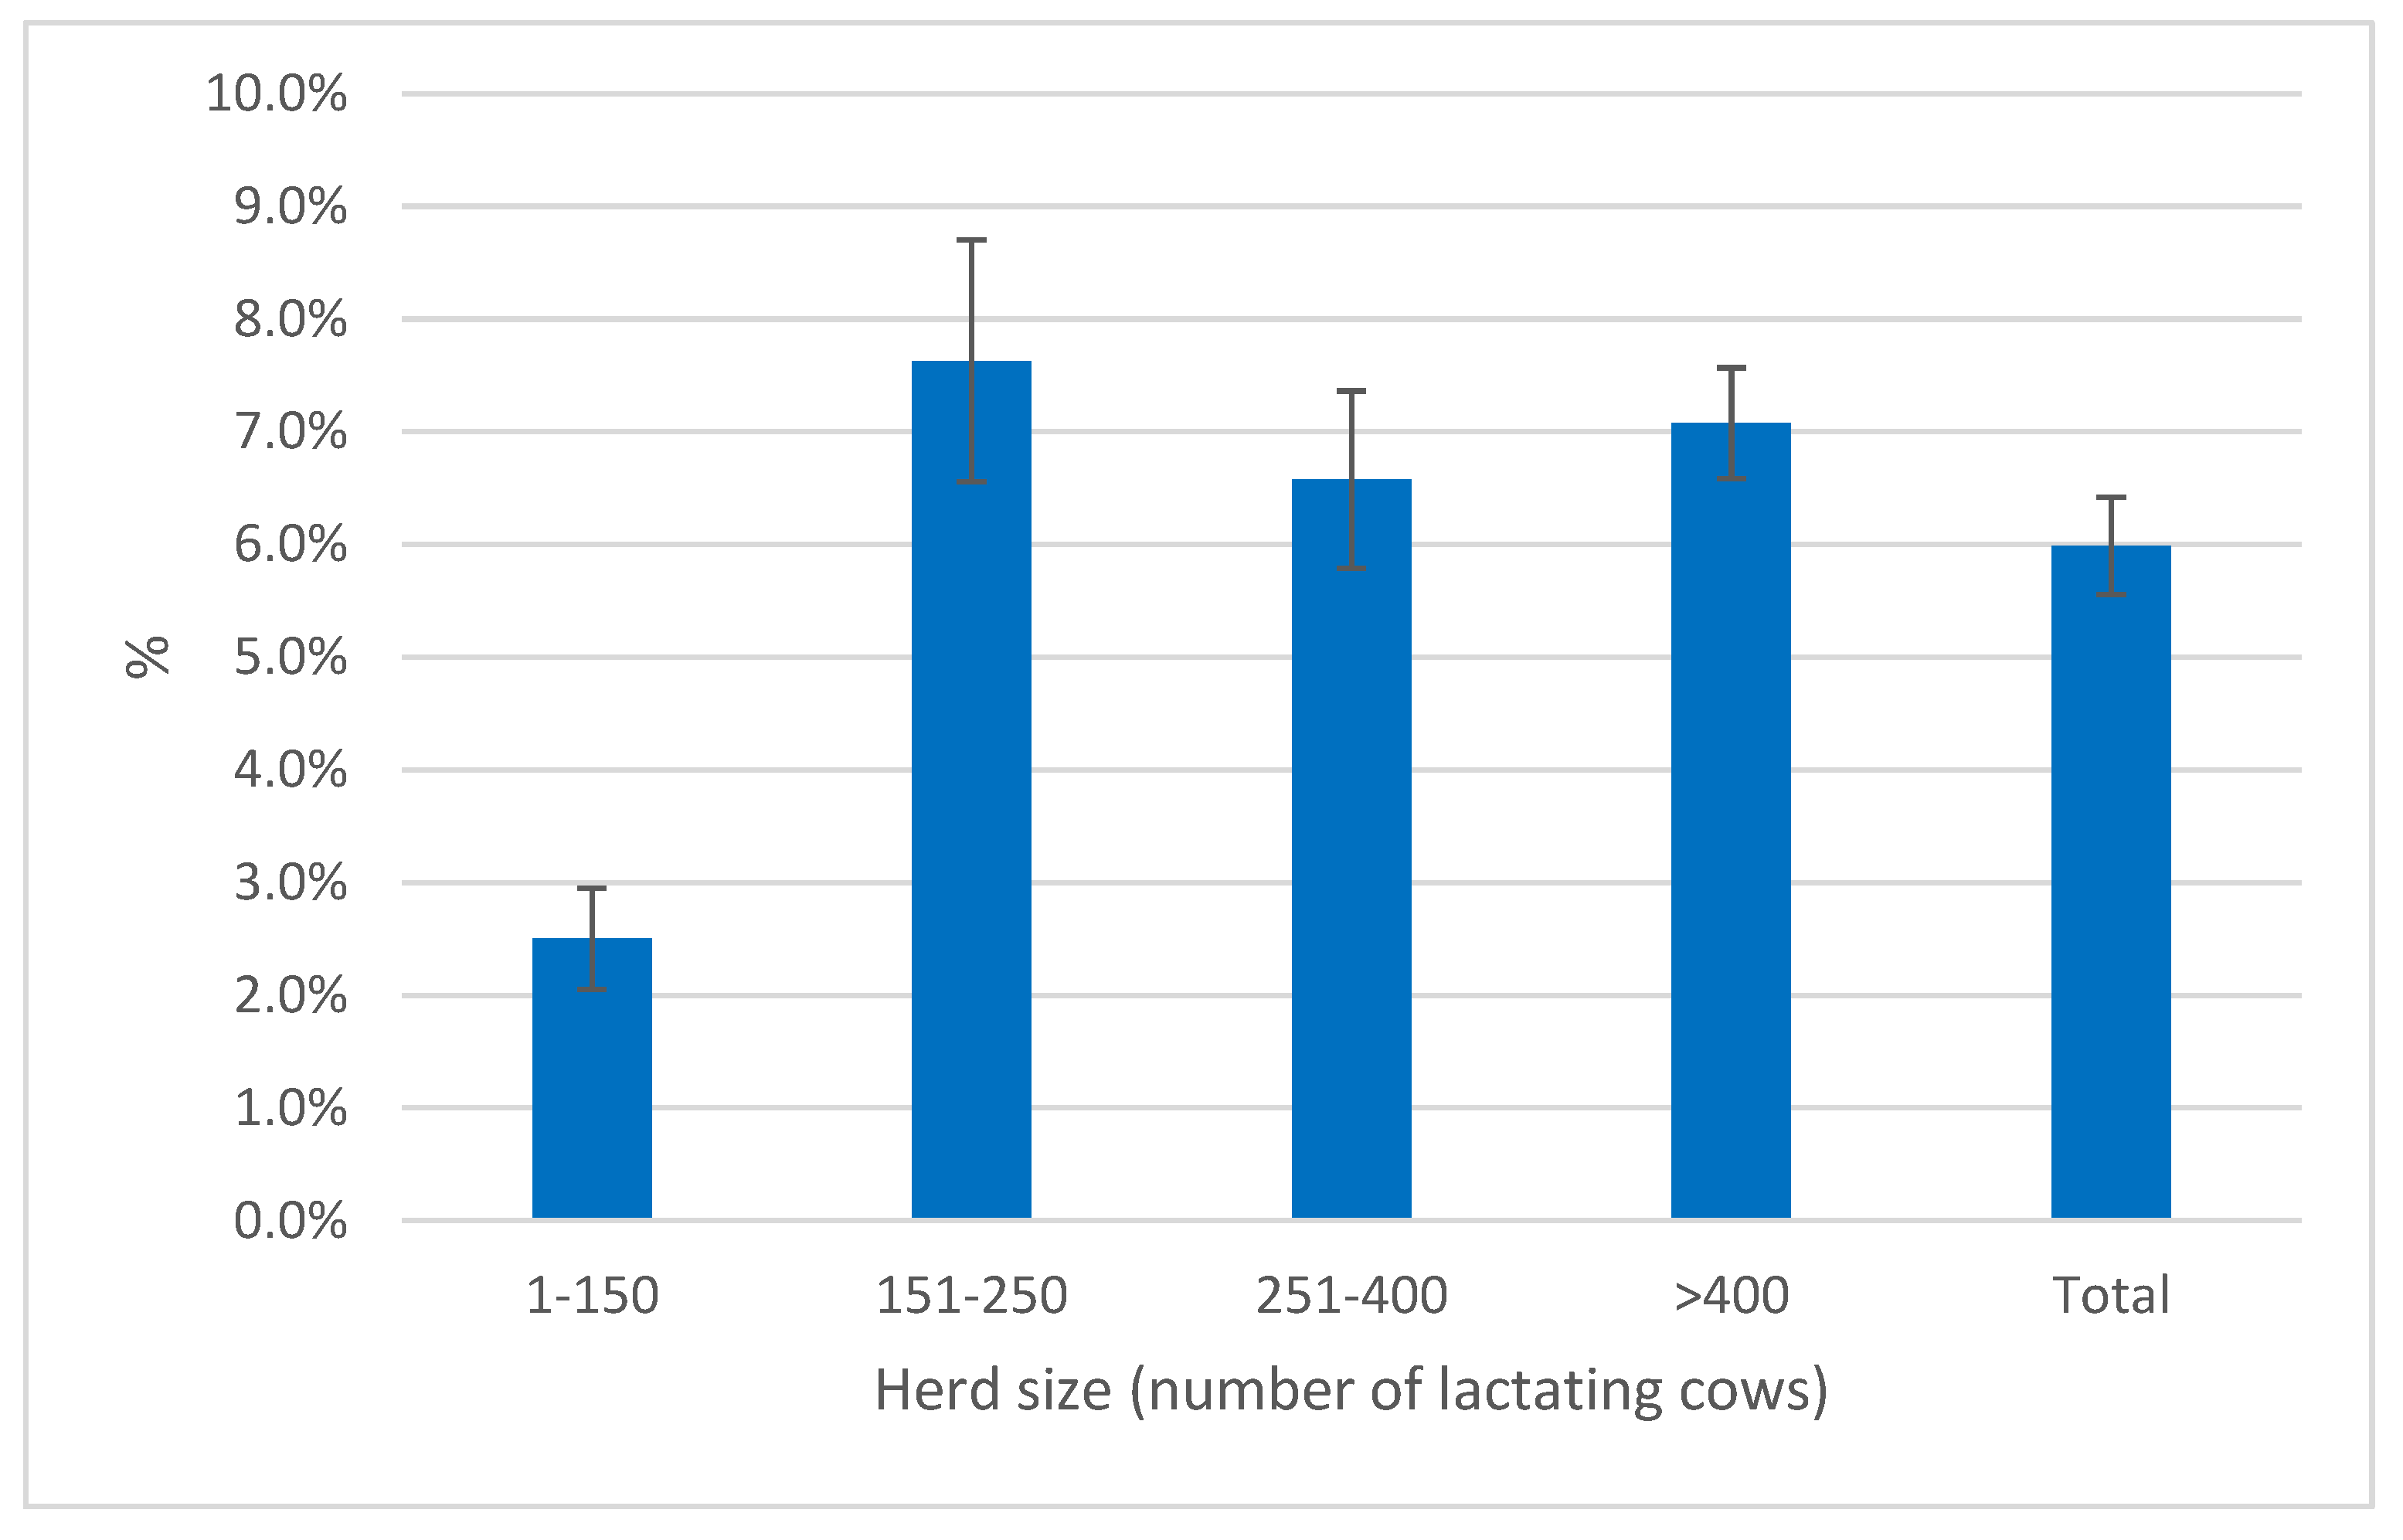
Herd size affected also the frequency of cows below the PLCC threshold. Indeed, the smaller herds had a mean below 2.5%, while in the larger herds the means were close and in the range 6.6-7.6% (
Figure 8).
3.4. Correlation Between Immune Status and Frequency of Treatments
The objective of this study was to investigate the presence of a correlation between the frequency of cows below the PLCC threshold and the frequency of treatments as an indicator of a reduced immune competence, leading to an increase in the frequency of disease.
The initial step in the research process entailed the examination of whether the cellular pattern exhibited by the cows fell below or above the established threshold. The findings indicated that low PLCC values were associated with a low proportion of PMN (see
Table 3). Notably, the proportion of PMN in samples with PLCC values <5000 cells/mL was nearly half that observed in the high PLCC samples. It is obvious that SCC levels are diminished in cows with a PLCC count < 5000 cells/mL, and these values are widely regarded as an indicator of optimal udder health. The frequency of samples falling below the established threshold is low, though not negligible, accounting for 6.5% of the total. These findings support the hypothesis that this condition does not have a physiological basis.
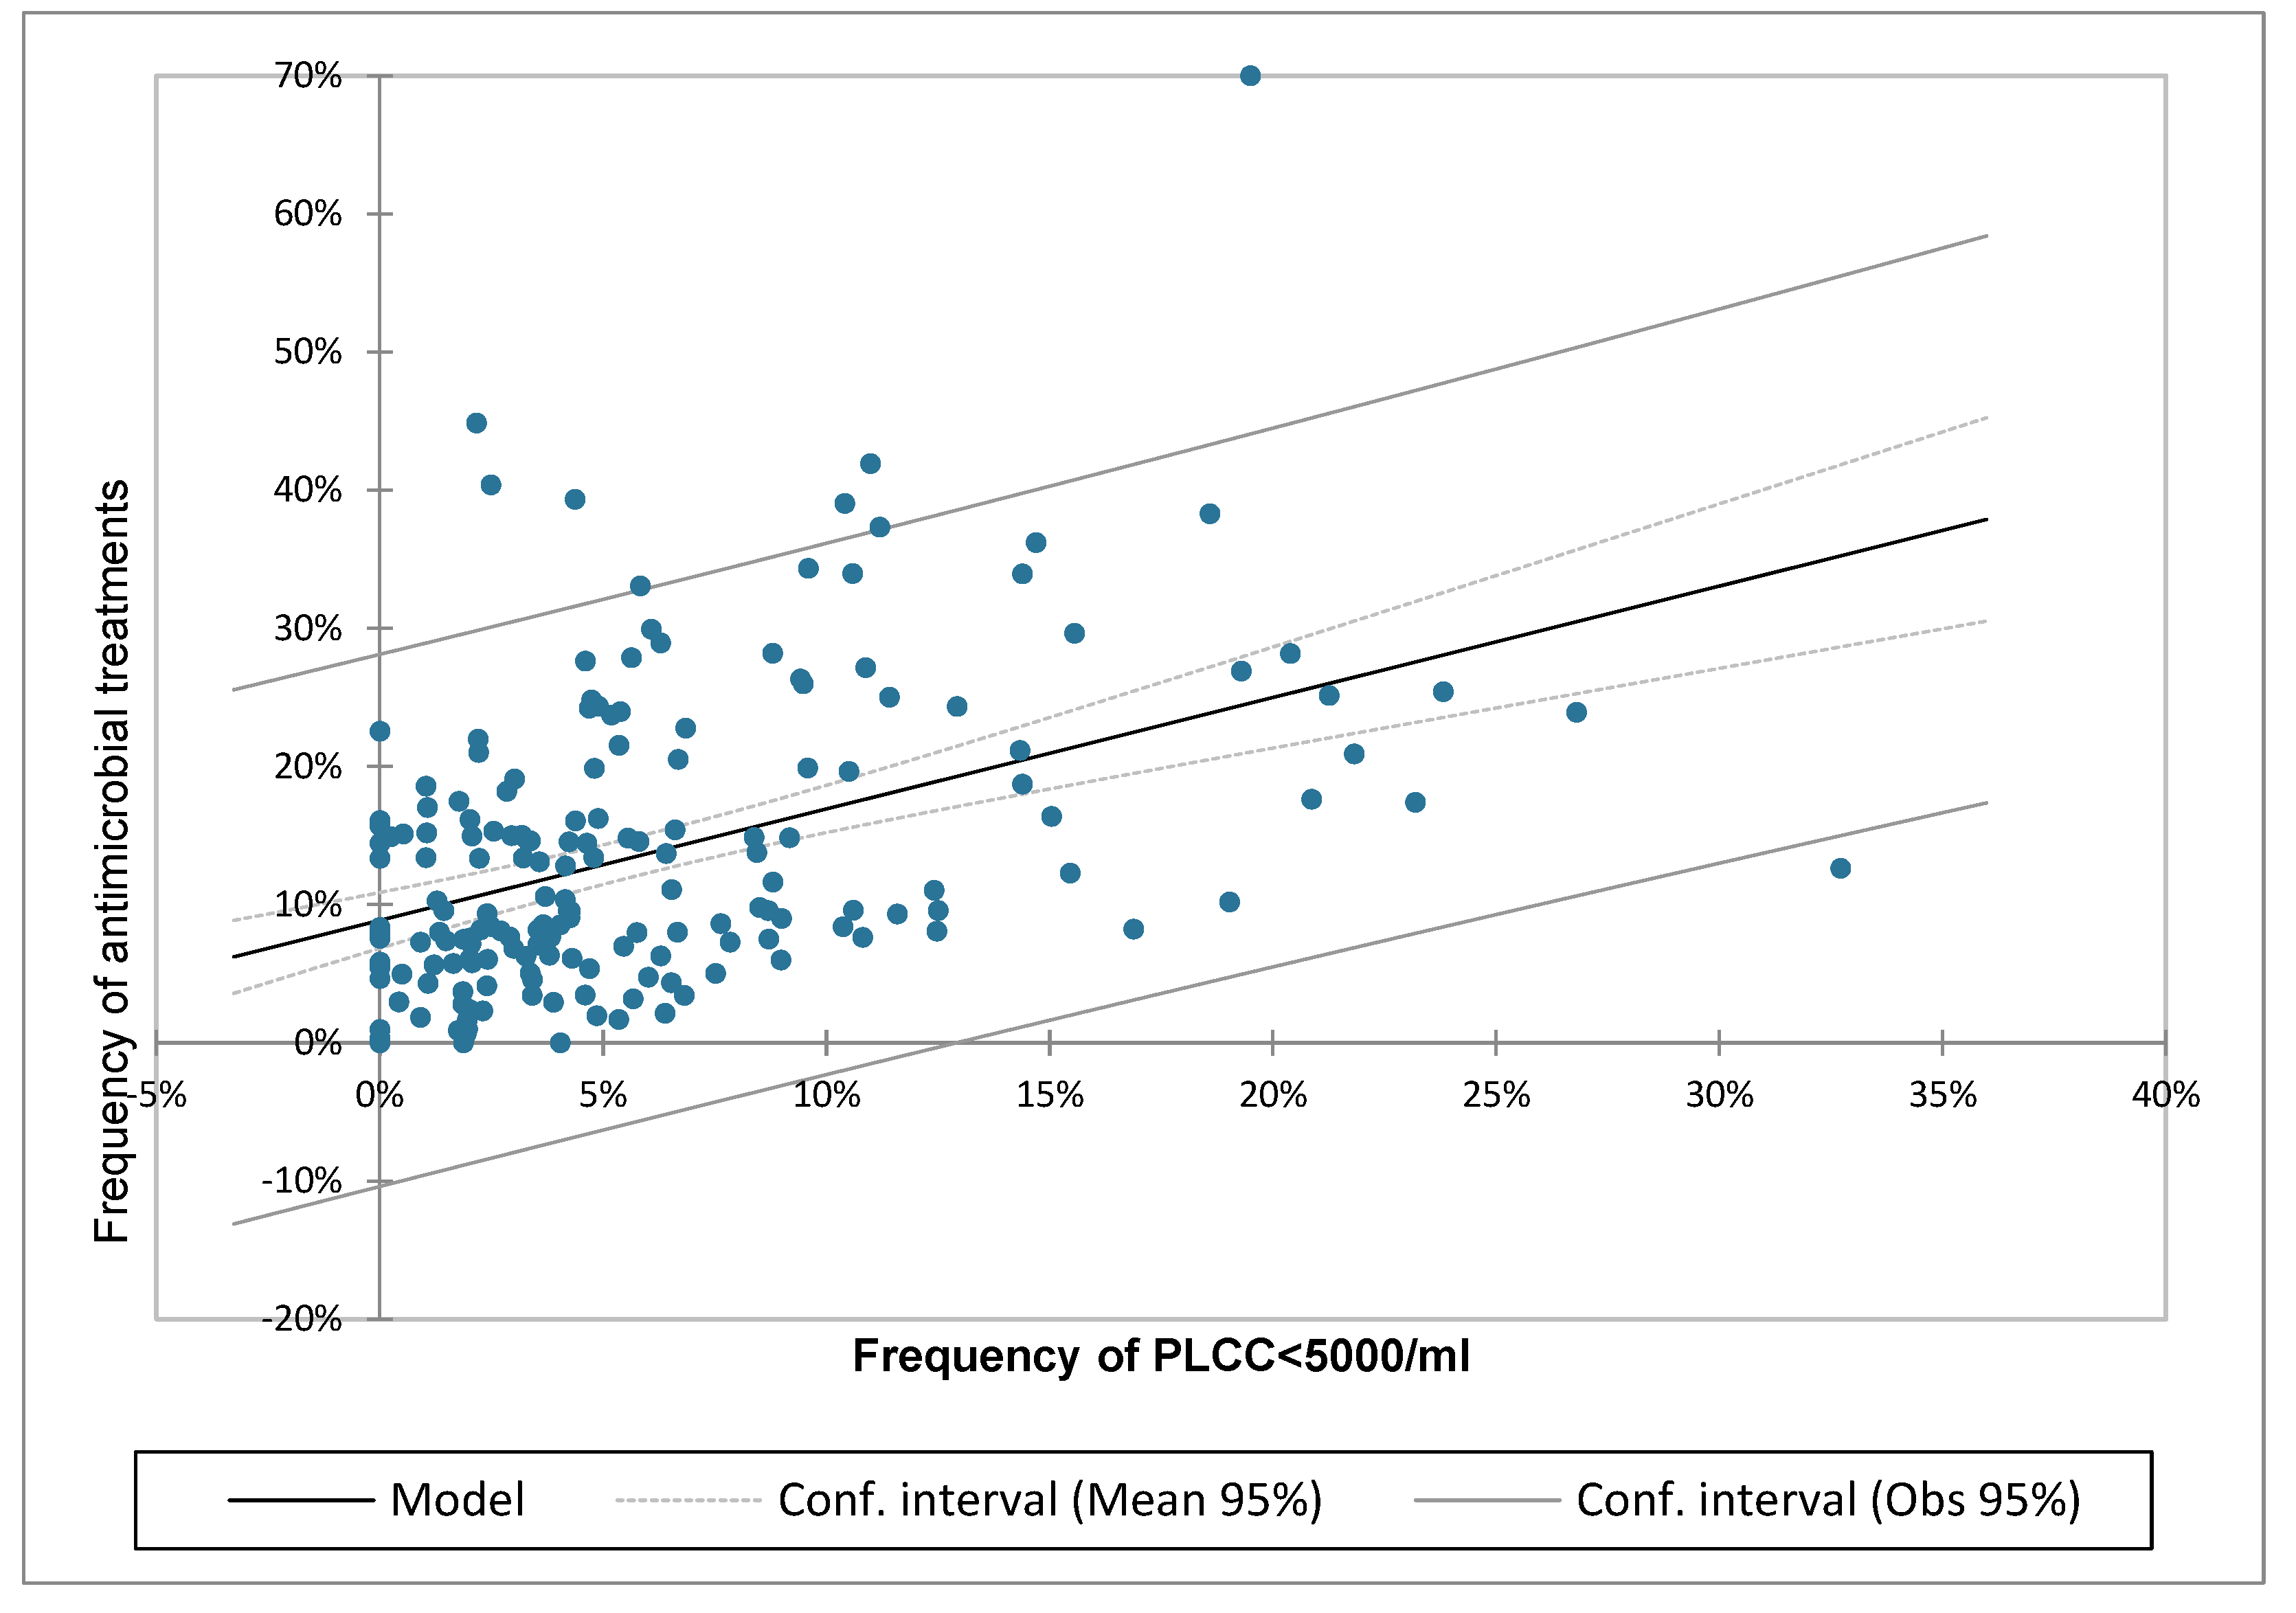
The Pearson’s correlation coefficient was calculated for the monthly frequency of PLCC <5000 cells/mL and the correspondent frequency of AMT/CH. The results showed as the coefficient was 0.44 (95% CL 0.31-0.55) which is statistically significant (p<0.0001).
The linear regression analysis was reported in
Table 4 and in
Figure 9. The statistical analysis confirmed the presence of a significant association between the two parameters with a regression coefficient of 0.19 and a linear increase of AMT/CH as the frequency of cows with PLCC <5000 increased.
The existence of a statistically significant and positive association between the frequency of cows with a PMN content < 5,000 cells/mL and the number of antimicrobial treatments administered suggests that a low PMN content in milk may be indicative of a cow’s diminished immune competence. This result also suggests that identifying a threshold for the frequency of PLCC<5000 cells/mL may serve as method to define a herd as being at risk of increasing the number of treatments. In practice, the increase in the frequency of PLCC<5000 cells/mL is assumed to represent a status of neutropenia or, more generally, an impairment of nonspecific immunity, leading to an increase in diseases and, consequently, in AMT.
To define this threshold the ROC was calculated defining as response variable two different levels of frequency of AMT/CH: 6% and 10%, representing, respectively, the lower 25th percentile and the median of the monthly AMT/CH frequency in the 20 herds considered.
The results were reported in
Table 5 and showed that the ROC curve related to the 10% AMT/CH threshold gave relatively poor results with an accuracy of only 67% and values for sensibility and specificity respectively of 65% and 69%. The 6% AMT/CH threshold gave more interesting results having an accuracy of 78% and higher values for sensitivity (85%), while specificity was lower (57%). Practically, when in a herd the frequency of samples with PLCC below 5000 cells/mL is over 2%, we may expect in 85% of the cases a level of AMT >6%. On the other hand, a herd with a frequency of PLCC samples <5000 cells/mL is >2% has a 86%probability to treat more than 6% of the cows (positive predictive value). If the PLCC frequency is >2%, there are 54% chances that the herd also have <6% of treatments (negative predictive value).
4. Discussion
Modern, sustainable dairy farming must address a variety of issues raised by civil society, health authorities and processors. One of the most important of these is reducing the use of antimicrobials to slow the spread of antimicrobial resistance [
35,
36]. This is one of the most important issues when the dairy production is considered from a One Health perspective. The reduction of antimicrobial usage can be achieved through various approaches, such as improved and earlier diagnosis, better management and higher hygiene standards. However, the approach with the greatest potential is increasing the animal’s immune status [
37,
38]. All of these new approaches require tools that allow rapid and efficient changes to the overall management of farms, which are constantly growing in size. One of these tools has been in use for a long time and consists in the DHI approach through MTR system, which is carried out in Italy by the National Breeders’ Association (AIA). While this tool is not new it has evolved over time thanks to new technologies that have made it possible to supplement the classic parameters (cells, fat, proteins and lactose) with many others that provide information on metabolic and health aspects. A fundamental step forward in this regard is the ability to perform a differential count of milk cells. The assessment of DSCC showed to be accurate and efficient in defining udder health, as shown by several papers [
17,
22,
23,
24,
39], but also in assessing the effects of different management systems and the changes in milk composition [
19,
40].
If we consider the capability of DSCC to assess the inflammatory status of the gland to be achieved, the ’other side of the coin’, or the assessment of the cow’s immune status, is still unexplored. As stated previously, in healthy cows, production and destruction of PMN is tightly regulated, which keeps their number in blood, milk and tissue constant. Therefore, we may assume that PMN concentrations in milk, as measured by PLCC, may be a proxy of the amount of circulating PMN, and lower levels in milk are a sign of a neutropenia or of an impaired migration from blood. Such impairment could be considered as a factor increasing the risk of an increased occurrence of infectious diseases. If confirmed, this hypothesis would support the use of PLCC as a marker of immunity and it may be used to identify herds or cows at risk.
One method of verifying this hypothesis is the observation of an increase in the incidence of the disease, concomitant with a decrease in the number of PMN. However, the accuracy of disease recording is often uncertain, particularly, but not exclusively, in Italian dairy herds. The recent implementation of Regulation (EU) 2019/6 of the European Parliament and of the Council has led to the mandatory recording of antimicrobial treatments administered on Italian livestock farms within an official electronic database. This approach allows us to obtain reliable data that does not depend on the breeder’s willingness, ability, and availability to record pathologies, a problem that has always plagued this type of survey.
Therefore, we have obtained consistent and accurate information regarding diseases that require antimicrobial treatment together with an accurate measurement of milk cells (total and differential) on monthly bases.
This study encompassed 20 dairy herds from Lombardy, characterized by higher herd sizes and lower SCC compared to the regional mean. These herds were selected to represent those with optimal management, performance, and health. Consequently, these herds stand to benefit the most from a consistent and precise monitoring of their immune status. In these herds, the application of AMT had a yearly frequency ranging from 12 to 70% of the lactating cows. The lowest observed frequencies were exhibited by smaller herds, a result that was not anticipated. One potential explanation for this phenomenon is the increased prevalence of voluntary culling, which occurs at a rate of 36% compared to 26% in larger herds [
41]. This practice is driven by the desire to get the financial incentives associated with the European common agriculture policy restrained to herds that reduce antimicrobial treatments.
The status of neutropenia or impaired cellular immunity was defined through the implementation of an approach that has been successfully utilized in the field of human medicine. This approach is based on defining neutropenia when PMN values fell below the lower limit of the physiological range for a defined species. Healthy cows showed to have a PMN content in the range of 6000- 30.000 cells/mL [
20]. Consequently, a value of PLCC<5000 cells/mL was designated as the optimal threshold for an inadequate level of PMN. The results indicated that 6.5% of the samples were below this value, with peaks of approximately 8% observed in May, November, and December. Furthermore, herds of smaller size exhibited the lowest frequencies (<3%), likely for the same reasons that have been posited for AMT frequencies (increase in culling rate). Conversely, the lowest frequency of low PLCC cows was documented in August, coinciding with the period of peak heat stress in Lombardy. This observation indicates that the impact of heat stress on PMN is less severe than previously hypothesized [
42,
43]. The observed findings suggest that the reduction of PMN levels is attributable mainly to other factors, including infection, alterations in management practices, and metabolic diseases, among others [
44].
The statistical analyses performed demonstrated a significant association between the prevalence of cows with a low proportion of PMN in milk and an increased prevalence of antibiotic treatments, not necessarily related to the treatment of mastitis. In fact, both Pearson’s correlation coefficient and linear regression analysis demonstrated a positive correlation. These results suggest that it is possible to routinely identify if the number of cows with low PLCC surpasses an alarm level within a herd. The calculation of this level was performed using the ROC curve, with a threshold of 6% for AMT/CH (the level of the 25th percentile of the herds with lower AMT frequency). The calculated level was established at 2%, which, with an accuracy of 78%, enabled the identification of a herd exhibiting a heightened risk of requiring treatment. This level was determined in a particular group of herds, not randomly selected, which may not be representative of the population in other regions or with different management practices. However, the results of this study demonstrate the efficacy of measuring the cellular markers in MTR, combining them in PLCC variable, and using this latter one in identifying herds at risk of impaired cellular immune response.
Further studies are necessary to substantiate these results, and to verify whether the assessment of immune status at herd level can be applied also to individual cows. The objective of such an assessment would be to identify cows that are at risk of developing diseases due to an impaired immune response.
5. Conclusions
The capacity to discern an ineffective immune response at herd level will empower farmers and their advisors to execute the measures they deem most suitable to restore the animals’ immune response to an optimal level. The findings of this study suggest that the adoption of these measures will result in enhanced animal welfare, a reduction in the use of antibiotic treatments, and, more broadly, an increase in the overall sustainability of the farm.
Author Contributions
For research articles with several authors, a short paragraph specifying their individual contributions must be provided. The following statements should be used “Conceptualization, A.Z. and E.I.; methodology, V.S. and V.G..; software, V.G. and F.Z..; validation, V.S., F.Z. and V.G. formal analysis, A.Z. and E.I.; investigation, A.Z. and V.G.; resources, A.Z:.; data curation, V.G. and F.Z..; writing—original draft preparation, A.Z. writing—review and editing, A.Z., V.S., F.Z; project administration, V.G.; funding acquisition, A.Z. All authors have read and agreed to the published version of the manuscript.
Funding
This study was funded by FEASR—Programma di Sviluppo Rurale 2014–2020 Misura 16.1 project MOOH.
Institutional Review Board Statement
Ethical review and approval were waived for this study according to national legislation (milk samples taken during routine approved procedures). Furthermore, this study was conducted in accordance with EU Directive 2010/63/EU on the protection of animals used for scientific purposes.
Informed Consent Statement
Not applicable.
Data Availability Statement
The data are not publicly available due to privacy regulations concerning MTR.
Acknowledgments
The authors are grateful for the technical support offered by the field and laboratory technicians of Associazione Regionale Allevatori della Lombardia.
Conflicts of Interest
The authors declare no conflicts of interest.
Abbreviations
The following abbreviations are used in this manuscript:
| AMT |
Antimicrobial treatment |
| AMT/CH |
Antimicrobial treatment/cows in the herd |
| DHI |
Dairy herd improvement |
| DSCC |
Differential somatic cell count |
| MTR |
Milk test record |
| PLCC |
Polymorphonuclear leukocytes neutrophils cell count |
| PMN |
Polymorphonuclear leukocytes neutrophils |
| SCC |
Somatic cells count |
References
- Davis, M.; Lohm, D.; Flowers, P.; Whittaker, A. The immune self, hygiene and performative virtue in general public narratives on antibiotics and antimicrobial resistance. Health 2023, 27, 491–507. [Google Scholar] [CrossRef] [PubMed]
- Mughini-Gras, L.; Di Martino, G.; Moscati, L.; Buniolo, F.; Cibin, V.; Bonfanti, L. Natural immunity in conventionally and organically reared turkeys and its relation with antimicrobial resistance. Poult. Sci. 2020, 99, 763–771. [Google Scholar] [CrossRef]
- Gani, Z.; Kumar, A.; Raje, M.; Raje, C. Antimicrobial peptides: An alternative strategy to combat antimicrobial resistance. Drug Discov. Today 2025, 30, 14. [Google Scholar] [CrossRef]
- Shapira, T.; Christofferson, M.; Av-Gay, Y. The antimicrobial activity of innate host-directed therapies: A systematic review. International Journal of Antimicrobial Agents 2024, 63, 17. [Google Scholar] [CrossRef]
- Rainard, P.; Riollet, C. Innate immunity of the bovine mammary gland. Vet Res 2006, 37, 369–400. [Google Scholar] [CrossRef]
- Alluwaimi, A.M. The cytokines of bovine mammary gland: prospects for diagnosis and therapy. Res. Vet. Sci. 2004, 77, 211–222. [Google Scholar] [CrossRef]
- Trevisi, E.; Zecconi, A.; Bertoni, G.; Piccinini, R. Blood and milk immune and inflammatory profiles in periparturient dairy cows showing a different liver activity index. Journal of Dairy Research 2010, 77, 310–317. [Google Scholar] [CrossRef]
- Zecconi, A.; Smith, K.L. Ruminant Mammary Gland Immunity; FIL-IDF: Bruxelles, 2003; p. 128. [Google Scholar]
- Abbas, A.K.; Lichtman, A.K.; Pillai, S. Cellular and molecular immunology, 6th ed.; Elsevier: Philadelphia PA, 2007. [Google Scholar]
- Vlasova, A.; Saif, L. Bovine Immunology: Implications for Dairy Cattle. Frontiers in Immunology 2021, 12, 18. [Google Scholar] [CrossRef] [PubMed]
- Merle, R.; Schroder, A.; Hamann, J. Cell function in the bovine mammary gland: a preliminary study on interdependence of healthy and infected udder quarters. Journal of Dairy Research 2007, 74, 174–179. [Google Scholar] [CrossRef] [PubMed]
- Rivas, A.L.; Quimby, F.W.; Blue, J.; Coksaygan, O. Longitudinal evaluation of bovine mammary gland health status by somatic cell counting, flow cytometry, and cytology. J. Vet. Diagn. Invest. 2001, 13, 399–407. [Google Scholar] [CrossRef]
- Rivas, A.L.; Quimby, F.W.; Coksaygan, O.; Olmstead, L.; Lein, D.H. Longitudinal evaluation of CD4+and CD8+peripheral blood and mammary gland lymphocytes in cows experimentally inoculated with Staphylococcus aureus. Can. J. Vet. Res.-Rev. Can. Rech. Vet. 2000, 64, 232–237. [Google Scholar]
- Wall, S.K.; Wellnitz, O.; Bruckmaier, R.M.; Schwarz, D. Differential somatic cell count in milk before, during, and after lipopolysaccharide- and lipoteichoic-acid-induced mastitis in dairy cows. J. Dairy Sci. 2018, 101, 5362–5373. [Google Scholar] [CrossRef]
- Harmon, R.J. Physiology of mastitis and factors affecting somatic cell counts. J. Dairy Sci. 1994, 77, 2103–2112. [Google Scholar] [CrossRef] [PubMed]
- Damm, M.; Holm, C.; Blaabjerg, M.; Bro, M.N.; Schwarz, D. Differential somatic cell count-A novel method for routine mastitis screening in the frame of Dairy Herd Improvement testing programs. J. Dairy Sci. 2017, 100, 4926–4940. [Google Scholar] [CrossRef]
- Zecconi, A.; Zaghen, F.; Meroni, G.; Sommariva, F.; Ferrari, S.; Sora, V. Machine Learning Approach for Early Lactation Mastitis Diagnosis Using Total and Differential Somatic Cell Counts. Animals 2025, 15, 1125. [Google Scholar] [CrossRef] [PubMed]
- Zecconi, A.; Zaghen, F.; Meroni, G.; Sora, V.; Martino, P.A.; Laterza, G.; Zanini, L. Early Milk Total and Differential Cell Counts as a Diagnostic Tool to Improve Antimicrobial Therapy Protocols. Animals 2023, 13, 1143. [Google Scholar] [CrossRef]
- Stocco, G.; Cipolat-Gotet, C.; Stefanon, B.; Zecconi, A.; Francescutti, M.; Mountricha, M.; Summer, A. Herd and animal factors affect the variability of total and differential somatic cell count in bovine milk. Journal of Animal Science 2022. [Google Scholar] [CrossRef]
- Zecconi, A.; Zanini, L.; Cipolla, M.; Stefanon, B. Factors Affecting the Patterns of Total Amount and Proportions of Leukocytes in Bovine Milk Animals 2020, 10, 1–12. [CrossRef]
- Lozada-Soto, E.; Maltecca, C.; Anderson, K.; Tiezzi, F. Analysis of milk leukocyte differential measures for use in management practices for decreased mastitis incidence. J. Dairy Sci. 2020, 103, 572–582. [Google Scholar] [CrossRef]
- Kirkeby, C.; Toft, N.; Schwarz, D.; Farre, M.; Nielsen, S.S.; Zervens, L.; Hechinger, S.; Halasa, T. Differential somatic cell count as an additional indicator for intramammary infections in dairy cows. J. Dairy Sci. 2020, 103, 1759–1775. [Google Scholar] [CrossRef]
- Zecconi, A.; Vairani, D.; Cipolla, M.; Rizzi, N.; Zanini, L. Assessment of Subclinical Mastitis Diagnostic Accuracy by Differential Cell Count in Individual Cow Milk. Ital J Anim Sci 2018, 18, 435–440. [Google Scholar] [CrossRef]
- Schwarz, D.; Lipkens, Z.; Piepers, S.; De Vliegher, S. Investigation of differential somatic cell count as a potential new supplementary indicator to somatic cell count for identification of intramammary infection in dairy cows at the end of the lactation period. Preventive Veterinary Medicine 2019, 172, 7. [Google Scholar] [CrossRef] [PubMed]
- Mehrzad, J.; Duchateau, L.; Burvenich, C. Viability of milk neutrophils and severity of bovine coliform mastitis. J.Dairy Sci. 2004, 87, 4150–4162. [Google Scholar] [CrossRef]
- Burton, J.L.; Erskine, R.J. Immunity and mastitis: some new ideas for an old disease. (Mastitis). Veterinary Clinics of North America, Food Animal Practice 2003, Saunders, Philadelphia, USA, 1–45.
- Zecconi, A.; Bronzo, V.; Piccinini, R.; Spreafico, G.; Ruffo, G. Phagocytic activity of bovine polymorphonuclear neutrophil leucocytes. Journal of Dairy Research 1994, 61, 271–279. [Google Scholar] [CrossRef]
- Mehrzad, J.; Paape, M.; Burvenich, C. Role of neutrophils in protection of udder from infection in high yielding dairy cows. Iran J. Veterinary Res. 2010, 11, 102–118. [Google Scholar]
- Adewuyi, A.A.; Gruys, E.; van Eerdenburg, F. Non esterified fatty acids (NEFA) in dairy cattle. A review. Vet. Q. 2005, 27, 117–126. [Google Scholar] [CrossRef] [PubMed]
- Chapinal, N.; Carson, M.; Duffield, T.F.; Capel, M.; Godden, S.; Overton, M.; Santos, J.E.P.; LeBlanc, S.J. The association of serum metabolites with clinical disease during the transition period. Journal of Dairy Science 2011, 94, 4897–4903. [Google Scholar] [CrossRef]
- Goff, J.P. Major advances in our understanding of nutritional influences on bovine health. Journal of Dairy Science 2006, 89, 1292–1301. [Google Scholar] [CrossRef]
- Tomassone, L.; Scali, F.; Formenti, N.; Alborali, G.L.; Aragrande, M.; Canali, M.; Romanelli, C.; Suprani, V.; De Meneghi, D. Evaluation of ‘ClassyFarm’, the Italian integrated surveillance system of livestock farms, in the context of antimicrobial use and antimicrobial resistance. Ital. J. Anim. Sci. 2024, 23, 1426–1438. [CrossRef]
- Sharkey, L.C.; Heinrich, D.A. Chapter 25 - Alterations in the Leukogram*. In Large Animal Internal Medicine (Sixth Edition), Smith, B.P., Van Metre, D.C., Pusterla, N., Eds.; Mosby: St. Louis (MO), 2020; pp. 429–434.e421.
- Frater, J.L. How I investigate neutropenia. International Journal of Laboratory Hematology 2020, 42, 121–132. [Google Scholar] [CrossRef]
- McEwen, S.A.; Fedorka-Cray, P.J. Antimicrobial use and resistance in animals. Clin. Infect. Dis. 2002, 34, S93–S106. [Google Scholar] [CrossRef]
- Hudson, J.A.; Frewer, L.J.; Jones, G.; Brereton, P.A.; Whittingham, M.J.; Stewart, G. The agri-food chain and antimicrobial resistance: A review. Trends Food Sci. Technol. 2017, 69, 131–147. [Google Scholar] [CrossRef]
- Holmes, A.H.; Moore, L.S.P.; Sundsfjord, A.; Steinbakk, M.; Regmi, S.; Karkey, A.; Guerin, P.J.; Piddock, L.J.V. Understanding the mechanisms and drivers of antimicrobial resistance. The Lancet 2016, 387, 176–187. [Google Scholar] [CrossRef]
- O’Neill, J. Tackling drug-resistant infections globally: final report and recommendations; Government of the United Kingdom: 2016.
- Halasa, T.; Kirkeby, C. Differential Somatic Cell Count: Value for Udder Health Management. Front. Vet. Sci. 2020, 7, 7. [Google Scholar] [CrossRef] [PubMed]
- Stocco, G.; Summer, A.; Cipolat-Gotet, C.; Zanini, L.; Vairani, D.; Dadousis, D.; Zecconi, A. Differential cell count as a novel indicator of milk quality in dairy cows. Animals 2020, 10, 1–14. [Google Scholar] [CrossRef]
- Fusi, V. Correlazione tra uso del farmaco e tasso di riforma negli allevamenti di bovine da latte del Lodigiano. Università degli Studi di Milano, Milan, 2025.
- Dahl, G.E.; McFadden, T.B. Symposium review: Environmental effects on mammary immunity and health. Journal of Dairy Science 2022, 105, 8586–8589. [Google Scholar] [CrossRef]
- Gupta, S.; Sharma, A.; Joy, A.; Dunshea, F.R.; Chauhan, S.S. The Impact of Heat Stress on Immune Status of Dairy Cattle and Strategies to Ameliorate the Negative Effects. Animals 2023, 13, 107. [Google Scholar]
- George, J.W.; Snipes, J.; Lane, V.M. Comparison of bovine hematology reference intervals from 1957 to 2006. Veterinary Clinical Pathology 2010, 39, 138–148. [Google Scholar] [CrossRef] [PubMed]
Figure 1.
distribution of herd size within the 20 herds considered (red line represents the mean and the green line represents the median).
Figure 1.
distribution of herd size within the 20 herds considered (red line represents the mean and the green line represents the median).
Figure 2.
distribution of average daily production in the 20 herds considered (red line represents the mean and the green line represents the median).
Figure 2.
distribution of average daily production in the 20 herds considered (red line represents the mean and the green line represents the median).
Figure 3.
scatterplot of the monthly frequency of treatments/cows in the herd in the 20 herds considered (the red line represents the median and the cross the mean) a single sample with frequency of 70% was omitted.
Figure 3.
scatterplot of the monthly frequency of treatments/cows in the herd in the 20 herds considered (the red line represents the median and the cross the mean) a single sample with frequency of 70% was omitted.
Figure 4.
distribution of the monthly mean (± Std.err.) frequency of treatments in the 20 herds considered by month of the year 2024.
Figure 4.
distribution of the monthly mean (± Std.err.) frequency of treatments in the 20 herds considered by month of the year 2024.
Figure 5.
distribution of the monthly frequency of treatments/cows in the herd in the 20 herds considered by herd size.
Figure 5.
distribution of the monthly frequency of treatments/cows in the herd in the 20 herds considered by herd size.
Figure 6.
scatterplot of the monthly frequency of mean (± Std.err.) of cows with PLCC<5000 cells/mL in the 20 herds considered (the red line represents the median and the cross the mean).
Figure 6.
scatterplot of the monthly frequency of mean (± Std.err.) of cows with PLCC<5000 cells/mL in the 20 herds considered (the red line represents the median and the cross the mean).
Figure 7.
distribution of the monthly frequency of cows with PLCC<5000 cells/mL in the 20 herds considered by month of the year 2024.
Figure 7.
distribution of the monthly frequency of cows with PLCC<5000 cells/mL in the 20 herds considered by month of the year 2024.
Figure 8.
distribution of the monthly mean (± Std.err.) frequency of PLCC<5000 cells/mL in the 20 herds considered by herd size.
Figure 8.
distribution of the monthly mean (± Std.err.) frequency of PLCC<5000 cells/mL in the 20 herds considered by herd size.
Figure 9.
Linear regression model calculated for the frequency of cows with polymorphonuclear leukocytes neutrophils cell count (PLCC) <5,000/mL and the frequency of antimicrobial treatments per cows in the herd.
Figure 9.
Linear regression model calculated for the frequency of cows with polymorphonuclear leukocytes neutrophils cell count (PLCC) <5,000/mL and the frequency of antimicrobial treatments per cows in the herd.
Table 1.
descriptive statistics (mean ± standard deviation) for the three cellular markers considered (somatic cell count -SCC-, differential cell count -DSCC; and polymorphonuclear leukocytes neutrophil count -PLCC-).
Table 1.
descriptive statistics (mean ± standard deviation) for the three cellular markers considered (somatic cell count -SCC-, differential cell count -DSCC; and polymorphonuclear leukocytes neutrophil count -PLCC-).
| Herd |
SCC (Log10/mL) |
DSCC (%) |
PLCC (Log10/mL) |
| |
mean |
Std.dev. |
mean |
Std.dev. |
mean |
Std.dev. |
| A |
5.07 |
0.61 |
61.50 |
17.42 |
4.83 |
0.71 |
| B |
4.87 |
0.63 |
60.55 |
17.53 |
4.63 |
0.73 |
| C |
4.68 |
0.56 |
57.30 |
18.55 |
4.43 |
0.68 |
| D |
4.99 |
0.62 |
59.92 |
17.54 |
4.74 |
0.72 |
| E |
4.85 |
0.63 |
61.61 |
17.97 |
4.62 |
0.73 |
| F |
5.13 |
0.63 |
64.59 |
17.32 |
4.92 |
0.74 |
| G |
5.06 |
0.59 |
66.42 |
15.43 |
4.85 |
0.68 |
| H |
4.95 |
0.63 |
63.44 |
18.08 |
4.73 |
0.74 |
| K |
4.72 |
0.58 |
61.07 |
17.54 |
4.48 |
0.68 |
| J |
5.02 |
0.67 |
65.18 |
18.64 |
4.81 |
0.77 |
| L |
5.04 |
0.67 |
66.44 |
17.45 |
4.85 |
0.76 |
| M |
5.04 |
0.69 |
66.09 |
17.12 |
4.84 |
0.80 |
| N |
4.84 |
0.62 |
63.15 |
17.53 |
4.62 |
0.72 |
| O |
5.00 |
0.62 |
64.93 |
16.23 |
4.80 |
0.72 |
| P |
4.74 |
0.63 |
58.55 |
19.44 |
4.48 |
0.75 |
| Q |
4.52 |
0.55 |
52.89 |
18.88 |
4.22 |
0.66 |
| R |
4.70 |
0.57 |
55.94 |
18.42 |
4.43 |
0.67 |
| S |
4.74 |
0.55 |
56.15 |
18.08 |
4.46 |
0.65 |
| T |
5.13 |
0.63 |
72.17 |
14.77 |
4.98 |
0.70 |
| U |
4.97 |
0.60 |
63.73 |
16.25 |
4.76 |
0.69 |
| Total |
4.88 |
0.64 |
61.84 |
18.10 |
4.64 |
0.74 |
Table 2.
total number of antimicrobial treatments in the 20 herds considered and proportion of mastitis antimicrobial treatments.
Table 2.
total number of antimicrobial treatments in the 20 herds considered and proportion of mastitis antimicrobial treatments.
| Herd |
Total (N) |
Mastitis treatments proportion |
| A |
531 |
27% |
| B |
308 |
56% |
| C |
242 |
58% |
| D |
86 |
79% |
| E |
1865 |
13% |
| F |
41 |
37% |
| G |
81 |
68% |
| H |
1829 |
40% |
| K |
2695 |
4% |
| J |
339 |
74% |
| L |
152 |
84% |
| M |
618 |
73% |
| N |
417 |
65% |
| O |
111 |
70% |
| P |
1015 |
54% |
| Q |
642 |
23% |
| R |
346 |
96% |
| S |
444 |
46% |
| T |
235 |
46% |
| U |
17 |
29% |
| Total |
12,014 |
35% |
Table 3.
Somatic cell count (SCC) and differential cell count (DSCC) mean values (± Std.Dev.) in cows classified by PLCC (polymorphonuclear leukocytes neutrophils cell count) levels.
Table 3.
Somatic cell count (SCC) and differential cell count (DSCC) mean values (± Std.Dev.) in cows classified by PLCC (polymorphonuclear leukocytes neutrophils cell count) levels.
| PLCC status |
SCC |
DSCC |
Proportion of samples |
| Mean |
Std.Dev. |
Mean |
Std.Dev. |
| Below 5000 cells/mL |
4.0 |
0.16 |
35.4 |
11.3 |
6.5% |
| Over 5000 cells/mL |
4.9 |
0.61 |
63.8 |
16.9 |
93.5% |
Table 4.
results of linear regression analysis analysis on the frequency of cows with polymorphonuclear leukocytes neutrophils cell count (PLCC) < 5,000 cells/mL.
Table 4.
results of linear regression analysis analysis on the frequency of cows with polymorphonuclear leukocytes neutrophils cell count (PLCC) < 5,000 cells/mL.
| Model |
Coefficient |
P |
95,0% confidence
interval |
| B |
Std.err |
|
Lower |
Higher |
|
| Constant |
0,089 |
0,010 |
<0,001 |
0,068 |
0,109 |
|
| PLCC<5000/mL freq |
0,807 |
0,122 |
<0,001 |
0,566 |
1,048 |
|
Table 5.
results of the ROC curve analysis applying an antimicrobial treatment (AMT/CH) threshold of 6% and 10% for the response variable and the frequency of samples with polymorphonuclear leukocyte count (PLCC) cells/mL as a test variable.
Table 5.
results of the ROC curve analysis applying an antimicrobial treatment (AMT/CH) threshold of 6% and 10% for the response variable and the frequency of samples with polymorphonuclear leukocyte count (PLCC) cells/mL as a test variable.
| Calculated PLCC threshold |
2.0% |
4.4% |
| Parameter |
AMT/CH> 6% |
AMT/CH> 10% |
| Sensitivity |
85.0% |
64,9% |
| Lower bound (95%) |
78.0% |
54,8% |
| Upper bound (95%) |
90.0% |
73,8% |
| Specificity |
56.8% |
68,9% |
| Lower bound (95%) |
42.2% |
58,7% |
| Upper bound (95%) |
70.3% |
77,5% |
| Positive predictive value |
86.2% |
68,5% |
| Negative predictive value |
54.3% |
65,3% |
| Positive likelihood ratio |
1.97 |
2,09 |
| Negative likelihood ratio |
0.26 |
0,51 |
| Accuracy |
78.3% |
66,8% |
|
Disclaimer/Publisher’s Note: The statements, opinions and data contained in all publications are solely those of the individual author(s) and contributor(s) and not of MDPI and/or the editor(s). MDPI and/or the editor(s) disclaim responsibility for any injury to people or property resulting from any ideas, methods, instructions or products referred to in the content. |
© 2025 by the authors. Licensee MDPI, Basel, Switzerland. This article is an open access article distributed under the terms and conditions of the Creative Commons Attribution (CC BY) license (http://creativecommons.org/licenses/by/4.0/).