
Submitted:
25 September 2025
Posted:
26 September 2025
You are already at the latest version
Abstract
Energy consumption is a key driver of economic and social development, particularly in rapidly expanding sectors such as Information and Communication Technologies (ICT). This study explores the energy demand of Quito’s ICT sector across technical, organizational, economic, social, and environmental dimensions, aiming to inform sustainable urban strategies. A mixed-methods approach was applied, combining quantitative and qualitative analyses. Data was collected via questionnaires from 398 ICT companies and analyzed using descriptive statistics and multivariate techniques, including the Gower similarity coefficient, Principal Coordinates Analysis (PCoA), and biplots. VENSIM simulations were used to model energy consumption dynamics. Results indicate that most ICT firms are micro and small enterprises focused on software development and e-commerce, employing highly skilled personnel. Energy use is concentrated in computing and printing equipment, with limited reliance on climate control systems. While 93% of firms express environmental awareness, fewer than 10% have formal energy efficiency policies. Financial constraints and limited access to efficient equipment are the main barriers to improved energy management. The study concludes that, despite a moderate energy profile, there is an urgent need to strengthen internal energy practices. The findings offer a contextualized framework to guide energy policy and organizational strategies, contributing to more resilient and sustainable urban ICT ecosystems.
Keywords:
Energy consumption
; Information and Communication Technologies (ICT)
; Energy management
; Ecuador
1. Introduction
Multiple studies agree that energy consumption is a key driver of economic and social development, enabling the satisfaction of basic needs and the production of goods and services [1,2,3]. The Information and Communication Technologies (ICT) sector has experienced rapid expansion driven by growing demand for digital services and technological transformation; this growth has markedly increased internet traffic—with video transmission accounting for approximately two-thirds of global traffic—and contributed to the sector’s environmental footprint, estimated at 3.2% of global greenhouse-gas emissions in 2020 [4,5].
In Quito, ICTs hold strategic importance for the local economy: the urban ecosystem concentrates 1,045 companies, of which 881 (84.9%) are active but not classified as high-growth, 126 (12.7%) are non-high-growth firms founded in 2010–2012, and 30 firms (2.4%) are identified as high-growth enterprises—the latter predominantly micro and small businesses (46.7% each) with only 6.7% medium-sized [6]. This concentration generates qualified employment and functions as a driver of municipal innovation and productivity across value chains; simultaneously, the predominance of micro and small firms constrains collective capacity for investment in energy-efficient technologies and the institutionalization of formal energy management.
This study provides a contextualized analysis of energy demand in Quito’s ICT sector, aiming to characterize organizational practices, consumption patterns, and environmental perceptions at the firm level. Building on the theoretical framework proposed in [7,8], the research integrates sociodemographic, technical, organizational, economic, and environmental dimensions to identify the variables and categories that explain energy behavior in urban ICT firms. The approach seeks to bridge the gap between high reported environmental awareness and low uptake of structured practices by evidencing key barriers—limited financial resources, restricted access to efficient equipment, and absence of formal policies—while identifying leverage points for locally tailored interventions.
The article is organized as follows. Section 1 presents the conceptual framework and the energy and sectoral context; Section 2 describes the methodology—an exploratory-descriptive mixed-methods design combining a survey (n = 398) and telephone interviews with quantitative and qualitative analysis; methodologically, primary data were analyzed using descriptive statistics and multivariate techniques (Gower coefficient, Principal Coordinates Analysis, and biplots) implemented in R, and complemented with dynamic simulations in VENSIM to model the evolution and interrelations of the organizational energy system; Section 3 reports the empirical results; Section 4 discusses the implications in light of the proposed model; and Section 5 summarizes conclusions and outlines recommendations for validation.
1.1. Energy Context and ICT Sector Growth in Ecuador
Ecuador electricity matrix is predominantly based on renewable sources. Between 60% and 70% of electricity is generated from hydropower plants, providing a sustainability advantage; however, this reliance also exposes the country to vulnerabilities, such as climate change–induced droughts that can affect reservoir generation levels [9]. To mitigate these risks, the country is diversifying its energy matrix by incorporating solar and wind power to enhance resilience and ensure a sustainable energy supply [10]. Nevertheless, these efforts remain insufficient given the accelerated pace of growth and increasing energy demands, highlighting the urgency of implementing more ambitious and structural strategies.
The ICT sector in Ecuador has experienced significant growth, particularly in urban centers such as Quito and Guayaquil. This expansion has been driven by the development of infrastructures, including data centers and telecommunications networks, which has intensified the need for energy efficiency strategies to balance technological development with the sustainability of the national energy system [11].
The COVID-19 pandemic highlighted the fundamental role of ICT as a driver of business resilience and competitiveness. These technologies have enabled companies to optimize resources, process large datasets, and present information in a more accessible and practical manner, facilitating informed decision-making [12]. Nevertheless, significant challenges persist, including the ongoing connectivity gap between urban and rural areas, which continues to hinder equitable access to ICT resources [13].
In this context, the ICT sector in Pichincha comprises 4,678 companies, categorized as follows: i) television and radio programming and broadcasting; ii) information technology, encompassing data processing, web hosting, web portal management, computer programming, and IT consulting services; and iii) communications equipment manufacturing, focused on the production of components, electronic boards, communication devices, computers, and peripherals [14].
Studies conducted in cities with profiles similar to Quito highlight recurring trends in ICT energy use: in Medellín, the expansion of data centers has driven attention to integrating renewables and strengthening network efficiency [15]; in Santiago, cloud migration and network modernization have reduced electricity demand [16]; and in Quito, the “Mobility Orchestrator” illustrates local efforts to optimize energy via data platforms and IoT [17].
These case studies illustrate the innovative approaches that cities are adopting to address the dual objective of reducing energy consumption in the ICT sector while promoting sustainability in urban and technological development strategies.
Aligned with these international trends, the Ecuadorian government has recognized the urgency of more effectively managing energy demand in the ICT sector. To this end, it has implemented policies aimed at energy efficiency and promoted the adoption of renewable energy sources, aligning these measures with broader efforts to enhance the sustainability of the national energy system, mitigate environmental impacts, and optimize the use of available resources [10].
1.2. Bibliometric Mapping of Energy Consumption in the ICT Sector
To strengthen the formulation of hypotheses and provide a solid theoretical foundation for the proposed model, this section presents a bibliometric analysis focused on the ICT Sector, with particular emphasis on Energy Consumption and Energy Management. The objective is to identify prevailing approaches, empirical findings, and research gaps in the scientific literature that explain how ICT organizations consume and manage energy, and how these practices shape efficiency and sustainability outcomes.
The bibliometric analysis was conducted using VOSviewer and the Scopus database. The search was performed in the fields Title, Abstract, Keywords, covering the period 2016–2026, and included peer-reviewed articles, systematic reviews, and conference papers. The following search equation was applied:
(“Energy Consumption”) AND (“Energy Management”) AND (“ICT Sector”)
The search yielded 70 documents, reflecting a growing academic interest in the intersection between organizational energy practices and the ICT sector. The selected terms are justified as follows:
- Energy Consumption: captures the patterns of electricity use in ICT firms, including equipment, working schedules, and infrastructure.
- Energy Management: highlights organizational strategies, policies, and barriers that determine the efficiency of energy use.
- ICT Sector: delineates the scope of analysis to a dynamic and urban-oriented industry, central to digitalization and local economic development.
The co-occurrence analysis identified 25 terms grouped into four clusters, which represent the main research axes (Figure 1): (i) Energy Management and Smart Grids, (ii) Sustainability and Renewable Energy, (iii) Energy Efficiency and Environmental Technologies, and (iv) Communication and Sustainable Development.
🔴 Cluster 1 (Energy Management and Smart Grids): This cluster includes terms such as energy, energy management, energy management system, digital storage, information management, internet of things, smart grid, smart power grids, and electric power transmission. It reflects the integration of digital technologies and energy systems, emphasizing how IoT and smart grids enable more efficient monitoring, control, and optimization of electricity use in the ICT sector.
🟢 Cluster 2 (Sustainability and Renewable Energy): This cluster groups terms such as carbon footprint, green computing, quality of service, renewable energy, renewable energy resource, and sustainability. It highlights the environmental dimension of ICT, showing how renewable energy adoption and sustainable computing practices contribute to reducing emissions and aligning the sector with global sustainability goals.
🔵 Cluster 3 (Energy Efficiency and Environmental Technologies): This cluster contains terms such as energy efficiency, energy utilization, energy consumption, environmental technology, and power management (telecom). It focuses on strategies and technologies aimed at optimizing energy use in telecommunications and ICT infrastructures, underscoring the role of efficiency improvements and environmental technologies in reducing operational costs and ecological impacts.
🟡 Cluster 4 (Communication and Sustainable Development): This cluster encompasses terms such as information and communication, smart management, and sustainable development. It represents the strategic and institutional dimension of the ICT sector, where communication processes and intelligent management practices are directly linked to sustainability agendas, reinforcing the sector’s role as a driver of innovation, policy implementation, and resilient economic development.
The co-occurrence analysis demonstrates that energy consumption in the ICT sector is shaped by a complex interplay of managerial practices, technological infrastructures, environmental considerations, and institutional frameworks. Rather than being driven by a single dimension, energy behavior emerges from the convergence of these factors, which together define both the opportunities and the constraints for efficiency improvements. This integrated perspective is particularly relevant in Quito, where the predominance of micro and small firms limits the adoption of formal energy management systems, yet also highlights the potential for targeted interventions that align organizational practices with broader sustainability and policy agendas.
2. Methodology
An exploratory-descriptive study was conducted with the aim of deepening the understanding of the characteristics and specificities of the case study, particularly regarding consumer groups within the context of energy demand in the ICT sector in Quito, Ecuador. This approach served as a foundation for future in-depth studies.
The research adopted a mixed-methods approach, combining qualitative and quantitative techniques. The qualitative component contextualized management dynamics through the identification of measurable constructs, while the quantitative component relied on descriptive statistical techniques implemented in R, facilitating the synthesis and visualization of key patterns.
For multivariate analysis, the Gower similarity coefficient was applied, followed by Principal Coordinates Analysis (PCoA) and biplot, enabling the integration of heterogeneous variables and the visual representation of consumption patterns and relationships among indicators. Complementarily, VENSIM was employed as a simulation tool to model the dynamics and complexity of the energy system, generating structural representations that connected contextual analysis with quantifiable relationships [18,19] (Figure 2).
Building on this foundation, the theoretical energy consumption model proposed in [7,8] was adopted, which allows for a comprehensive understanding of energy consumption behavior in specific sectors such as Information and Communication Technologies (ICT). This model is based on the premise that energy consumption behavior is influenced not only by technical factors but also by social, economic, organizational, and environmental dimensions. For its application, endogenous and exogenous variables were integrated and categorized into four groups, following the methodological frameworks in [20,21].
As part of the operationalization of the model, a survey was conducted to collect primary data, yielding 398 responses from ICT companies in Quito during October 2023. This methodological approach facilitated the incorporation of multiple dimensions—economic, ecological, social, political, technological, among others—into the analysis of energy demand, adapting to the particularities of the urban business environment, which is described as follows:
- Organizational factors: Encompass company structure, internal management processes, strategic decision-making, and energy efficiency policies, all of which are determinants of the energy behavior of an organization [22].
- Technological factors: Examine how technologies used within organizations influence energy consumption. This may involve the adoption of more energy-efficient technologies or the lack of energy optimization in existing systems [23].
- Economic factors: Recognize how energy costs and their volatility affect the feasibility of technological solutions, directly influencing energy consumption decisions within organizations [24].
- Social and cultural factors: Energy consumption behavior is shaped by organizational culture and social expectations, which may affect the willingness to adopt more sustainable or technologically advanced practices to reduce energy use [25].
- Environmental factors: Consider the environmental context in which organizations operate, including governmental regulations on energy efficiency and the use of renewable energy sources [26].
This model is valuable for evaluating how interrelated factors determine energy consumption within specific sectors, such as ICT, particularly in urban contexts like Quito. Furthermore, it provides an analytical framework useful for establishing diagnostics that guide the implementation of energy efficiency and sustainability policies, tailored to local realities and capable of supporting informed decision-making in the design of sustainable energy strategies.
2.1. Key Variables in the Analysis of Corporate Energy Consumption
During the development phase, the categories, criteria, and relationships that characterize organizations as energy consumers were identified, defining and contextualizing the variables to be measured in the ICT sector of Quito as an initial step toward understanding the national context. Building on this foundation, the conceptual model proposed in [7,8] was adapted to characterize energy consumers within the sector, considering both internal factors and the structural conditions of the environment .
A non-probabilistic convenience sampling method was employed, selecting representative and easily accessible units for data collection [27]. Information was gathered through an online questionnaire, complemented by telephone interviews with strategic profiles within the organizations, which enriched data interpretation and verified the contextual relevance of the variables analyzed.
The questionnaire was designed to encompass economic, social, structural, and ecological dimensions, organized into three sections: i) organizational information; ii) equipment and energy consumption habits; and iii) energy management. The primary objective was to assess energy consumption in its main areas of impact in 2021, collecting information across four key categories (Figure 3).
- Spatial and Sociodemographic Characteristics (SSC)
- Organizational Structure (OS)
- Energy Consumption Patterns and Organizational Equipment (ECPE)
- Eco-Innovation Process Based on Environmental Awareness (EIP)
The data were analyzed using descriptive statistical techniques with the R software, allowing for the summarization of collected data into tables and visualizations that highlighted key patterns and findings. Additionally, VENSIM was employed as a simulation tool to model and analyze the complexity of relationships between internal and external variables of the energy system, as well as to generate graphical and conceptual representations of the theoretical model.
Furthermore, multivariate statistical techniques were applied to the dataset, given the heterogeneous nature of variables associated with energy consumption in Quito ICT sector. The Gower similarity coefficient was used, which enables the integration of numerical, categorical, ordinal, and binary data into a dissimilarity matrix [28,29]. This metric is calculated as the weighted average of standardized partial distances between observation pairs, allowing for the assignment of weights and the handling of missing values [30]. The resulting matrix was subjected to Principal Coordinates Analysis (PCoA), a technique that projects the data into a Euclidean space while preserving the original distances as much as possible [31].
The bidimensional graphical representation and visual interpretation of the latent structure were performed using a biplot [32] implemented in R, a technique originally proposed in [33] and updated in contemporary applications in [34]. By integrating the Gower similarity coefficient, this approach simultaneously displayed ICT company observations and energy-related variables in the same plane. This visualization facilitated the identification of consumption patterns, clusters, and relationships among indicators, proving particularly effective for the energy behavior in the ICT sector, enabling the identification of relevant patterns, which are presented in the Results section.
3. Results
The profile of the surveyed ICT organizations is presented according to the four categories established by the model in [7,8], allowing a structured analysis of their sociodemographic characteristics, organizational structure, energy consumption patterns, and eco-innovation practices.
3.1. Spatial and Sociodemographic Characteristics (SSC)
The Spatial and Sociodemographic Characteristics (SSC) category encompasses variables related to the location, size, and distribution of organizations, as well as the sociodemographic profile of their employees. The 398 ICT organizations surveyed exhibited diverse characteristics, particularly regarding the educational background of their employees. Most employees hold a university degree (78.6%), followed by technical or technological education (13.8%). A smaller group has postgraduate qualifications in non-business fields (4.8%) or in management/administration (1.5%), while only a minority lack higher education (1.3%) (Table 1).
Source: Authors.
3.2. Organizational Structure (OS)
The Organizational Structure (OS) category includes variables describing company composition, hierarchy, number of branches, facility size, and internal management practices. Regarding the main business activity, software application development stands out (30.4%), followed by other services (26.4%) and software distribution (15.3%). More specialized activities were also identified, such as e-commerce (7.8%), ICT training (7%), cybersecurity and networking (5%), and web development (2.5%). Less represented technological areas include Platform as a Service (PaaS) (2.3%), data science, artificial intelligence, and IoT (2%), and the telecommunications sector (1.3%).
Concerning organizational structure, most companies (84.7%) operate from a single location, with medium-sized offices (100–200 m² in 32.7% of cases). In terms of annual gross revenue, 75.9% report earnings below USD 100,000, and only 19.2% fall between USD 100,000 and 1 million. This configuration suggests small to medium-sized organizations with a highly skilled workforce and a clear focus on software and application development (Table 1).
The Gower biplot analysis (Figure 4) explains approximately 40% of the variability in the analyzed variables. Each company is represented as a point in the plane, with its position determined by the characteristics of the respective organization; short distances between points indicate similar profiles. Additionally, each point is depicted with a shape representing the sector and a color indicating the consumption category. Consumption categories are grouped using ellipses.
As observed, the blue ellipse represents low consumption and is the largest, showing considerable heterogeneity in company characteristics. The most representative subsectors within this category are Distribution_Software_Hardware (83.6%), Web_Development (80.0%), PaaS (77.8%), ICT_Training (67.9%), and Development_Computer_Applications (67.8%).
The medium-low consumption level (green) includes subsectors with higher relative presence: Cybersecurity_Networks (50%), E-commerce (48.4%), and Other_Services (44.8%). This large green ellipse partially overlaps with the blue one, indicating that both consumption levels share a significant portion of the multivariate space. Consequently, Distribution_Software_Hardware is underrepresented in the medium-low category, tending to be more associated with low consumption.
The medium-high consumption level is represented by a small orange ellipse, partially overlapping with the blue and green ellipses, indicating limited representation. Subsector presence includes Other_Services (3.8%), Development_Computer_Applications (2.5%), E-commerce (3.2%), and Data_Science_AI (12.5%), which exhibit more intensive energy use yet remain close to the blue–green continuum.
The high consumption category (red) does not form a complete ellipse and represents only 1% of the Other_Services subsector. The observed patterns suggest that energy consumption is strongly related to both the main business activity and organizational complexity.
3.3. Organizational Equipment and Energy Consumption Patterns (OEE)
The OEE category encompasses variables related to the type, quantity, and usage of equipment within organizations, as well as electricity and fuel consumption. For clarity, this section is divided into two subsections:
3.3.1. Type, Quantity, and Usage of Equipment
This subsection describes the equipment present in ICT organizations, their frequency of use, and their impact on energy consumption. Most organizations rely primarily on desktop computers, laptops, and printing/copying systems, which are used consistently throughout the workday. Video surveillance equipment is present in fewer companies, while air conditioning, heating, and refrigeration systems are limited, reflecting a lower energy impact compared to standard office devices (Figure 5).
The predominant working schedule is daytime (88.4%), accounting for most electricity consumption. Mixed shifts (day and night, 10.9%) generate a more variable consumption pattern, although their overall contribution is smaller. Continuous use of equipment during the workday maintains high electricity consumption in the absence of active energy-saving policies.
3.3.2. Electricity and Fuel Consumption
This subsection addresses direct energy consumption in terms of electricity and fossil fuels. Electricity consumption is the primary component, influenced by organizational size and the type of equipment used. Electricity expenditure is strongly associated with PCs, printers, air conditioning, and computing equipment, with a smaller yet relevant contribution from video surveillance systems and heating or water-heating devices (Table 2).
Source: Authors.
Fuel consumption (regular gasoline, premium gasoline, and diesel) depends mainly on the number and type of vehicles, daily hours of use, frequency of operation, and the company subsector. Variables such as organizational size, number of employees, and annual revenue show little correlation with fuel consumption. Application development companies and e-commerce businesses exhibit the highest fuel energy consumption.
Energy consumption in these organizations is directly influenced by the type and quantity of equipment used (Figure 6). This figure presents a Gower biplot analysis with the significant variables related to electricity expenditure, represented by their length, angle, and corresponding correlation coefficient. The dimensions explain 54% of the analyzed variables.
Organizational size has a notable influence (0.511), as do the number of employees (0.350) and branches (0.324). Consumption is strongly associated with the use of electronic devices such as smartphones (0.348), printers (0.320), air conditioning (0.200), and computing equipment (0.396). Video surveillance equipment (0.473) also contributes to electricity consumption, albeit with less intensity, as do power equipment (0.132) and water heating devices (0.132), which have a moderate influence.
On the other hand, outdoor lighting (0.175) has a low effect, and VoIP devices, cooling systems, and heat generators are not significant for consumption. It is noteworthy that annual revenue (0.252) does not appear to significantly affect energy expenditure. Self-generation (0.356) and the company subsector (0.317) also play a role in influencing electricity consumption.
Figure 7 presents a Gower biplot analysis with the significant variables related to premium gasoline expenditure, along with their correlation values. The dimensions in this analysis explain approximately 71% of the variability. Frequency of vehicle use (0.801) and daily operating hours (0.793) exhibit strong correlations and high relevance. Additionally, expenditure is associated with the number of vehicles (0.767), the type of fuel used (0.760), and the company subsector (0.190), although the latter has limited importance.
On the other hand, working days per week (0.28), organizational size (0.29), and shift type (−0.100) show weaker correlations with minor significance. It is noteworthy that premium gasoline consumption does not appear to be related to annual revenue (−0.251) or the number of employees (−0.127). Figure 8 presents a Gower biplot analysis with the significant variables related to premium gasoline (Super) expenditure, along with their correlation values. The dimensions in this analysis explain approximately 70% of the variability. Vehicle type (0.414), number of vehicles (0.404), daily operating hours (0.384), and frequency of use (0.391) show strong correlations with expenditure, as does the company subsector (0.189), although the latter has limited significance.
While organizational size (−0.101) is not directly related to expenditure, it holds some relevance for overall interpretation. Notably, Super gasoline consumption does not appear to be associated with annual revenue (−0.252) or number of employees (−0.161).
Figure 9 presents a Gower biplot analysis of diesel consumption. The dimensions in this analysis explain approximately 69% of the variability, and the consumption pattern is like that observed for Super gasoline. The most significant variables related to diesel consumption, along with their correlation coefficients, are vehicle type (0.364), number of vehicles (0.284), daily operating hours (0.243), and frequency of use (0.276). The company subsector (0.079) also contributes, but due to its low value, its association with diesel consumption is of limited relevance.
3.4. Eco-Innovation Process Based on Environmental Awareness (EIP)
Although organizational size (0.19), number of branches (0.35), and weekly working days (0.36) show weak correlations with diesel expenditure, they remain relevant for overall interpretation.
The eco-innovation category based on environmental awareness (EIP) includes variables related to organizations’ perceptions of the energy sector, their level of environmental and energy awareness, and the adoption of actions, motivations, and barriers associated with efficient energy use. This section highlights how ICT companies integrate sustainability and energy efficiency into their organizational practices.
3.4.1. Perception and Priorities Regarding the Energy Sector
52.1% of the surveyed organizations associate the energy sector primarily with energy costs (fuel and electricity), while 19.9% link it to development and well-being. Energy subsidies (42.8%) and lack of energy education (35%) are considered the most urgent issues, reflecting concern for both economic management and the need for knowledge in the sector.
3.4.2. Notions About Energy Consumption
Companies show a considerable level of environmental awareness:
- 93% acknowledge their responsibility for environmental protection.
- 84.8% are aware of how their consumption impacts on the environment.
However, less than half have clear knowledge of specific aspects, such as which type of energy most affects the environment (40.7%), suggesting a gap between general awareness and the technical knowledge required for informed energy decisions.
3.4.3. Energy Efficiency Actions and Practices
Although most organizations turn off unnecessary electrical devices (94%), participation in energy efficiency programs is limited:
- Only 10% have participated in government programs for efficient energy use.
- 9% have adopted international standards, such as ISO 50001.
- 75% have not implemented productivity improvements or innovative alternatives to optimize energy consumption.
3.4.4. Motivations and Barriers for Efficient Energy Use
The main motivations for adopting good energy practices are cost reduction (65.7%) and environmental protection (27.2%). The most significant barriers are lack of financial resources (32%) and limited availability of efficient equipment (27.7%), indicating that decisions are more influenced by economic constraints than environmental awareness.
3.4.5. Energy Management in Organizations
46% of companies delegate energy management to administrative-financial departments, while 42.7% lack a specific unit for this function. Only 6.8% have a formal energy planning document, highlighting the lack of institutionalization in efficient energy resource management.
Overall, surveyed organizations demonstrate good awareness of the importance of efficient energy consumption and its environmental impact, yet these attitudes are not translated into structural actions due to financial barriers, lack of internal policies, and limited participation in efficiency programs. This underscores the need for economic incentives, technical training, and stronger public policies to promote energy efficiency in the ICT sector.
4. Discussion
The following section contextualizes the empirical findings within broader theoretical and sectoral frameworks, offering a multidimensional interpretation of energy consumption in Quito’s ICT sector. By examining consumption patterns, organizational structures, and eco-innovation practices, the discussion highlights both the sector’s relative efficiency and its structural limitations. This analysis lays the groundwork for constructing a conceptual model that informs strategic interventions and sustainable energy policies.
4.1. Energy Consumption and Comparison – ICT Sector
The ICT sector exhibits moderate energy consumption, primarily linked to the use of servers and computing equipment. Although these organizations operate numerous office devices, consumption can be optimized through efficient servers and energy policies in data centers [35]. Companies lacking air conditioning systems or industrial equipment display a relatively efficient profile compared to sectors such as manufacturing or mining.
When compared with other regional sectors, ICT organizations have lower energy consumption if they do not employ high-consumption industrial equipment [36]. Notably, 91.9% do not self-generate electricity nor rely on external sources, indicating low dependence on costly or polluting energy. In contrast, industrial sectors exhibit a high energy footprint due to heavy machinery and continuous operational processes [37].
4.2. Theoretical Model of the ICT Sector in Quito, Ecuador
Based in [7,8], energy consumers were characterized across four categories. The main findings for each category are summarized below:
4.2.1. Spatial and Socio-Demographic Characteristics (CSD)
- Predominantly five-day workweeks, mainly during daytime hours (88.4%).
- Office infrastructure of 100–200 m², without cooling or heating systems.
4.2.2. Organizational Structure (EO)
- 46% delegate energy planning to administrative-financial departments, while 42.7% lack a dedicated unit.
- Only 6.8% have formal energy policies.
4.2.3. Equipment and Energy Consumption Patterns (CEE)
- Predominance of computers and printing systems; high-consumption equipment is scarce.
- 91.9% do not generate electricity; basic energy-saving practices are frequent (94%), but adoption of international standards is below 10%.
4.2.4. Eco-Innovation Process Based on Environmental Awareness (EIP)
- 93% acknowledge environmental responsibility; 84.8% understand the impact of their consumption.
- Only 10% participate in energy efficiency programs and fewer than 9% adopt ISO 50001 standards.
- Motivations: cost reduction (65.7%) and environmental protection (27.2%).
4.3. Relationship with Work Proposals
The findings are also supported by existing work proposals:
Sustainable Development and the 2030 SDGs: Progress in sustainability remains limited due to scarce resources and a lack of formal energy policies, partially aligning with energy efficiency targets [1,42].
Eco-Innovation Models: Eco-innovation has the potential to reduce environmental impacts and promote sustainable development; however, its implementation in the ICT sector remains limited, as the adoption of international standards is still low [38,43].
Energy Consumption Factors: Economic growth drives energy consumption [44], but the Kuznets curve suggests stabilization after a certain income threshold [45]. Effective energy management requires measurement, monitoring, and operational control [46,47,48,49].
Energy Context: Ecuador has historically prioritized electricity over fossil fuels [50]. Fossil fuel subsidies, in place since 1974, have incentivized excessive consumption [51,52].
These proposals also align with the bibliometric clusters identified in this study, which provide a complementary framework for interpreting the findings. In particular, 🟢 Cluster 2 (Sustainability and Renewable Energy) and 🟡 Cluster 4 (Communication and Sustainable Development) offer the institutional and policy context that links the ICT sector to the 2030 SDGs and national energy strategies, reinforcing the relevance of aligning organizational practices with broader sustainability agendas.
4.4. Integration of Findings
The findings partially support the theoretical assumptions: sociodemographic characteristics and consumption patterns are well-defined, whereas organizational structure and eco-innovation practices exhibit weaknesses. The sectoral energy matrix highlights high fossil fuel consumption in transportation and industry, with subsidies being a key factor explaining part of this pattern.
The integration of i) the 2030 SDGs; ii) eco-innovation models; iii) energy consumption factors; and iv) the energy context, enabled the construction of a conceptual theoretical model of energy consumption in Quito ICT sector (Figure 10). This model provides a foundation for designing strategies, public policies, and sustainable energy efficiency measures, as well as identifying innovation opportunities, guiding investment decisions, and supporting strategic decision-making within organizations.
This integrative framework consolidates empirical findings with established theoretical models, offering a nuanced understanding of energy consumption in Quito’s ICT sector. By situating organizational practices within broader sustainability agendas—such as the 2030 SDGs, eco-innovation paradigms, and Ecuador’s energy context—the proposed model captures both structural limitations and latent opportunities for transformation. It reveals how sociodemographic factors and consumption patterns are relatively stable, while institutional and technological dimensions remain underdeveloped.
In this regard, 🔴 Cluster 1 (Energy Management and Smart Grids) and 🔵 Cluster 3 (Energy Efficiency and Environmental Technologies) constitute the empirical and technical core of the model. These clusters highlight the organizational and technological dimensions that explain energy behavior in ICT firms, underscoring both the barriers to adopting formal energy management systems and the opportunities for efficiency improvements. Figure 9 thus serves not only as a diagnostic tool but also as a strategic roadmap, identifying leverage points for intervention—such as fiscal incentives, capacity-building programs, and targeted investments—that can empower ICT firms to transition toward more sustainable energy practices. This conceptual model provides a foundation for designing context-sensitive policies and guiding organizational decision-making, with the potential to enhance energy efficiency, reduce environmental impact, and foster resilience in urban ecosystems
5. Conclusions
This study characterized the energy profile of the ICT sector in Quito, revealing that consumption is primarily concentrated in electricity, distinguishing it from other sectors with higher reliance on petroleum derivatives. However, this dependence on the electrical grid also exposes the sector to structural limitations of the national energy matrix, where fossil fuel sources still play a role.
The ICT sector in Quito demonstrates relatively efficient energy use, shaped by office-based operations and limited reliance on industrial equipment. Nonetheless, the absence of formal energy policies, low adoption of international standards, and financial barriers reveal structural weaknesses that hinder progress. The proposed model reflects local realities—such as subsidy-driven consumption and organizational fragmentation—and offers a practical foundation for designing targeted interventions.
The application of multivariate statistical techniques enabled the construction of an interpretative model that integrates consumption patterns, management practices, and energy perception. Although sustainability awareness is growing, energy efficiency practices remain uneven—predominantly concentrated in medium and large enterprises—while smaller organizations lack consolidated strategies.
Beyond its diagnostic value, the model serves as a planning tool to guide public policy and corporate decision-making. Its consolidation and expansion—especially toward peripheral urban and rural actors—will be essential to validate its applicability and support more inclusive, context-sensitive energy transitions.
The integration of the four clusters demonstrates that energy consumption in the ICT sector emerges from the convergence of macro level agendas and micro level practices. 🟢 Cluster 2 (Sustainability and Renewable Energy) and 🟡 Cluster 4 (Communication and Sustainable Development) provide the institutional and policy frameworks that connect firms to global sustainability goals and national energy strategies, while 🔴 Cluster 1 (Energy Management and Smart Grids) and 🔵 Cluster 3 (Energy Efficiency and Environmental Technologies) capture the organizational and technological dimensions that directly shape energy behavior at the firm level. Together, these clusters reveal that the sector’s transition toward sustainability depends not only on the availability of efficient technologies but also on the alignment of local practices with broader governance structures. This dual perspective underscores the need for strategies that simultaneously strengthen institutional frameworks and empower micro and small firms to adopt formal energy management systems, thereby bridging the gap between policy ambitions and operational realities.
References
- Oviedo-Salazar, J.; Badii, M.; Guillen, A.; Lugo Serrato, O. Historia y uso de energías renovables. *Daena Int. J. Good Conscienc.* 2015, *10*, 1–18.
- Bhattacharyya, S. *Energy Economics: Concepts, Issues, Markets and Governance*, 2nd ed.; Springer: Leicester, Leicestershire, UK, 2019; pp. 1–450. [Google Scholar]
- Castillo-Calderón, J.; Carrión Jaura, R.; Sinche, D.D.; Panchana, B. Estimation of traction energy consumption of urban service buses in an intermediate Andean city. *IOP Conf. Ser. Earth Environ. Sci.* 2023, *1141*, 012001. [CrossRef]
- World Bank Group. Global Digitalization in 10 Charts. Available online: https://www.worldbank.org/en/news/immersive-story/2024/03/05/global-digitalization-in-10-charts (accessed on 10 September 2025).
- UNCTAD. *2024 Digital Economy Report: Shaping an Environmentally Sustainable and Inclusive Digital Future*; United Nations: Geneva, Switzerland, 2024. [Google Scholar]
- Ganchala, R.; Robalino-López, A.; Aniscenko, Z. High-growth firms’ behavior in Latam: the case of ICT sector in Ecuador. *J. Technol. Manag. Innov.* 2022, *17*, 48–62. [CrossRef]
- Araujo, G.; Robalino-López, A.; Román, J.L. Propuesta de modelo teórico referente al comportamiento de consumo energético del sector residencial urbano ecuatoriano. In *Responsabilidad Social y Sostenibilidad: Disrupción e Innovación ante el Cambio de Época*; Editorial: Quito, Ecuador, 2021; pp. 611–634. [Google Scholar]
- Araujo-Vizuete, G.; Robalino-López, A.; Mena-Nieto, Á. Looking beyond subsidies: Understanding the complexity of household energy consumption dynamics of Ecuador’s main cities. *Cities* 2025, *163*, 106008. [CrossRef]
- Pacheco, F. Modelo de gestión estratégica para la industria de energías renovables bajo el escenario de cambio de la matriz energética del Ecuador. Master’s Thesis, Universidad Central del Ecuador, Quito, Ecuador, 2018. [Google Scholar]
- Soria, R.; Villamar, D.; Rochedo, P. Impacto económico de la transición energética en Ecuador. 2024. [CrossRef]
- MINTEL. Agenda de Transformación Digital del Ecuador 2022–2025. 2022. Available online: https://www.telecomunicaciones.gob.ec/wp-content/uploads/2021/05/Agenda-Digital-del-Ecuador-2021-2022-222-comprimido.pdf (accessed on 24 September 2025).
- García, S.; Parejo, A.; Personal, E.; Guerrero, J.I.; Biscarri, F.; León, C. A retrospective analysis of the impact of the COVID-19 restrictions on energy consumption at a disaggregated level. *Appl. Energy* 2021, *287*, 116547. [CrossRef]
- International Telecommunication Union (ITU). Measuring Digital Development: Facts and Figures. 2021.
- Peña, A.; Herrera, L.; Indicadores de tecnología de la información y comunicación. Encuesta Nacional Multipropósito de Hogares (Seguimiento al Plan Nacional de Desarrollo). *Instituto Nacional de Estadística y Censos*, 2021, p. 24. Available online: https://www.ecuadorencifras.gob.ec/encuesta-nacional-multiproposito-de-hogares/ (accessed on 24 September 2025).
- Aguilar, L. Criterios Técnicos de Evaluación de Fuentes No Convencionales de Energía en un Distrito Térmico en Colombia. 2024.
- Ministerio de Energía del Gobierno de Chile. Long-Term Energy Planning 2023–2027. 2024. Available online: https://energia.gob.cl/sites/default/files/documentos/pelp2023-2027_informe_final.pdf (accessed on 24 September 2025).
- Municipio DMQ. Orquestador de Movilidad. 2018. Available online: https://www7.quito.gob.ec/mdmq_ordenanzas/Administración%202019-2023/Asamblea%20de%20Quito/Asamblea%202020-12-16/I.%20Cumplimiento%20resoluciones/Orquestador/v1.2_perfil_de_proyecto_orquestador-signed.pdf (accessed on 24 September 2025).
- Tejedor-Flores, N.; Vicente-Galindo, P.; Galindo-Villardón, P. Sustainability multivariate analysis of the energy consumption of Ecuador using MuSIASEM and BIPLOT approach. *Sustainability* 2017, *9*, 984. [CrossRef]
- Hernández-Sampieri, R.; Fernández-Collado, C.; Baptista-Lucio, P. *Metodología de la Investigación*, 6th ed.; McGraw-Hill Interamericana: Ciudad de México, México, 2014. [Google Scholar]
- Vasseur, V.; Marique, A.F.; Udalov, V. A conceptual framework to understand households’ energy consumption. *Energies* 2019, *12*, 4250. [CrossRef]
- Ofetotse, E.L.; Essah, E.A.; Yao, R. Evaluating the determinants of household electricity consumption using cluster analysis. *J. Build. Eng.* 2021, *43*, 102487. [CrossRef]
- König, W. Energy efficiency in industrial organizations – A cultural-institutional framework of decision-making. *Energy Res. Soc. Sci.* 2020, *67*, 101483. [CrossRef]
- Javaid, M.; Haleem, A.; Singh, R.P.; Suman, R.; Gonzalez, E.S. Understanding the adoption of Industry 4.0 technologies in improving environmental sustainability. *Sustain. Oper. Comput.* 2022, *3*, 203–217. [CrossRef]
- Wang, S.; Sun, L.; Iqbal, S. Green financing role on renewable energy dependence and energy transition in E7 economies. *Renew. Energy* 2022, *200*, 1561–1572. [CrossRef]
- Perri, C.; Giglio, C.; Corvello, V. Smart users for smart technologies: Investigating the intention to adopt smart energy consumption behaviors. *Technol. Forecast. Soc. Change* 2020, *155*, 119991. [CrossRef]
- Fatima, N.; Li, Y.; Ahmad, M.; Jabeen, G.; Li, X. Factors influencing renewable energy generation development: A way to environmental sustainability. *Environ. Sci. Pollut. Res.* 2021, *28*, 51714–51732. [CrossRef]
- González, O. An approach to the different types of nonprobabilistic sampling. *Rev. Cuba. Med. Gen. Integr.* 2021, *37*, 3.
- Gower, J.C.; A general coefficient of similarity and some of its properties. *Biometrics* 1971, *27*, 857–871. Available online: https://www.jstor.org/stable/2528823 (accessed on 24 September 2025).
- D’Orazio, M. Distances with mixed-type variables, some modified Gower’s coefficients. *arXiv Prepr.* 2021, pp. 1–17. [CrossRef]
- Gower, J.C. Some distance properties of latent root and vector methods used in multivariate analysis. *Biometrika* 1966, *53*, 325. [CrossRef]
- Legendre, P.; Legendre, L. Book review. *Ecol. Modell.* 1998, *132*, 303–304.
- Cubilla-Montilla, M.; Nieto-Librero, A.B.; Galindo-Villardón, M.P.; Torres-Cubilla, C.A. Sparse HJ biplot: A new methodology via elastic net. *Mathematics* 2021, *9*, 1298. [CrossRef]
- Gabriel, K.R. The biplot graphic display of matrices with application to principal component analysis. *Biometrika* 1971, *58*, 453–467. [CrossRef]
- Settanni, E.; Srai, J.S. It’s a long way to the top (if you wanna biplot): A back-to-basics perspective on the implementation of principal component biplots in R. Springer Netherlands, 2025.
- Castro-Kohnenkampf, E. Construcció Civil: Buenas prácticas para la descarbonización de edificios de centros de datos. 2024.
- Bustamante, T.; Lara Ponce, R. *El Dorado o la caja de Pandora: Matices para pensar la minería en Ecuador*. 2010.
- Alarcon Rodriguez, A.D.; et al. Watts on: Una mirada al sector energético en América Latina y el Caribe. *Watts: Una mirada al sector energético en América Latina y el Caribe* 2024. [CrossRef]
- Alonso-Almeida, M.-M.; Rocafort, A.; Borrajo, F. Shedding light on eco-innovation in tourism: A critical analysis. *Sustainability* 2016, *8*, 1262. [CrossRef]
- Klewitz, J.; Hansen, E.G. Sustainability-oriented innovation of SMEs: A systematic review. *J. Clean. Prod.* 2013, *65*, 1–19. [CrossRef]
- Díaz-García, C.; González-Moreno, Á.; Sáez-Martínez, F.J. Eco-innovation: Insights from a literature review. *Innov. Manag. Policy Pract.* 2015, *17*, 6–23. [CrossRef]
- Urbaniec, M. Towards sustainable development through eco-innovations: Drivers and barriers in Poland. *Econ. Sociol.* 2015, *8*, 179–190. [CrossRef]
- Pawłowski, A. How many dimensions does sustainable development have? *Sustain. Dev.* 2008, *90*, 81–90. [CrossRef]
- Warner, K.S.R.; Wäger, M. Building dynamic capabilities for digital transformation: An ongoing process of strategic renewal. *Long Range Plann.* 2019, *52*, 326–349. [CrossRef]
- Keho, Y. What drives energy consumption in developing countries? The experience of selected African countries. *Energy Policy* 2016, *91*, 233–246. [CrossRef]
- Borja-Patiño, J.; Robalino-López, A.; Mena-Nieto, A. Breaking the unsustainable paradigm: Exploring the relationship between energy consumption, economic development and carbon dioxide emissions in Ecuador. *Sustain. Sci.* 2024, *19*, 403–421. [CrossRef]
- De Wilde, P. The gap between predicted and measured energy performance of buildings: A framework for investigation. *Autom. Constr.* 2014, *41*, 40–49. [CrossRef]
- Schulze, M.; Nehler, H.; Ottosson, M.; Thollander, P. Energy management in industry: A systematic review of previous findings and an integrative conceptual framework. *J. Clean. Prod.* 2016, *112*, 3692–3708. [CrossRef]
- Introna, V.; Cesarotti, V.; Benedetti, M.; Biagiotti, S.; Rotunno, R. Energy Management Maturity Model: An organizational tool to foster the continuous reduction of energy consumption in companies. *J. Clean. Prod.* 2014, *83*, 108–117. [CrossRef]
- Sa, A.; Thollander, P.; Cagno, E. Assessing the driving factors for energy management program adoption. *Renew. Sustain. Energy Rev.* 2017, *74*, 538–547. [CrossRef]
- Araujo-Vizuete, G.; Robalino-López, A. A systematic roadmap for energy transition: Bridging governance and community engagement in Ecuador. *Smart Cities* 2025, *8*, 80. https://www.mdpi.com/2624-6511/8/3/80.
- Llerena Poveda, B.L. Incidencia del cambio de la matriz energética en empresas proveedoras de servicios de instalación de acometidas y medidores en el sector eléctrico y una propuesta estratégica. Caso EnergyWhole Cía. Ltda. Master’s Thesis, Quito, Ecuador, 2016. [Google Scholar]
- Espinoza, S.; Guayanlema, V.; Balance y proyecciones del sistema de subsidios energéticos en Ecuador. *Análisis* 2017, pp. 1–28. Available online: http://library.fes.de/pdf-files/bueros/quito/13648.pdf (accessed on 24 September 2025).
Figure 1.
Network visualization of the bibliometric analysis: Cluster 1 (Red): Energy Management and Smart Grids; Cluster 2 (Green): Sustainability and Renewable Energy; Cluster 3 (Blue): Energy Efficiency and Environmental Technologies; Cluster 4 (Yellow): Communication and Sustainable Development.
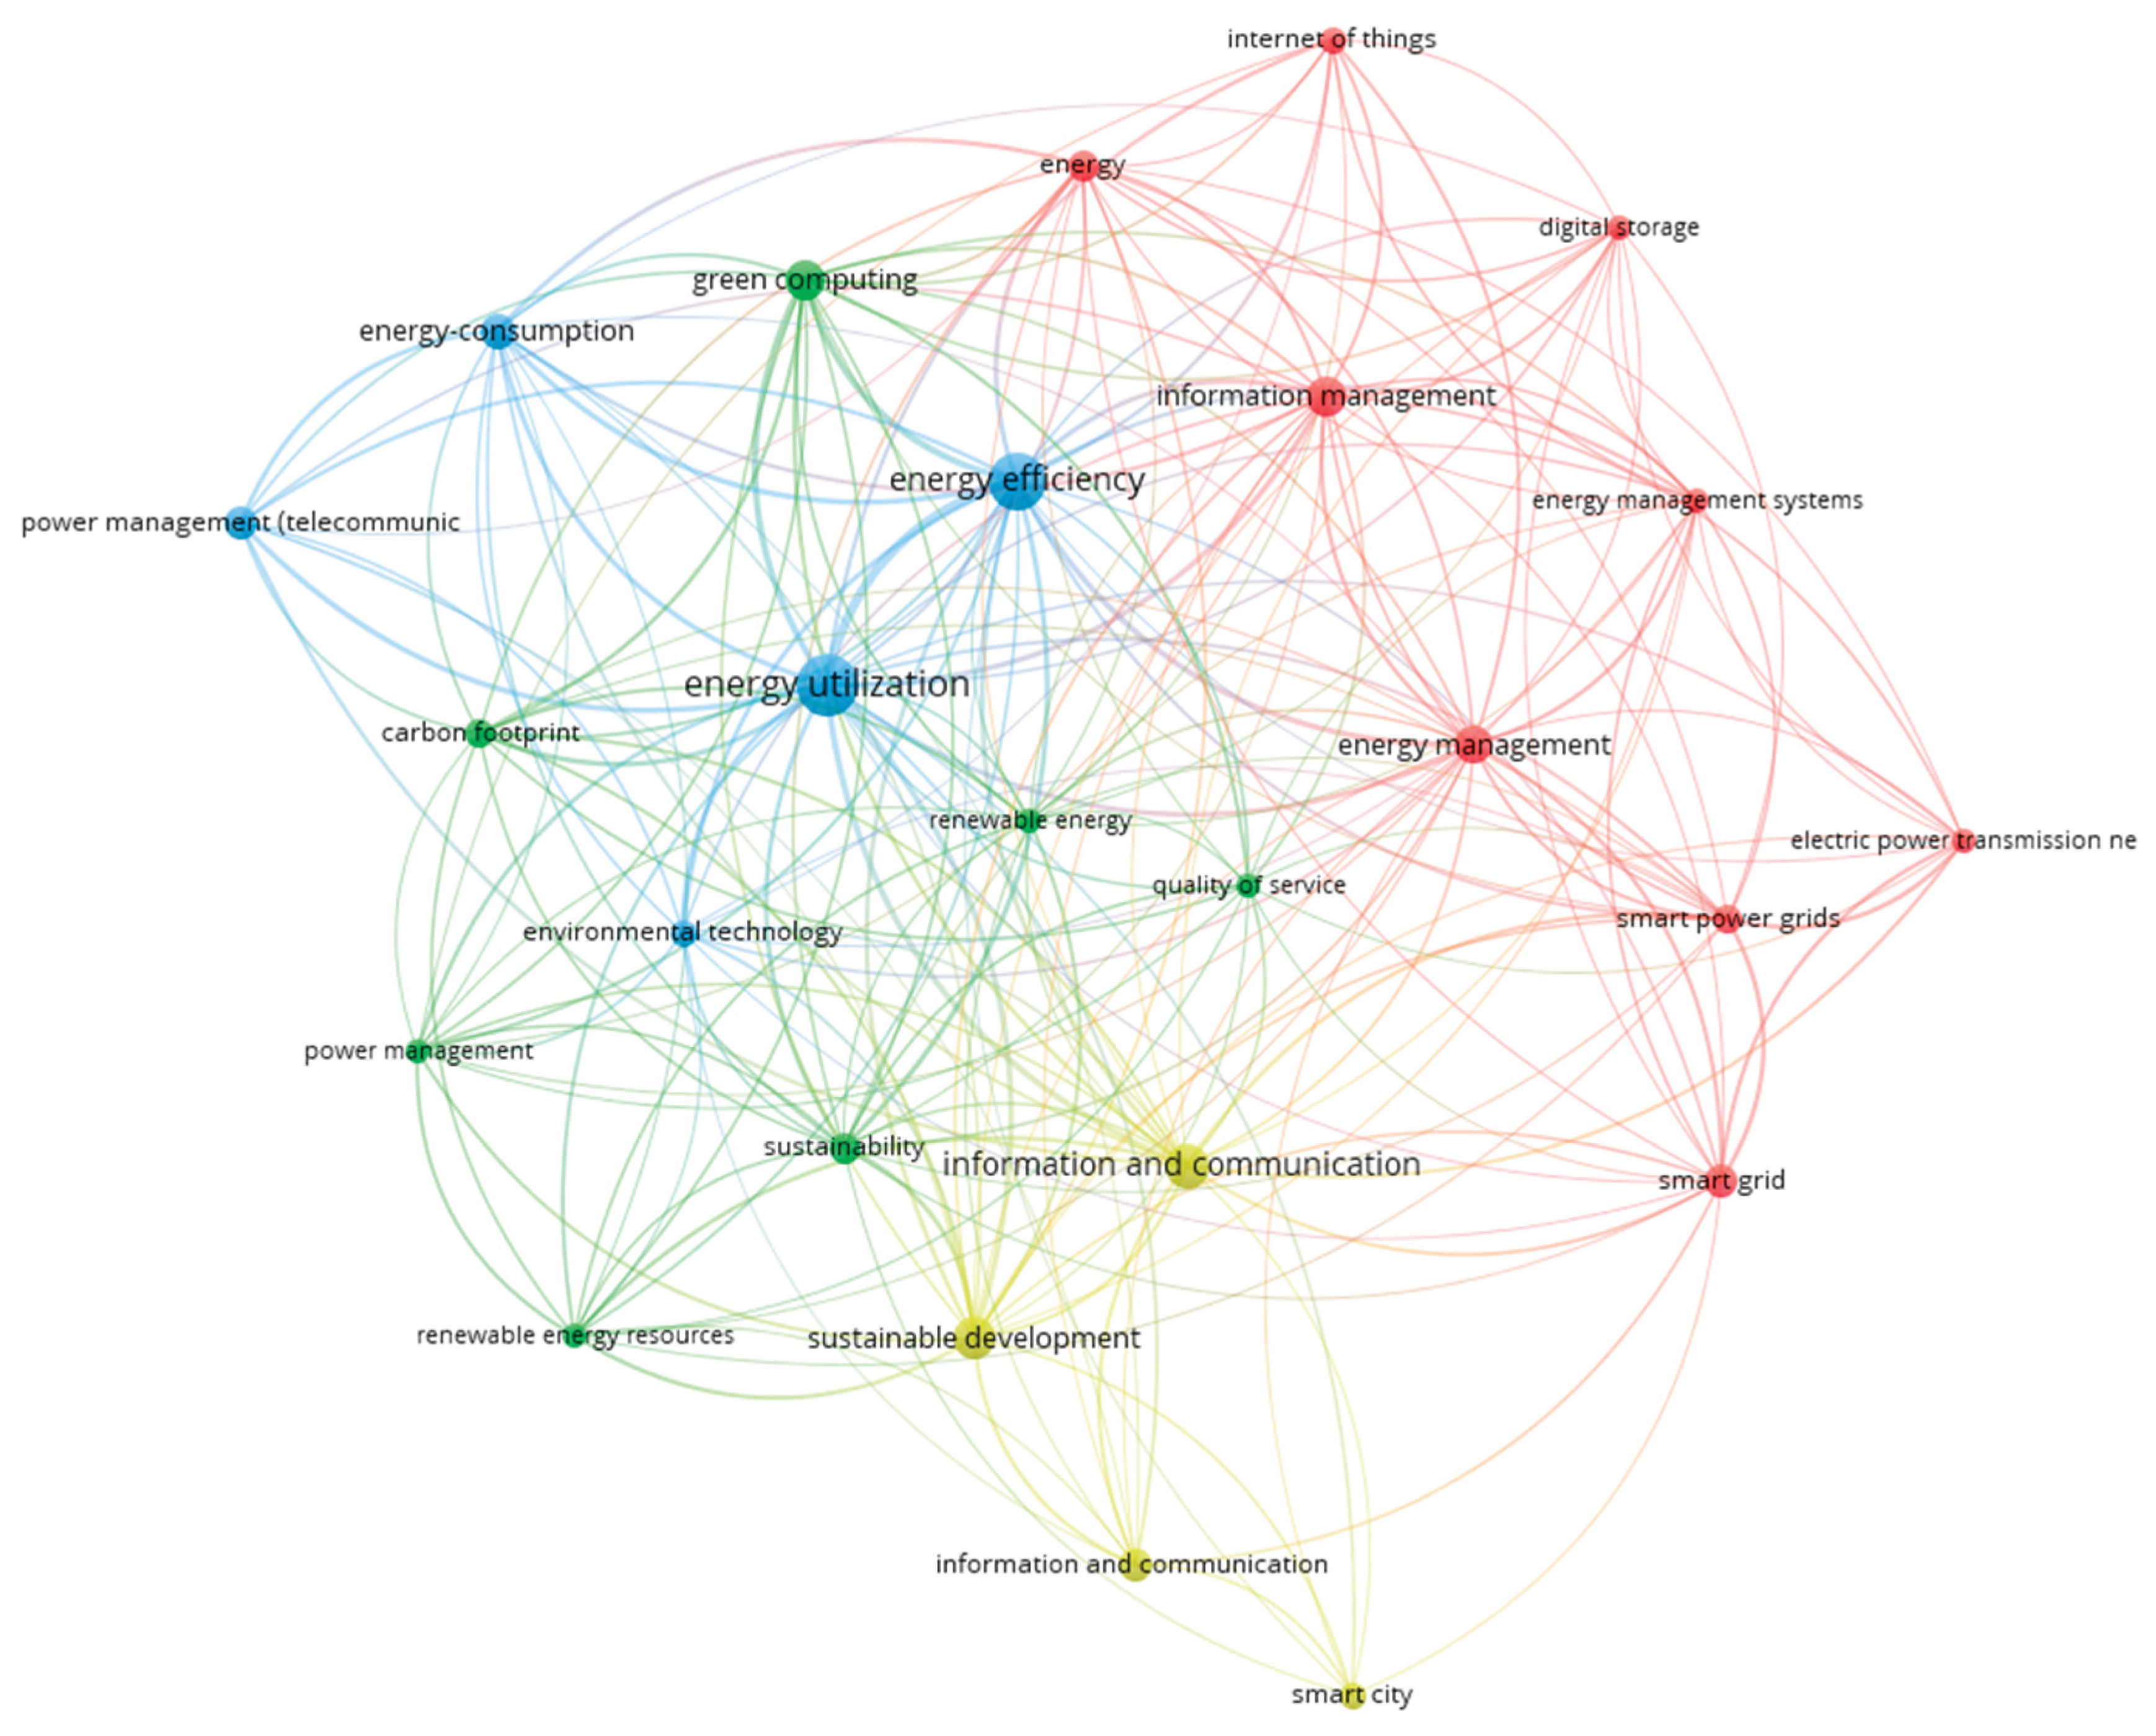
Figure 2.
Research Methodology.
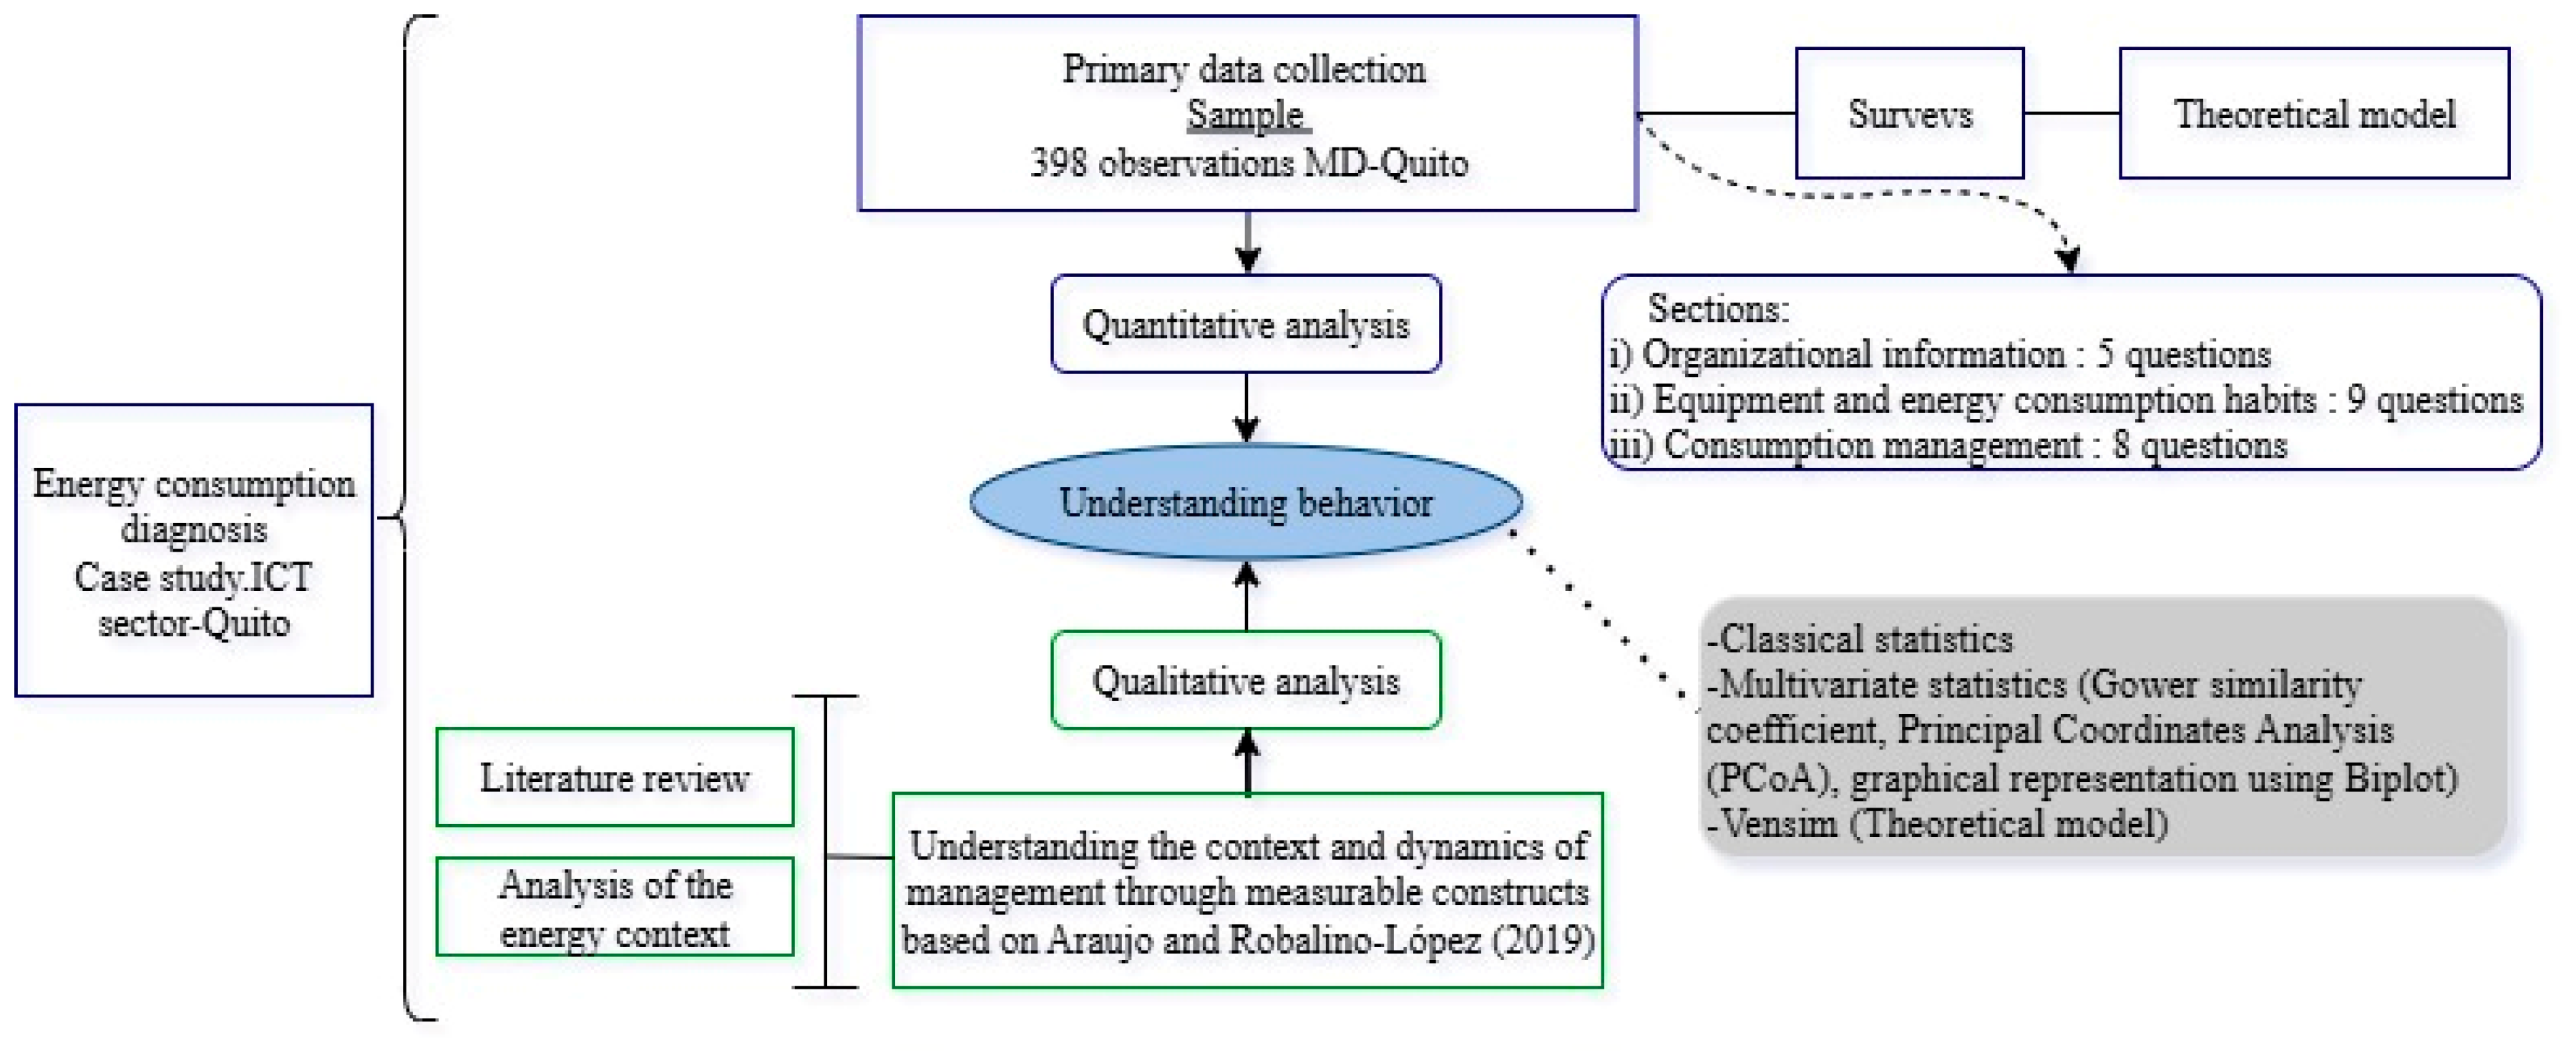
Figure 3.
Variables Examined (22 across four categories).
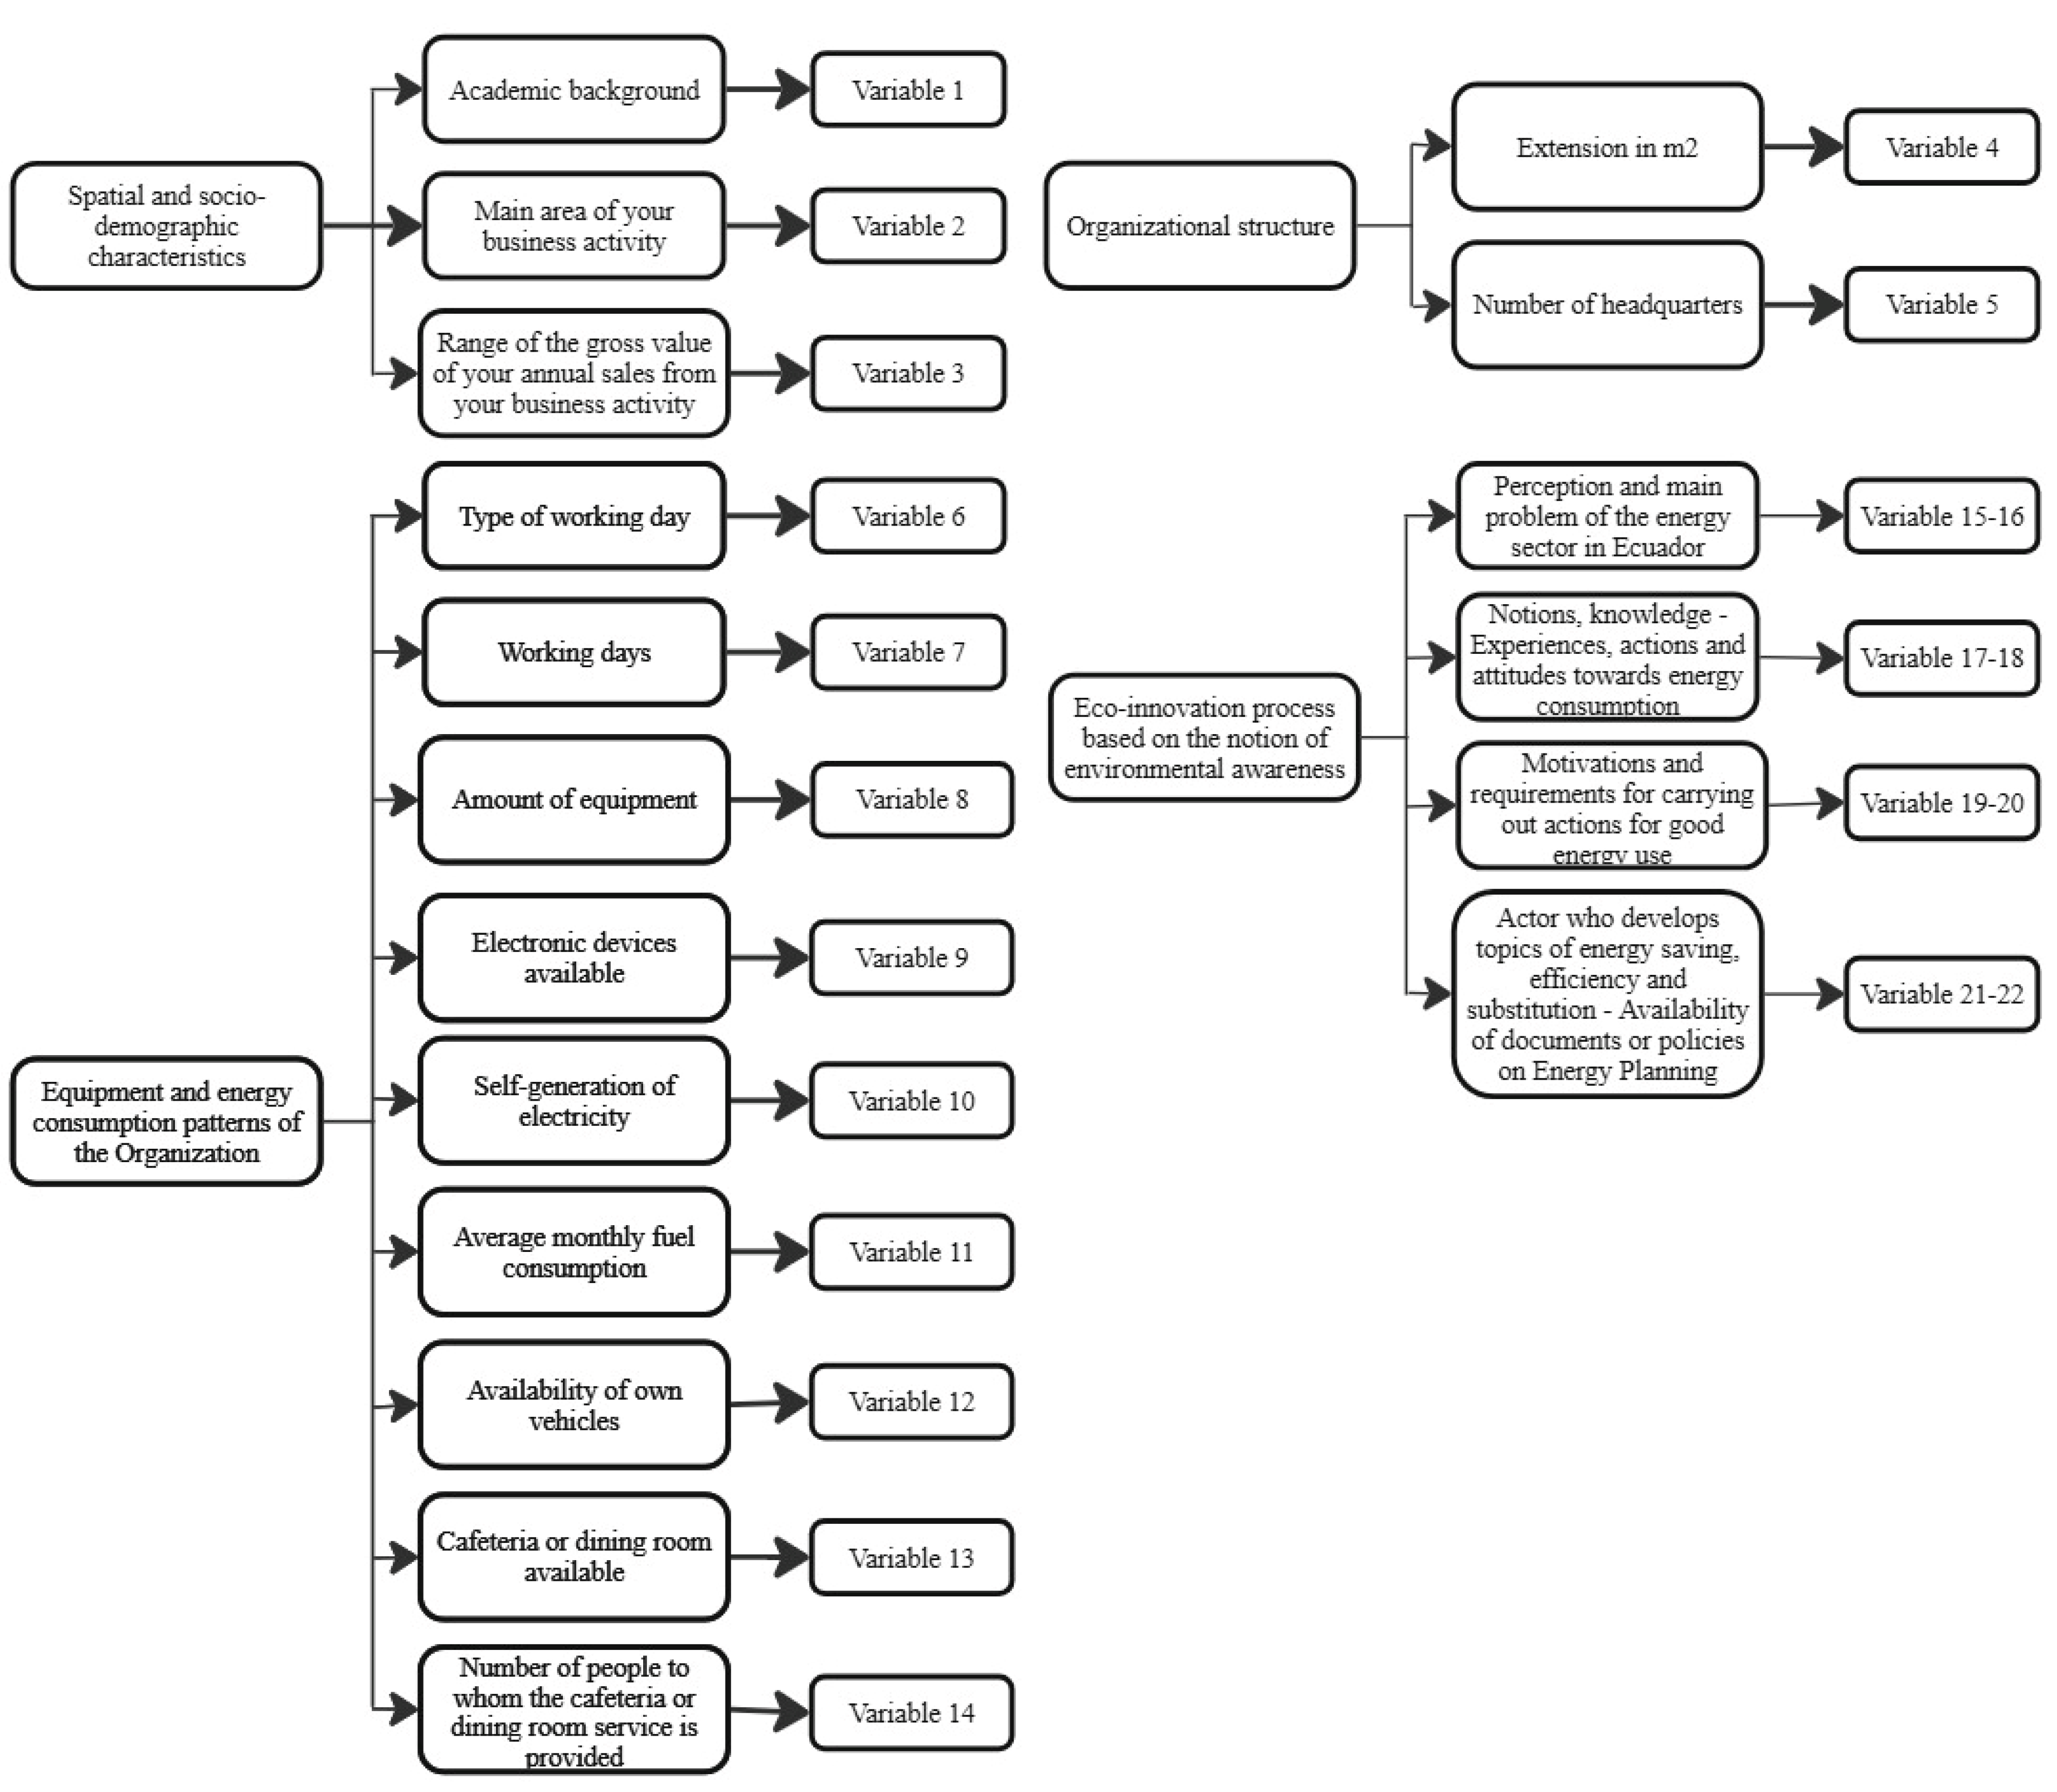
Figure 4.
Gower Biplot – Energy Consumption by ICT Subsector.
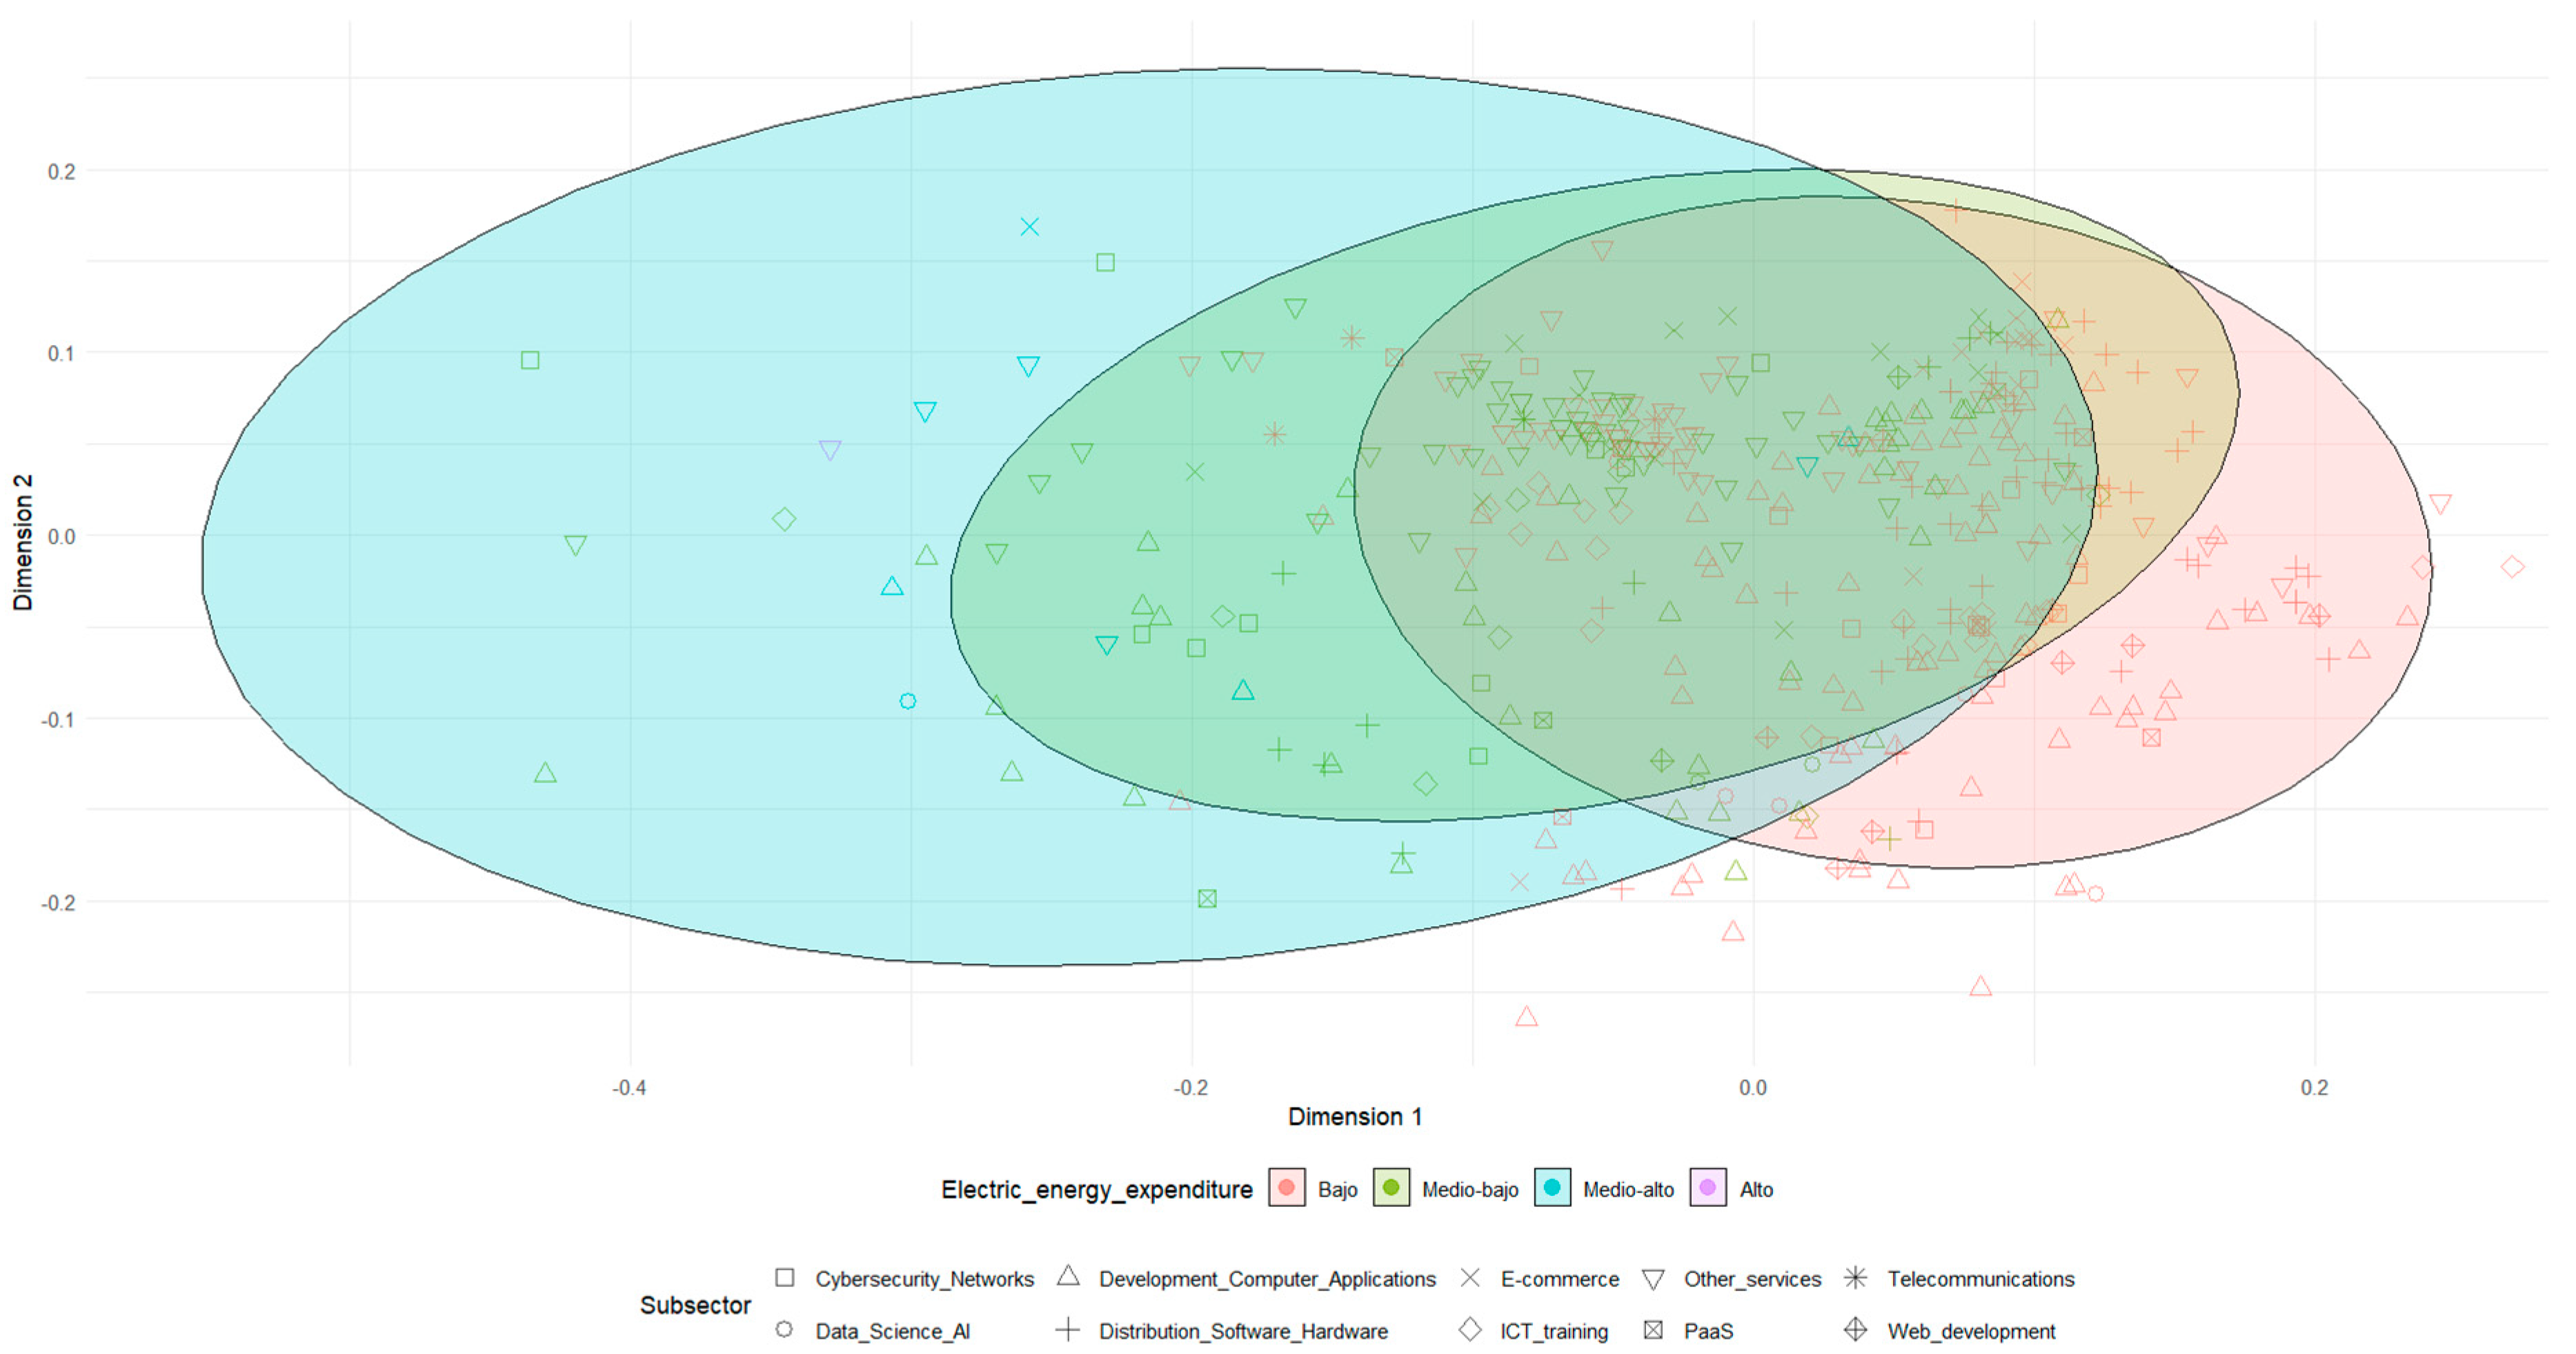
Figure 5.
Gower Biplot: Equipment Usage Patterns.
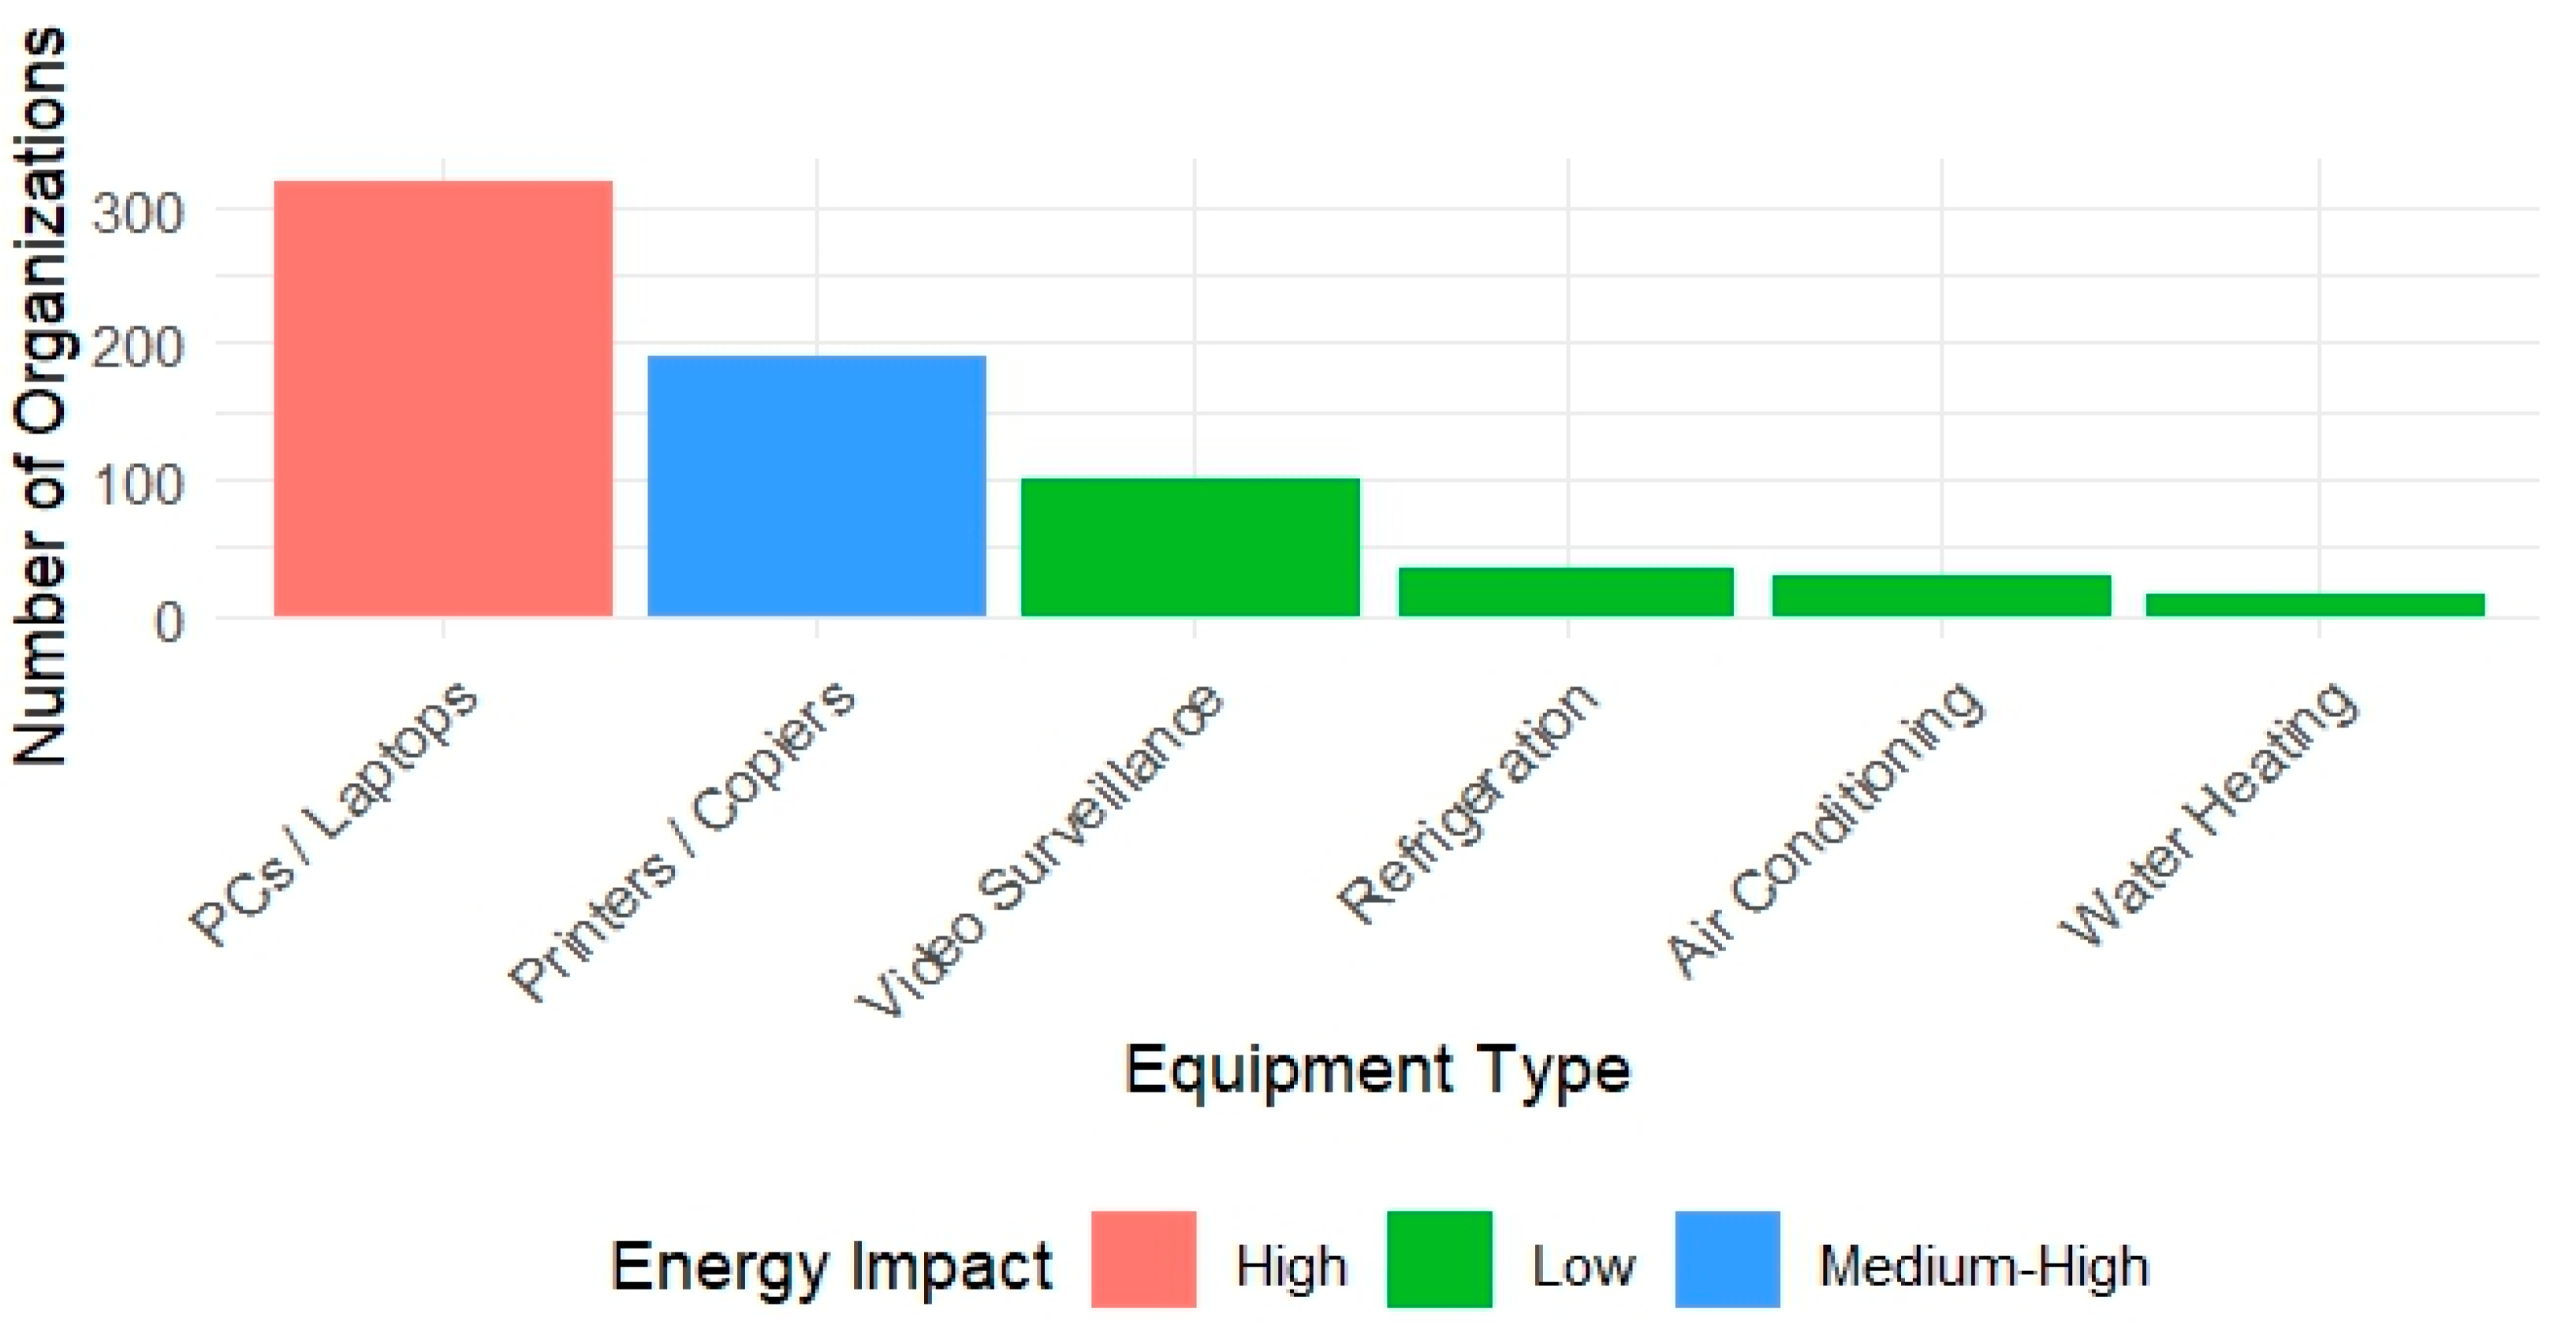
Figure 6.
Gower Biplot – Electricity Consumption.
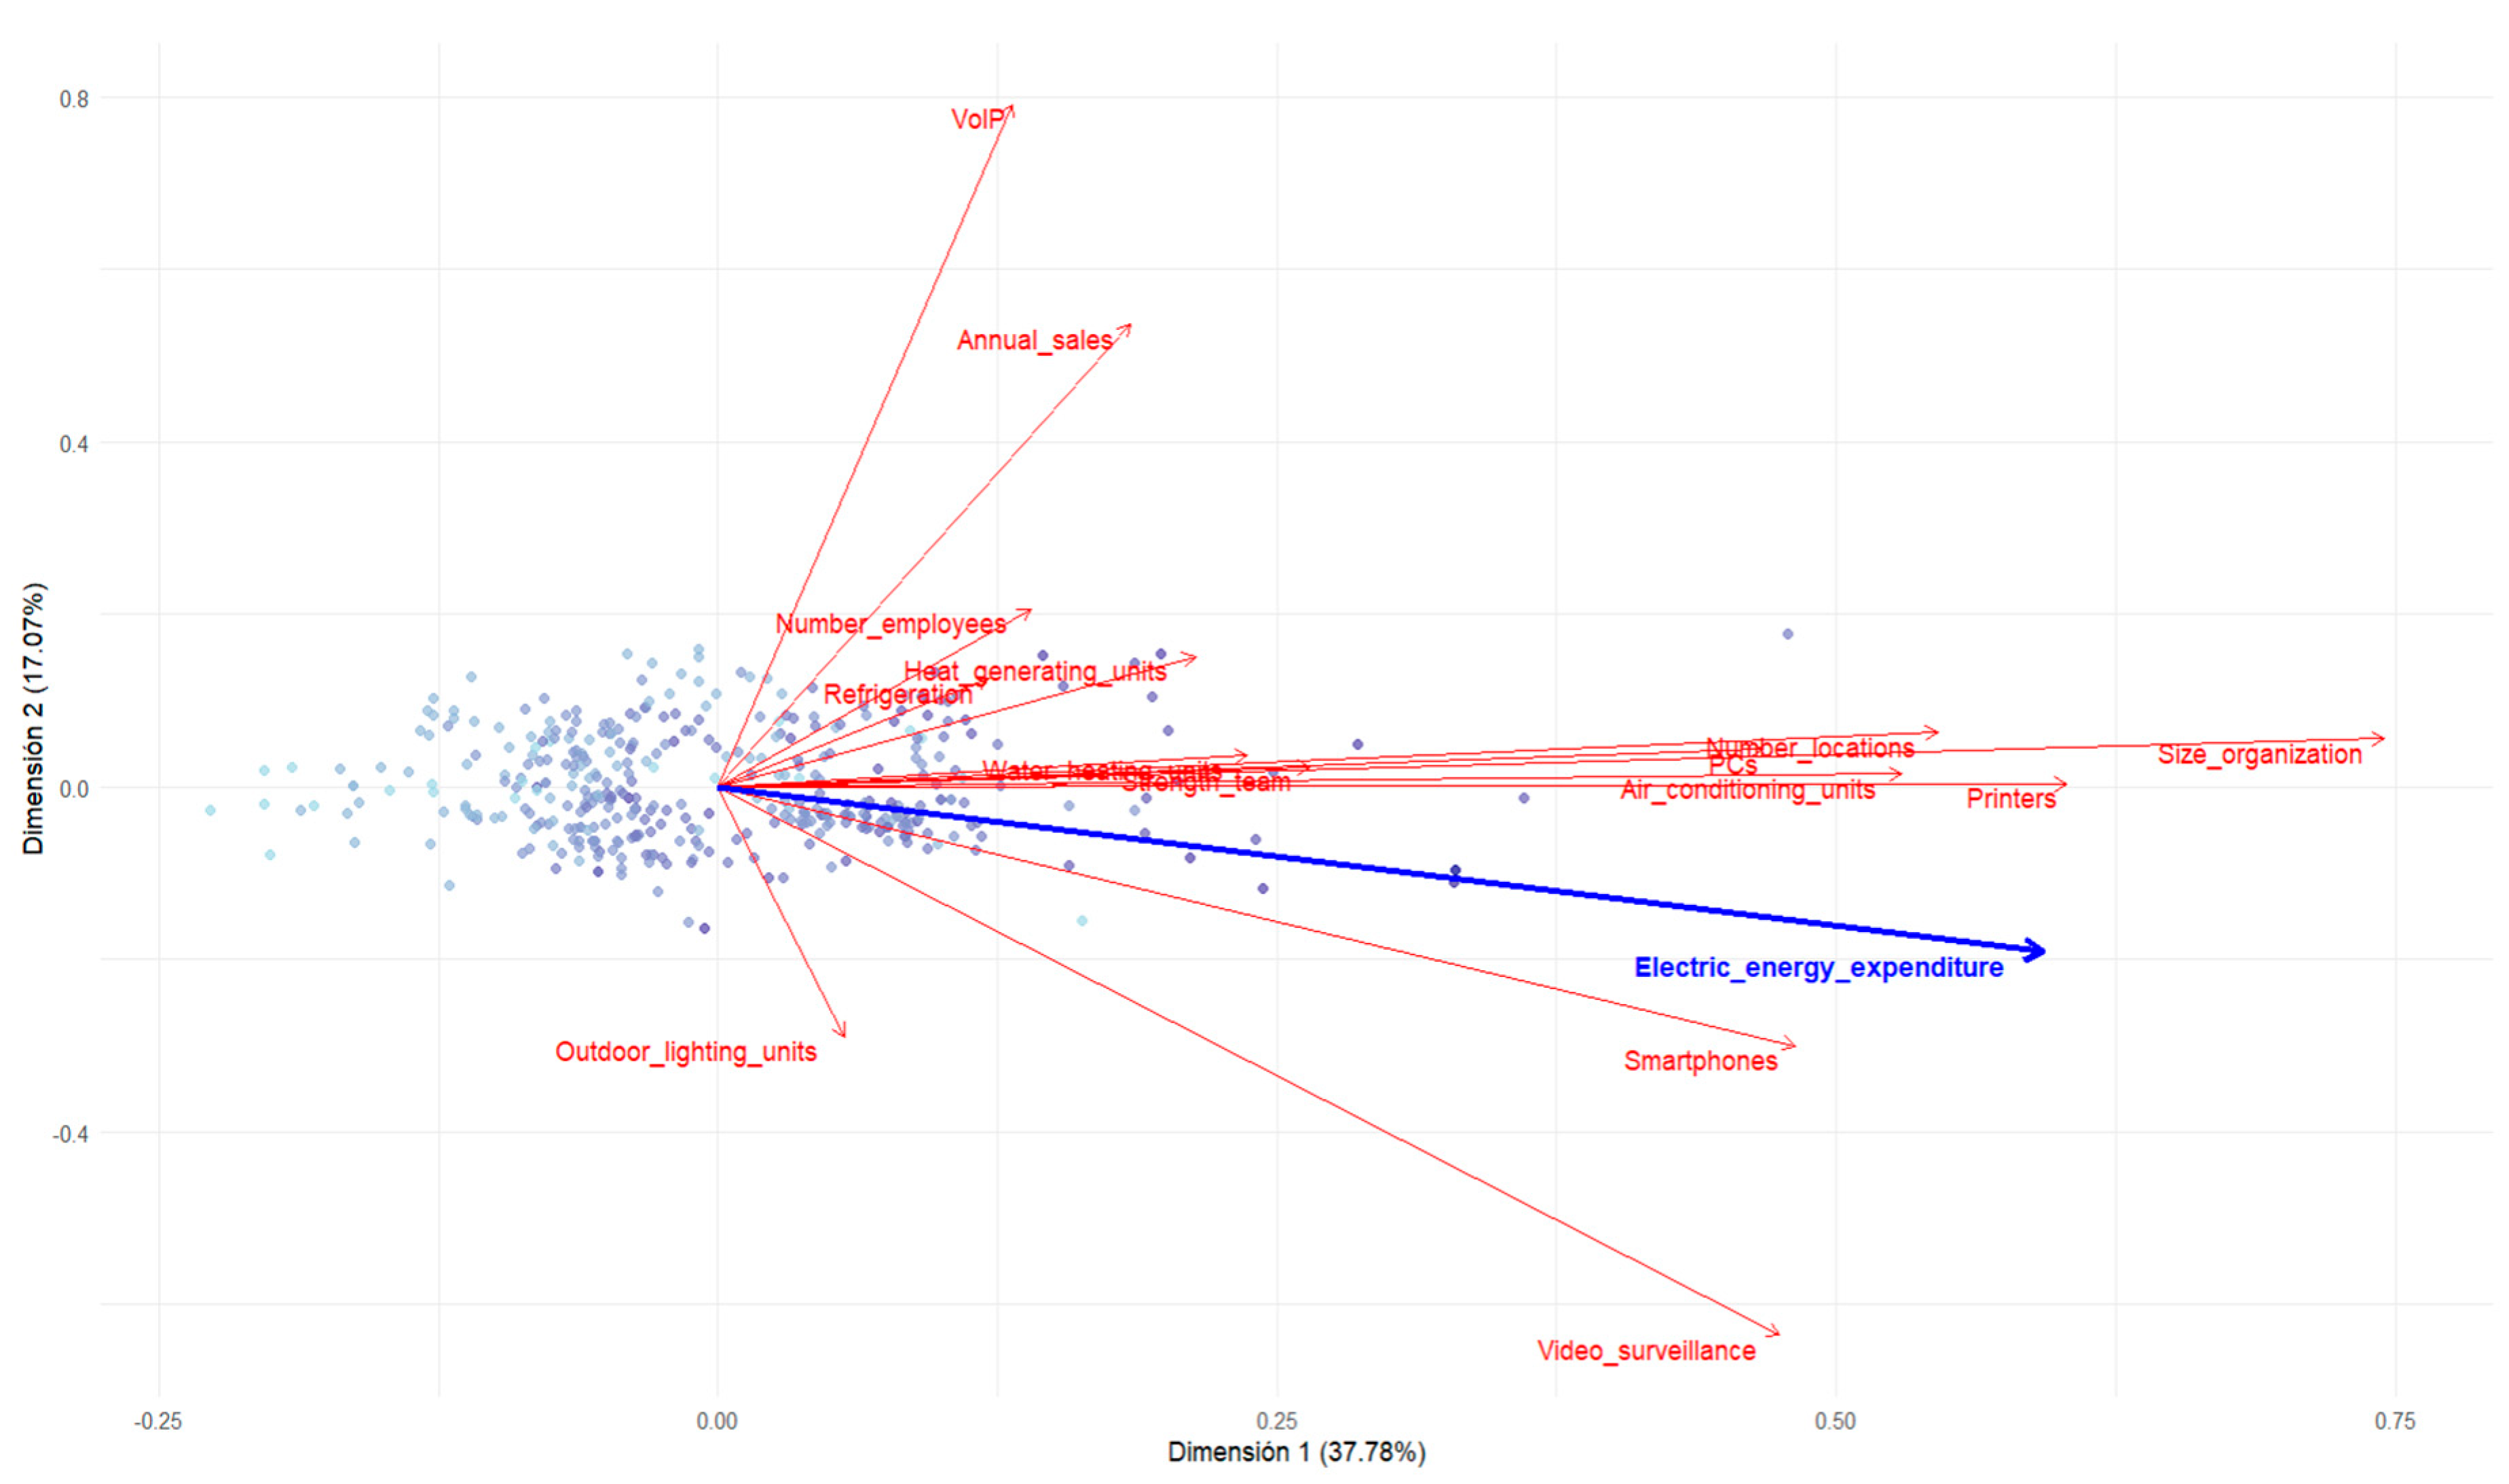
Figure 7.
Gower Biplot – Premium Gasoline Consumption.
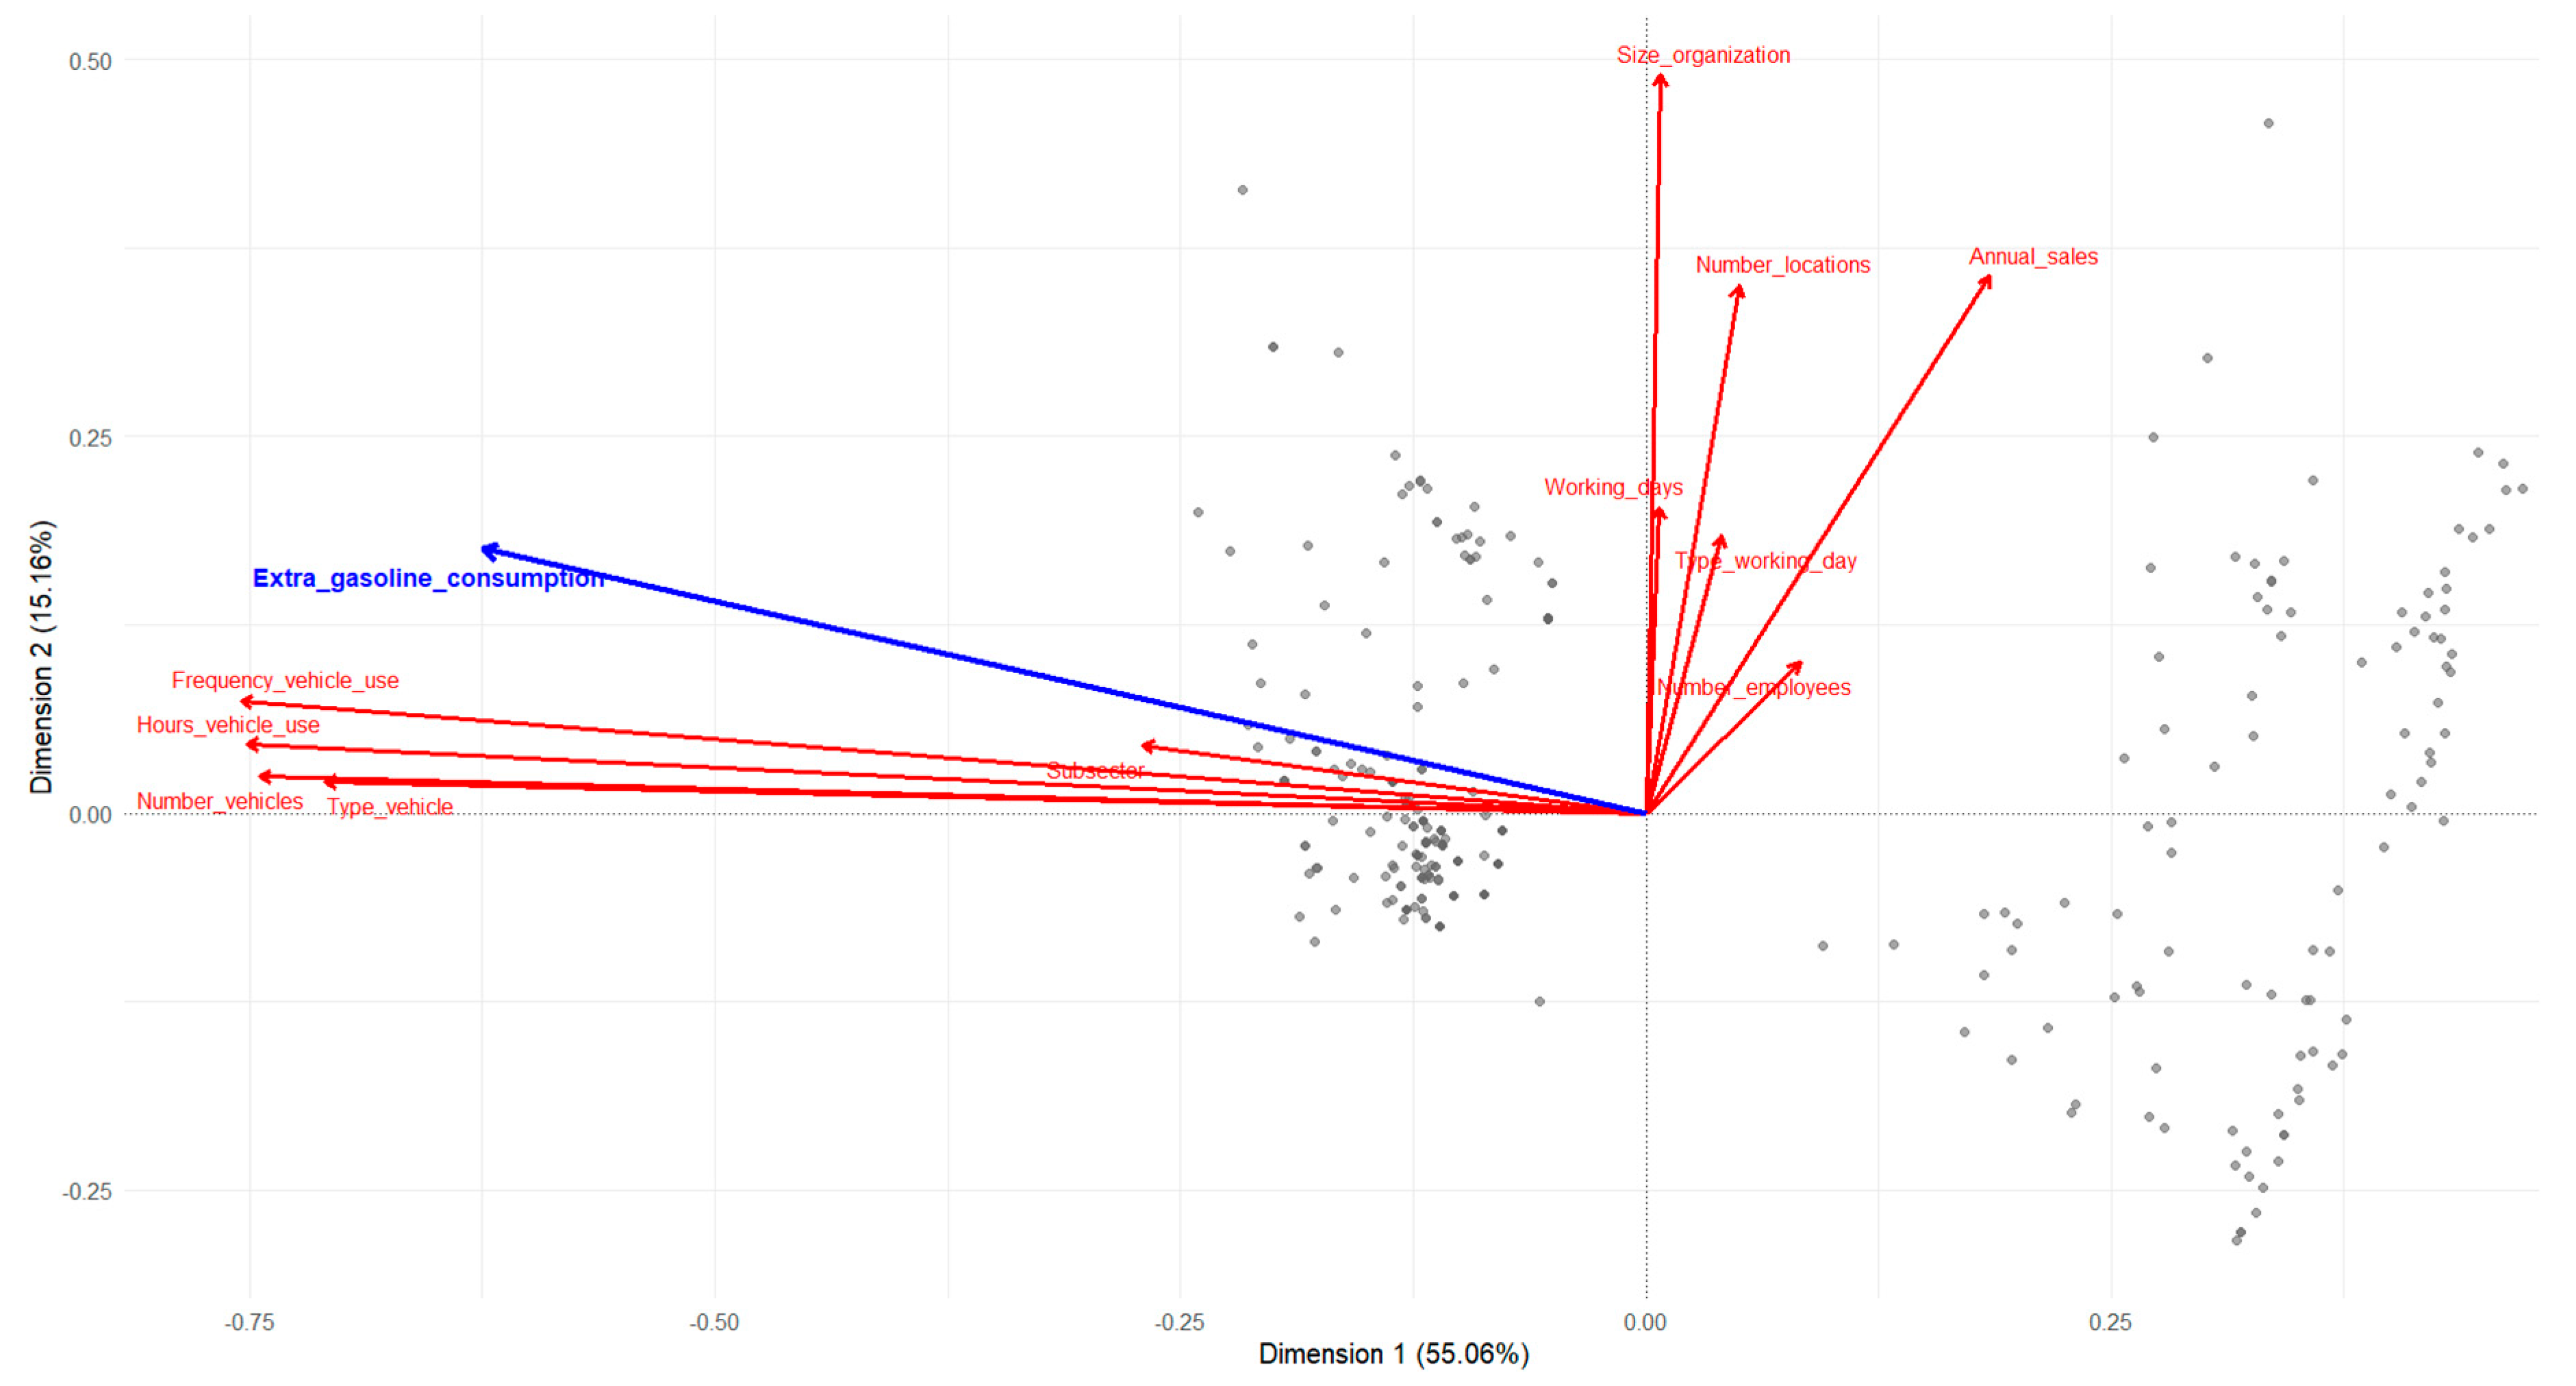
Figure 8.
Gower Biplot – Super Gasoline Consumption.
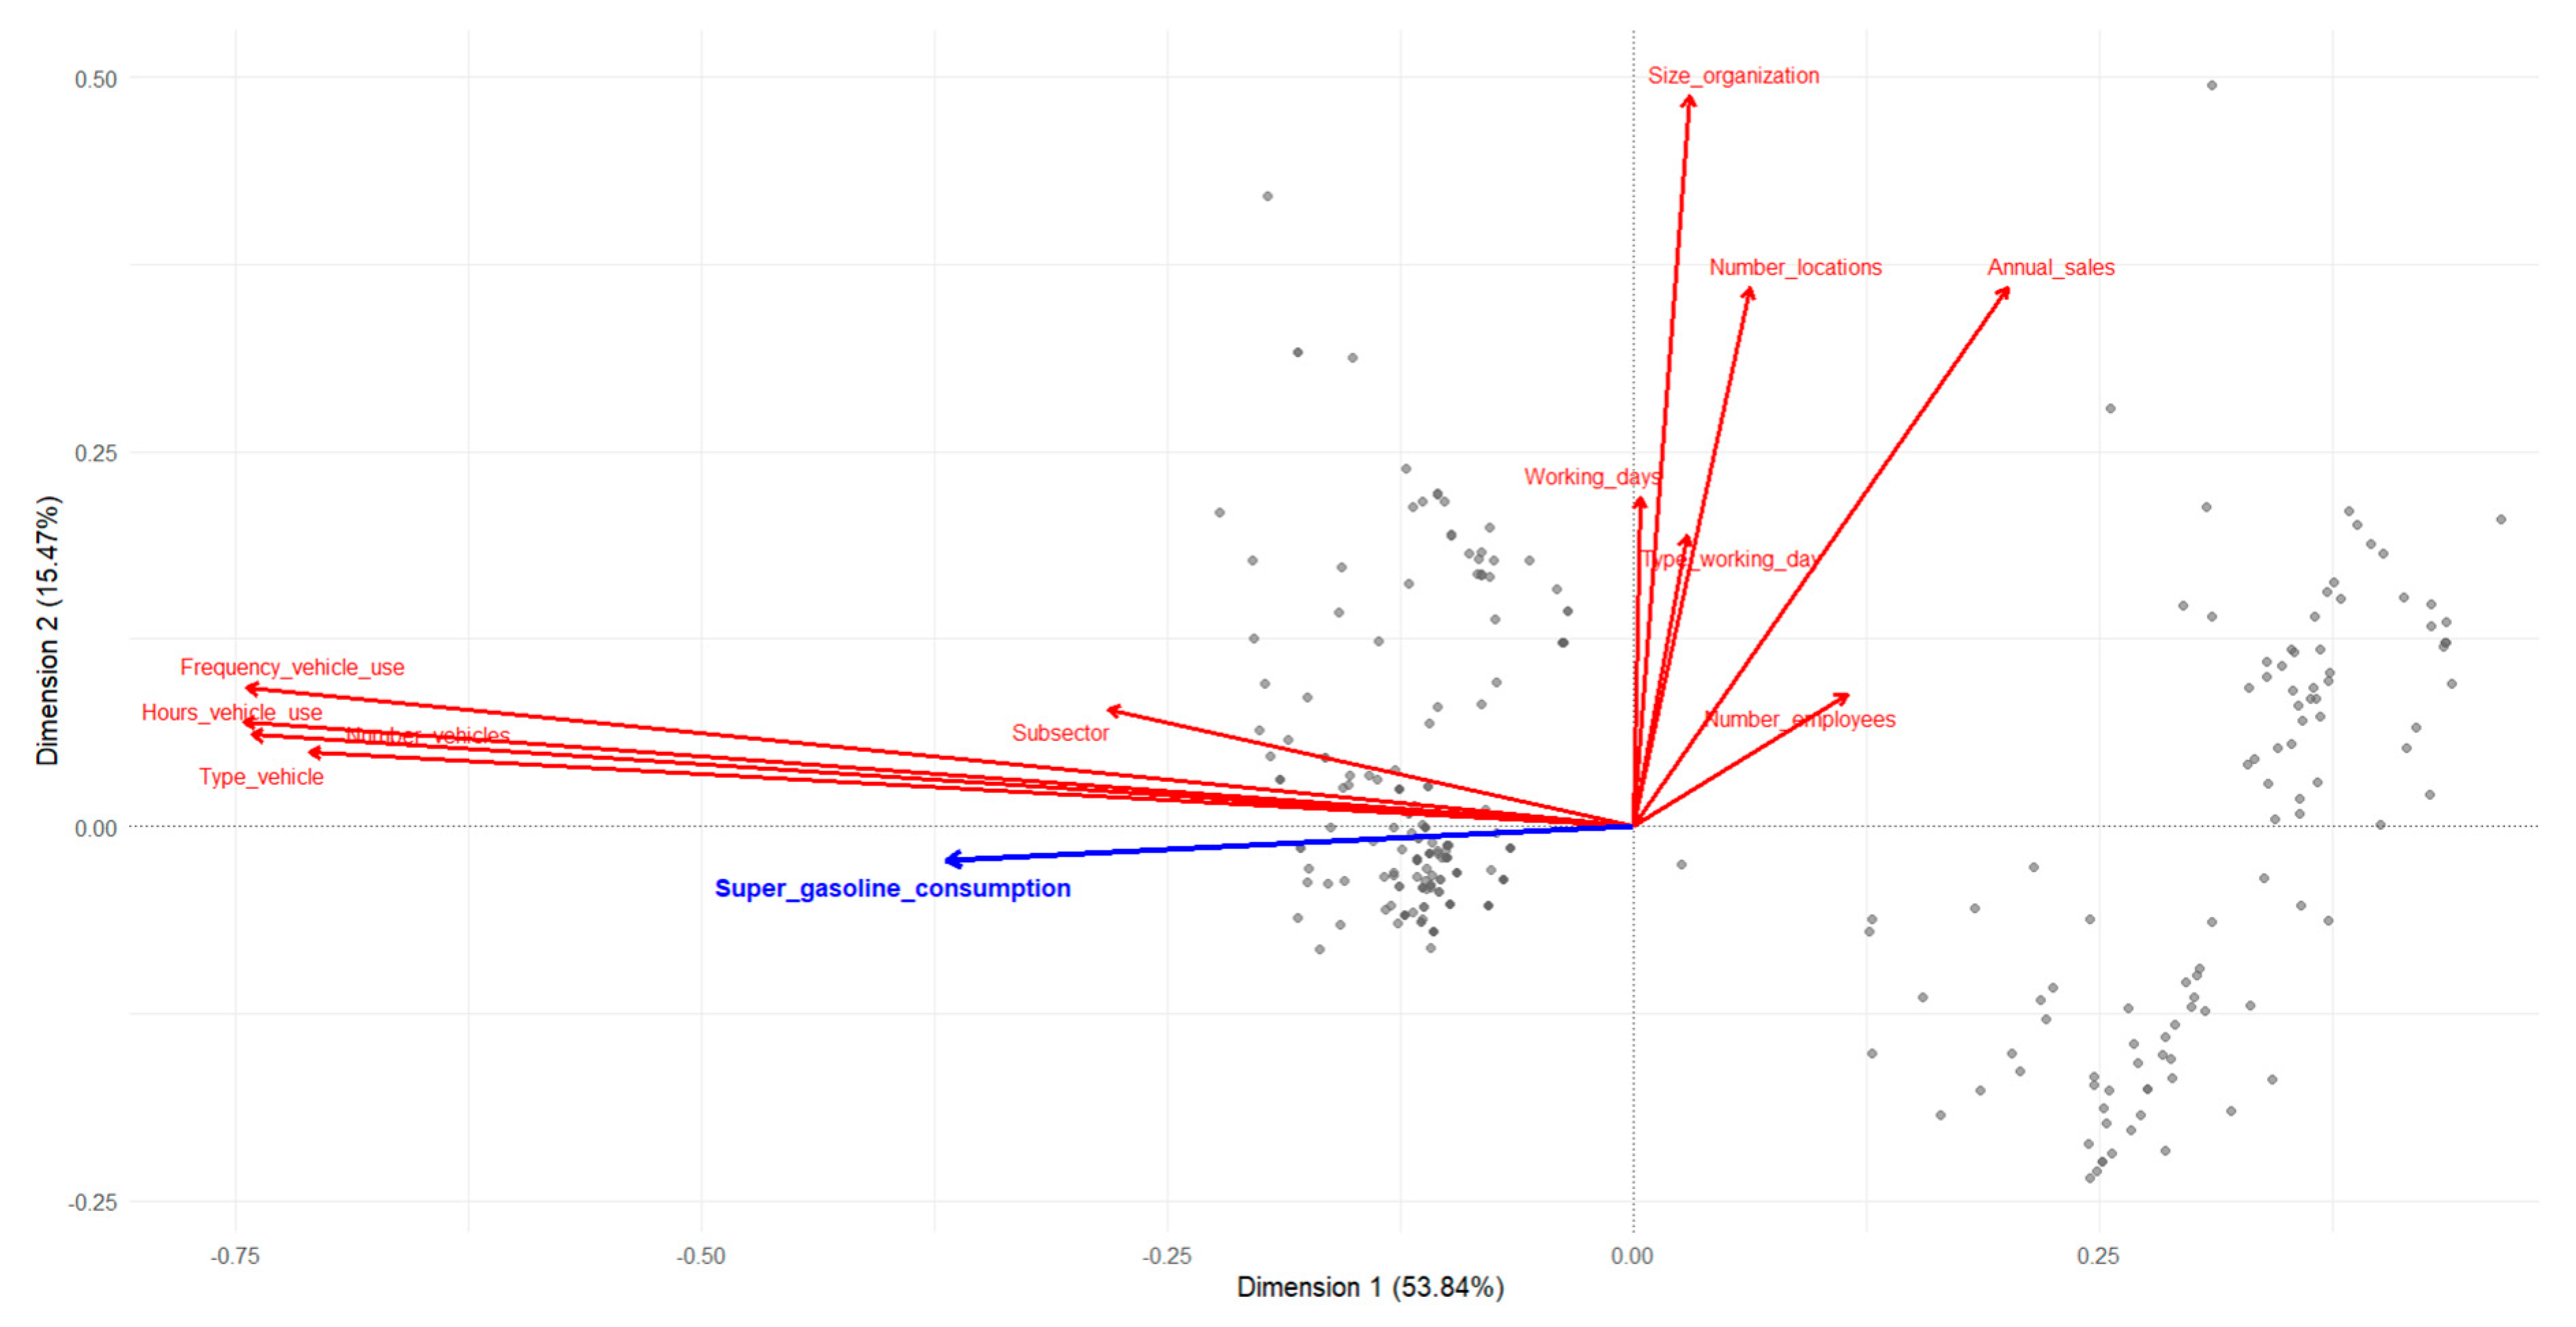
Figure 9.
Gower Biplot – Diesel Consumption.
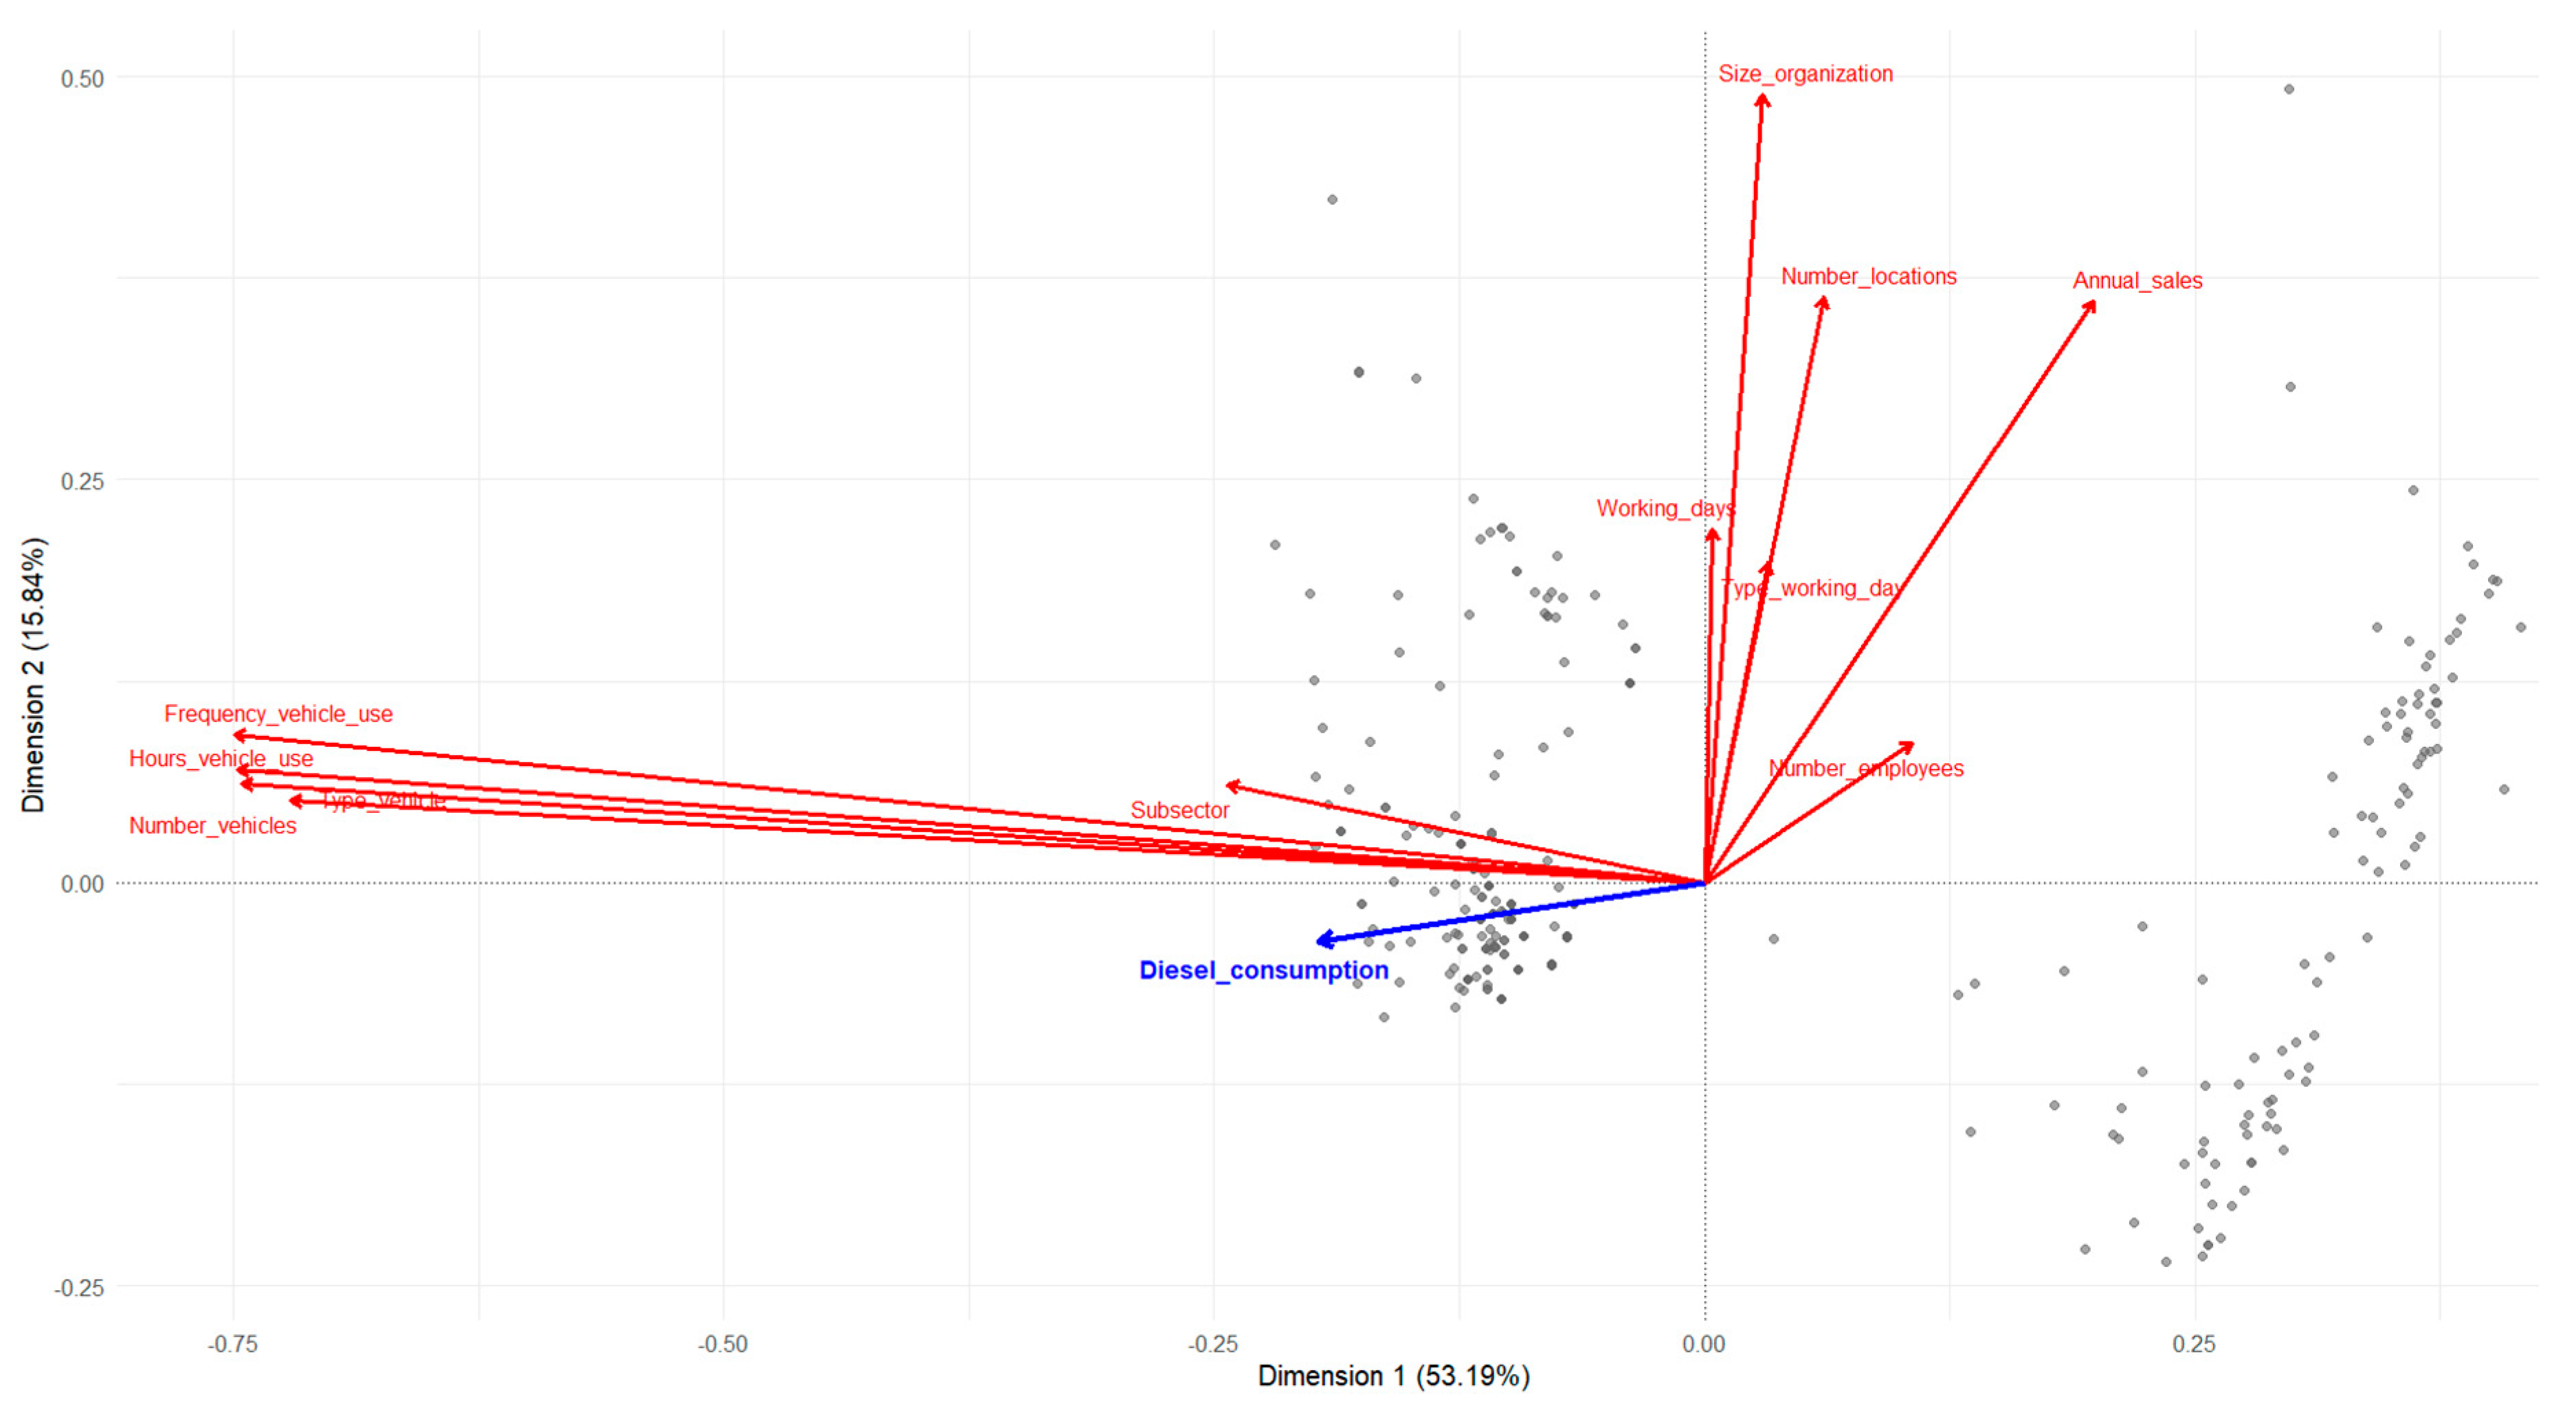
Figure 10.
Proposed Theoretical Model of Energy Consumption in the ICT Industrial Sector – Quito, Ecuador.
Figure 10.
Proposed Theoretical Model of Energy Consumption in the ICT Industrial Sector – Quito, Ecuador.
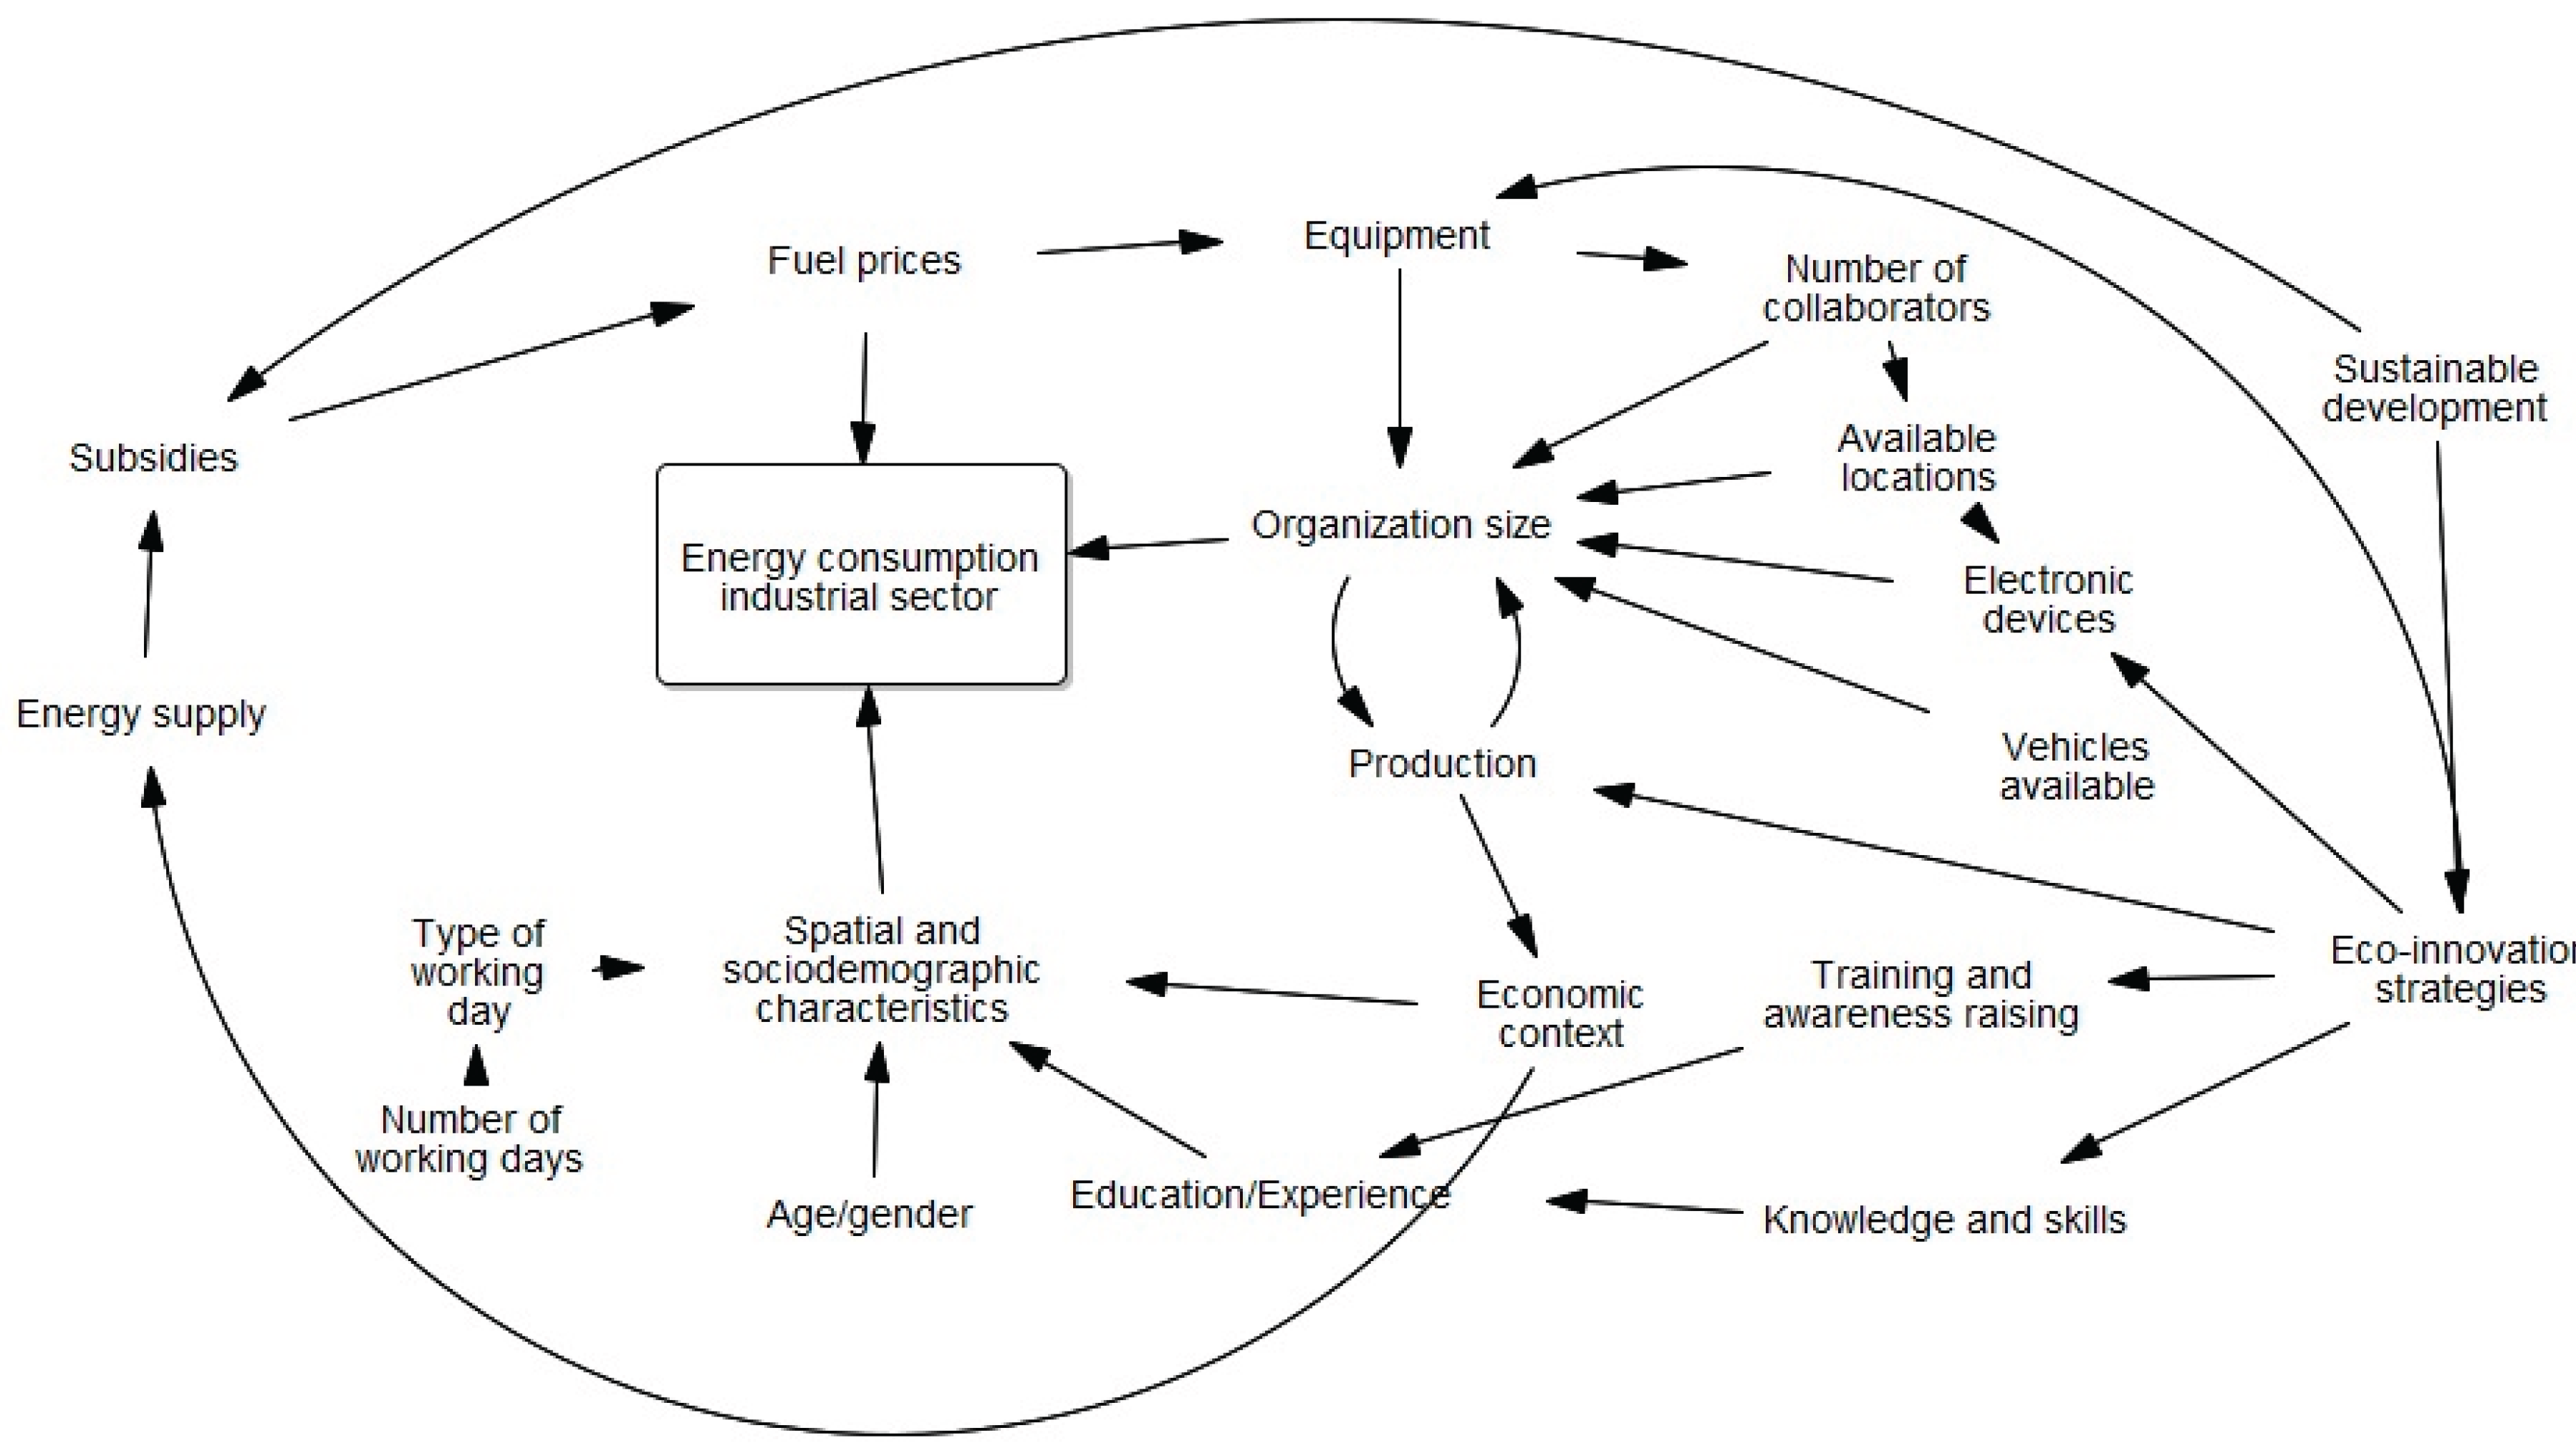

Table 1.
Sociodemographic and Organizational Profile of ICT Companies in Quito (n = 398).
| Variable | Category | Frequency | Percentage |
| Employee Education | University | 313 | 78.6% |
| Technical/Technological | 55 | 13.8% | |
| Postgraduate (Non-Business) | 19 | 4.8% | |
| Postgraduate (Management/Administration) | 6 | 1.5% | |
| No Higher Education | 5 | 1.3% | |
| Main Activity | Application Development | 121 | 30.4% |
| Other ICT Services | 105 | 26.4% | |
| Software Distribution | 61 | 15.3% | |
| E-commerce | 31 | 7.8% | |
| ICT Training | 28 | 7% | |
| Cybersecurity and Networking | 20 | 5% | |
| Web Development | 10 | 2.5% | |
| Platform as a Service (PaaS) | 9 | 2.3% | |
| Data Science/AI/IoT | 8 | 2% | |
| Telecommunications | 5 | 1.3% | |
| Number of Branches | Single Branch | 337 | 84.7% |
| Office Size | 100–200 m² | 130 | 32.7% |
| Annual Revenue | < USD 100,000 | 302 | 75.9% |
| USD 100,000–1,000,000 | 76 | 19.2% |
Table 2.
Significant Variables and Energy Consumption Patterns by Energy Source in ICT Organizations.
Table 2.
Significant Variables and Energy Consumption Patterns by Energy Source in ICT Organizations.
| Energy Type | Significant Variables | Observations |
| Electricity | Company size, PCs, Printers, AC, Computing Devices, Video Surveillance | Consumption concentrated during daytime; Annual revenue not significant |
| Gasoline Extra | Vehicle quantity & type, Daily usage hours, Usage frequency, Subsector | Higher consumption of app developers and e-commerce |
| Gasoline Super | Vehicle quantity & type, Daily usage hours, Usage frequency, Subsector | Similar pattern as Gasoline Extra; Organization size less relevant |
| Diesel | Vehicle quantity & type, Daily usage hours, Usage frequency, Subsector | Similar pattern to Gasoline Super; Organization size not related |
Disclaimer/Publisher’s Note: The statements, opinions and data contained in all publications are solely those of the individual author(s) and contributor(s) and not of MDPI and/or the editor(s). MDPI and/or the editor(s) disclaim responsibility for any injury to people or property resulting from any ideas, methods, instructions or products referred to in the content. |
© 2025 by the authors. Licensee MDPI, Basel, Switzerland. This article is an open access article distributed under the terms and conditions of the Creative Commons Attribution (CC BY) license (http://creativecommons.org/licenses/by/4.0/).
Copyright: This open access article is published under a Creative Commons CC BY 4.0 license, which permit the free download, distribution, and reuse, provided that the author and preprint are cited in any reuse.


