
Submitted:
08 December 2025
Posted:
11 December 2025
You are already at the latest version
Abstract
Background/Objectives: Schizophrenia is a highly heritable psychiatric disorder that affects approximately 1% of the global population. Genome-wide association studies (GWAS) have mapped most schizophrenia risk variants to noncoding regions, highlighting the role of regulatory processes and noncoding RNAs in schizophrenia pathology. Despite this, and schizophrenia’s association with 5-hydroxytryptamine (serotonin) system dysfunction, HTR5A-AS1, a long noncoding RNA (lncRNA) antisense to the serotonin receptor (HTR, 5-hydroxytryptamine receptor) gene HTR5A, remains virtually unstudied. This study provides the first systematic characterization of HTR5A-AS1, validating its transcript structure and investigating its genetic associations, expression dynamics, developmental regulation, and potential synaptic and GABAergic functions in schizophrenia. Methods: Transcriptome-wide association study (TWAS) summary statistics were integrated with postmortem RNA sequencing (RNA-seq), BrainSpan developmental transcriptomes, UCSC Genome Browser annotations, and functional prediction tools. These complementary approaches enabled validation of the transcript’s structure, quantification of regional and developmental expression, and assessment of potential molecular functions. Results: HTR5A-AS1 showed significant TWAS associations with schizophrenia in the hippocampus and dorsolateral prefrontal cortex (dlPFC). In postmortem schizophrenia donor tissue, expression was significantly reduced in the hippocampus, with a non-significant but directionally similar decrease in the dlPFC; sex-stratified analyses revealed that hippocampal reductions were strongest in male donors. Parallel analyses showed modest hippocampal downregulation of the paired receptor gene HTR5A, again driven primarily by males. Developmental transcriptomes revealed region-specific developmental trajectories, with steep increases during adolescence, aligning with the age range of typical schizophrenia onset. HTR5A-AS1 was strongly co-expressed with HTR5A, and functional predictions implicated involvement in synaptic and GABAergic signaling, consistent with cortico-hippocampal circuit disruption in schizophrenia. Conclusions: These findings provide the first evidence that HTR5A-AS1 is a bona fide antisense transcript with developmental and synaptic roles that may contribute to schizophrenia risk. Future single-cell and functional perturbation studies are needed to test causality and define mechanisms of regulation.
Keywords:
schizophrenia
; long noncoding RNA
; HTR5A-AS1
; antisense RNA
; serotonin system
; transcriptome-wide association study
; BrainSpan
; synaptic signaling
; GABAergic signaling
; neurodevelopment
1. Introduction
Schizophrenia is a severe psychiatric disorder that impacts approximately 0.3–0.7% of people during their lifetime, corresponding to about 21 million individuals worldwide [1]. Age-adjusted prevalence has remained relatively stable, but incidence rates have risen modestly over recent decades, with more new diagnoses per year [2]. Schizophrenia is characterized by hallucinations, delusions, cognitive deficits, and social withdrawal [3]. Environmental factors such as maternal stress and especially adolescent cannabis use may contribute to a person’s likelihood of getting schizophrenia. However, twin, family, and genome-wide association studies (GWAS) firmly establish genetics as the central risk component, with genetic factors explaining approximately 80% [4] of the risk for schizophrenia. GWAS have identified 287 genetic variants and 120 genes linked to schizophrenia. Interestingly, of the 287 genome-wide significant risk loci, only 106 are in protein-coding genes [5,6]. These findings highlight the importance of regulatory processes and noncoding RNAs as a risk factor for schizophrenia.
In addition, schizophrenia is widely considered a neurodevelopmental disorder, with symptoms typically emerging in adolescence or early adulthood. Converging evidence suggests that genetic risk factors act, in part, by altering neurodevelopmental trajectories: large-scale transcriptomic studies show that schizophrenia-associated genes are preferentially expressed prenatally and during adolescence, when synaptic pruning and cortical maturation occur [7]. This framework emphasizes the importance of evaluating potential risk genes across developmental stages and brain regions.
Schizophrenia is consistently linked to structural and functional abnormalities across brain regions. Meta-analyses and longitudinal magnetic resonance imaging (MRI) studies reveal reduced gray matter volumes and altered connectivity in areas including the prefrontal cortex, hippocampus, superior temporal cortex, thalamus, and anterior cingulate cortex [8]. These structures are critical for cognition, memory, and emotional regulation, and their dysfunction highlights schizophrenia’s characterization as a dysconnection syndrome, defined by disrupted cognition and impaired high-order neural integration.
The 5-hydroxytryptamine (serotonin) system has been consistently implicated in the pathology of schizophrenia, especially through its involvement in mood, cognition, and sensory processing [9]. The serotonin receptor family (HTR, 5-hydroxytryptamine receptor) consists of seven main classes from HTR1A to HTR7 and 14 subtypes. Antipsychotic drugs used to treat schizophrenia primarily target dopamine receptors [10], although many have also been shown to act on serotonin receptors [11], particularly HTR1A and HTR2A. Interestingly, variants in HTR2A, HTR1A, HTR2C, and HTR3A have been implicated in schizophrenia [12].
By contrast, HTR5A is far less studied despite its clear physiological relevance. HTR5A encodes the serotonin 5-HT5A receptor, a G protein-coupled receptor (GPCR) that inhibits adenylate cyclase and modulates cyclic adenosine monophosphate (cAMP) signaling [13]. HTR5A is highly expressed in the cortex and hippocampus [13], areas that are consistently disrupted in schizophrenia. Nevertheless, unlike HTR2A and HTR1A, which are highly characterized, HTR5A’s role in psychiatric disease remains largely unexplored. This gap makes it especially intriguing to investigate HTR5A as a potential contributor to the pathophysiology of schizophrenia [14].
Transcriptome-wide association studies (TWAS) present a means of addressing gene-disease associations by integrating GWAS summary statistics with expression quantitative trait loci (eQTL) data to score a gene based on an association between its predicted expression and a trait [15]. A recent TWAS study identified the expression of a long noncoding RNA (lncRNA) transcribed antisense to HTR5A, HTR5A-AS1, to be significantly associated with schizophrenia risk [16]. Collado-Torres et al. profiled 900 postmortem brain tissue samples from the hippocampus () and dorsolateral prefrontal cortex (dlPFC; ) from 286 individuals diagnosed with schizophrenia and 265 not diagnosed with schizophrenia. By integrating the most recent schizophrenia GWAS and their own eQTL results, the authors performed brain region-specific TWAS [16] and reported over 1,140 significant associations spanning 333 genes, including two independent associations with HTR5A-AS1: a junction-level hippocampal signal (, , false discovery rate [FDR] ) and an exon-level signal in the dlPFC (, , FDR ). The significant association of HTR5A-AS1 in the hippocampus is linked to schizophrenia GWAS variants that are predicted to act as eQTLs regulating its expression. Nevertheless, HTR5A-AS1 remains largely unexplored in the literature, with PubMed [17] and GeneCards [18] searches showing no PubMed-indexed publications explicitly mentioning it to date. In this study, the dlPFC was prioritized for postmortem analyses because it was one of the two regions in which HTR5A-AS1 showed significant TWAS associations in Collado-Torres et al. (2019). Furthermore, the dlPFC is one of the most consistently implicated cortical regions in schizophrenia, particularly in relation to executive dysfunction and working-memory impairment [8]. Its large and well-powered BrainSeq sample size further makes it an optimal region for detecting case–control transcriptional differences.
2. Materials and Methods
2.1. Transcriptome-Wide Association Study (TWAS)
R [19] version 4.4.3 with the readr [20], dplyr [21], ggplot2 [22], and stringr [23] packages was used to analyze Collado-Torres et al. TWAS results, which were downloaded from http://eqtl.brainseq.org/phase2/. The TWAS data were imported, and gene identifiers were cleaned by removing Ensembl version suffixes to allow for consistent matching across datasets. The data were then filtered to include only rows containing HTR5A-AS1 or its Ensembl ID: ENSG00000220575. TWAS p-values were converted to a numeric format, and the lowest p-values across all brain regions were identified and tested to determine the most significant gene–trait association for HTR5A-AS1. This step was performed to establish whether HTR5A-AS1 showed robust statistical evidence for involvement in schizophrenia across the transcriptome.
Parallel to the analysis of HTR5A-AS1, the same procedure was applied to the paired sense gene HTR5A. TWAS summary statistics were imported and filtered using both the gene symbol and Ensembl identifier (ENSG00000157219), and the corresponding Z-scores and p-values for hippocampus and dlPFC were extracted. This step was performed to determine whether HTR5A itself shows a transcriptome-wide association with schizophrenia. As with HTR5A-AS1, all p-values were converted to numeric format, and brain region–specific results were evaluated. These findings are reported in the Results section for comparison with the antisense RNA.
2.2. Linkage Disequilibrium Analysis
LD statistics were obtained using the LDlinkR [24] package in R, which provides programmatic access to the NIH LDlink suite [25]. The LDpair() function was used to calculate pairwise LD between the schizophrenia GWAS sentinel SNP (rs1583830) and the lead exon-level eQTL SNP (rs1881691). Analyses were restricted to the European (EUR) reference population from the 1000 Genomes Project Phase 3 under the GRCh38 genome build. LD metrics reported include , , and p-values. This analysis was performed to evaluate whether the schizophrenia risk SNP and the eQTL regulating HTR5A-AS1 are linked on the same haplotype, suggesting a shared genetic mechanism.
2.3. Postmortem Expression Analysis (BrainSeq)
Bulk RNA-seq expression data containing raw count data and sample metadata from postmortem brain tissue were loaded into R. The SummarizedExperiment [26], dplyr [21], ggplot2 [22], forcats [27], and ggbeeswarm [28] packages were used to extract expression values for HTR5A-AS1 and its sense partner HTR5A, which were converted to counts per million (CPM) using sample-specific library sizes. The samples were filtered to include only adult donors (at least 18 years old) from the hippocampus and dlPFC. Expression values were log2-transformed as prior to statistical testing, and group differences between control and schizophrenia samples were assessed using Wilcoxon rank-sum tests. To address potential sex effects, all analyses were repeated after stratifying by biological sex (male vs. female), using the same pipeline, and Wilcoxon rank-sum tests were performed within each sex group for both HTR5A-AS1 and its sense gene HTR5A. Sex-stratified adult subsets were generated for hippocampus and dlPFC, and violin plots were produced to visualize these comparisons. These sex-stratified results are presented in Figures S1–S4. This analysis directly tested whether HTR5A-AS1 and HTR5A show region- and sex-specific dysregulation in disease-relevant cortical and limbic regions.
2.4. Developmental Expression Trajectories (BrainSpan)
Expression trajectories of HTR5A-AS1 were derived from BrainSpan bulk RNA-seq data. Transcript abundance values were extracted from the expression matrix using gene annotations from the accompanying metadata. Reported sample ages were parsed into post-conception days (PCD) by converting gestational weeks, months, and years into a continuous day scale, with birth defined at 280 days. Expression values were plotted against log10-scaled PCD, with vertical reference lines marking birth and selected developmental timepoints.
A linear regression model (TPM ∼ PCD) was fit to quantify the global developmental trend. The regression slope (TPM/day), coefficient of determination (), and p-value were calculated using the broom [29] package and annotated directly onto the plot. The slope serves as a quantitative measure of whether HTR5A-AS1 expression systematically increased or decreased across human brain development.
Sample metadata were mapped from BrainSpan structure acronyms into broad anatomical classes: NCX, hippocampus, STR, MD, AMY, and CBC. Regions with the six highest median TPM values were retained for visualization. For each of the six regions, linear regression models (TPM ∼ PCD) were fit independently. Slopes (TPM change per post-conception day) were extracted using the broom package, and slope values were embedded into the figure legend for interpretability. Points were overlaid on regression lines, with a log-scaled x-axis and vertical markers at birth and selected guide marks, enabling identification of the most developmentally dynamic brain regions for HTR5A-AS1 expression.
2.5. UCSC Genome Browser Validation
The UCSC Genome Browser (hg38 assembly, accessed 2025) [30] was used to confirm the presence and transcriptional structure of HTR5A-AS1. The locus was examined with the following tracks enabled: Base Position, database of single nucleotide polymorphisms (dbSNP) build 155 (to visualize genome-wide significant GWAS SNP rs1583830 and the lead eQTL SNP rs1881691), GENCODE v48 annotation, CLS transcript models, Adult Blood/Brain transcript models, Cell Line and Embryonic Brain transcript models, ENCODE4 long-read transcripts, and GTEx tissue expression. A PDF export of the genome browser view was generated to document transcript models and SNP placement relative to HTR5A-AS1.
2.6. Functional Predictions (lncHUB)
Functional predictions for HTR5A-AS1 were obtained from the lncHUB platform [31], including Kyoto Encyclopedia of Genes and Genomics (KEGG) pathway Z-scores, Mammalian/MGI mouse phenotype Z-scores, Gene Ontology (GO) biological process Z-scores, and co-expressed gene Z-scores. The exported result tables were read into R and processed in dplyr; display names were wrapped for readability and converted to title case while preserving acronyms (e.g., GPCR, GABA). For each category, the top entries by Z-score were selected without transformation (KEGG top 15; Mouse Phenotype top 15; GO Biological Process top 20; Co-expression top 25). Ranked horizontal bar charts were generated in ggplot2, with bars representing the reported Z-scores and numeric labels printed just beyond bar ends. Axis text was brought closer to bars to improve legibility, and figure margins were adjusted to avoid clipping of labels. No statistical re-analysis or rescaling of Z-scores was performed; ordering and formatting were applied for visualization. All plots were produced in R (packages: tibble [32], dplyr, ggplot2, stringr, forcats, rlang [33], grid [34]) using fixed fill colors and identical geometries across panels to facilitate comparison.
3. Results
3.1. TWAS Identifies HTR5A-AS1 Association with Schizophrenia
The first step of this study was to determine whether HTR5A-AS1 is associated with schizophrenia on a genetic and expression level, as establishing such links is critical before pursuing functional interpretation. In the hippocampus, the strongest TWAS association with HTR5A-AS1 was detected at the junction level (, , FDR ; Figure 1A) [16]. Junction-level hits indicate that genetic regulation influences exon–exon splicing events, implicating HTR5A-AS1 isoform usage in disease susceptibility. The lead GWAS variant in this locus, rs1583830, showed robust association with schizophrenia (GWAS , ). The corresponding hippocampal eQTL, rs1881691, exerted a strong effect on HTR5A-AS1 expression (eQTL , ; Figure 1B). In the dlPFC, an exon-level feature of HTR5A-AS1 also reached statistical significance (TWAS , , FDR ; Figure 1A). Exon-level hits capture expression changes, reflecting the regulatory effects of transcript expression level rather than isoform usage. The same GWAS sentinel single-nucleotide polymorphism (SNP), rs1583830, again showed strong association with schizophrenia, while the lead exon eQTL, rs1881691, exhibited an even stronger effect in this region (eQTL , ; Figure 1B). Across both regions, the GWAS sentinel SNP (rs1583830) and the exon-level eQTL SNP (rs1881691) were found to be in moderate-to-strong linkage disequilibrium (LD; , , ), suggesting that the same haplotype block drives the schizophrenia risk association and HTR5A-AS1 regulation. Taken together, these results indicate that the haplotype containing rs1583830 and rs1881691 regulates HTR5A-AS1 expression and splicing, supporting its role as a schizophrenia risk gene. For comparison, parallel TWAS analysis of the paired sense gene HTR5A revealed no transcriptome-wide significant associations in either region. In the hippocampus, the strongest HTR5A feature showed a Z-score of -2.44 and p = 0.113, while in the dlPFC the corresponding feature showed a Z-score of -1.87 and p = 0.279. All values fell below false-discovery thresholds, confirming that the TWAS signal in this locus is specific to the antisense transcript HTR5A-AS1.
3.2. Reduced HTR5A-AS1 Expression in the Hippocampus
Analyses of postmortem raw count RNA sequencing (RNA-seq) data from 900 brain samples across hippocampus () and dlPFC (), from both control and schizophrenia donors, were performed [16]. In the hippocampus, HTR5A-AS1 was expressed significantly lower (, Wilcoxon rank-sum test; Figure 2A) in schizophrenia than in the control samples, consistent with its negative TWAS Z-score, . In the dlPFC, expression was lower in schizophrenia but did not reach statistical significance (, Wilcoxon rank-sum test; Figure 2B). These findings indicate that HTR5A-AS1 is significantly downregulated in the hippocampus of schizophrenia donors, consistent with genetic predictions of disease risk, and motivated follow-up sex-stratified analyses (Figures S1 and S2).
3.3. Sex-Stratified Postmortem Expression of HTR5A-AS1 and HTR5A
Given prior evidence for sex differences in serotonergic signaling [35], all postmortem analyses were repeated after stratifying by biological sex. In the hippocampus, HTR5A-AS1 showed nominally lower expression in male patients compared with male controls (; Supplementary Figure S1), whereas no significant difference was observed in females (; Supplementary Figure S1). In the dlPFC, HTR5A-AS1 shows significant case–control differences in neither female (; Supplementary Figure S2) nor male(; Supplementary Figure S2) samples.
Although HTR5A itself did not emerge as a significant TWAS hit, whether or not the receptor displayed similar expression patterns in postmortem tissue was tested. In the hippocampus, HTR5A expression was modestly but significantly reduced in schizophrenia when all adults were considered together (), with this effect driven primarily by males (; Supplementary Figure S3) and not significant in females (; Supplementary Figure S3). By contrast, HTR5A expression in the dlPFC was not significantly different between schizophrenia and control donors in the combined (), female-only (; Supplementary Figure S4), or male-only (; Supplementary Figure S4) samples. Together, these results suggest a region- and sex-specific relationship in which hippocampal downregulation of both HTR5A-AS1 and HTR5A is strongest in male schizophrenia donors.
3.4. Region-Specific Expression in the Human Brain
To evaluate whether HTR5A-AS1 is expressed in regions most consistently disrupted in schizophrenia, its expression patterns across brain regions were analyzed using RNA-seq data from the BrainSpan Atlas of the Developing Human Brain [36]. Expression was quantified as transcripts-per-million (TPM). Expression was highest in the cerebellar cortex (CBC; mean TPM, median , ), followed by the primary somatosensory cortex (S1C; mean TPM, median , ), the posterior superior temporal cortex (STC; mean TPM, median , ), and the inferior parietal cortex (IPC; mean TPM, median , ). Other notable regions with moderate expression included the inferolateral temporal cortex (ITC; mean TPM, ) and the primary motor cortex (M1C; mean TPM, ), whereas expression was comparatively lower in the amygdaloid complex (AMY; mean TPM, ) and especially the cerebellum (CB; mean TPM, ) (Figure 3A). This analysis confirmed that HTR5A-AS1 shows strong region-specific enrichment, particularly in cortical and cerebellar regions.
3.5. Developmental Trajectory of HTR5A-AS1
To determine whether HTR5A-AS1 expression is developmentally regulated, brain RNA-seq data spanning prenatal to adult stages were analyzed from BrainSpan [36]. Developmental analyses showed dynamic changes across the lifespan. Linear regression across all samples revealed an overall positive developmental trajectory ( TPM/day; Figure 3B). Region-stratified linear fits showed that HTR5A-AS1 expression rises at distinct rates across brain regions (Figure 3C). The fastest rate of increase was observed in the CBC ( TPM/day), followed by the neocortex (NCX; ) and striatum (STR; ). Moderate increases were seen in the AMY () and hippocampus (), while the mediodorsal nucleus of the thalamus (MD) showed the lowest rates (), suggesting relative developmental stability.
3.6. Transcript Validation via UCSC Genome Browser and Co-Expression Analysis
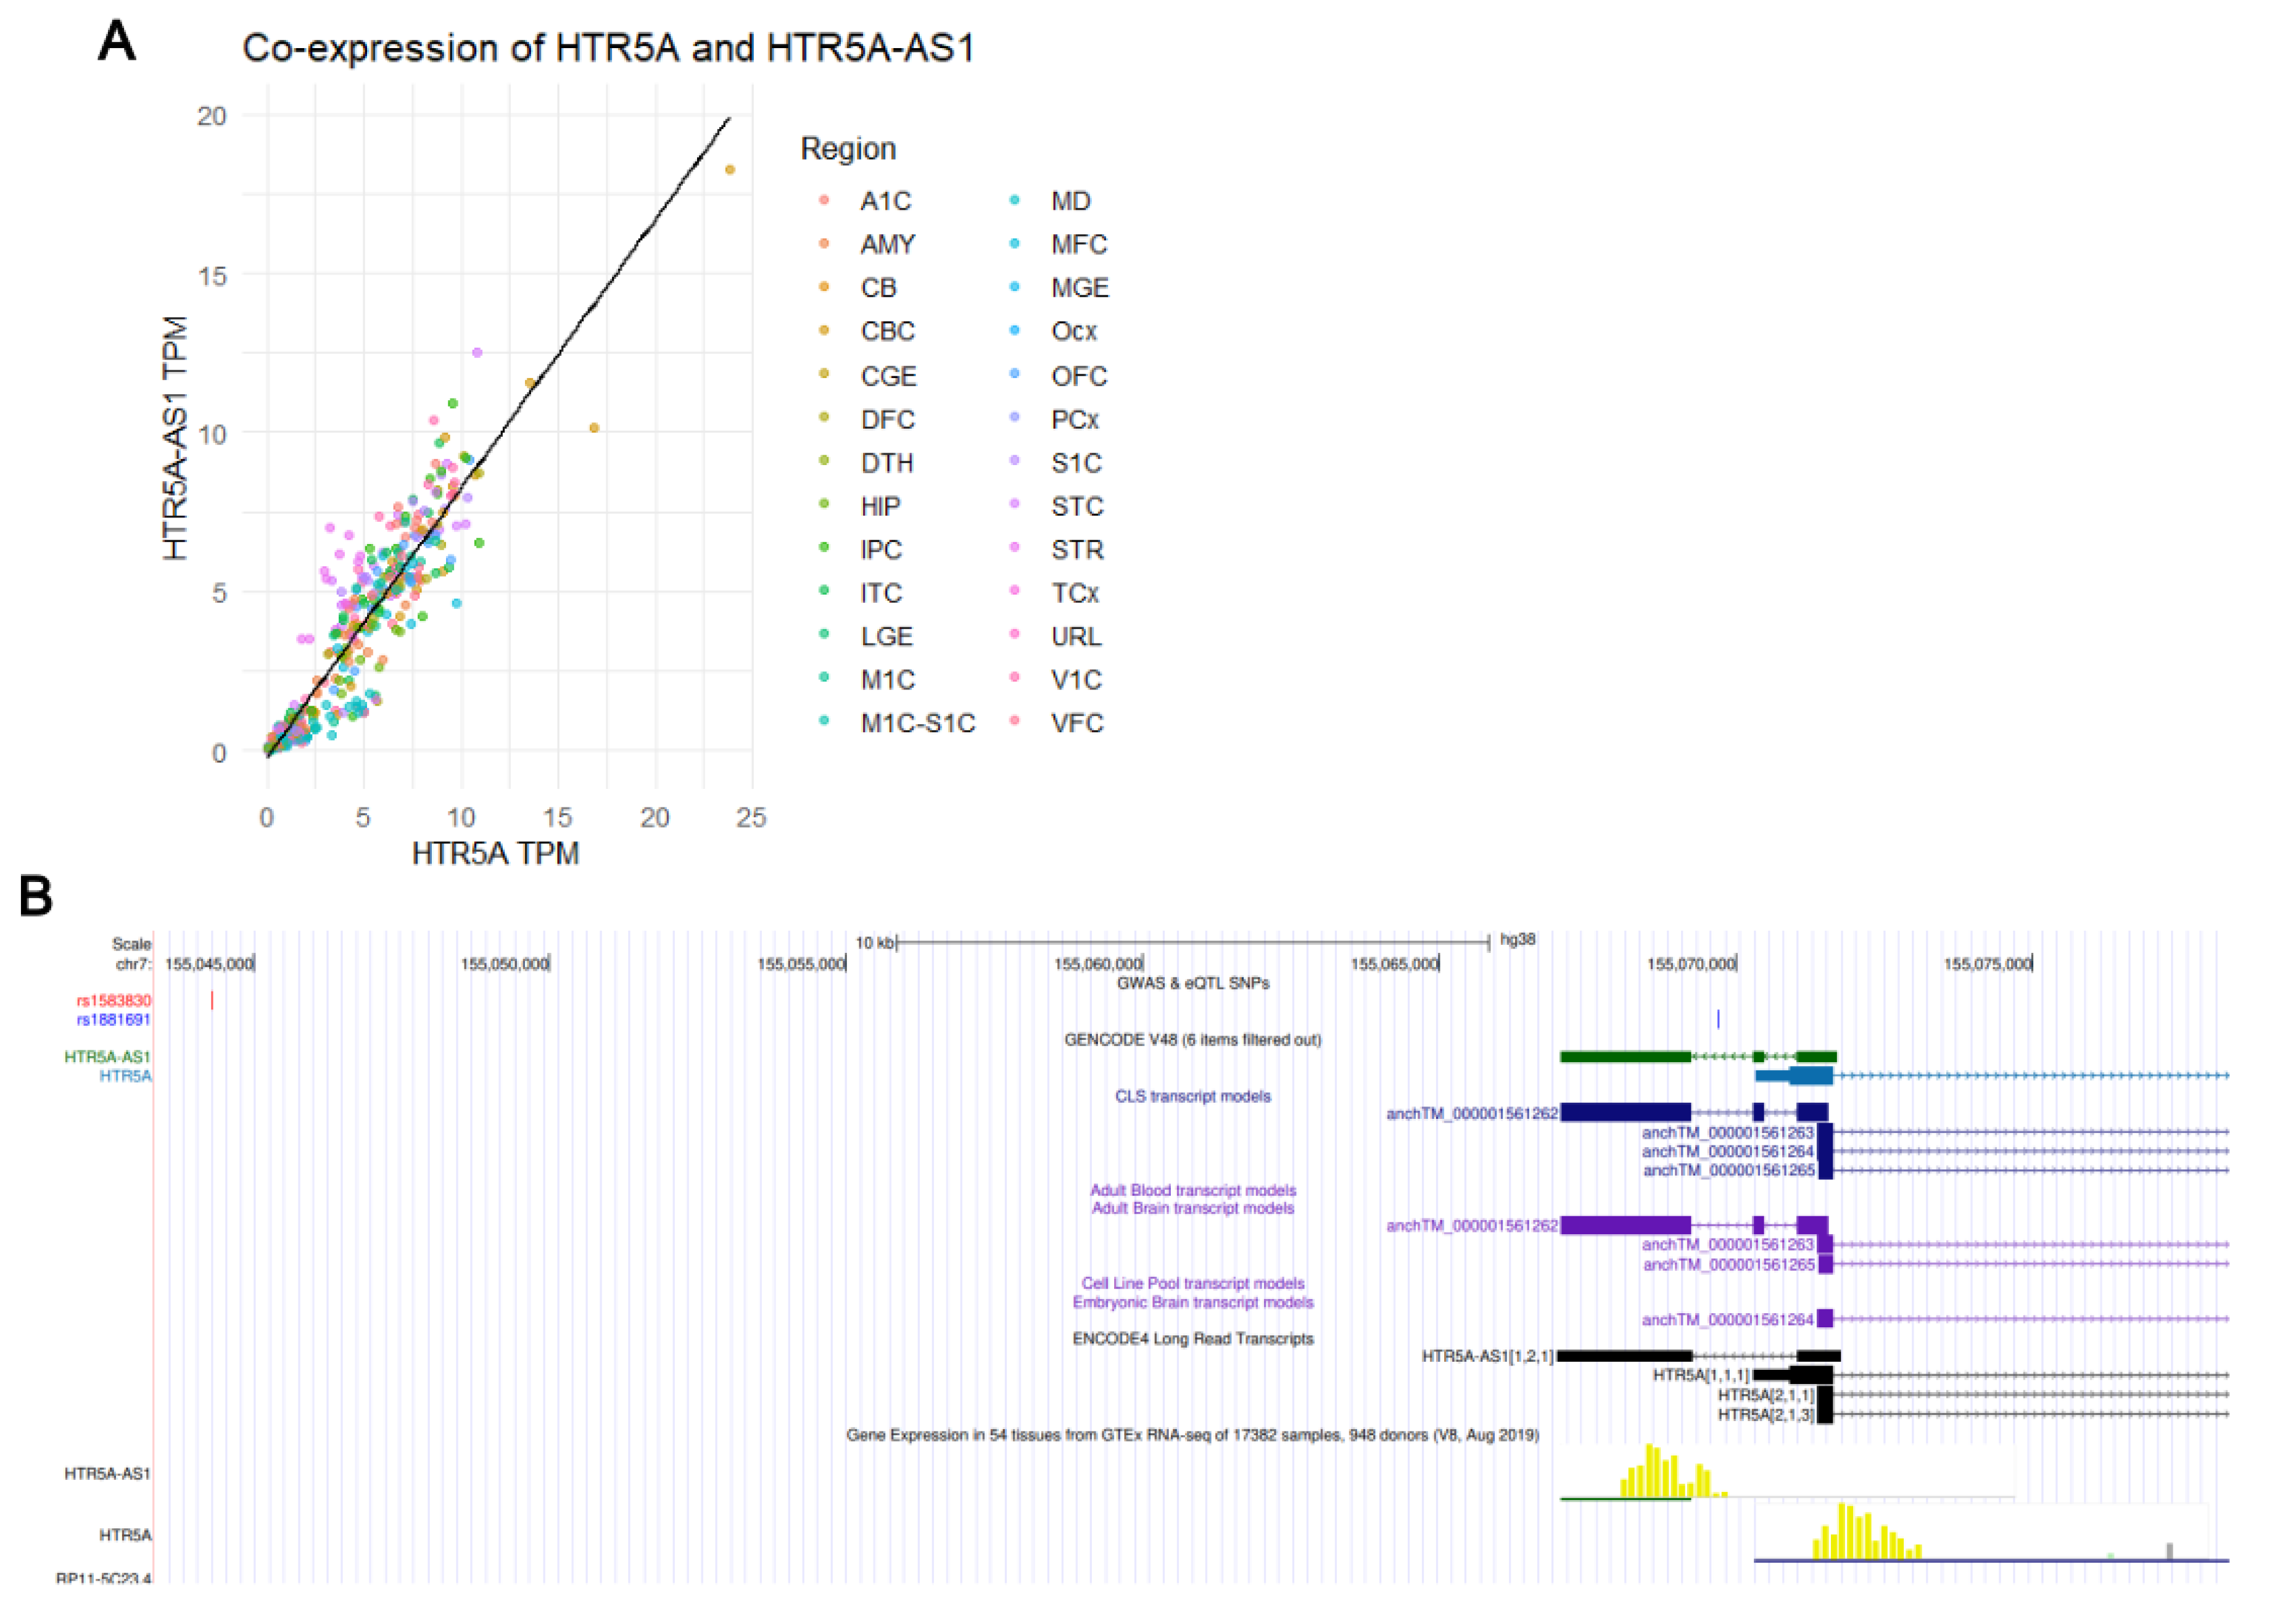
To verify that HTR5A-AS1 is a genuine transcript rather than an artifact of transcriptional noise, its annotation and expression were examined using independent datasets. In the UCSC Genome Browser analysis (hg38 assembly; accessed 2025) [30], long-read RNA-seq tracks confirmed multi-exonic transcripts in brain tissues overlapping the GENCODE-annotated locus. The schizophrenia-associated SNPs appeared upstream of the HTR5A-AS1 locus, consistent with potential regulatory positioning. These data support HTR5A-AS1 as a distinct multi-exonic antisense transcript to HTR5A (Figure 4B). To test whether HTR5A-AS1 expression is related to its sense strand partner, HTR5A, the same BrainSpan dataset was examined [36]. Across 524 samples, HTR5A-AS1 expression correlated strongly with HTR5A (Pearson’s , ; Figure 4A).
3.7. Predicted Functional Associations of HTR5A-AS1
Pathway enrichment and co-expression analyses from lncHUB [31] indicated a potentially strong enrichment for pathways related to synaptic transmission, learning, and addiction (Supplementary Figure S5). The top KEGG pathway was amyotrophic lateral sclerosis (ALS; ), followed by nicotine addiction () and long-term potentiation (). Predicted mouse phenotypes highlighted associations with abnormal short-term spatial reference memory (), abnormal hearing electrophysiology (), and abnormal peripheral synaptic transmission (; Supplementary Figure S6). Gene Ontology (GO) enrichment identified GABAergic synaptic transmission (), regulation of secretion by cell (), and gamma-aminobutyric acid signaling pathway () among the top biological processes (Supplementary Figure S7). Analysis of the top 500 co-expressed genes revealed many known synaptic and neuronal regulators, including HTR5A (), CAMK2A (), SNAP25 (), and GRIN1 (; Supplementary Figure S8). These enrichment patterns should be interpreted cautiously, as they derive from co-expression and statistical associations rather than experimental evidence. These analyses alone do not prove that HTR5A-AS1 directly influences GABAergic or synaptic pathways. Full lncHUB bar plots are provided in Supplementary Figures S5–S8.
4. Discussion
This study provides the first detailed characterization of a lncRNA transcribed antisense to the serotonin receptor gene HTR5A, HTR5A-AS1, in the context of schizophrenia. TWAS analyses [16] identified two significant associations between HTR5A-AS1 expression and schizophrenia: a junction-level signal in the hippocampus and an exon-level signal in the dlPFC. Beyond genetic associations, expression analyses revealed significantly reduced HTR5A-AS1 expression in the hippocampus of schizophrenia brain donors, aligning with TWAS predictions [16]. While the reduction in the dlPFC did not reach statistical significance, the trend aligns with the negative TWAS association. Notably, the TWAS associations were identified at the junction and exon level, suggesting that schizophrenia risk may involve altered isoform usage of HTR5A-AS1. Such splicing-dependent effects would be diluted in bulk gene-level differential expression analyses, underscoring the need for isoform-aware approaches.
Using BrainSpan data [36], analyses revealed that HTR5A-AS1 is developmentally regulated, with distinct region-specific trajectories. Consistent with schizophrenia’s developmental origins, HTR5A-AS1 displayed steep increases in expression in the cerebellar cortex (CBC) and neocortex (NCX), moderate increases in the hippocampus and AMY, and relative stability in the thalamus. These trajectories suggest that HTR5A-AS1 may contribute to the maturation of cortical–cerebellar and cortico-limbic circuits, which are strongly implicated in schizophrenia’s cognitive and affective dysfunction. The differing developmental slopes observed in the AMY and MD also carry functional implications. The AMY, which showed a moderate rate of increase, is central to affective regulation, emotional salience processing, and fear learning—domains frequently altered in schizophrenia. By contrast, the MD exhibited relative developmental stability, consistent with its role as a relay hub with less protracted maturation. These region-specific patterns suggest that HTR5A-AS1 may participate in shaping both affective (amygdala-driven) and cognitive-attentional (thalamic–cortical) circuits relevant to schizophrenia.
The possibility that HTR5A-AS1 is simply transcriptional noise arising from HTR5A was also refuted. This study provides multiple independent lines of evidence to validate the transcript’s authenticity: multi-exonic structure validated by long-read RNA-seq, consistent annotation in GENCODE, and strong independent expression signals across multiple datasets [30]. Its co-expression with HTR5A is expected for antisense pairs but does not negate potential regulatory function. Instead, it raises the possibility of cis-regulation of HTR5A, as well as coordinated involvement in common pathways.
Functional predictions and co-expression analyses consistently implicated synaptic and cognitive processes, notably GABAergic signaling and long-term potentiation [31]. These findings align with the developmental regulation and cortical–hippocampal enrichment of HTR5A-AS1, regions in which disruptions of inhibitory–excitatory balance are strongly implicated in schizophrenia. The lncHUB predictions differentiated between “GABAergic synaptic transmission” and the broader “GABAergic signaling pathway,” which carry distinct biological meanings. GABAergic signaling encompasses receptor-mediated intracellular cascades and downstream regulatory pathways, whereas GABAergic synaptic transmission refers to presynaptic vesicle release, reuptake, and inhibitory synaptic homeostasis. Schizophrenia is known to involve disruptions at both levels, including impaired inhibitory interneuron function and altered GABA receptor dynamics. The enrichment of HTR5A-AS1 in both categories suggests that it may influence multiple components of inhibitory circuitry, although the present findings remain correlative. Together, these results suggest that HTR5A-AS1 may modulate neuronal excitability or plasticity, potentially by regulating HTR5A expression or by interacting with other synaptic genes such as CAMK2A, SNAP25, and GRIN1.
Sex-stratified postmortem analyses further refine this picture. In the hippocampus, significant downregulation of both HTR5A-AS1 and HTR5A was present in male schizophrenia donors, whereas effects were weaker and non-significant in females. No robust expression differences were observed for either transcript in the dlPFC when stratified by sex. These findings are consistent with reports of sex-dependent serotonergic alterations in psychiatric disease and suggest that HTR5A-AS1 may contribute to schizophrenia risk in a regionally and sexually dimorphic manner.
Importantly, although HTR5A-AS1 showed robust TWAS associations, the sense gene HTR5A did not reach transcriptome-wide significance in the hippocampus or dlPFC. This finding is fully consistent with prior studies showing that HTR5A dysregulation in schizophrenia is often observed at the level of receptor availability or signaling rather than bulk mRNA abundance. As a GPCR, HTR5A is strongly shaped by post-transcriptional and translational regulation, including alternative splicing, RNA editing, and potential antisense-mediated repression. Therefore, the absence of a TWAS signal for HTR5A, combined with its sex-dependent decrease in hippocampal expression, supports the interpretation that HTR5A-AS1 may influence schizophrenia risk partly through post-transcriptional modulation of HTR5A, not through steady-state transcript changes. This resolves apparent discrepancies with prior reports and strengthens the biological link between the antisense RNA and its paired receptor.
There are several implications and limitations to acknowledge. First, the predicted associations obtained from lncHUB are inherently correlative and based on co-expression [31]. Although the present study provides convergent evidence supporting HTR5A-AS1 as a bona fide transcript through integration of genetic association, postmortem expression, developmental trajectory analyses, and co-expression patterns, these findings do not establish a mechanistic role for the lncRNA. All hypothesized functional roles for HTR5A-AS1 therefore remain putative and cannot be interpreted as causal. Second, the strong co-expression between HTR5A-AS1 and its paired sense transcript HTR5A complicates interpretation, as distinguishing potential cis effects (local effects on the paired sense transcript) from trans effects (distal regulatory effects on other genes) will require targeted experimental perturbation, such as CRISPR interference (CRISPRi), allele-specific expression assays, or reporter-based enhancer/promoter testing. Third, although the sample sizes used here exceed those of many prior studies, they remain modest relative to the highly polygenic architecture of schizophrenia, and expression differences across cell types are obscured in bulk-tissue RNA-seq. Taken together, future work should incorporate experimental perturbation approaches—including CRISPRi knockdown, antisense oligonucleotide inhibition, and allele-specific regulatory assays—to determine whether HTR5A-AS1 directly influences HTR5A or other transcripts. qPCR validation in independent cohorts and cell-type–specific functional studies will also be essential to clarify the biological role of this lncRNA.
Supplementary Materials
The following supporting information can be downloaded at the website of this paper posted on Preprints.org.
Author Contributions
G.H.R. conceived the study, curated data, performed analyses, created figures, and wrote and revised the manuscript. The author agrees to be accountable for all aspects of the work.
Funding
This research received no external funding.
Data Availability Statement
Public datasets were analyzed in this study (e.g., BrainSpan, GTEx, and BrainSeq/TWAS resources). Source links and accession details are provided in the Methods. Any custom code used for processing and plotting is available from the author upon reasonable request.
References
- World Health Organization. Schizophrenia. https://www.who.int/news-room/fact-sheets/detail/schizophrenia, 2025. Accessed: 2025-09-08.
- Solmi, M.; Seitidis, G.; Mavridis, D.; Correll, C.U.; Dragioti, E.; Guimond, S.; Tuominen, L.; Dargél, A.; Carvalho, A.F.; Fornaro, M.; et al. Incidence, Prevalence, and Global Burden of Schizophrenia—Data, with Critical Appraisal, from the Global Burden of Disease (GBD) 2019. Molecular Psychiatry 2023, 28, 5319–5327. [CrossRef]
- Hany, M.; Rizvi, A. Schizophrenia; StatPearls Publishing: Treasure Island, FL, USA, 2025.
- Marder, S.R.; Cannon, T.D. Schizophrenia. New England Journal of Medicine 2019. [CrossRef]
- Chick, S.L.; Holmans, P.; Cameron, D.; Grozeva, D.; Sims, R.; Williams, J.; Bray, N.J.; Owen, M.J.; O’Donovan, M.C.; Walters, J.T.R.; et al. Whole-Exome Sequencing Analysis Identifies Risk Genes for Schizophrenia. Nature Communications 2025, 16, 1–9. [CrossRef]
- Huo, Y.; Li, S.; Liu, J.; Li, X.; Luo, X.J. Functional genomics reveal gene regulatory mechanisms underlying schizophrenia risk. Nature Communications 2019, 10, 670. [CrossRef]
- Birnbaum, R.; Weinberger, D.R. Genetic Insights into the Neurodevelopmental Origins of Schizophrenia. Nature Reviews Neuroscience 2017, 18, 727–740. [CrossRef]
- Karlsgodt, K.H.; Sun, D.; Cannon, T.D. Structural and Functional Brain Abnormalities in Schizophrenia. Current Directions in Psychological Science 2010, 19, 226–231. [CrossRef]
- Quednow, B.B.; Geyer, M.A.; Halberstadt, A.L. Serotonin and Schizophrenia. In Handbook of Behavioral Neuroscience; Müller, C.P.; Cunningham, K.A., Eds.; Elsevier: Amsterdam, The Netherlands, 2020; Vol. 31, pp. 711–743. [CrossRef]
- Li, P.; Snyder, G.L.; Vanover, K.E. Dopamine Targeting Drugs for the Treatment of Schizophrenia: Past, Present and Future. Current Topics in Medicinal Chemistry 2016, 16, 3385–3403. [CrossRef]
- Meltzer, H.Y.; Li, Z.; Kaneda, Y.; Ichikawa, J. Serotonin Receptors: Their Key Role in Drugs to Treat Schizophrenia. Progress in Neuropsychopharmacology and Biological Psychiatry 2003, 27, 1159–1172. [CrossRef]
- Grubor, M.; Zivkovic, M.; Sagud, M.; Nikolac Perkovic, M.; Mihaljevic-Peles, A.; Pivac, N.; Muck-Seler, D.; Svob Strac, D. HTR1A, HTR1B, HTR2A, HTR2C and HTR6 Gene Polymorphisms and Extrapyramidal Side Effects in Haloperidol-Treated Patients with Schizophrenia. International Journal of Molecular Sciences 2020, 21. [CrossRef]
- Thomas, D.R. 5-HT5A Receptors as a Therapeutic Target. Pharmacology & Therapeutics 2006, 111, 707–714. [CrossRef]
- Zhang, Y.; Smith, E.M.; Baye, T.M.; Eckert, J.V.; Abraham, L.J.; Moses, E.K.; Kissebah, A.H.; Martin, L.J.; Olivier, M. Serotonin (5-HT) Receptor 5A Sequence Variants Affect Human Plasma Triglyceride Levels. Physiological Genomics 2010, 42, 168–176. [CrossRef]
- Gusev, A.; Ko, A.; Shi, H.; Bhatia, G.; Chung, W.; Penninx, B.W.J.H.; Jansen, R.; de Geus, E.J.; Boomsma, D.I.; Wright, F.A.; et al. Integrative Approaches for Large-Scale Transcriptome-Wide Association Studies. Nature Genetics 2016, 48, 245–252. [CrossRef]
- Collado-Torres, L.; Burke, E.E.; Peterson, A.; Shin, J.; Straub, R.E.; Rajpurohit, A.; Semick, S.A.; Ulrich, W.S.; Price, A.J.; Valencia, C.; et al. Regional Heterogeneity in Gene Expression, Regulation, and Coherence in the Frontal Cortex and Hippocampus across Development and Schizophrenia. Neuron 2019, 103, 203–216.e8. [CrossRef]
- National Center for Biotechnology Information. NCBI Homepage. https://www.ncbi.nlm.nih.gov/, 2025. Accessed: 2025-09-17.
- GeneCards. GeneCards. https://www.genecards.org/, 2025. Accessed: 2025-09-17.
- R Core Team. R: The R Project for Statistical Computing. https://www.r-project.org/, 2025. Accessed: 2025-09-17.
- CRAN. readr: Read Rectangular Text Data. https://CRAN.R-project.org/package=readr, 2025. Accessed: 2025-09-17.
- CRAN. dplyr: A Grammar of Data Manipulation. https://CRAN.R-project.org/package=dplyr, 2025. Accessed: 2025-09-17.
- Wickham, H. ggplot2; Springer International Publishing: Cham, Switzerland, 2016. [CrossRef]
- CRAN. stringr: Simple, Consistent Wrappers for Common String Operations. https://CRAN.R-project.org/package=stringr, 2025. Accessed: 2025-09-17.
- Myers, T.A.; Chanock, S.J.; Machiela, M.J. LDlinkR: An R Package for Rapidly Calculating Linkage Disequilibrium Statistics in Diverse Populations. Frontiers in Genetics 2020, 11, 157. [CrossRef]
- Lin, S.H.; Thakur, R.; Machiela, M.J. LDexpress: An Online Tool for Integrating Population-Specific Linkage Disequilibrium Patterns with Tissue-Specific Expression Data. BMC Bioinformatics 2021, 22, 608. [CrossRef]
- Bioconductor. SummarizedExperiment: Summarized Experiment Container. https://bioconductor.org/packages/SummarizedExperiment, 2025. Accessed: 2025-09-17.
- CRAN. forcats: Tools for Working with Categorical Variables (Factors). https://CRAN.R-project.org/package=forcats, 2025. Accessed: 2025-09-17.
- CRAN. ggbeeswarm: Categorical Scatter (Violin Point) Plots. https://CRAN.R-project.org/package=ggbeeswarm, 2025. Accessed: 2025-09-17.
- CRAN. broom: Convert Statistical Objects into Tidy Tibbles. https://CRAN.R-project.org/package=broom, 2025. Accessed: 2025-09-17.
- UCSC Genome Browser. UCSC Genome Browser. https://genome.ucsc.edu/, 2025. Accessed: 2025-09-17.
- lncHUB. lncHUB. https://maayanlab.cloud/lnchub/, 2025. Accessed: 2025-09-17.
- CRAN. tibble: Simple Data Frames. https://CRAN.R-project.org/package=tibble, 2025. Accessed: 2025-09-17.
- CRAN. rlang: Functions for Base Types and Core R and Tidyverse Features. https://CRAN.R-project.org/package=rlang, 2025. Accessed: 2025-09-17.
- R Core Team. grid: The Grid Graphics Package. https://stat.ethz.ch/R-manual/R-devel/library/grid/doc/grid.pdf, 2025. Accessed: 2025-09-17.
- Groves, N.J.; Kesby, J.P.; Eyles, D.W.; McGrath, J.J. Misconceptions about serotonin receptors: the case for sex differences in the human serotonergic system. Psychoneuroendocrinology 2013, 40, 123–139. [CrossRef]
- BrainSpan Atlas of the Developing Human Brain. BrainSpan. https://www.brainspan.org/, 2025. Accessed: 2025-09-08.
Figure 1.
HTR5A-AS1 TWAS results and eQTL associations with schizophrenia. (A) Bar plot showing for HTR5A-AS1 in dorsolateral prefrontal cortex (dlPFC) and hippocampus (HIPPO) from transcriptome-wide association studies (TWAS) analysis [16]. HTR5A-AS1 showed its strongest association in the HIPPO (, FDR-adjusted ), exceeding the false discovery rate (FDR) threshold for significance, and a weaker but notable association in dlPFC (, FDR-adjusted ). (B) Expression quantitative trait loci (eQTL) association for HTR5A-AS1 with lead SNP rs1881691. Scatterplot showing eQTL Z-scores (x-axis) versus (y-axis) across all tested variants. The lead variant rs1881691 (highlighted in red) shows a strong association with HTR5A-AS1 expression (, ) in the HIPPO samples.
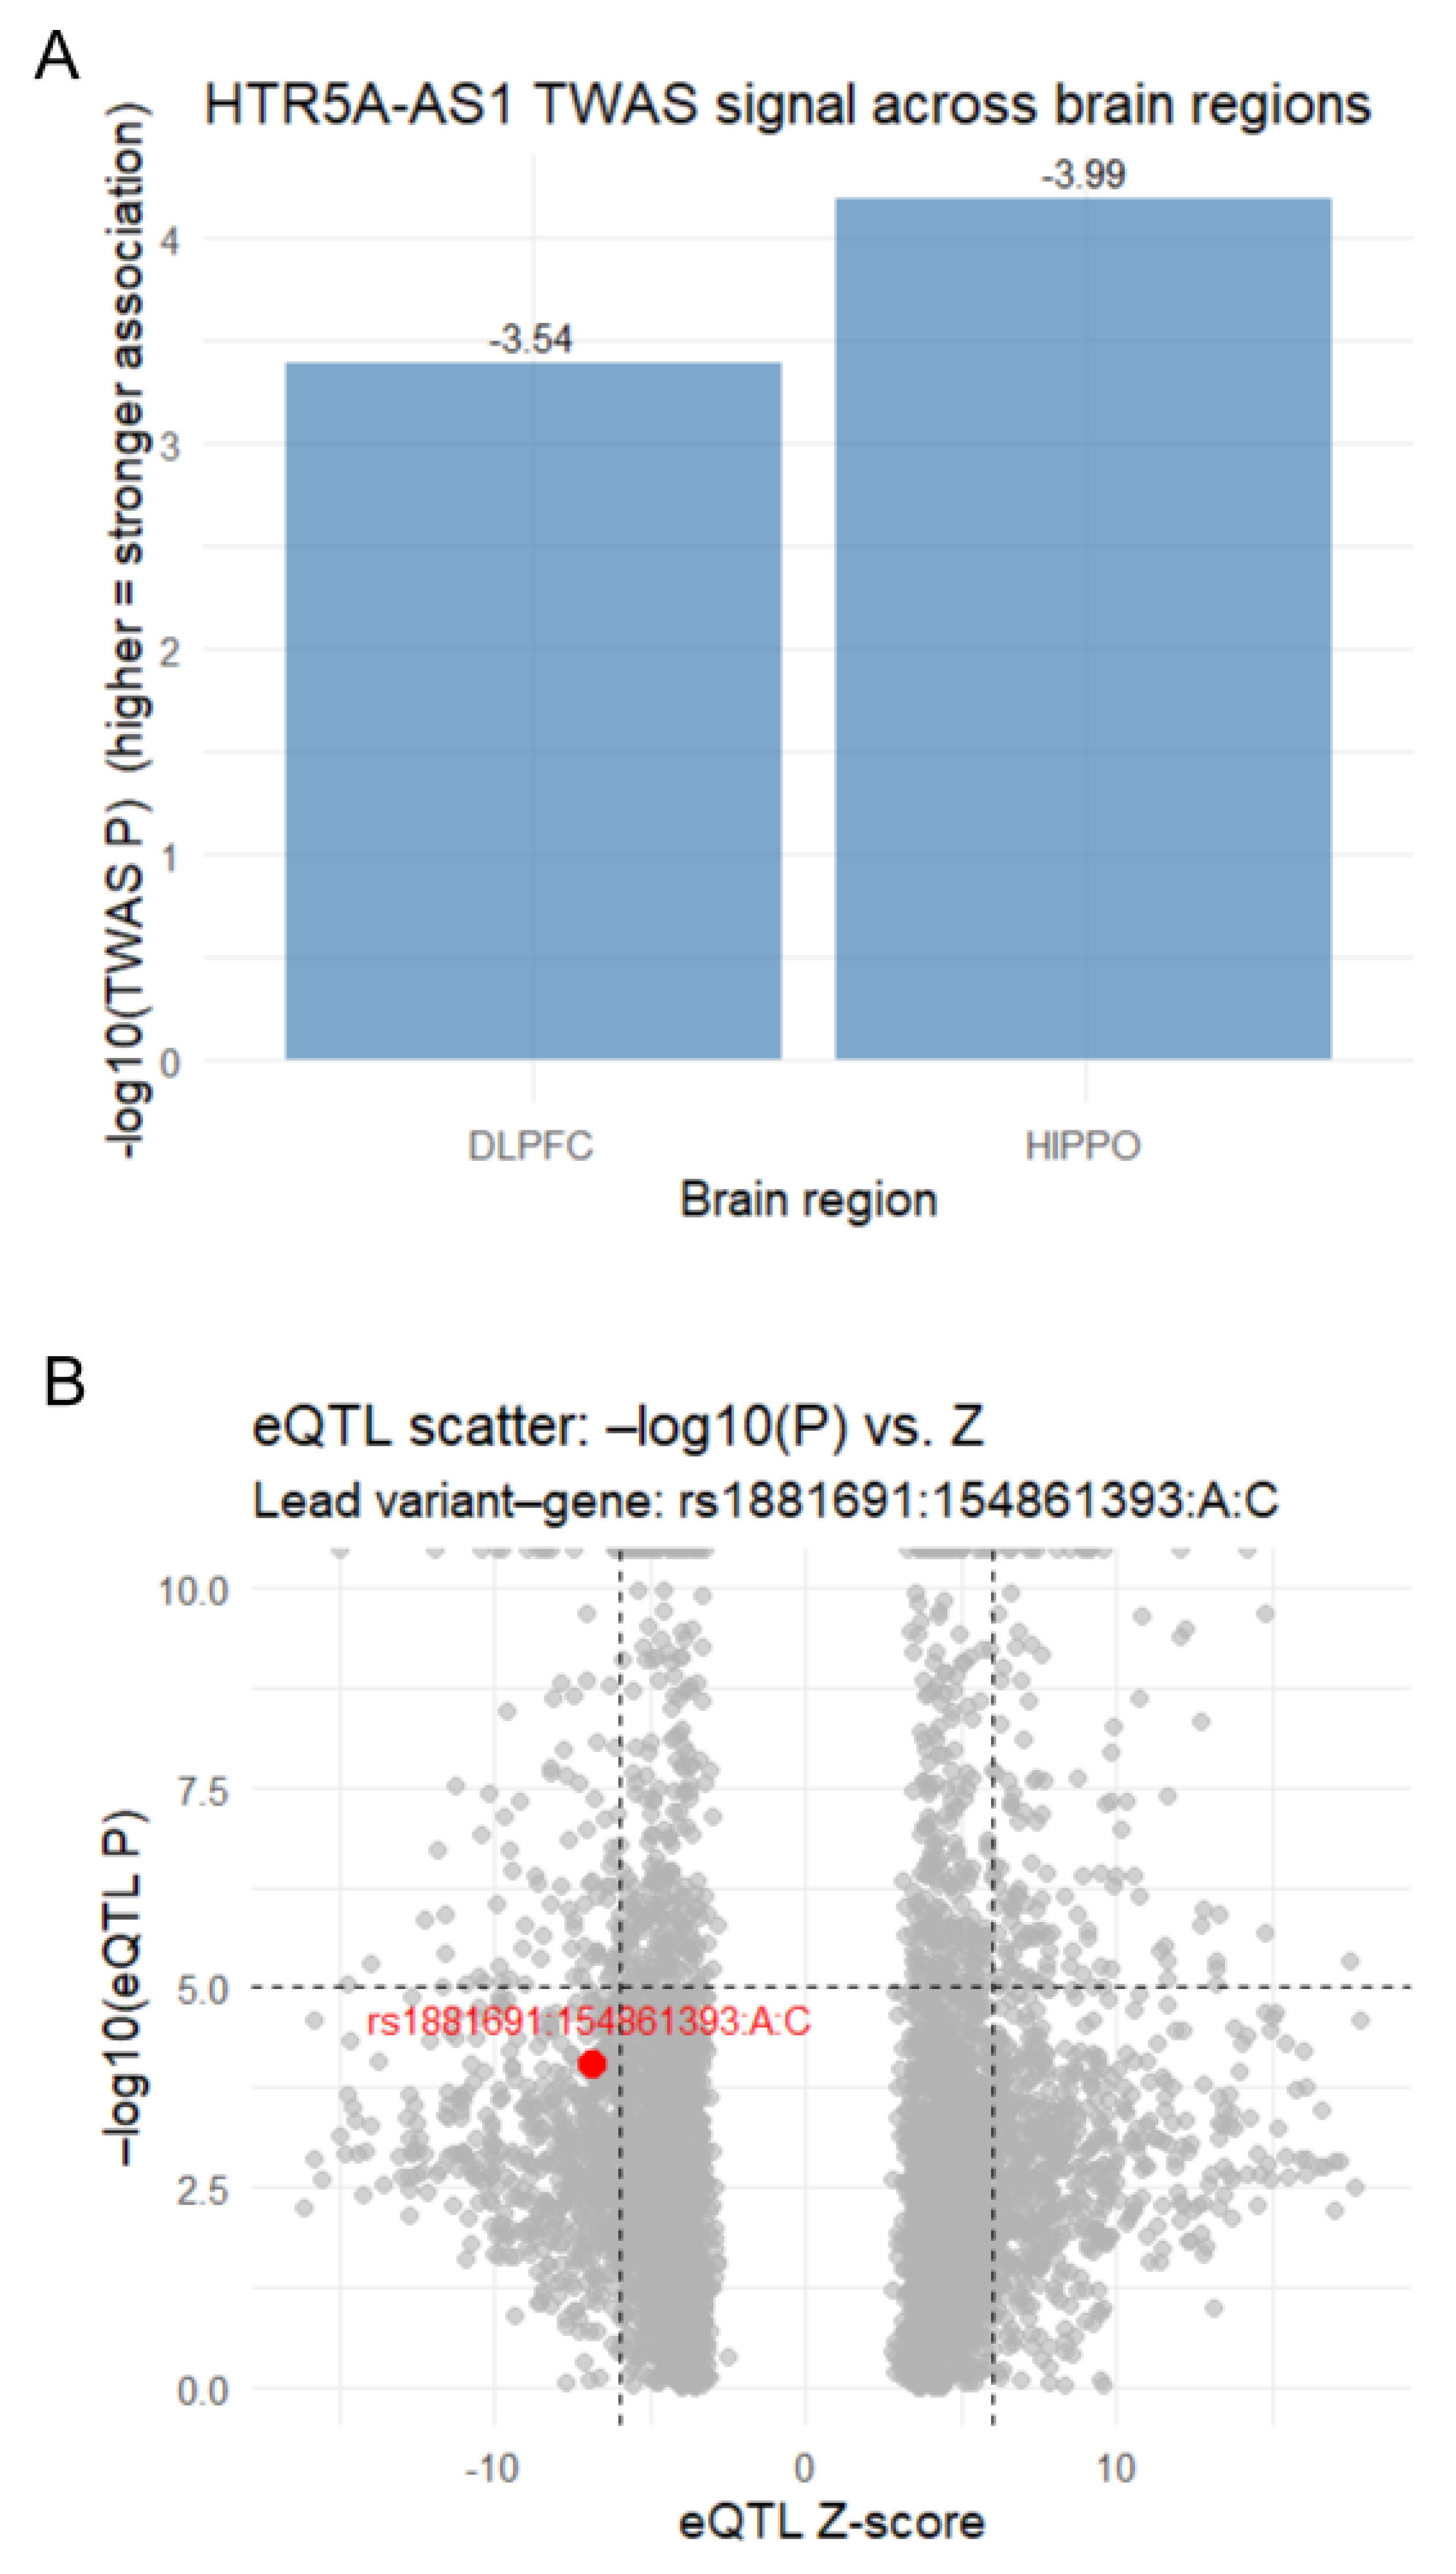
Figure 2.
Violin plots of regional HTR5A-AS1 expression using Collado-Torres et al. (2019) TWAS data [16]. (A) Violin plot showing HTR5A-AS1 expression in adult hippocampus (HIPPO) from postmortem schizophrenia and control donors. Data were normalized to CPM using sample-specific library sizes. A Wilcoxon rank-sum test revealed significantly lower expression in schizophrenia (). (B) Violin plot showing HTR5A-AS1 expression in adult dorsolateral prefrontal cortex (dlPFC) from postmortem schizophrenia and control donors (, Wilcoxon rank-sum test). Corresponding sex-stratified analyses for both regions are provided in Figures S1 and S2.
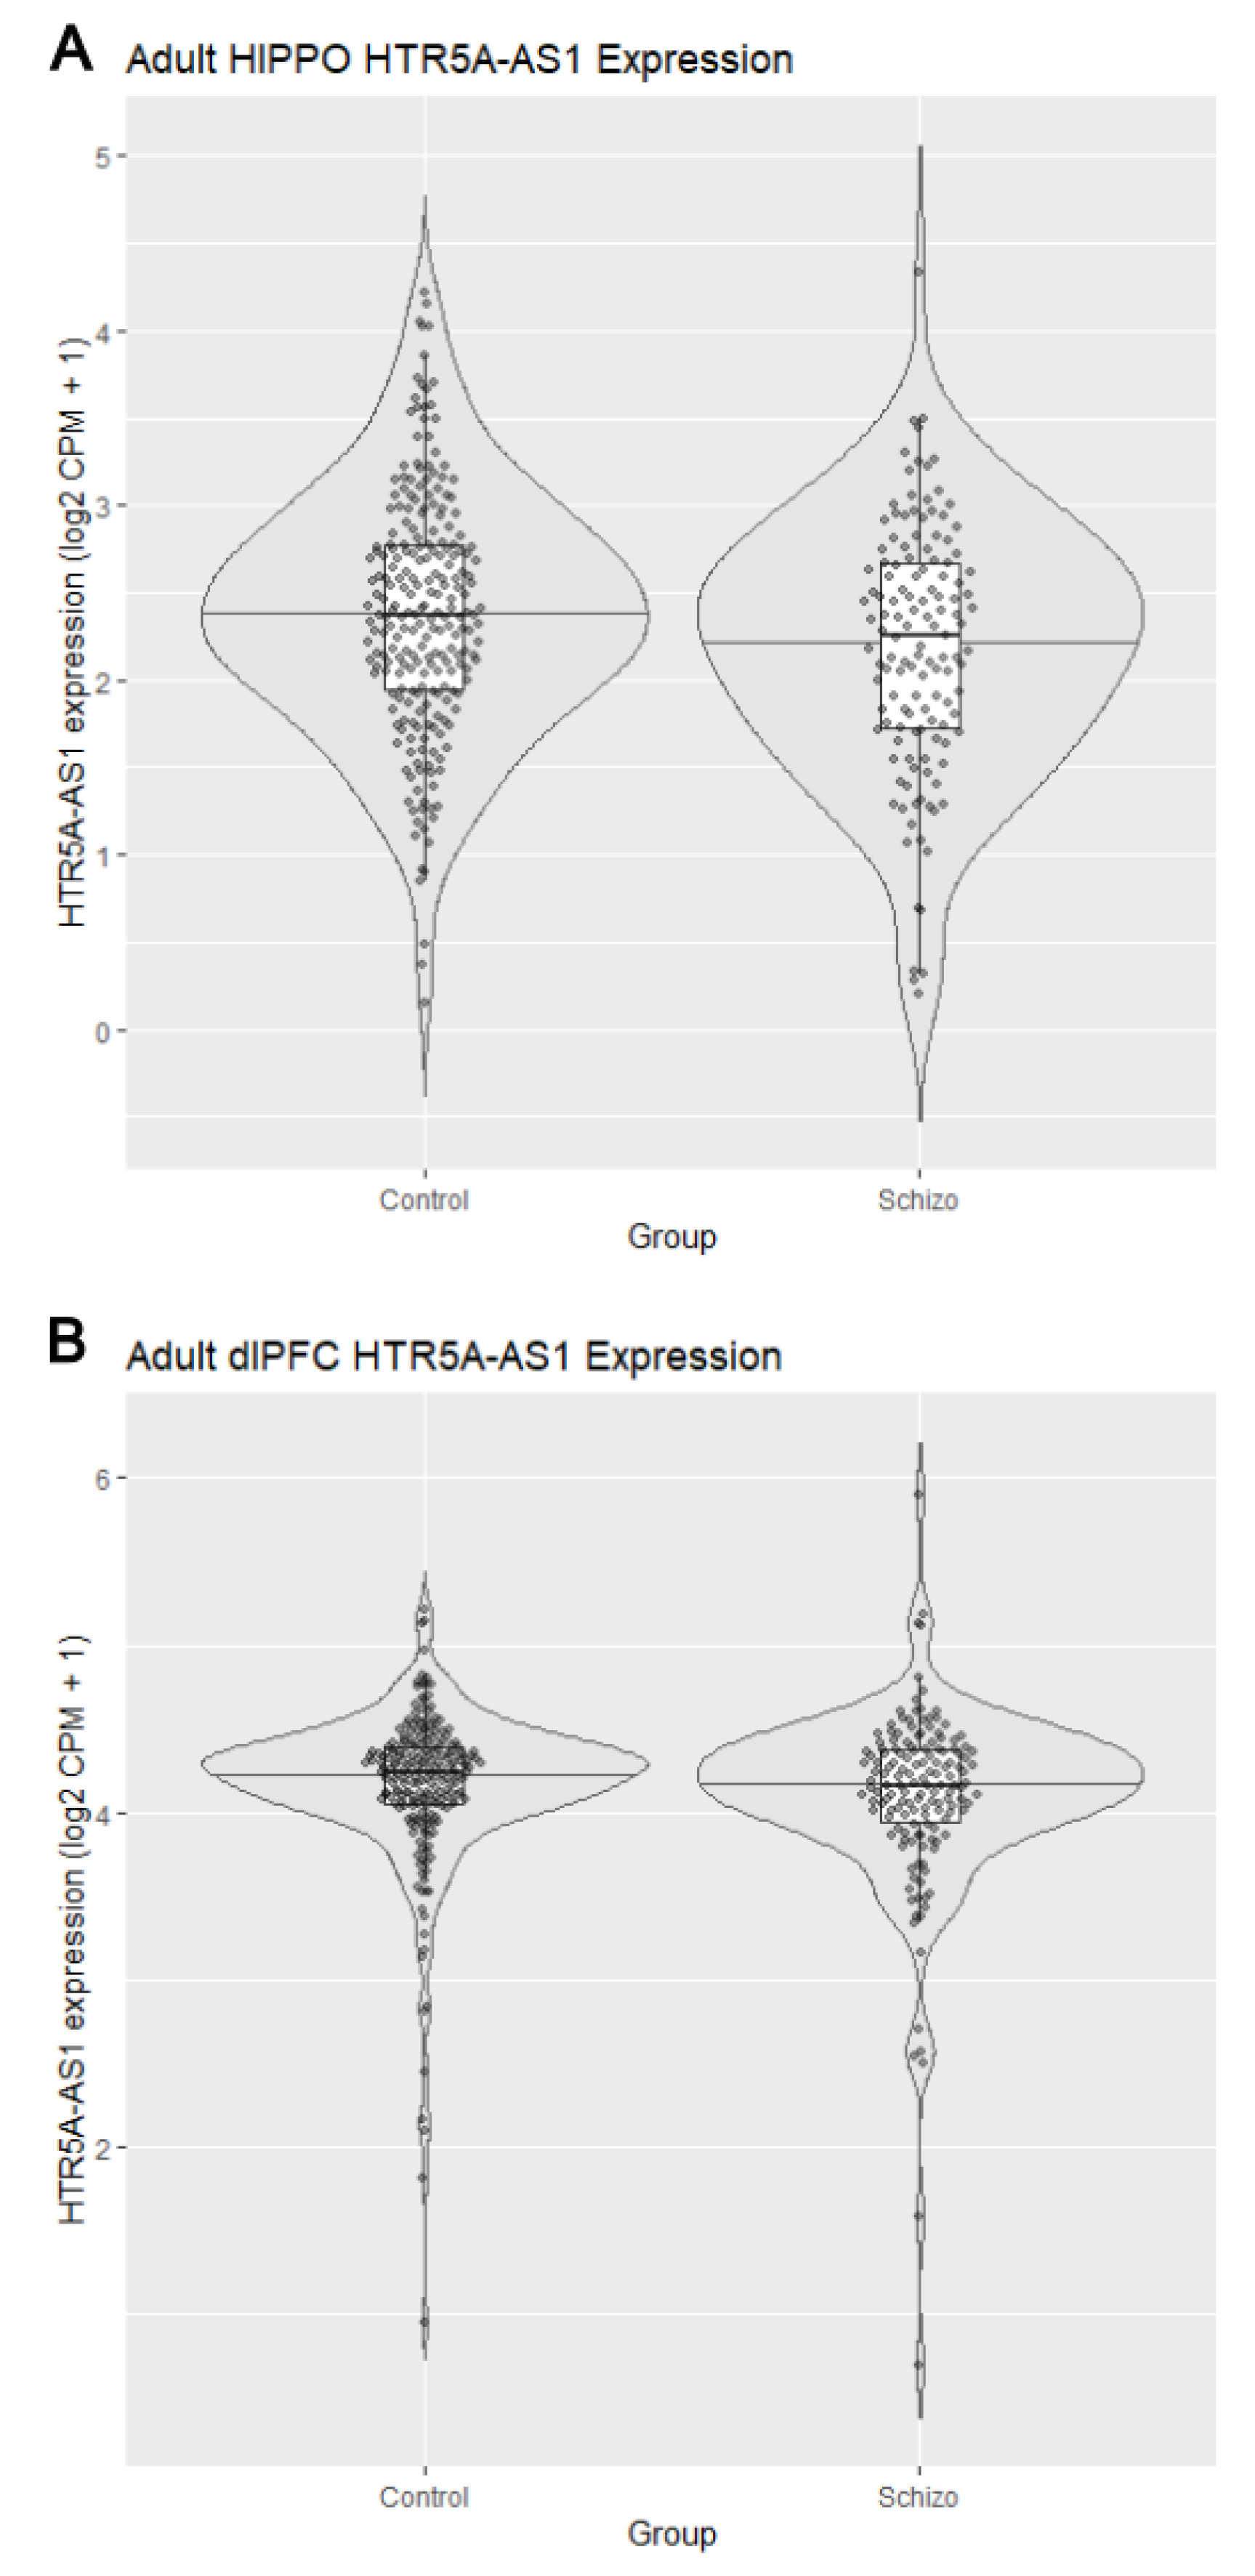
Figure 3.
BrainSpan RNA-seq HTR5A-AS1 expression by brain region, across development [36]. (A) Mean TPM values are shown for selected brain regions, ordered by decreasing expression. (B) Expression of HTR5A-AS1 increases steadily from prenatal to postnatal stages in BrainSpan RNA-seq data. A linear regression shows a significant positive trajectory (slope TPM/day; ; ), indicating strong developmental regulation. (C) Region-stratified regression shows distinct developmental patterns.
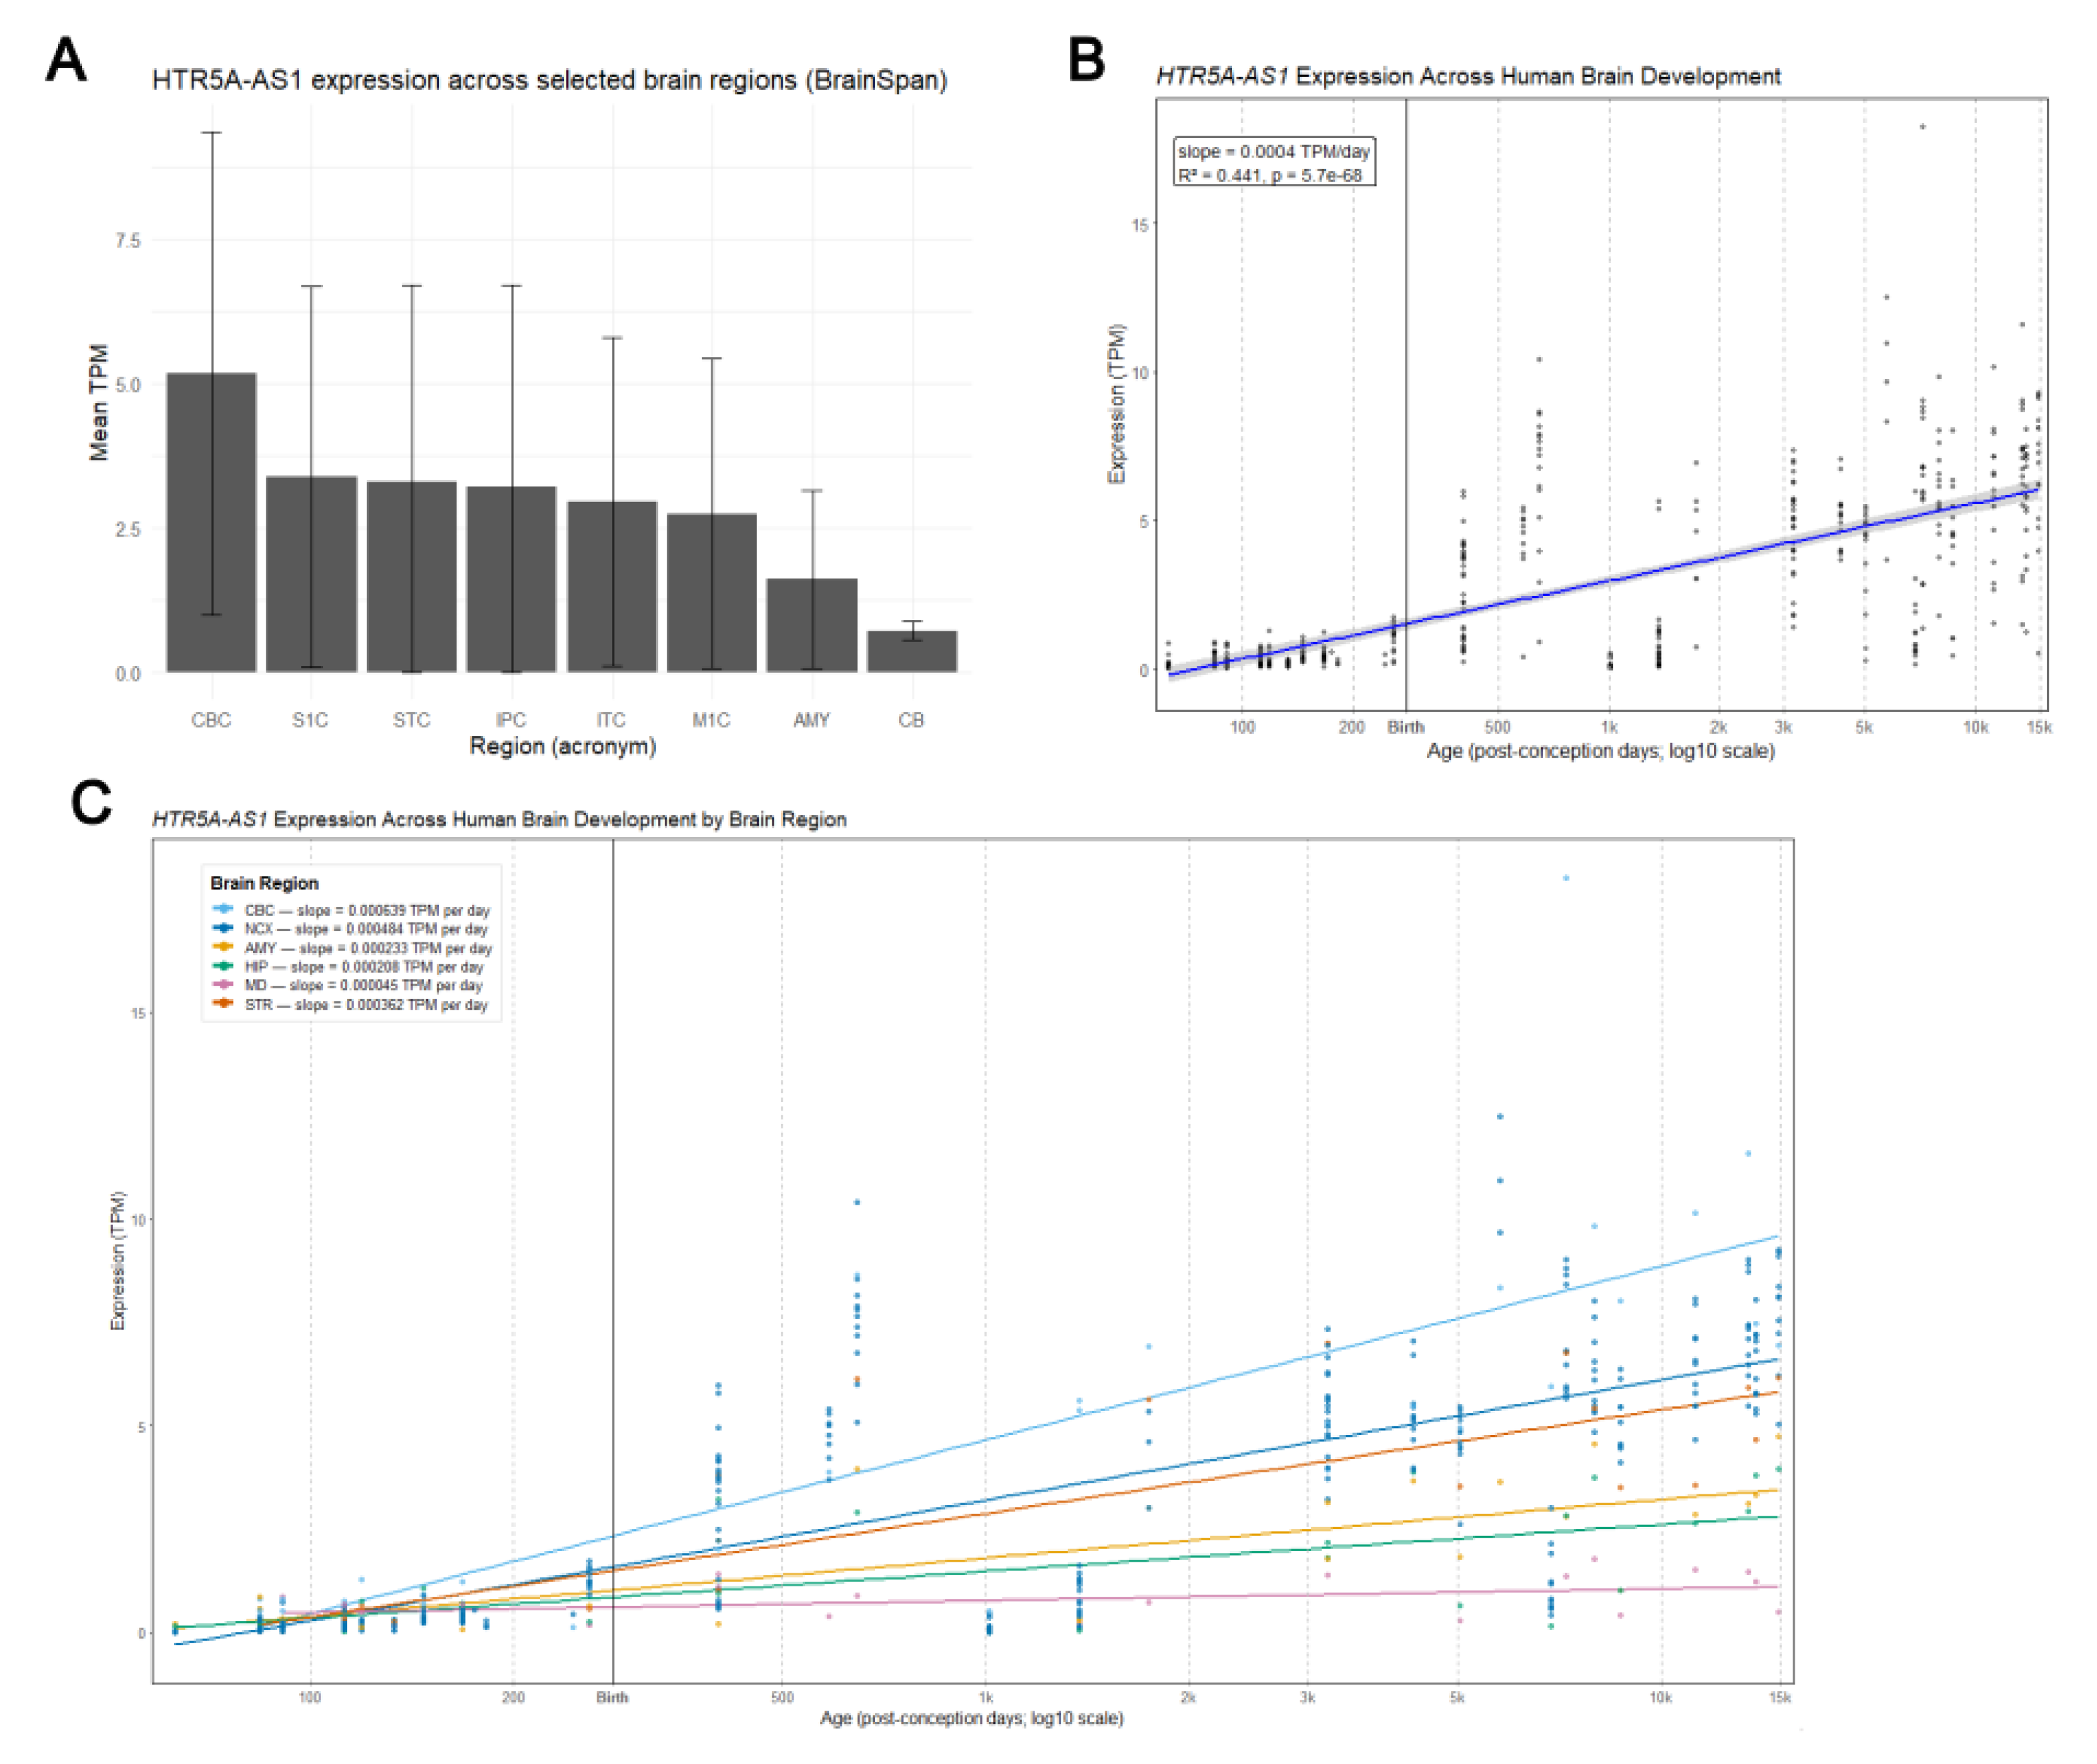
Figure 4.
Co-expression with HTR5A and UCSC Genome Browser analysis. (A) Scatterplot showing TPM for HTR5A-AS1 (y-axis) versus HTR5A (x-axis) across samples in the BrainSpan dataset [36], colored by brain region. Pearson’s , . (B) UCSC Genome Browser (hg38) snapshot of the HTR5A-AS1 locus on chromosome 7 [30]. Displayed tracks include genome-wide association studies (GWAS) and eQTL sentinel SNPs (rs1583830, red; rs1881691, blue), GENCODE v48 annotation, transcript models, ENCODE4 long-read RNA-seq, and GTEx RNA-seq.
Disclaimer/Publisher’s Note: The statements, opinions and data contained in all publications are solely those of the individual author(s) and contributor(s) and not of MDPI and/or the editor(s). MDPI and/or the editor(s) disclaim responsibility for any injury to people or property resulting from any ideas, methods, instructions or products referred to in the content. |
© 2025 by the author. Licensee MDPI, Basel, Switzerland. This article is an open access article distributed under the terms and conditions of the Creative Commons Attribution (CC BY) license (http://creativecommons.org/licenses/by/4.0/).
Copyright: This open access article is published under a Creative Commons CC BY 4.0 license, which permit the free download, distribution, and reuse, provided that the author and preprint are cited in any reuse.


