
Submitted:
23 September 2025
Posted:
23 September 2025
You are already at the latest version
Abstract
Agriculture and forestry remain vital sources of rural employment; yet both sectors face challenges of low labour productivity, demographic change, and structural inefficiencies. Modernisation improves productivity but often reduces labour demand, creating a policy dilemma between innovation and job preservation. Therefore, this study aims to quantify labour input across different land use types related to agriculture and forestry in Latvia. This study develops a multi-stage framework to quantify labour inputs across agricultural and forestry land uses in Latvia. The research results indicate that labour intensity decreases with farm size but varies more strongly by production type. Perennial plantations, vegetable and potato cultivation, and dairy and pig farming show the highest labour demands, whereas energy crops and grass-based systems require the least. In forestry, establishment and tending dominate labour needs, while mechanised harvesting reduces input requirements. These findings highlight the strategic role of labour-intensive, high-value activities in sustaining rural employment. Policy should prioritise targeted support for labour-intensive, high-value farming and forestry activities to maximise rural jobs and income growth.
Keywords:
labour input
; labour demand
; land use
; agriculture
; forestry
1. Introduction
Employment in agriculture and forestry remains a vital contributor to sustaining rural livelihoods. Agriculture remains a cornerstone of rural economies, serving as a primary source of income and employment through a wide range of activities along the agri-food value chain. Labour-intensive and sustainable agricultural practices are essential for enhancing household incomes and generating stable employment opportunities [1,2]. Employment diversification within agriculture further strengthens economic resilience, particularly among poorer households, by increasing productivity and wages [3]. The reallocation of labour to diversified agricultural activities and the adoption of cooperative farming structures foster community cohesion, social participation, and institutional collaboration [4,5].
However, the agricultural sector continues to face persistent structural challenges. These include low labour productivity, rising wage costs, and recurrent seasonal or long-term labour shortages [6,7]. These issues are exacerbated by demographic pressures such as an ageing rural population and youth outmigration, as well as by inefficiencies in labour organisation and allocation [8,9]. Additionally, climate change poses a significant threat to rural labour capacity, with rising temperatures projected to reduce agricultural labour productivity by up to a half in some vulnerable regions by the end of the century [10].
Forestry also provides essential, though often overlooked, employment opportunities in rural regions, particularly where reforestation and ecosystem restoration projects are active. The sustainable use of forest resources contributes to poverty reduction, enhances household income generation, and reinforces rural socio-economic structures [11]. Agroforestry systems have been shown in some cases to require less labour than input-intensive farming systems [12]. Despite a general decline in the forestry workforce and substantial regional disparities, the sector remains a key contributor to rural development [13]. Labour migration undermines the efficiency of forest management and local income generation [14], underscoring the need for a sufficiently skilled and locally available workforce to ensure both ecological sustainability and rural well-being.
Addressing these rural employment challenges requires a clear understanding of structural constraints such as low labour productivity and demographic shifts. Sustainable intensification, improved resource management, and selective mechanisation can reduce labour input without undermining productivity or economic viability [15,16]. Policies must prioritise the qualification, allocation, and long-term sustainability of the rural workforce to enhance the resilience of agricultural systems and promote inclusive rural development grounded in structural insight.
Policymakers in rural labour policy face a fundamental dilemma between promoting innovation and preserving employment. On one side, public support for innovation, technological advancements, and enhanced competitiveness is expected to improve farm productivity and resilience, contributing to long-term sustainability. However, these same innovations often reduce the demand for manual labour and thus reduce employment opportunities [15,17]. Even sustainable intensification and conservation-oriented practices may lower labour requirements [16]. As a result, modernisation may unintentionally displace workers, unless it is accompanied by proactive measures to ensure inclusive employment, workforce adaptation, and the long-term sustainability of rural labour markets.
The European Union (EU) Common Agricultural Policy (CAP) 2023–2027 provides a flexible framework to support sustainable rural development. This is attained primarily by maintaining rural employment [18]. Simultaneously, broader EU policy initiatives such as the European Green Deal [19], the Circular Economy Action Plan [20], and the Bioeconomy Strategy [21] all emphasise the potential for rural job creation through transitions to greener, more circular economies. These frameworks involve employment gains, provided workers possess appropriate green skills. However, quantitative evidence on the labour impacts of bioeconomy in rural areas has remained limited [22]. Thus, these developments underscore the growing importance of anticipating and quantifying workforce needs across agriculture and forestry, aligning policy ambitions with labour market realities.
This study aims to quantify the labour input across different land-use types related to agriculture and forestry in Latvia. To achieve this, a novel approach to quantifying labour input across various land uses in rural areas of Latvia is introduced. This involves a detailed and multi-stage framework that enables precise calculation of labour-hour consumption per hectare or per animal by systematically accounting for variations in enterprise size, production specialisation, and levels of technological equipment.
By addressing the current lack of quantitative data, particularly concerning the bio-economy, the study contributes to a better understanding of structural labour dynamics. It supports the formulation of policies that align economic, environmental, and social objectives in the context of sustainable rural development. The results provide an evidence base for policy decisions that seek to balance technological innovation and productivity growth with the preservation and promotion of rural employment.
2. Background of the Study
2.1. Task- and Sector-Specific Approaches to Quantifying Labour Input
In the literature on agriculture and forestry, measurement of labour input varies mainly according to sectoral focus. A common approach in crop production involves expressing labour input per unit of land, most often as labour time per hectare. Many studies adopt this land-based metric, using terms such as effective working hours per hectare, labour days per hectare, or man-hours per hectare [17,23,24,25]. Measurement approaches further diverge based on farming operations, such as sowing, weeding, fertilising, and irrigation [15,26,27,28,29].
Livestock and dairy systems apply distinct labour input metrics, often defined per animal or herd task. Studies quantify the time spent per cow on activities such as feeding or milking, typically using weekly or daily timeframes [30,31]. In forestry contexts, labour input is recorded as worker days per hectare for tasks like felling, reflecting episodic but labour-intensive activities [32].
Additionally, several sources quantify labour input using standardised constructs such as annual work units or productive work hours [33,34], enhancing comparability across farm types and labour regimes. When labour inputs are expressed relative to other inputs, such as land area or the number of animals, the concept of labour intensity is appropriate [35].
A notable research gap is the absence of standardised labour input metrics, which hinders cross-study comparisons. Diverse units such as days, hours, or annual work equivalents introduce inconsistencies. Measuring labour input in terms of hours per hectare or per animal provides a consistent, scalable, and task-insensitive unit that aligns with land use intensity and livestock management, thereby enabling more accurate benchmarking across various farming systems and operational contexts.
2.2. Mechanisation as a Driver of Labour Reduction in Large-Scale and Specialised Production
Mechanisation plays a central role in reducing labour requirements in arable crop systems. Mechanical planters and dibble bars significantly reduce the time and physical effort associated with sowing operations compared to manual planting techniques [25,36]. Similarly, mechanised weeding and cultivation enhance worker productivity by lowering both the number of labourers needed and the physical burden of field tasks [37,38]. Mechanised irrigation systems, particularly sprinkler and drip systems, are likewise associated with significant labour savings per hectare when compared to furrow-based irrigation [26,39].
In contrast to annual systems, where sowing and weeding dominate labour use, mechanisation is most impactful during pruning and thinning operations in permanent cropping systems. Devices such as blossom thinners and automated thinning machines improve labour productivity by decreasing the time and labour intensity of manual thinning while enhancing crop uniformity [40,41]. Although complete replacement of manual labour is not feasible in many contexts, mechanical thinning substantially reduces the need for intensive follow-up labour and facilitates improved marketability of fruits [42,43]. Mechanical harvesters substantially reduce labour input by performing harvesting tasks more efficiently and with fewer operators [17,23].
Grassland-based production systems, including meadows and pastures, introduce yet another set of labour challenges, which are solved by mechanisation, particularly during short harvesting times. Tools such as chippers and pickup headers expedite formerly manual alignment tasks, contributing to time savings, although these technologies do not eliminate the need for manual adjustment [44]. Mechanisation of these systems allows for quicker completion of seasonal tasks, reducing dependence on large seasonal labour forces and improving time-sensitive harvesting logistics.
Mechanisation is also transformative in livestock systems, where feeding and milking are the most labour-intensive tasks. Mechanised feeding systems distribute feed while maintaining consistency in ration delivery [45]. Automated milking systems reduce the labour required for routine milking and offer consistent labour demands across varying herd sizes, contributing to scalability and management flexibility [31,46]. More broadly, the integration of digital technologies and mechanised equipment into dairy operations has led to considerable gains in labour efficiency and productivity [47].
As this evidence suggests, larger farms often benefit more from the economies of scale of mechanisation, reducing labour input per unit area or animal. Specialisation in production increases task complexity, usually resulting in higher labour efficiency gains from mechanisation. Accurate labour input estimation must thus consider both scale and specialisation of production to reflect realistic workload differences and help optimise resource allocation in diverse agricultural and forestry settings.
2.3. Scale and Technology Boost Labour Efficiency on Larger Farms
Larger operations tend to exhibit greater labour efficiency and increased reliance on hired hands relative to their smaller counterparts. In crop systems, evidence from plantation contexts shows that large estates employing mechanised harvesting cover substantially more area per hour than those relying on manual tools [17]. Mechanised grain farms similarly report improvements in yields, profitability, and food self-sufficiency. Interestingly, the most significant benefits are often observed among the smallest holdings, which face acute labour shortages. At the same time, the largest farms show more modest reductions in wage labour demand following mechanisation [48,49].
A similar pattern emerges in livestock production, where labour productivity rises with herd size. Herds beyond the medium threshold required markedly fewer labour hours per animal than their smaller counterparts [46,50]. Beef enterprises of considerable scale achieved higher output per labour unit, reflecting economies of scale in both land and livestock management [8]. Time devoted to calf care per farm increased with herd expansion, while per-calf attention remained greatest on the smallest holdings [51].
Beyond efficiency measures, structural characteristics also influence labour organisation. Larger and more diversified farms are more likely to employ wage workers, and greater tenancy is associated with higher overall labour inputs [33,52].
Despite these insights, comparative studies explicitly contrasting small and large enterprises across production systems remain limited. Most research focuses either on highly mechanised large-scale operations or on smallholder farms in isolation. Moreover, existing work typically measures labour efficiency in terms of output value rather than relative to land area or animal numbers. These gaps constrain a comprehensive understanding of how scale shapes labour input as a dimension of resource demand.
2.4. Labour Needs Differ by Production Specialisation and Crop Type
Labour requirements in agriculture vary significantly across different production systems and management practices. Specialised, high-value systems, such as cherry and vegetable cultivation, are notably labour-intensive [2,53]. Similarly, organic farming, although it demands more labour per hectare, tends to provide more stable employment compared to conventional methods [1]. Conversely, some less intensive systems, like oil palm cultivation, can lead to a decrease in overall family labour [54].
The adoption of certain agricultural practices also influences labour dynamics. Conservation agriculture, for instance, presents a mixed picture. Some studies indicate an increase in labour input requirements, particularly for women, with instances of child labour observed in Sub-Saharan Africa [55]. However, other findings suggest that conservation agriculture-based sustainable intensification practices can substantially decrease labour use [16,56]. Agroforestry practices have also been shown to require less labour than fertilised maize fields, though more than non-fertilised continuous maize [12].
Furthermore, specific tasks within agricultural systems contribute to varying labour demands. For example, early cleaning activities can require varying labour inputs depending on the season, spanning several productive work hours per hectare [34]. In livestock systems, calf care and milk feeding illustrate how certain stages require disproportionately high labour inputs despite overall efficiency gains from scale [51,57].
Overall, comparative studies examining labour inputs across different agricultural domains remain scarce. Most research tends to focus on specific animals or crops, resulting in fragmented insights that hinder a comprehensive understanding of labour dynamics across farming types. This gap restricts the ability to generalise findings or develop integrated labour efficiency strategies applicable across varied agricultural contexts.
2.5. Forestry Integrates Labour Costs for Operational Planning
Labour costs are a central component of forestry planning models, often included to assess economic feasibility and conduct sensitivity analyses. For instance, models developed in Latvia have included labour expenses to facilitate sensitivity analyses of key cost drivers, such as timber volume and transport distance [58].
Beyond modelling exercises, empirical studies emphasise that labour efficiency in forestry depends on both environmental and operational factors. In North America, challenging terrain and dense vegetation have been shown to reduce worker productivity [59]. Stand type and silvicultural operation likewise influence the time and effort required.
Work-time studies reveal that production activities such as felling, processing, stacking, and extraction typically account for the majority of labour input. At the same time, worksite preparation and equipment maintenance make up the remainder [32]. The duration of these tasks varies considerably depending on stand conditions and harvesting methods.
Aside from these studies, research explicitly quantifying labour requirements in forestry is limited. Most studies address labour costs indirectly through operational models, while comprehensive empirical assessments across diverse forest conditions and management practices are sparse. Closing this gap is essential for improving the accuracy and applicability of forestry planning tools.
3. Materials and Methods
3.1. Agriculture
In this study, labour input in agricultural land use is defined as the number of labour hours per hectare of land or per grazing animal. Labour input is quantified for the main crop groups (cereals, oilseeds and pulses; vegetables and potatoes; perennial crops; energy crops; other crops; fallow land; grassland in arable land; meadows and pastures) and main grazing animal groups (dairy cows; other grazing animals; pigs; poultry) in 2021, because this year was typical year for agricultural activities in Latvia. The calculation process incorporates a farm size-based classification system, as summarised in Appendix A (Table A1). The classification was undertaken to examine the effects stemming from the assumption that smaller farms require more intensive labour input than larger farms, primarily due to their reliance on outdated machinery and equipment.
The assessment of labour input across agricultural sectors and farm size groups in this study applies multiple methods as follows: 1) the ordinary least squares regression method was performed on the Latvian Farm Accountancy Data Network (FADN) farm-level data [60], 2) calculation of average labour hours for specialised farms in FADN data [60], and 3) adjustments were made using the Latvian Rural Consulting and Education Centre (LLKC) Gross Margins calculations [61].
The analytical framework applies the ordinary least squares regression method, where the dependent variable is total labour input (hours) comprising both paid and unpaid labour within farm operations, and the independent variables are land area allocated to different production types and average livestock population per farm. To address the FADN data limitations, a composite grazing animal group, “other grazing animals”, was created, applying standardised weighting coefficients of 1 for non-dairy cattle and horses, and 0.3 for sheep and goats. The regression outputs are presented in Table 1.
Table 1 presents the mean labour input in terms of hours per hectare or per grazing animal across various agricultural sectors in Latvia in 2021, along with regression parameter estimates and p-values.
The results indicate a significant disparity in labour requirements among industries. Vegetable/potato cultivation and plantations of perennials recorded the highest average labour per hectare (234.2 and 215.4 hours, respectively), while dairy cow husbandry had the highest average labour input per animal (87.04 hours). Poultry and pig sectors, however, required significantly lower amounts of labour (0.84 and 3.46 hours, respectively), while other grazing animals had an average of 12.19 hours.
To quantitatively assess labour input for various types of agricultural land use, anonymised farm-level data from the FADN for the year 2021 were utilised [60]. FADN is a harmonised European system for collecting microeconomic data on farms, providing detailed information on farm incomes, production activities, and structural characteristics for policy analysis and research. From the 1,000 farms in the FADN data, a subset of 898 farms (90% of the total) was used for calculations, excluding:
- rabbit farms (results are not statistically significant);
- beekeeping farms (very large differences in labour input between medium and large farms);
- farms where the number of calves exceeds the total number of dairy cows and other cattle by 2 times or more (rapidly expanding);
- farms with only areas of meadows and pastures;
- cereal, oilseed, and pulse farms with relatively high outsourcing (exceeding 5 EUR per hour);
- farms where the difference between observed values and those predicted by the statistical model (residual) exceeds a magnitude of 10,000 (extreme values that interfere with accurate calculation results).
Although the FADN provides detailed data on approximately 1,000 Latvian farms, most of them are mixed-specialisation enterprises that produce several products at the same time. In such a situation, it is not possible to accurately determine the labour input into the production of each product.
To overcome this challenge, the calculations are performed by selecting FADN farms with the narrowest possible specialisation. However, even within this group, significant differences in results are observed between farms. Therefore, the obtained data are adjusted using the LLKC Gross Margins data for 2021, which defines standard activities for different crop groups and grazing animal groups.
The total land area and number of grazing animals for each crop and grazing animal group, categorised by farm size groups, were calculated using FADN data [60]. Due to frequent underreporting of land areas for micro farms in FADN records, calibration was performed for this farm size category using national statistics [62], which reports a total agricultural land use area of 1.97 million hectares (in Appendix A, Table A2).
Our calculation results are cross-validated using Eurostat statistics on agricultural labour input [63]. This comparison ensures the methodological accuracy of our conclusions. According to these data, in 2021, the total labour input from agricultural land use was 61.15 thousand Annual work units (AWU), where 1 AWU = 1,840 hours per year, of which 21.78 thousand AWUs correspond to salaried employees, while 39.37 thousand AWUs to employees working without direct remuneration, benefiting instead from profits or production outputs.
3.2. Forestry
For calculations of labour input from forestry land use, a different approach is applied, although the outcome is the same – labour hours per hectare of land use. In forestry, labour input is dependent on the dominant tree species as well as the silvicultural activity or timber extraction done in the forest area. The latest available data for 2024 was used for calculations. Due to the purpose of different forestry activities, the labour input calculations have been classified into silvicultural and logging activities. In the estimation of labour inputs in forestry land use, such silvicultural activities as soil preparation, planting, forest protection, forest replenishment, tending, young stand tending, underbrush tending, and maintenance of amelioration systems are included. The labour inputs for each silvicultural operation, depending on the dominant tree species, have been determined based on evaluations by industry practitioners.
As for logging activities, the labour input was assessed by determining the capacity of each piece of equipment per hour, depending on the logging activity, cubic meters per hour (m3/h), as reported in the Latvian State Forest’s 2024 efficiency indicators of logging service providers [64]. Logging activities employ techniques such as a harvester and chainsaw (for cutting trees), a forwarder (for timber delivery), and transport (for timber transportation). In addition to capacity, the proportion of chainsaw use in percentage (%) was determined, depending on the dominant tree species and logging activity (see Appendix A, Table A3).
The total land area for silvicultural and logging activities, depending on the dominant tree species, was calculated using data from national statistics in 2022 as follows:
- Soil preparation is employed in natural forest regeneration to enhance the success rate of regeneration through natural processes. However, soil preparation is not universally applied in all instances of natural regeneration. For this analysis, it is assumed that soil preparation, specifically topsoil mineralisation achieved by creating furrows with a disc plough or ridges using an excavator, is implemented in approximately 50% of naturally regenerating forest areas. Consequently, the total area subjected to soil preparation was estimated by summing the total area of forest regeneration achieved through sowing and planting with half of the naturally regenerating forest area, based on national statistical data on forest regeneration [65];
- The total area of forest planting was calculated by combining the total area of forest regeneration (by sowing and planting) with the total area of planted forests as reported in the national statistical data on afforestation [66];
- The total area of forest requiring protection (except for dominant tree species – black alder, aspen, and white alder) and tending was determined by aggregating the total area of forest regeneration conducted over the preceding four years;
- It is posited that the area requiring young stand tending is approximately 30% smaller than the total area requiring tending, reflecting the less frequent and prolonged tending needs of young stands;
- The total area subjected to forest replenishment was estimated as half of the total area of regenerated forest;
- Data on the total forest area where logging activities – including main felling, maintenance felling, and other types of felling – were conducted, along with corresponding timber stock, were obtained from national statistical records on inventoried forest felling areas and stock volume [67];
- It is assumed that the total area subjected to underbrush tending corresponds to 90% of the total area of logging activities;
- The total area where maintenance of amelioration systems has been performed was obtained from national statistical data on forest land area [68].
The total areas of silvicultural activities are summarised in Appendix A (Table A4). The total areas of logging activities and their total stock volumes are reported in Appendix A (Table A5).
The validation of the determined labour input was conducted using national statistical data on employment by activity type [69], which reported a total workforce of 13,200 full-time equivalent employees in 2022. By comparing our results with this official statistic, we ensure the methodological robustness of our approach.
3.3. Spatial Analysis
Several data sources are used for spatial identification. For field-level crop production, Rural Support Service data for 2021 are used (upon request, not publicly available). For the spatial location of grazing animal holdings, the Agricultural Data Centre produces data for 2021, which is available upon request (not publicly available). For spatial information on all forest parcels and their dominant tree species, data from the State Register of Forests for 2024 is used (upon request, publicly not available).
Based on this information, we calculated the labour input at the individual parcel level, taking into account the characteristics of each plot and management practices (the overall size of the farm managing each specific land parcel). To ensure data protection for individual fields and to make spatial visualisation more straightforward, the parcel-level results were summarised in a grid of 100-hectare square cells [70]. By standardising the data in 100-hectare cells, greater consistency and comparability in the spatial representation of labour intensity across the study area were achieved, and the processing of complex parcel geometries was simplified.
4. Results
4.1. Agriculture
The results reveal substantial variation in labour inputs across different agricultural sectors and farm size groups (Table 2). The highest labour inputs per hectare were observed in perennial plantations and vegetable and potato cultivation. On micro farms, perennial plantations required an average of 726 hours per hectare, followed closely by vegetables and potatoes at 667 hours per hectare. Small farms reported slightly lower labour inputs in these categories, with 647 and 595 hours per hectare, respectively. Thus, labour intensity decreased substantially with farm size – large farms required 234 and 215 hours per hectare in perennial plantations and vegetable production, respectively, while medium farms required 441 and 405 hours.
Labour input differences across farm size groups were also notable for grazing animal categories. For dairy cows with calves, micro farms reported the highest labour requirement at 387 hours per animal, followed by small farms (196 hours), medium farms (106 hours), and large farms (87 hours). A similar pattern emerged across other grazing animal farms. Goats required 203 hours per animal on micro farms, but only 42 on both large and medium farms. Horses required 82 hours per animal on micro farms and 17 hours on large and medium farms. Sheep and other grazing animals followed the same trend, with labour inputs increasing consistently from large to micro farms.
Among arable crops, cereals, oilseeds, and pulses exhibited moderate labour intensity, with micro farms requiring 63 hours per hectare and large farms only 15 hours per hectare. Energy crops consistently required the lowest labour inputs across all farm size categories, ranging from 13 hours per hectare on large and medium farms to 28 hours per hectare on micro farms.
For fallow land, grasslands, and meadows/pastures, labour inputs were uniformly very low but still demonstrated a positive association with decreasing farm size. For example, labour input on fallow land ranged from 7 hours per hectare on large farms to 28 hours per hectare on micro farms. Similarly, meadows and pastures required just 3 hours per hectare on large farms compared to 18 on micro farms (Table 2).
In the category of non-ruminant livestock, pigs and poultry showed markedly low labour requirements on large farms, 3.5 and 0.8 hours per animal, respectively. However, these values increased considerably on micro farms to 119 hours for pigs and 4 hours for poultry. Medium farms showed an especially steep increase for pigs, reporting 20 hours per animal (Table 2).
The spatial distribution of agricultural labour intensity across Latvia follows considerable regional variation (Figure 1). The highest continuous levels of labour input intensity are concentrated in the western regions of the country. Central Latvia has high labour input intensity, indicating sustained agricultural activity. In contrast, the areas surrounding the capital, Riga, show very low levels of agricultural labour input. In eastern Latvia, labour intensity also remains high, suggesting that agricultural practices in this region similarly require substantial labour inputs. The northern area of Latvia displays a consistent pattern of medium to low labour intensity, indicating a moderate level of agricultural engagement. In general, the map reveals a structured spatial gradient in agricultural labour input intensity, with the most pronounced activity occurring in western and south-eastern Latvia.
4.2. Forestry
The average labour input associated with forestry land use shows notable variation across silvicultural operations and dominant tree species (Table 3). The most labour-intensive operations are underbrush tending, young stand tending, and general tending, each consistently requiring 23 to 25 hours per hectare across nearly all tree species. Specifically, underbrush tending exhibits the highest average input, reaching 25 hours per hectare uniformly for all species except aspen and grey alder, which have reduced labour requirements in other categories.
Planting and soil preparation are also prominent labour inputs, with both operations requiring 24 and 20.3 hours per hectare, respectively, for pine, spruce, birch, black alder, and other species. These operations are absent for aspen and grey alder, suggesting a different silvicultural regime for these species. Forest replenishment requires 22 hours per hectare for all species except birch, aspen, and grey alder.
Forest protection labour input is reported at 13.5 hours per hectare for pine, spruce, birch, and other species. Maintenance of amelioration systems is uniform across all species, requiring 13 hours per hectare, indicating standardised management efforts in this domain regardless of species composition.
Overall, tending operations are the most uniformly applied and labour-intensive activities across species. At the same time, soil preparation, planting, forest protection and replenishment vary more substantially and are absent for some species, particularly aspen and grey alder.
The highest equipment capacities are observed in timber transport by lorry, with a consistent output of 18 cubic meters (m3) per hour across all logging activities. Harvesters also demonstrate a substantial capacity, particularly in main felling and other types of felling, yielding 18.7 m3/h, more than double the capacity recorded for maintenance felling (7.9 m3/h) (Table 4).
Forwarders exhibit moderate variation, with capacities ranging from 5.8 m3/hour during maintenance felling to 12.2 m3/h during main and other types of felling. This increase parallels the pattern observed for harvesters, indicating higher productivity in non-maintenance operations (Table 4).
Chainsaw productivity remains constant at 0.9 m3/h across all logging activities, representing the lowest capacity among all equipment types and the only value that does not vary with logging context.
In summary, harvester and forwarder capacities are markedly higher during main and other types of felling than in maintenance felling, while timber lorry and chainsaw outputs remain unchanged across activities.
Unlike agriculture, where output is annual or more frequent, forestry demands continuous labour over a long rotation cycle. Labour intensity fluctuates widely, with alternating periods of low and high demand, which limits direct comparability with agriculture.
The spatial distribution of forestry labour input intensity in Latvia reveals a distinct pattern of clustering, with marked regional variation in labour allocation to forestry activities (Figure 2). In the south-eastern region of Latvia, forestry labour intensity is low relative to most of the territory. This area features several delineated clusters of high-intensity labour input, indicating localised concentrations of forestry operations. Northern Latvia exhibits relatively high levels of forestry labour input. The area comprises several smaller clusters of intense labour inputs, reflecting a dispersed yet notable forestry presence. A contiguous band of elevated labour intensity is observed traversing the central part of the country, extending through parts of Latvia. In the coastal region of Latvia, forestry labour intensity is higher compared to adjacent inland territories. Overall, the data indicate that the most labour-intensive forestry activities in Latvia are concentrated in coastal areas of the west and in the central region, characterised by numerous small spatial clusters with high labour input levels.
5. Discussion
5.1. Farm Size and Labour Intensity in Agriculture
The research results consistently suggested that larger farms systematically require fewer labour hours per unit of output, whether measured per hectare or animal, than their smaller counterparts. Several interrelated factors contribute to this pattern. Larger farms typically possess greater capacity to invest in mechanisation, automation, and optimised infrastructure, thereby reducing reliance on manual labour [17]. This is particularly evident in labour-intensive sectors such as pig production and grazing livestock, where large farms demonstrated labour input reductions exceeding 80%, and up to 97% in the case of pigs, relative to micro-scale operations. These efficiencies are less accessible to smaller farms due to capital constraints and the indivisibility of specific technologies.
Larger holdings often adopt more streamlined workflows, whereas micro and small farms frequently rely on diverse, low-tech, and labour-intensive methods [51]. As a result, micro farms exhibited labour input levels at least three times higher per unit than large farms, reflecting both technological and organisational limitations.
Fixed labour requirements associated with supervision, maintenance, and animal care do not scale linearly with production size. Larger herds or field areas do not necessarily entail proportional increases in labour demand, as evidenced by markedly lower labour hours per animal on larger livestock farms in the results. This nonlinear scaling of labour inputs aligns with previous empirical findings [46,50], reinforcing the interpretation that increased farm size yields significant labour efficiencies.
The findings also support international evidence suggesting that while land productivity may plateau or decline with increasing size, labour productivity typically rises with larger scales of agricultural production [35]. As scale increases, management and operational efficiencies tend to favour labour productivity gains. In contrast, land productivity may stagnate or even decline due to less intensive land use, diminished attention to marginal plots, or reliance on monocultures.
5.2. Complexity of Production as the Key Driver of Labour Demand
Although labour intensity declines with increasing farm size across all sectors, this effect is more pronounced in labour-intensive systems. The analysis thus challenges the common assumption that small farms are intrinsically labour-intensive due solely to their size. Instead, the results of this study highlight that production complexity is a more accurate determinant of labour demand.
Micro and small farms growing vegetables or managing grazing livestock require disproportionately high labour per hectare or animal, indicating that the labour burden is elevated not because of their small scale, but due to the complexity of the agricultural systems involved. Highly specialised and high-value systems, such as vegetable cultivation and perennial plantations, consistently require greater labour input due to their complex, labour-intensive tasks, as has also been demonstrated by some earlier studies [2,53]. In contrast, extensive systems such as fallow land and grasslands were considerably less labour-intensive, and this was likely not due to scale but due to their low management complexity.
High-value and management-intensive systems involve manual tasks that are difficult to mechanise, yet mechanisation and standardisation play a critical role in reducing labour input. Arable crops benefit from economies of scale and high mechanisation potential, leading to reduced labour requirements on larger farms, as confirmed by the results. Infrastructure and system constraints explain the labour intensity of small-scale livestock operations. For instance, micro farms raising dairy cows or pigs face higher labour requirements, likely due to the lack of automation and limited access to specialised labour-saving equipment.
Substantial variation across production types furthermore reinforces the role of production complexity. Perennial crops, vegetables, and livestock systems exhibited significant disparities in labour inputs across size classes, whereas energy crops, grasslands, and fallow land showed uniformly low labour needs. Thus, variation in labour intensity is explained by activities involved rather than by the size of operations, suggesting that labour requirements are more closely tied to production type than to scale.
These research results align with broader research indicating that the overall structure of land use and the specific mix of activities, rather than farm size alone, are central determinants of employment creation, rural livelihoods, and the trajectory of structural transformation in rural areas [71].
5.3. Silvicultural Regimes Drive Episodic Variation in Forestry Labour Input
The results indicate that labour demand in forestry is more closely associated with the complexity of specific operations than with the category of tree species. Moreover, labour demand in forestry appears to be episodic, with pronounced peaks during establishment and tending phases, and a significant reduction in direct employment needs as mechanisation in logging increases. The most labour-intensive operations, such as underbrush tending, young stand tending, and general tending, required 23 to 25 hours per hectare across nearly all tree species. Their uniformity suggests that labour demand in these phases is governed by the intrinsic complexity of managing early stand development, which is relatively unaffected by species differences. Similarly, planting and soil preparation required high labour input for most species, but were absent for aspen and grey alder, indicating differences in silvicultural regimes rather than species.
The analysis of equipment productivity reveals how operational complexity shapes indirect labour requirements. Harvester and forwarder capacities were significantly higher in main and other types of felling than in maintenance felling, indicating that using equipment to save labour works best in large, less fragmented operations. In contrast, chainsaw productivity remains consistently low across all logging contexts, highlighting both the persistence of manual labour in certain operations and its limited scalability. The high labour intensity associated with timber lorry operations, irrespective of felling method, is supported by study indicating that log transport by truck incurs relatively high labour costs [58].
5.4. Land Use Legacies and Spatial Patterns of Labour Intensity
Historical land use legacies and prevailing biophysical constraints strongly shape labour input patterns. The spatial distribution of labour demand closely mirrors the patterns of forested versus agricultural land cover [72], which continue to structure regional labour allocation. In Latvia, a clear spatial inverse relationship exists between forest and agricultural land use, which is reflected in the opposing labour input intensities across the two sectors. Regions characterised by extensive forest cover show higher forestry labour demand, whereas areas dominated by agricultural land exhibit more labour-intensive farming activities. These patterns suggest that the nature and intensity of land use, determined by both ecological suitability and historical land management regimes, remain key drivers of regional labour demand variation.
In and around the metropolitan region of the capital city, Riga, both agricultural and forestry labour inputs are markedly low. This pattern aligns with the urban character of the area, which is characterised by high population density, a dominant non-agricultural employment sector, and limited land availability for primary production. As a result, labour input patterns in the capital region deviate from those observed elsewhere in the country, further underscoring the influence of land use practices and socio-economic context on labour distribution.
Notably, the findings indicate that peripheral regions, such as the eastern regions of Latvia, can exhibit levels of labour intensity that surpass those of more central economic zones. This contradicts the expectation that labour intensity scales uniformly with production size and suggests instead that diversified farming practices, lower degrees of mechanisation, or specific market and environmental constraints may generate heightened labour demands.
5.5. Limitations, Policy Improvements and Opportunities for Future Research
Several limitations related to data and methodology warrant consideration. Parcel-level data often represent mixed-specialisation farms, hindering the precise attribution of labour inputs to specific products. While the analysis emphasises specialised farms and incorporates LLKC standard activity data for calibration, some heterogeneity persists. The land areas of micro-farms are frequently underreported, although partially corrected using national statistics. In forestry, the long rotation cycle and uneven temporal distribution of labour complicate annual comparisons with agriculture; estimates rely on assumptions about the share of land undergoing particular silvicultural operations.
The research demonstrates how scale, production complexity, land use, and technological interactions impact labour demand in agriculture and forestry. The implication of the results points to policy and research priorities. Future research should focus on addressing the structural and data-related gaps revealed in this study. Long-term evaluation of mechanisation uptake, particularly among smaller farms, is necessary to understand how capital constraints and access to technology shape labour dynamics over time. Comparative analysis across production systems would help identify tasks and activities that remain resistant to technological improvements and thus continue to demand significant manual labour. In parallel, integrating labour efficiency assessments with environmental and social sustainability frameworks could clarify trade-offs between productivity gains, ecological goals, and rural employment opportunities. More advanced spatial analyses that combine information on land use, mechanisation potential, and demographic factors would also enhance understanding of regional disparities in rural labour intensity. For forestry, further research should investigate how silvicultural practices and climate adaptation strategies influence episodic patterns of labour demand. Finally, improving parcel-level labour data and addressing underreporting by micro-farms, together with applying dynamic models to evaluate efficiency drivers across farm size and production types, would substantially refine the evidence base for rural employment and policy design.
Many policymakers are paying substantial attention to facilitating employment in rural areas. Moreover, one of the tools used is differentiating support payments based on the size of the farms [73,74]. The research shows that farm size only partially explains labour demand intensity. Furthermore, specialisation plays an even more critical role in creating employment opportunities than size. From this perspective, for employment facilitation, primary attention of rural employment facilitation policies should not be on size, but specialisation.
6. Conclusions
This study quantified typical labour inputs across agricultural and forestry land uses in Latvia, calculating labour hours per hectare or animal for a wide range of production types, farm sizes, tree species, and tasks. Labour input estimates were derived by calculating average labour hours for specialised farms, further adjusted through LLKC Gross Margins estimates, and complemented by expert evaluations or calculated using equipment productivity indicators. The results demonstrate that labour intensity consistently declines with increasing farm size, yet differences between production types are even more pronounced. Highest labour intensity occurs in perennial plantations, as well as in vegetable and potato cultivation. Among livestock, dairy cows and pigs required exceptionally high labour inputs, with pigs showing one of the most pronounced disparities between micro and large scales of production. Energy crops and grass-based land uses require the lowest labour inputs, though even this shows increased labour demands on smaller farms. In forestry, tending and establishment operations (planting, soil preparation) dominate labour demand, while mechanised harvesting shows pronounced productivity advantages for felling. The spatial distribution of labour demand closely reflects the longstanding division between forested and agricultural areas, although labour intensity only partly reflects land use.
The empirical evidence generated by this study has several implications for rural development policy, particularly concerning fostering employment in the agricultural and forestry sectors. While supporting smaller farms can maximise employment per unit, our findings emphasise that prioritising labour-intensive and high-value crops and activities, such as perennial plantations, vegetable and potato cultivation, dairy farming, and pig farming, is equally, if not more, critical for driving rural job creation and rising incomes. These sectors consistently show the highest labour demands, and are thus strategic targets for employment-focused support. Conversely, energy crops and grass-based systems, while extensive, contribute less to labour demand and should not be prioritised solely for job creation. In forestry, labour demand is concentrated in tending and regeneration operations, suggesting that policy attention should shift to silvicultural workforce development for employment generation. International and European experience demonstrates that rural development policies, such as the CAP, can positively influence farm employment. However, the impact depends strongly on the type of subsidy and its targeting. Investments in labour-intensive sectors, value-added activities, and diversification are more likely to sustain and create jobs than broad-based support based solely on farm size.
Author Contributions
Conceptualization, U.D.V., I.P. and A.N.; methodology, U.D.V., K.V. and A.N.; validation, K.V.; formal analysis, U.D.V.; data curation, U.D.V.; writing—original draft preparation, U.D.V, I.P. and J.L.; writing—review and editing, U.D.V., I.P., J.L. and K.V.; visualization, U.D.V.; supervision, A.N., project administration A.N., funding acquisition A.N. All authors have read and agreed to the published version of the manuscript.
Funding
This research was funded by the Ministry of Agriculture of the Republic of Latvia’s project “Improvement of the Functional Land Use Model” number S512.
Data Availability Statement
The data presented in this study are openly available in DataverseLV at: https://dv.dataverse.lv/dataset.xhtml?persistentId=doi:10.71782/DATA/PFT36O (accessed on 28 August 2025).
Conflicts of Interest
The authors declare no conflicts of interest. The funders had no role in the design of the study, in the collection, analysis, or interpretation of data, in the writing of the manuscript, or in the decision to publish the results.
Abbreviations
The following abbreviations are used in this manuscript:
| AWU | Annual work units |
| CAP | European Union Common Agricultural Policy |
| EU | European Union |
| FADN | Latvian Farm Accountancy Data Network |
| h | hours |
| LLKC | Latvian Rural Consulting and Education Centre |
| m3 | cubic meter |
| % | percent |
Appendix A

Table A1.
Farm size groups in different agricultural sectors in Latvia in 2021.
| Agricultural sector | Large farms | Medium farms | Small farms | Micro farms |
|---|---|---|---|---|
| Cereals, oilseeds, pulses (ha) | >300 | >100, ≤300 | >20, ≤100 | ≤20 |
| Potatoes and vegetables (ha) | >30 | >10, ≤30 | >2, ≤10 | ≤2 |
| Perennial plantations (ha) | >30 | >10, ≤30 | >2, ≤10 | ≤2 |
| Energy crops (ha) | >30 | >10, ≤30 | >2, ≤10 | ≤2 |
| Other crops (ha) | >150 | >50, ≤150 | >10, ≤50 | ≤10 |
| Fallow land (ha) | >300 | >100, ≤300 | >20, ≤100 | ≤20 |
| Grassland (ha) | >300 | >100, ≤300 | >20, ≤100 | ≤20 |
| Meadows and pastures (ha) | >300 | >100, ≤300 | >20, ≤100 | ≤20 |
| Dairy cows (number) | >200 | >30, <=200 | >4, <=30 | <=4 |
| Other grazing animals (number) | >200 | >30, <=200 | >4, <=30 | <=4 |
| Horses (number) | – | >30 | >4, <=30 | <=4 |
| Goats (number) | – | >50 | >5, <=50 | <=5 |
| Sheep (number) | – | >50 | >5, <=50 | <=5 |
| Pigs (number) | >=1000 | >=100, <1000 | >=5, <100 | <5 |
| Poultry (number) | >=50k | >=1k, <50k | >=20, <1k | <20 |
Table A2.
The total land area (ha) and grazing animal number for each crop and grazing animal group, categorised by farm size groups in Latvia in 2021.
Table A2.
The total land area (ha) and grazing animal number for each crop and grazing animal group, categorised by farm size groups in Latvia in 2021.
| Agricultural sector | Large farms | Medium farms | Small farms | Micro farms | Total |
|---|---|---|---|---|---|
| Cereals, oilseeds, pulses (ha) | 526 827 | 217 347 | 148 684 | 77 355 | 970 213 |
| Potatoes and vegetables (ha) | 4 459 | 1 894 | 2 530 | 14 916 | 23 798 |
| Perennial plantations (ha) | 2 174 | 2 509 | 3 387 | 1 733 | 9 803 |
| Energy crops (ha) | 881 | 176 | 138 | 15 | 1 210 |
| Other crops (ha) | 682 | 1 065 | 2 459 | 9 612 | 13 819 |
| Fallow land (ha) | 309 | 6 718 | 26 564 | 26 194 | 59 785 |
| Grassland (ha) | 44 568 | 55 153 | 75 044 | 118 223 | 292 989 |
| Meadows and pastures (ha) | 22 100 | 71 726 | 173 626 | 331 180 | 598 631 |
| Dairy cows (number) | 37 049 | 48 509 | 34 902 | 10 783 | 131 243 |
| Other grazing animals (number) | 86 516 | 131 355 | 42 255 | 2 648 | 262 774 |
| Horses (number) | - | 62 290 | 25 226 | 2 466 | 89 982 |
| Goats (number) | - | 3 721 | 5 014 | 2 355 | 11 090 |
| Sheep (number) | - | 1 857 | 4 177 | 2 430 | 8 464 |
| Pigs (number) | 315 972 | 8 298 | 11 020 | 3 634 | 338 924 |
| Poultry (number) | 4 956 310 | 609 399 | 253 395 | 38 596 | 5 857 700 |
Table A3.
The proportion of chainsaw usage depending on the dominant tree species and logging activity in Latvia in 2024, %.
Table A3.
The proportion of chainsaw usage depending on the dominant tree species and logging activity in Latvia in 2024, %.
| Dominant tree species | Maintenance felling | Main felling | Other types of felling |
|---|---|---|---|
| Pine | 12 | 9 | 9 |
| Spruce | 12 | 9 | 9 |
| Birch | 15 | 12 | 12 |
| Black alder | 18 | 15 | 15 |
| Aspen | 25 | 20 | 20 |
| Grey alder | 28 | 18 | 18 |
| Other | 12 | 9 | 9 |
Table A4.
The total land area of forestry activities, depending on the dominant tree species in Latvia in 2024, ha.
Table A4.
The total land area of forestry activities, depending on the dominant tree species in Latvia in 2024, ha.
| Dominant tree species | Soil preparation | Planting | Forest protection | Forest replenishment | Tending | Young stand tending | Underbrush tending | Maintenance of amelioration systems |
|---|---|---|---|---|---|---|---|---|
| Pine | 8 337 | 8 486 | 31 021 | 4 316 | 31 021 | 21 715 | 38 272 | 19 049 |
| Spruce | 9 820 | 9 851 | 38 935 | 5 081 | 38 935 | 27 255 | 37 208 | 14 581 |
| Birch | 5 809 | 2 592 | 42 669 | 4 788 | 42 669 | 29 868 | 31 193 | 20 265 |
| Black alder | 1 080 | 583 | 0 | 857 | 6 693 | 4 685 | 2 122 | 4 726 |
| Aspen | 2 918 | 25 | 0 | 2 914 | 24 712 | 17 298 | 5 459 | 6 078 |
| Grey alder | 2 515 | 168 | 0 | 2 511 | 21 102 | 14 771 | 8 682 | 7 496 |
| Other | 63 | 49 | 508 | 54 | 508 | 356 | 374 | 2 271 |
| Total | 30 540 | 21 754 | 113 133 | 20 520 | 165 640 | 115 948 | 123 311 | 74 466 |
Table A5.
The total land area (ha) and the total stand volume (m3) of logging activities, depending on the dominant tree species in Latvia in 2024.
Table A5.
The total land area (ha) and the total stand volume (m3) of logging activities, depending on the dominant tree species in Latvia in 2024.
| Dominant tree species | Maintenance felling | Main felling | Other types of felling | |||
|---|---|---|---|---|---|---|
| Indicator | Area | Stand volume | Area | Stand volume | Area | Stand volume |
| Pine | 10 110 | 447 099 | 11 229 | 2 949 161 | 21 185 | 453 687 |
| Spruce | 8 689 | 430 924 | 5 241 | 1 314 902 | 27 412 | 875 109 |
| Birch | 11 575 | 365 271 | 16 527 | 3 586 121 | 6 557 | 165 630 |
| Black alder | 803 | 26 898 | 990 | 220 134 | 565 | 19 622 |
| Aspen | 1 588 | 50 072 | 3 759 | 924 629 | 719 | 24 188 |
| Grey alder | 1 122 | 22 094 | 7 778 | 1 148 901 | 747 | 29 950 |
| Other | 65 | 1 527 | 117 | 12 368 | 234 | 7 650 |
| Total | 33 952 | 1 343 885 | 45 641 | 10 156 216 | 57 419 | 1 575 836 |
References
- Huong, P.T.T.; Everaarts, A.P.; Neeteson, J.J.; Struik, P.C. Vegetable Production in the Red River Delta of Vietnam. II. Profitability, Labour Requirement and Pesticide Use. NJAS: Wageningen Journal of Life Sciences 2013, 67, 37–46. [Google Scholar] [CrossRef]
- Finley, L.; Chappell, M.J.; Thiers, P.; Moore, J.R. Does Organic Farming Present Greater Opportunities for Employment and Community Development Than Conventional Farming? A Survey-Based Investigation in California and Washington. Agroecology and Sustainable Food Systems 2018, 42, 552–572. [Google Scholar] [CrossRef]
- Fink, G.; Jack, B.K.; Masiye, F. Seasonal Liquidity, Rural Labor Markets, and Agricultural Production. American Economic Review 2020, 110, 3351–3392. [Google Scholar] [CrossRef]
- Le Phi Khanh, H.; Corfield, J.; Lane, P.; Ba, N.X.; Van, N.H.; Parsons, D. Intensive Forage Cultivation Reduces Labour Input and Increases Cattle Production Income in Smallholder Mixed Farming Communities of South Central Coastal Vietnam. Journal of Agriculture and Food Research 2020, 2, 100067. [Google Scholar] [CrossRef]
- Agarwal, B.; Dorin, B. Group Farming in France: Why Do Some Regions Have More Cooperative Ventures Than Others? Environ Plan A 2019, 51, 781–804. [Google Scholar] [CrossRef]
- Kostandini, G.; Mykerezi, E.; Escalante, C. The Impact of Immigration Enforcement on the U.S. Farming Sector. American J Agri Economics 2014, 96, 172–192. [Google Scholar] [CrossRef]
- Kolodziejczak, W. Labour Productivity and Employment in Agriculture in the European Union. ERSJ 2025, XXVIII, 991–1009. [Google Scholar] [CrossRef]
- Colnago, P.; Dogliotti, S. Introducing Labour Productivity Analysis in a Co-Innovation Process to Improve Sustainability in Mixed Family Farming. Agricultural Systems 2020, 177, 102732. [Google Scholar] [CrossRef]
- Drall, A.; Mandal, S.K. Does Multiple Job Holding Raise Labour Use Efficiency of the Farm Operators? Evidence from Rural India. Applied Economics 2025, 1–16. [Google Scholar] [CrossRef]
- Altinsoy, H.; Yildirim, H.A. Labor Productivity Losses over Western Turkey in the Twenty-First Century as a Result of Alteration in WBGT. Int J Biometeorol 2015, 59, 463–471. [Google Scholar] [CrossRef]
- Babulo, B.; Muys, B.; Nega, F.; Tollens, E.; Nyssen, J.; Deckers, J.; Mathijs, E. The Economic Contribution of Forest Resource Use to Rural Livelihoods in Tigray, Northern Ethiopia. Forest Policy and Economics 2009, 11, 109–117. [Google Scholar] [CrossRef]
- Ajayi, O.C.; Akinnifesi, F.K.; Sileshi, G.; Kanjipite, W. Labour Inputs and Financial Profitability of Conventional and Agroforestry-Based Soil Fertility Management Practices in Zambia. Agrekon 2009, 48, 276–292. [Google Scholar] [CrossRef]
- Zhang, B.; Jiang, X. Research on Forestry Labor Input Measurement and Forestry Industry Development in China. FER 2023, 5, 2–22. [Google Scholar] [CrossRef]
- Ning, C.; Xie, F.; Xiao, H.; Rao, P.; Zhu, S. Impact and Mechanism of Rural Labor Migration on Forest Management Income: Evidence from the Jiangxi Province, China. Front. Environ. Sci. 2022, 10, 902153. [Google Scholar] [CrossRef]
- Gathala, M.K.; Laing, A.M.; Tiwari, T.P.; Timsina, J.; Rola-Rubzen, F.; Islam, S.; Maharjan, S.; Brown, P.R.; Das, K.K.; Pradhan, K.; et al. Improving Smallholder Farmers’ Gross Margins and Labor-Use Efficiency Across a Range of Cropping Systems in the Eastern Gangetic Plains. World Development 2021, 138, 105266. [Google Scholar] [CrossRef]
- Aune, J.B.; Coulibaly, A.; Woumou, K. Intensification of Dryland Farming in Mali Through Mechanisation of Sowing, Fertiliser Application and Weeding. Archives of Agronomy and Soil Science 2019, 65, 400–410. [Google Scholar] [CrossRef]
- Aliuddin Bakar, M.; Firdaus Abdul Rashid, N.; Syahlan, S. Comparison of an Effective Working Hour and Harvesting Cost Between Manual Harvesting (Chisel and Sickle) and Mechanised Harvesting (CKAT and Motorised Cutter) in Oil Palm Plantation. IJET 2018, 7, 282. [Google Scholar] [CrossRef]
- Lillemets, J.; Fertő, I.; Viira, A.-H. The Socioeconomic Impacts of the CAP: Systematic Literature Review. Land Use Policy 2022, 114, 105968. [Google Scholar] [CrossRef]
- The European Green Deal. COM/2019/640 final. 2019. Available online: https://eur-lex.europa.eu/legal-content/EN/TXT/?uri=celex:52019DC0640 (accessed on 29 July 2025).
- A New Circular Economy Action Plan For a Cleaner and More Competitive Europe. COM/2020/98 final. 2020. Available online: https://eur-lex.europa.eu/legal-content/EN/TXT/?uri=celex:52020DC0098 (accessed on day month year).
- European Commission. A Sustainable Bioeconomy for Europe: Strengthening the Connection Between Economy, Society and the Environment: Updated Bioeconomy Strategy. Publications Office of the European Union, 2018. Available online: https://data.europa.eu/doi/10.2777/792130 (accessed on 25 May 2025).
- Sørensen, J.F.L.; Jørgensen, H.P. Rural Development Potential in the Bioeconomy in Developed Countries: The Case of Biogas Production in Denmark. Sustainability 2022, 14, 11077. [Google Scholar] [CrossRef]
- Krzyżaniak, K.; Kowalik, I.; Rybacki, P. Evaluation of the Operating Parameters of Self-Propelled Forage Harvesters During Maize Silage Harvest. Agricultural Engineering 2023, 27, 229–239. [Google Scholar] [CrossRef]
- Paman, U.; Inaba, S.; Uchida, S. The Mechanization of Small-Scale Rice Farming: Labor Requirements and Costs. Engineering in Agriculture, Environment and Food 2014, 7, 122–126. [Google Scholar] [CrossRef]
- Tylek, P.; Kiełbasa, P.; Szulc, T.; Szychta, M.; Szczepaniak, J.; Wojciechowski, J.; Danielak, M.; Adamczyk, F.; Tadeusiewicz, R.; Juliszewski, T.; et al. Design of a Planting Module for an Automatic Device for Forest Regeneration. Croat. j. for. eng. (Online) 2023, 44, 203–215. [Google Scholar] [CrossRef]
- Communal, T.; Faysse, N.; Bleuze, S.; Aceldo, B. Effects at Farm and Community Level of the Adoption of Sprinkler Irrigation in the Ecuadorian Andes. Irrigation and Drainage 2016, 65, 559–567. [Google Scholar] [CrossRef]
- Ogwuike, P.; Rodenburg, J.; Diagne, A.; Agboh-Noameshie, A.R.; Amovin-Assagba, E. Weed Management in Upland Rice in Sub-Saharan Africa: Impact on Labor and Crop Productivity. Food Sec. 2014, 6, 327–337. [Google Scholar] [CrossRef]
- Lee, J.H.; Myeong, D.J.; Shin, G.H.; Kim, K.H.; Lee, B.-S.; Jeon, Y.H.; Park, G.H. Analysis of the Relationship Between Sweet Pepper Stem Growth and Labor Load. HST 2022, 40, 388–399. [Google Scholar] [CrossRef]
- Zitha, H.M.; Ramantswana, M.M.; Spinelli, R. Performance of Harvesting Residue Treatment Methods in South African Pine Plantations. Forests 2023, 14, 1661. [Google Scholar] [CrossRef]
- Ferris, C.P.; Binnie, R.C.; Frost, J.P.; Patterson, D.C. Effect of Offering Silage During Housing at Night on the Performance of Grazing Dairy Cows and on Labour Requirements. Grass and Forage Science 2008, 63, 138–151. [Google Scholar] [CrossRef]
- Schmid, D. Profitability of Swiss Dairy Farms with Different Milking Systems. 2023. [Google Scholar] [CrossRef]
- Magagnotti, N.; Mihelic, M.; Perazzolo, A.; Spinelli, R. Seventeen Years of Forest Restoration with Small-Scale Technologies: Time and Fuel Consumption for Alternative Operations and Techniques. Small-scale Forestry 2023, 22, 557–581. [Google Scholar] [CrossRef]
- Lips, M.; Schmid, D.; Jan, P. Labour-Use Pattern on Swiss Dairy Farms. Agric. Econ. - Czech 2013, 59, 149–159. [Google Scholar] [CrossRef]
- Uotila, K.; Saksa, T. Cost-Efficient Pre-Commercial Thinning: Effects of Method and Season of Early Cleaning. Silva Fenn. 2021, 55. [Google Scholar] [CrossRef]
- Chiarella, C.; Meyfroidt, P.; Abeygunawardane, D.; Conforti, P. Balancing the Trade-Offs Between Land Productivity, Labor Productivity and Labor Intensity. Ambio 2023, 52, 1618–1634. [Google Scholar] [CrossRef] [PubMed]
- Singh, A.K.; Singh, P.R. Development of a Tractor Operated Sugarcane Cutter Planter for Mechanisation of Sugarcane Planting in Deep Furrows. Sugar Tech 2017, 19, 416–423. [Google Scholar] [CrossRef]
- Singh, S.P.; Ekka, U.; Singh, M.K.; Jain, A.K. Mini Electric Prime Mover for Increasing Productivity of Sugarcane Farmers. Sugar Tech 2022, 24, 1368–1381. [Google Scholar] [CrossRef]
- Nourou, A.I.M.; Saidou, A.K.; Arifa, W.; Abdoulaye, A.O.; Aune, J.B. Intensification of Pearl Millet Production in Niger Through Mechanized Sowing and Weeding, Seed Priming, Seed Treatment, and Microdosing. Agronomy 2020, 10, 629. [Google Scholar] [CrossRef]
- Murali, P.; Balakrishnan, R. Labour Scarcity and Selective Mechanisation of Sugarcane Agriculture in Tamil Nadu, India. Sugar Tech 2012, 14, 223–228. [Google Scholar] [CrossRef]
- Baugher, T.A.; Schupp, J.R.; Lesser, K.M.; Hess-Reichard, K. Horizontal String Blossom Thinner Reduces Labor Input and Increases Fruit Size in Peach Trees Trained to Open-center Systems. hortte 2009, 19, 755–761. [Google Scholar] [CrossRef]
- Mosqueda, E.; Smith, R.; Goorahoo, D.; Shrestha, A. Automated Lettuce Thinners Reduce Labor Requirements and Increase Speed of Thinning. Calif Agr 2018, 114–119. [Google Scholar] [CrossRef]
- Schupp, J.R.; Baugher, T.A.; Miller, S.S.; Harsh, R.M.; Lesser, K.M. Mechanical Thinning of Peach and Apple Trees Reduces Labor Input and Increases Fruit Size. hortte 2008, 18, 660–670. [Google Scholar] [CrossRef]
- Seehuber, C.; Damerow, L.; Blanke, M.M. Concepts of Selective Mechanical Thinning in Fruit Tree Crops. Acta Hortic. 2013, 77–83. [Google Scholar] [CrossRef]
- Velázquez-Martí, B.; Fernández-González, E. Analysis of the Process of Biomass Harvesting with Collecting-Chippers Fed by Pick up Headers in Plantations of Olive Trees. Biosystems Engineering 2009, 104, 184–190. [Google Scholar] [CrossRef]
- Ferris, C.P.; Frost, J.P.; Binnie, R.C.; Patterson, D.C. Dairy Cow Performance and Labour Inputs Associated with Two Silage Feeding Systems. Grass and Forage Science 2006, 61, 304–314. [Google Scholar] [CrossRef]
- Næss, G.; Bøe, K.E. Labour Input in Small Cubicle Dairy Barns with Different Layouts and Mechanisation Levels. Biosystems Engineering 2011, 110, 83–89. [Google Scholar] [CrossRef]
- Edwards, J.P.; Dela Rue, B.T.; Jago, J.G. Evaluating Rates of Technology Adoption and Milking Practices on New Zealand Dairy Farms. Anim. Prod. Sci. 2015, 55, 702. [Google Scholar] [CrossRef]
- Paudel, G.P.; Gartaula, H.; Rahut, D.B.; Justice, S.E.; Krupnik, T.J.; McDonald, A.J. The Contributions of Scale-Appropriate Farm Mechanization to Hunger and Poverty Reduction: Evidence from Smallholder Systems in Nepal. JED 2023, 25, 37–61. [Google Scholar] [CrossRef]
- Rajkhowa, P.; Kubik, Z. Revisiting the Relationship Between Farm Mechanization and Labour Requirement in India. Ind. Econ. Rev. 2021, 56, 487–513. [Google Scholar] [CrossRef]
- Deming, J.; Gleeson, D.; O’Dwyer, T.; Kinsella, J.; O’Brien, B. Measuring Labor Input on Pasture-Based Dairy Farms Using a Smartphone. Journal of Dairy Science 2018, 101, 9527–9543. [Google Scholar] [CrossRef]
- Gleeson, D.; O’Brien, B.; O’Donovan, K. The Labour Input Associated with Calf Care on Irish Dairy Farms. Livestock Science 2008, 116, 82–89. [Google Scholar] [CrossRef]
- Tongwei, Q.; Luo, B.; Boris Choy, S.T.; Li, Y.; He, Q. Do Land Renting-in and Its Marketization Increase Labor Input in Agriculture? Evidence from Rural China. Land Use Policy 2020, 99, 104820. [Google Scholar] [CrossRef]
- Akçil, M.B.; Bayramoğlu, Z.; Ağizan, K.; Gökdoğan, O. Labor, Energy Use and Greenhouse Gas Emissions of Cherry Production in Türkiye. Applied Fruit Science 2025, 67. [Google Scholar] [CrossRef]
- Kubitza, C.; Krishna, V.V.; Klasen, S.; Kopp, T.; Nuryartono, N.; Qaim, M. Labor Displacement in Agriculture: Evidence from Oil Palm Expansion in Indonesia. Land Economics 2024, 100, 547–567. [Google Scholar] [CrossRef]
- Montt, G.; Luu, T. Does Conservation Agriculture Change Labour Requirements? Evidence of Sustainable Intensification in Sub-Saharan Africa. J Agricultural Economics 2020, 71, 556–580. [Google Scholar] [CrossRef]
- Thierfelder, C.; Matemba-Mutasa, R.; Bunderson, W.T.; Mutenje, M.; Nyagumbo, I.; Mupangwa, W. Evaluating Manual Conservation Agriculture Systems in Southern Africa. Agriculture, Ecosystems & Environment 2016, 222, 112–124. [Google Scholar] [CrossRef]
- Medrano-Galarza, C.; LeBlanc, S.J.; DeVries, T.J.; Jones-Bitton, A.; Rushen, J.; Marie De Passillé, A.; Endres, M.I.; Haley, D.B. Effect of Age of Introduction to an Automated Milk Feeder on Calf Learning and Performance and Labor Requirements. Journal of Dairy Science 2018, 101, 9371–9384. [Google Scholar] [CrossRef] [PubMed]
- Kalēja, S.; Lazdiņš, A.; Zimelis, A.; Spalva, G. Model for Cost Calculation and Sensitivity Analysis of Forest Operations. 2018, 769. [CrossRef]
- Dubeau, D.; LeBel, L.G.; Imbeau, D.; Auger, I. Impacts of Vegetation Abundance and Terrain Obstacles on Brushcutter Performance During Regeneration Release. Northern Journal of Applied Forestry 2012, 29, 173–181. [Google Scholar] [CrossRef]
- AREI. Latvijas lauku saimniecību uzskaites datu tīkls SUDAT (Latvian Farm Accountancy Data Network. Institute of Agricultural Resources and Economics (in Latvian)). Agroresursu un ekonomikas institūts, 2021. Available online: https://sudat.arei.lv/Login.aspx?ReturnUrl=%2f (accessed on 22 February 2025).
- LLKC. Bruto segumi (Gross Margins – in Latvian) 2021. Available online: https://arhivs.llkc.lv/lv/nozares/ekonomika/bruto-segumi (accessed on 20 May 2025).
- CSP. Use of agricultural area (thousand ha) 1990 – 2024. Available online: https://data.stat.gov.lv/pxweb/en/OSP_PUB/START__NOZ__LA__LAG/LAG010 (accessed on 17 May 2025).
- Eurostat. Agricultural Labor Input Statistics: Absolute Figures (1,000 Annual Work Units) – Statistics 2025. Available online. [CrossRef]
- LVM. Mežizstrādes pakalpojuma sniedzēju efektivitātes rādītāji 2024 (Efficiency indicators of logging service providers 2024 (in Latvian)). 2024. Available online: https://www.lvm.lv/images/lvm/biznesam/koksnes-produkti/razosana/mezizstrade/darba-razigums/forvarderu/mps_efektivitate_2024.pdf (accessed on 18 May 2025).
- CSP. Forest Regeneration (Ha) 2025. Available online: https://stat.gov.lv/en/statistics-themes/business-sectors/forestry/tables/mep082-forest-regeneration-ha (accessed on 22 May 2025).
- CSP. Afforestation (Ha) 2025. Available online: https://stat.gov.lv/en/statistics-themes/business-sectors/forestry/tables/mep042-afforestation-ha (accessed on 19 May 2025).
- CSP. Inventoried Forest Felling Areas and Stock Volume 2025. Available online: https://stat.gov.lv/en/statistics-themes/business-sectors/forestry/tables/mez012-inventoried-forest-felling-areas-and (accessed on 20 May 2025).
- CSP. Forest Land Area (Ha) 2025. Available online: https://data.stat.gov.lv/pxweb/en/OSP_PUB/START__NOZ__ME__MEP/MEP051/table/tableViewLayout1/ (accessed on 20 May 2025).
- CSP. National Accounts: Employment and Total Hours Worked by Kind of Activity, Detailed Breakdown (NACE 2.red.) 2024. Available online: https://stat.gov.lv/en/statistics-themes/economy/national-accounts/tables/ikp160-national-accounts-employment-and-total (accessed on 20 May 2025).
- Veipane, U.D.; Pilvere, I.; Lillemets, J.; Valujeva, K.; Nipers, A. Dataset for Land Use and Production Practices Shape Unequal Labour Demand in Agriculture and Forestry. 2025. Available online: https://dv.dataverse.lv/dataset.xhtml?persistentId=doi:10.71782/DATA/PFT36O (accessed on 28 August 2025). [CrossRef]
- Imai, K.; Gaiha, R.; Bresciani, F. The Labor Productivity Gap Between the Agricultural and Nonagricultural Sectors, and Poverty and Inequality Reduction in Asia. Asian Development Review 2019, 36, 112–135. [Google Scholar] [CrossRef]
- Valujeva, K.; Nipers, A.; Lupikis, A.; Schulte, R.P.O. Assessment of Soil Functions: An Example of Meeting Competing National and International Obligations by Harnessing Regional Differences. Front. Environ. Sci. 2020, 8. [Google Scholar] [CrossRef]
Figure 1.
Spatial distribution of agricultural labour intensity in Latvia in 2021, hours per 100 hectares [70].
Figure 1.
Spatial distribution of agricultural labour intensity in Latvia in 2021, hours per 100 hectares [70].
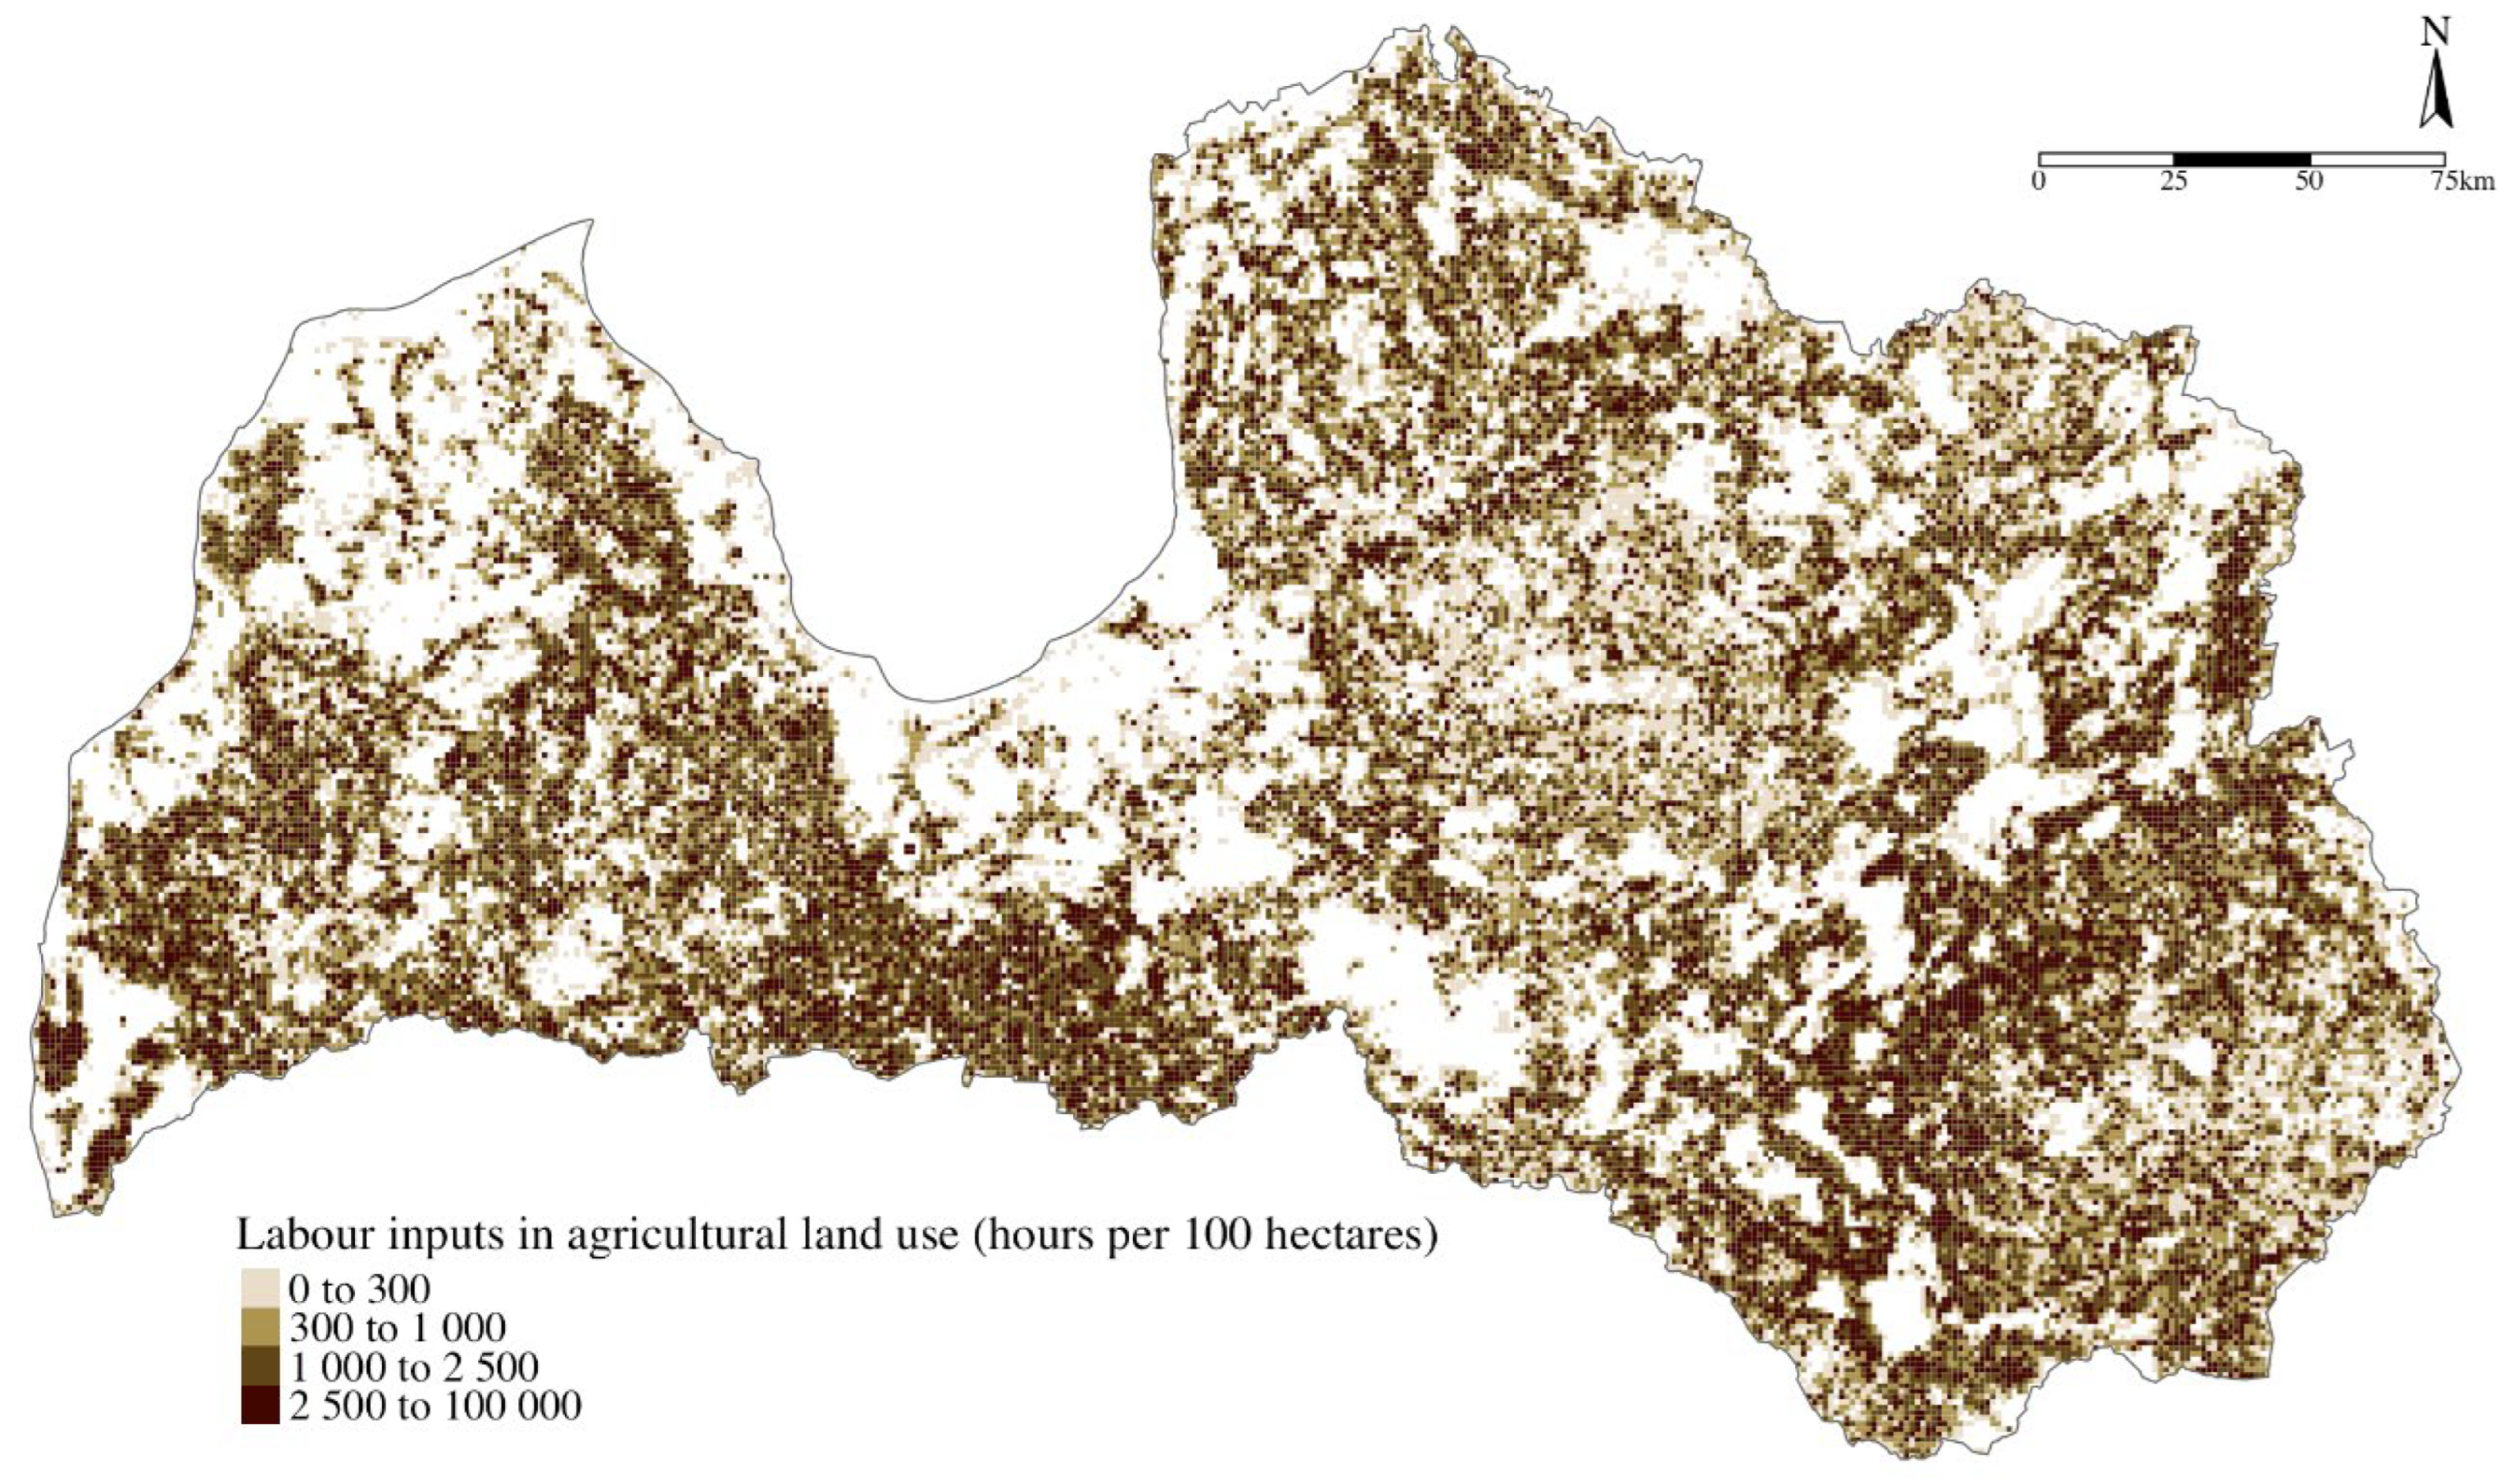
Figure 2.
Spatial distribution of forestry labour intensity in Latvia in 2024, hours per 100 hectares [70].
Figure 2.
Spatial distribution of forestry labour intensity in Latvia in 2024, hours per 100 hectares [70].
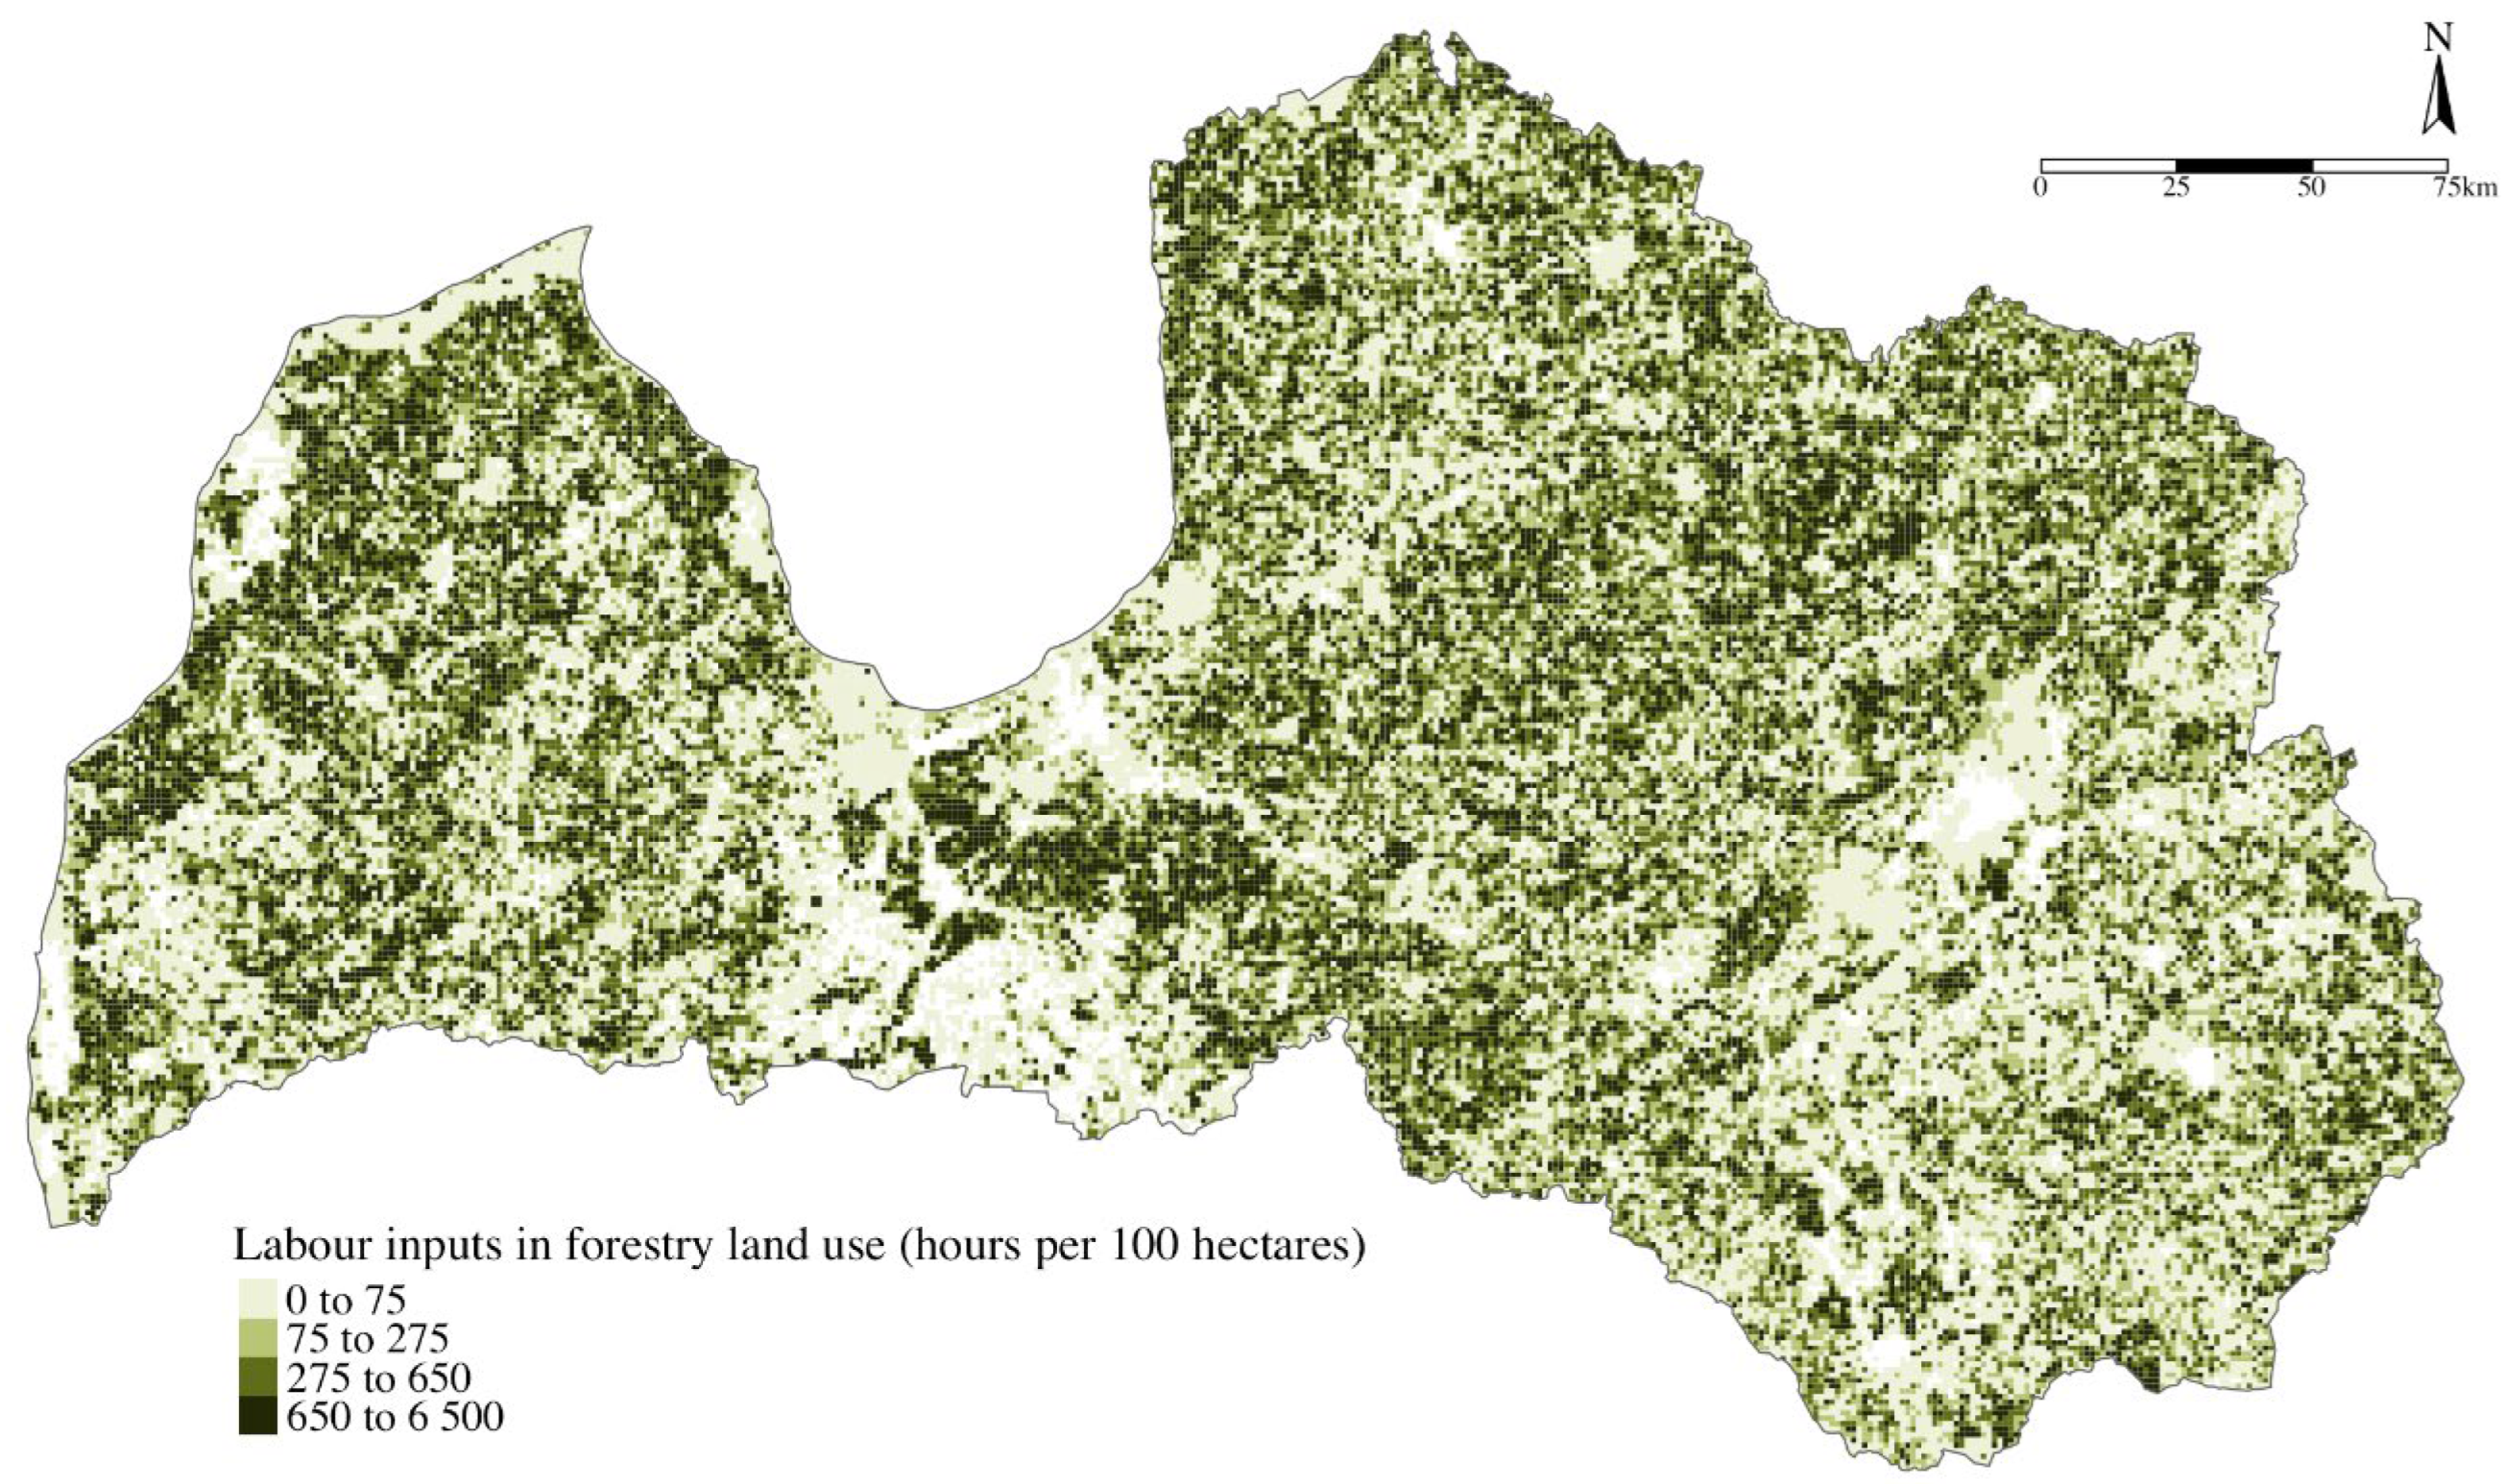
Table 1.
Average labour input (hours) per hectare or per grazing animal, and statistical output parameter estimates and significance levels in different agricultural sectors in Latvia in 2021*.
Table 1.
Average labour input (hours) per hectare or per grazing animal, and statistical output parameter estimates and significance levels in different agricultural sectors in Latvia in 2021*.
| Parameter | Estimate | Std. Error | t-value | Probability (>|t|) | Significance |
|---|---|---|---|---|---|
| Intercept | 1 128 | 103.1 | 10.938 | < 2e-16 | *** |
| Cereals, oilseeds, pulses | 12.42 | 0.3791 | 32.763 | < 2e-16 | *** |
| Vegetables and potatoes | 215.4 | 14.06 | 15.325 | < 2e-16 | *** |
| Perennial plantations | 234.2 | 19.10 | 12.258 | < 2e-16 | *** |
| Other crops | 54.89 | 6.51 | 8.431 | < 2e-16 | *** |
| Dairy cows | 87.04 | 3.079 | 28.265 | < 2e-16 | *** |
| Other grazing animals | 12.19 | 1.849 | 6.590 | 7,51e-11 | *** |
| Pigs | 3.46 | 0.07882 | 43.895 | < 2e-16 | *** |
| Poultry | 0.8394 | 0.0889 | 9.443 | < 2e-16 | *** |
* Significance codes: 0 ‘’ 0.001 ‘’ 0.01 ‘’ 0.05 ‘.’ 0.1 ‘’ 1. Residual standard error: 2 407 on 889 degrees of freedom. Multiple R-squared: 0.8676, adjusted R-squared: 0.8664. F-statistic: 728.1 on 8 and 889 DF, p-value: < 2.2e-16.
Table 2.
Average labour inputs in agricultural land use, categorised by farm size groups and the main crop and grazing animal groups in Latvia in 2021, hours per hectare or grazing animal.
Table 2.
Average labour inputs in agricultural land use, categorised by farm size groups and the main crop and grazing animal groups in Latvia in 2021, hours per hectare or grazing animal.
| Agricultural sector | Large farms | Medium farms | Small farms | Micro farms | Micro farms differ from large farms, times |
|---|---|---|---|---|---|
| Cereals, oilseeds, pulses | 15 | 20 | 32 | 63 | 4.2 |
| Vegetables and potatoes | 215 | 405 | 595 | 667 | 3.1 |
| Perennial plantations | 234 | 441 | 647 | 726 | 3.1 |
| Energy crops | 13 | 13 | 25 | 28 | 2.2 |
| Other crops | 55 | 103 | 152 | 301 | 5.5 |
| Fallow land | 7 | 8 | 16 | 28 | 4.0 |
| Grasslands | 16 | 30 | 44 | 88 | 5.5 |
| Meadows and pastures | 3 | 6 | 9 | 18 | 6.0 |
| Dairy cows (with calves) | 87 | 106 | 196 | 387 | 4.4 |
| Other grazing animals | 24 | 32 | 55 | 65 | 2.7 |
| Sheep | 9 | 9 | 18 | 45 | 5.0 |
| Goats | 42 | 42 | 72 | 203 | 4.8 |
| Horses | 17 | 17 | 29 | 82 | 4.8 |
| Pigs | 3.5 | 20 | 60 | 119 | 34.0 |
| Poultry | 0.8 | 0.8 | 2.3 | 4 | 5.0 |
Table 3.
Average labour inputs in forestry land use categorised by silvicultural operations and the dominant tree species in Latvia in 2024, hours per hectare.
Table 3.
Average labour inputs in forestry land use categorised by silvicultural operations and the dominant tree species in Latvia in 2024, hours per hectare.
| Dominant tree species | Soil preparation | Planting | Forest protection | Forest replenishment | Tending | Young stand tending | Underbrush tending | Maintenance of amelioration systems |
|---|---|---|---|---|---|---|---|---|
| Pine | 20.3 | 24 | 13.5 | 22 | 23 | 23 | 25 | 13 |
| Spruce | 20.3 | 24 | 13.5 | 22 | 23 | 23 | 25 | 13 |
| Birch | 20.3 | 24 | 13.5 | 0 | 23 | 23 | 25 | 13 |
| Black alder | 20.3 | 24 | 0 | 22 | 23 | 23 | 25 | 13 |
| Aspen | 0 | 0 | 0 | 0 | 23 | 23 | 25 | 13 |
| Grey alder | 0 | 0 | 0 | 0 | 23 | 23 | 25 | 13 |
| Other | 20.3 | 24 | 13.5 | 22 | 23 | 23 | 25 | 13 |
Table 4.
The average capacity of logging equipment, depending on logging activity in Latvia in 2024, m3 per hour.
Table 4.
The average capacity of logging equipment, depending on logging activity in Latvia in 2024, m3 per hour.
| Logging activity | Harvester | Chainsaw | Forwarder | Timber lorry |
|---|---|---|---|---|
| Maintenance felling | 7.9 | 0.9 | 5.8 | 18 |
| Main felling | 18.7 | 0.9 | 12.2 | 18 |
| Other types of felling | 18.7 | 0.9 | 12.2 | 18 |
Disclaimer/Publisher’s Note: The statements, opinions and data contained in all publications are solely those of the individual author(s) and contributor(s) and not of MDPI and/or the editor(s). MDPI and/or the editor(s) disclaim responsibility for any injury to people or property resulting from any ideas, methods, instructions or products referred to in the content. |
© 2025 by the authors. Licensee MDPI, Basel, Switzerland. This article is an open access article distributed under the terms and conditions of the Creative Commons Attribution (CC BY) license (http://creativecommons.org/licenses/by/4.0/).
Copyright: This open access article is published under a Creative Commons CC BY 4.0 license, which permit the free download, distribution, and reuse, provided that the author and preprint are cited in any reuse.


