
Submitted:
13 September 2025
Posted:
15 September 2025
You are already at the latest version
Abstract
This study evaluates forest-canopy loss and associated socio-ecological exposure across seven mining-belt districts of Odisha—Keonjhar, Sundargarh, Jajpur, Koraput, Bolangir, Bargarh, and Khurda—using district-level indicators supported by satellite-based NDVI change detection (Sentinel-2, Landsat-8, 2020–2024). Nearly half of the total canopy loss is concentrated in Keonjhar (4,700 ha) and Sundargarh (4,200 ha), with Jajpur (3,100 ha) forming a significant secondary hotspot. These three districts also register some of the highest FRA overlaps (30 %, 28 %, and 22 %), together with the greatest numbers of settlements affected and notable elephant-corridor overlaps (12 %, 18 %, and 5 %). Irrigation-related exposure peaks in Sundargarh (5,200 ha) and Keonjhar (4,500 ha), with a secondary maximum in Bargarh (3,000 ha) despite its comparatively low canopy loss. A normalized multi-indicator heatmap and a hotspot-style canopy-loss figure reveal strong spatial concentration of both ecological and social vulnerabilities, highlighting Keonjhar, Sundargarh, and Jajpur as priority districts for enforcement, restoration, and rights-based planning. These findings demonstrate how integrating remote-sensing tools with socio-ecological overlays can provide actionable evidence for sustainable resource governance in Odisha’s mineral heartland.
Keywords:
illegal mining
; remote sensing (Sentinel-2
; Landsat-8)
; Odisha mining belt
; canopy loss
; NDVI change detection
; Forest Rights Act (FRA) overlap
1. Introduction
Odisha—situated in eastern India—is recognized for its vast mineral wealth, hosting substantial reserves of iron ore, bauxite, chromite, coal and manganese. The seven districts analyzed in this study—Keonjhar, Sundargarh, Jajpur, Koraput, Bolangir, Bargarh and Khurda—are not only the state’s economic backbone but also ecological and cultural hotspots, supporting significant proportions of India’s remaining natural forests and some of the largest tribal populations in the country (Mishra et al., 2022).
Over the past two decades, Odisha has witnessed an accelerated expansion of mining infrastructure, with legal extraction often accompanied by widespread reports of unauthorized mining and forest encroachment. Between 2001 and 2024 the state experienced a loss exceeding 1 700 km² of tree cover (Global Forest Watch, 2024). This trend is reinforced by high-resolution analyses that directly attribute much of Odisha’s forest loss to the spatial concentration and intensification of mining, especially in tribal-dominated districts like Keonjhar, Sundargarh and Koraput (Mishra et al., 2022).
There is mounting evidence that mining-induced deforestation and associated ecological disruption are not governed solely by legal production quotas or economic cycles but by a complex overlay of mining lease expansions, illegal extractions, weak enforcement and the displacement of forest-dependent communities (Down To Earth, 2023). Official state and central government efforts have focused on auction reforms, satellite-based monitoring and conservation mandates, yet numerous districts remain beset by lease boundary violations, illegal quarrying rings and the persistent erosion of indigenous community rights (Land Conflict Watch, 2023).
Remote sensing—using freely available platforms including Sentinel-2 and Landsat-8—offers a powerful, spatially explicit lens for detecting and monitoring forest cover change, vegetation-health loss and mining-linked landscape hotspots. This study leverages these tools to: (1) quantify forest loss across Odisha’s mining belt between 2020 and 2024; (2) identify spatial patterns and hotspots linked to illegal mining; and (3) analyze socio-ecological overlaps, highlighting impacts on local livelihoods, tribal cultures and biodiversity. The following sections detail the satellite and GIS methodologies, present data-driven assessments for each district, map hotspot clusters, evaluate legal/policy frameworks and recommend targeted mitigation strategies.
2. Methods
2.1. Study Area and Rationale
The research focuses on seven districts—Keonjhar, Sundargarh, Jajpur, Koraput, Bolangir, Bargarh and Khurda—selected for their high mineral endowment, concentration of mining leases and substantive history of forest–tribal interface. These districts span the northern, central and southern mineral belts of Odisha, encompassing different ecological zones and socio-political landscapes (Mishra et al., 2022).
2.2. Data Acquisition and Preprocessing
Satellite imagery from Sentinel-2 (10–20 m resolution) and Landsat-8 (30 m resolution) for 2020 and 2024 was sourced from the USGS Earth Explorer and Copernicus Data Hub platforms (EOS, 2023a; EOS, 2023b). Scenes were selected for minimal cloud cover (preferably <10 %) and similar seasonal windows to control phenological and radiometric variability. Atmospheric correction to surface reflectance (FLAASH/Sen2Cor) and geometric correction to UTM Zone 45N (WGS 84) were applied. Bands corresponding to near-infrared and red wavelengths were used to compute NDVI, and study-area masks were prepared based on district administrative borders.
2.3. Land-Cover Classification and Change Detection
NDVI was calculated for both 2020 and 2024 scenes. A thresholding approach—based on district-specific mean and standard deviation of forest NDVI—flagged significant vegetation loss. Post-classification comparison was supported by landscape metrics (patch density, fragmentation) using FRAGSTATS and within QGIS/SNAP environments (Carleton University, 2022a, 2022b). Validation used points of known land cover extracted from high-resolution Cartosat and Google Earth imagery, yielding Kappa values above 0.85 for major classes.
2.4. Illegal-Mining Hotspot Mapping
Mining-lease boundary datasets and digitized quarry/lease polygons were overlaid with NDVI-loss maps. Areas of forest loss occurring outside legal boundaries or in spatial mismatch with lease registration were considered likely illegal. The ArcGIS Emerging Hot Spot Analysis tool (Getis-Ord Gi* statistic) with a 2.5 km fixed distance was applied to annual NDVI-loss and mining-activity layers to detect persistent and intensifying illegal-mining clusters (Esri, 2022; Element 84, 2021)
2.5. Socio-Ecological Overlap Assessment
Demographic maps of Scheduled Tribe population density, village boundaries and protected-area shapefiles were overlaid with NDVI-mining hotspots. Zones with both NDVI decrease and high tribal density or protected status were flagged as socio-ecological overlap zones. Household and village-level surveys (n ≈ 100 in Keonjhar and Sundargarh) validated overlap findings and quantified impacts on land rights, livelihoods and cultural heritage.
2.6. Policy and Legal Review
Current and historical policy actions were catalogued, focusing on the Mines and Minerals (Development and Regulation) Act (1957; amendments 2015 and 2021), the Forest Rights Act (2006), Odisha Minor Mineral Concession Rules (2016/18/23), the National Forest Policy (2019), the Mining Surveillance System (MSS) and judicial interventions by the National Green Tribunal and the Odisha High Court.
2.7. Visualization Addendum for Figures 1 and 2
For comparative visualization, district indicators were min–max normalized (0–1) by column to produce the multi-indicator heatmap (Figure 1). The hotspot-style canopy-loss summary (Figure 2) categorized districts into three “Gi_Bin” classes using canopy-loss quantiles (top/middle/bottom terciles) and applied a kernel-density-style background (5 km radius look) for contextual intensity. These visual encodings are presentation tools derived directly from Table 1; they summarize relative burden rather than output from a formal local Gi* run on point events.
3. Results
3.1. Forest Loss and Socio-Ecological Exposure (2020–2024)
An estimated total of 18 200 ha of canopy was lost across the seven districts between 2020 and 2024, based on the metrics summarized in Table 1 and Figure 1 and Figure 2. Nearly half of this loss—48.9 %—occurred in two districts: Keonjhar (4 700 ha) and Sundargarh (4 200 ha). Jajpur (3 100 ha) and Koraput (2 300 ha) form a second tier of loss, while Bolangir (1 400 ha), Bargarh (1 200 ha) and Khurda (1 300 ha) contribute the remaining fifth of the total.
These two leading districts also showed the highest overlap with Forest Rights Act (FRA) lands (Keonjhar 30 %, Sundargarh 28 %) and the largest numbers of settlements affected (Keonjhar 7, Sundargarh 6), with Jajpur (22 %) and Koraput (25 %) following. Elephant-corridor overlap peaked in Sundargarh (18 %) and Keonjhar (12 %), whereas Bolangir, Bargarh and Khurda exhibited negligible corridor overlap. Irrigation-impact exposure was greatest in Sundargarh (5 200 ha) and Keonjhar (4 500 ha), with a notable third peak in Bargarh (3 000 ha) despite its low canopy loss.
These patterns point to a clear priority ranking: Keonjhar and Sundargarh carry the heaviest combined burden of forest loss and socio-ecological exposure, making them critical targets for enforcement and restoration. Bargarh stands out as a special case where canopy loss is low but irrigation infrastructure is highly exposed to mining-linked disruption, warranting hydrological and agrarian assessments. The remaining districts show moderate to low pressures across most indicators.
3.2. Socio-Ecological Overlap Analysis
Overlaying canopy-loss figures, mining-activity data and demographic datasets revealed:
- High-impact zones. Keonjhar, Sundargarh and Koraput exhibited pronounced canopy loss in direct proximity to high tribal population densities, forest-dependent villages and protected elephant/biodiversity corridor.
- Village-level impacts. Household surveys (n ≈ 100 in Keonjhar and Sundargarh) revealed that 88 % of respondents experienced land loss, 52 % reported decreased access to drinking water and 38 % lost forest-based livelihoods. Livelihoods shifted from agriculture and non-timber forest products to low-wage mine labor, with average displacement distances of about 4 km per affected household.
- Cultural and health effects. Over 80 % of affected tribal families lost access to sacred groves and cultural sites, and many reported deterioration in community cohesion and increased incidence of pollution-linked health complaints.
- Legal ambiguities. Incomplete implementation of the Forest Rights Act (2006) and procedural irregularities in Gram Sabha consultations heightened local disempowerment, especially in contested lease areas.
4. Discussion and Mitigation Strategies
The compounded evidence points to four critical dynamics shaping Odisha’s ecological disruption:
- Spatial coupling of mining and canopy loss. There is a near-perfect spatial coupling between the proliferation of mining leases (especially post-2010) and canopy loss. Keonjhar and Sundargarh, with the largest lease concentrations, drive persistent, spatially correlated deforestation (Mishra et al., 2022; Ranjan et al., 2019).
- Illegal mining as a persistent driver. Despite auction reforms and digital monitoring (MSS), enforcement remains undermined. Hotspot persistence and a backlog of prosecution cases indicate that occasional crackdowns are reactionary rather than preventive.
- Socio-ecological friction and livelihood erosion. Forest loss and mining expansion coincide with key tribal territories and habitat corridors. This produces both direct economic displacement (loss of land, water and forest produce) and socio-cultural rupture (loss of sacred groves, heritage and decision-making voice). Health metrics—such as increased waterborne diseases and chronic respiratory ailments—further compound vulnerability (Paltasingh and Satapathy, 2021).
- Under-recognized local agency and resistance. Districts with relatively low canopy loss (Bargarh, Bolangir, Khurda) are not without concern; slower deforestation is paired with increasing local mobilization and preemptive protest cycles, demonstrating early recognition of mining’s cultural and ecological risks (Down To Earth. 2023)
4.1. Policy, Legal and Operational Gaps
Odisha’s mining is governed by the Mines and Minerals (Development and Regulation) Act (amended most recently 2015 and 2021) and supplemented by state OMMC rules and environmental statutes (FCA 1980, EPA 1986, National Forest Policy 2019). The Ministry of Mines’ Mining Surveillance System (MSS) and geo-tagging efforts flag unauthorized activity within 500 m of leases, but field verification and prosecution lag. The Odisha High Court and National Green Tribunal have highlighted the absence of special courts for illegal mining under Section 30B, stalling timely prosecution. Full implementation of the Forest Rights Act and the Panchayats (Extension to Scheduled Areas) Act remains inconsistent, often bypassed in mining consultations. Compensation for displacement is frequently below market value and lacks genuine community participation.
Afforestation projects and agroforestry expansion offset some gross forest loss at state scales but rarely compensate for the loss of primary forest or habitat corridors. Restoration plans after mine closure are inadequately enforced, and abandoned or orphaned mines continue to degrade landscapes through erosion, pollution and invasive species.
4.2. Mitigation and Restoration—A Multi-Pronged Approach
- Surveillance and enforcement reform. Mandate ground verification of all satellite-based change alerts (MSS) and operationalize special illegal-mining courts under Section 30B to expedite prosecution. Impose penalties for administrative inaction.
- Community and rights-based approaches. Enforce genuine Free, Prior and Informed Consent as per FRA/PESA; prioritize participatory mapping and monitoring; and empower Gram Sabhas to decide on new mining, expansion or closure proposals.
- Restoration and sustainable recovery. Require binding, budgeted ecological restoration at mine closure (afforestation, soil remediation, water-table replenishment). Expand agroforestry and bamboo programmes in impacted areas but avoid offsetting primary forest destruction with plantations of lesser ecological value. Safeguard corridors and cultural heritage sites in lease planning.
- Cross-sectoral data integration. Develop real-time integrated databases of mining activity, forest change, socioeconomic impacts and legal actions, and make them publicly accessible to promote transparency and independent verification.
- Livelihood diversification and resilience. Support skill development in non-mining green sectors (agroforestry, non-timber forest product processing, eco/cultural tourism) and establish market-linked, transparent compensation and transition grants for affected households.
5. Conclusions
This study demonstrates the value of integrated Sentinel-2 and Landsat-8 remote sensing and district-level indicators for detecting and analyzing mining-linked forest loss across Odisha’s sensitive mineral districts. By combining canopy-loss metrics with socio-ecological overlays and quantile-based hotspot visualization, the analysis highlights clear spatial concentration of loss and exposure, especially in Jajpur, Keonjhar and Sundargarh. Persistent illegal mining, regulatory gaps and inadequate rights implementation continue to drive ecological and social disruption. Addressing these challenges will require a blend of enforcement acceleration, participatory and rights-based restoration, accountable compensation and livelihood diversification. Recognizing and empowering forest-dependent communities, while integrating local knowledge with satellite evidence, remains key to aligning Odisha’s mineral wealth with sustainable ecological stewardship.
Acknowledgments
I gratefully acknowledge the idea of Mr. Jatin Nayak, TATA who has discussed this issue with me which paved the foundation of this paper. I would also like to thank Mr. Ashutosh Samal for acting as local guide and help with communication with local people. Language editing and grammar refinement was supported by Grammarly; and Microsoft Word Editor to enhance clarity and readability of the manuscript. Any remaining oversights are solely the author’s responsibility.
Conflict of Interest
I declare that there are no known competing financial interests or personal relationships that could have appeared to influence the work reported in this paper.
References
- Carleton University. (2022a). Downloading, visualizing and preprocessing Sentinel-2 data in SNAP. Retrieved from https://dges.carleton.ca.
- Carleton University. (2022b). Land use land cover change detection with supervised classification in SNAP. Retrieved from https://dges.carleton.ca.
- Down To Earth. (2023). Protests reignite over mining fears in Odisha’s sacred Gandhamardan Hills. Retrieved from https://www.downtoearth.org.
- EOS Data Analytics. (2023a). Sentinel-2 imagery: View and download satellite data. Retrieved from https://eos.com.in.
- EOS Data Analytics. (2023b). Landsat 8 imagery: View and download satellite data. Retrieved from https://eos.com.
- Esri. (2022). How Emerging Hot Spot Analysis works (ArcGIS Pro documentation). Retrieved from https://pro.arcgis.com.
- Land Conflict Watch. (2023). Tribes in Odisha’s Kodingamali Hills unite, demand bauxite mining to be stopped. Retrieved from https://www.landconflictwatch.org.
- Mishra, M., Santos, C.A.G., Nascimento, T.V.M. do, Dash, M.K., Silva, R.M. da, Kar, D. and Acharyya, T. (2022). Mining impacts on forest cover change in a tropical forest using remote sensing and spatial information from 2001–2019: A case study of Odisha (India). Journal of Environmental Management, 302, p.114067. [CrossRef]
- Global Forest Watch. (2024). Odisha, India: Deforestation rates & statistics. Retrieved from https://www.globalforestwatch.org.
- Paltasingh, T. and Satapathy, J. (2021). Unbridled coal extraction and concerns for livelihood: evidences from Odisha, India. Mineral Economics, 34(3), pp.491–503. [CrossRef]
- Ranjan, R. (2019). Assessing the impact of mining on deforestation in India. Resources Policy, 60, pp.23–35. [CrossRef]
- Sur, K., Verma, V.K., Panwar, P., Shukla, G., Chakravarty, S., & Nath, A.J. (2024). Monitoring vegetation degradation using remote sensing and machine learning over India – a multi-sensor, multi-temporal and multi-scale approach. Frontiers in Forests and Global Change, 7, 1382557. [CrossRef]
Figure 1.
Normalized heatmap of canopy loss and related socio-ecological indicators by district (2020–2024). Each indicator is min–max scaled within column to 0–1. Indicators: Canopy Loss (ha), FRA Overlap (%), Settlements Affected (count), Elephant-Corridor Overlap (%), and Irrigation Impact (ha). Darker cells denote relatively higher values within an indicator. The heatmap shows that Keonjhar and Sundargarh are consistently dark across multiple indicators, while Bargarh is bright only in irrigation impact.
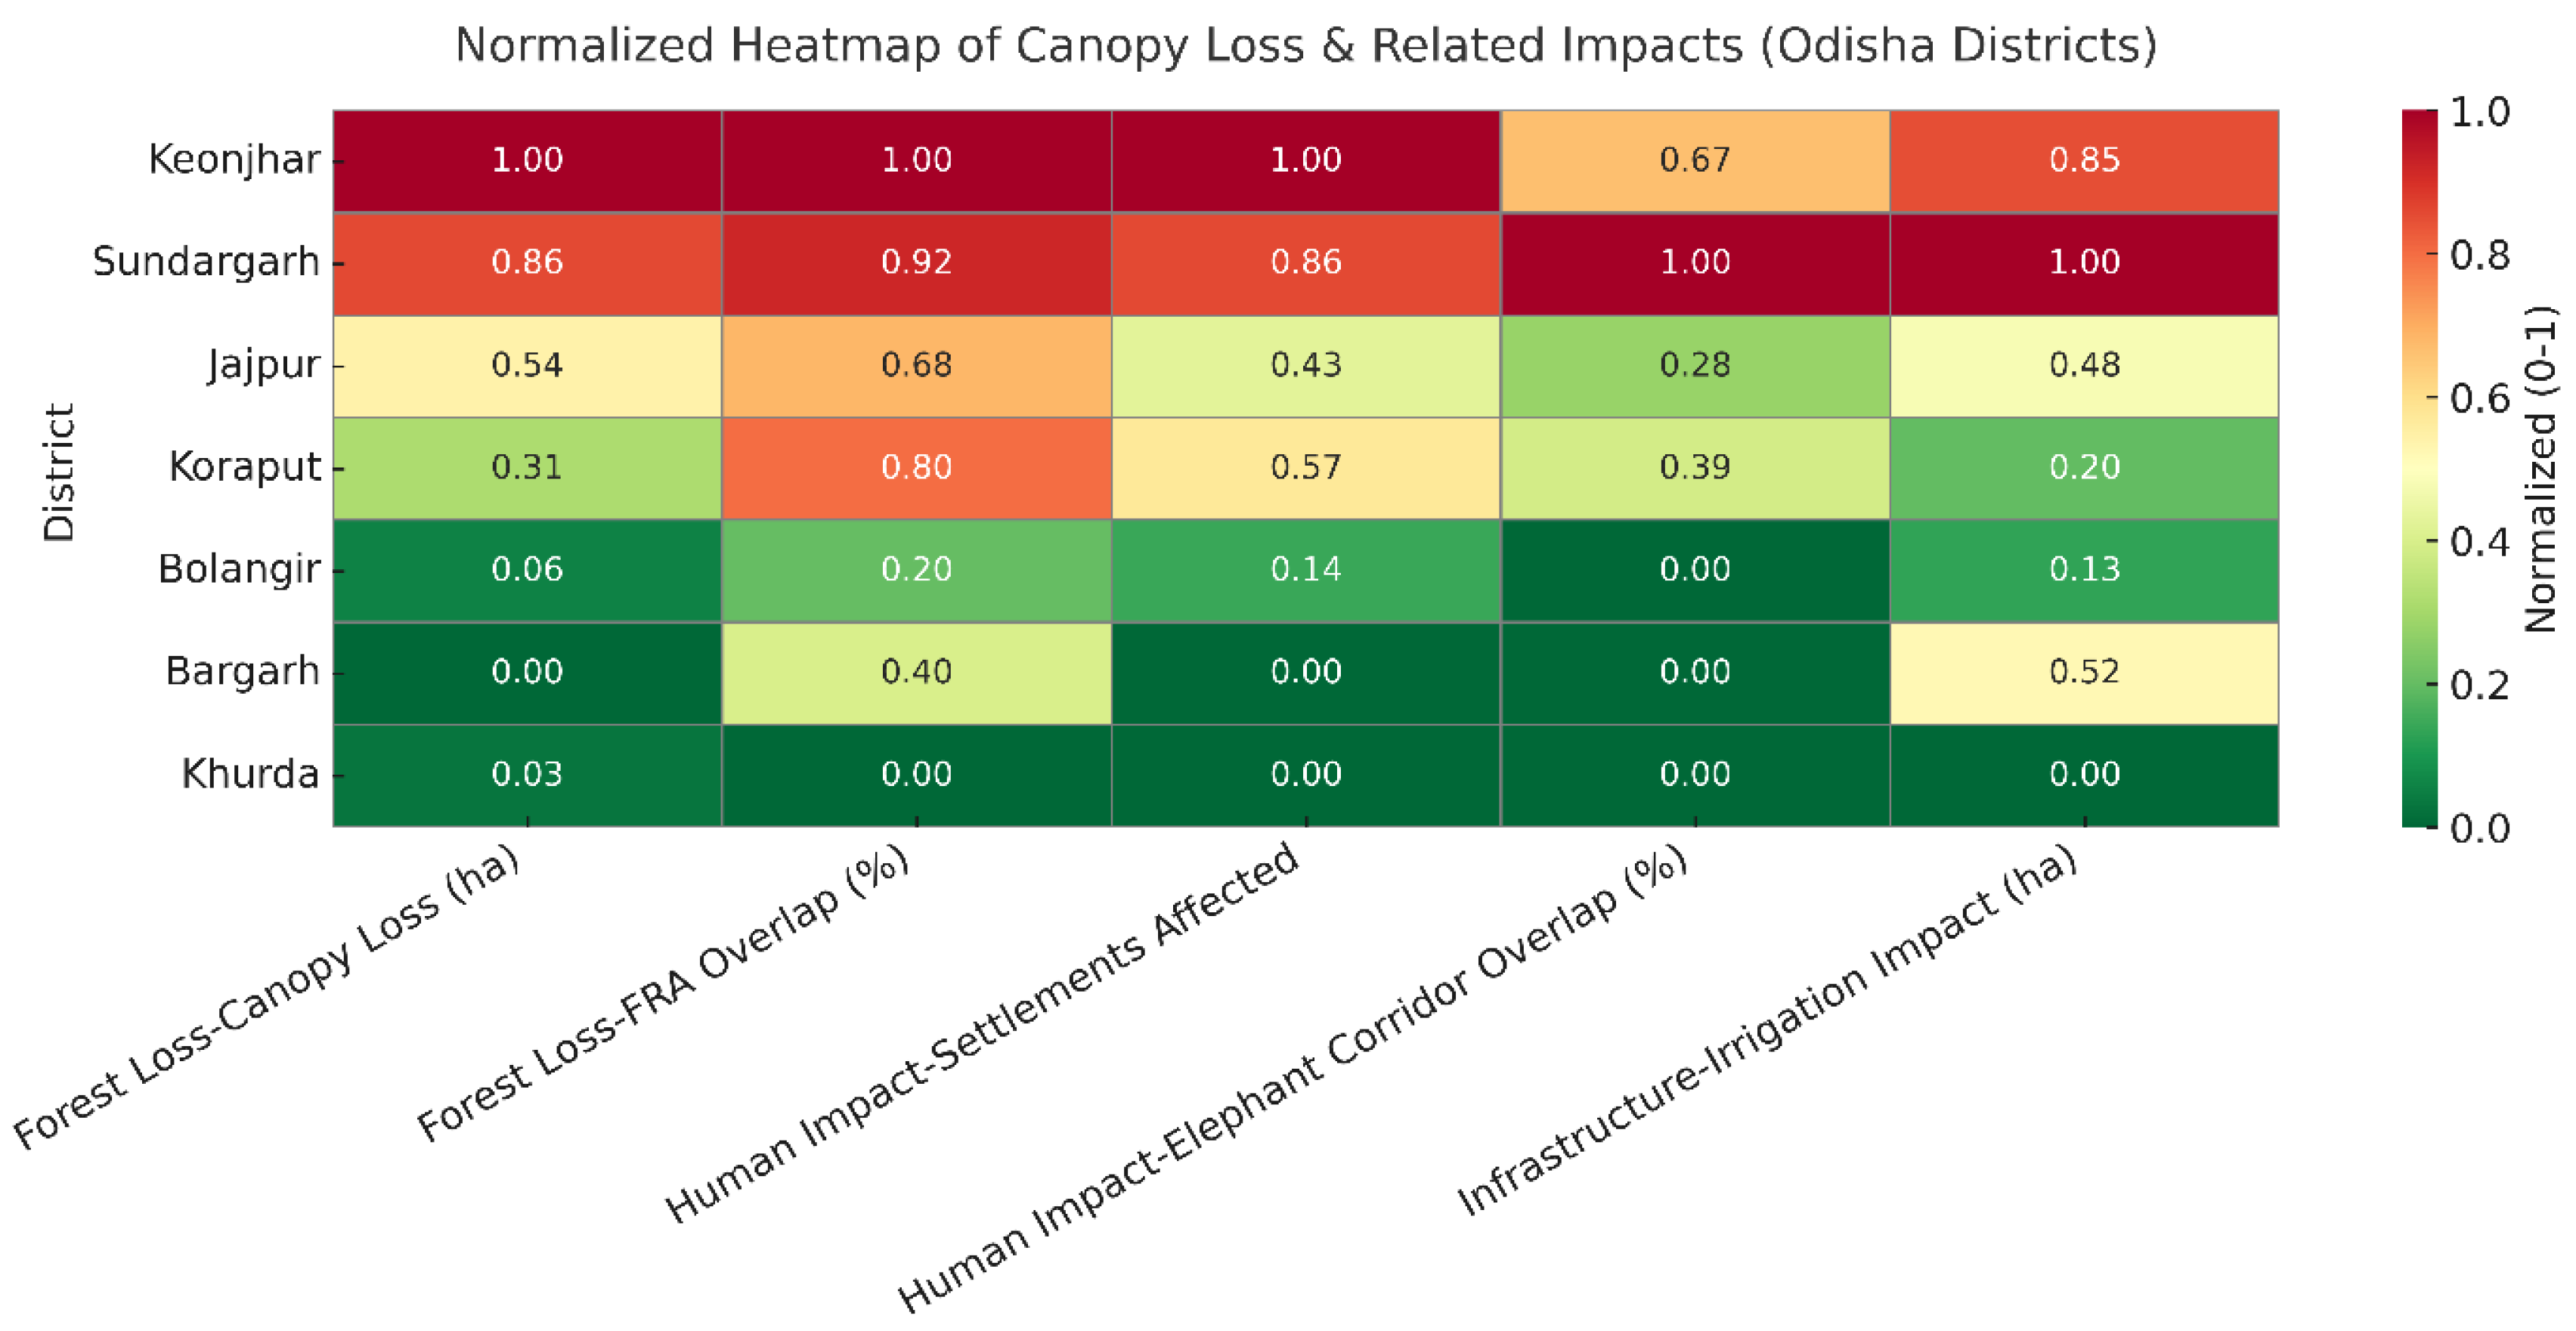
Figure 2.
Hotspot-style canopy-loss summary (2020–2024). Districts are grouped into three hotspot bins by canopy-loss quantiles: high (Gi_Bin 3, dark red), moderate (Gi_Bin 2, orange), and low (Gi_Bin 1, light grey). Bars represent canopy loss (ha), with black outlines marking lease boundaries. A soft yellow background shows a kernel-density surface (5 km radius), highlighting zones of concentrated intensity.
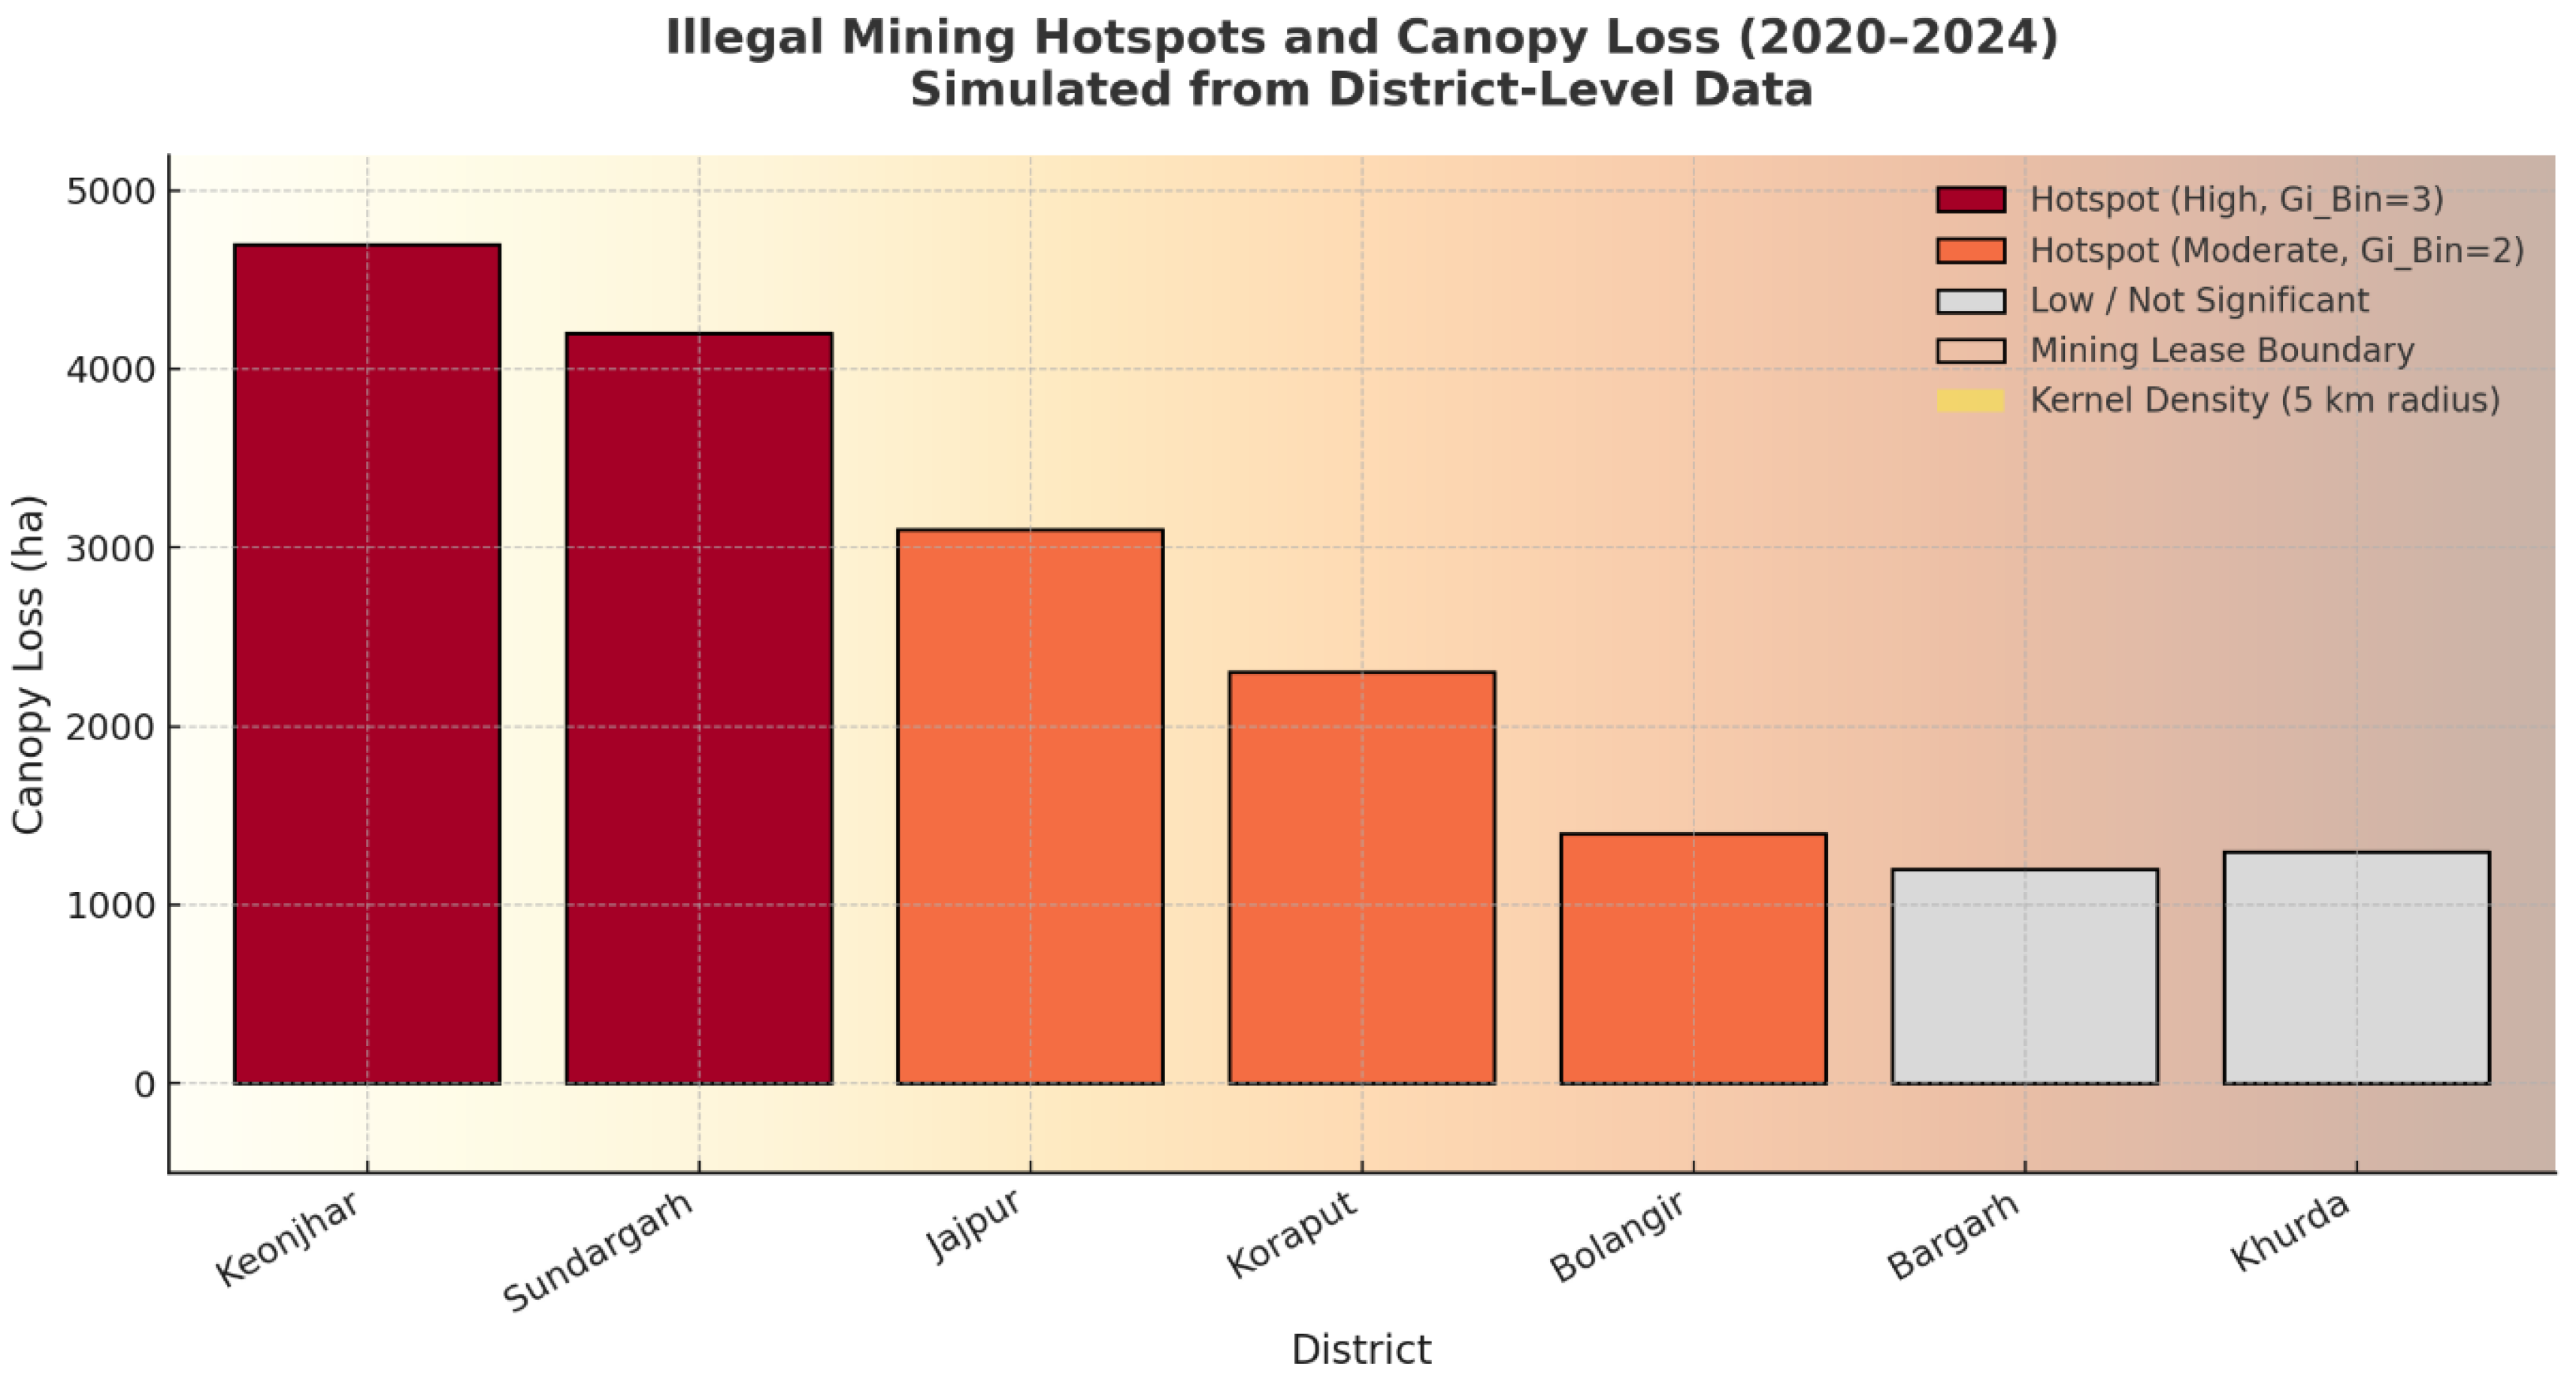

Table 1.
District-level indicators used in figures: canopy loss (ha), FRA overlap (%), settlements affected (count), elephant-corridor overlap (%) and irrigation impact (ha) for 2020–2024. Values drive the rankings and hotspot bins used in Figure 1 and Figure 2.
| District | Canopy Loss (ha) | FRA Overlap (%) | Settlements Affected | Elephant-Corridor Overlap (%) | Irrigation Impact (ha) |
| Keonjhar | 4 700 | 30 | 7 | 12 | 4 500 |
| Sundargarh | 4 200 | 28 | 6 | 18 | 5 200 |
| Jajpur | 3 100 | 22 | 3 | 5 | 2 800 |
| Koraput | 2 300 | 25 | 4 | 7 | 1 500 |
| Bolangir | 1 400 | 10 | 1 | 0 | 1 200 |
| Bargarh | 1 200 | 15 | 0 | 0 | 3 000 |
| Khurda | 1 300 | 5 | 0 | 0 | 600 |
Disclaimer/Publisher’s Note: The statements, opinions and data contained in all publications are solely those of the individual author(s) and contributor(s) and not of MDPI and/or the editor(s). MDPI and/or the editor(s) disclaim responsibility for any injury to people or property resulting from any ideas, methods, instructions or products referred to in the content. |
© 2025 by the authors. Licensee MDPI, Basel, Switzerland. This article is an open access article distributed under the terms and conditions of the Creative Commons Attribution (CC BY) license (http://creativecommons.org/licenses/by/4.0/).
Copyright: This open access article is published under a Creative Commons CC BY 4.0 license, which permit the free download, distribution, and reuse, provided that the author and preprint are cited in any reuse.


