Submitted:
12 September 2025
Posted:
15 September 2025
You are already at the latest version
Abstract
Microalgae are valuable marine resources with bioactive compounds that can be used for health and industrial applications. This study investigated the optimisation of extraction methods and antioxidant properties of Dunaliella salina and Spirulina platensis to explore their potential as sources of natural compounds for cosmetic use. Extraction was performed using aqueous, methanol, and ethanol solvents, with methanol yielding the highest recovery in D. salina (21.67% ± 0.58) and aqueous extraction being most effective for S. platensis (24.00% ± 0.50). Phytochemical analysis revealed solvent-dependent variation, as methanolic D. salina extracts showed maximum phenolic content (32.15 ± 2.05 mg GAE/g DW), while aqueous extracts contained the highest flavonoids (94.90 ± 0.90 mg QE/g DW). In S. platensis, aqueous extracts exhibited superior phenolic (70.99 ± 1.03 mg GAE/g DW) and flavonoid content (65.39 ± 2.68 mg QE/g DW). Antioxidant capacity assessed by ABTS, DPPH, and FRAP assays confirmed strong radical scavenging and reducing activities, with methanolic S. platensis showing the highest ABTS activity (IC50 = 113.44 µg/mL) and aqueous extracts demonstrating the strongest reducing power (FRAPIC50 = 138.08 µg/mL). Molecular docking revealed strong binding of key phytochemicals with Keap1 protein, suggesting a role in oxidative stress modulation. These findings highlight the potential of D. salina and S. platensis as marine-derived sources of natural antioxidants for biotechnological and cosmetic applications.
Keywords:
microalgae
; Dunaliella salina
; Spirulina platensis
; total phenolic content (TPC)
; total flavonoid content (TFC)
; antioxidant activity
; molecular docking
; cosmetic applications
1. Introduction
The global market's shift towards natural and sustainable products has driven up demand for marine-derived bioactive components in cosmetic formulations [1,2]. Marine microalgae are particularly valuable resources because of their high metabolic diversity and capacity to produce a wide range of beneficial compounds, such as antioxidants, anti-inflammatory agents, and UV-protective substances [3,4]. Among the thousands of microalgal species, Dunaliella salina and Spirulina platensis are of particular interest due to their well-documented nutritional and pharmacological properties [5,6]. D. salina is a halophilic microalga known for its high β-carotene content, which accumulates during stress circumstances. This potent carotenoid is a crucial antioxidant that protects skin from oxidative damage and photoaging, making it a popular ingredient in anti-aging and sun-care products [5,6,7]. Similarly, the cyanobacterium S. platensis is well-known for its high-quality proteins, vitamins, and phycobiliproteins, with multiple studies emphasising its phenolic compounds and flavonoids for their antioxidant and skin-rejuvenating properties [2,4].
The potential of these microalgae is well established; however, the scientific literature reveals several gaps that restrict their complete commercial and therapeutic application. Contemporary studies frequently emphasise general characterisation, failing to adopt a systematic method for optimising the extraction of target compounds. Conventional solvent extractions are foundational but often inefficient and lacking in selectivity, indicating a necessity for improved techniques that enhance yields while preserving compound stability [8,9]. Moreover, although the antioxidant activity of these microalgal extracts is extensively documented [9,10], a comprehensive understanding of their underlying mechanisms is frequently lacking. Connecting observed biological activity to specific molecular interactions offers important insights into efficacy and informs the development of more effective formulations.
This study employs three key methodologies to conduct a comprehensive analysis of D. salina and S. platensis extracts, thereby addressing existing gaps in the literature. A comparative analysis of various solvent systems was performed to determine the most effective extraction methods for optimising bioactive compound yield. Secondly, a series of in vitro antioxidant assays, including 2, 2-diphenyl-1-picrylhydrazyl (DPPH), 2, 2’-Azino-bis (3-ethylbenzothiazoline-6-sulfonic acid) (ABTS), and Ferric reducing antioxidant power (FRAP), were conducted to quantitatively assess the radical scavenging and reducing capacities of the extracts. Molecular docking studies were employed to understand the mechanistic basis of antioxidant effects by predicting the binding affinities of key phytochemicals with the Keap1 protein, a principal regulator of the cellular antioxidant response [11,12].
These findings contribute to the growing body of knowledge on marine-derived compounds and their potential as natural antioxidants for cosmetic and biotechnological applications. By providing a structured, data-driven approach, this research not only validates the potential of D. salina and S. platensis but also provides a path for developing effective and environmentally sustainable cosmetic products that meet the evolving demands of the consumer market.
2. Results and Discussion
2.1. Extraction Yields and Solvent-Dependent Efficiency
The quantitative assessment of extraction yields from Dunaliella salina and Spirulina platensis using aqueous, methanol, and ethanol solvents provided significant insights into their respective biochemical profiles (Table 1). Methanol proved to be the most effective solvent for D. salina, yielding the highest result of 21.67% ± 0.58. This suggests that D. salina is rich in methanol-soluble compounds, such as carotenoids and other non-polar antioxidants, which are vital for mitigating oxidative stress in cosmetic formulations [13,14]. In contrast, aqueous extraction yielded 18.84% ± 0.86, while ethanol extraction resulted in the lowest yield at 15.54% ± 0.54. Conversely, aqueous extraction was the most effective method for S. platensis, yielding the highest result of 24.00% ± 0.50. This indicates a high concentration of water-soluble compounds, such as polysaccharides and hydrophilic proteins, which are advantageous for skin hydration and soothing properties in cosmetic applications [15,16]. Methanol extraction of S. platensis was less efficient at 14.50% ± 0.58, and ethanol was the least effective solvent with a yield of 4.06% ± 0.06.
The results of a one-way ANOVA confirmed a statistically significant difference in extraction yields across the solvents (F(2,6) = 9.35, p = 0.001654). Post-hoc analysis showed that both aqueous and methanol extractions yielded significantly higher amounts compared to ethanol (p < 0.05). Specifically, the mean difference between aqueous and ethanol was -11.620 (p = 0.0015), and the difference between methanol and ethanol was 8.285 (p = 0.0183). However, there was no significant difference observed between aqueous and methanol extractions (p = 0.4431), suggesting a similar overall extraction efficiency between these two polar solvents, despite their different target compound classes. These findings highlight the critical importance of solvent selection, which must be tailored to the specific target species and desired cosmetic application. The high yield from methanol in D. salina supports its potential for anti-aging products rich in antioxidants, while the substantial yield from the aqueous extraction of S. platensis highlights its suitability for hydrating and calming cosmetic formulations. These findings are consistent with existing literature [17,18].
2.2. Total Phenolic Content (TPC)
The quantitative assessment of Total Phenolic Content (TPC) provided significant insights into the solvent-dependent extraction efficiency for Dunaliella salina and Spirulina platensis (Table 2). Methanol extraction of D. salina yielded the highest phenolic concentration, with a mean value of 32.153 ± 2.053 mg GAE/g DW. This value was significantly greater than both the aqueous (15.949 ± 1.254 mg GAE/g DW) and ethanol (4.215 ± 0.374 mg GAE/g DW) extractions. This finding aligns with previous studies that report the effectiveness of polar solvents like methanol in interacting with and extracting various phenolic structures [9,19,20]. Phenolic compounds are particularly valued in cosmetics for their ability to protect the skin from oxidative stress, a primary contributor to aging [21]. These findings align with previous research indicating that D. salina extracts, particularly those obtained using methanol, are rich in phenolic compounds and exhibit significant antioxidant properties, making them valuable for anti-aging and skin-rejuvenating cosmetic formulations [22].
In contrast, S. platensis exhibited a starkly different profile, with aqueous extraction yielding the highest phenolic concentration at 70.99 ± 1.029 mg GAE/g DW. This was significantly higher than the methanol (1.98 ± 0.047 mg GAE/g DW) and ethanol (27.12 ± 0.850 mg GAE/g DW) extractions. This result implies that S. platensis contains phenolic chemicals that contribute significantly to its antioxidant activities [[23,24]. Many of these phenolics are hydrophilic due to their numerous hydroxyl groups, which increases their solubility in water and allows them to interact well in aqueous cosmetic compositions. Such qualities are especially useful in skincare products because water-soluble antioxidants can increase skin hydration and give calming benefits [24]. The increased phenolic content noted in aqueous extracts of S. platensis further supports its use in formulations aimed for hydration and skin-calming benefits.
A two-way ANOVA revealed a statistically significant interaction between the microalgae species and the solvent used for extraction (p < 0.001), demonstrating that the efficacy of a solvent for phenolic extraction is highly species-dependent. S. platensis consistently exhibited higher overall phenolic levels than D. salina, emphasizing the importance of selecting both the appropriate microalgae species and solvent to optimize extraction for specific cosmetic benefits [25]. While Tukey's Honestly Significant Difference (HSD) test showed no significant difference in phenolic content between the ethanol extract of D. salina and the methanol extract of S. platensis (p > 0.05), these results further underscore that the choice of solvent should be tailored to the specific application and desired characteristics of the final product [26]. Our findings align with previous research indicating that both aqueous and methanol solvents can be optimized for extracting phenolic compounds from microalgae for various applications, including cosmetics [27,28].
2.3. Total Flavonoid Content (TFC)
The total flavonoid content (TFC) of extracts from Dunaliella salina and Spirulina platensis exhibited significant variation across different solvents, highlighting their unique biochemical profiles and potential for cosmetic applications (Table 3). The flavonoid concentration in D. salina was consistently high across all solvents, with values of 94.90 ± 0.904 mg QE/g DW for aqueous, 94.23 ± 2.543 mg QE/g DW for ethanol, and 91.56 ± 1.296 mg QE/g DW for methanol. The consistent high yields of flavonoids in polar solvents indicate that D. salina is a valuable source of these bioactive compounds. Flavonoids from marine microalgae are known for their powerful antioxidant activities, which protect skin cells from oxidative stress and improve the efficacy of anti-aging and skin-protective cosmetic formulations [9]. This conclusion is similar with previous research on other marine-derived compounds, such as fish proteins and peptides, which are commonly utilised in cosmeceuticals due to their antioxidant, antibacterial, and skin-repairing properties [29].
In contrast to D. salina, S. platensis showed a significant solvent-dependent variation in flavonoid content. Aqueous extraction yielded the highest concentration at 65.39 ± 2.678 mg QE/g DW, followed by ethanol (60.47 ± 2.296 mg QE/g DW), and methanol (52.36 ± 1.933 mg QE/g DW). This result highlights the efficacy of water-based solvents in extracting more polar flavonoids, which are advantageous for cosmetic formulations targeting skin hydration and soothing effects [30]. The high flavonoid concentration from aqueous extraction aligns with previous research demonstrating that phenolic compounds exhibit greater solubility in polar solvents like water and ethanol than in less polar solvents [30,31]. The presence of flavonoids in S. platensis enhances its antioxidant capacity and supports its potential for anti-inflammatory applications, as extracts from this species have been shown to inhibit pro-inflammatory cytokines [32].
A two-way ANOVA confirmed a significant interaction between the microalgae species and the solvent type (p < 0.01), indicating that the optimal solvent for flavonoid extraction is species-specific. D. salina proved to be a reliable source of flavonoids independent of the solvent used, as evidenced by the same flavonoid concentration observed throughout water, ethanol, and methanol extractions [9,33]. On the other hand, S. platensis higher aqueous extraction efficiency suggests that it could be used in cosmetic products that aim to hydrate and soothe the skin. According to studies, S. platensis aqueous extracts not only yield higher amounts of phenolic and flavonoid chemicals but also have positive effects on skin health, including promoting wound healing and offering antioxidant protection [34].
2.4. Antioxidant Activity
2.4.1. ABTS (2, 2’-Azino-bis (3-ethylbenzothiazoline-6-sulfonic acid) Radical Cation Decolourization Assay
The ABTS radical cation decolourization assay quantitatively assessed the antioxidant capacity of the microalgal extracts. The ethanolic extract of D. salina exhibited the highest antioxidant activity for this species, with an IC50 value of 142.32 µg/mL (Table 4a). The significant activity is likely linked to its high carotenoid content, especially β-carotene, known for its capacity to reduce oxidative stress and protect against photoaging [35,36]. This finding supports the incorporation of this extract in cosmetic formulations aimed at mitigating environmental stressors and improving skin health.
The methanolic extract of S. platensis demonstrated a lower IC50 of 113.44 µg/mL, signifying its enhanced radical scavenging activity compared to the D. salina extracts. This finding highlights the potential of S. platensis as a vital component in skincare formulations designed to improve skin elasticity and reduce the visibility of wrinkles [37]. The significant free-radical scavenging capacity demonstrated by microalgal extracts indicates their effectiveness in protecting skin cells from oxidative stress, crucial for preserving youthful and healthy skin.
The reference standards, ascorbic acid and Trolox, demonstrated concentration-dependent inhibition, confirming the efficacy of the ABTS assay (Table 4b). Ascorbic acid exhibited 94.13% inhibition at a concentration of 10 µg/mL, whereas Trolox displayed 94.67% inhibition at 2 mM, thereby validating the assay's effectiveness in evaluating the antioxidant potential of these extracts. The observed scavenging activities correspond with the growing consumer preference for natural ingredients and establish these microalgae as effective solutions for reducing oxidative stress and improving skin vitality in the cosmetic industry [37,38].
2.4.2. DPPH (2, 2-diphenyl-1-picrylhydrazyl) Radical Scavenging Activity
The DPPH radical scavenging activity of the microalgal extracts exhibited a positive, dose-dependent correlation with concentration (Table 5a). The methanolic extract of D. salina exhibited a moderate antioxidant capacity, with an IC50 value of 185.74 µg/mL. The observed activity can be attributed to the extract's high carotenoid content, recognised for its capacity to scavenge free radicals and reduce oxidative damage [39,40]. This finding supports the incorporation of D. salina in cosmetic formulations designed to enhance skin health.
The aqueous extract of S. platensis demonstrated greater antioxidant capacity, evidenced by a lower IC50 of 163.50 µg/mL. The enhanced activity of S. platensis is attributed to its high levels of phycocyanin and other hydrophilic phenolic compounds, which demonstrate significant efficacy in neutralising DPPH radicals [30,41]. This finding indicates that aqueous extracts of S. platensis are beneficial for formulating skincare products that requires hydration and antioxidant protection [42,43].
In a comparative analysis, the reference standards ascorbic acid and Trolox showed considerably greater antioxidant potency (Table 5b). Ascorbic acid showed an IC₅₀ of 4.84 µg/mL, while Trolox presented an IC₅₀ of 0.92 mM. The benchmarks suggest that microalgal extracts exhibit notable antioxidant properties; however, their effectiveness is typically lower to that of conventional chemical antioxidants, a pattern consistent with previous comparative research [44]. Such comparative framework is crucial for accurately assessing the antioxidant potential of natural extracts and guiding their effective application in cosmetic formulations [45,46].
2.4.3. FRAP (Ferric Reducing Antioxidant Power) Assay
The results of the Ferric Reducing Antioxidant Power (FRAP) assay demonstrate that the methanolic extract of D. salina exhibits considerable reducing power, evidenced by an IC50 value of 159.841 µg/mL (Table 6a). This finding aligns with the literature that identifies methanol as an effective solvent for extracting various bioactive compounds, including polar and non-polar antioxidants such as carotenoids and phenolics, thus improving the overall antioxidant capacity of the extracts [44,47]. The reducing capacity of this extract indicates its potential application in anti-aging cosmetic formulations aimed at mitigating oxidative stress.
The aqueous extract of S. platensis showed increased antioxidant activity, indicated by a lower IC50 of 138.080 µg/mL. This result highlights the important role of water-soluble antioxidants from this species, including phycobiliproteins, especially allophycocyanin, recognised for its potent radical scavenging properties. This finding corresponds with the increasing consumer preference for natural, water-soluble ingredients in skincare products [48,49].
In comparison to the reference standards, both ascorbic acid and Trolox demonstrated significantly greater reducing power. Ascorbic acid achieved a 100% reduction at a concentration of 10 µg/mL, whereas Trolox exhibited a maximum reduction of 80.328% at 2 mM (Table 6b). The results highlight the greater efficacy of traditional, pure antioxidants compared to microalgal extracts. This comparison is essential for establishing the potential of the extracts and highlights the necessity of assessing new antioxidant sources relative to established standards [50,51].
2.4.4. ANOVA Analysis of Antioxidant Activity
The analysis of variance (ANOVA) indicated that multiple factors significantly affected the inhibition percentages of antioxidant activity. The assay type significantly influenced the results (p=0.0446), indicating that the evaluation method is essential for assessing antioxidant potential. Assays such as ABTS, DPPH, and FRAP function through different mechanisms, resulting in variable outcomes for identical extracts [52]. The results align with current literature supporting the utilisation of multiple assays to achieve a thorough understanding of the antioxidant potential of natural extracts.
Additionally, the type of solvent had a significant impact on the inhibition percentages (p= 0.0256), suggesting that the selection of solvent is essential for optimising the extraction of bioactive compounds. This corroborates earlier research indicating that polar solvents, including methanol and aqueous solutions, are particularly effective in extracting antioxidants from microalgae, thus improving their efficacy [53,54]. Methanol's capacity to solubilise various polar compounds, such as phenolic acids and carotenoids, significantly contributes to the increased antioxidant capacity noted in the microalgal extracts [55].
The findings are consistent with existing literature emphasising the significance of assay selection and solvent choice in antioxidant research [56]. The variability observed in assays highlights the complexity of antioxidant mechanisms and the necessity for a comprehensive approach to effectively evaluate the potential of microalgal extracts. In line with current market trends for natural ingredients with functional benefits [57], this approach not only improves understanding of the bioactive compounds but also promotes the development of effective formulations in the nutraceutical and cosmetic industries [58].
2.5. Molecular Docking Analysis
The virtual screening and molecular docking results provided insights into the interactions between phytochemicals and the Keap1 protein, which is involved in cellular defense mechanisms against oxidative stress (Figure 1). Keap1 regulates the activity of the transcription factor NRF2, crucial for the antioxidant response pathway [59]. By preventing Keap1 from binding to NRF2, the selected inhibitors promote NRF2 accumulation and nuclear translocation, leading to the upregulation of antioxidant and cytoprotective genes. The validation of docking calculations by redocking the native ligand, fuu, and observing similar interactions and binding affinity confirmed the reliability of the molecular docking process. The binding energies of the selected phytochemicals, all lower than that of fuu, indicate stronger interactions with the Keap1 protein (Table 7). The presence of specific amino acid residues in the binding pocket, such as SER 42, TYR 13, and ARG 59, highlights potential targets for inhibition.
Carotenoids, which abundant in the two microalgae species studied, showed significant hydrophobic interactions within the binding pocket (Figure 2 and Figure 3). The lack of hydrogen bonds in alpha-carotene and beta-carotene, due to the absence of electronegative atoms, suggested that their binding is predominantly driven by hydrophobic forces. This aligned with the understanding that hydrophobic interactions are crucial for protein folding and stability [60]. The involvement of hydrogen bonding in other carotenoids, such as beta-cryptoxanthin and lutein, further supported their potential as effective Keap1 inhibitors. The binding affinities of these compounds suggested their strong interaction with the target protein, which is essential for disrupting the Keap1-NRF2 interaction and enhancing cellular antioxidant responses.
2.6. Toxicity and Safety Profile
The safety and pharmacokinetic profiles of the selected phytochemicals were evaluated using the ADMETlab2.0 platform (Table 8), emphasising their potential application in cosmetic formulations. Toxicological assessments revealed that most evaluated carotenoids exhibited a significant likelihood of causing skin sensitisation (probability ≥0.96). Phytol demonstrated a significant risk of eye irritation (0.95), whereas violaxanthin (0.91) and neoxanthin (0.52) showed increased probabilities of carcinogenicity. Neoxanthin (0.86), violaxanthin (0.70), and zeaxanthin (0.66) demonstrated relatively elevated risks of respiratory toxicity. The findings emphasise the importance of thorough safety evaluations, especially given that dermal application typically leads to minimal systemic exposure. Predictive toxicological modelling is a valuable tool for preliminary risk assessment; however, it may overestimate certain toxicity endpoints [61,62].
In terms of solubility and distribution, folate (−3.90), riboflavin (−3.66), and lariciresinol 4-O-glucoside (−2.88) were classified as soluble, with LogS values ranging from 4 to 0.5. The physicochemical properties, demonstrated by Chaiyasut et al. [63], are beneficial for inclusion in cosmetic formulations. The carotenoids demonstrated significant lipophilicity and low solubility in water, with LogS values ranging from −5.86 to −7.98. Advanced delivery systems, including lipid-based carriers and emulsions, have been proposed to improve bioavailability and efficacy in response to formulation challenges [64]. Furthermore, the examination of blood-brain barrier (BBB) penetration indicated that the majority of the phytochemicals assessed demonstrated limited BBB permeability, implying a decreased likelihood of central nervous system exposure. This is an important factor in assessing the safety profile of topical agents [65]. The findings highlight the necessity of combining predictive ADMET modelling with targeted formulation strategies to enhance the efficacy and safety of marine-derived phytochemicals in cosmetic applications.
Significant variations were noted among the phytochemicals in terms of their pharmacokinetic profiles, particularly for the fraction unbound in plasma. Riboflavin exhibited a higher percentage of unbound fraction, indicating relatively greater systemic bioavailability, as reported by Marczyński et al. [66]. Carotenoids exhibit low unbound fractions, reflecting their significant lipophilicity. This characteristic influences their systemic availability, which in turn affects formulation strategies, dosing, and the anticipated efficacy profiles of cosmetic products [67]. Despite potential toxicity concerns associated with high systemic absorption, the minimal systemic uptake resulting from dermal application allows for the safe inclusion of these compounds in cosmetic formulations, provided appropriate risk management measures are implemented [68]. These findings are consistent with earlier studies that have examined the safety and bioavailability of carotenoids in topical applications [69,70].
3. Materials and Methods
3.1. Microalgae Biomass
Spray-dried biomass of two microalgal species, Dunaliella salina and Spirulina platensis, was used in this study. The D. salina biomass was obtained from the Algae Biotechnology Laboratory, University of Greenwich (London, UK), while S. platensis biomass was purchased from The Soap Kitchen (Devon, UK). All biomass samples were stored at −20 °C prior to analysis and characterisation to preserve their biochemical integrity.
3.2. Extraction Yield
Metabolites were extracted from Dunaliella salina and Spirulina platensis using a modified protocol adapted from previous studies [23,71,72]. 100 mg samples of each microalga were processed in triplicate. Water, methanol, and ethanol were employed as solvents. The samples were sonicated using a Scimed UP50H ultrasonic processor to enhance metabolite extraction. After sonication, the samples were centrifuged, and the supernatants were filtered to remove particulate matter. Ethanol and methanol extracts were concentrated using a Genevac EZ 3835 evaporator, while aqueous extracts were freeze-dried. All extracts were stored at −20 °C for future analysis.
The extraction yield was calculated using the following formula:
Y % = (weight used for extraction / total amount of extract) × 100
3.3. Determination of Total Phenolic Content (TPC)
The total phenolic content (TPC) was determined using the Folin-Ciocalteu method, with modifications based on previous studies of Shirazi et al. [73]. Gallic acid was used as a standard for calibration, with concentrations ranging from 5 to 100 µg/mL prepared in distilled water. Samples (100 µL) were mixed with 500 µL of distilled water and 100 µL of Folin-Ciocalteu reagent. This mixture was incubated in darkness for 6 minutes, followed by the addition of 1 mL of a 7% Na₂CO₃ solution. The samples were then incubated for 90 minutes at room temperature (22 °C). The absorbance was measured at 760 nm using a Jenway 6305 UV spectrophotometer. TPC was calculated and expressed as milligrams of gallic acid equivalents (GAE) per gram of extract (dry weight).
3.4. Determination of Total Flavonoid Content (TFC)
Total flavonoid content (TFC) was determined using the aluminum chloride colorimetric method, adapted from existing protocols of Shirazi et al. [73]. Quercetin served as the reference standard, with concentrations ranging from 5 to 100 µg/mL. Each test involved mixing 100 µL of quercetin dilution with 500 µL of distilled water and 100 µL of 5% sodium nitrate solution. After a 6-minute incubation, 150 µL of 10% AlCl₃ was added, followed by an additional 5-minute incubation. Finally, 200 µL of 1 M NaOH was added, and absorbance was measured at 510 nm using a Jenway 6305 UV spectrophotometer. TFC was expressed as milligrams of quercetin equivalents (QE) per gram of extract (dry weight).
3.5. Evaluation of Antioxidant Activity
3.5.1. ABTS Radical Scavenging Activity
ABTS radical scavenging activity (RSA) was measured based on a modified method from Brand-Williams et al. [74] and Asekunowo et al. [75]. ABTS reagent was prepared and diluted to an initial absorbance of approximately 0.7 at 734 nm. In a 96-well plate, 190 µL of diluted ABTS reagent was combined with 10 µL of microalgae extracts or standard antioxidants (ascorbic acid at 2-10 µg/mL and Trolox at 0.125-2 mM). Samples were tested in triplicate and incubated in the dark at room temperature for 30 minutes. Absorbance at 734 nm was measured using a Thermo Scientific™ Multiskan™ GO Microplate Spectrophotometer.
ABTS scavenging activity (%) was calculated using the formula:
ABTS scavenging activity (%) = [(Acontrol - Asample) / Acontrol] x 100
Where Acontrol is the absorbance of the control reaction and Asample is the absorbance of the test compound.
3.5.2. DPPH Radical Scavenging Activity
DPPH radical scavenging activity was evaluated following a method modified from Brand-Williams et al. [74]. A methanolic solution of DPPH (0.1 mM) was mixed with 50 µL of microalgae extracts (50–250 µg/mL) and incubated for 30 minutes in the dark. Absorbance at 517 nm was measured using a Thermo Scientific™ Multiskan™ GO Microplate Spectrophotometer.
DPPH scavenging activity (%) was calculated:
DPPH scavenging activity (%) = [(Acontrol - Asample) / Acontrol] x 100
Where Acontrol is the absorbance of the control reaction and Asample is the absorbance of the test compound.
3.5.3. Ferric Reducing Antioxidant Power Assay (FRAP)
The FRAP assay, based on Benzie and Strain [76]), was used to measure antioxidant reducing power by converting ferric (Fe³⁺) ions to ferrous (Fe²⁺) ions. The FRAP reagent was prepared by mixing acetate buffer, TPTZ solution and ferric chloride solution in a 10:1:1 ratio. After incubation at 37 °C, 150 µL of FRAP reagent was added to 50 µL of sample or standard antioxidants (ascorbic acid and Trolox). Absorbance was measured at 700 nm using a Thermo Scientific™ Multiskan™ GO Microplate Spectrophotometer.
Reducing power was calculated using:
% RP = [1- ((1-As))/Ac)] ×100
Where % RP is the percentage reducing power, As is absorbance of the sample while Ac is the absorbance of the standard at maximum concentration tested.
3.6. Molecular Docking for Toxicity Assessment
The 3D structures of various phytochemicals from the microalgae, including 2-Fluoropalmitic acid (CID_1560), Alpha-carotene (CID_6419725), Alpha-ionone (CID_5282108), Alpha-linolenic Acid (CID_5280934), ascorbyl-palmitate (CID_54680660), Beta-carotene (CID_5280489), Beta-cryptoxanthin (CID_5281235), Beta-Cyclocitral (CID_9895), Beta-ionone (CID_638014), Caffeic acid (CID_689043), Canthaxanthin (CID_5281227), Chlorogenic acid (CID_1794427), Folate (CID_135398658), Gamma-linolenic Acid (CID_5280933), Glycerol (CID_753), Lariciresinol 4-O-glucoside (CID_11972394), Lutein (CID_5281243), Mycosporine (CID_442866), Mycosporine-glycine (CID_14444485), Myxoxanthophyll (CID_102601544), Neophytadiene (CID_10446), Neoxanthin (CID_5282217), Niacin (CID_938), Oleic acid (CID_4456), Ostruthin (CID_5281420), Palmitic Acid (CID_985), Phycoerythrin (CID_238), Phytol (CID_5280435), Porphyra-334 (CID_6857486), Pyrogallol (CID_1057), Shinorine (CID_122706103), Spiculisporic acid (CID_316426), Stearidonic Acid (CID_5312508), Syringic acid (CID_459276651), Violaxanthin (CID_448438), Vitamin B1 (Thiamine) (CID_6042), Vitamin B2 (Riboflavin) (CID_493570), Vitamin B6 (Pyridoxine) (CID_1054), and Zeaxanthin (CID_5280899) were sourced from PubChem (https://pubchem.ncbi.nlm.nih.gov/) and carotenoids analysis from previous publication [77,78,79,80]. These structures were minimised to avoid steric clashes using Gaussian 09W software [81] at the semi-empirical level of theory, which is appropriate for the type of ligands involved.
The Keap1 protein, with PDB ID 3vnh and a resolution of 2.10 Å, served as the target protein in this study. The crystal structure of the protein was obtained from the Protein Data Bank (www.rcsb.org) [82] and was prepared by removing water molecules and bound ligands using BIOVIA Discovery Studio (BIOVIA, Dassault Systèmes, Discovery Studio, 2018). For virtual screening, the optimized phytochemical structures were converted to .mol2 format using GaussView [83] and subsequently to .pdbqt format with Geisteiger charges using raccoon.py. Amino acids in the binding site were identified using the LigPlot server [84]. Virtual screening was conducted with AutoDock Vina 1.7 [85] installed on a Windows operating system. The dimensions of the binding center were set to -9.659 × -26.081 × 4.199. The toxicity profiles of the top phytochemicals were assessed using the ADMETlab 2.0 server (https://admetmesh.scbdd.com/) [86].
3.7. Statistical Analysis
Statistical analyses were performed to evaluate both metabolite extraction and antioxidant activity. For extraction yield, total phenolic content (TPC), and total flavonoid content (TFC), one-way ANOVA was used to assess differences between solvents (water, methanol, ethanol) within D. salina and S. platensis samples. Two-way ANOVA was utilised to examine interactions between microalgal species and solvent type for phenolic and flavonoid contents. When ANOVA indicated significant differences, Tukey’s Honestly Significant Difference (HSD) post hoc test was applied to identify pairwise differences between group means.
For antioxidant activity, one-way ANOVA was applied to compare ABTS, DPPH, and FRAP assay results across different factors, including assay type, solvent (aqueous, methanol, ethanol), microalgal species, and concentration. Linear regression models were further used to evaluate main effects and interactions. Tukey’s HSD post hoc test was performed to determine specific differences between means when significant variations were observed. All statistical analyses and data visualisations were performed using Python (version X.X) with the libraries Pandas, SciPy, Statsmodels, and Matplotlib. A p-value < 0.05 was considered statistically significant.
4. Conclusions
This study adds to the growing body of literature on the potential of Dunaliella salina and Spirulina platensis as viable sources of bioactive compounds for cosmetic applications. The optimisation of extraction techniques revealed that methanol and aqueous solvents are especially effective for maximising the yield of phenolic and flavonoid compounds. The high concentrations of these bioactive compounds, along with the significant antioxidant activity demonstrated, highlight their efficiency in mitigating oxidative stress, a primary contributor to skin ageing and damage. Furthermore, the molecular docking analyses demonstrated significant binding affinities of essential phytochemicals with the Keap1 protein, indicating their potential effectiveness in improving skin health. The ADMET analysis further buttresses the overall safety of the extracts for topical use, although it highlights specific toxicological risks for certain isolated compounds, such as potential skin sensitization and eye irritation. The results support the inclusion of these microalgal extracts in cosmetic formulations designed to enhance skin hydration, elasticity, and protection from environmental stressors. The incorporation of advanced extraction techniques, thorough evaluations of antioxidant properties, and comprehensive safety analysis not only validates the potential of D. salina and S. platensis but also aligns with the increasing consumer demand for natural and effective cosmetic components. Ongoing research in this area could lead to the development of innovative, effective, and environmentally sustainable cosmetic products that leverage the unique properties of these microalgae.
Author Contributions
Conceptualization, M.L. and T.A.; methodology, M.L., T.A., O.A. and O.O.; software, O.O.; validation, M.L., T.A. and O.T.; formal analysis, M.L.; investigation, M.L.; resources, Y.S. and N.T.; data curation, M.L. and O.O; writing—original draft preparation, M.L.; writing—review and editing, T.A., and O.A.; visualization, M.L. T.A. and O.A.; supervision, T.A., O.A. and N.T. All authors have read and agreed to the published version of the manuscript.
Funding
This research received no external funding.
Institutional Review Board Statement
Not applicable.
Data Availability Statement
All data supporting this study are included in the paper. Additional raw data files are available from the corresponding author upon request.
Acknowledgments
The authors appreciate the University of Greenwich for providing the necessary platform and resources for the research and the University of Lagos for the permission to conduct the part of the research at the University of Greenwich.
Conflicts of Interest
The authors declare no conflict of interest.
References
- Michalak, I.; Chojnacka, K. Study on bioactive compounds of microalgae as antioxidants in a bibliometric analysis and visualization perspective. Front. Plant Sci. 2022, 13, 1144326. [Google Scholar]
- Zhou, Y.; Jiang, H.; Zhou, L.; Wang, H.; Li, Z. Extraction and characterization of bioactive compounds from diverse marine microalgae and their potential antioxidant activities. Chem. Biodivers. 2023, 20, e202300602. [Google Scholar] [CrossRef]
- Rodrigues, A.M.C.; Figueiredo, D.; Soares, A.M.V.M.; Barata, C.; Loureiro, S. Bioactive lipids in Dunaliella salina: Implications for functional foods and health. Mar. Drugs 2024, 22, 152. [Google Scholar]
- Torres-Tiji, Y.; Fields, F.J.; Mayfield, S.P. Microalgae as a future food source. Biotechnol. Adv. 2020, 41, 107536. [Google Scholar] [CrossRef]
- Araj-Shirvani, Z.; Khosravi-Darani, K.; Kasaai, M.R.; Golmakani, E.-M.; Shekarabi, S.P.; Vahabzadeh, F. Biochemical profile of Dunaliella isolates from different regions of Iran with a focus on pharmaceutical and nutraceutical potential applications. Food Sci. Nutr. 2024, 12, 1–15. [Google Scholar] [CrossRef] [PubMed]
- Gómez, C.; Pellizzari, F.M.; Pérez, M.J.; Contreras, M. Microalgae bioactive compounds to topical applications products—A review. Mar. Drugs 2022, 20, 377. [Google Scholar]
- Mellado, M.; Bustos, P.; Figueroa, F.L. A Dunaliella salina extract counteracts skin aging under intense solar irradiation thanks to its antiglycation and anti-inflammatory properties. Mar. Drugs 2022, 20, 123. [Google Scholar] [CrossRef]
- El-Sheekh, M.M.; Eladel, H.M.; Shaaban, M.M.; El-Sayed, A.B.A. Extraction of bioactive compounds from microalgae: An overview of methodologies and applications. J. Appl. Phycol. 2022, 34, 2327–2342. [Google Scholar]
- Safafar, H.; Van Wagenen, J.; Møller, P.; Jacobsen, C. Carotenoids, phenolic compounds and tocopherols contribute to the antioxidative properties of some microalgae species grown on industrial wastewater. Mar. Drugs 2015, 13, 7339–7356. [Google Scholar] [CrossRef] [PubMed]
- Abdel-Raouf, N.; Al-Enazi, N.M.; Al-Homaidan, A.A.I. Microalgae: Antioxidant compounds and their potential uses in health and disease. Mar. Drugs 2023, 21, 171. [Google Scholar]
- Rani, S.; Kumar, P.; Alam, A.; Prasad, A. Molecular docking studies of phytochemicals for antioxidant activity via Keap1–Nrf2 pathway. Curr. Comput. Aided Drug Des. 2022, 18, 396–408. [Google Scholar]
- Li, M.; Huang, W.; Jie, F.; Wang, M.; Zhong, Y.; Chen, Q.; Lu, B. Discovery of Keap1–Nrf2 small-molecule inhibitors from phytochemicals based on molecular docking. Food Chem. Toxicol. 2019, 133, 110758. [Google Scholar] [CrossRef]
- El-Baz, F.K.; Aboul-Enein, A.M.; El-Baroty, G.S.; Youssef, A.M.; Abd El-Baky, H.H. Accumulation of antioxidant vitamins in Dunaliella salina. Am.-Eurasian J. Agric. Environ. Sci. 2010, 7, 386–391. [Google Scholar]
- Safaei, M.; Maleki, H.; Soleimanpour, H.; Mokhtari, M.; Akbari, A.; Gharanjik, B. Ultrasound-assisted extraction of carotenoids from Dunaliella salina: Optimization and comparison with other methods. Iran. J. Nutr. Sci. 2019, 14, 109–118. [Google Scholar]
- Chen, L.; Wang, C.; Wang, Z.; Dou, J.; Yuan, Y.; Yang, L.; Xu, N. Polysaccharides from Spirulina platensis: Extraction methods, structural features, and bioactivities. Int. J. Biol. Macromol. 2023, 236, 124097. [Google Scholar]
- Güneş, S.; Tamburacı, S.; Dalay, M.C.; Deliloğlu Gürhan, İ. In vitro evaluation of Spirulina platensis extract-incorporated skin cream with wound healing and antioxidant activities. Pharm. Biol. 2017, 55, 1824–1832. [Google Scholar] [CrossRef]
- Ngu, E.L.; Ko, C.L.; Tan, C.Y.; Wong, K.H.; Phang, S.M.; Yow, Y.Y. Phytochemical profiling and in vitro screening for neuritogenic and antioxidant activities of Spirulina platensis. Indian J. Pharm. Educ. Res. 2021, 55, 812–822. [Google Scholar] [CrossRef]
- Li, B.; Liu, S.; Zhang, C.; Wang, D.; Feng, J. Extraction, characterization, and antioxidant activity of polysaccharides from Spirulina platensis. Int. J. Biol. Macromol. 2021, 183, 1732–1740. [Google Scholar]
- Ngu, T.T.; Nguyen, T.H.; Le, T.M.; Nguyen, H.V.; Pham, T.T. Antioxidant activity and chemical composition of Dunaliella salina extracts using different solvents. J. Appl. Phycol. 2022, 34, 1593–1604. [Google Scholar] [CrossRef]
- Adesalu, T.A.; Kuti, F.O. Phytochemicals, total lipids and molecular characterization of a West African strain of Oscillatoria sp. (Cyanobacterium) isolated from Ceratophyllum demersum L. (Hornwort). J. Pharmacogn. Phytochem. 2020, 9, 18–25. [Google Scholar]
- Saewan, N.; Jimtaisong, A. Natural products as photoprotection. J. Cosmet. Dermatol. 2015, 14, 47–63. [Google Scholar] [CrossRef] [PubMed]
- Havas, F.; Krispin, S.; Cohen, M.; Loing, E.; Farge, M.; Suere, T.; Attia-Vigneau, J. A Dunaliella salina extract counteracts skin aging under intense solar irradiation thanks to its antiglycation and anti-inflammatory properties. Mar. Drugs 2022, 20, 625. [Google Scholar] [CrossRef]
- Machů, L.; Mišurcová, L.; Ambrožová, J.V.; Orsavová, J.; Mlček, J.; Sochor, J.; Juríková, T. Phenolic content and antioxidant capacity in algal food products. Molecules 2015, 20, 1118–1133. [Google Scholar] [CrossRef] [PubMed]
- Bellahcen, T.O.; Aamiri, A.; Touam, I.; Hmimid, F.; Amrani, A.E.; Cherif, A.; Cherki, M. Evaluation of Moroccan microalgae Spirulina platensis as a potential source of natural antioxidants. J. Complement. Integr. Med. 2020, 17, 20190036. [Google Scholar] [CrossRef]
- Liang, J.; Zago, E.; Nandasiri, R.; Khattab, R.; Eskin, N.M.; Eck, P.; Thiyam-Holländer, U. Effect of solvent, preheating temperature, and time on the ultrasonic extraction of phenolic compounds from cold-pressed hempseed cake. J. Am. Oil Chem. Soc. 2018, 95, 1319–1327. [Google Scholar] [CrossRef]
- Nilamsari, E.I.; Nugroho, L.H.; Sukirno, S. Bioactive compound profile of Muntingia calabura leaf extract with different polarity solvents. Syntax Literate J. Ilm. Indones. 2023, 8, 6035–6046. [Google Scholar]
- Hajimahmoodi, M.; Faramarzi, M.A.; Mohammadi, N.; Soltani, N.; Oveisi, M.R.; Nafissi-Varcheh, N. Evaluation of antioxidant properties and total phenolic contents of some strains of microalgae. J. Appl. Phycol. 2010, 22, 43–50. [Google Scholar] [CrossRef]
- Ruzi, I.I.; Mohd Shahpudin, S.N.; Mohamad, S.; et al. Impact of extraction techniques and solvent systems on the antioxidant activity and fatty acid composition of Scenedesmus parvus extracts. Food Anal. Methods 2025, 18, 2220–2229. [Google Scholar] [CrossRef]
- Venkatesan, J.; Anil, S.; Kim, S.; Shim, M.S. Marine fish proteins and peptides for cosmeceuticals: A review. Mar. Drugs 2017, 15, 143. [Google Scholar] [CrossRef]
- Kumar, A.; Ramamoorthy, D.; Verma, D.K.; Kumar, A.; Kumar, N.; Kanak, K.R.; Marwein, B.M.; Mohan, K. Antioxidant and phytonutrient activities of Spirulina platensis. Energy Nexus 2022, 6, 100064. [Google Scholar] [CrossRef]
- Uzlaşır, T.; Şaşmaz, H.K.; Kelebek, H. Comparison of extraction techniques for determining bioactive compounds and antioxidant activity of Spirulina platensis. Turk. J. Agric. Food Sci. Technol. 2024, 12, 554–560. [Google Scholar] [CrossRef]
- Pham, T.X.; Park, Y.K.; Lee, J.Y. Anti-inflammatory effects of Spirulina platensis extract via the modulation of histone deacetylases. Nutrients 2016, 8, 381. [Google Scholar] [CrossRef]
- Ferdous, U.T.; Nurdin, A.; Ismail, S.; Shaari, K.; Yusof, Z.N.B. A comparative study on antioxidant properties, total phenolics, total flavonoid contents, and cytotoxic properties of marine green microalgae and diatoms. J. Genet. Eng. Biotechnol. 2025, 23, 100456. [Google Scholar] [CrossRef] [PubMed]
- Syarina, P.N.; Karthivashan, G.; Abas, F.; Arulselvan, P.; Fakurazi, S. Wound healing potential of Spirulina platensis extracts on human dermal fibroblast cells. EXCLI J. 2015, 14, 385–393. [Google Scholar]
- Dewi, R.; Winanto, T.; Haryono, F.; Marhaeni, B.; Hanifa, G.; Nabila, D.; et al. Potensi klorofil dan karotenoid fitoplankton Dunaliella salina sebagai sumber antioksidan. Bul. Oseanogr. Mar. 2023, 12, 125–132. [Google Scholar] [CrossRef]
- Kevin, K.; Widjaja, A. Effect of nitrogen deficiency and UV light on Dunaliella salina β-carotene production. In AIP Conf. Proc.; AIP Publishing: Melville, NY, USA, 2023; Volume 2847, p. 020005. [Google Scholar]
- Adamiak, K.; Kurzawa, M.; Sionkowska, A. Physicochemical performance of collagen modified by Melissa officinalis extract. Cosmetics 2021, 8, 95. [Google Scholar] [CrossRef]
- Brudzyńska, P.; Kurzawa, M.; Sionkowska, A.; Grisel, M. Antioxidant activity of plant-derived colorants for potential cosmetic application. Cosmetics 2022, 9, 81. [Google Scholar] [CrossRef]
- Ahmed, F.; Fanning, K.; Netzel, M.; Turner, W.; Li, Y.; Schenk, P.M. Profiling of carotenoids and antioxidant capacity of microalgae from subtropical coastal and brackish waters. Food Chem. 2014, 165, 300–306. [Google Scholar] [CrossRef]
- Farhat, N.; Rabhi, M.; Falleh, H.; Jouini, J.; Abdelly, C.; Smaoui, A. Optimization of salt concentrations for a higher carotenoid production in Dunaliella salina (Chlorophyceae). J. Phycol. 2011, 47, 1072–1077. [Google Scholar] [CrossRef] [PubMed]
- Patel, A.; Mishra, S.; Pawar, R.; Ghosh, P.K. Purification and characterization of C-phycocyanin from cyanobacterial species of marine and freshwater habitat. Protein Expr. Purif. 2005, 40, 248–255. [Google Scholar] [CrossRef]
- Mohammadi, M.; Soltanzadeh, M.; Ebrahimi, A.R.; Hamishehkar, H. Spirulina platensis protein hydrolysates: Techno-functional, nutritional and antioxidant properties. Algal Res. 2022, 65, 102739. [Google Scholar] [CrossRef]
- Afify, A.E.M.M.; Abd El Baky, H.H.; El Baroty, G.S.; El Baz, F.K.; Murad, S.A. Antioxidant activity of protein hydrolysates derived from blue-green alga Spirulina platensis extracted with three different methods and treated with enzymes. Biosci. Res. 2017, 14, 485–497. [Google Scholar]
- Zhou, L.; Duan, X.; Li, K.; Hill, D.R.A.; Martin, G.J.O.; Suleria, H.A.R. Extraction and characterization of bioactive compounds from diverse marine microalgae and their potential antioxidant activities. Chem. Biodivers. 2023, 20, e202300602. [Google Scholar] [CrossRef]
- Yang, N.; Zhang, Q.; Chen, J.; Wu, S.; Chen, R.; Yao, L.; Zhang, Z. Study on bioactive compounds of microalgae as antioxidants: A bibliometric analysis and visualization perspective. Front. Plant Sci. 2023, 14, 1144326. [Google Scholar] [CrossRef]
- Tibbetts, S.M.; Milley, J.E.; Lall, S.P. Chemical composition and nutritional properties of freshwater and marine microalgal biomass cultured in photobioreactors. J. Appl. Phycol. 2015, 27, 1109–1119. [Google Scholar] [CrossRef]
- Conde, T.A.; Neves, B.F.; Couto, D.; Melo, T.; Neves, B.; Costa, M.; Domingues, M.R. Microalgae as sustainable bio-factories of healthy lipids: Evaluating fatty acid content and antioxidant activity. Mar. Drugs 2021, 19, 357. [Google Scholar] [CrossRef]
- Shanab, S.M.; Mostafa, S.S.; Shalaby, E.A.; Mahmoud, G.I. Aqueous extracts of microalgae exhibit antioxidant and anticancer activities. Asian Pac. J. Trop. Biomed. 2012, 2, 608–615. [Google Scholar] [CrossRef]
- Guedes, A.C.; Gião, M.S.; Seabra, R.; Ferreira, A.L.A.; Tamagnini, P.; Moradas-Ferreira, P.; Malcata, F.X. Evaluation of the antioxidant activity of cell extracts from microalgae. Mar. Drugs 2013, 11, 1256–1270. [Google Scholar] [CrossRef]
- Üstün-Aytekin, Ö.; Çoban, I.; Aktaş, B. Nutritional value, sensory properties, and antioxidant activity of a traditional kefir produced with Arthrospira platensis. J. Food Process. Preserv. 2022, 46, e16380. [Google Scholar] [CrossRef]
- Carrillo, M.; Anchundia, M. Antimicrobial and antioxidant capacity of Dunaliella salina, Tetraselmis chuii and Isochrysis galbana and their potential use in food: A systematic review. CABI Agric. Biosci. 2024, 5, 108. [Google Scholar] [CrossRef]
- Coulombier, N.; Jauffrais, T.; Lebouvier, N. Antioxidant compounds from microalgae: A review. Mar. Drugs 2021, 19, 549. [Google Scholar] [CrossRef]
- Kokkali, M.; Martí-Quijal, F.J.; Taroncher, M.; Ruiz, M.J.; Kousoulaki, K.; Barba, F.J. Improved extraction efficiency of antioxidant bioactive compounds from Tetraselmis chuii and Phaeodactylum tricornutum using pulsed electric fields. Molecules 2020, 25, 3921. [Google Scholar] [CrossRef] [PubMed]
- Silva, M.E.T.D.; Martins, M.A.; Leite, M.D.O.; Milião, G.L.; Coimbra, J.S.D.R. Microalga Scenedesmus obliquus: Extraction of bioactive compounds and antioxidant activity. Rev. Ciênc. Agron. 2021, 52, e20196848. [Google Scholar] [CrossRef]
- Azaman, S.N.A.; Nagao, N.; Yusoff, F.M.; Tan, S.W.; Yeap, S.K. A comparison of the morphological and biochemical characteristics of Chlorella sorokiniana and Chlorella zofingiensis cultured under photoautotrophic and mixotrophic conditions. PeerJ 2017, 5, e3473. [Google Scholar] [CrossRef]
- Asekun, O.T.; Okoh, S.O.; Familoni, O.B.; Afolayan, A.J. Chemical profiles and antioxidant activity of essential oils extracted from the leaves and stem of Parkia biglobosa (Jacq) Benth. Res. J. Med. Plants 2013, 7, 82–91. [Google Scholar] [CrossRef]
- Goiris, K.; Muylaert, K.; Voorspoels, S.; Noten, B.; De Paepe, D.; Baart, G.J.E.; De Cooman, L. Detection of flavonoids in microalgae from different evolutionary lineages. J. Phycol. 2014, 50, 483–492. [Google Scholar] [CrossRef]
- Gutiérrez-Pliego, L.E.; Martínez-Carrillo, B.E.; Reséndiz-Albor, A.A.; Valdés-Ramos, R. Effect on adipose tissue of diabetic mice supplemented with n-3 fatty acids extracted from microalgae. Endocr. Metab. Immune Disord. Drug Targets 2020, 20, 728–735. [Google Scholar] [CrossRef]
- Kobayashi, A.; Kang, M.-I.; Watai, Y.; Tong, K.I.; Shibata, T.; Uchida, K.; Yamamoto, M. Oxidative and electrophilic stresses activate Nrf2 through inhibition of ubiquitination activity of Keap1. Mol. Cell. Biol. 2006, 26, 221–229. [Google Scholar] [CrossRef] [PubMed]
- Xiao, F.; Chen, Z.; Wei, Z.; Tian, L. Hydrophobic interaction: A promising driving force for the biomedical applications of nucleic acids. Adv. Sci. 2020, 7, 2001048. [Google Scholar] [CrossRef]
- Thomford, N.E.; Dzobo, K.; Chopera, D.; Wonkam, A.; Maroyi, A.; Blackhurst, D.; Dandara, C. In Vitro Reversible and Time-Dependent CYP450 Inhibition Profiles of Medicinal Herbal Plant Extracts Newbouldia laevis and Cassia abbreviata: Implications for Herb–Drug Interactions. Molecules 2016, 21, 891. [Google Scholar] [CrossRef]
- Lim, S.; Bae, S.; Lee, H.; Han, H.; Choi, C. Effect of Betanin, the Major Pigment of Red Beetroot (Beta vulgaris L.), on the Activity of Recombinant Human Cytochrome P450 Enzymes. Pharmaceuticals 2023, 16, 1224. [Google Scholar] [CrossRef]
- Chaiyasut, C.; Kesika, P.; Sakdakampanat, P.; Peerajan, S.; Sivamaruthi, B. Formulation and Evaluation of Stability of Thai Purple Rice Bran-Based Cosmetic Products. Asian J. Pharm. Clin. Res. 2018, 11, 99–103. [Google Scholar] [CrossRef]
- Rizk, S.; Moneim, A.; Abdel-Gaber, R.; Alquraishi, M.; Santourlidis, S.; Dkhil, M. Nephroprotective Efficacy of Echinops spinosus against a Glycerol-Induced Acute Kidney Injury Model. ACS Omega 2023, 8, 41865–41875. [Google Scholar] [CrossRef]
- Ramamoorthy, S.K.; Manickam, D.; Subramaniam, S.; Subramaniam, S. Standardisation and Phytochemical Screening of Traditional Formulation. Int. J. Curr. Pharm. Res. 2016, 9, 70–74. [Google Scholar] [CrossRef]
- Marczynski, Z.; Skibska, B.; Nowak, S.; Jambor, J.; Zgoda, M.M. Actual solubility (S| real.|), level of hydrophilic-lipophilic balance (HLBRequ., HLBD, HLBG) and partition coefficient (log P) of phytochemicals contained in Ext. Camellia sinensis L. Aqu. Siccum. Herba Pol. 2018, 64, 107–116. [Google Scholar] [CrossRef]
- Ma, Y.; Li, C.; Su, W.; Sun, Z.; Gao, S.; Xie, W.; Zhang, B.; Sui, L. Carotenoids in Skin Photoaging: Unveiling Protective Effects, Molecular Insights, and Safety and Bioavailability Frontiers. Antioxidants 2025, 14, 577. [Google Scholar] [CrossRef]
- Stănescu, C.; Chișcop, I.; Mihalache, D.; Popa, F.; Tămaș, C.; Stoleriu, G. Skin Aging and Carotenoids: A Systematic Review of Their Multifaceted Protective Mechanisms. Nutrients 2025, 17, 2596. [Google Scholar] [CrossRef]
- Sirilun, S.; Sivamaruthi, B.; Kumar, N.; Kesika, P.; Peerajan, S.; Chaiyasut, C. Lactobacillus-Fermented Plant Juice as a Potential Ingredient in Cosmetics: Formulation and Assessment of Natural Mouthwash. Asian J. Pharm. Clin. Res. 2016, 9, 52–56. [Google Scholar] [CrossRef]
- Havas, F.; Krispin, S.; Meléndez-Martínez, A.J.; von Oppen-Bezalel, L. Preliminary Data on the Safety of Phytoene- and Phytofluene-Rich Products for Human Use Including Topical Application. J. Toxicol. 2018, 2018, 5475784. [Google Scholar] [CrossRef]
- Danielli, L.J.; de Souza, T.J.T.; Maciel, A.J.; Ferrão, M.F.; Fuentefria, A.M.; Apel, M.A. Influence of Monoterpenes in Biological Activities of Nectandra megapotamica (Spreng.) Mez Essential Oils. Biomolecules 2019, 9, 112. [Google Scholar] [CrossRef]
- Shalaby, E.A.; Shanab, S.M.; Hafez, R.M.; El-Ansary, A.E. Chemical Constituents and Biological Activities of Different Extracts from Ginger Plant (Zingiber officinale). Chem. Biol. Technol. Agric. 2023, 10, 14. [Google Scholar] [CrossRef]
- Shirazi, O.U.; Khattak, M.M.A.K.; Shukri, N.A.M. Determination of Total Phenolic, Flavonoid Content and Free Radical Scavenging Activities of Common Herbs and Spices. J. Pharmacogn. Phytochem. 2014, 3, 104–108. [Google Scholar]
- Brand-Williams, W.; Cuvelier, M.E.; Berset, C. Use of a Free Radical Method to Evaluate Antioxidant Activity. LWT-Food Sci. Technol. 1995, 28, 25–30. [Google Scholar] [CrossRef]
- Asekunowo, A.K.; Ashafa, A.O.T.; Okoh, O.; Asekun, O.T.; Familoni, O.B. Polyphenolic Constituents, Antioxidant and Hypoglycaemic Potential of Leaf Extracts of Acalypha godseffiana from Eastern Nigeria: In Vitro Study. J. Med. Plants Econ. Dev. 2019, 3, a36. [Google Scholar] [CrossRef]
- Benzie, I.F.F.; Strain, J.J. The Ferric Reducing Ability of Plasma (FRAP) as a Measure of “Antioxidant Power”: The FRAP Assay. Anal. Biochem. 1996, 239, 70–76. [Google Scholar] [CrossRef]
- Kim, S.; Thiessen, P.A.; Bolton, E.E.; Chen, J.; Fu, G.; Gindulyte, A.; Han, L.; He, J.; He, S.; Shoemaker, B.A.; Wang, J.; Yu, B.; Zhang, J.; Bryant, S.H. PubChem Substance and Compound Databases. Nucleic Acids Res. 2016, 44, D1202–D1213. [Google Scholar] [CrossRef]
- Kim, S.; Chen, J.; Cheng, T.; Gindulyte, A.; He, J.; He, S.; Li, Q.; Shoemaker, B.A.; Thiessen, P.A.; Yu, B.; Zaslavsky, L.; Zhang, J.; Bolton, E.E. PubChem 2019 Update: Improved Access to Chemical Data. Nucleic Acids Res. 2019, 47, D1102–D1109. [Google Scholar] [CrossRef] [PubMed]
- Sayers, E.W.; Beck, J.; Brister, J.R.; Bolton, E.E.; Canese, K.; Comeau, D.C.; Ostell, J. Database Resources of the National Center for Biotechnology Information. Nucleic Acids Res. 2020, 48, D9–D16. [Google Scholar] [CrossRef] [PubMed]
- Li-Hammed, M.; Adesalu, T.; Tripathi, N.; Asekun, O. Comparative biochemical profiling and industrial application potentials of Dunaliella salina and Spirulina platensis. J. Res. Rev. Sci. 2024, 11, 1. [Google Scholar] [CrossRef]
- Frisch, M.J.; Trucks, G.W.; Schlegel, H.B.; Scuseria, G.E.; Robb, M.A.; Cheeseman, J.R.; Scalmani, G.; Barone, V.; Mennucci, B.; Petersson, G.A.; et al. Gaussian 09, Revision E.01; Gaussian, Inc.: Wallingford, CT, USA, 2009. [Google Scholar]
- Berman, H.M.; Westbrook, J.; Feng, Z.; Gilliland, G.; Bhat, T.N.; Weissig, H.; Shindyalov, I.N.; Bourne, P.E. The Protein Data Bank. Nucleic Acids Res. 2000, 28, 235–242. [Google Scholar] [CrossRef]
- Dennington, R.; Keith, T.; Millam, J. GaussView, Version 5; Semichem Inc.: Shawnee Mission, KS, USA, 2009. [Google Scholar]
- Laskowski, R.A.; Swindells, M.B. LigPlot+: Multiple ligand–protein interaction diagrams for drug discovery. J. Chem. Inf. Model. 2011, 51, 2778–2786. [Google Scholar] [CrossRef] [PubMed]
- Eberhardt, J.; Santos-Martins, D.; Tillack, A.F.; Forli, S. AutoDock Vina 1. 2.0: New docking methods, expanded force field, and Python bindings. J. Chem. Inf. Model. 2021, 61, 3891–3898. [Google Scholar] [PubMed]
- Xiong, G.; Wu, Z.; Yi, J.; Fu, L.; Yang, Z.; Hsieh, C.; Yin, M.; Zeng, X.; Wu, C.; Lu, A.; Chen, X.; Hou, T.; Cao, D. ADMETlab 2.0: An integrated online platform for accurate and comprehensive predictions of ADMET properties. Nucleic Acids Res. 2021, 49, W5–W14. [Google Scholar] [CrossRef] [PubMed]
Figure 1.
(a) a top view of the Keap1 with labeled amino acid residues; (b) side view of the Keap1; the amino acid residues are displayed with line model.
Figure 1.
(a) a top view of the Keap1 with labeled amino acid residues; (b) side view of the Keap1; the amino acid residues are displayed with line model.
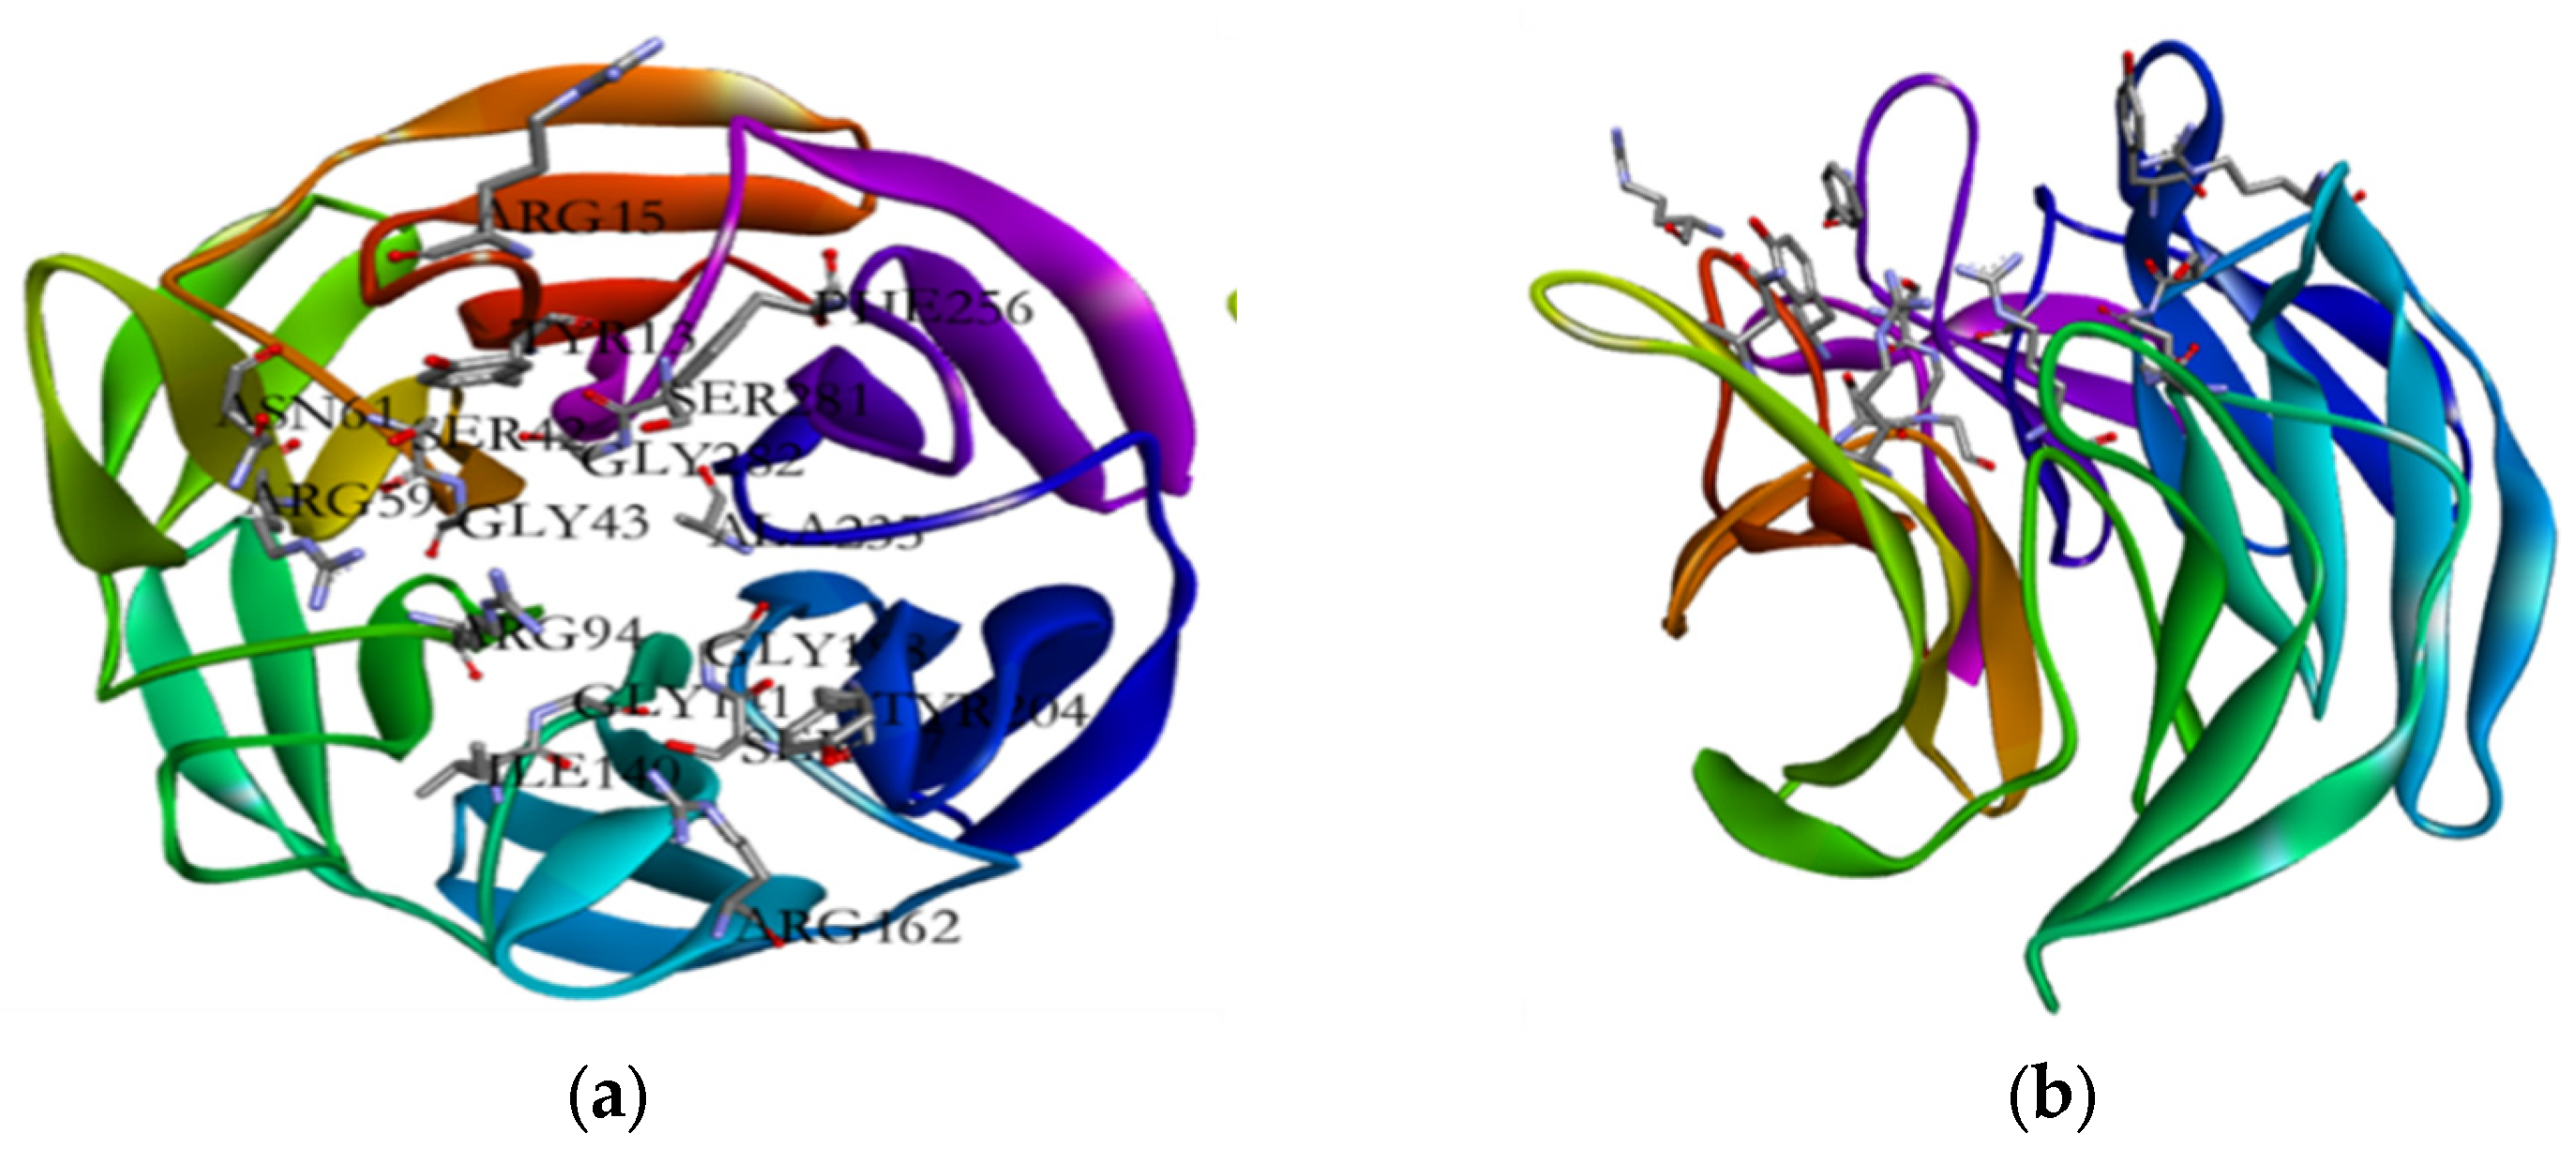
Figure 2.
The (a) 3D docked pose of and; (b) side view of the Keap1; the amino acid residues are displayed with line model..
Figure 2.
The (a) 3D docked pose of and; (b) side view of the Keap1; the amino acid residues are displayed with line model..
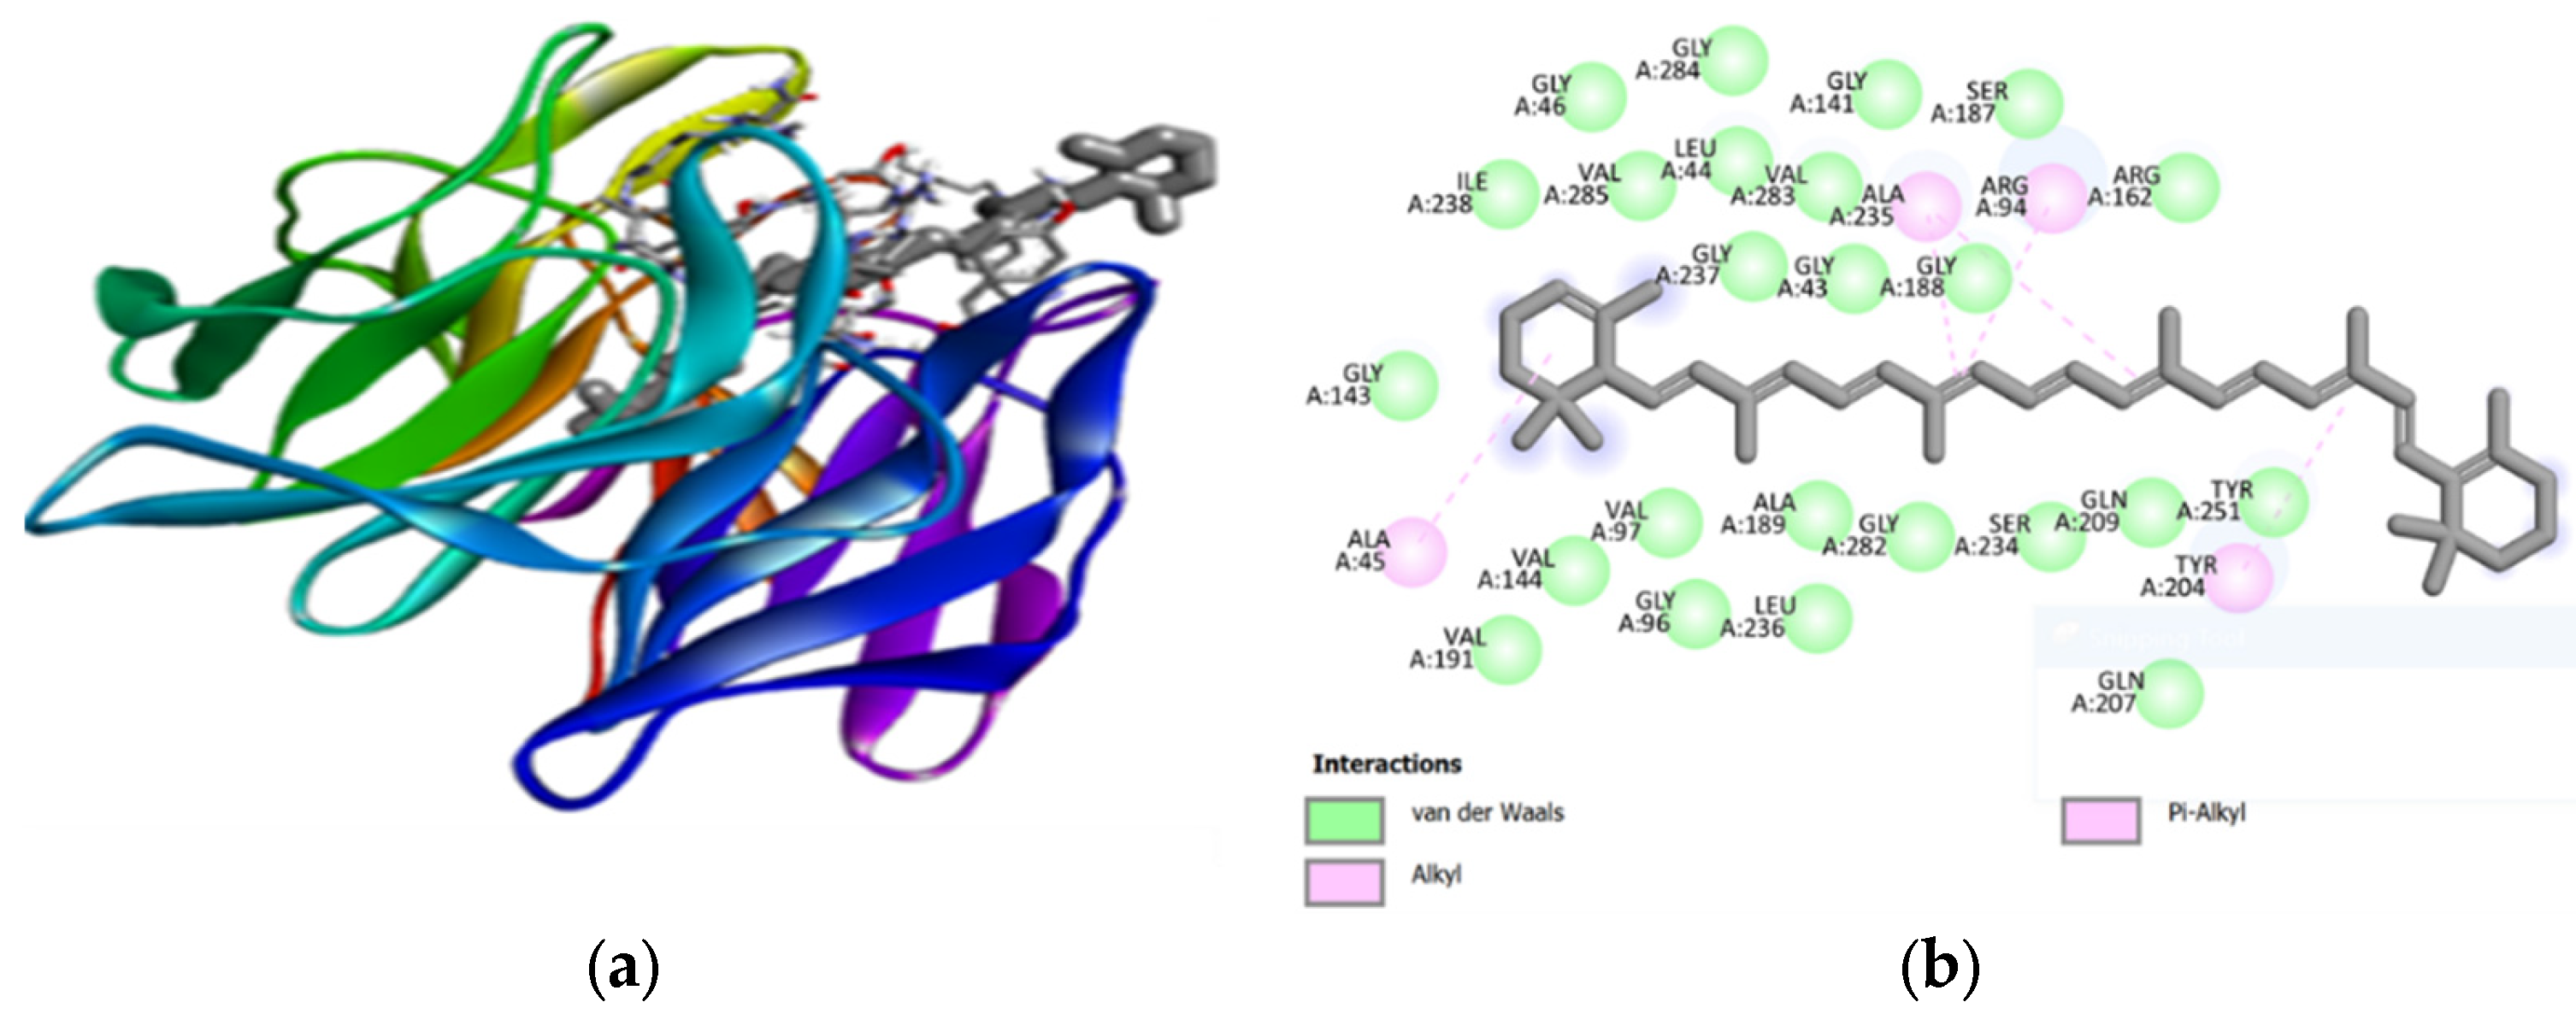
Figure 3.
The (a) 3D docked pose of and; (b) 2D interaction between Beta-Carotene and Keap1 protein target.
Figure 3.
The (a) 3D docked pose of and; (b) 2D interaction between Beta-Carotene and Keap1 protein target.
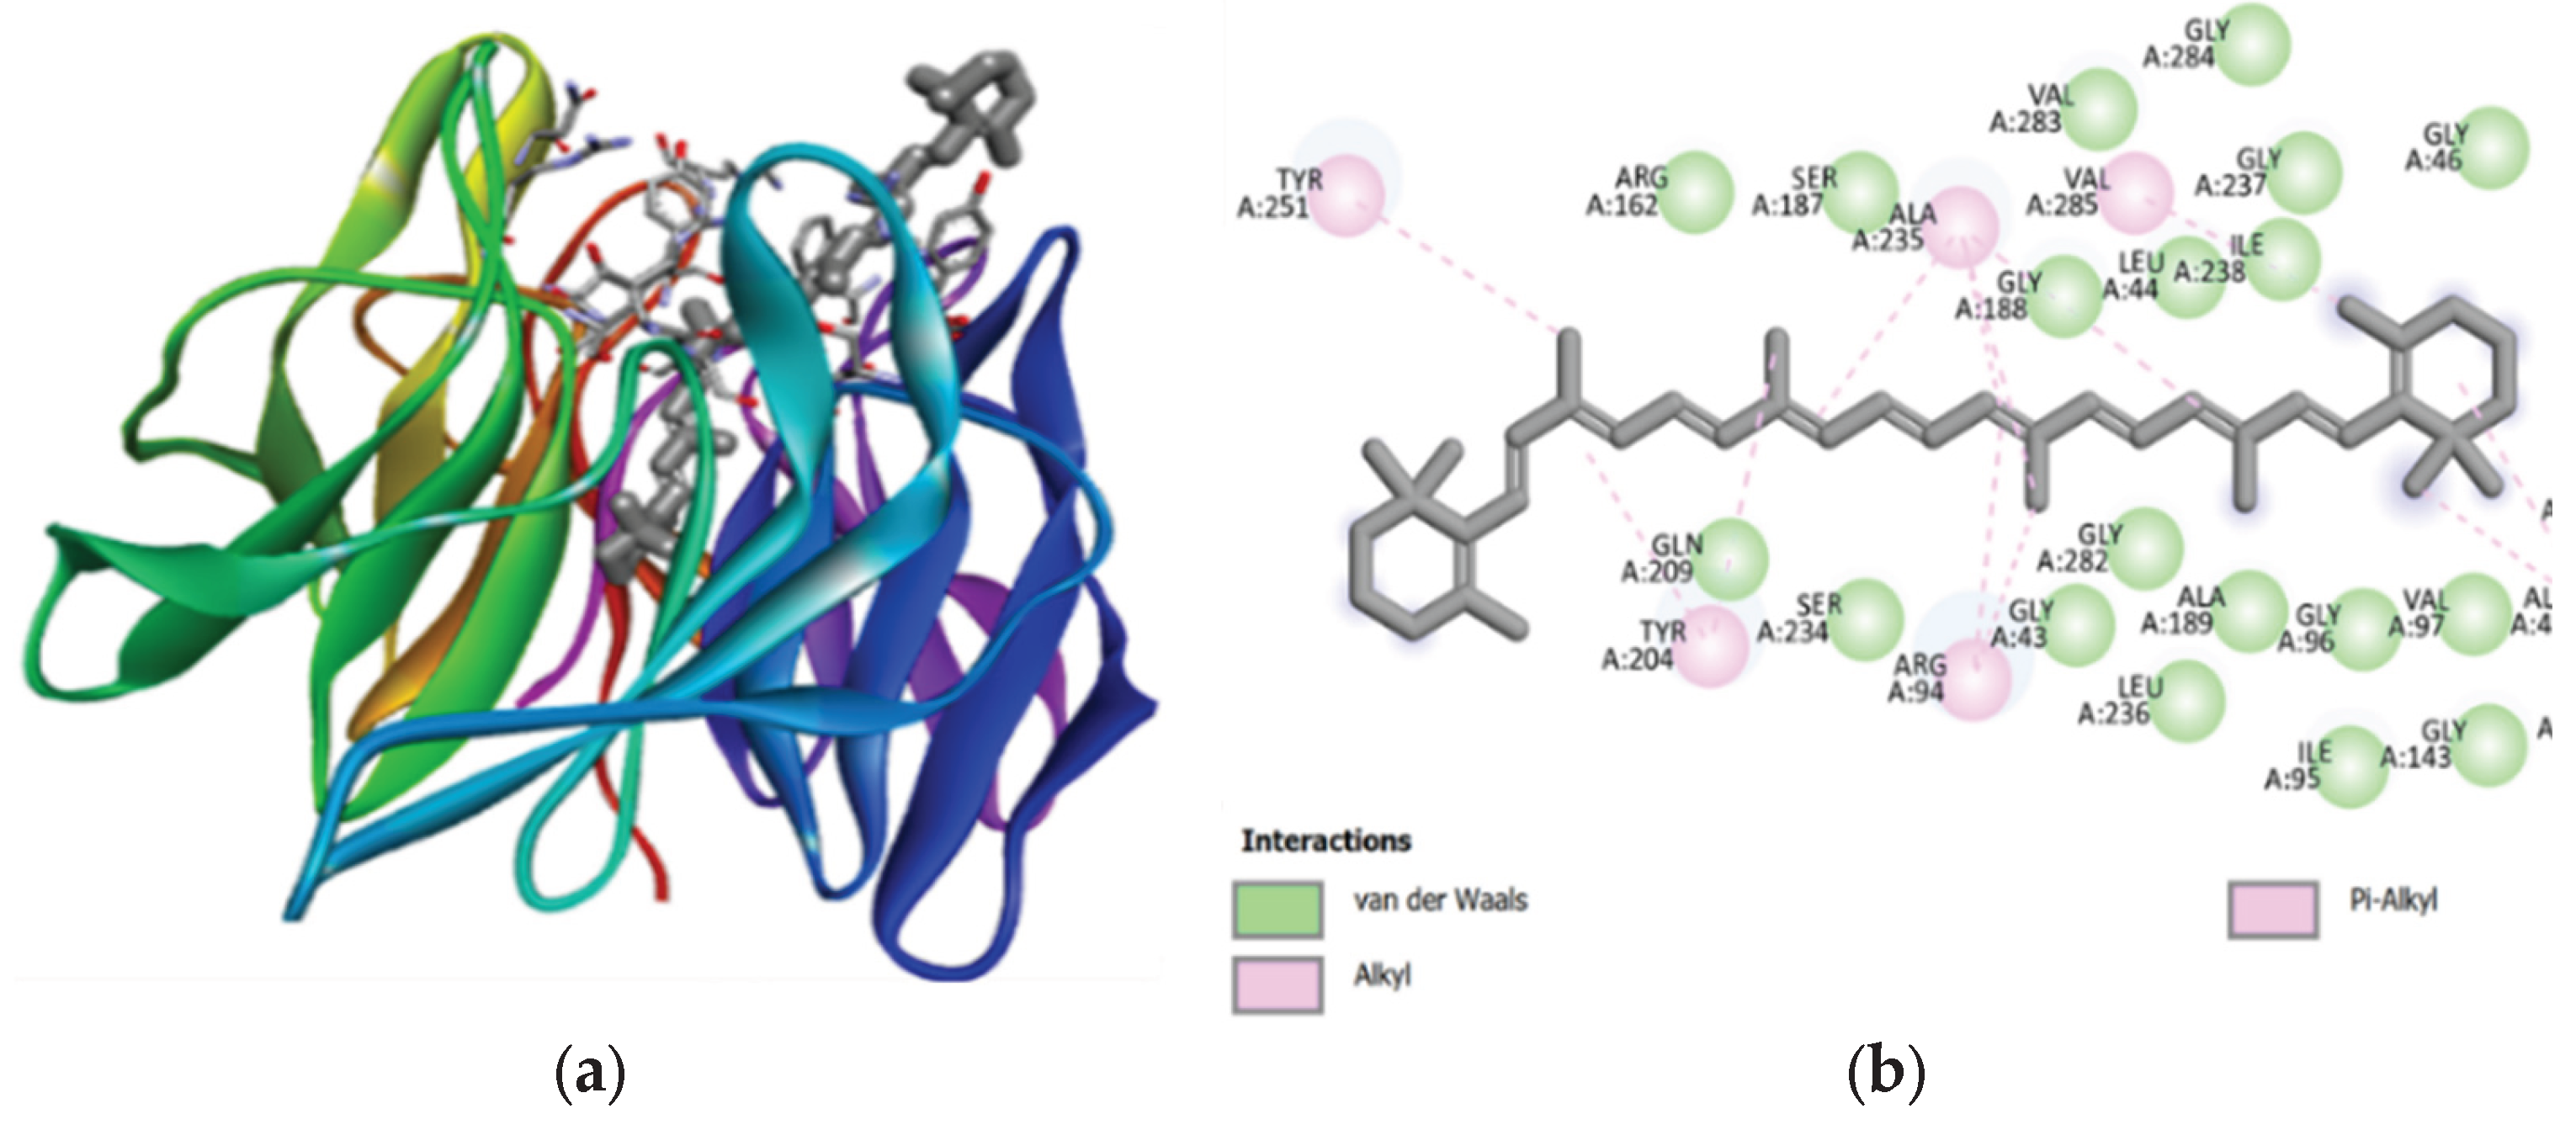

Table 1.
Percentage yield of Dunaliella salina and Spirulina platensis extracts.
| Solvent | Dunaliella salina Yield (%) (Mean ± SD) | Spirulina platensis Yield (%) (Mean ± SD) |
|---|---|---|
| Aqueous | 18.84 ± 0.86 | 24.0 ± 0.50 |
| Methanol | 21.67 ± 0.58 | 14.50 ± 0.50 |
| Ethanol | 15.54 ± 0.54 | 4.06 ± 0.06 |
Table 2.
Phenolic Content of Dunaliella salina and Spirulina platensis extracts.
| Microalgae/Extract | Aqueous (mg GAE/g) |
Methanol (mg GAE/g) |
Ethanol (mg GAE/g) |
|---|---|---|---|
| Dunaliella salina | 15.95 ± 1.25a* | 32.15 ± 2.05b | 4.22 ± 0.37c |
| Spirulina platensis | 70.99 ± 1.03d | 1.98 ± 0.05e | 27.12 ± 0.85f |
* Different letters within a column indicate statistically significant differences (p < 0.05) according to Tukey's HSD test.
Table 3.
Flavonoid Content of Dunaliella salina and Spirulina platensis extracts.
| Microalgae/Extract | Aqueous (mg GAE/g) |
Methanol (mg GAE/g) |
Ethanol (mg GAE/g) |
|---|---|---|---|
| Dunaliella salina | 94.90 ± 0.90a* | 91.56 ± 1.30b | 94.23 ± 2.54c |
| Spirulina platensis | 65.39 ± 2.68d | 52.36 ± 1.93e | 60.47 ± 2.30f |
* Different letters within a column indicate statistically significant differences (p < 0.05) according to Tukey's HSD test.
Table 4.
a. Percentage inhibition of ABTS assay by D. salina and S. platensis extracts in aqueous, methanolic and ethanolic solvents at different concentrations (µg/mL).
Table 4.
a. Percentage inhibition of ABTS assay by D. salina and S. platensis extracts in aqueous, methanolic and ethanolic solvents at different concentrations (µg/mL).
| Conc (µg/mL). | D. salina Aqueous (%) | D. salina Methanol (%) | D. salina Ethanol (%) | S. platensis Aqueous (%) | S. platensis Methanol (%) | S. platensis Ethanol (%) |
|---|---|---|---|---|---|---|
| 50 | 18.310 | 25.34 | 25.55 | 24.66 | 28.96 | 21.17 |
| 100 | 21.040 | 45.49 | 46.11 | 33.13 | 45.56 | 31.97 |
| 150 | 34.970 | 56.76 | 53.01 | 50.48 | 65.1 | 49.59 |
| 200 | 59.150 | 60.31 | 60.79 | 58.33 | 79.03 | 63.80 |
| 250 | 62.300 | 68.03 | 72.95 | 74.86 | 83.27 | 70.36 |
| IC50 | 193.001 | 144.08 | 142.32 | 156.82 | 113.44 | 160.06 |
Table 4.
a. Percentage inhibition of ABTS radical cation by Ascorbic acid and Trolox at different concentrations.
Table 4.
a. Percentage inhibition of ABTS radical cation by Ascorbic acid and Trolox at different concentrations.
| Ascorbic Acid Conc (µg/ml) |
% Inhibition | Trolox Conc (mM) |
% Inhibition |
|---|---|---|---|
| 2 | 25.27 | 0.125 | 17.49 |
| 4 | 44.26 | 0.25 | 22.27 |
| 6 | 63.25 | 0.5 | 47.95 |
| 8 | 85.11 | 1 | 74.32 |
| 10 | 94.13 | 2 | 94.67 |
| IC50 | 4.79 | IC50 | 0.80 |
Table 5.
a. Percentage inhibition of DPPH assay by D. salina and S. platensis extracts in aqueous, methanolic and ethanolic solvents at different concentrations (µg/mL).
Table 5.
a. Percentage inhibition of DPPH assay by D. salina and S. platensis extracts in aqueous, methanolic and ethanolic solvents at different concentrations (µg/mL).
| Conc (µg/mL) | D. salina Aqueous (%) | D. salina Methanol (%) | D. salina Ethanol (%) | S. platensis Aqueous (%) | S. platensis Methanol (%) | S. platensis Ethanol (%) |
|---|---|---|---|---|---|---|
| 50 | 30.56 | 42.67 | 42.42 | 42.18 | 42.85 | 43.77 |
| 100 | 40.46 | 45.42 | 44.56 | 45.23 | 46.39 | 45.23 |
| 150 | 44.62 | 48.41 | 46.33 | 50.37 | 48.41 | 48.66 |
| 200 | 45.60 | 49.63 | 48.59 | 52.93 | 49.76 | 51.47 |
| 250 | 51.47 | 54.16 | 52.44 | 54.83 | 54.03 | 52.44 |
| IC50 | 229.39 | 185.74 | 214.83 | 163.50 | 183.15 | 186.49 |
Table 5.
b. Percentage inhibition of DPPH radical cation by Ascorbic acid and Trolox at different concentrations.
Table 5.
b. Percentage inhibition of DPPH radical cation by Ascorbic acid and Trolox at different concentrations.
| Ascorbic Acid Conc (µg/ml) |
% Inhibition | Trolox Conc (mM) |
% Inhibition |
|---|---|---|---|
| 2 | 35.56 | 0.125 | 15.65 |
| 4 | 47.68 | 0.25 | 26.77 |
| 6 | 53.18 | 0.5 | 39.61 |
| 8 | 67.36 | 1 | 51.96 |
| 10 | 80.81 | 2 | 78.24 |
| IC50 | 4.84 | IC50 | 0.92 |
Table 6.
a. Percentage inhibition of FRAP assay by D. salina and S. platensis extracts in aqueous, methanolic and ethanolic solvents at different concentrations (µg/mL).
Table 6.
a. Percentage inhibition of FRAP assay by D. salina and S. platensis extracts in aqueous, methanolic and ethanolic solvents at different concentrations (µg/mL).
| Conc (µg/mL) | D. salina Aqueous (%) | D. salina Methanol (%) | D. salina Ethanol (%) | S. platensis Aqueous (%) | S. platensis Methanol (%) | S. platensis Ethanol (%) |
|---|---|---|---|---|---|---|
| 50 | 10.66 | 17.21 | 13.93 | 22.13 | 18.85 | 17.21 |
| 100 | 20.49 | 30.33 | 18.85 | 36.07 | 31.97 | 28.69 |
| 150 | 25.41 | 43.44 | 39.34 | 55.74 | 45.08 | 45.90 |
| 200 | 40.16 | 63.93 | 56.56 | 71.31 | 63.93 | 58.20 |
| 250 | 51.64 | 79.51 | 69.67 | 83.61 | 76.23 | 72.95 |
| IC50 | 249.97 | 159.84 | 184.59 | 138.08 | 181.31 | 185.44 |
Table 6.
b. Percentage inhibition of Ferric cations by Ascorbic acid and Trolox at different concentrations.
Table 6.
b. Percentage inhibition of Ferric cations by Ascorbic acid and Trolox at different concentrations.
| Ascorbic Acid Conc (µg/ml) |
% Inhibition | Trolox Conc (mM) |
% Inhibition |
|---|---|---|---|
| 2 | 25.41 | 0.125 | 17.21 |
| 4 | 36.89 | 0.25 | 27.05 |
| 6 | 55.74 | 0.5 | 34.43 |
| 8 | 80.33 | 1 | 59.02 |
| 10 | 100.00 | 2 | 80.33 |
| IC50 | 5.028 | IC50 | 1.014 |
Table 7.
Binding affinity and molecular interaction of selected ligands with KEAP-1.
| Phytochemicals | Binding Affinity (ΔG), kcal/mol |
Amino Acids of keap-1 Receptor Forming h-Bond with Ligand | Other Interactions Involved (Electrostatic/Hydrophobic) | |
|---|---|---|---|---|
| 1 | Alpha-carotene | -10.1 | ALA 45, ALA 235, ARG 94, TYR 204 | |
| 2 | Beta-carotene | -9.9 | ARG 94, TYR 204, ALA 235, ALA 45, VAL 285, TYR 251 | |
| 3 | Beta-cryptoxanthin | -10 | GLY 46 | TYR 204, ARG 94, ALA 235 |
| 4 | Canthaxanthin | -10 | GLY 46 | TYR 204, ARG 94, ALA 235 |
| 5 | Lutein | -9.7 | GLY 46, VAL 285 | ARG 94, ALA 235, TYR 204 |
| 6 | Neoxanthin | -10.1 | VAL 97 | ALA 25, ARG 94, TYR 204 |
| 7 | Violaxanthin | -11.2 | GLY 46, VAL 285 | ARG 94, ALA 235, TYR 13 |
| 8 | Zeaxanthin | -10.1 | VAL 191 | ALA 235, ARG 94, TYR 204, TYR 251 |
| 9 | Lariciresinol4-O-glucoside | -9.8 | VAL144 | ALA 235, ARG 94 , TYR 13, PHE 256 |
| 10 | FolateCID_1 | -10.1 | ALA 189, GLY 46, SER 187, SER 234 | ALA 45, VAL 97, ARG 94, ALA 235 |
| 11 | VitaminB2_Riboflavin | -10.2 | VAL 97, VAL 144, GLY 43, VAL 281 | SER 42, GLY 282 (C-H bond), ARG 94, ALA 235, SER 281 |
| 12 | Phycoerythrin | -7.7 | SER 42, ARG 94, SER 234 | ALA 235, TYR 13, PHE 256, TYR 251, SER 281, GLY 282, GLY 188 |
| 13 | Phytol | -9.8 | ALA 189, VAL 142, ILE 95, ILE 238, VAL 285, SER 187 | GLY 141, ARG 94, ARG 162, GLY 188, VAL 97, LEU 236, VAL 283 |
Table 8.
Predicted toxicity profile of the selected phytochemicals from virtual screening.
| Phytochemicals | BBB | hERG | SkinSen | Carcin. | EC | EI | Resp | LogS | Fu% | H-HT |
|---|---|---|---|---|---|---|---|---|---|---|
| Alpha-carotene | 0.00 | 0.78 | 0.99 | 0.05 | 0.00 | 0.10 | 0.23 | -7.98 | 2.03 | 0.44 |
| Beta-carotene | 0.00 | 0.85 | 0.99 | 0.04 | 0.00 | 0.23 | 0.31 | -7.97 | 2.13 | 0.28 |
| Beta-cryptoxanthin | 0.00 | 0.85 | 0.99 | 0.04 | 0.00 | 0.04 | 0.49 | -7.58 | 2.31 | 0.22 |
| Canthaxanthin | 0.00 | 0.58 | 0.99 | 0.05 | 0.00 | 0.19 | 0.36 | -7.28 | 3.30 | 0.33 |
| Folate | 0.05 | 0.08 | 0.07 | 0.53 | 0.00 | 0.01 | 0.66 | -3.90 | 34.40 | 0.99 |
| Lariciresinol4-O-glucoside | 0.40 | 0.08 | 0.04 | 0.38 | 0.00 | 0.01 | 0.01 | -2.88 | 19.52 | 0.19 |
| Lutein | 0.01 | 0.63 | 0.97 | 0.04 | 0.00 | 0.01 | 0.36 | -6.75 | 2.43 | 0.16 |
| Neoxanthin | 0.37 | 0.80 | 0.99 | 0.52 | 0.00 | 0.02 | 0.86 | -5.86 | 3.13 | 0.70 |
| Phytol | 0.23 | 0.01 | 0.96 | 0.11 | 0.84 | 0.95 | 0.06 | -6.64 | 2.40 | 0.10 |
| Violaxanthin | 0.17 | 0.76 | 0.98 | 0.91 | 0.00 | 0.04 | 0.70 | -6.54 | 2.94 | 0.87 |
| VitaminB2_Riboflavin | 0.44 | 0.03 | 0.01 | 0.03 | 0.00 | 0.01 | 0.22 | -3.66 | 21.69 | 0.12 |
| Zeaxanthin | 0.01 | 0.84 | 0.98 | 0.05 | 0.00 | 0.01 | 0.66 | -7.12 | 2.56 | 0.19 |
Abbreviations: BBB, Blood–Brain Barrier penetration; hERG, cardiac toxicity risk; SkinSen, skin sensitisation potential; Carcin., carcinogenicity; EC, eye corrosion; EI, eye irritation; Resp, respiratory toxicity; LogS, solubility; Fu%, plasma protein unbound fraction; H-HT, human hepatotoxicity probability.
Disclaimer/Publisher’s Note: The statements, opinions and data contained in all publications are solely those of the individual author(s) and contributor(s) and not of MDPI and/or the editor(s). MDPI and/or the editor(s) disclaim responsibility for any injury to people or property resulting from any ideas, methods, instructions or products referred to in the content. |
© 2025 by the authors. Licensee MDPI, Basel, Switzerland. This article is an open access article distributed under the terms and conditions of the Creative Commons Attribution (CC BY) license (http://creativecommons.org/licenses/by/4.0/).
Copyright: This open access article is published under a Creative Commons CC BY 4.0 license, which permit the free download, distribution, and reuse, provided that the author and preprint are cited in any reuse.


