
Submitted:
11 September 2025
Posted:
12 September 2025
You are already at the latest version
Abstract
Modern agriculture aims to reduce the use of pesticides in favor of methods that provide high-quality raw materials for the agri-food industry. This study aimed to determine how using ultrasound in an aquatic environment to treat potato tubers before planting affects them. A three-year field experiment was conducted in central-eastern Poland using the randomized sub-block method in a dependent design, split-plot, in three replications. The main factor studied was the cultivation technology: (a) with ultrasonic treatment of the seed potatoes before planting, and (b) a traditional method without this treatment. The second-order factor was eight edible potato varieties of different earli-ness classes. After harvest, the effect of this method on the quality parameters of the raw material and second order obtained from it were assessed. Sonification helped improve the processing quality of potato tubers. Chips made from sonicated tubers had a lighter color, better overall appearance, and superior taste compared to those from traditionally grown tubers. They also showed less discoloration and had fewer wet spots. The results of the study suggest that ultrasonic treatment of seed potatoes can be an effective method of enhancing the quality of raw material for processing. Further research should focus on the optimization of sonication parameters and the economic analysis of its implementation on an industrial scale. Sonification of potato tubers is a promising, innovative technology with high application potential in the food industry, allowing for the improvement of the quality of the raw material and the finished product (chips) while supporting sustainable agriculture.
Keywords:
potato chip quality
; ultrasonic pretreatment
; sugar reduction
; chip moisture
; frying optimization
; innovative technologies in food processing
; correlation analysis
1. Introduction
Modern agriculture, facing the challenge of limiting the use of pesticides, is looking for innovative technologies to improve the quality of food raw materials. One of the promising methods is ultrasound (above 20 kHz) - a versatile technology used in medicine, industry and agrotechnics [1,2,3,4,5]. Their advantage is non-invasiveness, minimal impact on the environment and the ability to stimulate plant physiological processes [1,6,7,8,9,10]. In food processing, ultrasound is divided into:
The mechanism of action is based on the phenomenon of acoustic cavitation, generating locally extreme conditions (up to 5000 K and 100 MPa), which can affect heat/mass exchange (stable cavitation) or cause destructive implosions (transient cavitation) [1,10]. In the case of potato processing, the key challenge is to control the content of reducing sugars, which at high temperatures lead to undesirable browning of chips [6,11]. Their accumulation is influenced by genetic factors, abiotic stress and storage conditions [12,13,14,15]. A novel approach involves the use of sonication of tubers before planting as a method modulating plant metabolism, including the expression of genes related to sugar synthesis [11,12,13,14]. In the food industry, this technology is already used to improve the quality of products thanks to cavitation effects [3]. Modern agriculture is looking for alternative methods to reduce the use of pesticides, while ensuring high quality raw materials for the food industry. One of the promising technologies is ultrasound – acoustic waves with a frequency above 20 kHz, which are used in medicine, industry, and recently also in agrotechnics [1,2,3,4,5]. Their advantage is non-invasiveness, lack of negative impact on the environment and the possibility of stimulating physiological processes of plants [1,6,7,8,9,10]. Modern food processing technologies are also looking for solutions combining high product quality with the principles of sustainable development. In this context, ultrasound technology is gaining particular importance, which is increasingly used in various stages of food production – from pre-treatment of raw materials – to preservation processes [3,5,8,16,17]. Ultrasound (above 20 kHz) is widely used in medicine (e.g., organ imaging), in the electronics industry (non-contact sensors) and in nature (e.g., echolocation in bats) [10]. In the case of potatoes, the key challenge of processing is to control the content of reducing sugars, which at high temperatures participate in Maillard reactions, leading to undesirable browning of chips and deterioration of taste [6,11,12,13]. Previous studies indicate that the accumulation of sugars is influenced by genetic factors, abiotic stress (water, thermal) and storage conditions [6,13,14,15]. Traditional methods of modifying these parameters are often based on chemicalization, which is contrary to the trend of sustainable agriculture. Ultrasound is a versatile, sustainable and economical technology widely used in food processing for operations such as filtration, freezing, frying, sterilization or cutting. As an alternative, a non-thermal method increases efficiency, extends shelf life and preserves nutrients, while improving physicochemical and sensory properties of food [8,9,14,17,18]. Darsana and Sivakumar [10] emphasize the key applications of ultrasonics as pre-processing and treatment methods in various food sectors. A novel approach to the production of chips is the use of ultrasonics in the prevention of processing defects. Low-frequency ultrasound (20–300 kHz) can modify plant metabolism, including the expression of genes related to sugar synthesis [11,14,17]. In the food industry, this technology is already used to improve the color and texture of fried products due to cavitation effects that occur in an aqueous environment [3]. The aim of this research is to evaluate and optimize the sonication of edible potato tubers as a preliminary pre-processing treatment aimed at improving the quality of the raw material and the sensory properties of the final product, which is consistent with the pursuit of sustainable food production.
Null hypothesis (H0): Sonication of potato tubers before planting has no significant effect on the quality parameters of the raw material or on the properties of the final product (chips) compared to traditional cultivation methods.
Alternative hypothesis (H1): Sonication of potato tubers before planting significantly improves the quality parameters of the raw material and translates into better sensory and visual characteristics of the final product, making this method an effective tool in sustainable agriculture and food processing.
2. Materials and Methods
In southeastern Poland, from 2015 to 2017, a strict field experiment was conducted at the Uhnin Experimental Variety Testing Station (51°34′ N, 23°02′ E, 155 m a.s.l.). The study used a split-split-plot design with three replications. The first-order factor was two technologies: Traditional without the use of ultrasound (control) and technology using ultrasound as a pre-planting treatment. The second factor of the experiment was eight edible varieties from four earliness groups; (very early: ‘Denar’ and ‘Lord’; early: ‘Owacja’ and ‘Vineta’; medium early: ‘Satina’ and ‘Tajfun’; medium late: ‘Syrena’ and ‘Zagłoba’).
2.1. Field Research
The field experiment was conducted in accordance with the methodology of research on the economic values of varieties in force at the Research Centre for Cultivar Testing (COBORU) in Experimental Stations [19]. The potato pre-crop was spring cereal (spring barley). Tubers were planted in the third decade of April at a spacing of 67.5 x 37 cm, the harvest plot was 15 m2, i.e., 60 potato plants were planted in two rows of 30 tubers, in three replications. Standard NPK fertilization was applied; 90 kg N, 90 kg P2O5 and 135 kg K·ha−1. After planting the tubers, weeds were controlled through both mechanical and chemical means. Potato pests and diseases, specifically early and late blight (Alternaria sp. and Phytophthora infestans), were managed according to good agricultural practices [20]. Potato tubers were harvested at the 99° BBCH scale [21]. During harvest, 20 tubers (10 pieces with dimensions of 51–60 mm and over 60 mm) with a shape typical for a given variety, without visible external deformations and greening, were taken from each field experiment replicate, intended for testing chips [19]. In addition, 5.5 kg of tubers were taken from each plot during harvest to determine the content of soluble and reduce sugars [22]. In technology with the use of ultrasound, before planting, potato tubers were subjected to the sonication process in a water environment at a temperature of 18°C for 10 minutes. Pilot studies were used to determine the optimal ultrasound exposure time, as prolonged exposure to ultrasound damaged the potato tuber’s ability to germinate. The sonication process was carried out in a tank device equipped with three piezoelectric ultrasonic transducers attached to the bottom of a tank made of acid-resistant steel (Figure 1). The transducers generated ultrasonic waves and were powered by an alternating current of 50 Hz and an output power of 200 W, in accordance with the Polish Standard PN-IEC 6003 [23]. Potato tubers grown in traditional technology were soaked for 10 minutes in distilled water to create an environment similar to that prevailing in the case of ultrasonic treatment, in order to eliminate the effect of water on the physiology of potato emergence.
2.2. Characteristics of Potato Varieties
The experiment used edible potato varieties that are already well-established in the consumer market [24]. The potato varieties tested showed a range of characteristics related to tuber flesh color, culinary type, flavors, starch content and harvest time. While all varieties had yellow skin, their flesh color ranged from light yellow (for ‘Denar’, ‘Lord’ and ‘Owacja’) to yellow (for ‘Vineta’, ‘Satina’, ‘Tajfun’, ‘Syrena’ and ‘Zagłoba’) [24].
Culinary classifications also varied: ‘Denar’, ‘Lord’ and ‘Vineta’ were AB type; ‘Satina’, ‘Syrena’ and ‘Zagłoba’ were B type; and ‘Owacja’ and ‘Tajfun’ had B-BC flesh [24]. Flavor assessment was generally consistent for most varieties, scoring 7 out of 9. However, the ‘Satina’ variety was rated slightly higher, at 7.5, which indicates slightly better taste quality than the others [24].
Starch content varied significantly, from 12.3% to 16.5%. ‘Tajfun’ (16.5%) and ‘Syrena’ (15.4%) showed the highest starch level, followed by ‘Owacja’ (13.5%) and ‘Vineta’ (13.7%). The lowest starch content was found in tubers of the ‘Denar’ (12.3%), ‘Lord’ (12.4%), ‘Zagłoba’ (12.6%) and ‘Satina’ (12.8%) varieties [24].
The date of potato harvest was related to the maturity groups of the varieties: very early varieties (‘Denar’, ‘Lord’) were harvested in the first ten days of September; early varieties (‘Owacja’, ‘Vineta’) in the second ten days of September; medium-early varieties (‘Satina’, ‘Tajfun’) in the third decade of September; and medium-late varieties (‘Syrena’, ‘Zagłoba’) in the first decade of October. This diversity of features highlights the adaptability and diverse culinary potential of the potato varieties studied [24].
2.3. Laboratory Tests
2.3.1. Chips Rating
The tubers intended for chips were peeled and then cut into 1.0-1.5 mm thick slices. They were then rinsed with cold water to rinse out free starch and dried. The chips were fried by the single stage frying method in vegetable oil heated to 170°C for 3-4 minutes until the moisture content dropped below 2% (Figure 2). Immediately after frying, the color, taste and general appearance of the products as well as their defects, i.e., discoloration and so-called wet spots, were assessed. The color of the chips was assessed on a 9° scale using the “Cards color” table developed by the European Potato Research Association in Wageningen, where 9°—light color; 8°—gold color; 7°—light gold color; 6°—dark gold color; 5°—brown-gold color; 4°—brown color; 3°—dark brown color; 2°—brown color; and 1°—burnt, brown-black color. The desired color of the chips was in the range of 6–9° on a 9° scale. In addition, the visual and organoleptic evaluation of the chips was performed on a 5-point scale, where 5.0–4.5° means a very good result; 4.4–4.0°—good; 4.0–3.0°—satisfactory; 3.0–1.0°—unsatisfactory [25]. The visual, taste, and smell evaluation of the chips was performed by a trained and experienced 10-person team meeting the formal and consumer requirements for the organoleptic and rheological evaluation, in accordance with the EN ISO 8586 standard [26]. Each analysis was performed in 10 replicates.
2.3.2. Determination of Sugars
Technique: Iodometric Luff-Schoorl method with modification [27]. Standards: Glucose standard solutions were used for calibration. Sample preparation: Fresh potato tubers were homogenized and extracted in distilled water (80°C, 30 min). The extract was clarified by filtration and diluted to volume. For each sample, three independent replicates (n=3) were prepared.
Analytical procedure:
- − The following were introduced into the volumetric flask: 10 mL of Luff solution
- − 25 mL of sample.
- − The mixture was heated for 10 min in a water bath (95 ± 2°C). After cooling, 10 mL of KI (10%) and 25 mL of H₂SO₄ (25%) were added.
- − Iodine was determined titrimetrically with sodium thiosulfate (0.1 M) against starch.
Calculations: Sugar content was expressed as:
Reducing sugar [%] =where: V₀ – blank volume, V – sample volume, c – Na₂S₂O₃ concentration; k – conversion factor; m – sample mass.
- − Quality control: Each series was analyzed for:
- − Blank.
- − Positive control (glucose solution).
- − RSD < 5% was assumed for replicates.
Results are expressed as mean ± SD of three replicates.
2.3.3. Fat Content Determination
The fat content in the chips was determined using the Soxhlet extraction method – gravimetric, while the moisture content was measured gravimetrically [28]. Procedure: A sample of chips (5-10 g) was homogenized and pre-dried at 105°C. Extraction with an organic solvent (petroleum ether) for 6-8 cycles. Then, the solvent was evaporated, and the extract was dried to a constant mass. The result was expressed as a percentage of fat content in relation to the sample mass [28]. The advantage of this method was high accuracy and good repeatability (RSD < 2%).
2.3.4. Moisture Content Determination
Moisture content determination was performed using the thermogravimetric method (drying to constant mass). Procedure: An accurately weighed sample (2-5 g) was dried at 105 ± 2°C for 4-5 hours. Cooling was performed in a desiccator, and the samples were weighed again. This procedure was repeated until a constant mass was obtained (difference < 0.5 mg between weighing’s). The result was calculated as a percentage loss in mass. The advantages of this method were simplicity of execution, low cost, RSD ~1-1.5% [28].
2.4. Soil Conditions
The experiment in Uhnin was conducted on Haplic Luvisols soils, good rye complex, quality class IVa [29]. The tested soil was characterized by proper pH and high content of most nutrients, however: Low humus content could limit water and mineral retention; Variable potassium content (the lowest in 2016) could affect yield in drier years; High zinc and boron content was beneficial for tuber quality, especially in the production of chips. These data suggest that the soil was sufficiently fertile, but in dry years it could require additional irrigation or potassium fertilization. High phosphorus and magnesium content minimizes the risk of deficiencies of these nutrients [30].

Table 1.
Content of available forms of phosphorus, potassium and magnesium and some microelements, content of humus and soil acidity before establishing the experiment in 2015-2017.
Table 1.
Content of available forms of phosphorus, potassium and magnesium and some microelements, content of humus and soil acidity before establishing the experiment in 2015-2017.
| Year of research |
Content Macronutrients [mg kg-1 soil] |
Humus content [g kg-1] |
pH [KCL] |
Micronutrients content [mg kg-1 soil] |
||||||
| P | K | Mg | Cu | Mn | Zn | Fe | B | |||
| 2015 | 8.9 | 10.9 | 7.8 | 0.94 | 5.9 | 7.51 | 318 | 40.1 | 3760 | 7.24 |
| 2016 | 8.3 | 9.1 | 7.0 | 1.06 | 5.8 | 4.92 | 337 | 56.7 | 3925 | 5.28 |
| 2017 | 10.6 | 9.8 | 6.3 | 1.03 | 6.6 | 8.99 | 166 | 41.1 | 3600 | 6.04 |
| Mean | 9.3 | 9.9 | 7.0 | 1.02 | 7.02 | 273.8 | 45.96 | 3761.7 | 6.17 | |
Source: Analyzed by the District Chemical and Agricultural Station in Lublin.
2.5. Meteorological Conditions
Meteorological conditions in the study years were varied (Table 2).
The highest rainfall total in the three-year study cycle, during the potato vegetation period, was recorded in 2015. However, the rainfall distribution in this period was not conducive to the accumulation of tuber yield per unit area. During the period of intensive potato plant growth, during the accumulation of tuber yield, in the period June–August, a significant rainfall deficit was observed. September turned out to be very humid and very warm (2.8°C) above the multi-annual average, but the rainfall of this month was no longer decisive for the tuber yield [Table 2]. 2015 was the wettest season (HTC=1.7), especially in May (HTC=3.1) and September (HTC=2.8), but August was exceptionally dry (HTC=0.1) [31]. The lowest total rainfall, but with a favorable distribution of rainfall during the potato vegetation period, was recorded in the second year of the study (2016), and this year turned out to be very warm. Water shortages were recorded only in August and September, in which the total rainfall was only 60% of the multi-annual average with an air temperature higher than normal by 1.7°C (Table 2). The year 2016 was characterized by balanced to dry conditions (HTC=1.3), and July was the wettest month (HTC=1.9) [31]. 2017 was characterized by variable meteorological conditions. April turned out to be very humid, in May the optimal amount of rainfall was recorded, while in June a significant deficit was observed, only 33% of the multi-annual average and was also characterized by an average air temperature higher by 1.5°C. The rainfall balance improved only in July; a rainfall deficit was recorded again in August (Table 2). The year 2017 showed high variability of the hydrothermal coefficient –July was very wet (HTC=2.3), while June and August were dry (HTC=0.4) [31].
2.6. Statistical Calculations
The obtained research results were subjected to statistical analysis based on three-way ANOVA models [32] and Tukey’s multiple T tests, with the assumed significance level of α = 0.05. Letter indicators at means (significance groups) designate so-called homogeneous groups (statistically homogeneous). The occurrence of the same letter indicator means at least one) means no statistically significant difference between them. The significance of the sources of variation was assessed using the Fisher–Snedecor F test, which is responsible for the proportion of variation resolved by each factor in relation to random variation [33]. The ANOVA model generates main effects, as well as two-way interactions between the analyzed factors, considering statistical significance [33]. Additional calculations of effect sizes (e.g., partial eta-square) for the quantitative purpose of practical significance of different functions. The application of Tukey’s test expansion on the detailed mean expansion, effectively identifying statistical differences in groups. Between them were considered important only if they were expanded, significant weight (LSD), considering the difference between treatment methods. Multiple comparison of comparisons to achieve health indicators. Tukey’s study results study allowed detailed comparative analysis and definition of characteristic groups; thus, a solid statistical framework is available for the results and between the studied factors. Confidence divisions for other means were reported for the interpretation of interpretability and additional reliability [33]. In addition, descriptive statistics and simple correlation analysis were presented using the IBM SPSS Statistics program [34], which is used for data analysis, statistical description, explanation of phenomena, prediction and hypothesis testing.
3. Results
3.1. Evaluation of the Quality of Chips
The use of ultrasound as a pre-planting treatment in potato cultivation contributed significantly to the improvement of the quality of chips in such parameters as: color, visual evaluation, organoleptic evaluation, in relation to chips made from tubers obtained using traditional cultivation technology (Table 3).
The genetic properties of the tested varieties significantly modified the discussed features of the chips. The lightest color of the chips, the highest visual assessment and the highest organoleptic assessment were noted for chips made from the following varieties: Tajfun’, Syrena’ and ‘Vineta’, which were placed in one homogeneous group. The darkest color was noted for chips made from tubers of the ‘Denar’ variety, while the lowest visual assessment on a 5° scale was obtained by chips made from tubers of the ‘Lord’ variety, this variety also had the lowest organoleptic assessment, similarly to chips made from the ‘Owacja’ variety (Table 3). Meteorological conditions in the years of the study significantly modified the desired quality parameters of the chips. The agrometeorological conditions of the first year of the study, which was characterized by a deficiency of rainfall, significantly contributed to obtaining chips with the lightest color and at the same time obtained the highest visual and organoleptic assessments, in relation to the other years of the study. In the rainy year of 2016, the darkest chips were obtained, and they were characterized by the lowest visual and organoleptic assessments (Table 3).
The applied cultivation technologies had a significant effect on discoloration, the share of wet spots and fat content in the chips but did not affect the moisture content of this product. The use of ultrasound technology contributed to reducing discoloration by half, as well as a significant reduction in wet spots and lower fat absorption by the chips (Table 4).
Genetic features proved to be a factor significantly influencing all the tested defects and fat content in the chips. The lowest fat content was recorded in chips made from tubers of the ‘Lord’ and ‘Denar’ varieties, the remaining varieties had a similar fat content and were in the same homogeneous group (Table 4). Among the varieties studied, ‘Vineta’, ‘Syrena’, ‘Tajfun’, and ‘Zagłoba’ formed a homogeneous group with the lowest percentage of discolored chips. Chips made from these varieties, except for the ‘Zagłoba’ variety, were also characterized by the lowest moisture content. Chips made from tubers of the ‘Vineta’ and ‘Lord’ varieties had the fewest moist spots and generally had the worst quality parameters. They were characterized by the highest share of discolouration, the highest moisture content and the moistest spots (Table 4). Chips obtained in the first year of the study, in which a significant water deficit was noted, were characterized by the best parameters. They had the least color, were the least moist and had the fewest moist spots, compared to the other years of the study (Table 4).
3.2. Content of Total Sugars and Reducing Sugars
The study of the content of total sugars and reducing sugars in tubers of different potato varieties allows for the assessment of their suitability for processing, especially for the production of chips and French fries (Figure 3).
The total sugar content in the analyzed varieties ranged from 0.74% (‘Syrena’) to 1.45% (‘Zagłoba’). The highest value of this feature was recorded for the ‘Zagłoba’ variety (1.45%), while the lowest sugar content was characteristic of ‘Syrena’ (0.74%). A relatively high level of total sugars may affect the sweet aftertaste of the tubers and their behavior during heat treatment (Figure 3). Reducing sugars play a key role in the frying process because they affect the intensity of the Maillard reaction, responsible for the browning of chips and French fries. The ‘Tajfun’ variety had the lowest content of these sugars (0.29%), which makes it a very good candidate for processing. The ‘Syrena’ (0.31%) and ‘Vineta’ (0.48%) varieties were also characterized by a low content of reducing sugars, which favors their use in the production of chips. The highest value of this feature was recorded for the ‘Zagłoba’ variety (0.74%), which may result in excessive darkening of the chips during frying (Figure 3).
The tested varieties differed significantly in the content of reducing sugars. Four varieties were in two homogeneous groups. The first group included the varieties ‘Tajfun’ and ‘Syrena’, the second group included the varieties ‘Lord’ and ‘Owacja’ with a content of 0.62%, the remaining varieties accumulated a varied content of these sugars in the fresh mass of tubers (Figure 3). For varieties intended for the production of chips, the key criterion is the low content of reducing sugars (below 0.5%). The varieties that met these criteria were ‘Tajfun’, ‘Syrena’ and ‘Vineta’. The variety on the border of acceptability was the medium-late ‘Satina’ (0.54%). The varieties less suitable for this type of processing were: ‘Denar’, ‘Lord’, ‘Owacja’ and ‘Zagłoba’. The high content of reducing sugar increases the risk of excessive browning during frying.
The best suited for potato processing were the varieties ‘Tajfun’, Syrena’, Vineta’ and ‘Satina’, which have the lowest values of reducing sugars. Varieties such as ‘Zagłoba’, ‘Denar’ or ‘Owacja’ may not be suitable for this purpose due to the increased level of reducing sugars, which would result in undesirable darkening of the final products.
The technologies used did not have a significant effect on the content of reducing sugars. Only in the second year of the study, with the highest amount of rainfall, a significant decrease in the content of reducing sugars was observed in the objects where sonication of potato tubers was used before planting (Figure 4).
The genetic properties of the studied varieties in interaction with the variable conditions of the years of the study significantly influenced the content of reducing sugars in potato tubers. The best raw material for the production of chips was obtained in the first and last year of the study. The content of reducing sugars in the fresh mass of tubers in these years did not exceed 0.5%, except for the ‘Zagłoba’ variety. The first year of the study was characterized by a certain deficiency of rainfall, while the last year was characterized by both excess and deficiency of rainfall. In the second year of the study, no significant differences were noted between the varieties. Most varieties accumulated more than 1.0% of sugars in the fresh mass of tubers this year. Only two varieties, Syrena’ and ‘Tajfun’, slightly exceeded their permissible limit (Figure 5).
The applied technologies in cooperation with the genetic properties of the tested varieties in most cases did not have a significant effect on the content of reducing sugars in potato tubers. Under the influence of sonication, a clear tendency towards a lower accumulation of sugars was observed in the tuber. In two cases: in the ‘Denar’ variety, a significant increase in the content of reducing sugars was noted in the object where ultrasound was used in comparison to the traditional technology. In the second case, in the ‘Vineta’ variety, the opposite process was observed, i.e., the applied ultrasonics contributed to a significant decrease in the content of reducing sugars in the fresh mass of tubers, in comparison to the traditional technology (Figure 6).
3.3. Multivariate Statistical Analysis of Quality Characteristics of Potato Chips
Descriptive statistics of the chips and some characteristics of the raw material for chips production, such as sugar content, are presented in Table 5.
Color and sensory evaluation of chips (y1, x1, x2). The average color value of chips (y1) was 7.15 on a 9-point scale, which suggests a good color for the final product. Both the visual evaluation (x1) and the sensory evaluation (x2) of chips oscillated around the value of 3.89–3.97 on a 5-point scale, which indicates a very high sensory quality of this product (Table 6). The coefficients of variation for these features (approx. 23%) indicate a moderate sample variability, which in turn suggests a relative homogeneity of the material (Table 5).
Product moisture and its defects (x3, x4, x5). The moisture content of chips (x3) was on average 2.2% and showed high variability (V = 55.5%) and extreme deviation (max. 15%), which suggests significant differences in the water content of the raw material for chips production (Table 5).
Defects and discolorations (x4) and wet spots (x5) were characterized by the highest variability (V = 139–158%) and strong skewness and kurtosis, which indicates the presence of extreme cases (e.g., samples with no defects at all or with a high proportion of them). The average value of defects was 6.9%, and wet spots 2.6% (Table 5).
Fat content (x6). The average fat content in the chips was 27.59%, with a relatively low variability (V = 9.74%), which indicates a homogeneous frying process. Low kurtosis and moderate skewness suggest a distribution close to normal (Table 5).
Sugar content in tubers (x7, x8). The content of total sugars (x7) was on average 1.05% and reduced sugars (x8) 0.53% in the fresh weight of tubers. The high variability of these parameters (V = 73% and 63%, respectively) indicates significant differences between varieties, which is important because the content of reducing sugars strongly affects the intensity of darkening of chips during frying. Too high a content of these sugars (>0.5–0.6%) may lead to undesirable darkening of products (Table 5).
Most of the tested samples obtained high scores in the sensory evaluation, but the variability in the content of defects, spots and reducing sugars, which affect the final quality of chips, may be a major problem. The greatest threats to the quality of chips may be too high a content of reducing sugars in the tubers of some varieties and the presence of defects, which indicates the need for careful selection of varieties and optimization of the conditions of storage and processing of tubers.
3.4. Correlations Between Potato Chips Quality Parameters—Statistical Analysis
Table 6 with Pearson correlations shows the relationships (strength and direction of dependence) between various features assessed in the study of potato chips quality and sugar content in the potato raw material. The purpose of the table is to determine which factors affect the quality of chips - including their color, appearance, taste, fat and sugar content, as well as the occurrence of defects.
The correlation coefficient measures the strength and direction of a linear relationship between two variables. The cooler of the chips was characterized by an excellent positive correlation with the visual assessment and the organoleptic assessment of the chips. On the other hand, the color of the chips was strongly negatively correlated with the defects and discolourations of the chips (-0.62) and the content of reducing sugars in the fresh mass of the tubers (-0.54) (Table 6). The visual assessment of the chips was highly positively correlated with the organoleptic assessment of the chips (0.88), and with a high negative correlation with the defects and discolourations of the chips (-0.71) and the number of wet spots on the chips (-0.54). A strong negative correlation was observed between the organoleptic assessment of the chips and their defects, discoloration, and the number of wet spots. Specifically, the correlation coefficients were -0.67 for defects and discoloration, and -0.58 for wet spots. Our own research shows that the defects and discoloration of chips go hand in hand with the number of wet spots in the chip; this positive linear correlation, unfavorable in the production of chips, reached the value of (0.67) (Table 6).
Sensory evaluation and color of chips (y1, x1, x2). There was a very strong positive correlation between the color of chips (y1) and their visual evaluation (x1), as well as between color and organoleptic evaluation (x2) (r = 0.78). This means that the lighter and more uniform the chips, the better they were evaluated by tasters. The correlation between the visual and organoleptic evaluation of chips (x1 and x2) was also high (r = 0.88), which indicates their consistency in the perception of quality (Table 6).
Moisture content of chips (x3). The water content in chips (x3) shows a weak relationship or no correlation with other features - the greatest negative correlations, but still weak, occur with sensory evaluations (e.g., with x1: r = -0.25). This suggests that water content is not directly perceived by tasters and does not significantly affect the color or fat content of the chips (Table 6).
Defects and discolouration (x4), damp spots (x5). Defects and discolouration (x4) were strongly negatively correlated with sensory scores and chip color (r = -0.62 to -0.71), clearly indicating that increased defects reduce the quality of the chips. Damp spots (x5) also had a moderately strong negative correlation with sensory scores (r = -0.54 to -0.58) and were found to be moderately positively correlated with defects (r = 0.67), suggesting a common source of these undesirable features (e.g., technological or storage problems) (Table 6).
Fat content (x6). Fat content (x6) shows a moderate positive correlation with their sensory scores (e.g., r = 0.43 with x2), which may suggest that chips with a higher fat content may be more acceptable in terms of taste and texture. At the same time, fat content did not correlate significantly with their moisture or with the sugar content of the raw material (Table 6).
Total sugars (x7) and reducing sugars (x8). The strong correlation between total and reducing sugars (r = 0.94) indicates their close interdependence, which is expected since reducing sugars are part of total sugars. Reducing sugars (x8) were significantly negatively correlated with the color of the chips (r = -0.54) and sensory scores, confirming that higher levels of them lead to darkening of the chips and their deterioration (Table 6).
Table 6 allows us to understand which features are strongly related to each other and which do not have a significant effect on each other.
4. Discussion
4.1. The Effect of Sonification on Potato Metabolism and Chip Quality—Current Mechanisms and Practical Implications
Own studies prove that ultrasonic waves activate metabolic processes in potato plants. In the studies, based on pilot studies, the optimal time of sonication of tubers was assumed to be 10 minutes, which is consistent with the reports of Teixeira da Silva & Dobránszki [35], Guiné et al. [36], Kutlu et al. [3]. This state that the use of acoustic sound or ultrasound in extreme conditions with too high frequency or for long periods of exposure are harmful and even fatal to plants, while milder conditions of sonication can improve the growth or development of plants and affect the antioxidant system and hormonal balance of plants. The results of the studies by Antunes-Rohling et al. [37] confirm that ultrasonic treatment (US) significantly affects the properties of potatoes before frying, and optimal parameters can effectively reduce the content of acrylamide in chips. These authors showed that:
- − The temperature of 42°C favors water absorption, especially at lower ultrasound powers, which may be due to partial denaturation of cell membranes facilitating diffusion.
- − Extraction of reducing sugars is most effective at 35 kHz and 92.5 W kg-1 (31% reduction), which directly translates into a reduction of the Maillard reaction during frying.
- − Changes in colorimetric parameters (↓L, ↑a) confirm the relationship between US treatment and the reduction of non-enzymatic browning.
- − A 90% reduction of acrylamide compared to untreated samples proves that sonication can be a key strategy in the production of healthier chips.
Practical implications:
Optimal parameters (35 kHz, 92.5 W kg-1, 42°C) provide a double benefit: improved food safety (less acrylamide) and sensory quality (better color). Further optimization is necessary for process scaling, especially energy balance.
Own research and reports by Kutlu et al. [3] indicate that the use of ultrasound significantly improves the color of chips, compared to traditional technology. The latest studies [9,38] prove that this effect results from: short-term activation of ROS pathways, leading to: increased activity of antioxidant enzymes (SOD, CAT), modulation of expression of genes related to carbohydrate metabolism; inhibition of non-enzymatic browning reactions by destabilization of polyphenol oxidase (PPO). At the same time, it has been shown that long-term exposure (>15 minutes) leads to degradation of cell membranes and unfavorable sensory changes [6,9].
4.2. Optimization of Potato Chip Production Processes Using Ultrasonic Technology
The use of ultrasonic technology in potato chip processing offers producers and consumers a number of benefits that can significantly improve product quality, production efficiency, and environmental impact. Prempeh et al. [11] refers to this approach for food processing in general. Here are their suggestions for the use of ultrasound in potato processing are presented below:
- Ultrasound can be used to pretreat seed potatoes, which can accelerate germination, improve nutrient absorption, and strengthen plant immunity. This can lead to more uniform growth and healthier tubers with the desired reducing sugar content.
- Optimization of Processing:
- − Washing and Cleaning: Ultrasound can assist in removing dirt from potato surfaces, which is more effective than traditional methods and can reduce water consumption.
- − Slicing: Ultrasonic pretreatment before slicing can affect potato texture, facilitate precise cutting and minimize cell damage [55].
- − Blanching: The use of ultrasound during blanching helps shorten the process time, improves the inactivation of enzymes responsible for browning (e.g., polyphenoloxidase), and reduces nutrient loss.
- − Draining/Dewatering Before Frying: Ultrasound can increase the porosity of potatoes, which facilitates the removal of excess water before frying, shortening frying time and reducing fat absorption.
- − Frying: Ultrasound during frying can accelerate the process, resulting in crispy potatoes while reducing fat content. It can also contribute to even heat distribution and reduce acrylamide formation.
- − Reducing Product Darkening: Direct ultrasound exposure can help control the Maillard reaction, reducing excessive browning of chips, which is crucial for consumer acceptance.
- Improved Quality and Shelf Life of the Final Product: Ultrasound can affect the cellular structure of potato flesh, resulting in improved texture and the desired crispness of the chips.
- o Shelf Life: Inactivating microorganisms and enzymes with ultrasound can extend the shelf life of chips by reducing mold growth and spoilage.
- o Reducing the Use of Chemical Additives: Thanks to the significant effectiveness of ultrasound in blanching and enzyme inactivation, it is possible to reduce or completely eliminate the use of chemical antioxidants or browning inhibitors.
- Sustainability:
- − Reduced Energy and Water Consumption: Process optimization with ultrasound can lead to energy savings and reduced water consumption throughout the production cycle.
- − Waste Reduction: Improving raw material quality and improving production processes can reduce rejection and post-production waste.
Figure 7 shows key applications of ultrasound technology in potato chip production, illustrating its impact at various stages—from stimulating potato growth, through optimizing processing, to improving the quality and shelf life of the final product. The diagram also highlights environmental and economic benefits, such as water and energy savings, and reducing chemicals.
4.3. The Effect of Potato Sonication on Sugar Metabolism
In the opinion of Sawicka et al. [6], Zgórska & Czerko [12,13], Sawicka & Pszczółkowski [14], Zgórska & Sowa-Niedziałkowska [43], Grudzińska & Zgórska [53] the determination of reducing sugars in potatoes is crucial for the quality of processed products. Due to the high genotypic variability, Peraza-Alemán et al. [39] developed predictive models using near-infrared hyperspectral imaging (NIR-HSI). The best model (SNV-PLSR) achieved R²=0.88 (calibration) and 0.86 (validation), and variable selection algorithms (CARS, iPLS) reduced the number of wavelengths to 2.65–3.57% without losing accuracy. The visualization of sugar distribution at the pixel level con-firms the usefulness of NIR-HSI in assessing the quality of raw material for chips pro-duction. The sugar content in potato tubers is strongly genotype-dependent [14], and sonication, in the opinion Peraza-Alemán et al. [38] does not significantly alter their levels. Key factors influencing sugar accumulation include (Table 7).
According to industry standards [44], acceptable sugar levels are Chips: ≤1.5 g·kg⁻¹ (max. 2.5 g kg⁻¹), French fries: ≤2.5 g·kg⁻¹ (max. 5 g kg⁻¹).
Mechanisms of Chip Quality Improvement. The 9.5% improvement in color is attributed to: PPO inactivation via cavitation-induced protein denaturation [9,54]; Structural changes in tuber tissue: Increased porosity → faster water evaporation (↓ final moisture by 12%); Enhanced oil diffusion during frying [6,8,12].
Industrial Implications: Recent recommendations from European Commission: Directorate-General for Health and Food Safety [55] highlight: Customizing sonication parameters based on: Cultivar (e.g., low-starch potatoes require shorter exposure); End-use (chips vs. fries vs. puree); Synergy with emerging technologies: Pulsed electric field (PEF), Low-temperature plasma treatment Antunes-Rohling et al. [37].
Future Research Directions: Further studies should focus on: Molecular mechanisms of potato response to acoustic stress, Optimization for different farming systems (conventional vs. organic), Integration with AI and NIR spectroscopy for raw material sorting [37].
Key Improvements: More concise and structured (bullet points, table for key factors).
- − Stronger academic tone (precise terminology, passive voice where appropriate).
- − Better readability (logical flow, clear cause-effect relationships).
- − Consistent formatting (uniform units, proper citation style).
4.4. The Effect of Ultrasonic Treatment on the Fat Content of Chips
The results of the conducted studies indicate a significant relationship between starch content and chip quality. Studies by Zhang et al. [8] on structural modifications of starch induced by ultrasound and reduction of oil absorption during frying have shown, among others:
- − Morphological changes in starch: Erosion of the surface of starch granules under the influence of ultrasound (confirmed in microscopic studies) led to the formation of a more compact internal structure of chips. Reduced water mobility in the raw material for the production of chips after US treatment limits moisture migration during frying [8,45]
- − Mechanisms of fat absorption reduction: Modified starch structure creates a barrier limiting oil penetration (confirmed by NMR measurements), while faster water evaporation (up to 25% faster) promotes the formation of a surface layer inhibiting absorption. This in turn leads to reduced surface viscosity of the raw material for chips production (rheological measurements) [36,45,46].
This results in practical implications, such as:
- − US treatment at 35-45 kHz for 5-8 minutes allows us to achieve a reduction of the final fat content by 18-22% [47].
Development prospects for the production of chips are primarily:
- − The need for optimization for different potato varieties (different starch content).
- − Research on scaling the process with consideration of energy efficiency [46].
- − Glucose content in tubers is usually 80.5–97.6% of the coefficient of variation V for the brightness of French fries and 88.4–94.2% for the brightness of potato chips.
- − The critical range of glucose content for acceptable products in French fries and chips based on color values (L* and a*) is 12–22 mg/100 g and 8–14 mg/100 g, respectively, for the tested varieties [45].
4.5. The Influence of Varieties on the Quality of Chips
4.5.1. Key Parameters Quality and Varieties for Chip Production
The latest studies confirm that chip quality is mainly influenced by reducing sugar content (the main factor of darkening in the Maillard reaction); dry matter, which determines the texture and chipness of chips; starch content and its structure, which affects fat absorption; enzymatic activity (e.g., polyphenoloxidases responsible for browning) [14].
According to the conducted research, the ‘Tajfun’ variety is still the leader, due to the low content of reducing sugars (<0.3%) and high dry matter content (>22%).
‘Syrena’ - is a variety with stable parameters even in unfavourable climatic conditions (lower accumulation of sugars with temperature fluctuations).
‘Vineta’ - this variety can be recommended due to the uniform structure of the flesh, which limits uneven frying.
‘Satina’ variety - requires strict storage control, but new research indicates that appropriate storage conditions (4°C, humidity 90%) can maintain sugars at an acceptable level (<0.5%).
Varieties not recommended for chips processing: ‘Lord’ and ‘Owacja’ – despite agrotechnical improvements, they showed high variability of sugar content, which makes quality control difficult. Variety ‘Zagłoba’, even with optimal storage, exceeds the permissible standards for reducing sugar content (>0.7%)
4.5.2. Indications for the Processing Industry
Recommendations for the Processing Industry in the Context of the Latest Knowledge:
- − Optimal Variety Selection: The Tajfun and Syrena varieties continue to demonstrate high reliability in terms of quality parameters of the raw material for the production of chips. However, in the light of ongoing climate change and new research appear as promising alternatives, potentially demonstrating better tolerance to extreme growing conditions. Nevertheless, the recommendation of specific varieties should consider the latest results of field trials in different regions and years, assessing their yield and quality stability under changing conditions.
- − Monitoring of Storage Conditions: Close monitoring of storage conditions remains crucial. The latest research [citations on the effect of controlled atmosphere, humidity and temperature on the long-term quality of potatoes for processing] confirms that even varieties with the best quality potential can be degraded as a result of inappropriate temperature and humidity. It is worth considering the implementation of predictive systems based on modeling the impact of environmental conditions during the growing season on the optimal storage parameters of a given batch of raw material.
- − Further and broader integration of fast and non-destructive measurement technologies, such as near-infrared spectroscopy (NIR) and hyperspectral imaging (HSI), is necessary for routine assessment of reducing sugar content and other key quality parameters of the raw material before processing. The latest achievements in artificial intelligence and machine learning enable the creation of more precise and efficient quality assessment systems in real time, which allows for optimization of the production process and minimization of losses.
- − Holistic Approach to Quality: The latest research [citations integrating the impact of variety, agrotechnics and storage on chip quality] confirms that variety is the foundation of chip quality, but its potential can only be fully exploited with the use of optimal agrotechnical practices (considering adaptation to climate change, e.g., precise irrigation, fertilization) and precise storage conditions. Progress in potato breeding, focused on traits useful for processing and resistance to abiotic stresses, must go hand in hand with the implementation of integrated quality management systems at every stage of the supply chain [7].
- − Implementation of Recommendations: Conscious and consistent implementation of the latest recommendations, based on solid scientific research and innovative technologies, is crucial for significant improvement of production efficiency, cost reduction, ensuring high and stable quality of chips and increasing consumer satisfaction in the face of dynamically changing climatic and market conditions.
4.6. Influence of Climatic Conditions on the Quality of Raw Material for Chip Production
4.6.1. Influence of Temperature During the Vegetation Period
Our own research and literature data [48,49,50] clearly indicate that warm summers (average daily temperature >20°C) contribute to a decrease in the content of reducing sugars in potato tubers (<0.4% for the Tajfun variety, <0.5% for the Syrena variety). At the same time, a higher dry matter content (>22%) has a positive effect on the chipness of chips. A negative correlation (r = -0.72) between temperature and sugar accumulation was confirmed. Conversely, cool summers (average daily temperature <15°C) result in an increase in the level of reducing sugars by up to 30–50% (e.g., up to 0.7% in the Satina variety), increasing the risk of uneven frying and darkening of chips as a result of the Maillard reaction. Research by Pszczółkowski et al. [16], Zgórska & Czerko [13], Zgórska and Grudzińska [41], clearly confirms that low temperature (both during cultivation and storage) leads to a phenomenon called “cold-induced sweetening” (CIS). In this process, starch, the main component of potatoes, is broken down into simple sugars, such as glucose and fructose. These sugars are the main precursors of potato chip darkening.
4.6.2. Effects of Water Stress
According to the findings of Parra-López et al. [51] and Sawicka and Pszczółkowski [14], drought (rainfall <300 mm/year) leads to an increase in dry matter, which is desirable from the point of view of the texture of chips. However, it induces the accumulation of reducing sugars (metabolic stress), especially in sensitive varieties such as Lord and Owacja. It is worth noting that drip irrigation can reduce the increase in sugars by up to 15–20%. The authors [15,16,43,51] emphasize that modern technologies, including remote sensing and artificial intelligence, play a key role in the effective management of water resources in agriculture, and precision irrigation is a commonly used digital strategy. In turn, excess rainfall (>500 mm/year) causes a decrease in dry matter content (<20%), which results in the production of soft and not very chippy chips. In addition, plant susceptibility to diseases (e.g., P. infestans) increases, which indirectly contributes to an increase in sugar content in the raw material.
4.6.3. Extreme Weather Phenomena
Analysis of data from our own research from 2015–2017 and studies [51] showed that heat waves (>30°C) inhibit tuber growth but paradoxically may lead to a decrease in the sugar content (due to accelerated conversion to starch). Nevertheless, the risk of tuber deformation increases, which negatively affects the uniformity of the chips produced. Conversely, early autumn frosts can cause a rapid increase in the sugar content of potatoes (up to 1% in the ‘Zagłoba’ variety), necessitating an earlier harvest for late-ripening varieties. Many scientific publications [14,16,41,43,48] confirm the negative correlation between temperature and sugar accumulation in potatoes. This means that as temperature increases, the content of reducing sugars decreases and vice versa. High temperatures during potato vegetation (above 20°C), particularly during tuber formation, help maintain low levels of reducing sugars. According to Hu et al. [51], Pedrosa et al. [52] and Grudzińska and Zgórska [53] this is because the potato expends more energy on starch synthesis rather than on its breakdown. As a result, the tubers have a lower sugar content and a higher dry matter content, which is desirable in potato chip production.
4.6.4. Influence of Storage Conditions
The relationship between meteorological conditions during the growing season and optimal storage conditions has been confirmed by [12,13,14] and our own studies. Tubers from wet years require a lower storage temperature (3–4°C) to limit starch hydrolysis. On the other hand, tubers harvested in dry years tolerate storage at a higher temperature (6–8°C) better due to a lower risk of sugar accumulation [42,43]. In the context of climate change and the latest knowledge: Extreme Weather Events:
- − Climate change is causing an increase in the frequency and intensity of extreme weather events, such as heat waves, droughts, floods, storms and hailstorms. Each of these events can negatively affect the yield and quality of the raw material through mechanical damage, water stress, root hypoxia and increased susceptibility to diseases and pests [6,14,17,40,41].
- − Elevated CO₂ Levels: Increased atmospheric carbon dioxide concentration can modify plant physiology, often stimulating photosynthesis, but at the same time potentially reducing protein and micronutrient content (so-called dilution effect). Increased atmospheric CO₂ concentration, as a result of CO₂ fertilization, stimulates photosynthesis. Plants, having more substrate (CO₂) to build sugars, increase their growth rate and produce more biomass (carbohydrates, such as starch). However, this increase in carbohydrate production is often not accompanied by increased nitrogen uptake from the soil, which is essential for protein synthesis [54]. As a result, despite an overall increase in yield, the concentration of proteins and some micronutrients (e.g., molybdenum, iron) per unit of plant mass decreases. This is known as the dilution effect. Although the plant is larger, it is “diluted” in terms of nutrient content, which has consequences for the nutritional value of the crop [54].
- − Phenological Changes: Higher temperatures can accelerate plant development cycles, shortening the vegetation period, which can lead to lower yields and changes in the chemical composition of the raw material [17].
- − Pest Spread: Climate change can promote the migration and increased activity of pests and pathogens, which indirectly worsens the quality of crops through damage and the need for more intensive plant protection. The observation regarding the ‘Satina’ variety is particularly important, which, despite its recognized stability in terms of reducing sugar content, may be susceptible to heat stress. Current knowledge in this area focuses on:
- − Physiological Mechanisms: High temperatures during tuber formation and maturation accelerate respiration and starch metabolism. Under conditions of extreme heat stress, the rate of starch synthesis may be lower than its decomposition into simple sugars (glucose and fructose) and then sucrose. Additionally, heat stress may disrupt the activity of enzymes key to starch synthesis [6,16,17].
- − Genotype-Environment Interaction (GxE): Studies [6,15,16,40,41] confirm a strong interaction between genotype and environment. Potato genotype determines the chemical composition of tubers, including the potential content of dry matter, starch and sugars. However, environmental conditions such as temperature, soil moisture, sunlight or fertilization can significantly modify these values. The right proportion of starch and sugars is crucial for obtaining chippy, non-burning chips with the desired color. Some potato genotypes can accumulate the ideal amount of dry matter, starch and reducing sugars only in specific climatic conditions, which is confirmed by the results of the conducted research. In addition, genetics is largely responsible for the shape and size of potato tubers. The environment in which the tubers grow can also affect their uniformity. Uniform, shapely potato tubers are easier to cut into slices of equal thickness, which translate into even frying and better texture of chips. Some genotypes may be more susceptible to deformation in unfavorable soil conditions [7]. Dry matter content: Genotype and environment jointly affect the dry matter content of potatoes. Higher dry matter content usually means lower water content, which is desirable for chip production because it shortens frying time and reduces oil absorption, leading to chips and less greasy chips. Some varieties can only achieve high dry matter content under specific irrigation conditions [7,13,16,42]. Disease and pest resistance: Genetically determined resistance to diseases and pests is crucial for healthy tubers. However, pathogen and pest pressure can vary depending on the environment. A variety that is resistant in one region may be susceptible to another due to different climatic conditions favoring the development of specific pathogens. Healthy potato plants are essential for the production of high-quality chips [6,14,40]. Both genotype and environment can affect the content of phenolic compounds, which can affect the taste and shelf life of chips. Some potato genotypes naturally have higher levels of these compounds, but their levels can be further modified by growing conditions such as water stress, salt stress, or sunlight [7]. A strong interaction between genotype and environment means there’s no single potato variety that’s universally best for making chips. The ideal variety depends heavily on the specific growing conditions. The quality of chips depends largely on whether a given genotype is grown in its optimal environmental conditions. Chip producers, striving to obtain a product of high and stable quality, must consider this complex interaction, carefully selecting both potato varieties, their growing regions, and the agricultural practices used. The studies conducted provide concrete examples of how specific combinations of genotype and environment affect specific quality traits of chips.
4.7. Ality Evaluation Relationships
The analysis revealed important connections between different assessment methods:
Visual and sensory evaluations showed remarkable agreement (r = 0.88), suggesting consistent quality perception across evaluation methods. Both evaluation types were adversely affected by:
- − Defects and discolorations (visual: r = -0.71; sensory: r = -0.67)
- − Moisture spots (visual: r = -0.54; sensory: r = -0.58)
A high correlation (r = 0.88) between visual and sensory assessments is widely confirmed in food research [15,16,42]. Appearance, color, and the absence of surface defects create the first impression, which largely coincides with subsequent assessments of taste, aroma, and texture. This phenomenon is particularly important in the case of crisps, where golden color and the absence of discoloration are key determinants of desired flavor and crispness [17]. The negative correlation between defects (r = −0.71) and discoloration (r = −0.67) and quality assessment is fully consistent with studies by other authors. In the case of crisps, dark spots and uneven color are a direct result of excessive Maillard reaction and may indicate an increased content of reducing sugars in the raw material. The studies by Zgórska and Grudzińska [43], Pszczółkowski et al. [16] showed that dark fried products are rated lower by consumers due to their bitter aftertaste and unappetizing appearance. Moisture stains (r=−0.54) also negatively correlate with quality, as they suggest that the product is not fried or stored properly, which affects its crispiness and stability [16,17].
4.8. The Study Identified a Particularly Problematic Relationship
A strong positive correlation (r = 0.67) existed between: The occurrence of defects/discolorations; The presence of moisture spots. This interdependence suggests this quality issues frequently co-occur during production, presenting a compounded challenge for manufacturers.
Technical Implications: The correlation patterns indicate that: Color measurement could serve as a reliable proxy for overall quality assessment. Reducing sugar content in raw materials significantly impacts final product appearance. Moisture control is crucial for minimizing multiple quality defects simultaneously. These findings provide quantitative support for focusing process improvements on raw material selection (reducing sugar content); moisture management during processing; color development monitoring [8,9,36].
The strength of these correlations (all statistically significant at p<0.05) underscores their importance in industrial quality control systems. Own research shows that applied technologies have no significant effect on the level of soluble and reduce sugars and are consistent with the reports. The research of these authors shows that the comparison of conventional cultivation with integrated and ecological cultivation did not bring a positive conclusion about the dominance of any of them in relation to the content of reducing sugars. Also, the method of fertilization, with and without the use of manure, had no significant effect on their content. For the same potato variety, the level of reducing sugars was five times higher in tubers harvested in July compared to those harvested at the end of August. The results of the research of most authors [14,39,40,42] confirm unanimously that the earliness of varieties and the degree of maturity of tubers are of significant importance for the content of reducing sugars. Early varieties and those harvested at the stage of incomplete maturity have a higher level of reducing sugars during harvesting compared to medium-late varieties and those harvested at the stage of full maturity [42,43]. Our own research, in which eight edible varieties from different earliness groups were tested, confirms this view, a similar relationship results from the research by Zgórska and Grudzińska [41]. The research of these authors emphasizes the relationship; that the content of reducing sugars decreases with the increase in starch content in potato tubers. Very early and early varieties usually contain lower starch content compared to medium late and late varieties. Our own research proves that the use of ultrasound contributed to obtaining chips with a nicer color by 9.5% than chips produced from tubers obtained from the control object. Kutlu [3] report that the effect of ultrasonic applications on food colors is quite positive, and the proper determination of the conditions of ultrasound application is very effective in preserving the color of food. Moreover, these researchers state that minimizing energy and power consumption while simultaneously preserving the color of food is one of the directions of the processing industry. The conducted studies showed that the potato varieties studied differed significantly in terms of the content of total sugars and reducing sugars in tubers and contained on average 1.05% of total sugars and 0.53% of reducing sugars in fresh weight (Table 2). Zgórska and Czerko [12,13] and Murniece et al. [17] showed that the content of reducing sugars is a feature directly related to the genotype of a given variety. In our studies with 8 potato varieties, the content of reducing monosaccharides ranged from 0.3 g∙kg-1 to 3.8 g∙kg-1 (Table 3).
According to [9,13,52], the content of total sugars above 10 g∙kg-1 in the fresh weight of tubers (glucose + fructose + sucrose) affects the change in the taste of boiled and fried tubers. These authors showed that the increase in saccharide content in tubers does not affect the appearance of their sweet aftertaste, however, tubers of very early and early varieties did not meet the criteria set for raw materials intended for the production of French fries and chips. The obtained results are consistent with the data presented by Gugała et al. [39], Zarzecka et al. [40] and Pedrosa et al. [53]. These authors showed that extremely high sugar contents were caused by atmospheric conditions. In wet and cold periods, the sugar content in tubers was significantly higher than during optimal conditions. Different results were obtained by Zgórska & Grudzińska [41]. These authors proved that the content of reducing sugars in mature and immature tubers is similar and amounts to an average of 0.2 g∙kg-1 of fresh tuber mass. The lack of full maturity of tubers, manifested by high activity of invertase hydrolyzing sucrose to glucose and fructose, may indicate that even tubers characterized by harvest maturity, with properly developed skin and debarking of the stolon attachment, come from over-fertilized objects. According to Zgórska & Czerko [12], in tubers intended for processing, stored at a temperature of 6-8°C, due to intensive respiration, the accumulation of sugars is small, however, the consequence of higher temperatures are intensive physiological processes and premature aging of tubers [54]. The limiting temperature at which increased accumulation of glucose and fructose occurs is 7°C. The reduction of reducing monosaccharides is the result of a “compromise” between low and high storage temperatures. At low temperatures, the development of pathogens is minimized, and metabolic processes are strongly inhibited, while at higher temperatures, the tubers metabolize intensively, but at the same time they are characterized by a low level of sugars [44]. Zgórska and Sowa-Niedziałkowska [43] showed that the content of reducing sugars in potato tubers intended for French fries should not exceed optimally 2.5 g∙kg-1 (maximum 5 g∙kg-1 of dry matter) and for chips optimally 1.5 g∙kg-1 (maximum 2.5 g) of fresh mass. In turn, the content of total sugars should not exceed 10 g∙kg-1 of fresh mass in both cases. [44,53,54]. Too high sugar content is undesirable because it caramelizes during frying, which gives the products a brown color and a bitter taste [54].
4.9. Directions and Trends in Ultrasound Applications in Food Processing
Ultrasound technology is increasingly being viewed as an eco-friendly and effective alternative to traditional methods in the food industry. Key trends and developments include:
Increasing Process Efficiency and Quality: Ultrasound is used to intensify processes such as drying, blanching, and frying, reducing processing time and increasing efficiency. This technology also allows for improved sensory properties, such as texture and color (e.g., in chips), and extending product shelf life [48].
Minimizing Chemical Use: Ultrasound can effectively inactivate enzymes responsible for undesirable changes (e.g., darkening of fruits and vegetables) and aid in food preservation, reducing the use of chemical additives and preservatives [36,56].
Structure Modification and Extraction: Ultrasound is used to modify the structure of biopolymers (e.g., starch), which can alter the textural properties of products. Furthermore, this technology facilitates the extraction of valuable compounds (e.g., antioxidants, essential oils) from plant materials, which is useful in the production of supplements and functional foods [51,57].
4.10. Limitations of Ultrasound Technology
While ultrasound technology offers numerous advantages in food processing, it also has several limitations and challenges that need to be considered. These are:
Limited Penetration: High-frequency ultrasound waves can’t penetrate deep into dense or complex foods, restricting their effectiveness to the surface [5,8,55,58].
Inconsistent Treatment: The intensity of ultrasound waves weakens as they travel, leading to uneven processing throughout a large volume of food [11,58].
Food Matrix Dependency: The effectiveness of technology changes based on the specific food’s properties, requiring unique settings for each product [55].
Energy and Cost: Scaling up for industrial use can be energy-intensive and requires a significant initial investment in equipment [8,10].
Resistance: Some resilient bacteria and enzymes can ultrasound treatment alone, often requiring its combination with other methods like heat or pressure [6,9,14].
Potential for Damage: High-intensity ultrasound can negatively affect food quality by causing texture degradation, lipid oxidation, or altering flavors [1,2,4,8,10].
Monitoring Challenges: It’s difficult to monitor and control the process in real-time within complex food systems, making it hard to ensure consistent results [10,55,58].
Lack of Standardization: The absence of standardized protocols and guidelines hinders its widespread adoption and regulatory approval [54,55].
Limited Understanding: The exact mechanisms of how ultrasound interacts with different food components aren’t fully understood, which makes predicting and optimizing its effects challenging. Addressing these limitations through ongoing research and development is crucial for the broader and more effective application of ultrasound technology in the food industry.
5. Conclusions
Ultrasound has helped optimize various stages of potato chip preparation, from stimulating tuber growth to improving frying parameters and extending shelf life. Ultrasound technology has significantly improved potato production. It may ultimately reduce the need for chemical additives in processing and potentially reduce the use of pesticides in cultivation.
High levels of reducing sugars in potato tubers lead to excessive browning and a deterioration in the flavor of the final product, which negatively impacts consumer acceptance. Therefore, controlling sugar content is essential for producing high-quality potato chips. This can be achieved through careful selection of potato varieties and precise control of growing and storage conditions.
Variety Selection: Some potato varieties are better suited for chip production due to their low reducing sugar content. Among the varieties tested, the varieties “Tajfun” and “Syrena” are particularly recommended, while varieties such as “Vineta” and “Satina” can be used provided the production process is strictly monitored. Varieties such as “Denar,” “Lord,” “Owacja,” and “Zagłoba” are not recommended for potato chip production.
Environmental factors, especially weather, significantly impacted potato quality. Warm, dry summers favored low sugar content in tubers, ideal for chip production. In cooler and wetter conditions, selecting appropriate varieties or implementing additional sugar control technologies proved crucial. Precise control of cultivation and storage was crucial to ensuring product consistency, regardless of variety or weather.
In cases of unfavorable weather conditions or using borderline varieties, it is essential to implement technologies that reduce sugar levels.
Further research should focus on analyzing the effects of other ingredients on browning and on developing predictive models that combine agronomic data with processing parameters.
Author Contributions
For research articles with several authors, a short paragraph specifying their individual contributions must be provided. The following statements should be used “Conceptualization, P.P. and B.S.; methodology, P.B., P.P., B.S.; software, P,B.; validates P.B. and P.P.; formal analysis, P.B.; B.S.; investigation, P.P.; resources P.P., P.B.; data curation, P.P., B.S.; writing—original draft preparation, P.B., P.P.; writing—review and editing, B.S., P.P.; visualization, P.B.; supervision, B.S.; project administration, P.P.; funding acquisition B.S. All authors have read and agreed to the published version of the manuscript.” Please turn to the CRediT taxonomy for the term explanation. Authorship must be limited to those who have contributed substantially to the work reported.
Funding
This research received no external funding—own financing.
Data Availability Statement
The data generated in this experiment are available from the first author.
Acknowledgments
We would like to thank the Directorate of the Central Research Centre for Cultivar Research in Słupia Wielka for administrative and technical assistance.
Conflicts of Interest
The authors declare that they have no conflict of interest.
Abbreviations
The following abbreviations are used in this manuscript:
| US | Ultrasonic treatment/sonication |
| ROS | Reactive Oxygen Species |
| SOD | Superoxide Dismutase |
| CAT | Catalase |
| Genes related to carbohydrate metabolism: | |
| InvInh2 (invertase inhibitor) | regulates sucrose breakdown |
| UGPase (UDP-glucose pyrophosphorylase) | key enzyme in starch synthesis |
| Amyl (amylase genes) | control starch degradation |
| PPO | Polyphenol Oxidase |
| NMR | Nuclear Magnetic Resonance |
| SEM | Scanning Electron Microscopy |
| MALDI-TOF | Matrix-Assisted Laser Desorption/Ionization Time-of-Flight |
References
- Śliwiński, A. Ultrasound and their applications. Publishing House: WNT, Warszawa, 2001, pp.
- Kentish, S.; Feng, H. Applications of Power Ultrasound in Food Processing, Annual Reviews of Food Science and Technology, 2014, 5, 263-284. [CrossRef]
- Kutlu, N.; Pandiselvam, R.; Kamiloglu, A.; Saka, I.; Sruthi, N.U.; Kothakota, A.; Socol, C.T.; Cristina Maerescu, C.M. Impact of ultrasonication applications on color profile of foods. 2022; 89. [Google Scholar] [CrossRef]
- Miłowska, K. Ultrasound – mechanisms of action and application in sonodynamic therapy. Postępy Hig. Med. Dośw., 2007, 61, 338–349. [Google Scholar]
- Maksymiec, M.; Frąckiewicz, A.; Stasiak, D.M. Ultrasonic assisted production of food. [in] (Ed) Szala M., Kropiwiec K., Review of selected issues in the field of the food industry. Wyd. Nauk. TYGIEL, Lublin, 2016, 199-213.
- Sawicka, B.; Pszczółkowski, P.; Kiełtyka-Dadasiewicz, A. ; Barbaś, P; Ćwinal, M. The Effect of Effective Microorganisms on the Quality of Potato Chips and French Fries. Appl. Sci. 2021, 11. [Google Scholar] [CrossRef]
- Vaitkevičienė, N.; Jariene, E.; Kulaitienė, J.; & Levickienė, D. ; & Levickienė, D. The physicochemical and sensory characteristics of colored-flesh potato chips: Influence of cultivar, slice thickness and frying temperature. Applied Sciences, 2022, 12, 1211. [Google Scholar] [CrossRef]
- Zhang, J.; Yu, P.; Fan, L.; Sun, Y. 2021; 70. [CrossRef]
- Rice, C.; Taylor, J.B.; Widom, J.; Zegart, A. Stanford emerging. technology review, /: Report on Ten Key Technologies and Their Policy Implications. Editor Herbert S. Lin, Stanford University, Stanford, California, pp. 191, Copyright © 2025 by the Board of Trustees of the Leland Stanford Junior University. https, 2025. [Google Scholar]
- Darsana, K.; Sivakumar, P. Potential of Ultrasound in Food Processing: An Overview. Curr. J. Appl. Sci. Technol., 2023, 42: 14-34. [CrossRef]
- Prempeh, N.Y.A.; Nunekpeku, X.; Murugesan, A.; Li, H. Ultrasound in the Food Industry: Mechanisms and Applications for Non-Invasive Texture and Quality Analysis. Foods 2025, 14, 2057. [Google Scholar] [CrossRef]
- Zgórska, K.; Czerko, Z. (2006). Reconditioning of potato tubers stored at low temperature - the methods reducing total soluble sugar contents in potato tubers. Zesz. Prób. Post. Nauk Rol. 2006, 511, 547–556. (in Polish). [Google Scholar]
- Grudzińska, M.; Czerko, Z.; Wierzbicka, A.; Borowska-Komenda, M. Changes in the content of reducing sugars and sucrose in tubers of 11 potato cultivars during long term storage at 5 and 8°C. Acta Agrophysica, 2016, 23, 31–38. (in Polish). [Google Scholar]
- Sawicka, B.; Pszczółkowski, P. Dry matter and carbohydrates content in the tubers of very early potato varieties cultivated under coverage. Acta Scientiarum Polonorum, Hortorum Cultus, 2005, 4, 111–122. [Google Scholar]
- Pszczółkowski, P.; Sawicka, B. Ultrasound Application in Potato Cultivation: Potential for Enhanced Yield and Sustainable Agriculture. Sustainability 2024, 16, 108. [Google Scholar] [CrossRef]
- Pszczółkowski, P.; Sawicka, B.; Skiba, D.; Barbaś, P. Enhancing Potato Quality in Fries Production Using Ultrasonic Techniques. Sustainability 2025, 17, 828. [Google Scholar] [CrossRef]
- Murniece, I.; Karklina, D.; Galoburda, R.; Sabovics, M. Reducing sugar and color intensity of fried Latvian potato varieties. Latvijas Lauksaimniecibas Universitate Raksti, 2010, 24, 20–30. [Google Scholar]
- Lenartowicz, T. Potato. In Methodology of Economic Value Analysis of Cultivars (WGO); Publishing House, COBORU: Słupia Wielka, Poland, 2013; p. 34. [Google Scholar]
- Duer, I.; Fotyma, M.; Madej, A. Code of Good Agricultural Practice; Ministry of Agriculture and Rural Development: Warsaw, Poland, 2004; p. 93. (in Polish) [Google Scholar]
- Bleinholder, H.; Buhr, L.; Feller, C.; Hack, H.; Hess, M.; Klose, R.; Meier, U.; Stauss, R.; van den Boom, T.; Weber, E.; et al. Compendium of Growth Stage Identification Keys for Mono- and Dicotyledonous Plants. The Key to Determining the Development Phases of Mono- and Dicotyledonous Plants on the BBCH Scale; Crowd. Adamczewski, K., Matysiak, K., Eds.; IOR: Pozna, Poland, 2005; pp. 15–33. [Google Scholar]
- Roztropowicz, S.; Czerko, Z.; Głuska, A.; Goliszewski, W.; Gruczek, T.; Lis, B.; Lutomirska, B.; Nowacki, W.; Rykaczewska, K.; Sowa-Niedziałkowska, G.; et al. Methodical of Observation, Measurements and Sample Take in Agricultural Experiments with Potato; Plant Breeding Acclimatization Institute, Section: Jadwisin, Poland, 1999; p. 50. (In Polish) [Google Scholar]
- Polish Standard PN-IEC 6003; Standard Voltages IEC. ASLAN Electrical Publishing: Franklin, MA, USA, 1999. Available online: www.aslan.com(In Polish). (accessed on 18 June 2018).
- Lenartowicz, T. Descriptive List of Agricultural Cultivars; COBORU Publishing House: Słupia Wielka, Poland, 2017; p. 38, (in Polish). ISSN 1641-7003. [Google Scholar]
- Mozolewski, W. Research on Relations between the Quality of Potato Cultivars and the Quality of PC and FF; Monogr.; Uniwersytet Warmińsko-Mazurski: Olsztyn, Poland, 2005; p. 77. (in Polish) [Google Scholar]
- EN ISO 8586: 2014; Sensory Analysis—General Guidelines for the Selection, Training and Monitoring of Selected Assessors and Sensory Evaluation Experts. ISO: Geneva, Switzerland, 2014.
- AOAC. The official methods of analysis of AOAC International by George W. Latimer, 20th ed. 2016, p. 3172. Available online: http://www.eoma.aoac.org/ (accessed on day month year).
- Kerłowska-Kułas, M. Badanie Jakości Produktów Spożywczych. Państwowe Wyd. Ekonomiczne Warszawa, Poland, 1993; pp. 53–55.
- IUSS Working Group WRB. World Reference Base for Soil Resources. In International Soil Classification System for Naming Soils and Creating Legends for Soil Maps, 4th ed.; International Union of Soil Sciences (IUSS): Vienna, Austria, 2022. [Google Scholar]
- Nawrocki, S. Fertilizer Recommendations. Part. I. Limit Numbers for Valuation of Soils in Macro- and Microelements; IUNG, Puławy, Poland, pp. 1991; 44. [Google Scholar]
- Skowera, B.; Kopcińska, J.; Kopeć, B. Changes in thermal and precipitation conditions in Poland in 1971–2010. Ann. Warsaw Univ. Life Sci. 2014, 46, 153–162. [Google Scholar] [CrossRef]
- SAS Institute Inc. SAS/STAT® 9.2 User’s Guide; SAS Institute Inc.: Cary, NC, USA, 2008. [Google Scholar]
- Tatarczak, A. Statistics. Vol. I - Textbook Part II - Case studies. Ed. WSEI-Lublin, 277 pp., 2021, ISBN 978-83-66159-83-9.
- IBM SPSS. Statistics – SPSS, 30,0. Operating System Windows, Linux/Unix, Mac OS, 2024.
- Teixeira da Silva, J.A.; Dobránszki, J. Sonication and ultrasound: Impact on plant growth and development. Plant Cell Tiss. Organ Cult. 2014, 117, 131–143. [Google Scholar] [CrossRef]
- Guiné, R.P.F.; Florença, S.G.; Barroca, M.J.; Anjos, O. The Link between the Consumer and the Innovations in Food Product Development. Foods 2020, 9, 1317. [Google Scholar] [CrossRef]
- Antunes-Rohling, A.; Ciudad-Hidalgo, S.; Mir-Bel, J.; Raso, J.; Cebrián, G.; Álvarez, I. Ultrasound as a pretreatment to reduce acrylamide formation in fried potatoes. Innovative Food Science & Emerging Technologies, Volume 49, 18, Pages 158-169. 20 October. [CrossRef]
- Chen, J.; Yang, J.; and Sawan, M. Emerging trends of integrated-mixed-signal chips in ISSCC 2023. J. Semicond. , 2023, 44, 050204. [Google Scholar] [CrossRef]
- Peraza-Alemán, C.M.; Arazuri, S.; Jarén, C.; de Galarreta, J.I.R.; Barandalla, L.; López-Maestresalas, A. a: the spatial distribution of reducing sugars using near-infrared hyperspectral imaging and chemometrics, 2025. [CrossRef]
- Gugała, M.; Zarzecka, K.; Sikorska, A.; Dołęga, H. Changes in sugar content in cultivars potato tubers depending on the weed control methods. Progress in Plant Protection, 2013, 53, 271–275. (in Polish). [Google Scholar]
- Zarzecka, K.; Gugała, M.; Ginter, A.; Mystkowska, I.; Sikorska, A. The Positive Effects of Mechanical and Chemical Treatments with the Application of Biostimulants in the Cultivation of Solanum tuberosum L. Agriculture 2023, 13, 45. Agriculture 2023, 13, 45. [Google Scholar] [CrossRef]
- Zgórska, K.; Grudzińska, M. Changes in selected quality parameters of potato tubers during storage. Acta Agrophysica, 2012, 19, 203–214. (in Polish). [Google Scholar]
- Cummins, E.; Butler, F.; Gormley, R.; Brunton, N. A methodology for evaluating the formation and human exposure to acrylamide through fried potato chips. LWT- Food Science and Technology, 2008, 41, 854–867. [Google Scholar] [CrossRef]
- Zgórska, K.; Sowa-Niedziałkowska, G. The influence of storage temperature and cultivar on quality changes in potato tubers during long term storage. Pam. Puł. 2005, 139, 328–336. (in Polish). [Google Scholar]
- Gikundi, E.N.; Buzera, A.; Orina, I.; Sila, D. Impact of the Temperature Reconditioning of Cold-Stored Potatoes on the Color of Potato Chips and French Fries. Foods, 2024, 13, 652. [Google Scholar] [CrossRef]
- Nowak, A. Acrylamide in food technology: Understanding, mitigating, and innovating. J Food Technol Pres. 2024, 8, 214. [Google Scholar]
- Wang, H.; Liu, Y.; Li, W. Influence of storage conditions on sugar content and fry color of potato varieties used for processing. J. Food Sci. Technol. 2023, 60, 103–115. [Google Scholar]
- Nawaz, A.; Danish, A.; Waseem, A.S.; Shahbaz, H.M.; Khalifa, I.; Ahmed, A.; Irshad, S.; Ahmad, S.; Ahmed, W. Evaluation and storage stability of potato chips made from different varieties of potatoes cultivated in Pakistan. J. Food Process. Preserv. 2021, 45, e15437. [Google Scholar] [CrossRef]
- Mike, G.; Baciu, A.; Mike, L. Studies on the effect of variety on the processing efficiency of potato chips. ISHS Acta Horticulturae 1391: IX South-Eastern European Symposium on Vegetables and Potatoes. [CrossRef]
- Nahid, M.; Akther, S.; Hassan, M.K.; Uddin, M.N.; Zaber, M.A.; and Bhuiyan, M.N.I. Quality enhancement of potato chips through acrylamide mitigation and comparison with local potato chips in Bangladesh. Food Research 2024, 8, 48–56. [Google Scholar] [CrossRef]
- Parra-López, C.; Abdallah, S.B.; Garcia-Garcia, G.; Hassoun, A.; Trollman, H.; Sandeep, J.; Gupta, S.; Aït-Kaddour, A.; Makmuang, S.; Carmona-Torres, C. Digital technologies for water use and management in agriculture: Recent applications and future outlook. Agricultural Water Management, 2025, 309, 109347. [Google Scholar] [CrossRef]
- Hu, X.; Jiang, H.; Liu, Z.; Gao, M.; Liu, G.; Tian, S.; Zeng, F. The Global Potato-Processing Industry: A Review of Production, Products, Quality and Sustainability. Foods 2025, 14, 1758. [Google Scholar] [CrossRef]
- Pedrosa, V.M.D. , Izidoro, M., Paythosh, S. et al. The Relationship Between Respiration Rate and Quality Parameters of Russet Potatoes During Long-Term Storage. Am. J. Potato Res. 2025, 102, 93–105. [Google Scholar] [CrossRef]
- Grudzińska, M.; Zgórska, K. Effect of reconditioning on decrease of the content of reducing sugars in tubers of some potato cultivars. Biul. IHAR, 2011, 259, 211–217. (in Polish). [Google Scholar] [CrossRef]
- Myers SS, Zanobetti A, Kloog I, Huybers P, Leakey AD, Bloom AJ, Carlisle E, Dietterich LH, Fitzgerald G, Hasegawa T, Holbrook NM, Nelson RL, Ottman MJ, Raboy V, Sakai H, Sartor KA, Schwartz J, Seneweera S, Tausz M, Usui Y. Increasing CO2 threatens human nutrition. Nature. [CrossRef]
- European Commission: Directorate-General for Health and Food Safety, Health and food audits and analysis Programme 2024, Publications Office of the European Union, 2023, https://data.europa.eu/doi/10. 2875.
- Siamalube, B. , Lambert E., Anyaji Ch., and Ehinmitan E. Advancements in potato science: agronomy, genetics, and biotechnology for sustainable food security. Potato J.
- Saini R, Kaur S. , Aggarwal P., Dhiman A., Suthar P., (2023). Conventional and emerging innovative processing technologies for quality processing of potato and potato-based products: A review, Food Control, 2023, 153, 109933, ISSN 0956–7135. [CrossRef]
- Lin, Y.; Ji, M.; Qijun, W.; and Sun, D.-W. Applications of machine learning techniques for enhancing nondestructive food quality and safety detection. Crit. Rev. Food Sci. Nutr. 2023, 63, 1649–1669. [Google Scholar] [CrossRef]
Figure 1.
Ultrasound processing setup diagram: 1—ultrasound generator, 2—ultrasound transducer, 3—time controller, 4—thermometer, 5—tank with lid, 6—sample, 7—water. Source: own.
Figure 1.
Ultrasound processing setup diagram: 1—ultrasound generator, 2—ultrasound transducer, 3—time controller, 4—thermometer, 5—tank with lid, 6—sample, 7—water. Source: own.
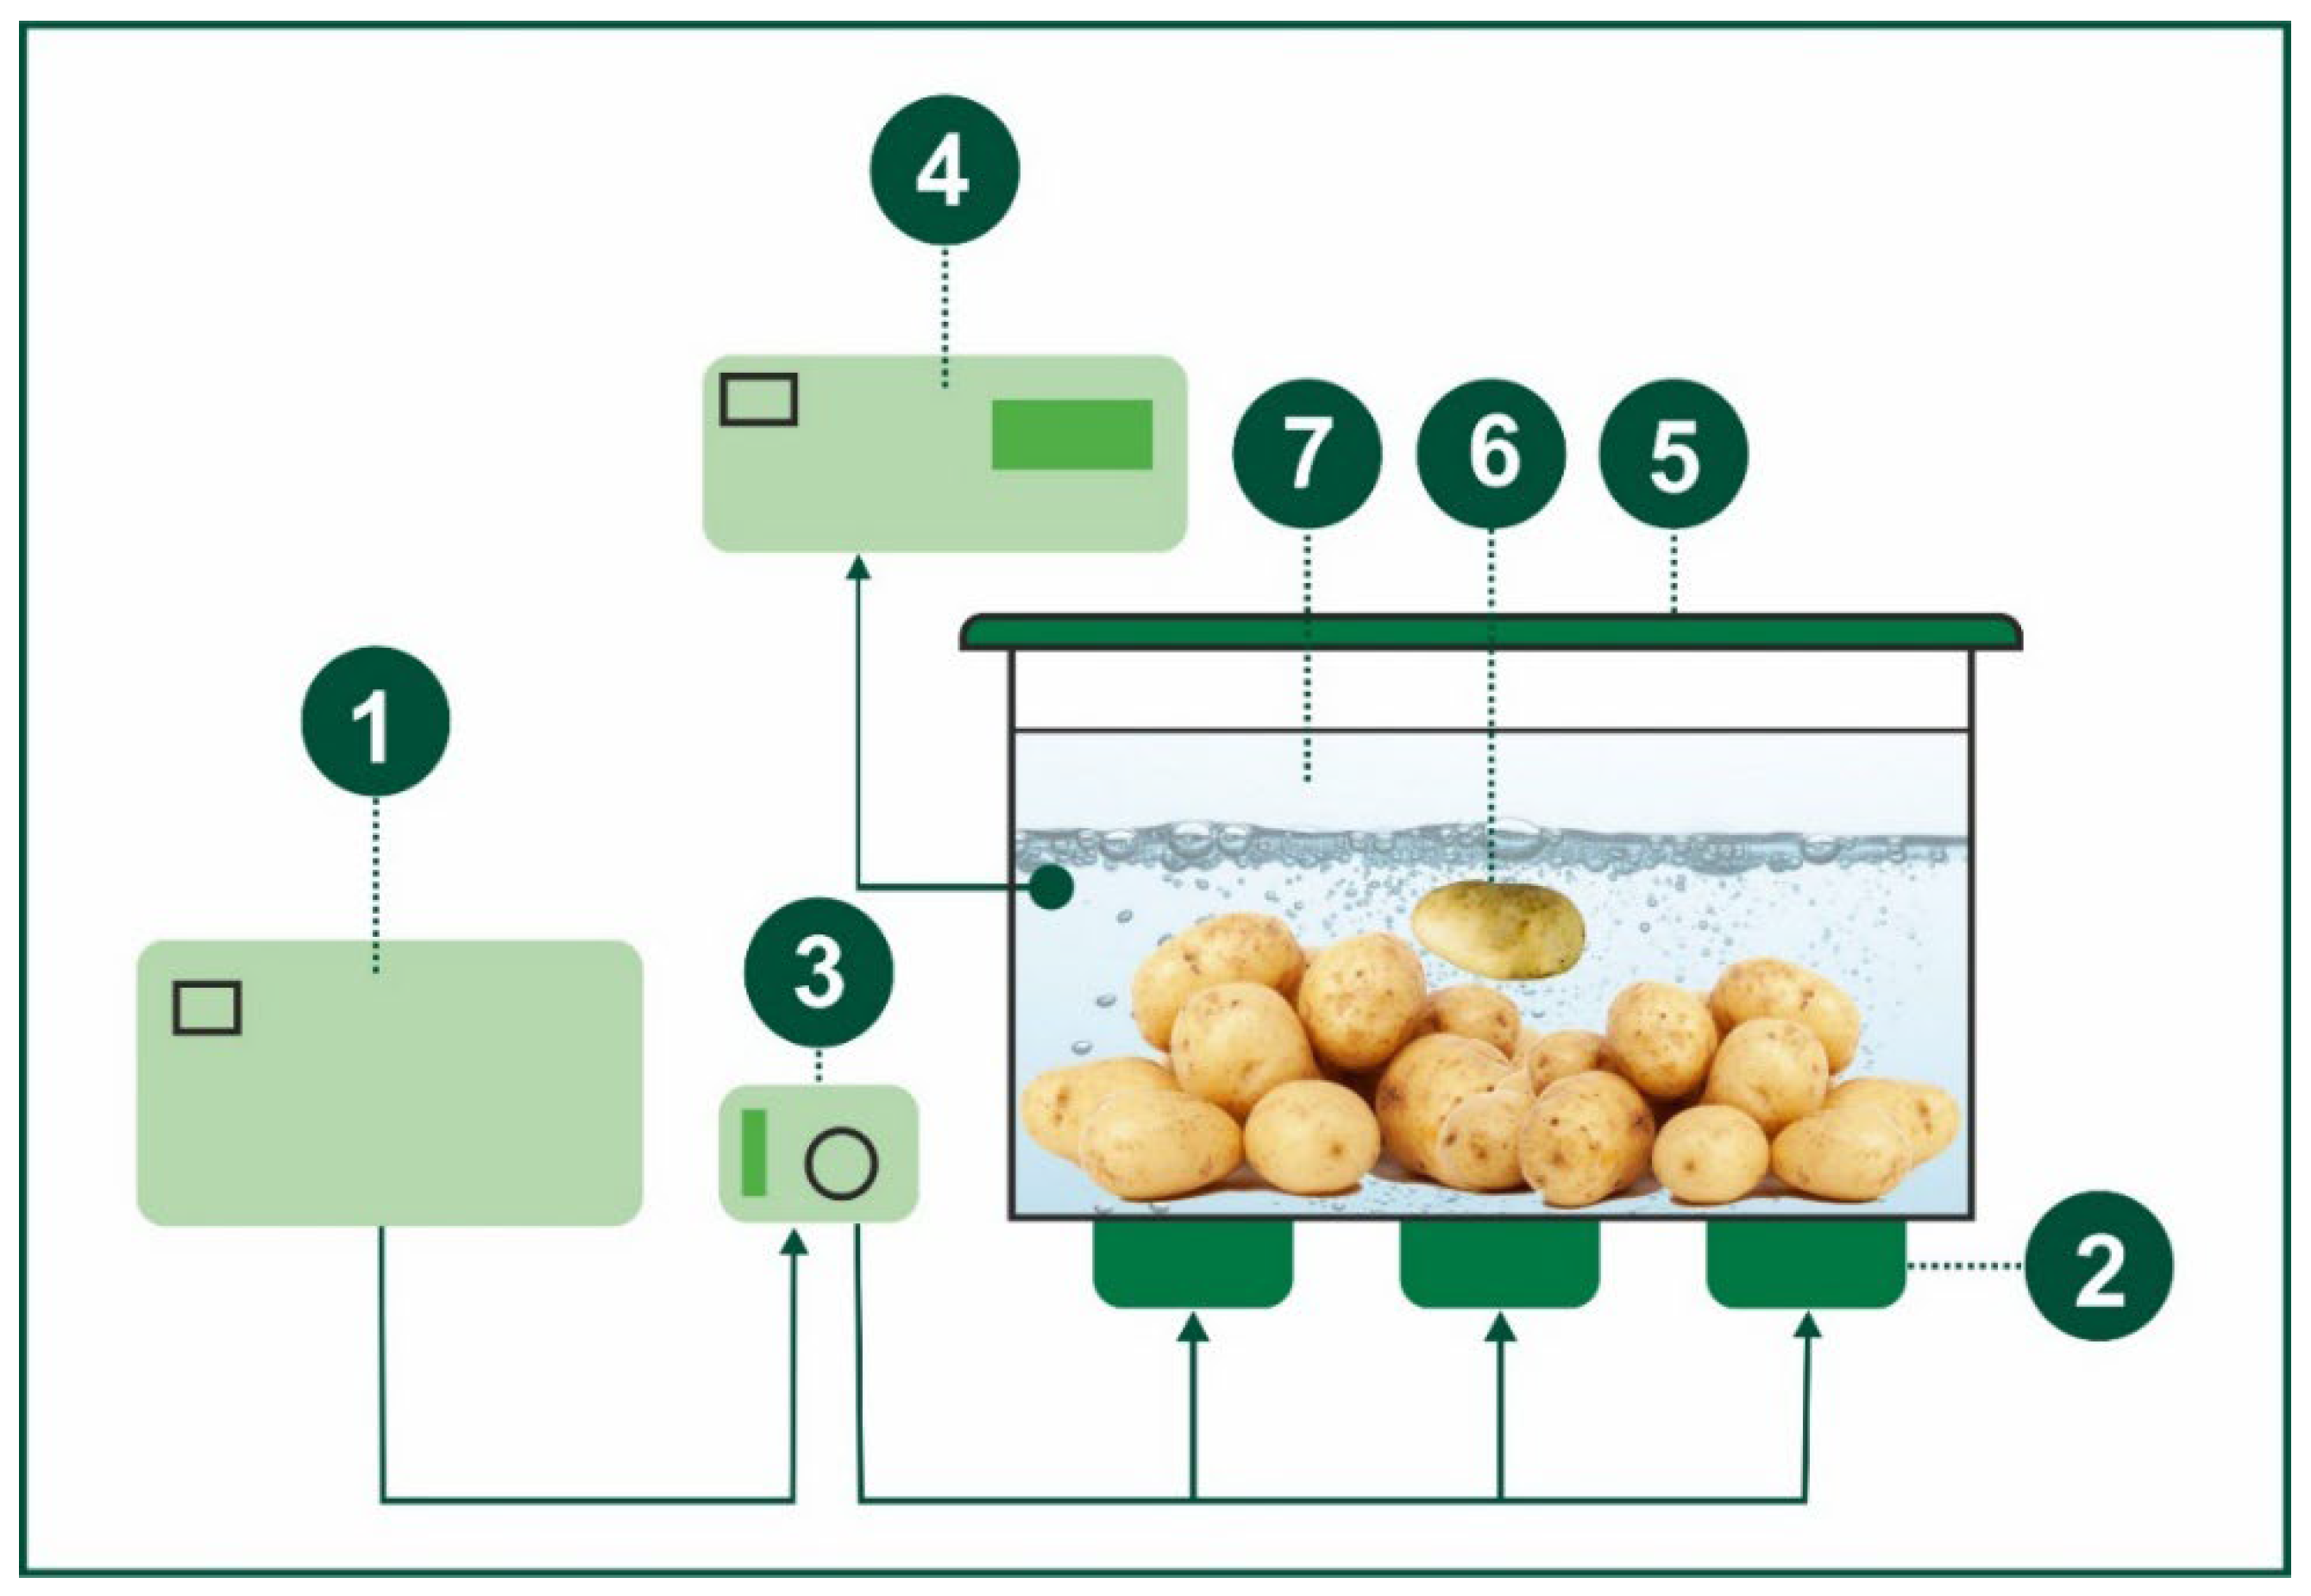
Figure 2.
Chips production stages: a) cutting, b) drying, c) appearance in the fryer, d) frying in an electric fryer.
Figure 2.
Chips production stages: a) cutting, b) drying, c) appearance in the fryer, d) frying in an electric fryer.
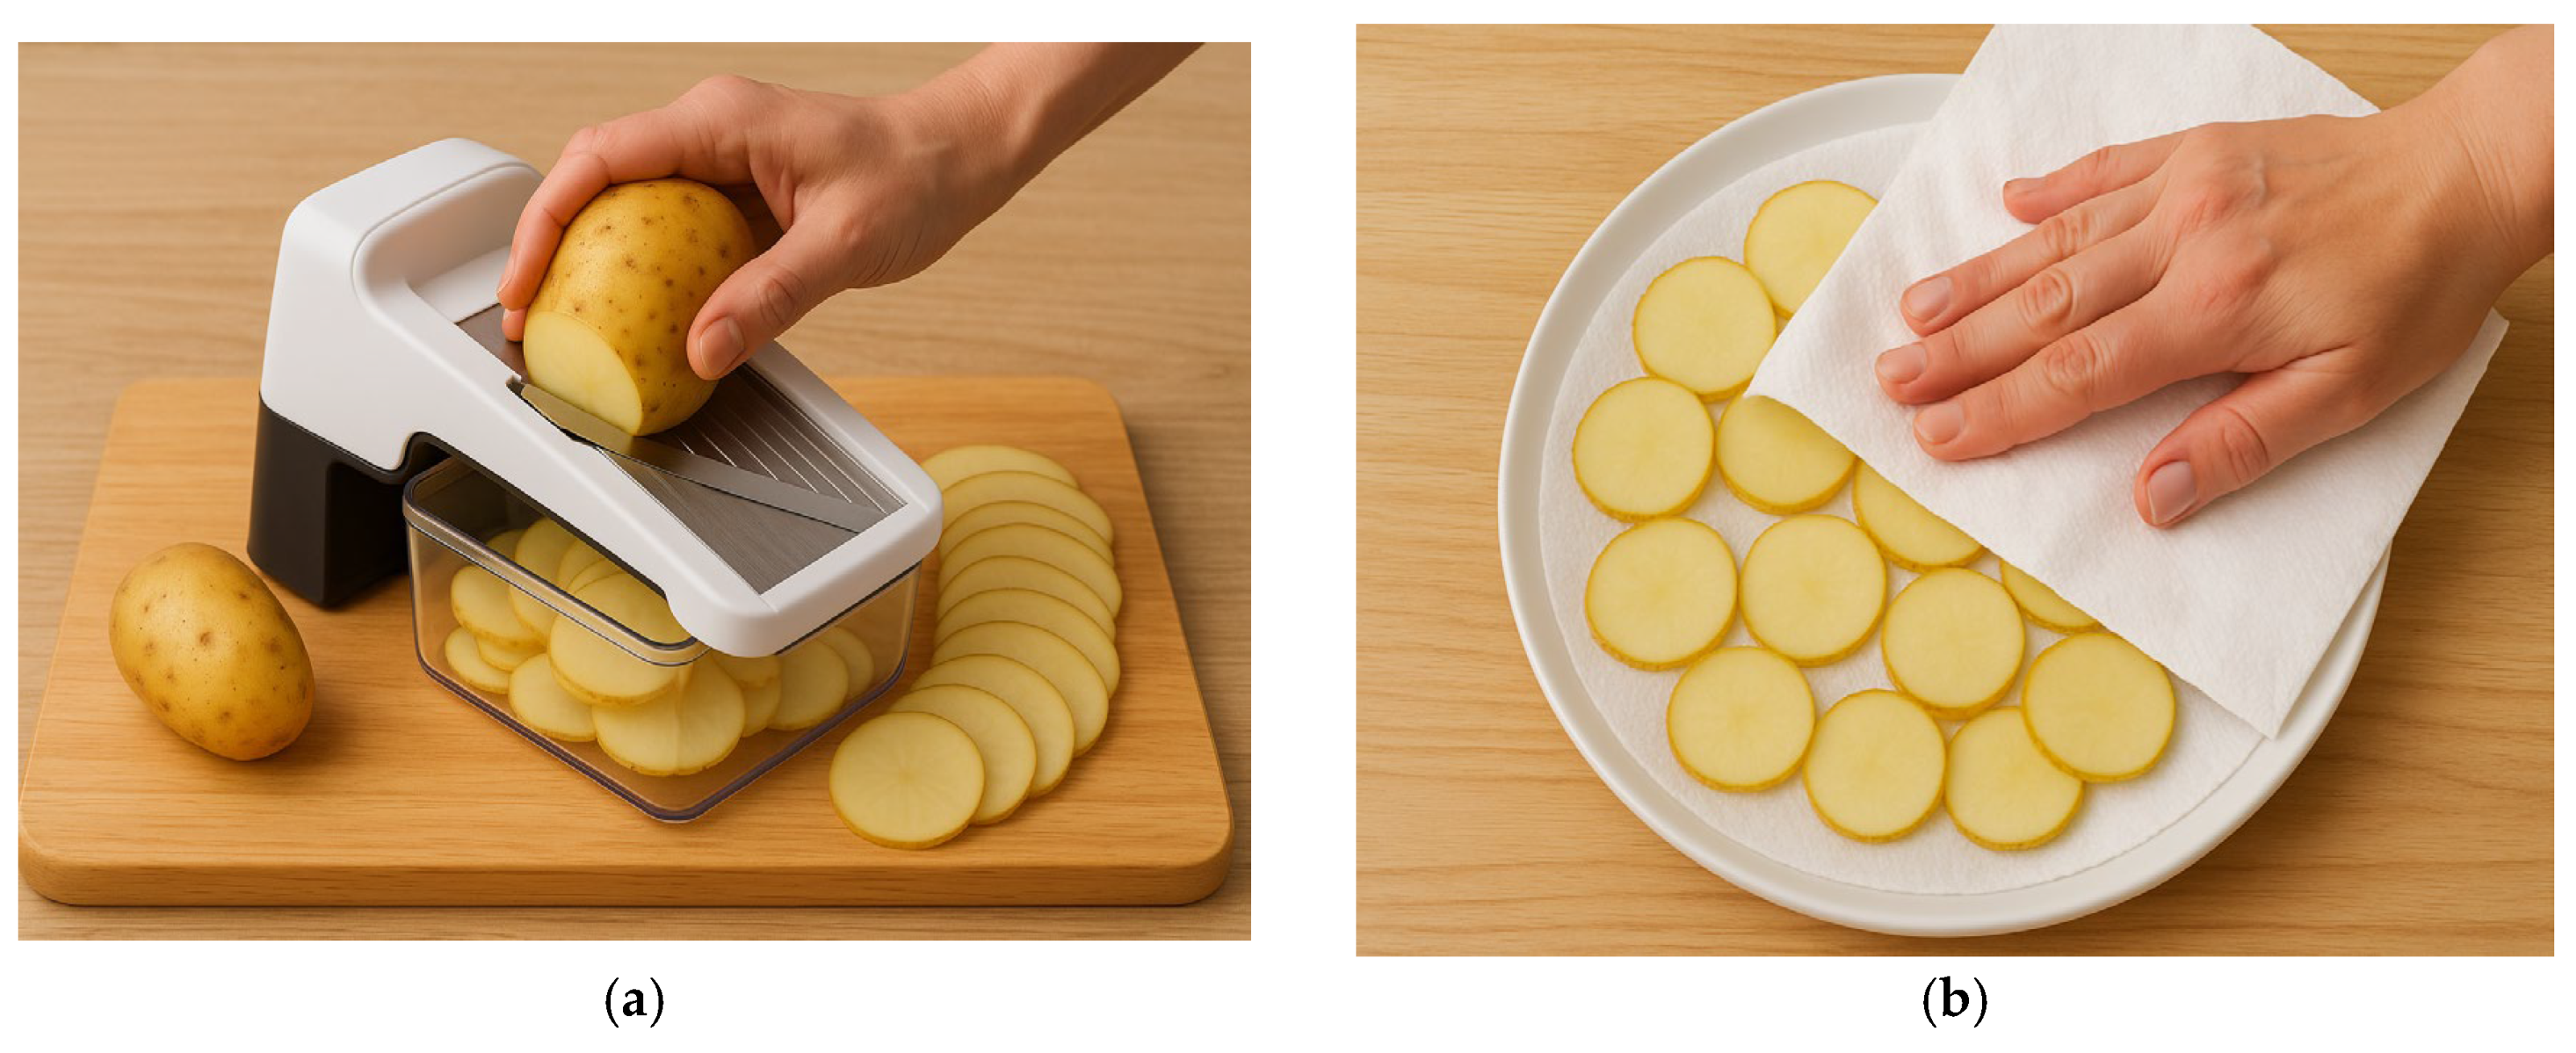
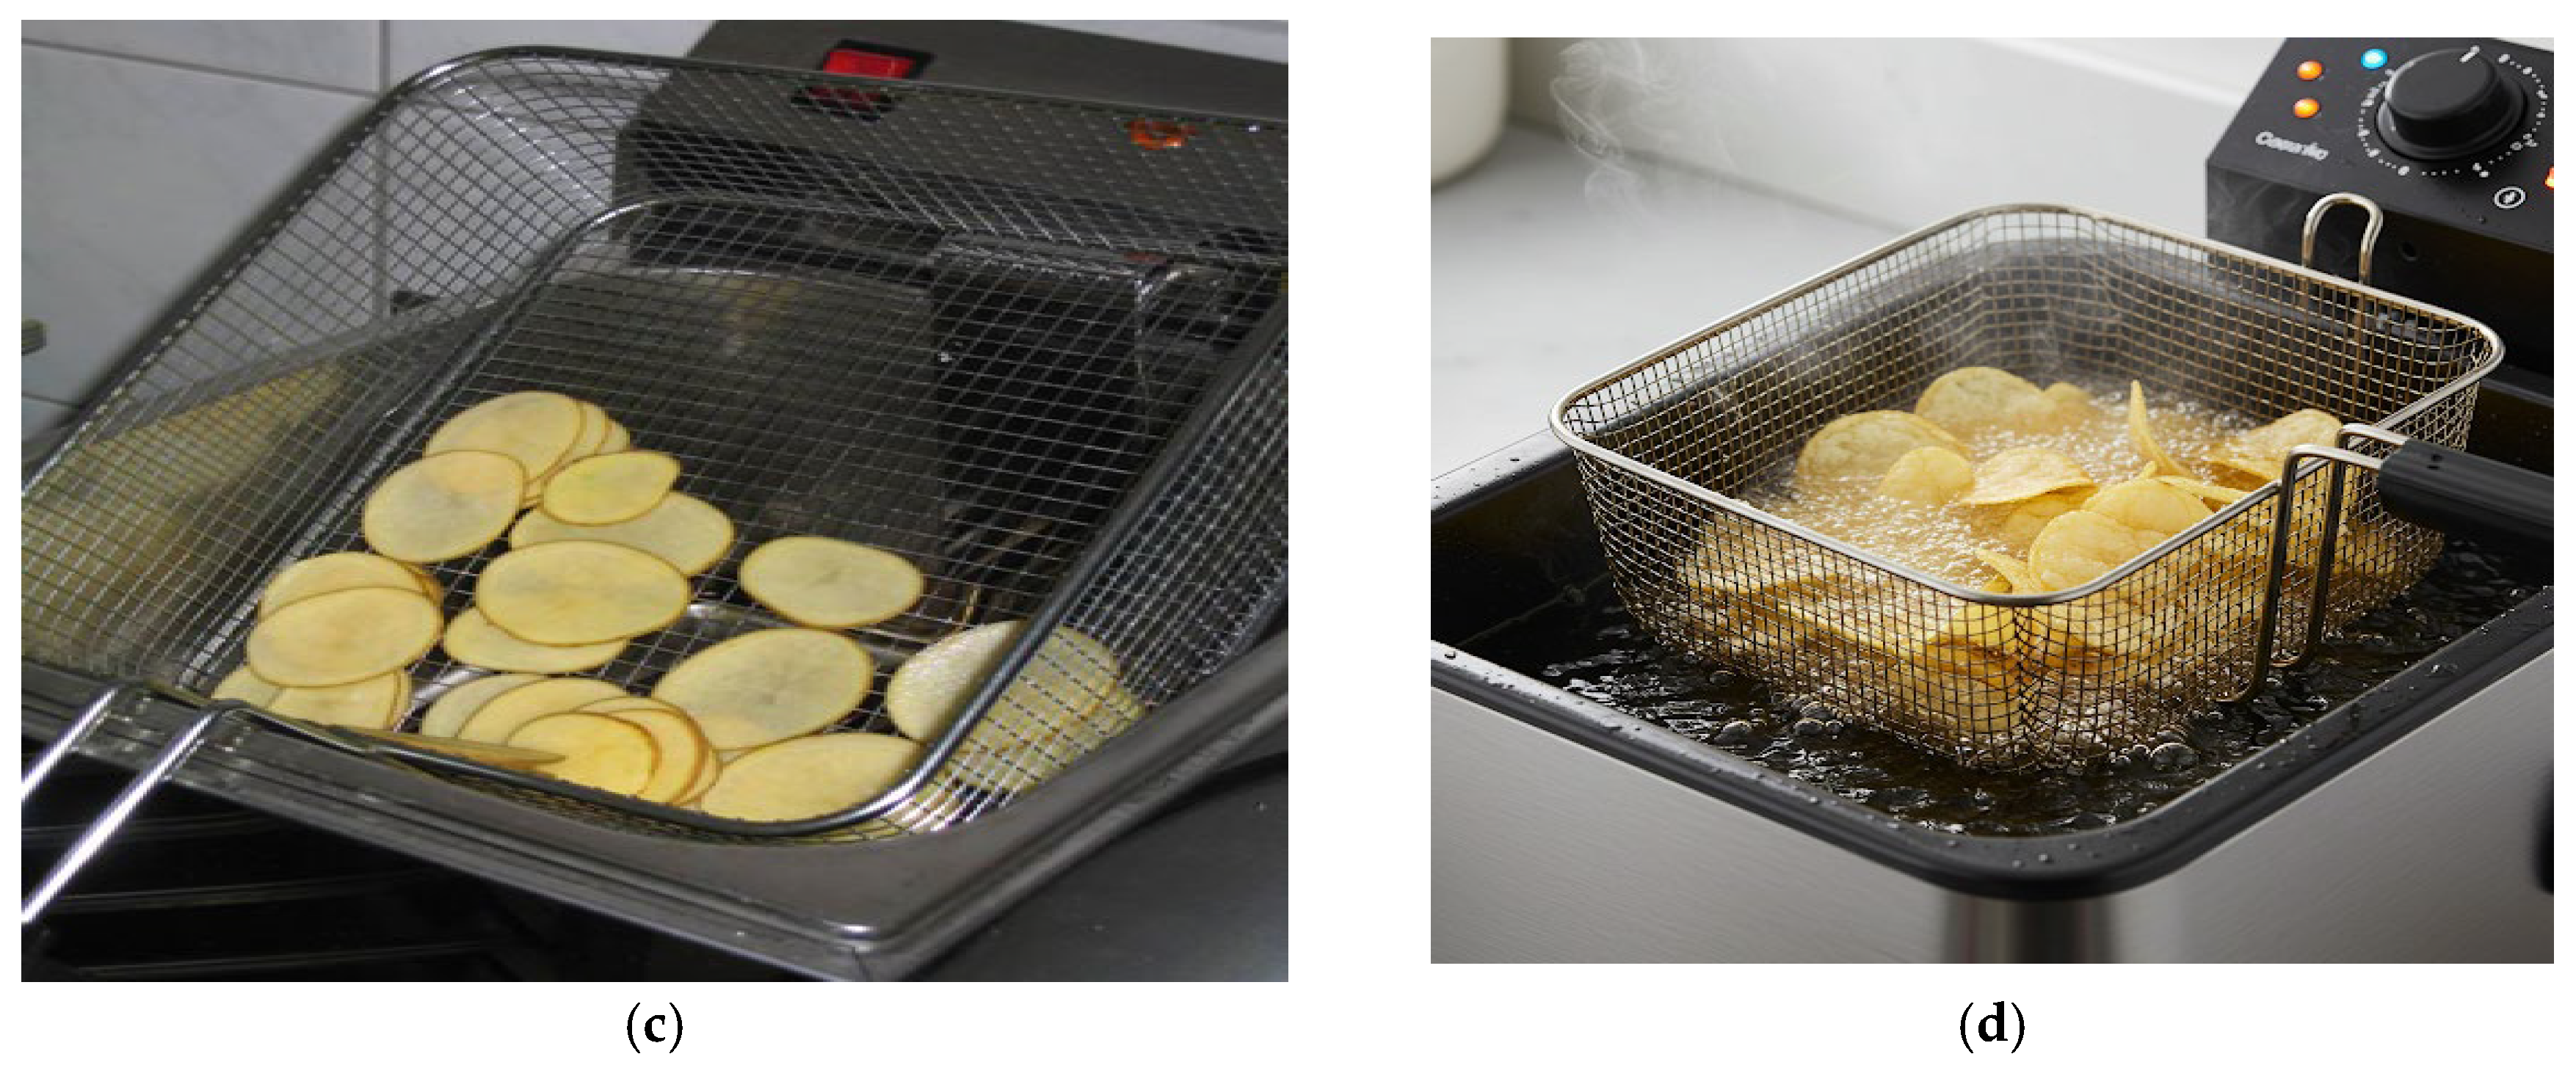
Figure 3.
The influence of cultivars on the content of total sugars and reducing sugars in potato tubers.
Figure 3.
The influence of cultivars on the content of total sugars and reducing sugars in potato tubers.
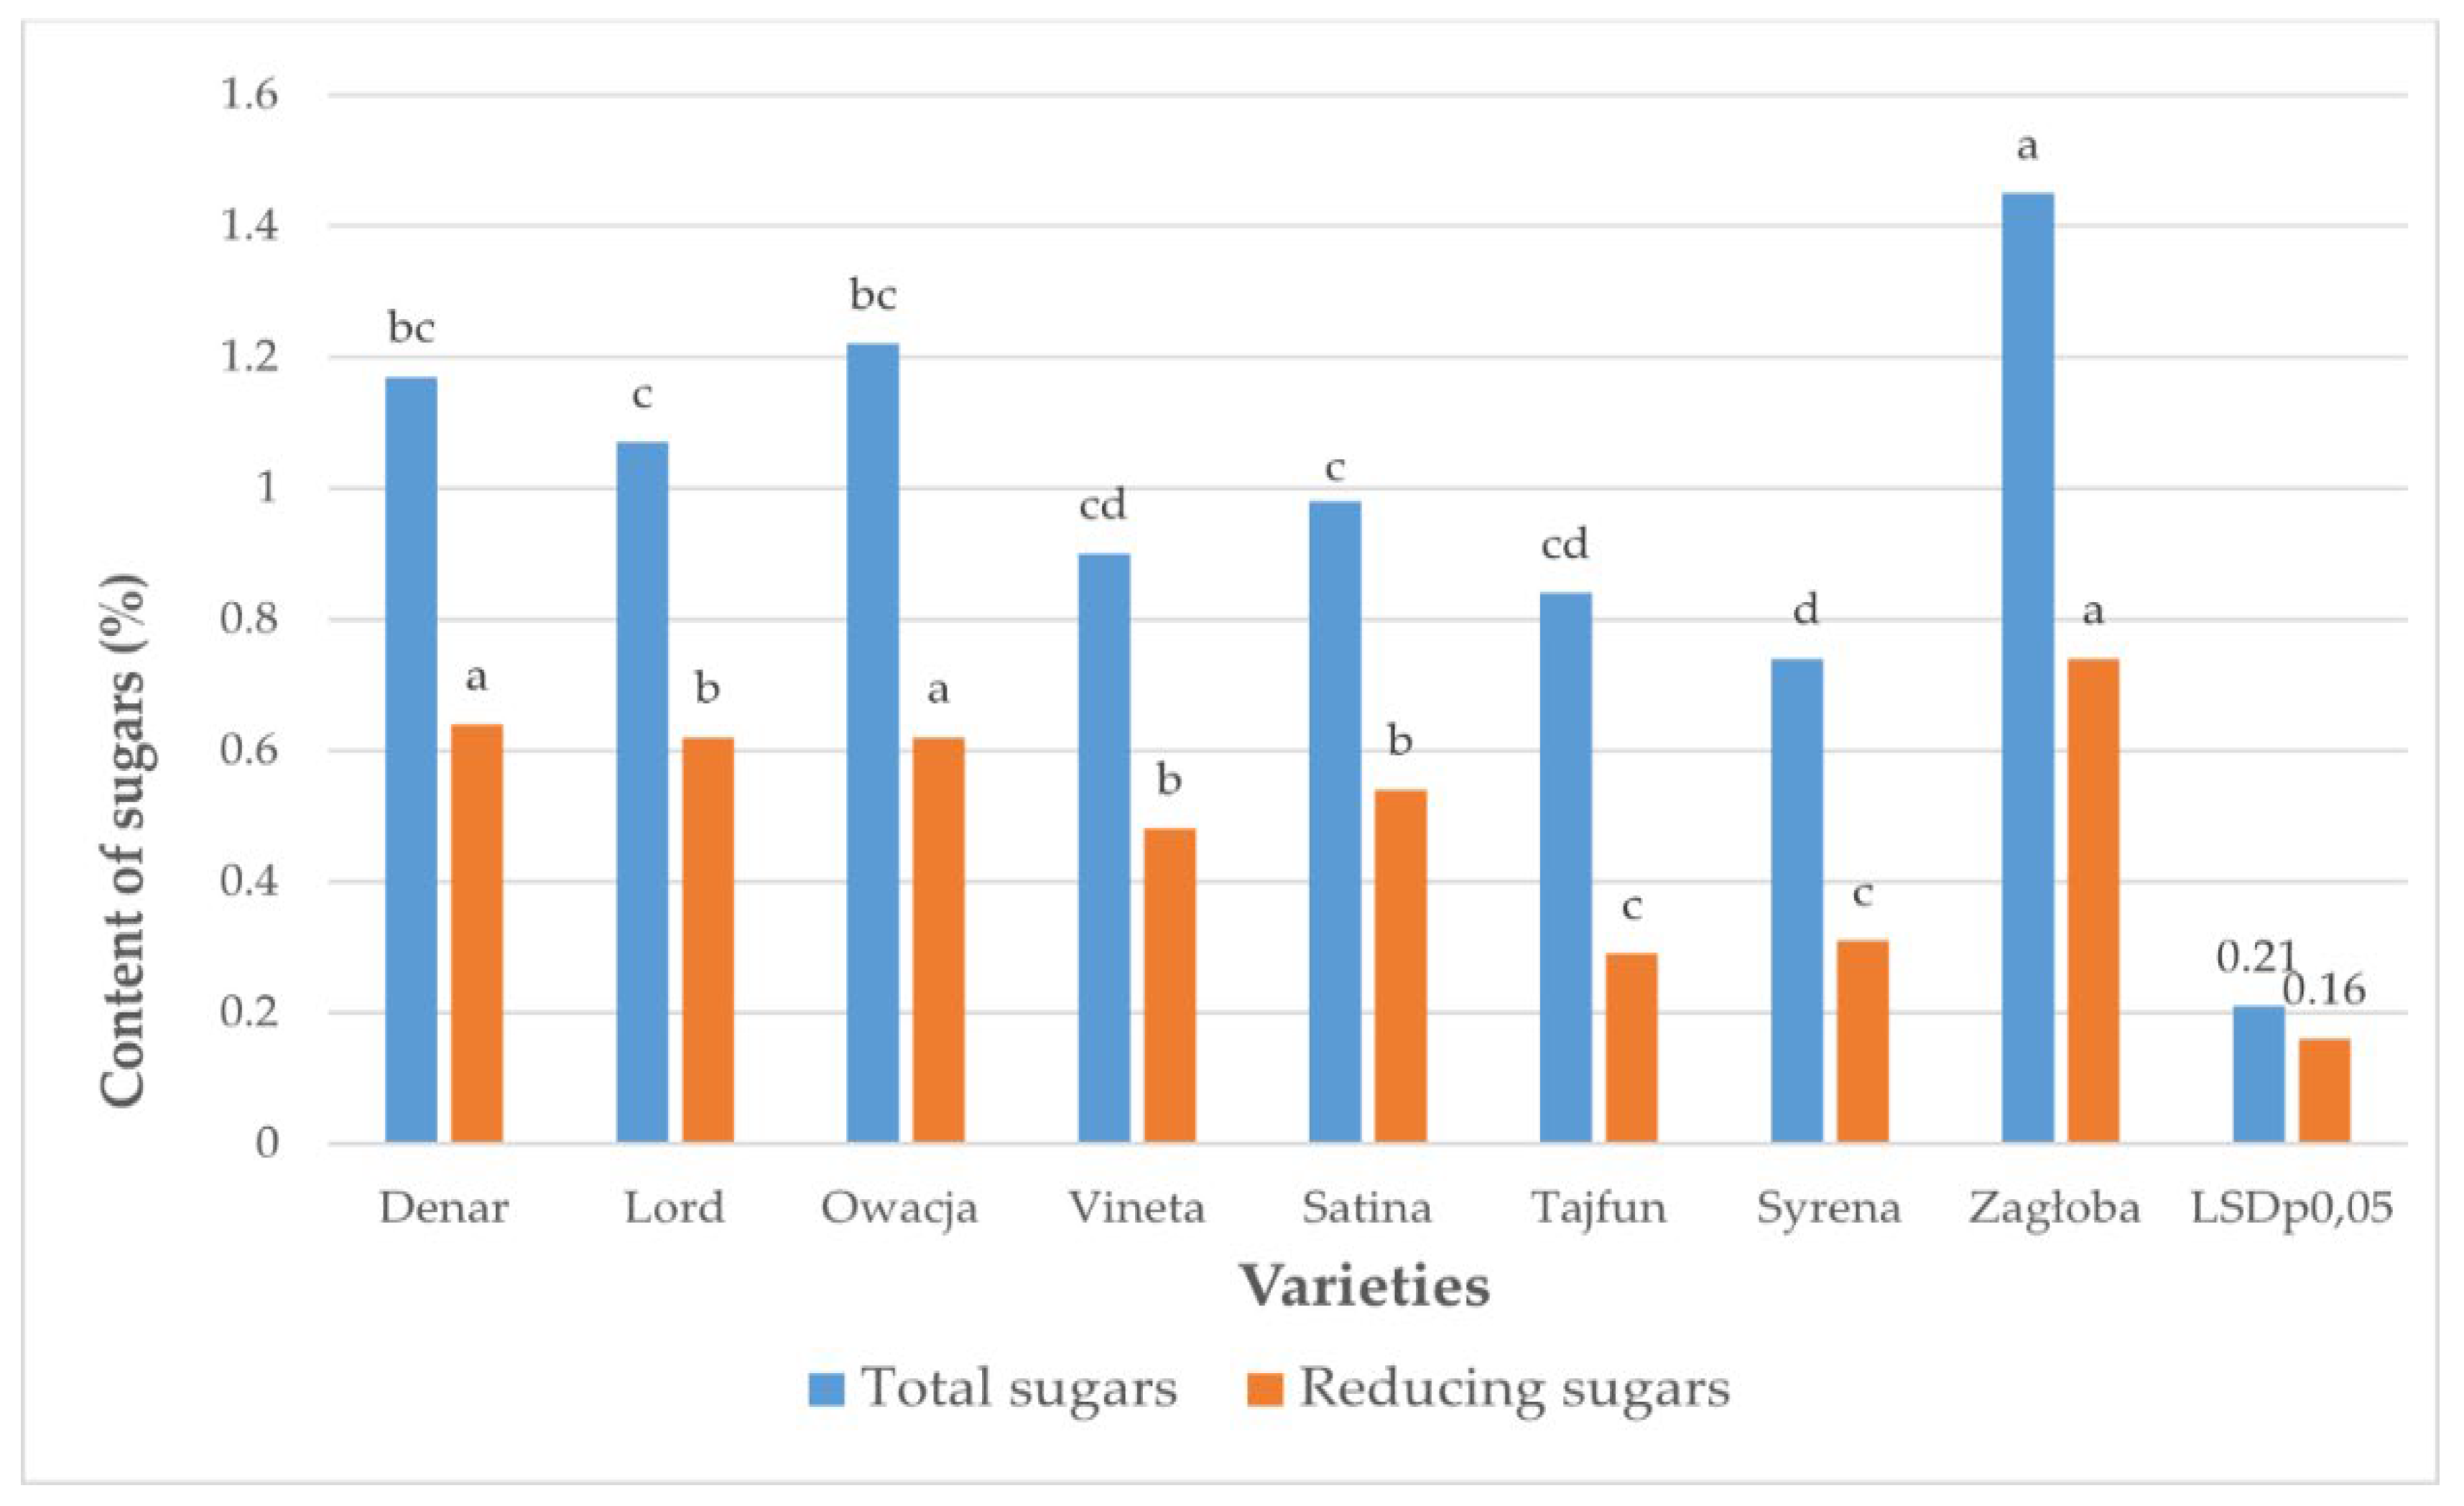
Figure 4.
The influence of cultivation technology and years on the content of reducing sugars in potato tubers.
Figure 4.
The influence of cultivation technology and years on the content of reducing sugars in potato tubers.
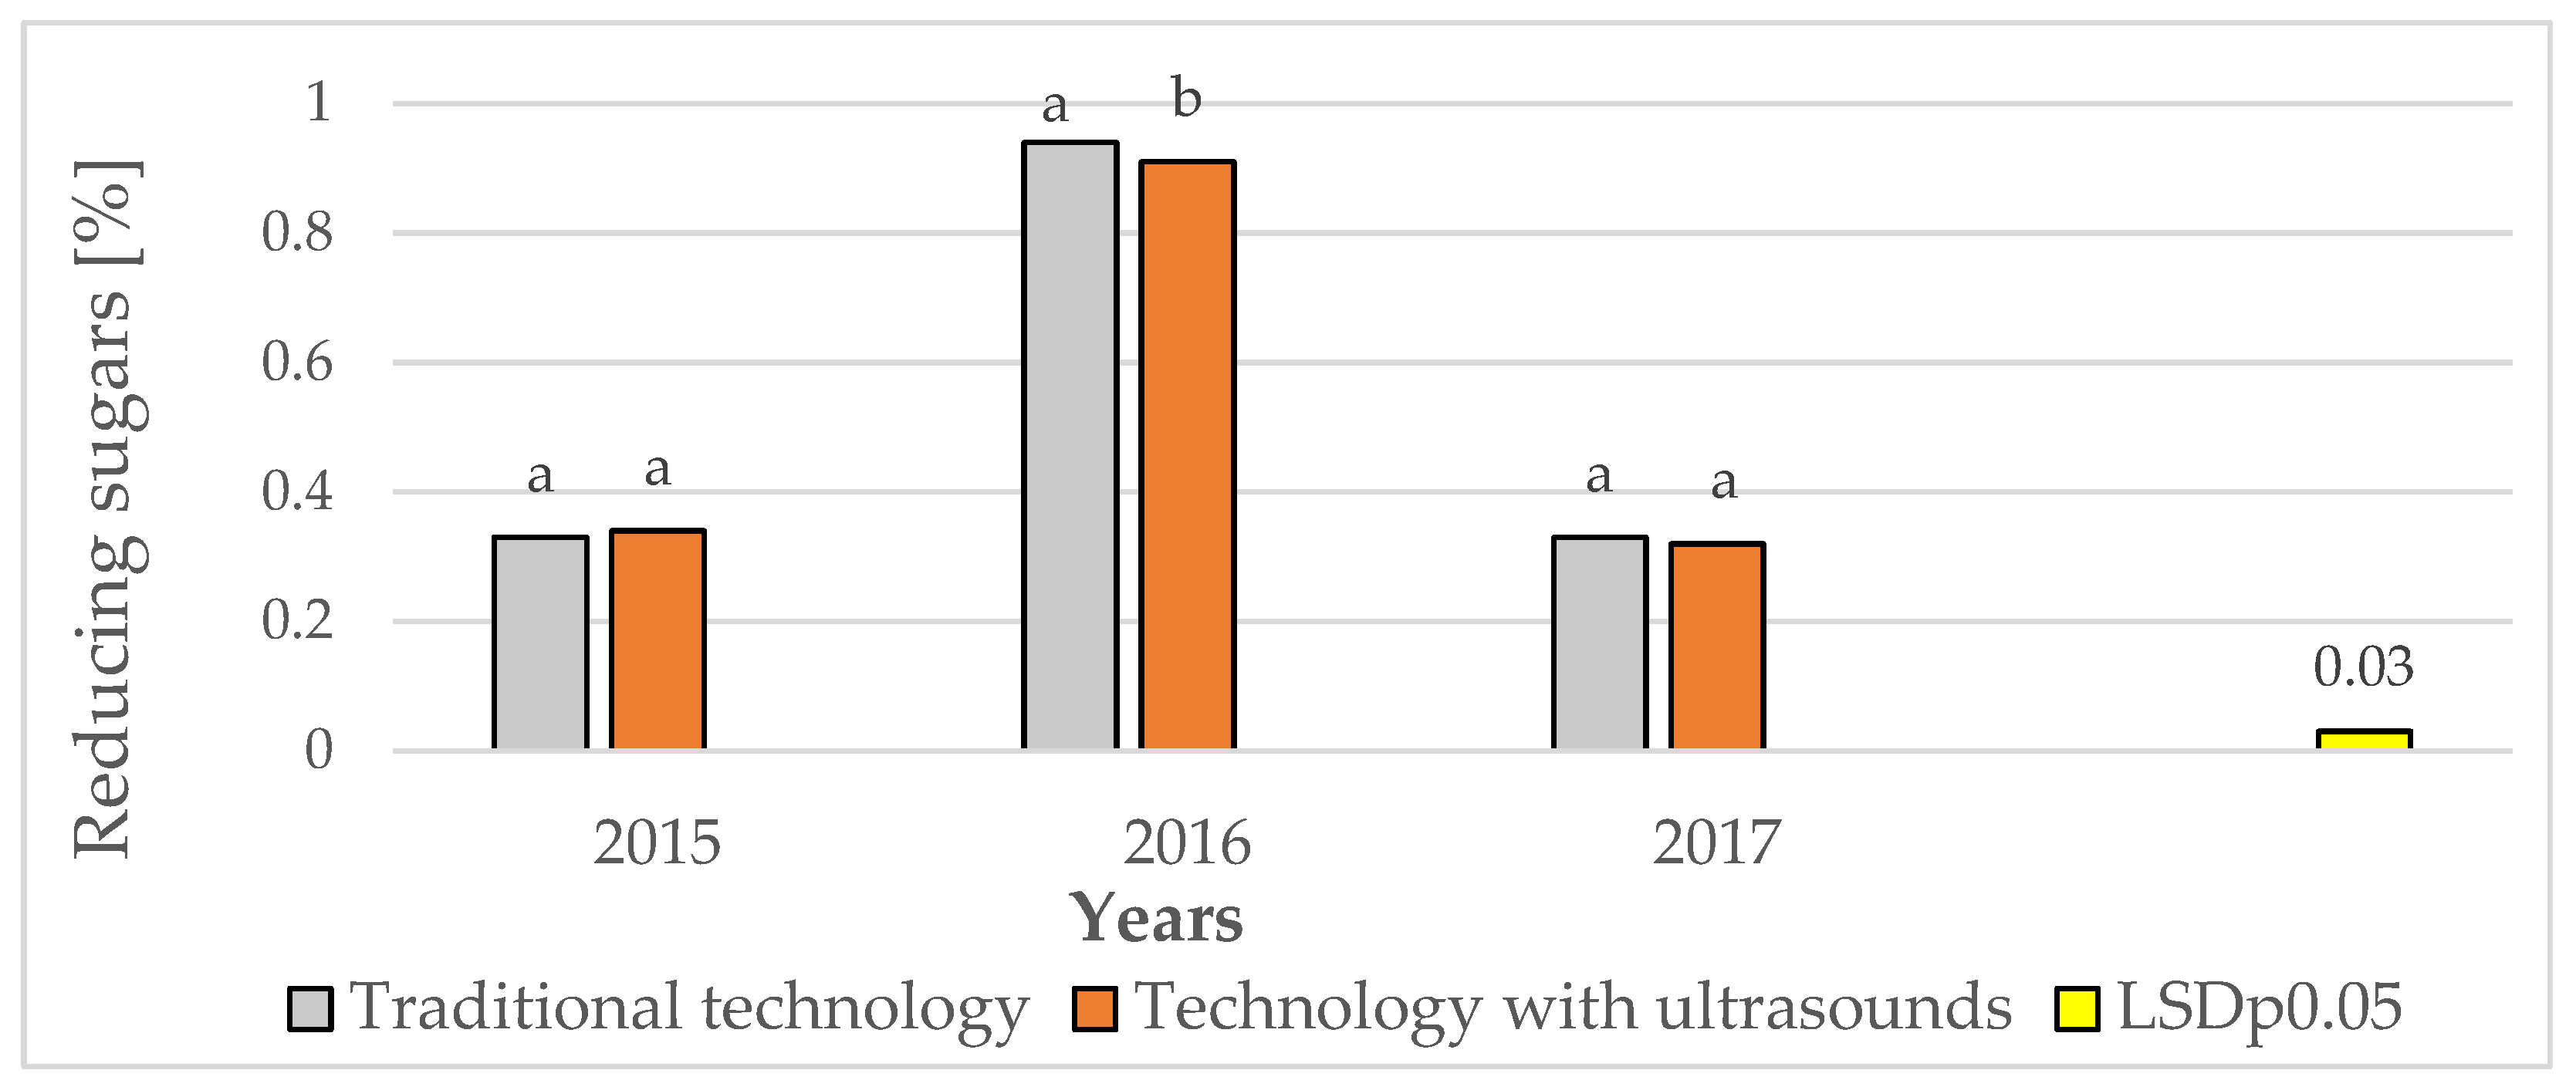
Figure 5.
The influence of varieties and years on the content of reducing sugars in potato tubers.
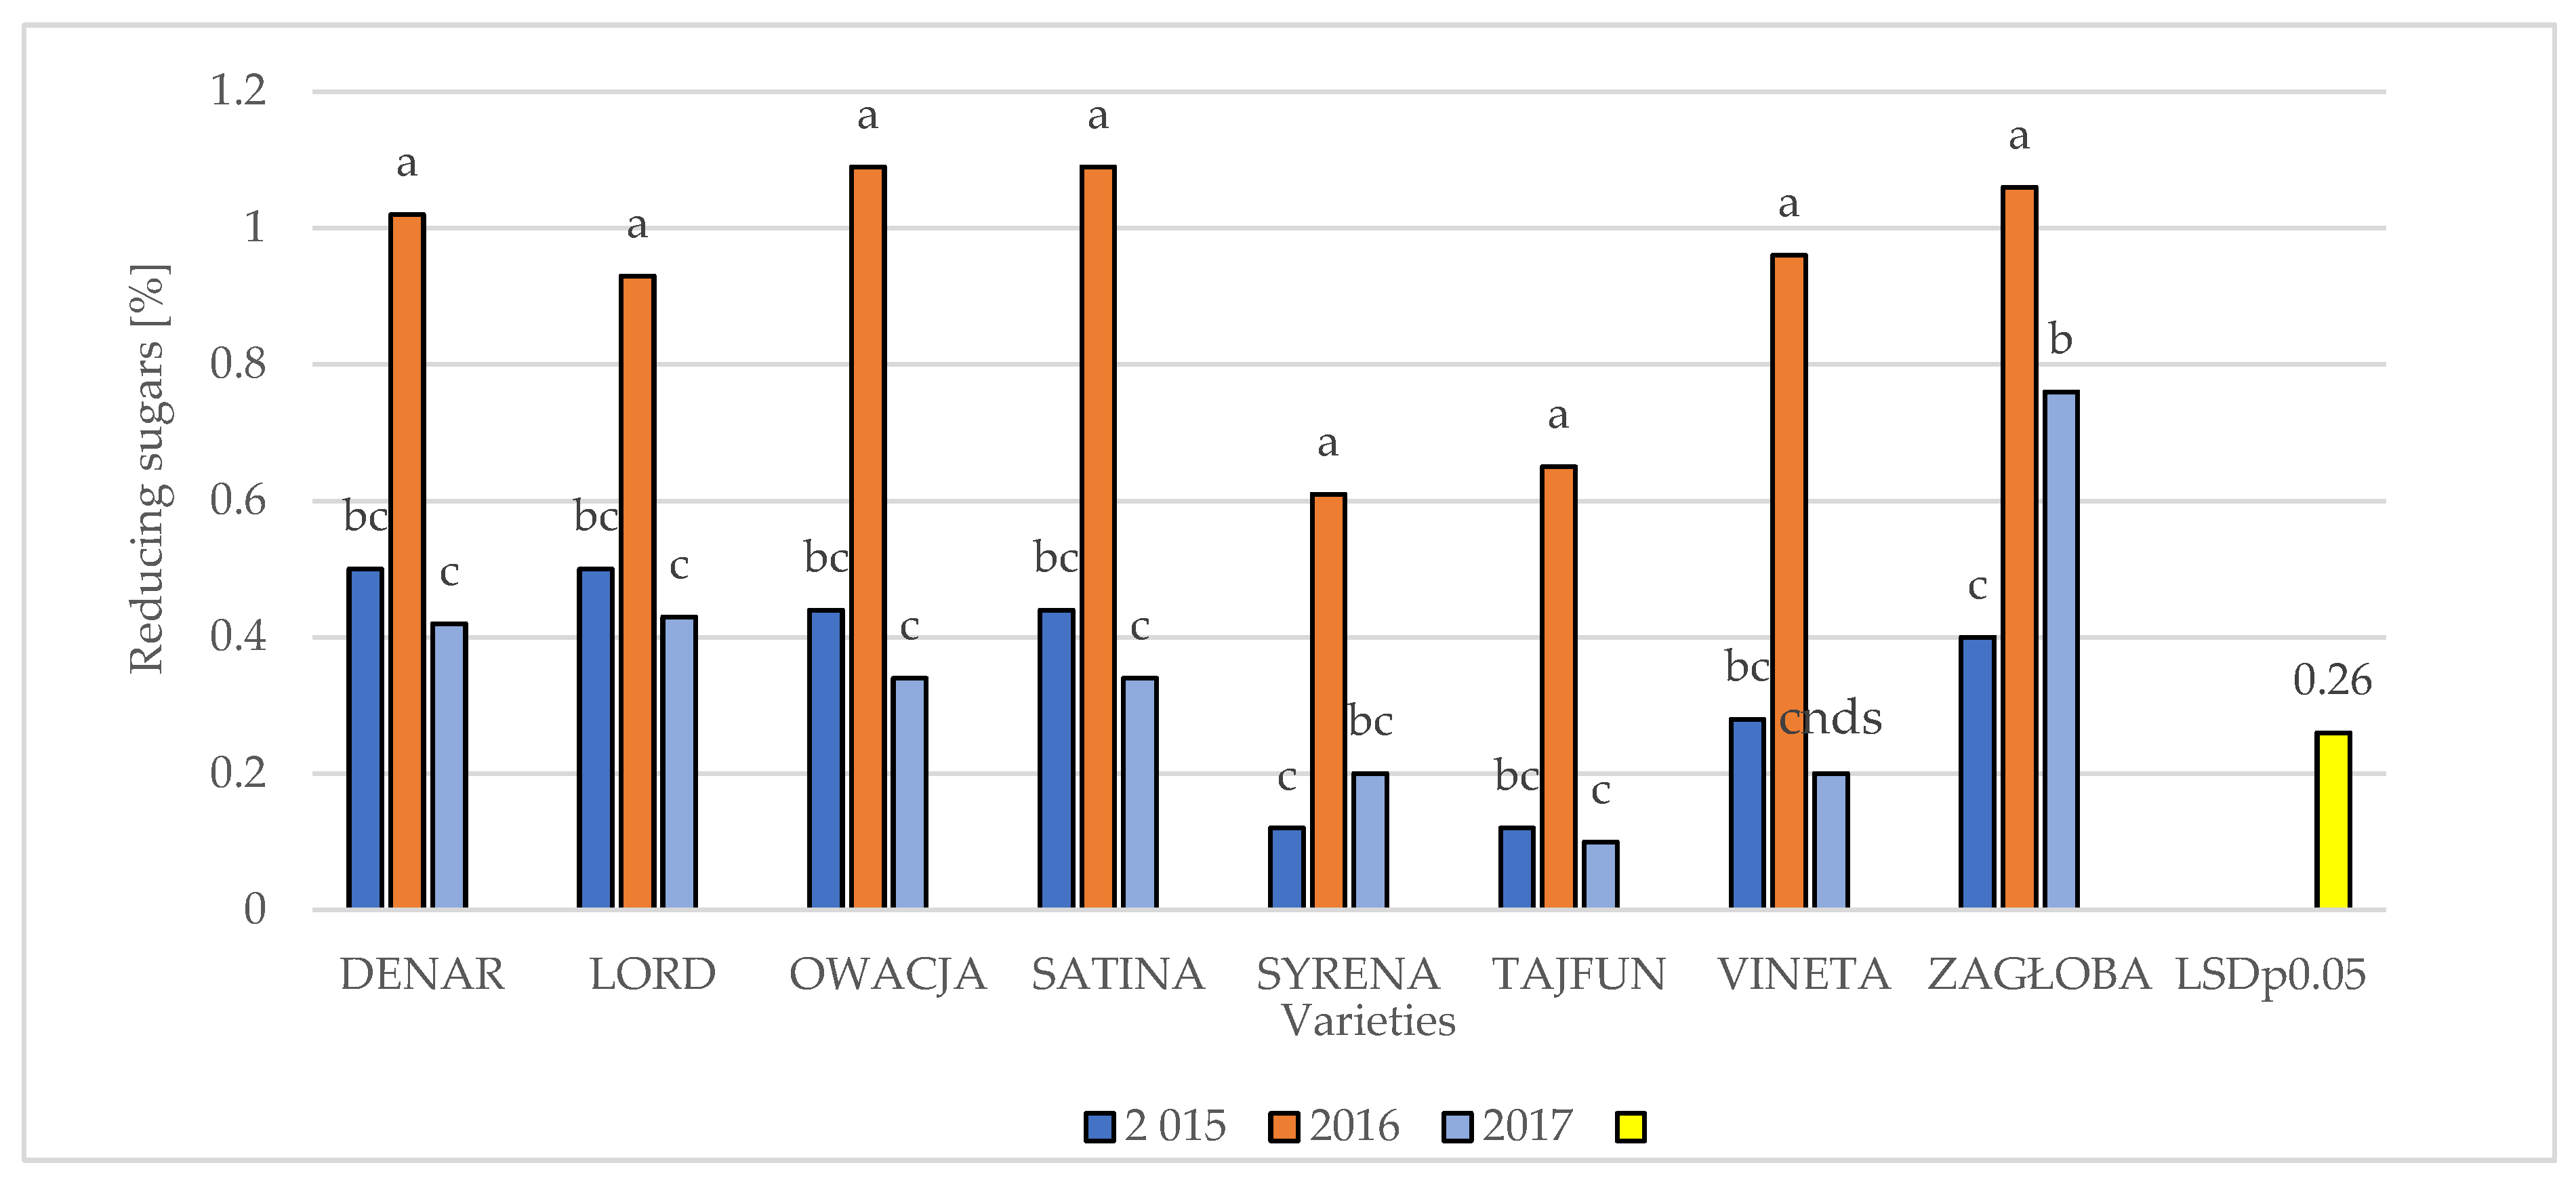
Figure 6.
The influence of cultivation technology and varieties on the content of reducing sugars in potato tubers.
Figure 6.
The influence of cultivation technology and varieties on the content of reducing sugars in potato tubers.
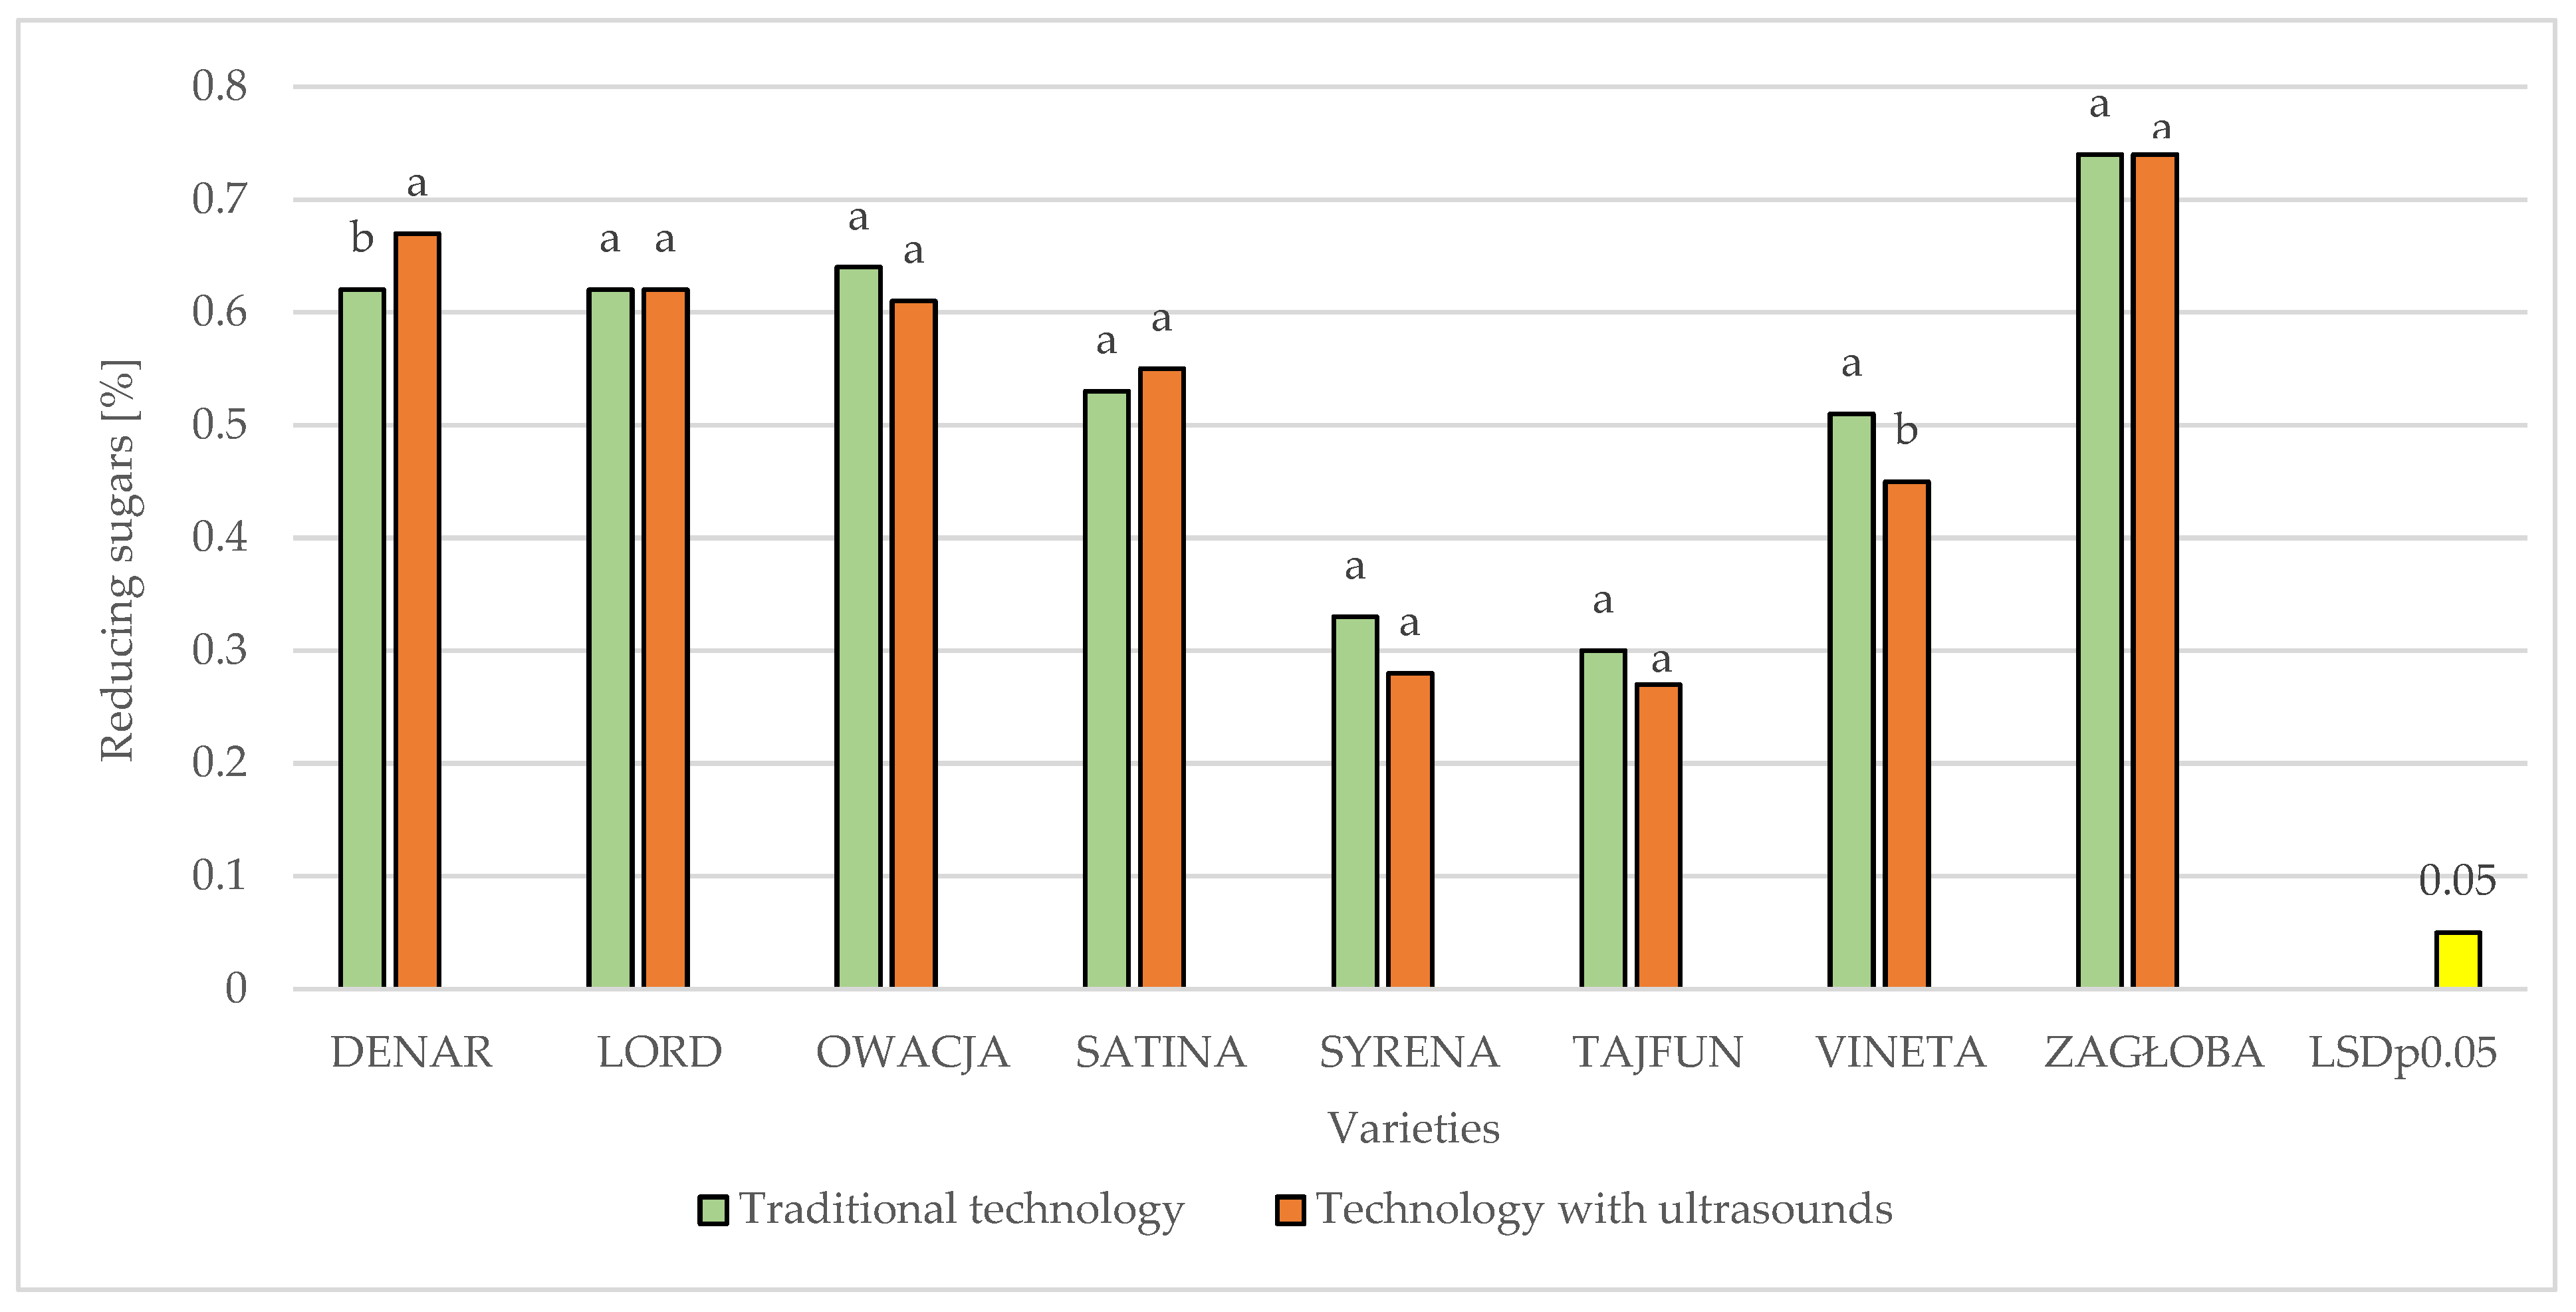
Figure 7.
The Use of Ultrasound in the Production of Potato Chips. Source: own.
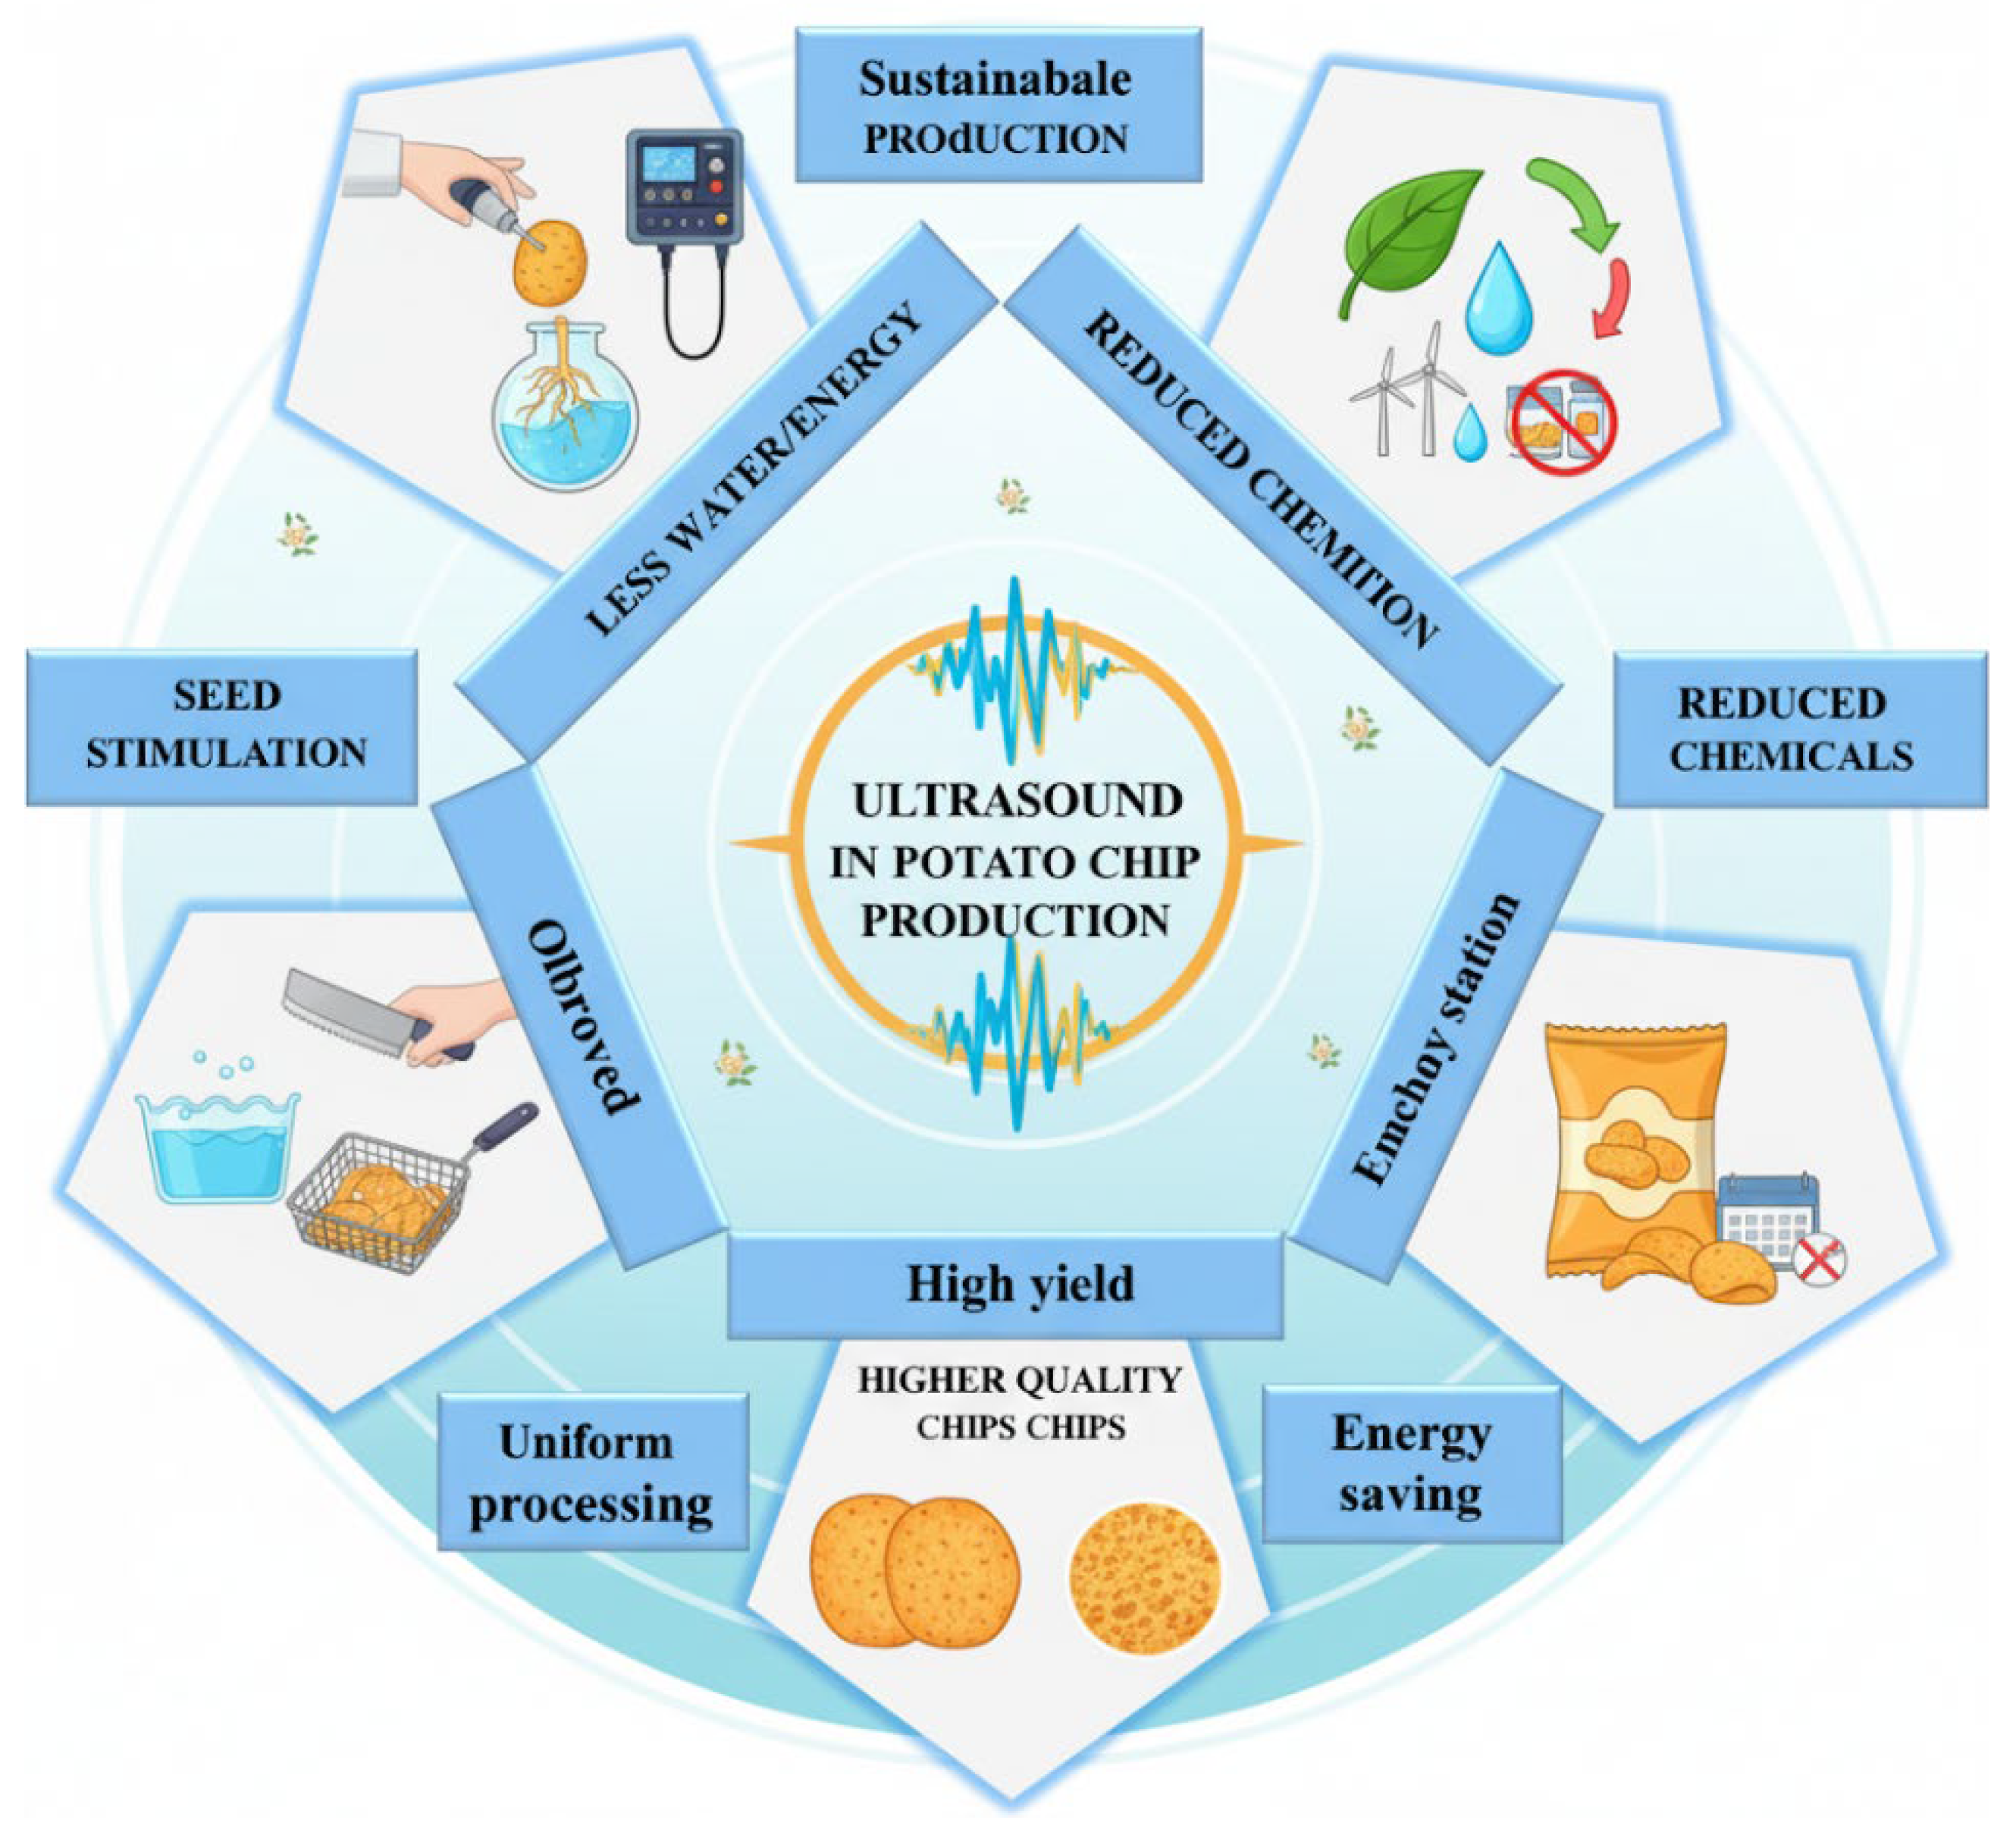
Table 2.
Total rainfalls and average air temperature during the growing season of potato according to the meteorological station in Uhnin 2015-2017.
Table 2.
Total rainfalls and average air temperature during the growing season of potato according to the meteorological station in Uhnin 2015-2017.
| Year | Month | Rainfall [mm] | Air temperature [°C] | ||||||
| Decade | Month | Decade | Mean | ||||||
| 1 | 2 | 3 | 1 | 2 | 3 | ||||
| 2015 | April | 14.6 | 5.9 | 41.3 | 61.8 | 5.4 | 8.6 | 12.4 | 8.8 |
| May | 23.4 | 13.9 | 83.0 | 120.3 | 12.6 | 12.0 | 13.7 | 12.8 | |
| June | 5.4 | 16.5 | 24.8 | 46.7 | 17.7 | 16.3 | 16.1 | 16.7 | |
| July | 10.5 | 21.6 | 13.1 | 45.2 | 19.6 | 18.7 | 19.9 | 19.4 | |
| August | 0.4 | 0.00 | 5.7 | 6.1 | 23.4 | 20.6 | 20.3 | 21.4 | |
| September | 32.4 | 32.6 | 65.2 | 130.2 | 16.0 | 17.7 | 12.8 | 15.5 | |
| Total | 410.3 | ||||||||
| 2016 | April | 11.5 | 22.2 | 13.4 | 47.1 | 10.9 | 10.1 | 9.0 | 10.0 |
| May | 4.9 | 2.8 | 38.6 | 46.3 | 14.4 | 17.8 | 12.9 | 15.3 | |
| June | 10.1 | 43.2 | 34.0 | 87.3 | 16.6 | 17.5 | 23.0 | 19.1 | |
| July | 22.4 | 30.8 | 60.9 | 114.1 | 19.5 | 20.1 | 21.9 | 20.5 | |
| August | 22.8 | 17.7 | 0.5 | 41.0 | 20.7 | 17.1 | 20.4 | 19.5 | |
| September | 7.6 | 0.10 | 4.1 | 11.8 | 19.5 | 15.5 | 11.5 | 15.5 | |
| Total | 347.6 | ||||||||
| 2017 | April | 6.4 | 7.2 | 38.2 | 51.8 | 10.6 | 6.8 | 6.9 | 8.1 |
| May | 45.1 | 1.3 | 19.1 | 65.5 | 10.5 | 13.0 | 17.4 | 13.7 | |
| June | 1.9 | 9.2 | 12.0 | 23.1 | 16.6 | 17.7 | 20.7 | 18.3 | |
| July | 10.1 | 80.9 | 41.0 | 132.0 | 17.9 | 19.0 | 21.0 | 19.4 | |
| August | 0.4 | 24.4 | 2.2 | 27.0 | 22.8 | 21.3 | 17.1 | 20.3 | |
| September | 38.7 | 35.9 | 8.7 | 83.3 | 16.3 | 15.3 | 12.8 | 14.8 | |
| Total | 382.7 | ||||||||
Source the meteorological station in Uhnin.
Table 3.
The influence of cultivation technology, varieties and years on the quality of chips.
| Experimental Factors | Chips evaluation parameters | |||
| Color on a 9º scale | Visual assessment on a 5º scale |
Organoleptic evaluation on a 5º scale |
||
| Technologies | Traditional | 6.79 a* | 3.60 a | 3.72 a |
| Ultrasounds | 7.50 b | 4.18 b | 4.22 b | |
| Varieties | ’Denar’ ’Lord’ ’Owacja’ ’Vineta’ ’Satina’ ’Tajfun’ ‘Syrena’ ‘Zagłoba’ |
5.94 a 6.34 ba 6.42 ba 7.96 d 7.28 c 8.36 d 8.17 d 6.70 bc |
3.33 ba 3.06 a 3.28 ba 4.50 d 3.94 c 4.72 d 4.61 d 3.69 bc |
3.44 ba 3.31 a 3.08 a 4.53 d 4.0 c 4.78 d 4.81 d 3.83 bc |
|
Years |
2015 2016 2017 |
7.69 c 6.53 a 7.22 b |
4.11 c 3.68 a 3.89 b |
4.34 b 3.75 a 3.82 a |
| Mean | 7.15 | 3.89 | 3.97 | |
* The letter indexes accompanying the arithmetic meaning represent so-called homogeneous groups. The occurrence of the same letter index for at least one of the means indicates the lack of a statistically significant difference between them. The subsequent letter indexes a, b, c. define groups of means in ascending order.
Table 4.
The influence of cultivation technology, variety and years of cultivation on defects and fat content in chips.
Table 4.
The influence of cultivation technology, variety and years of cultivation on defects and fat content in chips.
| Experiment Factors | Chips evaluation parameters [%] | |||||
| Discoloration | Humidity | Moist areas | Content of fat | |||
| Technologies | Traditional | 9.35 b* | 2.19 a | 3.43 b | 28.25 b | |
| Ultrasounds | 4.64 a | 2.28 a | 1.78 a | 27.27 a | ||
| Cultivars | ’Denar’ ’Lord’ ’Owacja’ ’Vineta’ ’Satina’ ’Tajfun’ ‘Syrena’ ‘Zagłoba’ |
6.17 ba 19.61 c 9.83 b 2.44 a 8.61 b 2.78 a 2.72 a 3.78 a |
2.44 ab 3.19 b 2.16 ab 1.92 a 2.26 ab 1.96 a 1.87 a 2.08 ab |
1.72 abc 5.67 e 3.11 dbc 0.28 a 4.78 de 0.56 a 0.83 ab 3.89 dec |
24.30 a 25.30 ab 25.90 b 26.75 b 27.48 b 29.42 b 31.25 b 31.68 b |
|
| Years | 2015 2016 2017 |
2.88 a 8.92 b 9.19 b |
1.90 a 2.13 ab 2.68 b |
0.60 a 3.27 b 3.94 b |
27.06 a 27.81 a 27.62 a |
|
| Mean | 6.99 | 2.24 | 2.60 | 26.39 | ||
* Designations as in Table 3.
Table 5.
Descriptive statistics of the characteristics of chips and sugar content in the raw material for the production of chips.
Table 5.
Descriptive statistics of the characteristics of chips and sugar content in the raw material for the production of chips.
| Specification | y1 | x1 | x2 | x3 | x4 | x5 | x6 | x7 | x8 |
| Average | 7.15 | 3.89 | 3.97 | 2.24 | 6.99 | 2.60 | 27.59 | 1.05 | 0.53 |
| Median | 7.40 | 4.00 | 4.00 | 2.00 | 5.00 | 0.00 | 27.01 | 0.72 | 0.46 |
| Standard deviation | 1.41 | 0.92 | 0.93 | 1.24 | 9.76 | 4.11 | 2.69 | 0.76 | 0.33 |
| Kurtosis | -0.72 | 0.18 | 0.27 | 78.76 | 7.50 | 3.96 | -1.37 | -1.10 | -1.08 |
| Skewness | -0.51 | -0.71 | -0.73 | 7.76 | 2.53 | 1.89 | 0.28 | 0.65 | 0.48 |
| Range | 5.20 | 4.00 | 4.00 | 14.00 | 50.00 | 20.00 | 7.99 | 2.41 | 1.06 |
| Minimum | 3.80 | 1.00 | 1.00 | 1.00 | 0.00 | 0.00 | 24.01 | 0.18 | 0.09 |
| Maximum | 9.00 | 5.00 | 5.00 | 15.00 | 50.00 | 20.00 | 32.00 | 2.59 | 1.15 |
| Variation coefficient V (%) | 19.71 | 23.54 | 23.29 | 55.52 | 139.52 | 157.79 | 9.74 | 72.86 | 63.15 |
y1 – colour of chips on a 9º scale; x1 – visual assessment of chips on a 5º scale; x2 – organoleptic assessment of chips on a 5º scale; x3 – moisture content of chips in %, x4 – defects and discolourations of chips in %; x5 – moist spots in chips in %; x6 – fat content in chips in %; x7 – total sugar content in % of the fresh weight of tubers; x8 – reducing sugar content in % of the fresh weight of tubers.
Table 6.
Pearson’s simple correlation coefficients of chips characteristics.
| Specification | y1 | x1 | x2 | x3 | x4 | x5 | x6 | x7 | x8 |
| y1 | 1.00 | ||||||||
| x1 | 0.87 | 1.00 | |||||||
| x2 | 0.78 | 0.88 | 1.00 | ||||||
| x3 | -0.14 | -0.25 | -0.26 | 1.00 | |||||
| x4 | -0.62 | -0.71 | -0.67 | 0.18 | 1.00 | ||||
| x5 | -0.38 | -0.54 | -0.58 | 0.20 | 0.67 | 1.00 | |||
| x6 | 0.34 | 0.38 | 0.43 | -0.20 | -0.30 | -0.11 | 1.00 | ||
| x7 | 0.44 | -0.29 | -0.28 | -0.06 | 0.18 | 0.17 | -0.04 | 1.00 | |
| x8 | -0.54 | -0.38 | -0.37 | 0.01 | 0.22 | 0.19 | -0.17 | 0.94 | 1.00 |
y1 – color of chips on a 9º scale; x1 – visual assessment of chips on a 5º scale; x2 – organoleptic assessment of chips on a 5º scale; x3 – moisture content of chips in %, x4 – defects and discolourations of chips in %; x5 – moist spots in chips in %; x6 – fat content in chips in %; x7 – total sugar content in % of the fresh weight of tubers; x8 – reducing sugar content in % of the fresh weight of tubers.
Table 7.
Key Factors Influencing Sugar Accumulation in Potato Tubers and Their Impact on Processing Quality.
Table 7.
Key Factors Influencing Sugar Accumulation in Potato Tubers and Their Impact on Processing Quality.
| Factors | Effect | Source |
| Weather conditions | ↑ in cold and humid periods | [39,41,51] |
| Storage temperature | Optimum: 6–8°C (↑ below 4°C & above 10°C) | [12,41,43] |
| Harvest time | July harvest → 5× higher sugar content than August | [43,53] |
Source: own.
Disclaimer/Publisher’s Note: The statements, opinions and data contained in all publications are solely those of the individual author(s) and contributor(s) and not of MDPI and/or the editor(s). MDPI and/or the editor(s) disclaim responsibility for any injury to people or property resulting from any ideas, methods, instructions or products referred to in the content. |
© 2025 by the authors. Licensee MDPI, Basel, Switzerland. This article is an open access article distributed under the terms and conditions of the Creative Commons Attribution (CC BY) license (https://creativecommons.org/licenses/by/4.0/).
Copyright: This open access article is published under a Creative Commons CC BY 4.0 license, which permit the free download, distribution, and reuse, provided that the author and preprint are cited in any reuse.


