
Submitted:
11 September 2025
Posted:
12 September 2025
You are already at the latest version
Abstract
The European Union’s (EU) climate neutrality agenda prioritises sustainable agriculture, and within that, the dairy sector is central to food security, rural life, and trade competitiveness. Latvia’s contribution to EU milk production is comparatively small; yet, dairy farming constitutes a structurally important sector that must reconcile economic sustainability with environmental concerns, including greenhouse gas (GHG) emissions and resource use. Therefore, the research aim is to identify key environmental hotspots and explore the relationship between productivity, economic performance, and sustainability using the life cycle assessment (LCA) approach in different sizes of farms in Latvia. This study applies an LCA methodology to evaluate environmental hotspots and investigate the relationships between productivity, farm size, and economic performance of Latvian dairy farms. GHG emissions from Latvian dairy farms were analysed. Small farms dominate by number in Latvia, but the largest ones have the highest yields and milk quality, and are more economically sensitive due to their high production costs. LCA results show that large farms have the highest absolute environmental impacts—particularly milking and feed production—though the emission intensity per kilogram of milk is lower compared to in small farms. These findings present productivity-profit-trade-offs for environmental impacts, with milking and feed emerging as the key areas for enhancing sustainability.
Keywords:
1. Introduction
2. Materials and Methods
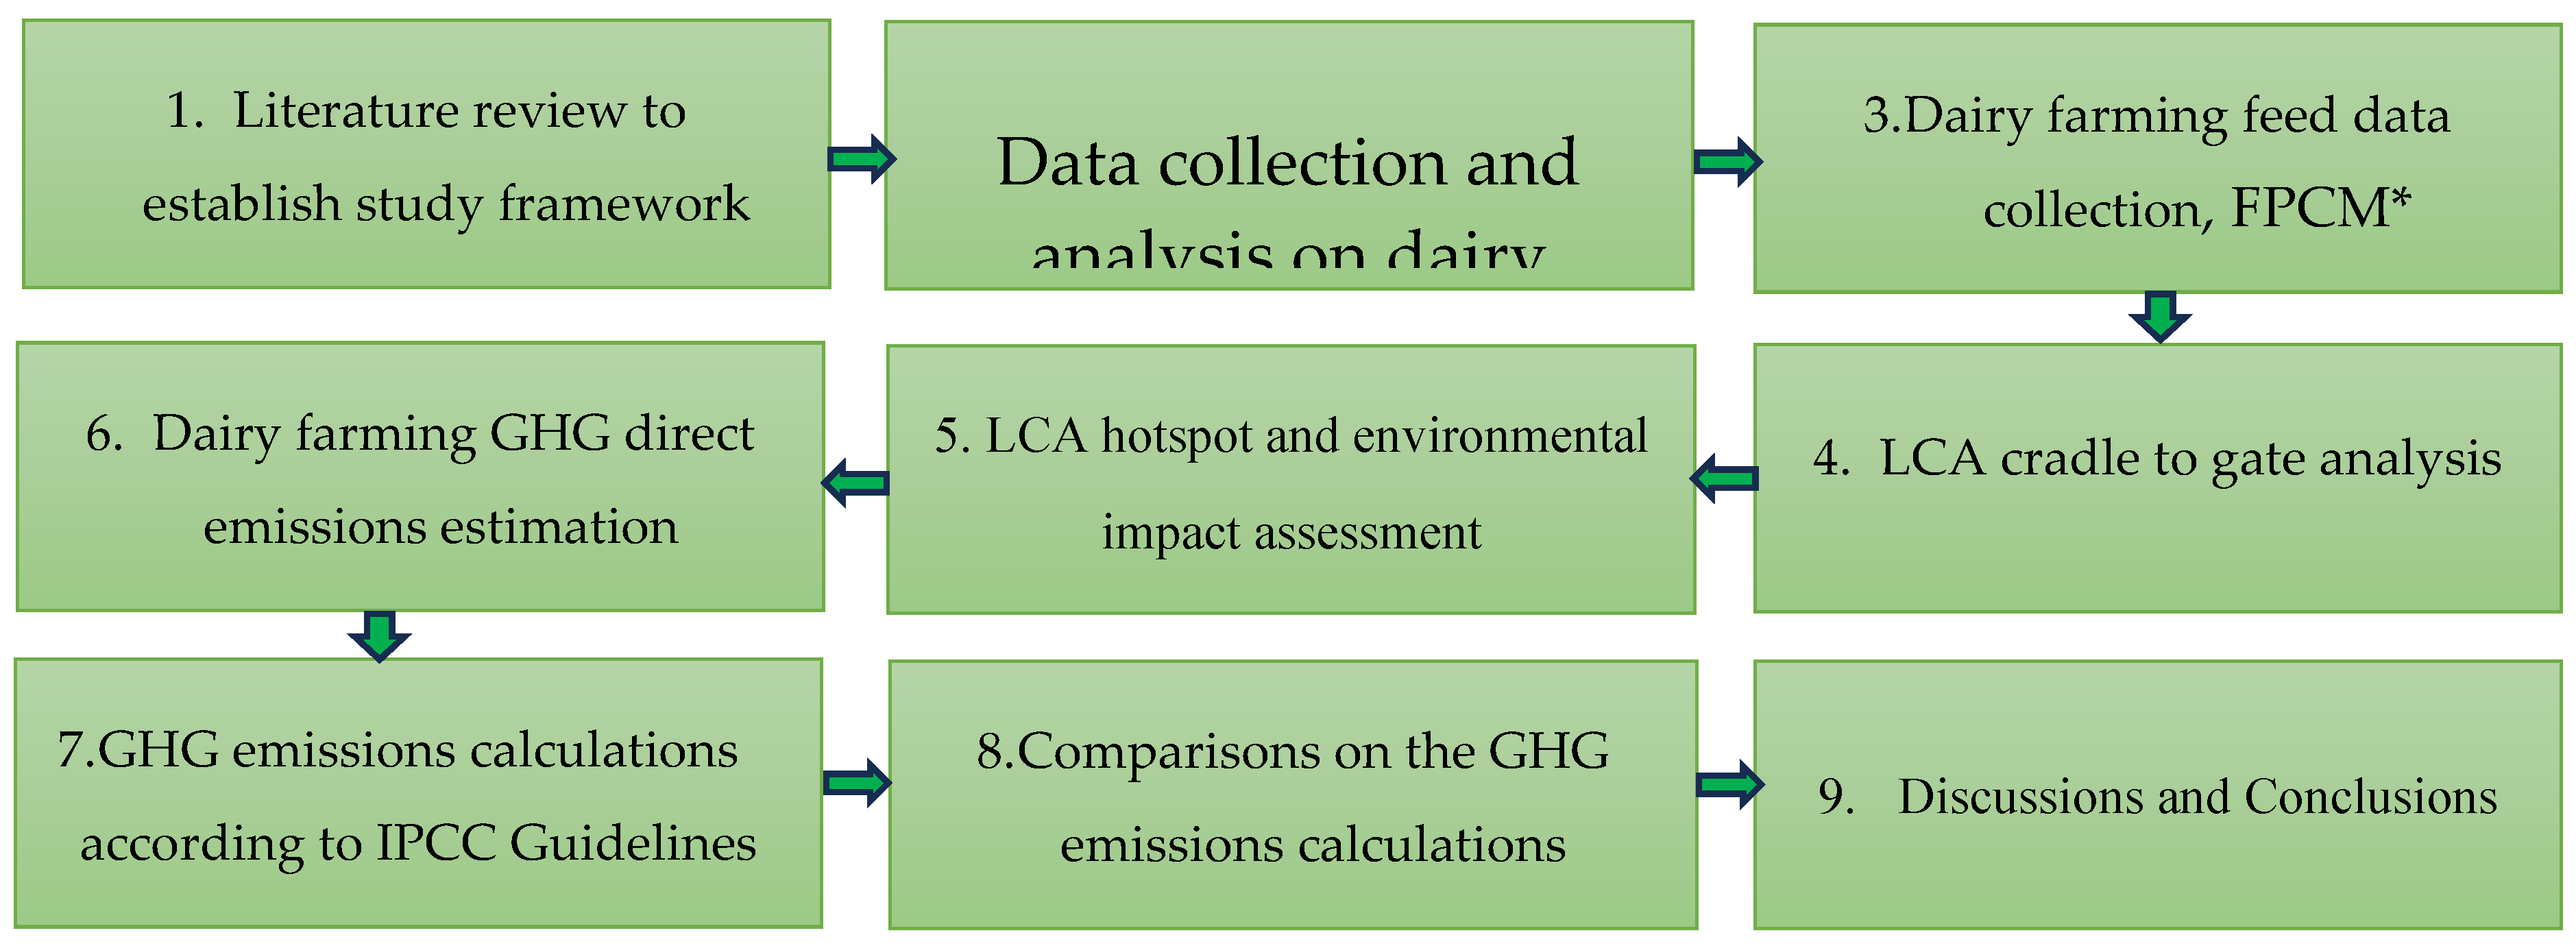
2.1. Methodological Framework of the Study
- FPCM, according to the International Dairy Federation, the FPCM shall be calculated by using the first formula [22]:
- 2.
- FPCM, according to the United Nations Food and Agriculture Organization (FAO) (2007), using the second formula [23]:
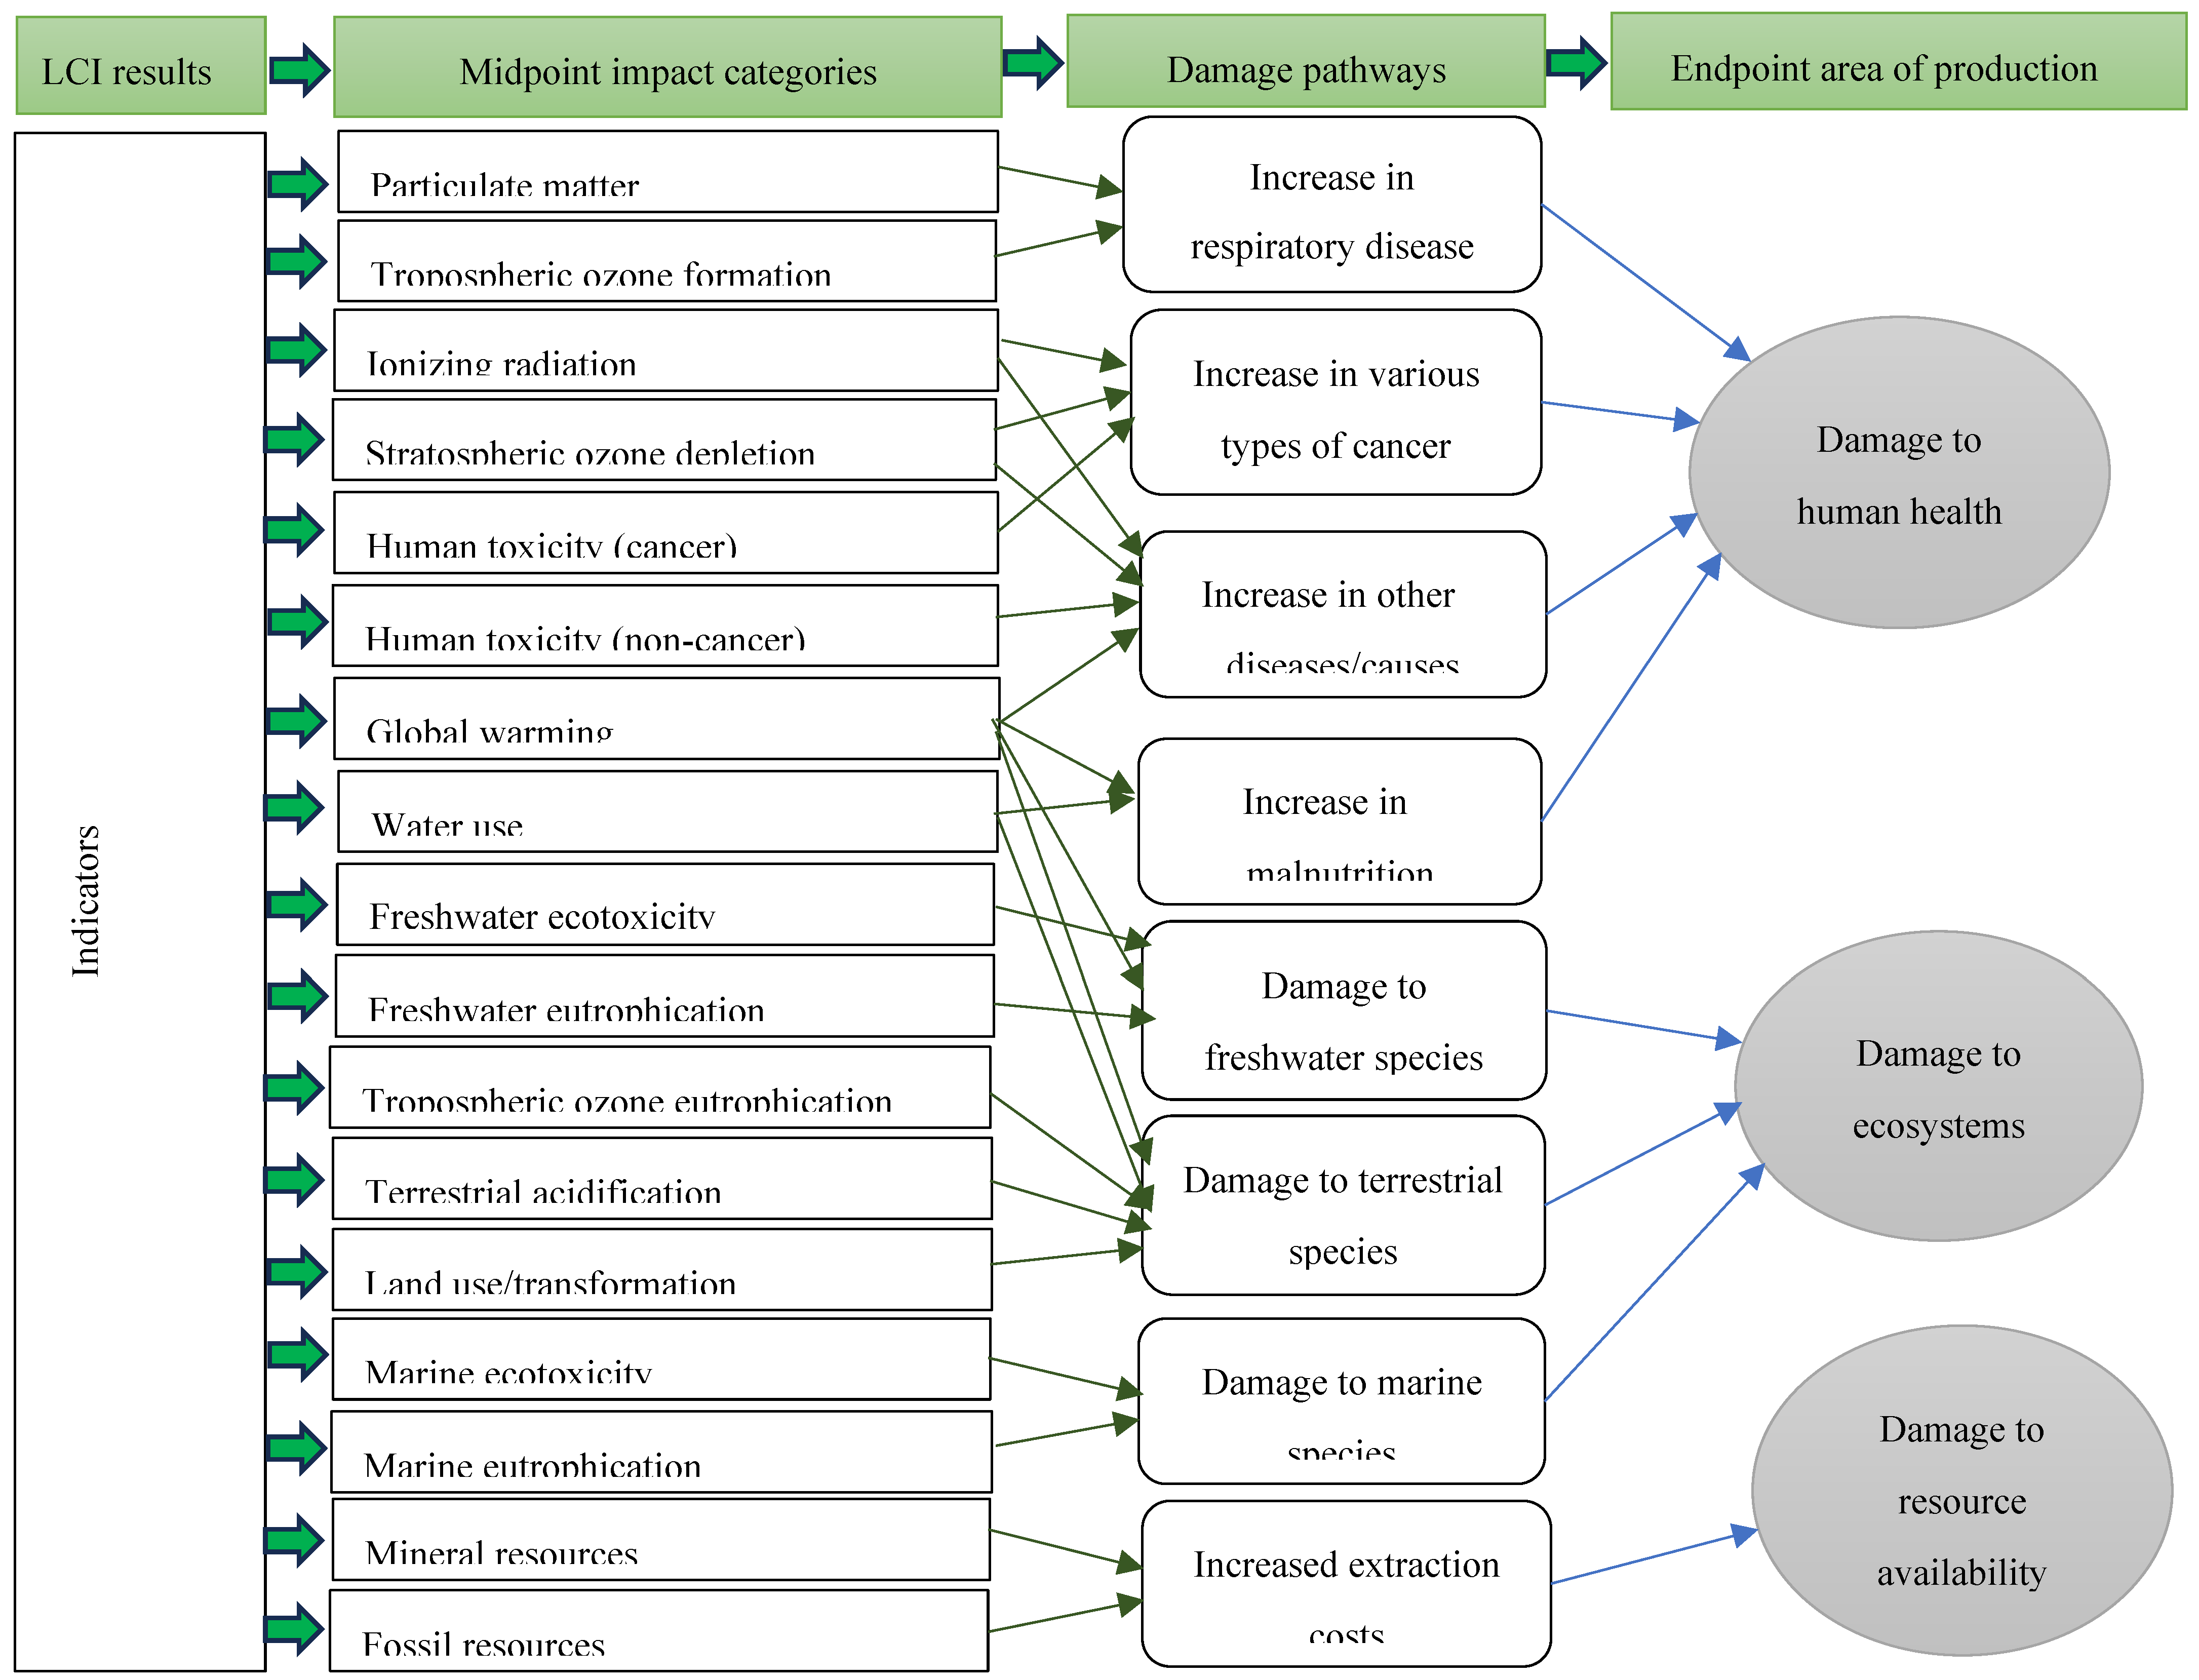
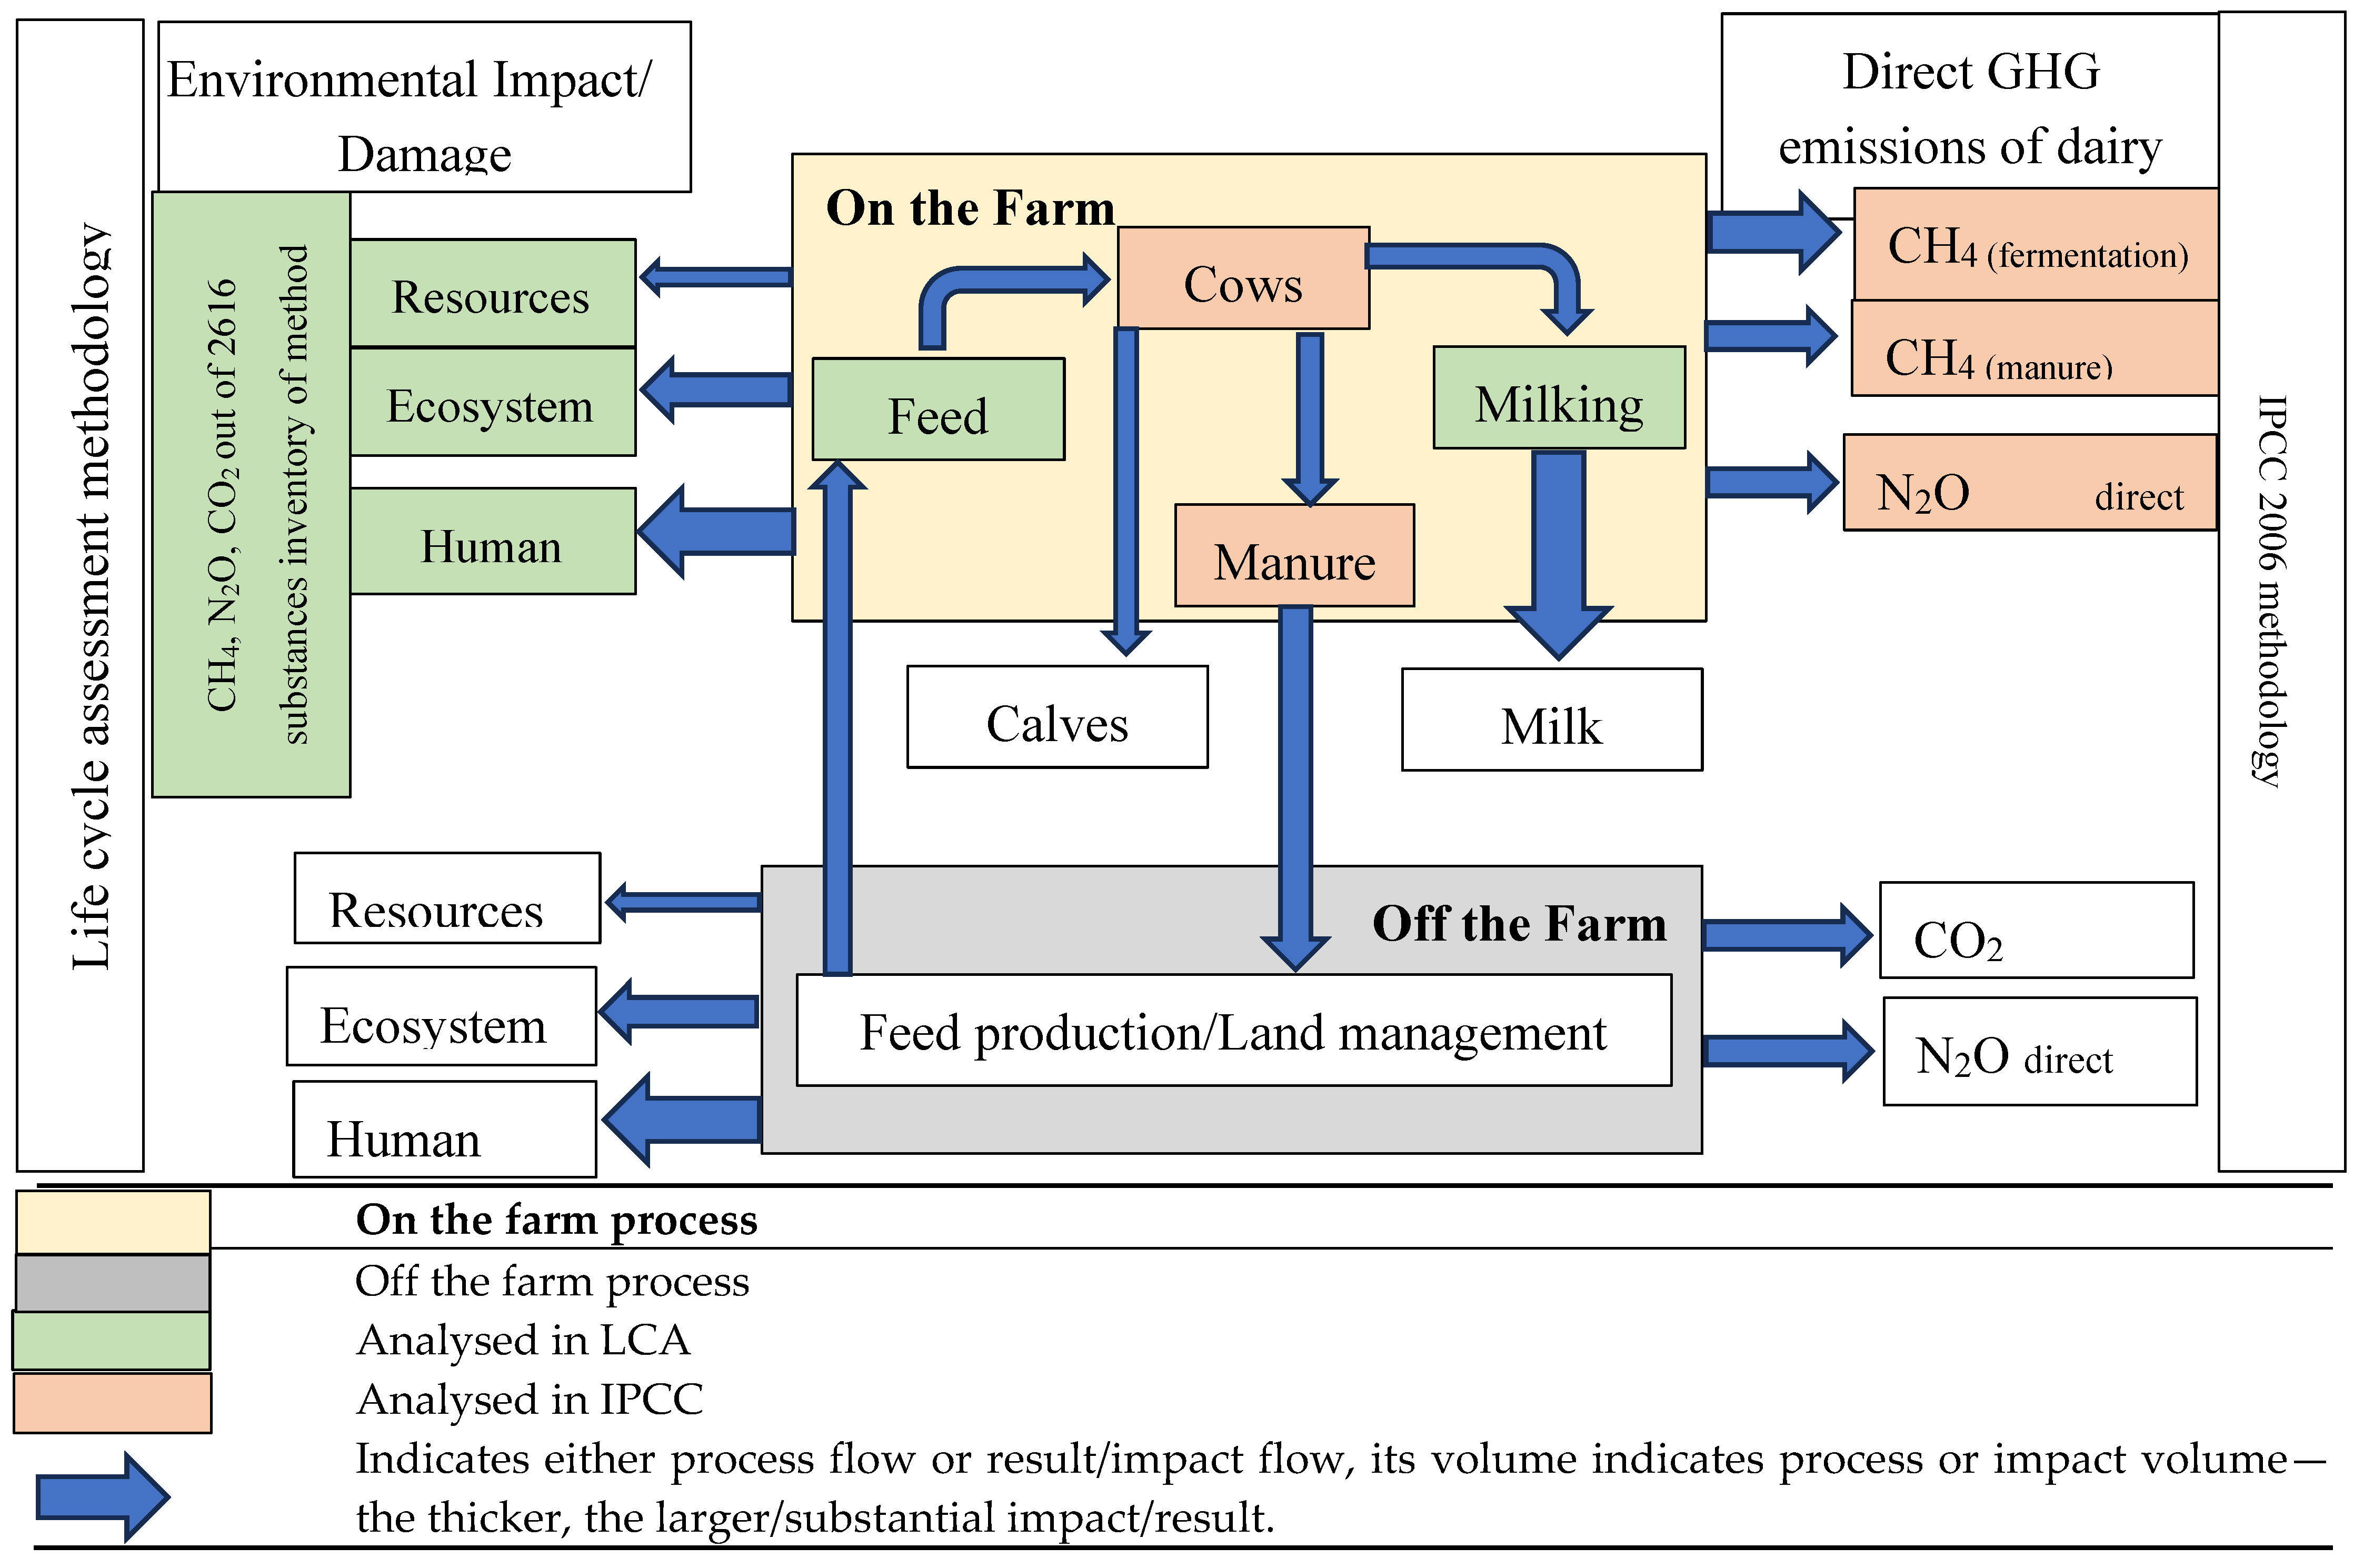
2.2. Environmental Impact Assessment Through the Cradle-to-Gate LCA Technique
2.3. GHG Emissions Calculations and Analysis
3. Results
3.1. Characteristics of Dairy Farms in Latvia
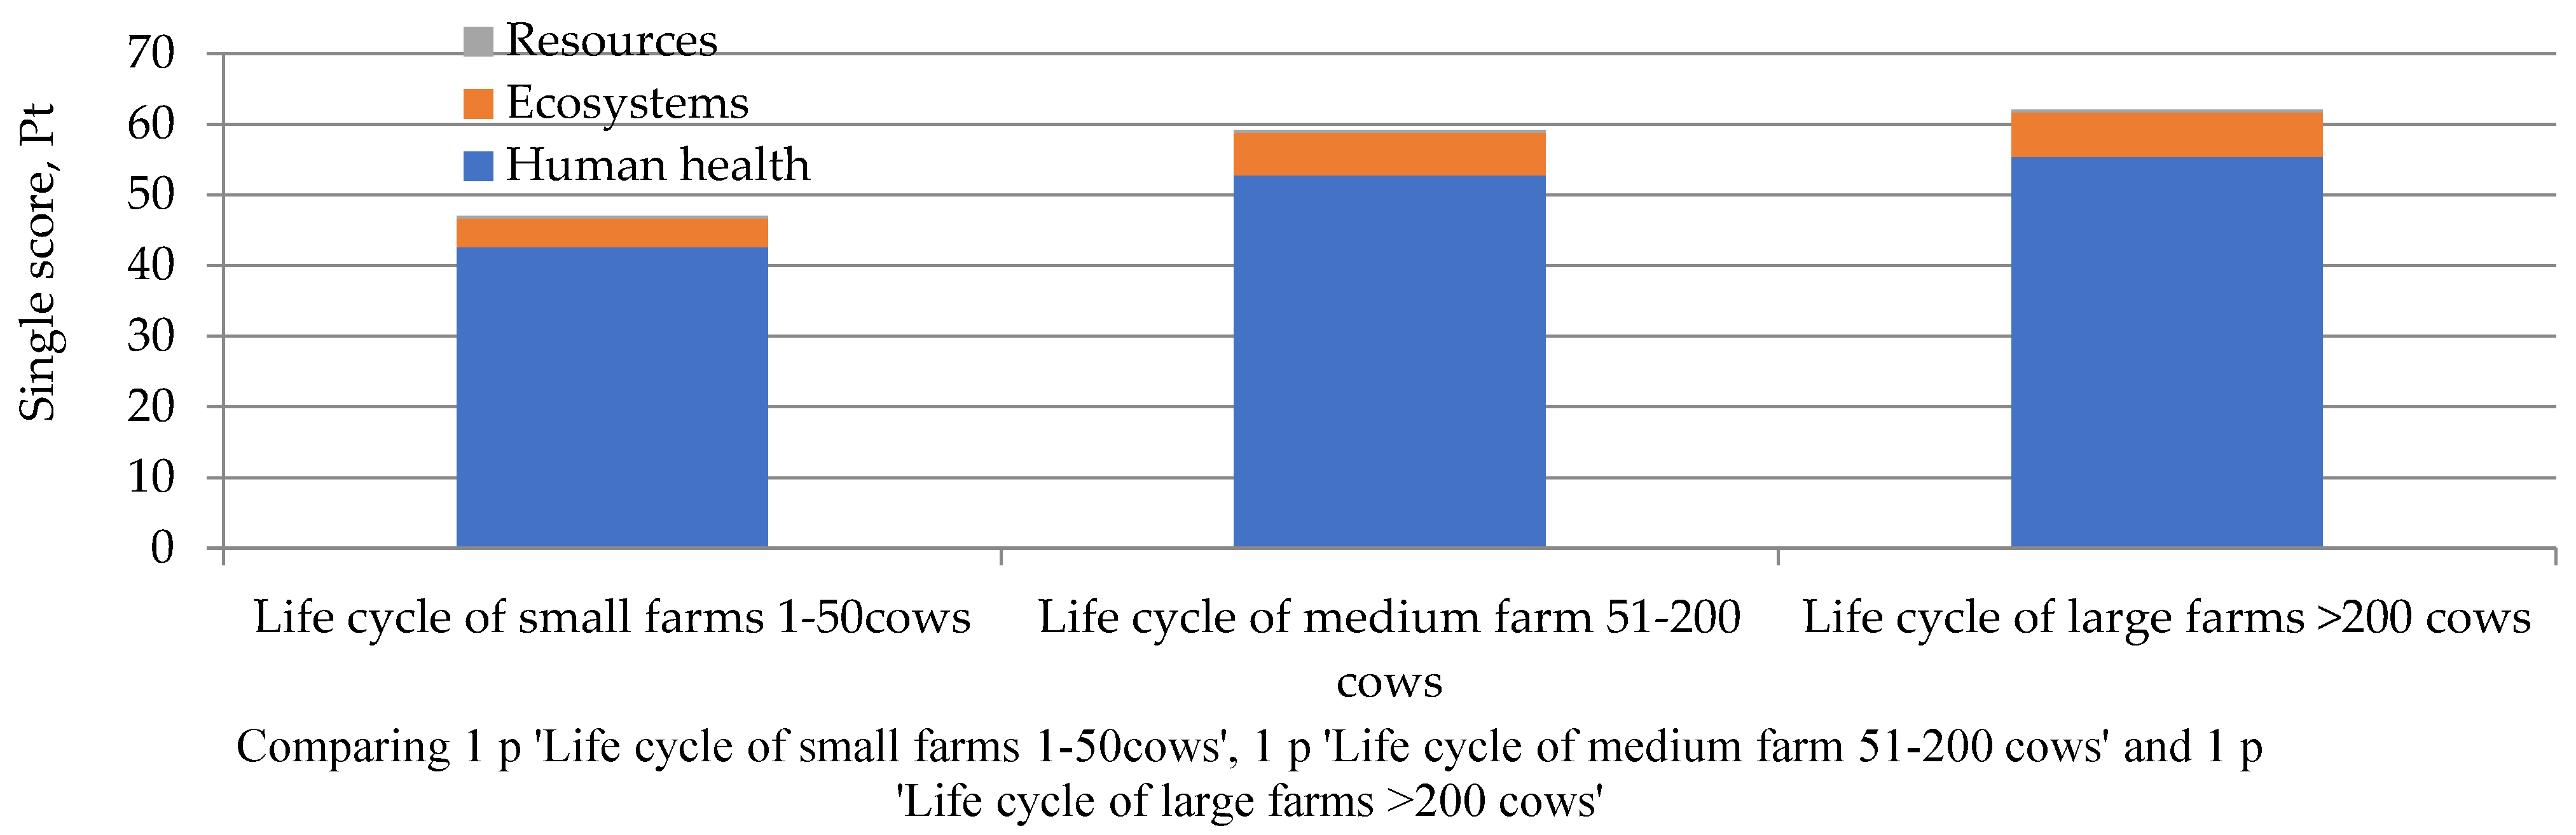
3.2. LCA Calculation Results for Dairy Farms in Latvia
3.3. Comparisons of the Calculation of Direct GHG Emissions in Different Sizes of Dairy Farms in Latvia
4. Discussion
4.1. Productivity and Economic Performance
4.2. Environmental Impact and Sustainability
4.3. Balancing Productivity, Profitability, and Environmental Performance
4.4. Methodological Considerations
4.5. Policy Implications and Future Research Directions
5. Conclusions
Supplementary Materials
Author Contributions
Funding
Institutional Review Board Statement
Data Availability Statement
Acknowledgments
Conflicts of Interest
Abbreviations
| CO2 | carbon dioxide |
| CH4 | methane |
| CO2eq | carbon dioxide equivalent |
| EU | European Union |
| EUR | euro |
| FADN | The Farm Accounting Data Network |
| FAO | The United Nations Food and Agriculture Organization |
| FPCM | fat and protein-corrected milk |
| GHG | greenhouse gas |
| IDF | International Dairy Federation |
| IPCC | The Intergovernmental Panel on Climate Change |
| ISO | International Organization for Standardization |
| kg | kilogram |
| LCA | Life cycle assessment |
| LCI | life cycle inventory |
| LLKC | Latvian Rural Advisory and Training Centre |
| N2O | nitrous oxide |
| SO | Standard Output |
| TMR | total mixed ratio |
Appendix

| Indicators/Number of Cows per Herd | 1-50 | 51-200 | ≥ 201 | Total/Overall Average |
| Hay | 5.70 | 2.47 | 2.19 | 3.46 |
| Haylage/Grass silage | 6.20 | 7.02 | 5.80 | 6.34 |
| Leguma and grass silage | 9.00 | 8.61 | 4.12 | 7.24 |
| Corn silage | 0.55 | 2.43 | 3.80 | 2.26 |
| Straw | 0.75 | 0.63 | 0.49 | 0.62 |
| Roots | 1.40 | 0.00 | 0.00 | 0.47 |
| Fodder | 4.05 | 4.31 | 3.49 | 3.95 |
| Molasses | 0.35 | 0.33 | 0.45 | 0.38 |
| Expeller and meal | 0.65 | 1.59 | 1.28 | 1.17 |
| Salt | 0.10 | 0.09 | 0.08 | 0.09 |
| Minerals and vitamins | 0.20 | 0.19 | 0.18 | 0.19 |
| Total mixed ratio (TMR) | 10.00 | 21.72 | 24.77 | 18.83 |
| Indicators | TMR Ratio per Day in kg per Cow | % of Total TMR |
| Alfaalfa grass silage | 31 | 61% |
| Maize silage | 7 | 14% |
| Wheat | 3 | 6% |
| Barley | 3 | 6% |
| Maize chop | 1.5 | 3% |
| Soy expellers | 2.7 | 5% |
| Molasses | 0.5 | 1% |
| Mineral supplements | 0.18 | 0% |
| Fodder chalk | 0.2 | 0% |
| Sodium | 0.1 | 0% |
| Salt | 0.05 | 0% |
| Water | 2 | 4% |
| Total | 51.23 | 100% |
|
Nutrient Provision in Feed Rations/ Number of Cows per Herd |
1-50 | 51-200 | > 201 |
Total/ Overall Average |
| Dry matter, kg | 18.8 | 23.25 | 25.04 | 22.36 |
| Crude protein, g | 2565.295 | 2 681.45 | 3 322.59 | 2 856.44 |
| Crude fats, g | 565.44 | 698.15 | 730.82 | 664.80 |
| Crude fibber, kg | 5.7 | 5.67 | 5.63 | 5.67 |
| Nitrogen-free extract, kg | 10.4 | 10.60 | 13.33 | 11.44 |
References
- Muska, A.; Pilvere, I.; Viira,A.-H.; Muska, K.; Nipers, A. European Green Deal Objective: Potential Expansion of Organic Farming Areas. Agriculture 2025, 15, 1633. [CrossRef]
- Peng, B.; Melnikiene, R.; Baležentis, T.; Agnusdei, G.P. Structural dynamics and sustainability in the agricultural sector: The case of the European Union. Agric. Food Econ. 2024, 12, 31. [CrossRef]
- Bórawski, P.; Pawlewicz, A.; Parzonko, A.; Harper, J.K.; Holden, L. Factors Shaping Cow’s Milk Production in the EU. Sustainability 2020, 12, 420. [CrossRef]
- Pilvere I.; Upite I.; Muska A.; Zdanovskis K.; Nipers A.; Janmere L. Resilience of Milk Supply Chains during and after the COVID-19 Crisis in Latvia. Rural Sustainability Research 2021, vol.45, no.340, pp.53-64. [CrossRef]
- Chatellier, V.; Delattre, F.; Rat-Aspert, O. Milk price in Savoy and cheese chain. HAL (Le Centre Pour La Communication Scientifique Directe). 2006. https://hal.archives-ouvertes.fr/hal-02822243.
- Brkić, I.; Puvača, N. Economic and Ecological Sustainability of Dairy Production. Journal of Agronomy Technology and Engineering Management (JATEM) 2024, 7(3), 1088. [CrossRef]
- Bojovic, M.; McGregor, A. A review of megatrends in the global dairy sector: what are the socioecological implications? Agriculture and Human Values 2022, 40(1), 373. [CrossRef]
- Summaries. Advances in Animal Biosciences 2016, 7(1), 1. [CrossRef]
- Capper, J. L.; Bauman, D. E. The Role of Productivity in Improving the Environmental Sustainability of Ruminant Production Systems. Annual Review of Animal Biosciences 2012, 1(1), 469. Annual Reviews. [CrossRef]
- Peterson, C. B.; Mitloehner, F. M. Sustainability of the Dairy Industry: Emissions and Mitigation Opportunities. Frontiers in Animal Science 2021, 2. [CrossRef]
- Slade, P.; Hailu, G. Efficiency and regulation: a comparison of dairy farms in Ontario and New York State. Journal of Productivity Analysis 2015, 45(1), 103. [CrossRef]
- Latruffe, L.; Desjeux, Y.; Hanitravelo, G. L. J.; Hennessy, T.; Bockstaller, C.; Dupraz, P.; Finn, J. A. Tradeoffs between Economic, Environmental and Social Sustainability: The Case of a Selection of European Farms. HAL (Le Centre Pour La Communication Scientifique Directe) 2016. https://hal.archives-ouvertes.fr/hal-01611416.
- Wilfart, A.; Baillet, V.; Balaine, L.; Otálora, X. D.; de, Dragoni, F.; Król, D.; Frątczak-Müller, J.; Rychła, A.; Rodriguez, D. G. P.; Breen, J.; Anestis, V.; Buckley, C.; Alem, H.; Winiwarter, W.; Akkal-Corfini, N.; Amon, B. DEXi-Dairy: an ex post multicriteria tool to assess the sustainability of dairy production systems in various European regions. Agronomy for Sustainable Development 2023, 43(6). [CrossRef]
- Koutouzidou, G.; Ragkos, A.; Theodoridis, A.; Arsenos, G. Entrepreneurship in Dairy Cattle Sector: Key Features of Successful Administration and Management. Land 2022, 11(10), 1736. [CrossRef]
- Tamburini, E.; Pedrini, P.; Marchetti, M. G.; Fano, E. A.; Castaldelli, G. Life Cycle Based Evaluation of Environmental and Economic Impacts of Agricultural Productions in the Mediterranean Area. Sustainability 2015, 7(3), 2915. [CrossRef]
- McClelland, S. C.; Arndt, C.; Gordon, D. R.; Thoma, G. Type and number of environmental impact categories used in livestock life cycle assessment: A systematic. Livestock Science 2018, 209, 39. [CrossRef]
- Milani, F.; Nutter, D. W.; Thoma, G. Invited review: Environmental impacts of dairy processing and products: A review. Journal of Dairy Science 2011, 94(9), 4243. [CrossRef]
- SLLC Latvian Environment, Geology and Meteorology Centre (LVMEO). Kopsavilkums par 2025.gada siltumnīcefekta gāzu inventarizāciju/Summary of the 2025 greenhouse gas inventory (in Latvian). Available online: https://videscentrs.lvgmc.lv/lapas/informacija-par-latvijas-seg-emisijam (accessed on September 08, 2025).
- IPCC 2006. 2006 IPCC Guidelines for National Greenhouse Gas Inventories. Prepared by the National. Greenhouse Gas Inventories Programme, Eggleston H.S.; Buendia L.; Miwa K.; Ngara T.; Tanabe K. (eds). Published: IGES, Japan. Available online: https://www.ipcc-nggip.iges.or.jp/public/2006gl/vol1.html (accessed on 17 July, 2025).
- Farm Accounting Data Network (FADN). 2023 data. Available online: https://sudat.arei.lv/Login.aspx?ReturnUrl=%2f (accessed on June 14, 2025).
- Rural Support Service (RSS). 2024 data. Monitoring data of herds in 2023/2024. Available online: https://registri.ldc.gov.lv/lv/parraudziba (accessed on August 11, 2025).
- International Dairy Federation (IDF). A common carbon footprint approach for dairy sector: The IDF guide to standard life cycle assessment methodology. Bulletin of the International Dairy Federation 479/2015. Available online: https://www.fil-idf.org/wp-content/uploads/2016/09/Bulletin479-2015_A-common-carbon-footprint-approach-for-the-dairy-sector.CAT.pdf (accessed on August 04, 2025).
- United Nations Food and Agriculture Organization (FAO). Greenhouse Gas Emissions from the Dairy Sector: A Life Cycle Assessment. 2007. Available online: https://www.fao.org/4/k7930e/k7930e00.pdf (accessed on August 11, 2025).
- SaimnieksLV portal. Article Dažāda auguma izmēra govju ražotais piena daudzums vienā dienā/Amount of milk produced by cows of different sizes in one day (In Latvian). By LLKC on 02.03.2022. Available online: http://saimnieks.lv/raksts/dazada-auguma-izmera-govju-razotais-piena-daudzums-viena-diena#:~:text=Vid%C4%93jais%20piena%20govju%20produkt%C4%ABv%C4%81s%20dz%C4%ABves,5%20l%C4%ABdz%206%2C5%20gadiem (accessed on September 05, 2025).
- International Organization for Standardization (ISO). 2006: Environmental management—Life cycle assessment – Principles and framework. ISO 14044:2006, 4.3.4.2. section, Switzerland: ISO.
- European Commission (EC). Annex I. Product Environmental Footprint Method. 2021. Available online: https://environment.ec.europa.eu/system/files/2021-12/Annexes%201%20to%202.pdf (accessed on August 21, 2025).
- PRé Sustainability, SimaPro software 10.2.0.2., using database Ecoinvent 3.0, cut-off by classification – system, and using method ReCiPe 2016 Endpoint (H) V1.11/World (2010) H/A. Available online: https://simapro.com/(licence since August 05, 2025).
- International Organization for Standardization (ISO). ISO 14072:2024 standard: Environmental management – Life cycle assessment – Requirements and guidance for organizational life cycle assessment. 2024, Switzerland: ISO.
- Buxel, H.; Esenduran, G.; Griffin, S. Strategic sustainability: Creating business value with life cycle analysis. Business Horizons 2014, 58(1), 109. [CrossRef]
- International Organization for Standardization (ISO), 2006, ISO 14040:2006: Environmental management – Life cycle assessment – Principles and framework. Switzerland: ISO.
- Degola L.; Cielava L.; Trupa A.; Aplocina E. Barības devas dažāda lieluma piena lopkopības saimniecīvās/Feed rations in different size dairy farms (In Latvian). Scientific practical conference „LĪDZSVAROTA LAUKSAIMNIECĪBA”, 25.–26.02.2016., LLU, Jelgava, Latvia. Available online: https://llufb.llu.lv/conference/lidzsvar_lauksaim/2016/Latvia-lidzsvarota-lauksaimnieciba2016-161-168.pdf (accessed on August 02, 2025).
- Holstein Foundation Inc. Milking and Lactation. 2017. Available online: https://www.holsteinfoundation.org/pdf_doc/workbooks/Milking_Lactation_Workbook.pdf (accessed on August 16, 2025).
- Latvian Rural Advisory and Training Centre (LLKC). Slaucamo govju ēdināšanas nozīme svaigpiena sausnas satura izmaiņā/The role of dairy cow nutrition in changing the dry matter content of raw milk (In Latvian). 21.11.2019. Available online: https://arhivs.llkc.lv/lv/nozares/lopkopiba/slaucamo-govju-edinasanas-nozime-svaigpiena-sausnas-satura-izmaina (accessed on August 18, 2025).
- European Commission. Green Forum, Life Cycle Assessment & the EF methods, comprehensive coverage of impacts, 2025. Available online: https://green-forum.ec.europa.eu/green-business/environmental-footprint-methods/life-cycle-assessment-ef-methods_en (accessed on August 11, 2025).
- Frazier R.S.; Jin E.; Ajay Kumar A. Life Cycle Assessment of Biochar versus Metal Catalysts Used in Syngas Cleaning. Energies 2015, 8(1), 621-644. https://www.mdpi.com/1996-1073/8/1/621.
- Popluga D. Pārskats par zinātniskās izpētes projekta izpildi “Latvijas lauksaimniecības siltumnīcefekta gāzu un amonjaka emisiju, kā arī CO2 piesaistes (aramzemēs un zālājos) robežsamazinājuma izmaksu līkņu (MACC) pielāgošana izmantošanai lauksaimniecības, vides un klimata politikas veidošanā”/Review of the implementation of the scientific research project “Adjustment of marginal abatement cost curves (MACC) of Latvian agricultural greenhouse gas and ammonia emissions, as well as CO2 sequestration (in arable land and grassland) for use in agricultural, environmental and climate policy-making” (in Latvian). 2019. Available online: https://www.lbtu.lv/sites/default/files/files/projects/Popluga_19-00-SOINV05-000018_1.pdf (accessed on August 22, 2025).
- Trading Economics. Latvia’s average temperature. 2025. Available online: https://tradingeconomics.com/latvia/temperature (accessed on August 20, 2025).
- Latvia`s National Inventory Report Greenhouse Gas Emissions in Latvia from 1990 to 2021 in Common Reporting Format (CRF). Riga, 2023, 489 p. Available online: https://unfccc.int/documents/627724 (accessed on August 15, 2025).
- International Organization for Standardization (ISO), 2018, 14067/2018. Greenhouse gases – Carbon footprint of products – Requirements and guidelines for quantification standards. 2018, Switzerland: ISO.
- Statistics Netherlands. What is the scale of greenhouse gas emissions? 2025. Available online: https://www.cbs.nl/en-gb/dossier/greenhouse-gas-emissions/what-is-the-scale-of-greenhouse-gas-emissions- (accessed on September 04, 2025).
- Statistical database. Business sectors: Agriculture. Livestock. LAL090. Number of livestock and poultry at the end of the year (thousand heads) 1915 – 2024. Available online: https://data.stat.gov.lv/pxweb/en/OSP_PUB/START__NOZ__LA__LAL/LAL090/(accessed on September 02, 2025).
- Statistical database. Business sectors: Agriculture. Livestock. LAL070. Livestock productivity 1940 – 2024. Available at: https://data.stat.gov.lv/pxweb/en/OSP_PUB/START__NOZ__LA__LAL/LAL070/ (accessed on September 02, 2025).
- Pilvere, A. Datasets for Efficiency and Emissions Performance in Latvian Dairy Farming: An LCA-Based Comparison Across Farm Sizes. 2025. Available online: https://dv.dataverse.lv/dataset.xhtml?persistentId=doi:10.71782/DATA/ZRTIQV, DataverseLV (accessed on September 10, 2025).
- Central Statistical Bureau of Latvia. Agriculture of Latvia. Collection of Statistics. 2025, 84 p. Available online: https://admin.stat.gov.lv/system/files/publication/2025-06/Nr_13_Latvijas_Lauksaimnieciba_2025_%2825_00%29_LV_EN_1.pdf (accessed on August 31, 2025).
- PRé Sustainability. SimaPro Database Manual, Methods library, 2022. Available online: https://simapro.com/wp-content/uploads/2022/07/DatabaseManualMethods.pdf (accessed on August 19, 2025).
- Brkić, I.; Puvača, N. Economic and Ecological Sustainability of Dairy Production. Journal of Agronomy Technology and Engineering Management (JATEM) 2024, 7(3), 1088. [CrossRef]
- Zanon, T.; Hörtenhuber, S.; Fichter, G.; Peratoner, G.; Zollitsch, W.; Gatterer, M.; Gauly, M. Effect of management system and dietary seasonal variability on environmental efficiency and human net food supply of mountain dairy farming systems. J. Dairy Sci. 2025, 108(1):597–610. [CrossRef]
- Fariña, S.; Chilibroste, P. Opportunities and challenges for the growth of milk production from pasture: The case of farm systems in Uruguay. Agricultural Systems 2019, 176, 102631. [CrossRef]
- Holly, M. A.; Kleinman, P. J. A.; Bryant, R. B.; Bjorneberg, D. L.; Rotz, C. A.; Baker, J. M.; Boggess, M.; Bräuer, D.; Chintala, R.; Feyereisen, G. W.; Gamble, J. D.; Leytem, A. B.; Reed, K. F.; Vadas, P. A.; Waldrip, H. M. Short communication: Identifying challenges and opportunities for improved nutrient management through the USDA’s Dairy Agroecosystem Working Group. Journal of Dairy Science, 2018, 101(7), 6632. [CrossRef]
- Gillespie, J.; Njuki, E.; Terán, A. Structure, costs, and technology used on U.S. dairy farms. Economic Research Service 2024. [CrossRef]
- Singh, A. B.; Bhakar, V.; Gaurav, G.; Khandelwal, C.; Sarkar, P. K.; Singh, H.; Dangayach, G. S. Environmental sustainability of milk production: a comparative environmental impact analysis and sustainability evaluation. Frontiers in Sustainability 2024, 5. [CrossRef]
- Kwon, H.-C.; Jung, H. S.; Kothuri, V.; Han, S. G. Current status and challenges for cell-cultured milk technology: a systematic review. Journal of Animal Science and Biotechnology 2024, 15(1). [CrossRef]
- Salari, F.; Marconi, C.; Sodi, I.; Altomonte, I.; Martini, M. Environmental Sustainability of Dairy Cattle in Pasture-Based Systems vs. Confined Systems. Sustainability 2025, 17(9), 3976. [CrossRef]
- Reddy, P. R. K.; Kumar, D.; Rao, E. R.; Seshiah, Ch. V.; Sateesh, K.; Rao, K. A.; Reddy, Y. P. K.; Hyder, I. Environmental sustainability assessment of tropical dairy buffalo farming vis-a-vis sustainable feed replacement strategy. Scientific Reports 2019, 9(1). [CrossRef]
- Ni, H.; Zeng, H.; Liu, Z.; Li, W.; Miao, S.; Yang, A.; Wang, Y. Towards decarbonizing the supply chain of dairy industry: current practice and emerging strategies. Carbon Neutrality 2025, 4(1). [CrossRef]
- Silvi, R.; Pereira, L. G. R.; Paiva, C. A. V.; Tomich, T. R.; Teixeira, V. A.; Sacramento, J. P.; Ferreira, R.; Coelho, S. G.; Machado, F. S.; Campos, M. M.; Dórea, J. R. R. Adoption of Precision Technologies by Brazilian Dairy Farms: The Farmer’s Perception. Animals 2021, 11(12), 3488. [CrossRef]
- Bhat, R.; Infascelli, F. The Path to Sustainable Dairy Industry: Addressing Challenges and Embracing Opportunities. Sustainability 2025, 17(9), 3766. [CrossRef]
- Capper, J. L.; Bauman, D. E. The Role of Productivity in Improving the Environmental Sustainability of Ruminant Production Systems. Annual Review of Animal Biosciences 2013, 1(1), 469. [CrossRef]
- Thorup, V.; Munksgaard, L.; Terré, M.; Henriksen, J.; Weisbjerg, M.; Løvendahl, P. The relationship between feed efficiency and behaviour differs between lactating Holstein and Jersey cows. The Journal of Dairy Research 2023. 90. 1-4. [CrossRef]
- Clasen, J.; Fikse, W. F.; Ramin, M.; Lindberg, M. Effects of herd management decisions on dairy cow longevity, farm profitability, and emissions of enteric methane – a simulation study of milk and beef production. Animal 2023, 18(2), 101051. [CrossRef]
- Britt, J. H.; Cushman, R. A.; Dechow, C. D.; Dobson, H.; Humblot, P.; Hutjens, M. F.; Jones, G.; Mitloehner, F. M.; Ruegg, P. L.; Sheldon, I. M.; Stevenson, J. S. Review: Perspective on high-performing dairy cows and herds. Animal 2021, 15, 100298. [CrossRef]
- Mondière, A.; Corson, M. S.; Auberger, J.; Durant, D.; Foray, S.; Glinec, J.-F.; Green, P.; Novak, S.; Signoret, F.; Werf, H. van D. Trade-offs between higher productivity and lower environmental impacts for biodiversity-friendly and conventional cattle-oriented systems. Agricultural Systems 2024, 213, 103798. [CrossRef]
- Triky, S.; Kissinger, M. An Integrated Analysis of Dairy Farming: Direct and Indirect Environmental Interactions in Challenging Bio-Physical Conditions. Agriculture 2022, 12(4), 480. [CrossRef]
- Hamelin, L.; Wenzel, H. Methodological aspects of environmental assessment of livestock production by LCA (Life Cycle Assessment). IX International Livestock Environment Symposium (ILES IX), American Society of Agricultural and Biological Engineers, 2012, ILES12-0945, . [CrossRef]
- Díaz de Otálora, X.; del Prado, A.; Dragoni, F.; Estellés, F.; Amon, B. Evaluating Three-Pillar Sustainability Modelling Approaches for Dairy Cattle Production Systems. Sustainability 2021, 13, 6332. [CrossRef]
- Ferronato, G.; Tobanelli, N.; Bani, P.; Cattaneo, L. Carbon Footprint Assessment of Dairy Milk and Grana Padano PDO Cheese and Improvement Scenarios: A Case Study in the Po Valley (Italy). Animals 2025, 15(6), 811. [CrossRef]
- Neethirajan, S. Innovative Strategies for Sustainable Dairy Farming in Canada amidst Climate Change. Sustainability 2023, 16(1), 265. [CrossRef]
- Berton, M.; Bittante, G.; Sturaro, E.; Gallo, L. Thirty years of global warming potential evolution for the Italian dairy cow sector measured by two different metrics. Italian Journal of Animal Science 2024, 23(1), 1002. [CrossRef]
| Size Groups, ‘ 000 EUR/Indicators | Average per Farm | 4–< 15 | 15–< 25 | 25–< 50 | 50–< 100 | 100–< 500 | ≥ 500 |
| Number of farms | 270 | 7 | 42 | 63 | 61 | 84 | 13 |
| Farms represented | 5 347 | 350 | 2 085 | 1 387 | 817 | 601 | 107 |
| Dairy farms as % of the total in the dairy farm sector | 5% | 2% | 2% | 5% | 7% | 14% | 12% |
| Dairy farms as % total farms | 24% | 5% | 39% | 34% | 32% | 23% | 18% |
| Average gross income per farm, EUR | 33 824 | -14 | 8 439 | 10 761 | 25 973 | 84 605 | 713 972 |
| Average farm net income per farm, EUR | 9 586 | -939 | 6 959 | 7 664 | 16 627 | 23 877 | -13 976 |
| Average farm net income to gross income | 28% | n.a. | 83% | 71% | 64% | 28% | -2% |
| Average number of dairy cows | 20 | 3 | 5 | 9 | 18 | 54 | 344 |
| Average number of cattle <1 year | 10 | 1 | 3 | 3 | 7 | 25 | 225 |
| Average number of cattle from 1 but less than 2 years | 7 | 1 | 1 | 2 | 5 | 18 | 153 |
| Average number of other cattle | 3 | 0 | 1 | 2 | 3 | 12 | 26 |
| Milk yield per cow, tons per year | 7.37 | 5.34 | 5.10 | 5.21 | 5.66 | 6.60 | 10.24 |
| Indicators/Number of Cows per Herd | 1-50 | 51-200 | ≥201 | Total/Overall average |
| Total number of herds (365-day average) | 2404 | 311 | 79 | 2794 |
| Average milk yield kg/per cow/per year | 6990 | 8826 | 11220 | 7314 |
| Total number of cows | 32776 | 30021 | 38308 | 101105 |
| Total milk output, tons per year | 231060 | 273248 | 441392 | 945701 |
| % of total milk | 24% | 29% | 47% | 100% |
| Average fat content, % | 4.17 | 4.07 | 3.90 | 4.15 |
| Minimum fat content, % | 2.27 | 2.74 | 3.04 | 2.27 |
| Maximum fat content, % | 6.04 | 5.63 | 4.74 | 6.04 |
| Average protein content, % | 3.34 | 3.38 | 3.43 | 3.34 |
| Minimum protein content, % | 2.84 | 2.90 | 3.13 | 2.84 |
| Maximum protein content, % | 4.49 | 3.85 | 3.70 | 4.49 |
| Fat and protein corrected milk FPCM (kg/per cow/per year) (FAO formula) | 5748 | 7164 | 8875 | 5999 |
| Fat and protein corrected milk FPCM (kg/per cow/per year) (IDF formula) | 7150 | 8962 | 11185 | 7470 |
| Deviation IDF/FAO formula | 124% | 125% | 126% | 125% |
| Impact Category/INDICATORS | Unit | Life Cycle Impact Assessment of | Deviation | ||||
| Small Farms (1-50 Cows) | Medium Farms (51-200 cows) | large Farms (≥201 cows) | medium–small farms | large–medium farms | large -small farms | ||
| Water consumption, Aquatic ecosystems | species.yr* | 5.44*10−12 | 8.00*10−12 | 9.01*10−12 | 47% | 13% | 66% |
| Water consumption, Terrestrial ecosystems | species. yr | 4.06*10−8 | 5.81*10−8 | 6.31*10−8 | 43% | 9% | 55% |
| Water consumption, Human health | DALY* | 5.38*10−06 | 7.60*10−6 | 8.35*10−6 | 41% | 10% | 55% |
| Fossil resource scarcity | USD2013 | 41.47 | 54.28877 | 57.91831 | 31% | 7% | 40% |
| Mineral resource scarcity | USD2013 | 0.86 | 1.085099 | 1.137804 | 26% | 5% | 32% |
| Land use | species.yr | 1.05*10−05 | 1.66*10−5 | 1.73*10−5 | 58% | 4% | 65% |
| Human non-carcinogenic toxicity | DALY | 0.000206 | 0.00021 | 0.000211 | 2% | 0% | 2% |
| Human carcinogenic toxicity | DALY | 0.000511 | 0.000634 | 0.0007 | 24% | 10% | 37% |
| Marine ecotoxicity | species.yr | 5.48*10−9 | 6.59*10−9 | 7.19*10−9 | 20% | 9% | 31% |
| Freshwater ecotoxicity | species.yr | 2.80*10−8 | 3.38*10−8 | 3.69*10−8 | 20% | 9% | 32% |
| Terrestrial ecotoxicity | species.yr | 2.08*10−8 | 2.71*10−8 | 2.84*10−8 | 30% | 5% | 36% |
| Marine eutrophication | species.yr | 3.71*10−9 | 6.58*10−9 | 6.99*10−9 | 77% | 6% | 88% |
| Freshwater eutrophication | species.yr | 2.36*10−7 | 3.03*10−7 | 3.37*10−7 | 28% | 11% | 43% |
| Terrestrial acidification | species.yr | 1.92*10−6 | 2.08*10−6 | 1.92*10−6 | 8% | -8% | 0% |
| Ozone formation, Terrestrial ecosystems | species.yr | 2.60*10−7 | 3.45*10−7 | 3.58*10−7 | 33% | 4% | 38% |
| Fine particulate matter formation | DALY | 0.001186 | 0.001397 | 0.001415 | 18% | 1% | 19% |
| Ozone formation, Human health | DALY | 1.78*10−6 | 2.35*10−6 | 2.44*10−6 | 32% | 4% | 38% |
| Ionizing radiation | DALY | 3.21*10−7 | 3.69*10−7 | 4.21*10−7 | 15% | 14% | 31% |
| Stratospheric ozone depletion | DALY | 3.55*10−6 | 5.24*10−6 | 5.27*10−6 | 48% | 1% | 48% |
| Global warming, Freshwater ecosystems | species.yr | 5.31*10−11 | 7.51*10−11 | 8.10*10−11 | 41% | 8% | 52% |
| Global warming, Terrestrial ecosystems | species.yr | 1.95*10−6 | 2.75*10−6 | 2.96*10−6 | 41% | 8% | 52% |
| Global warming, Human health | DALY | 0.000645 | 0.000911 | 0.000983 | 41% | 8% | 52% |
| Indicators and Sources |
Small Farms (1-50 Cows) |
Medium Farms (51-200 Cows) |
Large Farms (≥201 Cows) |
|||
| Pt | % of total | Pt | % of total | Pt | % of total | |
| Total of all processes | 47 | 100% | 59.2 | 100% | 62.1 | 100% |
| Alfaalfa-grass mixture, Swiss integrated | 3.10 | 7% | 2.88 | 5% | 1.38 | 2% |
| Alfaalfa-silage, Global | 4.59 | 10% | 9.98 | 17% | 11.4 | 18% |
| Barley grain, feed, Swiss production | 3.38 | 7% | 4.44 | 8% | 4.15 | 7% |
| Fodder beet, Swiss | 0.11 | 0% | 0 | 0% | 0 | 0% |
| Grass silage, Swiss | 5.34 | 11% | 6.04 | 10% | 4.99 | 8% |
| Hay, Swiss | 6.90 | 15% | 2.99 | 5% | 2.65 | 4% |
| Maize chop, Rest of the world | 0.20 | 0% | 0.433 | 1% | 0.494 | 1% |
| Maize silage Swiss | 0.14 | 0% | 0.356 | 1% | 0.453 | 1% |
| Milking process | 16.20 | 34% | 20.2 | 34% | 25 | 40% |
| Mineral supplement, Global | 0.54 | 1% | 0.641 | 1% | 0.624 | 1% |
| Molasses, Global | 0.08 | 0% | 0.0984 | 0% | 0.125 | 0% |
| Rape meal, Global | 1.06 | 2% | 2.6 | 4% | 2.09 | 3% |
| Soybean feed, Global | 1.70 | 4% | 3.69 | 6% | 4.2 | 7% |
| Straw, Europe | 0.12 | 0% | 0.0999 | 0% | 0.0777 | 0% |
| Total mixed ratio | 0.00 | 0% | 0.00151 | 0% | 0.00172 | 0% |
| Wheat grain, feed, Swiss | 3.63 | 8% | 4.77 | 8% | 4.45 | 7% |
| Indicators/Number of Dairy Cows | Unit | 1-50 | 51- 200 | ≥201 | Total |
| Total number of cows in the size group | cows | 32776 | 30021 | 38308 | 101105 |
| CH4 (fermentation) | kg | 4627999 | 4238979 | 5409090 | 14276068 |
| CH4 (manure) | kg | 566373 | 518765 | 661962 | 1747100 |
| CH4 to CO2eq | kg | 145442421 | 133216830 | 169989452 | 448648702 |
| N2ODmm (direct manure) | kg | 10807 | 9899 | 12631 | 33337 |
| N2O to CO2eq | kg | 2766626 | 2534069 | 3233563 | 8534258 |
| Total CO2eq, by size groups | tons | 148209 | 135751 | 173223 | 457183 |
| FPCM kg per cow, per year (FAO formula) | kg | 5748 | 7164 | 8875 | 5999 |
| CO2eq per 1kg of milk | kg | 0.79 | 0.63 | 0.51 | 0.75 |
| Indicators/Number of Dairy Cows | Unit | 1-50 | 51-200 | ≥201 |
| Total number of cows | cows | 32776 | 30021 | 38308 |
| Carbon dioxide, biogenic, per cow | kg | 35.6 | 53.2 | 50.3 |
| Carbon dioxide, fossil, per cow | kg | 414 | 541 | 596 |
| Carbon dioxide in the air, per cow | kg | 2610 | 3290 | 3000 |
| Carbon dioxide, land transformation, per cow | kg | 49.7 | 107 | 122 |
| Carbon dioxide non-fossil resource correction, per cow | kg | -96.9 | -114 | -155 |
| Total carbon dioxide, per cow | kg | 3012 | 3877 | 3613 |
| Total carbon dioxide per whole group | tons | 987350 | 1163978 | 1384183 |
| Nitrogen oxide N2O per cow | kg | 1.84 | 2.44 | 2.53 |
| Nitrogen oxide per group | tons | 60 | 73 | 97 |
| Nitrogen in CO2eq | tons | 15982 | 19412 | 25684 |
| Methane biogenic, per cow | kg | 0.0482 | 0.0608 | 0.0733 |
| Methane fossil, per cow | kg | 1.27 | 1.66 | 1.8 |
| Methane total per cow | kg | 1.3182 | 1.7208 | 1.8733 |
| Methane per group | tons | 43 | 52 | 72 |
| Menthane in CO2eq | tons | 1210 | 1446 | 2009 |
| Total CO2 in CO2eq, p.a. | tons | 1004542 | 1184836 | 1411876 |
| Deviation from the previous group | % | N/A | 18% | 19% |
| FPCM kg per cow, per year (FAO formula) | kg | 5748 | 7164 | 8875 |
| CO2eq per 1kg of FPCM milk | kg | 5.33 | 5.51 | 4.15 |
Disclaimer/Publisher’s Note: The statements, opinions and data contained in all publications are solely those of the individual author(s) and contributor(s) and not of MDPI and/or the editor(s). MDPI and/or the editor(s) disclaim responsibility for any injury to people or property resulting from any ideas, methods, instructions or products referred to in the content. |
© 2025 by the authors. Licensee MDPI, Basel, Switzerland. This article is an open access article distributed under the terms and conditions of the Creative Commons Attribution (CC BY) license (http://creativecommons.org/licenses/by/4.0/).


