
Submitted:
09 September 2025
Posted:
10 September 2025
You are already at the latest version
Abstract
The aquatic environments of main stems in large rivers and their connected lakes exhibit significant disparities under human activities. Fish, the top predators in aquatic ecosystems, have a crucial function in preserving the structure and functioning of these ecosystems. This study investigated fish communities in 192 samples from lakes and rivers across the Yangtze River (YR) basin utilizing environmental DNA (eDNA) technology. Additionally, the environmental variable impact on fish biodiversity in these two aquatic environments was uncovered. Herein, we identified approximately 230 fish species in this basin, with lakes and rivers comprising both prevalent and habitat-specific species. Water quality played different roles in affecting fish diversity in these two water systems. The geography traits, including Longitude, Latitude, and Altitude, as well as the water traits conductivity (CD), demonstrated the variance in fish diversity and community composition in both Rivers and Lakes. The human activity factors, including PMI, CHLA, and SiO2, elucidated much more variance in fish diversity and community composition in Lakes. These findings suggested that human activity factors exert a more significant influence on fish diversity within Lakes compared to Rivers. Our outcomes document the complex impacts of water quality on fish diversity in different aquatic habitats of the YR basin and emphasize the distinctive considerations required to protect aquatic biodiversity in this basin.
Keywords:
Environmental DNA
; Yangtze River basin
; Fish Biodiversity
; Water Quality
1. Introduction
Large rivers, integral to economic development, are deemed especially susceptible to anthropogenic influences (Allen & Pavelsky, 2018). The continual rise in water pollution precipitates cascading impacts on the entirety of river ecosystems, causing alterations to other abiotic factors (Reid et al., 2019). The swift pace of urbanization compounds these challenges, as anthropogenic pressures, notably water pollution driven by the expansion of population density, inflict substantial harm upon aquatic ecosystems (Su et al., 2021). Water pollution is an important factor affecting aquatic biodiversity in large rivers, while the spatio-temporal pattern of fish is directly affected by the hydrodynamics and physical and chemical characteristics of the water body (Dai et al., 2020). Large rivers are typically connected to numerous adjacent lakes; the ecological dynamics of rivers and lakes exhibit distinctions, such as the water flow, oxygen levels, and nutrient concentrations, as well as the development of algae and plankton (Ashworth & Lewin, 2012). It has been reported that significant differences existed in the relationship between water quality pollution and fish communities in a megacity in the lentic and lotic systems (Zhang et al., 2022a). However, it remains unclear whether such differences persist in large rivers and their connected lakes.
The Yangtze River (YR), a major river in China, spans 6363 km and passes across Tibet, Yunnan, Sichuan, and seven other provinces. The YR displayed a significant freshwater habitat variety, including alpine streams in the Himalayan mountain range, lowland rivers, floodplains, large lakes, and estuarine habitats (Ye, et al., 2014). The YR basin (a complex riverine-lacustrine network) is particularly abundant in fish fauna, exhibiting high species richness and endemism. As a result, it is a worldwide important region for conserving fish biodiversity (Dudgeon 2000; Park et al. 2003). The conservation of fish species in the YR has consistently been a subject of considerable interest, with several studies exploring the fish community structure and diversity in the YR primary stem (Dong et al., 2019; Liu et al., 2018; Yan et al., 2022), tributaries (Hu et al., 2019), and lakes (Liu et al., 2019). These studies have examined factors affecting fish community composition in various areas of the YR, including revealing that geographical distance significantly influenced spatial rotation in Poyang Lake, a YR tributary, historically and currently (Liu et al., 2019). Hu et al. found that altitude, velocity, and dissolved oxygen (DO) were the substantial impacting factors on the fish community in the upper reaches (UP) of the YR (Jinsha River) (Hu et al., 2019; Yan et al., 2022).
Environmental DNA (eDNA) is a mixture of DNA from organisms shed into the environment found in various media (Bohmann et al., 2014). Ficetola et al. (2008) first used eDNA to detect the American bullfrog (Rana catesbeiana) in ponds. The eDNA metabarcoding is a biodiversity assessment tool involving extracting total DNA, PCR amplification, and sequencing (Wang, et al., 2021). This technique, developed for environmental microbiology, is now widely used for aquatic biodiversity research (Hanfling, et al., 2016; Valentini et al., 2016). It is a non-invasive method that avoids the costs and ecological disturbance of traditional sampling methods, promising to enhance the assessment of aquatic biodiversity (Hering et al., 2018; Laramie et al., 2015).
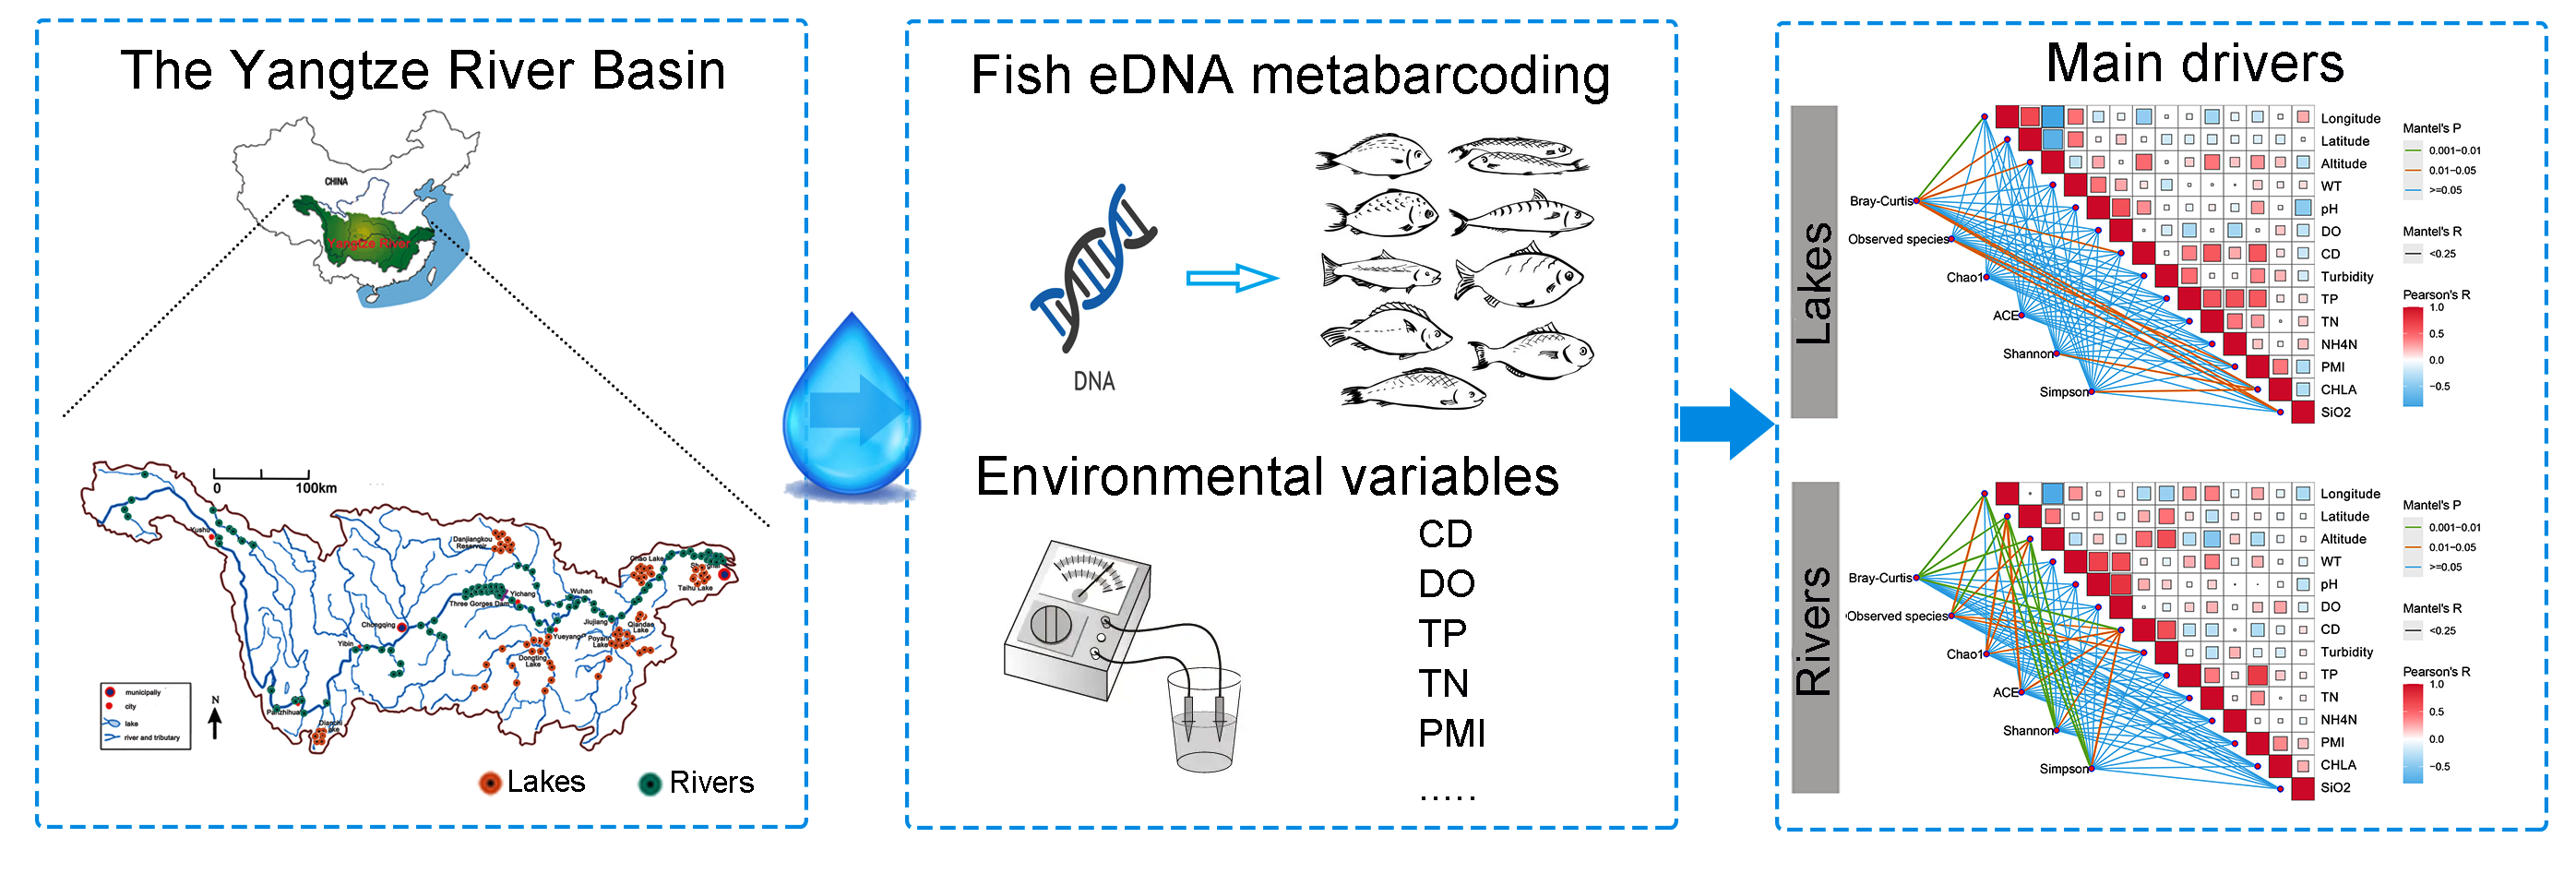
Recently, researchers have also commenced to use eDNA technology to investigate the relation between environmental variables and fish diversity in the YR. For example, Zhang et al. (2019) studied the seasonal variation characteristics of the fish community structure in the YR estuary and adjacent waters; Qian et al. (2023) investigated the fish community structure alongside diversity in the YR basin and found significant environmental factors impacting α-diversity, such as chlorophyll-a, chemical oxygen demand, DO, total nitrogen (TN), and elevation. Our aim was to deploy eDNA metabarcoding to explore the fish community compositions in rivers and lakes through the entire YR basin and analyze the response of fish diversity to pollution environmental variables in these two water forms. We examined the fish eDNA composition in 192 samples across the entire YR basin (98 from rivers and 94 from lakes) and investigated the fish community variation across different water bodies (rivers vs. lakes). Afterward, we tested the relations between fish diversity and the water quality indices (WQIs) and landscape variables. Various forms of fish diversity (qualitative and quantitative) were evaluated to explore the influences of human activity on different dimensions of biodiversity.
2. Materials and Methods
2.1. Sample Collection
Water sampling was conducted in YR Basin (24.49°N to 35.31°N, 92.07°E to 121.95°E) from May to September 2021(Figure 1). Table S1 presents the location of these samples. Sampling was conducted at 98 sites distributed in the main river and its tributaries (Type: Rivers in Table S1) and 94 sites distributed in lakes (Type: Lakes in Table S1), including Dianchi, Danjingkou reservoir, and Doting, Poyang, and Chao Lakes, and Tai lake. From each site, 3 L of water samples, a prevalently fish eDNA sample volume (Shu, et al., 2020), as gathered at three sites approximately equidistant from one another along the bank of the water body. At each sampling location, 2 L of water sample was gathered from approximately 10 cm beneath the surface and approximately 0.5 m from the shore employing a 2 L sterile PET bottle. All samples were conserved on ice and filtered within 8 h. Each water sample was allocated into two subsamples: one for eDNA extraction and diversity analyses and the other for environmental variable analysis. For diversity analysis, Filtration was conducted in a clean laboratory prepared for eDNA processing. Each 1 L of water sample and a filtration blank [double-distilled H2O (ddH2O)] were filtered through a pore size of 0.45 µm mixed cellulose esters membrane filter (Merck Millipore Ltd., Carrigtwohill, Ireland). Filtration units and laboratory tools were subjected to a 10% bleach solution (hypochlorous acid final concentration = 1%) and washed twice with ddH2O between samples to eliminate possible eDNA pollution. Filters were preserved at –20 °C for DNA extraction. For analysis of environmental variables, each 1 L of water sample was filtered through a 0.22 μm polycarbonate membrane. The pH, salinity, conductivity (CD), DO, total phosphorus (TP), TN, NH4N, permanganate index (PMI), chlorophylla (CHLA), SiO2, and water temperature were assessed per the previous studies (Zhang et al.,2022b).
2.2. eDNA Processing and Sequencing
The DNA extraction was performed based on Zhang’s method (Zhang, et al., 2022a). For the PCR, we employed the fish metabarcoding primer set MiFish Universal Teleost Primers (Miya et al., 2015), the most frequently employed primer pair so far (Xiong, et al., 2022). The PCRs were conducted in triplicate for eDNA extracts and negative controls (filtration, extraction, and no-template PCR blanks), each with uniquely labeled primers to identify each PCR amplicon (Zhang, et al., 2020). Herein, we carried out each PCR in a total volume of 25 µl, which contained 5 µl of 10-fold diluted eDNA extract (to lower the PCR inhibitors), 0.2 µM of the forward and reverse primers, bovine serum albumin (0.4 µg/L), and 1 × Premix Ex Taq (Takara, Kusatsu, Japan). The PCR program comprised a first denaturation step at 95 °C for 10 min; after that, 45 cycles of 95 °C, 65 °C, and 72 °C for 30, 30, and 60 s, respectively; and a last elongation step at 72 °C for 10 min. Utilizing the agarose gels, the PCR products were evaluated, gathered in equal volumes, and purified via the EasyPure PCR Purification Kit (TransGen Biotech, Beijing, China) for next-generation sequencing. Library construction as well as sequencing were conducted via the Beijing Genomics Institute sequencing service in Wuhan, China, employing 2 × 150 bp paired-end sequencing on a HiSeq 2500 System (Illumina Inc., San Diego, CA, USA).
2.3. The Construction of a Local Barcoding Database
A local barcoding database with fishes discovered in the YR Basin was built to improve the metabarcoding taxonomic assignment (Gold, et al., 2021). The YR freshwater fish checklist was first built according to Shen’s paper (Shen, et al., 2019) and then refined dependent on available online catalogs FISHBASE (Froese & D, 2014) and Eschmeyer catalog of fishes (Eschmeyer & Fricke, 2014) (Table S2). From the list, we acquired 1011 full mitochondria sequences from the Mitofish database and 116 other 12S sequences (> 600bp) from the NCBI and Bold databases. In total, we included 1127 12S sequences from 327 species in 195 genera. Then, targeted barcoding databases were created from these sequences by running in silico PCR with the MiFish Universal Teleost Primers. The genetic distance analyses were performed among these barcoding sequences using MUSCLE and the Kimura 2-parameter (K2P) (Kimura, 1980) pairwise genetic distances were calculated utilizing R package Ape 4.1 (Paradis, Claude, & Strimmer, 2004). Maximum intraspecific distances (Dist.Max.Intra) and nearest neighbor genetic distances (Dist.Near.Neigh) were calculated dependent on the pairwise K2P genetic distance matrice employing the R package Spider 1.5 (Brown, Collins, & Boyer, 2012).
2.4. Bioinformatics Processing
The raw sequencing data were converted to fastq format via bcl2fastq v2.20 (https://support.illumina.com/sequencing/sequencing). Other bioinformatic steps were conducted employing cutadapt v2.3 (Martin, 2011) and the data2 package v1.8 (Callahan et al., 2016). Reads were then dereplicated and denoised with the core data2 denoising algorithm. Denoised reads were paired by requesting a minimum overlap of 20 bp and allowing a maximum of five mismatches utilizing the function mergePairs in data2 to produce the amplicon sequence variants (ASVs). Chimeras were then de novo eliminated from this ASV table via the consensus approach from the removeBimeraDenovo function. The ASVs were annotated using BLAST against the local barcoding database constructed in this experiment. A taxon was allocated to each ASV based on the Max score and complete sequence coverage. The Max score combined the incentives for matched nucleotides and penalties for mismatches and gaps and often provided the same arrangement as the conventional expected value. The ASVs with a maximum similarity of < 99% (at 100% query coverage) and with read counts < 2 of the total reads were eliminated. The ASVs annotated with the same species in the reference database were treated as a tax unit, and the numbers of ASVs in each tax unit per sample were counted together to form a tax unit table (Table S3). This tax-unit table was used to analyze the sample saturation, taxonomic α- and β-diversity.
2.5. Statistical Analyses
To assess the sampling depth impacts on the uncovered fish species number, we conducted saturation curves for all 16 groups defined with the sampling region (such as the whole basin, Rivers, Lakes, UR, middle-lower reaches (MLR), Hanjing tributaries, Danjiangkou Reservoir, Dongting Lake, Honghu, Poyang Lake, Chishui River, Sanxia tributaries, Changjiang Yuan Qu, Dianchi, Chao Lake, Tai Lake) in the R package vegan. Fish community data were determined through sampling locations via both incidence- and abundance-based metrics. The incidence-based matrix was presented as the presence or absence of each tax unit, and the abundance-based matrix was presented as the PR (such as the percentage of reads for each tax unit). The taxonomic diversity (including α-diversity) and the classical biodiversity measurement, utilizing Chao1, ACE, Shannon, and Simpson diversity, were evaluated with the R package. Additionally, we measured the β-diversity dependent on Bray-Curtis coefficients employing the vegdist commands in vegan with the R package. Wilcoxon rank sum tests were used to analyze statistical variations in the α- and β-diversity metrics between two different groups. The PERMANOVA was performed via the Bray-Curtis coefficients as the response variables, employing the adonis function in vegan with 999 permutations to examine the variations in fish community compositions between two different groups.
Redundancy analysis (RDA) was carried out dependent on the Bray-Curtis distance to define the relation between community composition as well as regional variables. The hierarchical partitioning model was conducted to determine the relative significance of purely spatial and environmental components via the “rdacca.hp” package (Lai et al., 2022). The Mantel test was employed to assess the regional variances and water trait influences on fish diversity.
3. Results
3.1. Fish Diversity in the YR Basin
After bioinformatics filtering and standardization of sequencing depth across samples, typically, 176 taxonomic units were identified from 194 sampling locations, including 27 combined tax units (comprising 85 fish species), representing nearly 234 fish species. Of these tax units, 157 (comprising 213 fish species) were reported to be common in the YR basin, with dominant families including Cyprinidae, Cobitidae, Bagridae, Amblycipitidae, Balitoridae, and Tetraodontidae. In addition, 18 tax units (comprising 21 fish species), which were reported to be endangered or vulnerable, were detected, such as Ochetobius elongates and Myxocyprinus asiaticus. Some invasive species, such as Gambusia affinis, Rhynchocypris lagowskii, and Sinibrama macrops, were determined. The dominant species in the basin, in addition to some small-sized fish such as gobies (Unit18 and Rhinogobius cliffordpopei), Butis koilomatodon, and Chaeturichthys stigmatias, also include economically important fish such as Cyprinus carpio, Hypophthalmichthys nobilis, Carassius auratus, Ctenopharyngodon idella, and Unit01 (Culter and Megalobrama) and Unit02 (Siniperca).
A total of 176 tax units were recovered from 194 sites, including 27 combined tax units, representing nearly 234 fish species. Among these tax units, 158 were discovered in both Rivers and Lakes, while 9 tax units were only found in Rivers and 9 were only found in Lakes. The species found only in Rivers were mostly from the order Perciformes, while the species found only in Lakes were mainly minnows from the family Cyprinidae in the order Cypriniformes, especially gobies and fishes in the genus Acheilognathus (Figure 2).
3.2. Comparison of Lake and River Fish Communities
By comparing four α-diversity indices, comprising Chao1, ACE, Shannon, and Simpson, we found no significant variances (p > 0.05) in these indices between the Lakes and Rivers groups. The results of the Permanova test using the Bray-Curtis distance indicated significant variations in fish community diversity between Lakes and Rivers (p = 0.0002, F = 2.864). Additionally, there were significant variations in fish community diversity between the UR and MLR of the YR (p = 0.0025, F = 2.253).
Lefse analysis revealed 18 biomarkers for the Rivers group, including 6 tax units from Cyprinidae, 5 from Cobitidae, 3 from Gobiidae, 1 from Cottidae, 1 from Eleotridae, 1 from Sisoridae, and 1 from Tetraodontidae. Those fish were mainly small-sized fish, including Triplophysa (Unit30 & Unit15), Homatula, Beaufortia (Unit23), Jinshaia (Unit22), and other genera in the family Cobitidae, as well as the carnivorous Takifugu genus and the rare fish Trachidermus fasciatus. The Lakes group had 14 biomarkers, including 7 tax units from Cyprinidae, 2 from Channidae, 1 from Cobitidae, 1 from Gobiidae, 1 from Salangidae, 1 from Clupeidae, and 1 from Pleuronectidae. These biomarkers were mainly composed of economically important and common fish species, with only one species in the family Cobitidae, Cobitis macrostigma, two carnivorous Channa species, Channa maculata and Channa argus, and the larger Culter oxycephaloides. Pollution-tolerant species such as Carassius auratus and Channa argus were also identified as biomarkers for the Lakes (Figure 3).
3.3. Lake and River Fish Diversity Response to Environmental Variables
Generalized linear models (GLMs) were employed to detect the relative contribution of environmental variables to regional α-diversity. All fish α-diversity indexes were best predicted through models including inorganic nitrogen throughout the whole area. Random forest analysis revealed that not all environmental variables in the models participated in the fish diversity to the same degree (Figure 4). For example, the geography traits and CD were the most critical variables for predicting diversity in Rivers. The crucial variables for predicting Shannon and Chao1 in Lakes were CHLA and turbidity, respectively. These results indicated that human activity factors played a more important role in shaping fish diversity in Lakes than in Rivers.
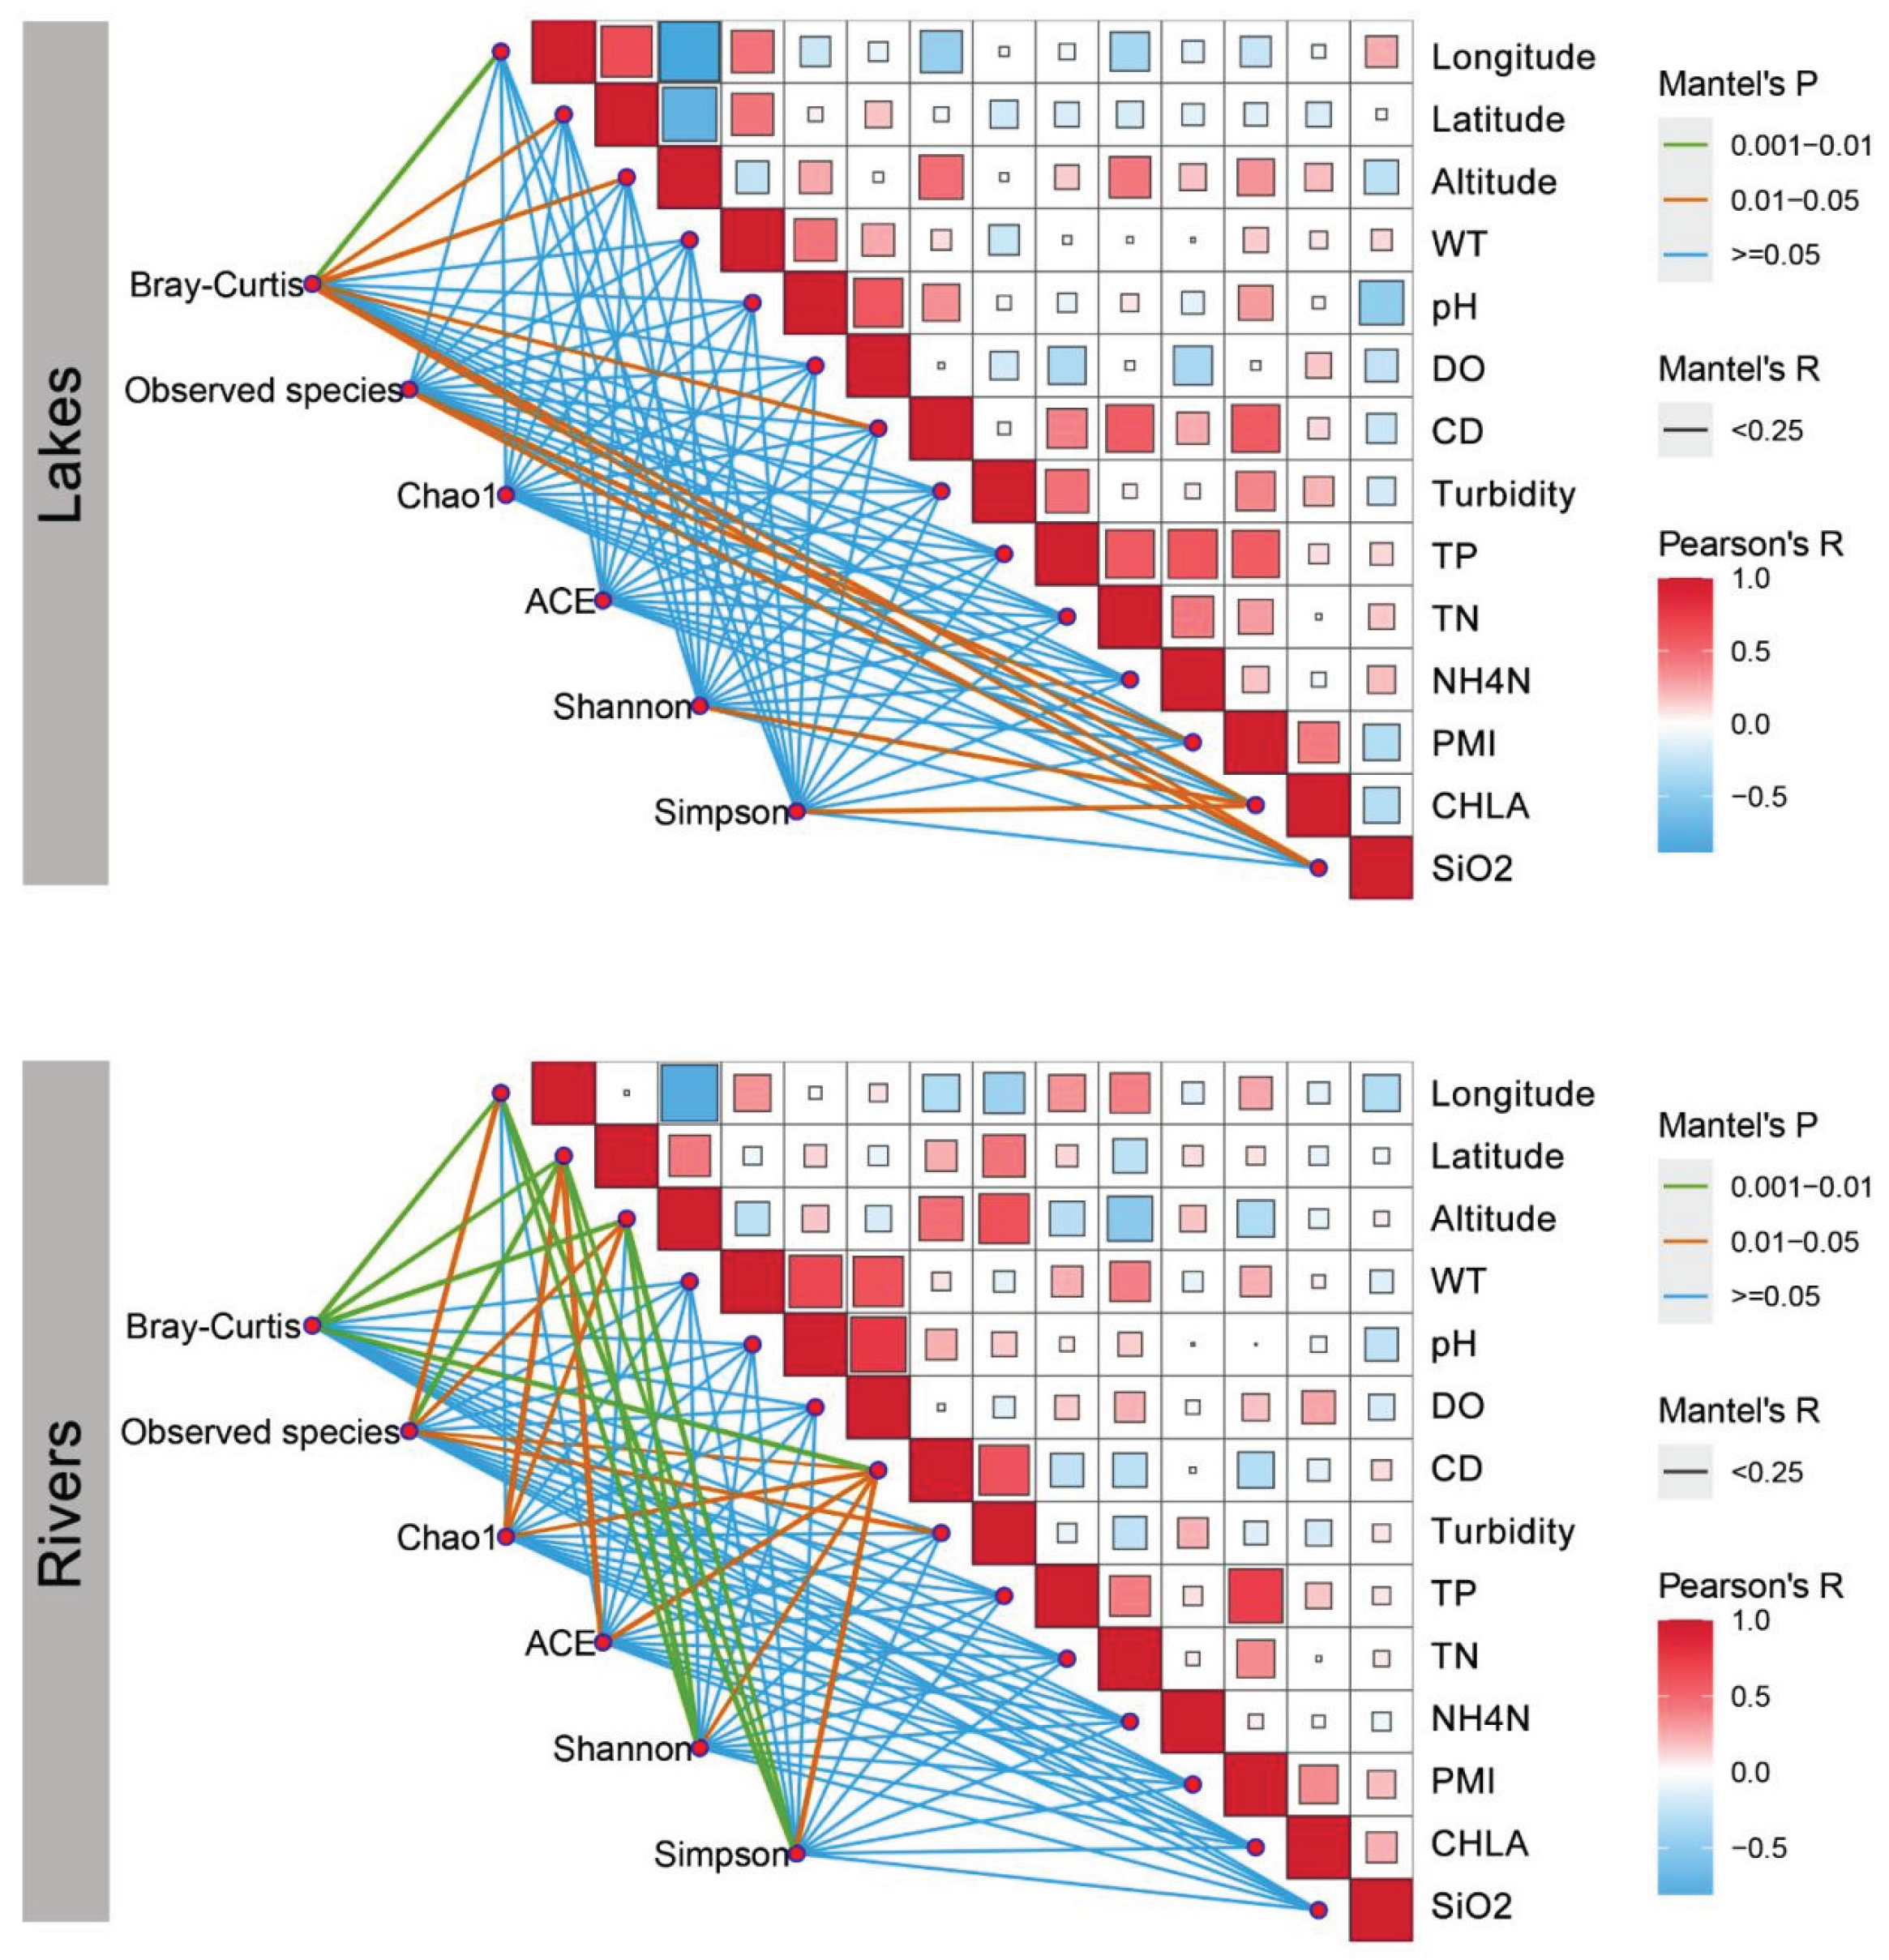
The RDA was carried out (Figure 5) to examine the environmental alongside geographic variables in shaping the regional fish community composition. The findings uncovered that pure environmental factor was the prerequisite link to the fish community variation in both two groups. Meanwhile, the correlation between environmental factors and fish diversity in both areas was uncovered by the Mantel test (Figure 6). The significance of environmental factors shaping regional fish diversity and community variance altered significantly between the two areas. The outcomes elucidated the geography traits, including Longitude, Latitude, and Altitude, as well as the water traits CD demonstrated the variance in fish diversity and community composition in both Rivers and Lakes. The results also revealed that human activity factors, including PMI, CHLA, and SiO2, manifested the variance in fish diversity and community composition in Lakes. Accordingly, the findings suggest that human activity factors exert a more significant influence on fish diversity within Lakes compared to Rivers.
4. Discussion
Compared to the traditional morphological identification of fishes, the eDNA technology is an effective and efficient method for collecting information on water systems and monitoring their ecological environment (Li, et al., 2019; Pawlowski, et al., 2020). Since Pont et al. (2018) emphasized the detection potential for local fish aggregations utilizing eDNA metabarcoding compared with long-term electrofishing surveys’ results in Rhône River, the application of this technology in large river ecosystems is developing rapidly ( Czegledi, et al., 2021; Goutte, et al., 2020; McColl-Gausden, et al., 2021; McDevitt, e al., 2019; Pont, et al., 2021). Herein, we examined 192 eDNA samples from the entire YR Basin, 98 sites distributed in the main river and 94 sites distributed in lakes, to analyze the spatial distribution of eDNA in the whole basin. Approximately 234 fish species were detected, including 157 taxonomic units (accounting for 213 fish species) of common fish and 18 taxonomic units (accounting for 21 fish species) of rare and endangered fish. Although this result did not present all the fish species (about 450) as traditionally reported in this region (Yang et al., 2022), considering factors such as sampling scales, survey time, and economic expenditure, this outcome still demonstrated the eDNA efficiency in investigating the diversity of fish species in large rivers.
Although we all know significant environmental disparities exhibited in the main stems of large rivers and their connected lakes under human activities, assessing whether fish responses to human activities differ between these two ecological environments is challenging. Here we attempted to use eDNA metabarcoding to investigate fish distribution in both ecological environments and conducted correlation statistics to study the effects of environmental factors on fish distribution. Our study showed that the geography traits, including Longitude, Latitude, and Altitude, revealed the variance in fish diversity and community composition in both Rivers and Lakes. This finding has also been discovered in other traditional research (Liu et al., 2019; Dong et al., 2019). We also found that CD played an important role in shaping fish communities in both water types. The CD can directly reflect the concentration of ions dissolved in water, including salts and minerals. It is well known that CD can affect the growth rate and immune function of fish, which is crucial for their physiological health. Now, we have found that CD is significantly related to the diversity and community structure of fish in the mainstream of large rivers and related lakes. This conclusion further enriches the importance of CD in the health of aquatic environments and has important guiding significance for human activities and water environmental protection. In our study, the human activity factors, including PMI, CHLA, and SiO2, seemed to exert a more significant influence on fish diversity within Lakes compared to Rivers. Due to their characteristics of closed or semi-closed water bodies, Lakes have slower water and material cycles compared to rivers. This slowness makes lake ecosystems more sensitive to human activities. In our research, factors related to human activities are also more closely related to fish diversity. This conclusion suggests that we should pay more attention to the impacts of over-exploitation, pollution discharge, and eutrophication in the conservation of lake fish diversity.
The experimental results showed significant differences in the β diversity of eDNA between the river and lake groups. The species Butis koilomatodon was reported to be the most significant biomarker of the River group. This species is a small warm-water near-shore bottom fish that mostly inhabits estuaries, mangrove wetlands, or sandy bottoms along the coast (https://fishdb.sinica.edu.tw/chi/home.php). Several species of the Cobitidae family, which preferred to live in flowing water, were reported to be the biomarkers of the River group, such as species from Triplophysa, Homatula, Metahomaloptera, Beaufortia, Lepturichthys, and Jinshaia. Three Gobiidae fish were reported to be the biomarkers of the River group such as Acanthogobius hasta, Rhinogobius leavelli, and Tridentiger trigonocephalus. All three species were riverine fish, as A. hasta and T. trigonocephalus were reported to prefer to live in coastal, harbor, and estuarine areas, while sometimes live in the lower reaches of rivers or streams, while R. leavelli was reported to prefer to live in the rivers and streams (https://www.fishbase.org). In addition, the estuarine fish Takifugu, the riverine fish Zacco platypus, Spinibarbus sinensis, Anabarilius brevianalis, Euchiloglanis kishinouyei, Pareuchiloglanis anteanalis, Metahomaloptera omeiensis, Beaufortia szechuanensisthe, the migratory fish Coreius heterodon, and the streamlined fish Acrossocheilus paradoxus were also the biomarkers of the River group. Otherwise, a rare fish species Trachidermus fasciatus was also the biomarker of the River group. It was reported that the small migratory T. fasciatus, usually distributed along coastal and adjacent freshwater waters, such as estuaries, has hardly been found in the Lakes of the YR (Pan et al., 2010). At present, in the mainstream of the YR, it was only found in the Yangtze Estuary in 2017 reported by the East China Sea Fisheries Research Institute (http://www.ecsf.ac.cn/info/1020/3218.htm). In summary, most of the biomarkers of Rivers found in our research preferred lotic water environments.
On the other side, most of the biomarkers in the Lakes are lacustrine fish, which prefer lentic water environments, including the pollution-tolerant species Carassius auratus and Channa argus, Sinibrama macrops inhabiting in slow flowing water, as well as the Lake endemic fish Neosalanx taihuensis (Fu, 2003). Finally, our result indicated that the composition of eDNA in the rivers of the YR is different from that in its connected lakes, and this difference is probably caused by the differences in living fish communities in different water bodies.
5. Conclusions
In this study, we examined the fish eDNA composition of 192 samples across the entire YR basin. We investigated how environmental variables affect fish biodiversity in Rivers and Lakes. The result showed that water quality played different roles in affecting fish diversity in these two water systems. The geography traits, including Longitude, Latitude, and Altitude, as well as the water traits CD, manifested the variance in fish diversity and community composition in both Rivers and Lakes. The human activity factor, including PMI, CHLA, and SiO2, explained much more variance in fish diversity and community composition in Lakes. These findings suggested that human activity factors exert a more significant influence on fish diversity within Lakes compared to Rivers. Our outcomes document the complex impacts of water quality on fish diversity in different aquatic habitats of the YR basin and reveal the distinctive considerations required to maintain aquatic biodiversity in this basin.
Supplementary Materials
The following supporting information can be downloaded at the website of this paper posted on Preprints.org.
Author Contributions
F.X. and C.F. conducted experiments, data analysis, and manuscript writing. Z.J., S.H., H.B., W.C., R.L., and H.Z. contributed to collecting specimens. Y.H., Y.W., and S.H. visualized and designed the experiments. All the authors approved the manuscript.
Funding
This research was funded by the National Natural Science Foundation of China (32200367), the National Key Research and Development Program of China (2022YFF0608200), and the Foundation for Outstanding Young and Middle-aged Innovative Research Team in Higher Education Institutions of HuBei Province of China (T2023040).
Ethics Approval and Consent to Participate
The experiments were conducted in adherence to the Ethics
Committee of the Institute of Hydrobiology at the Chinese Academy of Sciences (CAS). The policies were
enacted based on the Chinese Association for Laboratory Animal Sciences and the Institutional Animal Care and
Use Committee (IACUC) protocols.
Consent for Publication
All authors have given their explicit consent for the publication of this manuscript
in “Water, Air, & Soil Pollution”. The manuscript does not contain any individual person‘s identifiable data,
images, or other materials that require separate consent for publication.
Availability of Data and Material
All data are available in the paper and/or the Supplementary Materials. Raw
sequencing data are available on NCBI’s SRA database BioProject ID: PRJNA957488
(www.ncbi.nlm.nih.gov/bioproject/957488).
Competing Interests
No conflicting interest.
References
- Allen, G.H.; Pavelsky, T.M. Global extent of rivers and streams. Science 2018, 361, 585–588. [Google Scholar] [CrossRef]
- Ashworth, P.J.; Lewin, J. How do big rivers come to be different? Earth-Science Reviews 2012, 114, 84–107. [Google Scholar] [CrossRef]
- Bohmann, K.; Evans, A.; Gilbert, M.T.P.; et al. Environmental DNA for wildlife biology and biodiversity monitoring. Trends in Ecology & Evolution 2014, 29, 358–367. [Google Scholar] [PubMed]
- Brown, S. D. J.; Collins, R. A.; Boyer, S.; et al. Spider: An R package for the analysis of species identity and evolution, with particular reference to DNA barcoding. Molecular Ecology Resources 2012, 12, 562–565. [Google Scholar] [CrossRef]
- Callahan, B.J.; McMurdie, P.J.; Rosen, M.J.; et al. DADA2: High-resolution sample inference from Illumina amplicon data. Nature Methods 2016, 13, 581. [Google Scholar] [CrossRef]
- Czegledi, I.; Saly, P.; Specziar, A.; et al. Congruency between two traditional and eDNA-based sampling methods in characterising taxonomic and trait-based structure of fish communities and community-environment relationships in lentic environment. Ecological Indicators 2021, 129, 25–30. [Google Scholar] [CrossRef]
- Dai, B.; Jiang, Z.; Wang, C; et al. Abundance-based dissimilarity measurements reveal higher heterogeneity of fish communities in the lotic habitats of the Yangtze-Caizi transitional floodplain. Ecological Indicators 2020, 112, 106122. [Google Scholar] [CrossRef]
- Deiner, K.; Fronhofer, E.A.; Machler, E.; et al. Environmental DNA reveals that rivers are conveyer belts of biodiversity information. Nature Communication 2016, 7, 1–9. [Google Scholar] [CrossRef] [PubMed]
- Dong, W.W.; Wang, D.Q.; Tian, H.W.; et al. Genetic structure of two sympatric gudgeon fishes (Xenophysogobio boulengeri and X. nudicorpa) in the upper reaches of Yangtze River Basin. PeerJ 2019, 7, 26–31. [Google Scholar] [CrossRef]
- Dudgeon, D. The ecology of tropical Asian rivers and streamsin relation to biodiversity conservation. Annual Review of Ecology and Systematics 2000, 31, 239–263. [Google Scholar] [CrossRef]
- Eschmeyer, W. N.; Fricke, R. Catalog of fishes electronic version (updated 6 October 2014); San Francisco; California Academy of Sciences, 2014; updated. [Google Scholar]
- Ficetola, G.F.; Miaud, C.; Pompanon, F.; Taberlet, P. Species detection using environmental DNA from water samples. Biology Letters 2008, 4, 423–425. [Google Scholar] [CrossRef]
- Froese, R., & D., (2014). FishBase. World Wide Web electronic publication. P, https://www.fishbase.org.
- Fu, C. Spatial Patterns and Resource Analysis of Fish Diversity in the Yangtze River Basin [D]; Shanghai; Fudan University, 2003. [Google Scholar]
- Gold, Z.; Curd, E.E.; Goodwin, K.D.; et al. Improving metabarcoding taxonomic assignment: A case study of fishes in a large marine ecosystem. Molecular Ecology Resource 2021. [Google Scholar] [CrossRef]
- Goutte, A.; Molbert, N.; Guerin, S.; et al. Monitoring freshwater fish communities in large rivers using environmental DNA metabarcoding and a long-termelectrofishing survey. Journal of Fish Biology 2020, 97, 444–452. [Google Scholar] [CrossRef]
- Hanfling, B.; Handley, L.L.; Read, D.S.; et al. Environmental DNA metabarcoding of lake fish communities reflects long-term data from established survey methods. Molecular Ecology 2016, 25, 3101–3119. [Google Scholar] [CrossRef]
- Hering, D.; Borja, A.; Jones, J.I.; et al. Implementation options for DNA-based identification into ecological status assessment under the European Water Framework Directive. Water Research 2018, 138, 192–205. [Google Scholar] [CrossRef] [PubMed]
- Hu, M.L.; Wang, C.Y.; Liu, Y.Z.; et al. Fish species composition, distribution and community structure in the lower reaches of Ganjiang River, Jiangxi, China. Scientific Reports 2019, 9, 12–16. [Google Scholar] [CrossRef]
- Kimura, M. A simple method for estimating evolutionary rates of base substitutions through comparative studies of nucleotidesequences. Journal of Molecular Evolution 1980, 16, 111–120. [Google Scholar] [CrossRef]
- Lai, J.; Zhou, Y.; Peres-Neto, P.R. Generalizing hierarchical and variation partitioning in multiple regression and canonical analyses using the rdacca.hp R package. Methods in Ecology and Evolution 2022, 13, 782–788. [Google Scholar] [CrossRef]
- Laramie, M.B.; Pilliod, D.S.; Goldberg, C.S. Characterizing the distribution of an endangered salmonid using environmental DNA analysis. Biological Conservation 2015, 183, 29–37. [Google Scholar] [CrossRef]
- Li, J.; Hatton-Ellis, T.W.; Lawson Handley, L.J.; et al. Ground-truthing of a fish-based environmental DNA metabarcoding method for assessing the quality of lakes. Journal of Applied Ecology 2019, 56(5), 1232–1244. [Google Scholar] [CrossRef]
- Liu, M.D.; Wang, D.Q.; Gao, L.; et al. Species diversity of drifting fish eggs in the Yangtze River using molecular identification. PeerJ 2018, 6, 112–130. [Google Scholar] [CrossRef] [PubMed]
- Liu, X.J.; Qin, J.J.; Xu, Y.; et al. Biodiversity pattern of fish assemblages in Poyang Lake basin: threat and conservation. Evolutionary Ecology 2019, 9, 11672–11683. [Google Scholar] [CrossRef]
- Liu, X.; Zeng, H.; Wang, C.; et al. Improved genome assembly of Chinese sucker (Myxocyprinus asiaticus) provides insights into the identification and characterization of pharyngeal teeth related maker genes in Cyprinoidei. Water Biology & Security 2022, 1, 100049. [Google Scholar]
- Martin, M. Cutadapt removes adapter sequences from high-throughput sequencing reads. EMBnet.journal 2011, 17, 10–12. [Google Scholar] [CrossRef]
- McColl-Gausden, E.F.; Weeks, A.R.; Coleman, R.A.; et al. Multispecies models reveal that eDNA metabarcoding is more sensitive than backpack electrofishing for conducting fish surveys in freshwater streams. Molecular Ecology 2021, 30, 3111–3126. [Google Scholar] [CrossRef] [PubMed]
- McDevitt, A.D.; Sales, N.G.; Browett, S.S.; et al. Environmental DNA metabarcoding as an effective and rapid tool for fish monitoring in canals. Journal of Fish Biology 2019, 95, 679–682. [Google Scholar] [CrossRef]
- Miya, M.; Sato, Y.; Fukunaga, T.; et al. MiFish, a set of universal PCR primers for metabarcoding environmental DNA from fishes: detection of more than 230 subtropical marine species. Royal Society Open Science 2015, 2, 201–206. [Google Scholar] [CrossRef]
- Pan, L.; Cai, F.; Ma, Z.; et al. Population characteristics and resource protection of Trachidermus fasciatus in China. Fisheries Science & Technology Information 2010, 37, 211–213. [Google Scholar]
- Paradis, E.; Claude, J.; Strimmer, K. APE: Analyses of phylogenetics and evolution in R language. Bioinformatics 2004, 20, 289–290. [Google Scholar] [CrossRef]
- Park, Y.; Chang, J.; Lek, S.; et al. Conservation strategies for endemic fish species threatened by the ThreeGorges Dam. Conservation Biology 2003, 17, 1748–1758. [Google Scholar] [CrossRef]
- Pawlowski, J.; Apotheloz-Perret-Gentil, L.; Altermatt, F. Environmental DNA: What's behind the term? Clarifying the terminology and recommendations for its future use in biomonitoring. Molecular Ecology 2020, 29, 4258–4264. [Google Scholar] [CrossRef] [PubMed]
- Pont, D.; Valentini, A.; Rocle, M.; et al. The future of fish-based ecological assessment of European rivers: from traditional EU Water Framework Directive compliant methods to eDNA metabarcoding-based approaches. Journal of Fish Biology 2021, 98, 354–366. [Google Scholar] [CrossRef] [PubMed]
- Pont, D.; Rocle, M.; Valentini, A.; et al. Environmental DNA reveals quantitative patterns of fish biodiversity in large rivers despite its downstream transportation. Scientific Reports 2018, 8, 82–86. [Google Scholar] [CrossRef]
- Qian, M.M.; Wang, Z.Y.; Zhou, Q.; et al. Environmental DNA unveiling the fish community structure and diversity features in the Yangtze River basin. Environmental Research 2023, 239, 117198. [Google Scholar] [CrossRef]
- Reid, A.J.; Carlson, A.K.; Creed, I.F.; et al. Emerging threats and persistent conservation challenges for freshwater biodiversity. Biol. Rev. Camb. Philos. Soc. 2019, 94, 849–873. [Google Scholar] [CrossRef]
- Shen, Y.J.; Hubert, N.; Huang, Y.; et al. DNA barcoding the ichthyofauna of the Yangtze River: Insights from the molecular inventory of a mega-diverse temperate fauna. Molecular Ecology Resource 2019, 19, 1278–1291. [Google Scholar] [CrossRef]
- Shu, L.; Ludwig, A.; Peng, Z.G. Standards for Methods Utilizing Environmental DNA for Detection of Fish Species. Genes-Basel 2020, 11, 23–26. [Google Scholar] [CrossRef]
- Su, G.; Logez, M.; Xu, J.; et al. Human impacts on global freshwater fish biodiversity. Science 2021, 371, 835–838. [Google Scholar] [CrossRef] [PubMed]
- Valentini, A.; Taberlet, P.; Miaud, C.; et al. Next-generation monitoring of aquatic biodiversity using environmental DNA metabarcoding. Molecular Ecology 2016, 25, 929–942. [Google Scholar] [CrossRef]
- Wang, S.; Yan, Z.; Hanfling, B.; et al. Methodology of fish eDNA and its applications in ecology and environment. Science of the Total Environment 2021, 755, 142622. [Google Scholar] [CrossRef] [PubMed]
- Xiong, F.; Shu, L.; Zeng, H.; et al. Methodology for fish biodiversity monitoring with environmental DNA metabarcoding: The primers, databases and bioinformatic pipelines. Water Biology & Security 2022, 1, 100007. [Google Scholar]
- Yan, T.M.; He, J.Y.; Yang, D.Y. Fish community structure and biomass particle-size spectrum in the upper reaches of the jinsha river (China). Animals 2022, 12. [Google Scholar] [CrossRef]
- Yang, H.; Shen, L.; He, Y.; et al. (2022) Status of aquatic organisms resources and their environments in Yangtze river system (2017-2021). Journal of Fisheries of China. Available online: https://kns.cnki.net/kcms/detail/31.1283.S.20221009.1234.004.html.
- Ye, S.; Li, Z.; Liu, J.; et al. Distribution, endemism and conservation status of fishes in the Yangtze River basin, China. In Ecosystems Biodiversity; 2011; pp. 41–66. [Google Scholar]
- Ye, S.W.; Li, Z.J.; Zhang, T.L.; et al. Assessing fish distribution and threats to fish biodiversity in the Yangtze River Basin, China. Ichthyological Research 2014, 61, 183–188. [Google Scholar] [CrossRef]
- Zhang, H.; Yoshizawa, S.; Iwasaki, W.; et al. Seasonal fish assemblage structure using environmental DNA in the Yangtze Estuary and its adjacent waters. Frontiers in Marine Science 2019, 6, 515. [Google Scholar] [CrossRef]
- Zhang, S.; Lu, Q.; Wang, Y.; et al. Assessment of fish communities using environmental DNA: Effect of spatial sampling design in lentic systems of different sizes. Molecular Ecology Resource 2020, 20, 242–255. [Google Scholar] [CrossRef]
- Zhang, S.; Zheng, Y.T.; Zhan, A.B.; et al. Environmental DNA captures native and non-native fish community variations across the lentic and lotic systems of a megacity. Science Advances 2022a, 8. [Google Scholar]
- Zhang, Z.; Li, H.; Shen, W.; et al. The large-scale spatial patterns of ecological networks between phytoplankton and zooplankton in coastal marine ecosystems. Science of the Total Environment 2022b, 827, 154285. [Google Scholar] [CrossRef]
Figure 1.
Map of YR Basin of the sampling locations (N = 194), including 76 sites from the upper reaches (UR) (colored with red) and 118 sites from the middle-lower reaches (MLR) (colored with green). The type of sites was marked with the shape of the point, with the circles representing the main river and its tributaries (Rivers) and the triangle representing the lakes and their tributaries (Lakes).
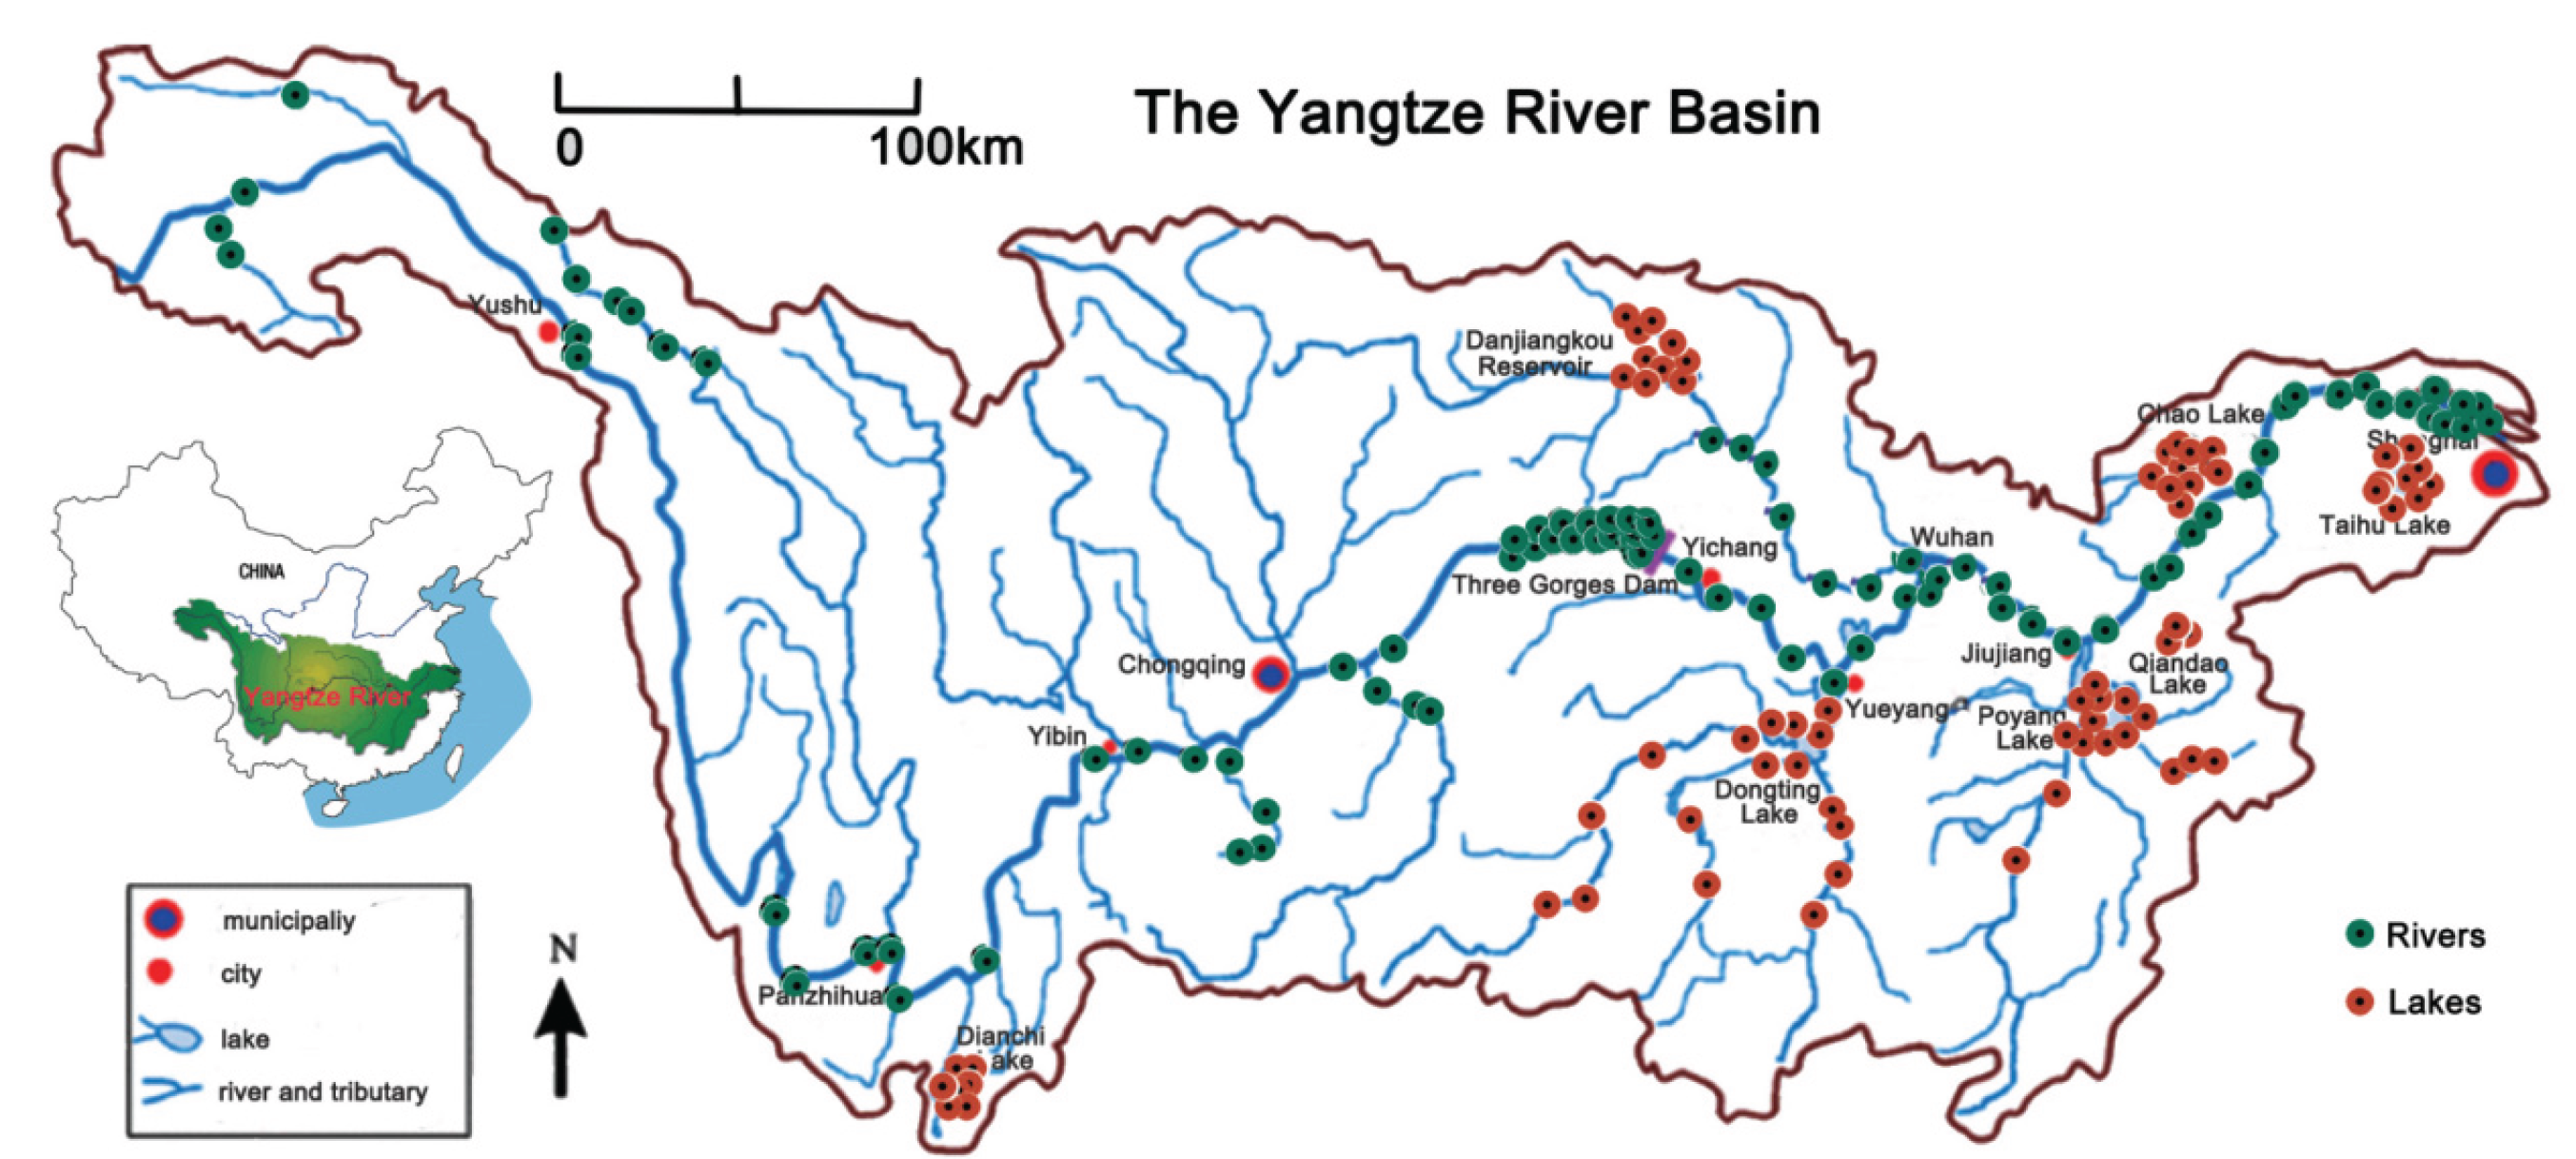
Figure 2.
Bar plots of the number of sampling locations in which each fish tax unit. The red font tax unit represents the rare and endangered fish detected, while the black font tax unit represents common fish.
Figure 2.
Bar plots of the number of sampling locations in which each fish tax unit. The red font tax unit represents the rare and endangered fish detected, while the black font tax unit represents common fish.
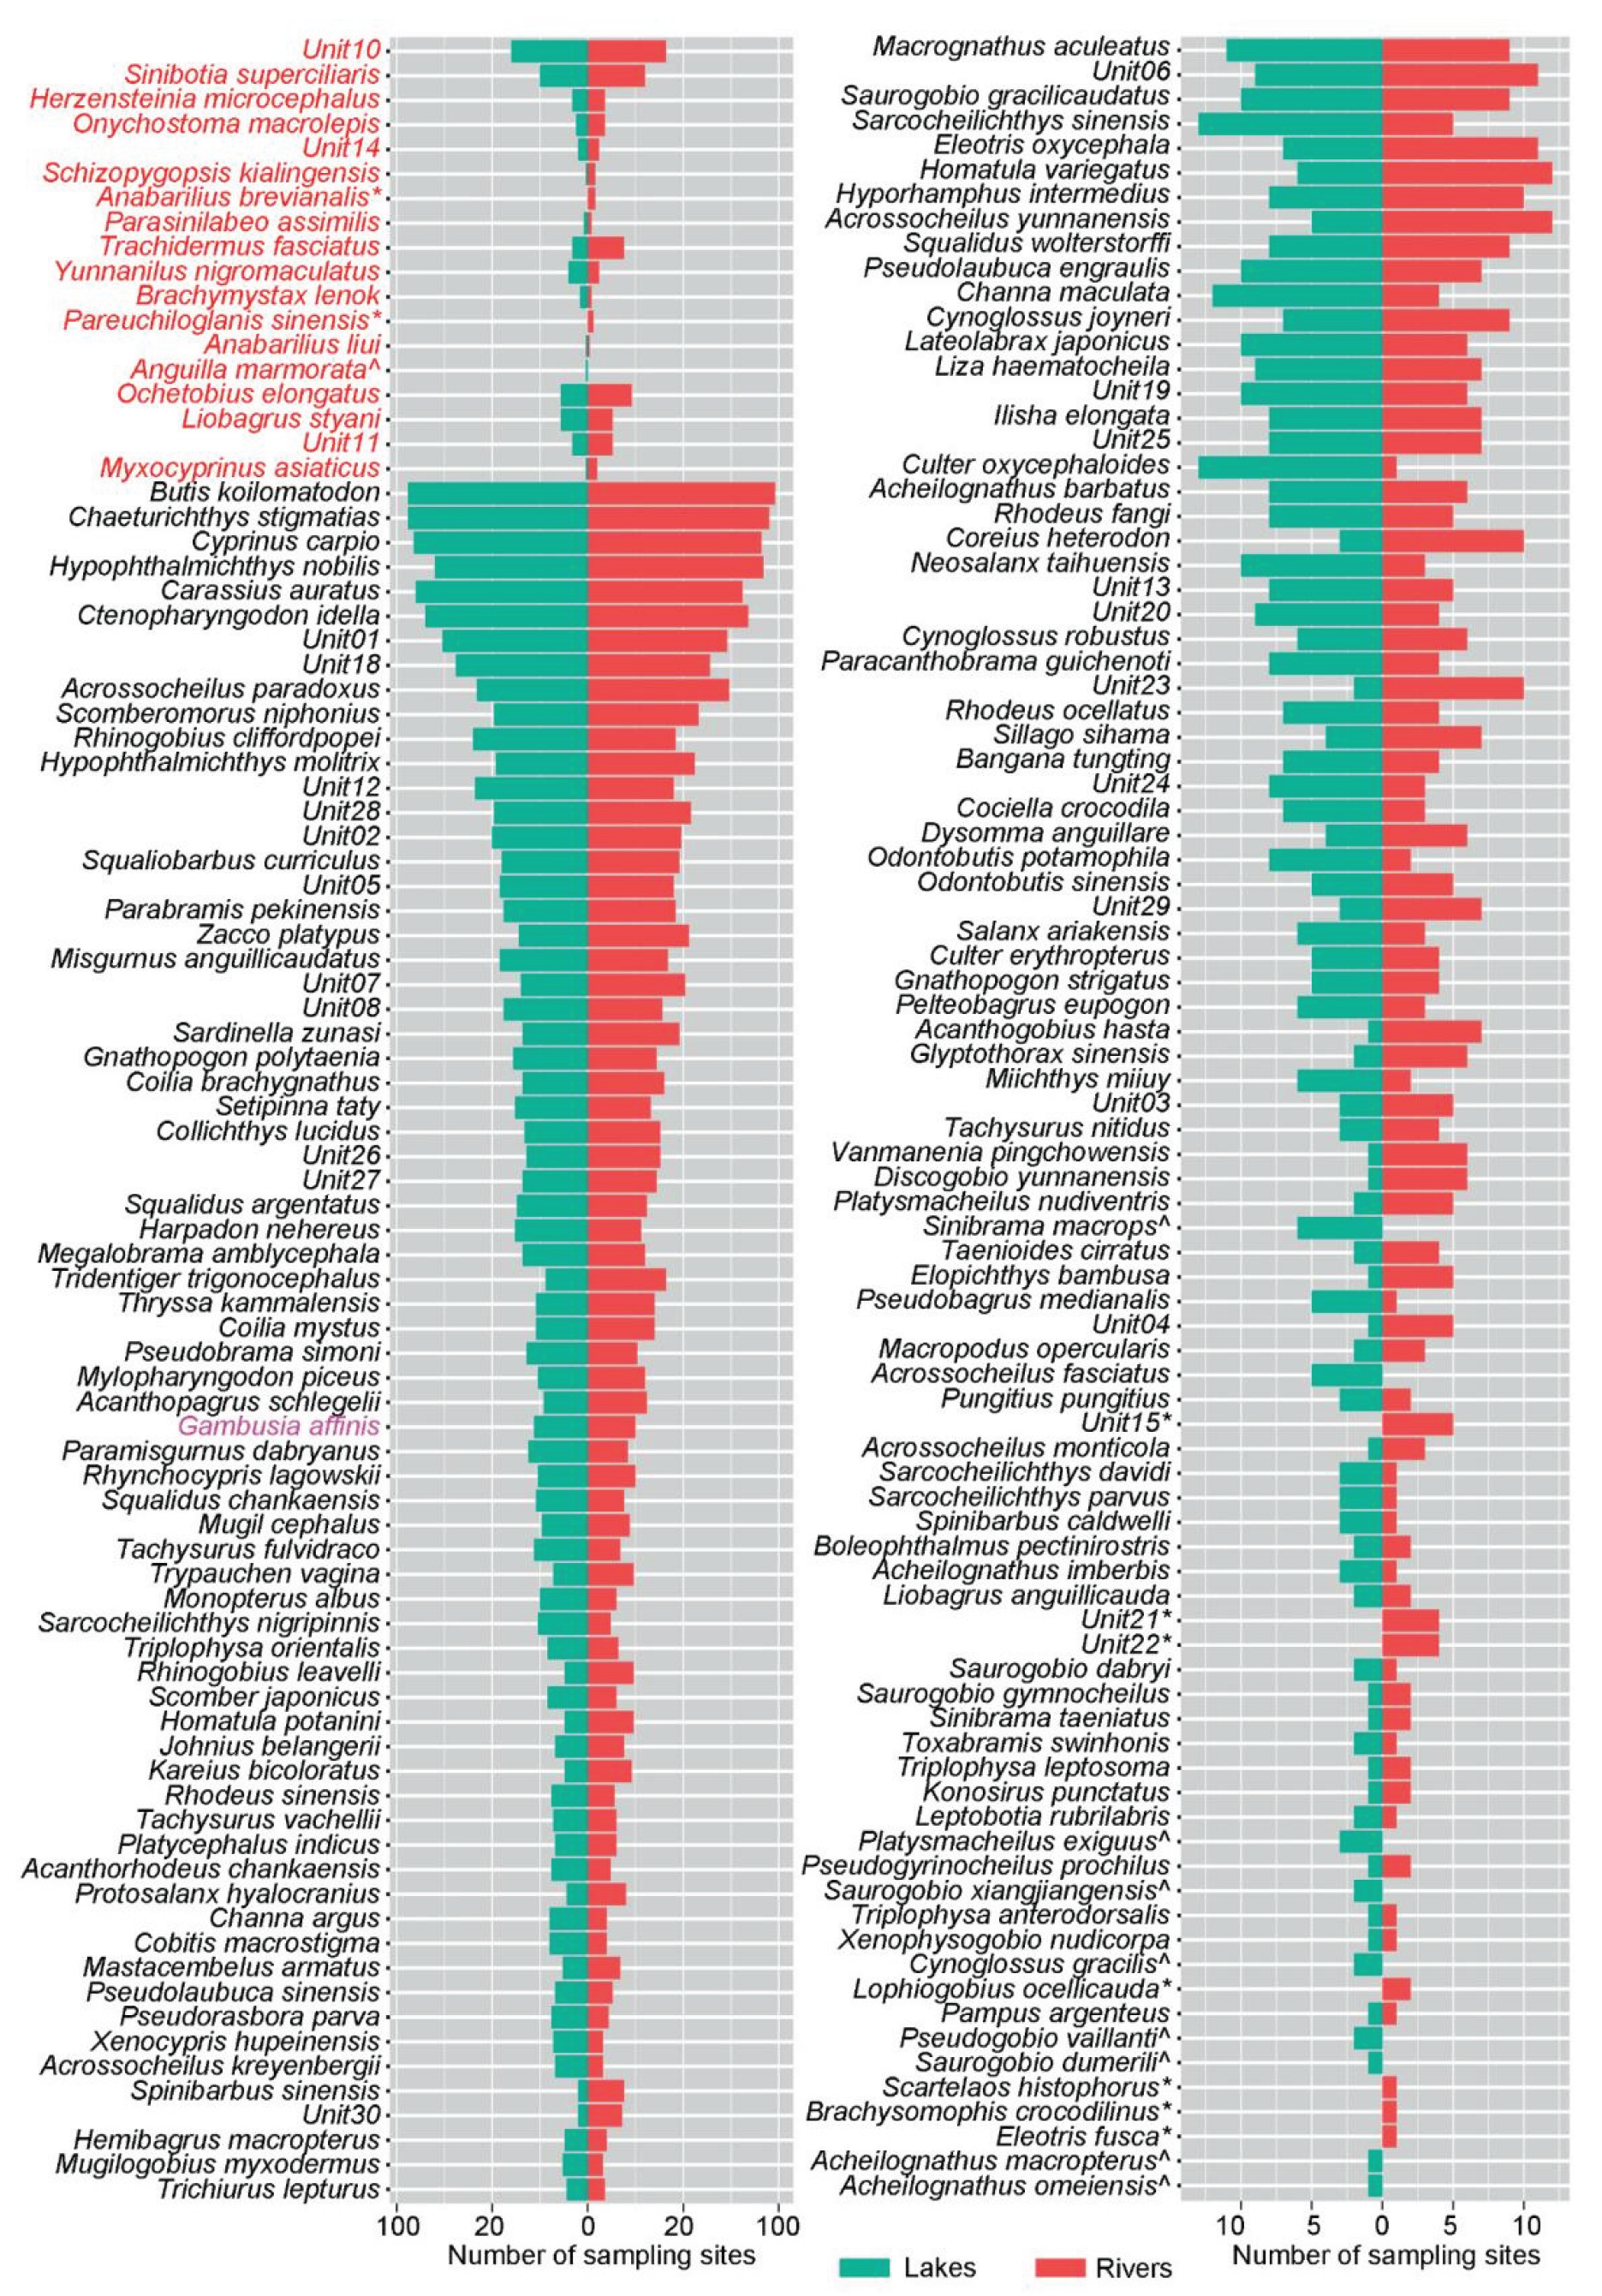
Figure 3.
Linear discriminant analysis effect size (LEfSe) analysis between the Lakes and Rivers group, the identified biomarkers ranked by effect size, and the α-value was < 0.05.
Figure 3.
Linear discriminant analysis effect size (LEfSe) analysis between the Lakes and Rivers group, the identified biomarkers ranked by effect size, and the α-value was < 0.05.
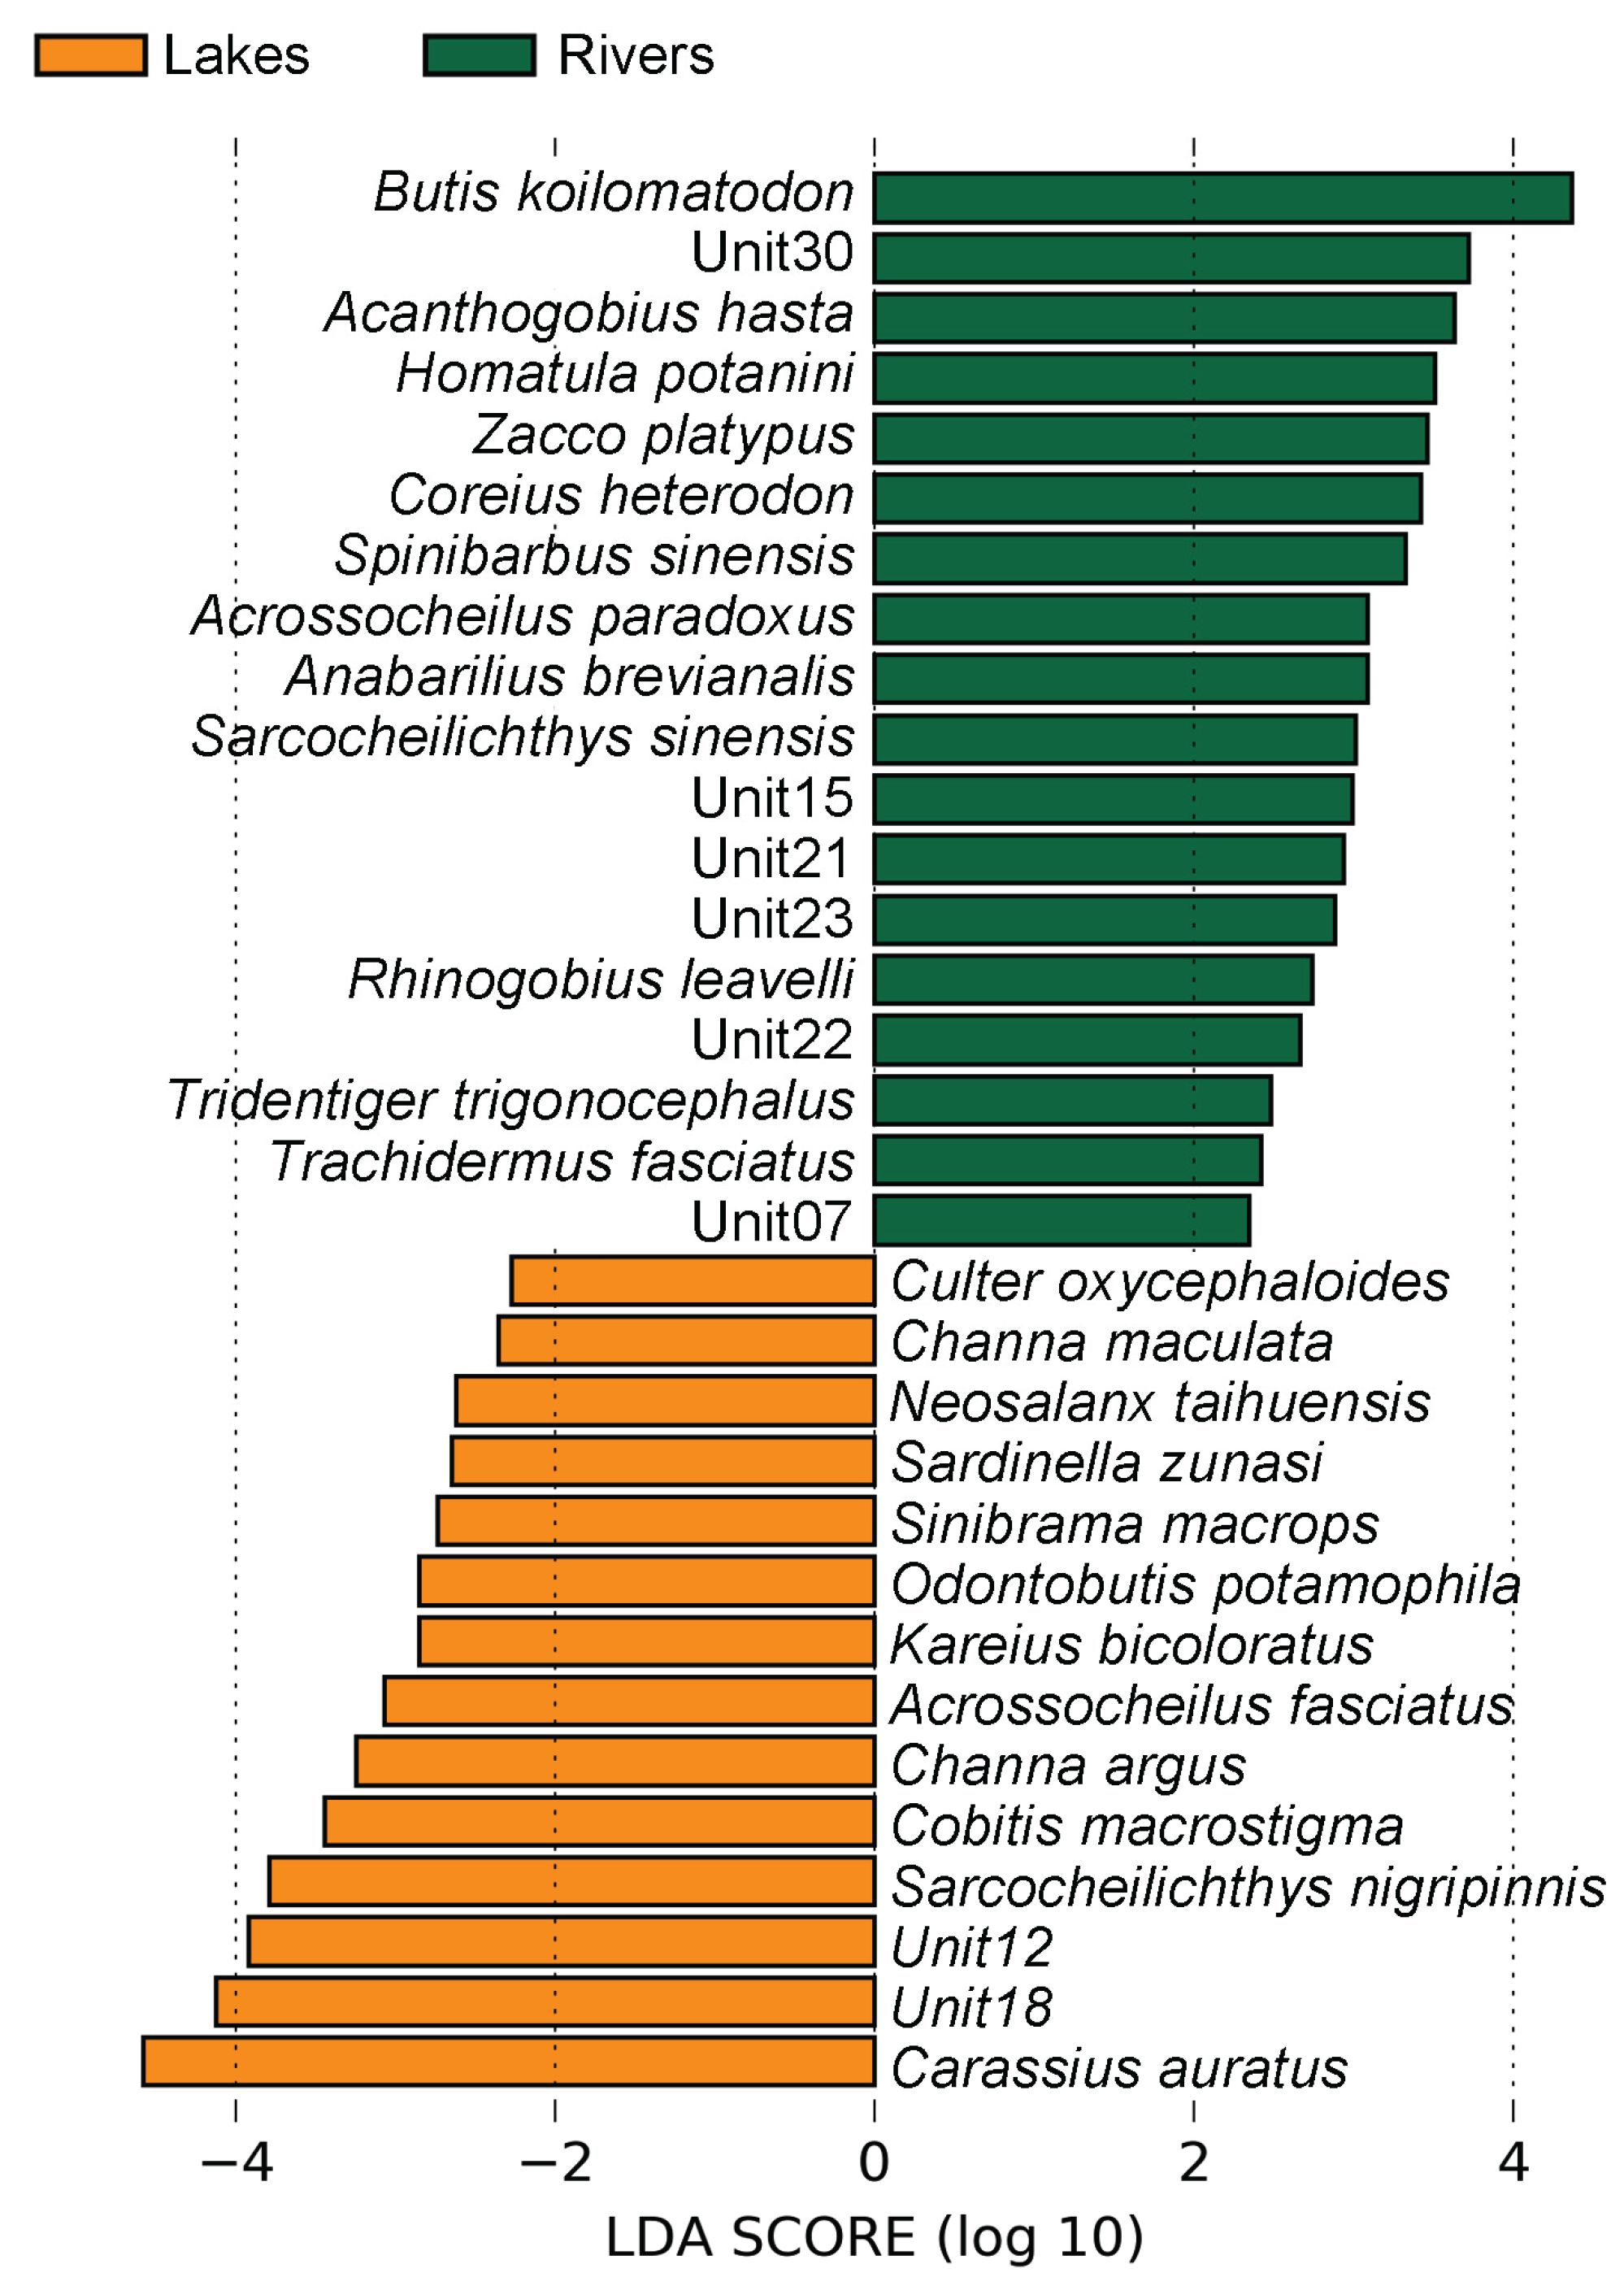
Figure 4.
Possible factors of variance in fish diversity and community composition in YR ecosystems.
Figure 4.
Possible factors of variance in fish diversity and community composition in YR ecosystems.
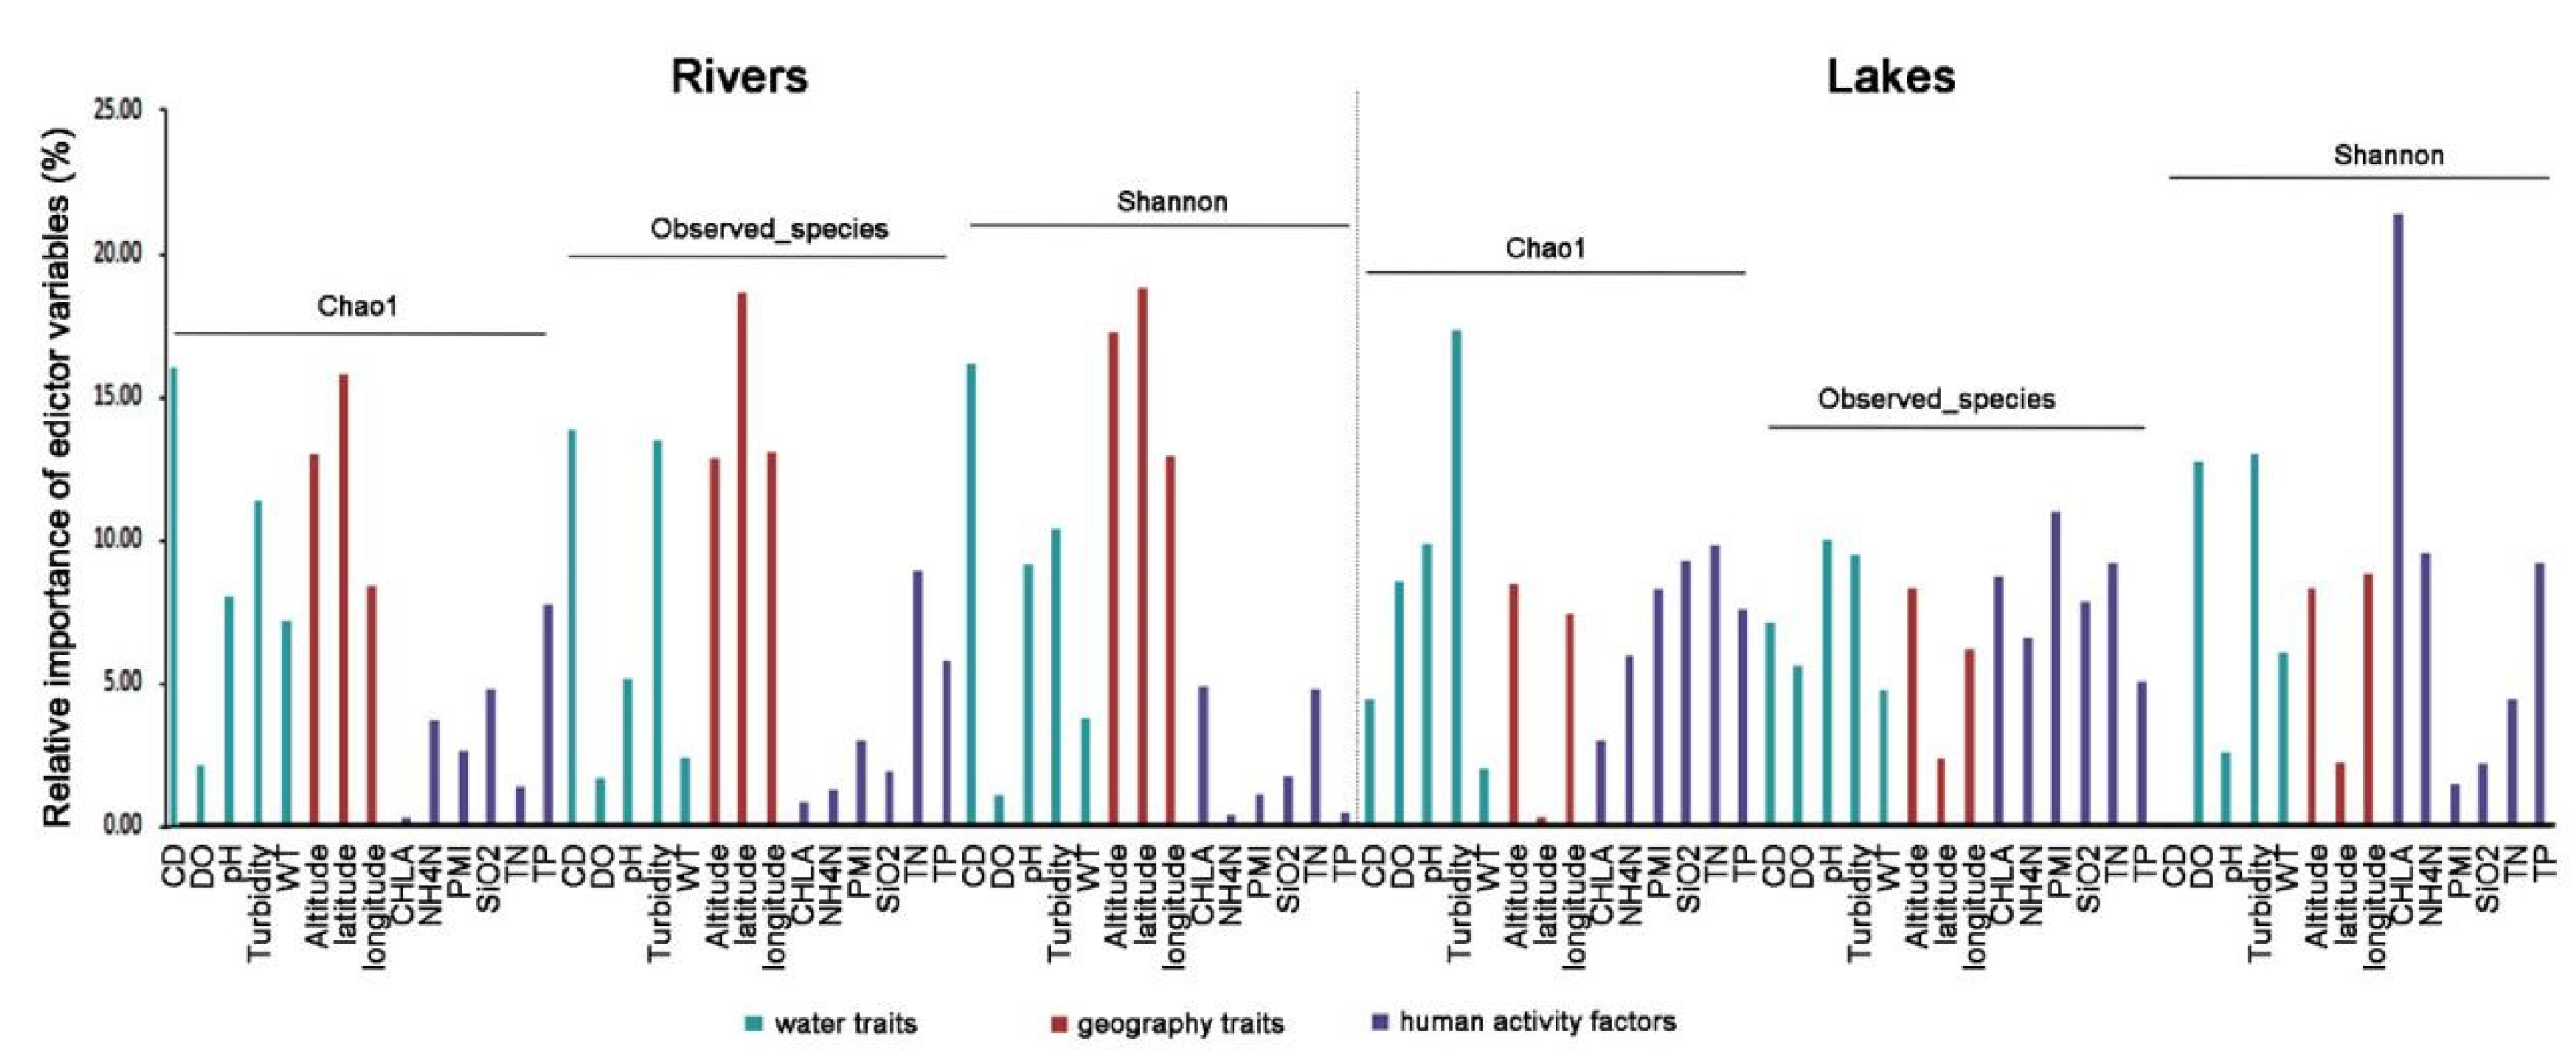
Figure 5.
Redundancy analysis of species-environment factors relations.
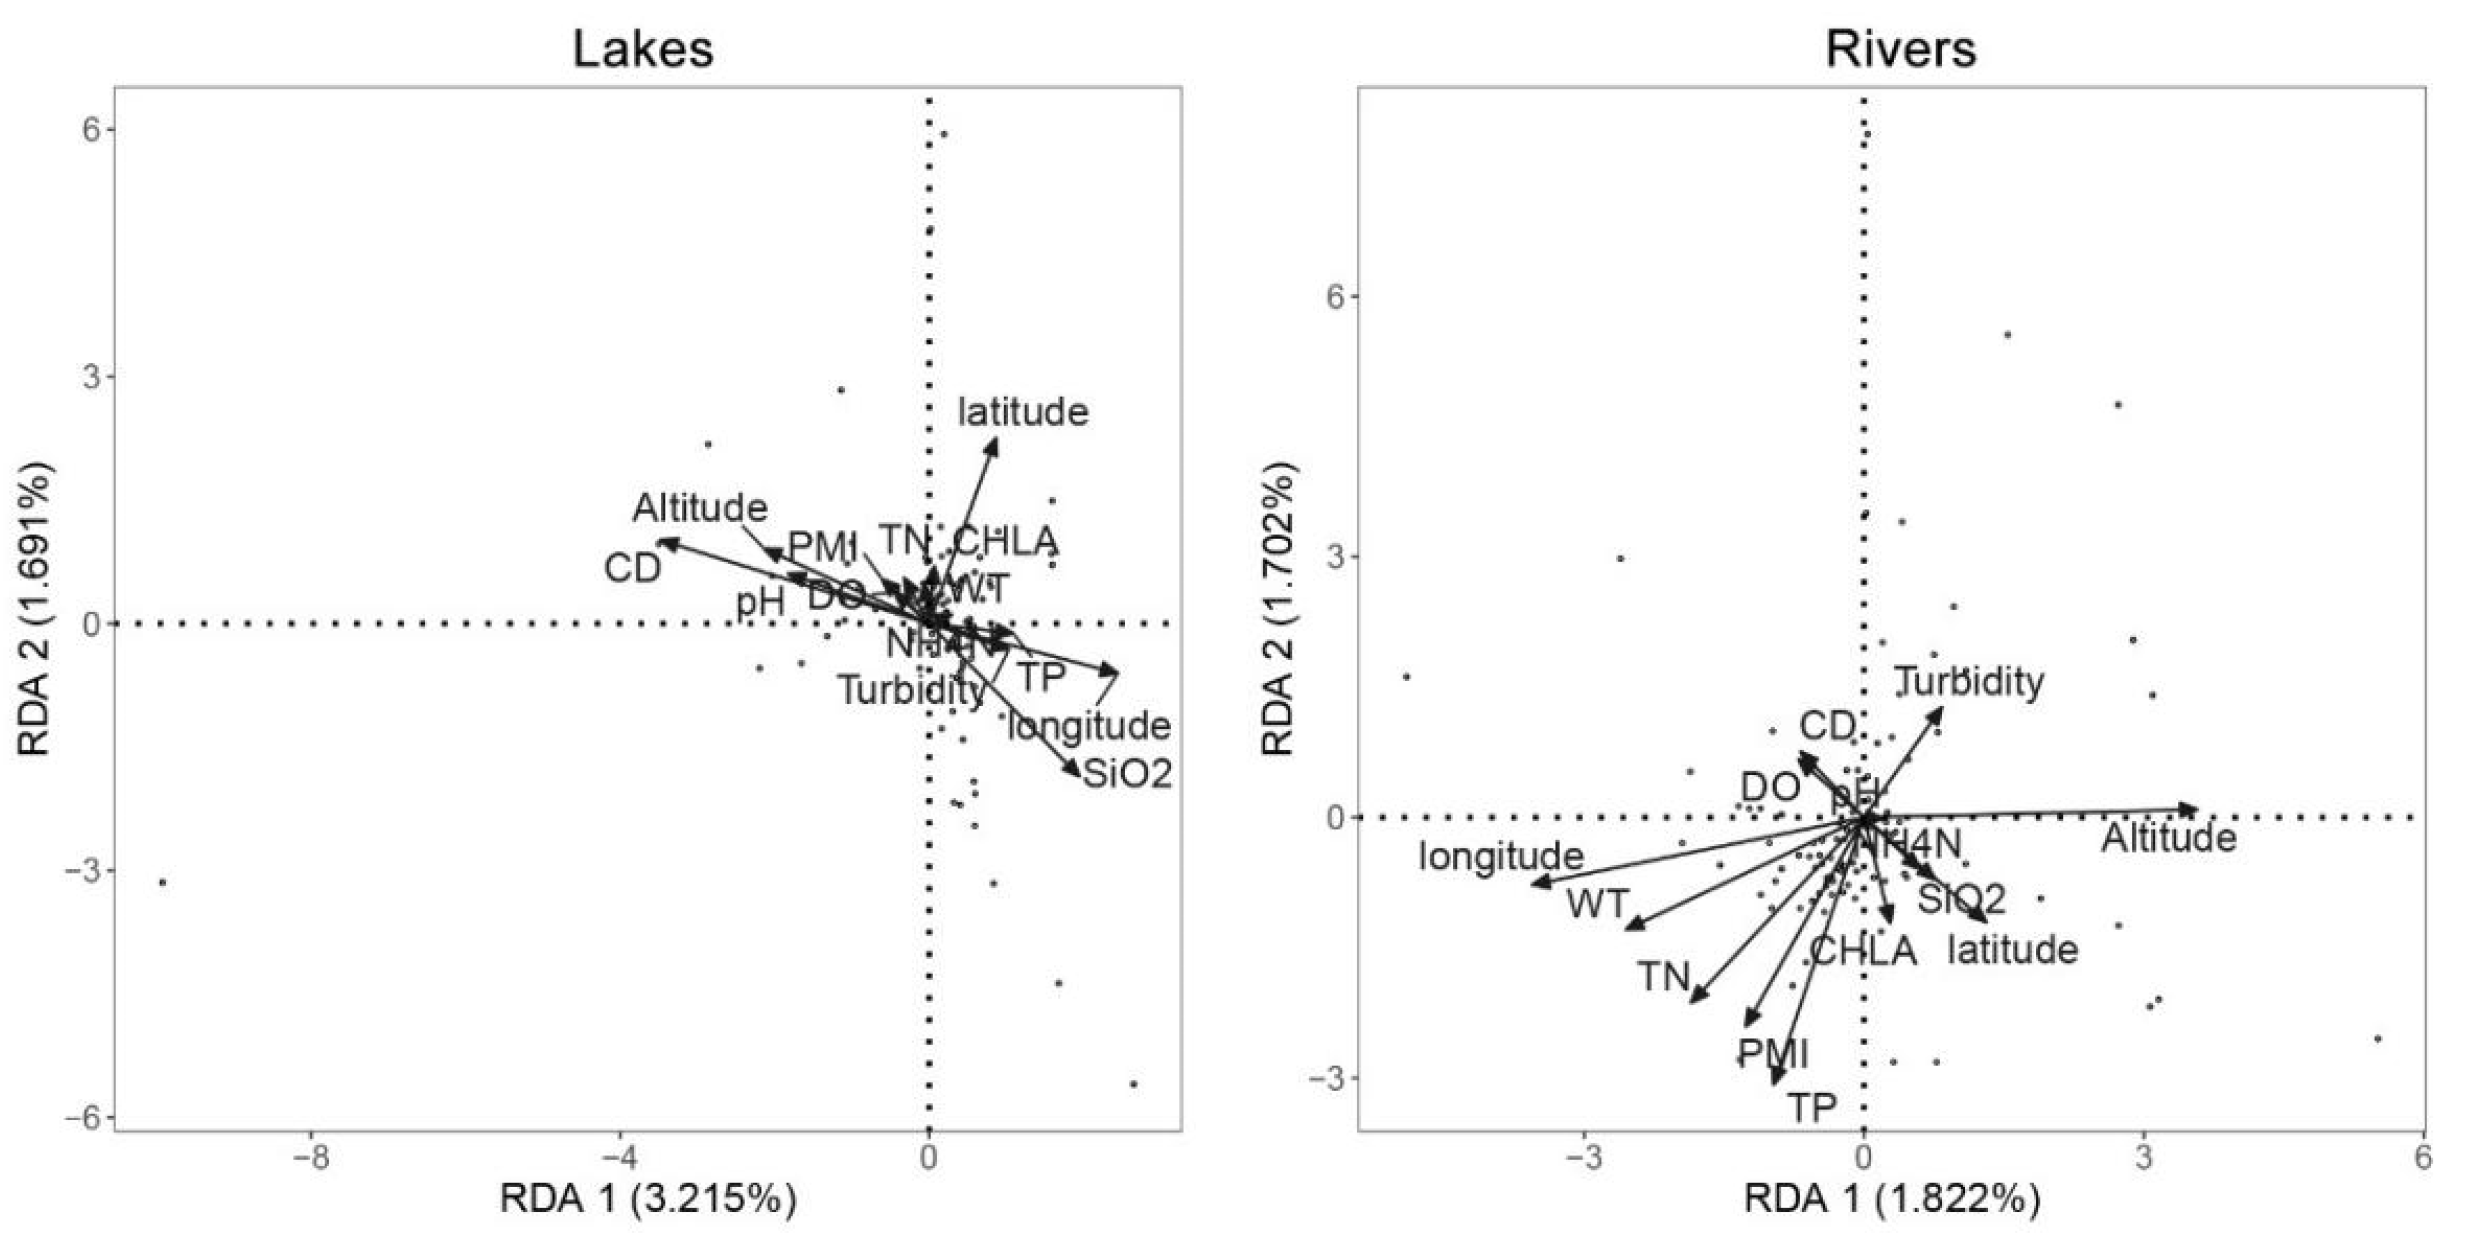
Figure 6.
Pairwise correlations of environmental factors. A color gradient represents Spearman’s correlation value. Planktonic diversity was linked to all environmental factors by the Mantel test. Edge width aligns with Mantel’s correlation coefficient, and edge color represents the statistical significance. “T”, water temperature; “NO3N”, nitrate; “NO2N”, nitrite; “NH4N”, ammonium. “OR”, observed richness; “PD”, phylogenetic distance.
Disclaimer/Publisher’s Note: The statements, opinions and data contained in all publications are solely those of the individual author(s) and contributor(s) and not of MDPI and/or the editor(s). MDPI and/or the editor(s) disclaim responsibility for any injury to people or property resulting from any ideas, methods, instructions or products referred to in the content. |
© 2025 by the authors. Licensee MDPI, Basel, Switzerland. This article is an open access article distributed under the terms and conditions of the Creative Commons Attribution (CC BY) license (http://creativecommons.org/licenses/by/4.0/).
Copyright: This open access article is published under a Creative Commons CC BY 4.0 license, which permit the free download, distribution, and reuse, provided that the author and preprint are cited in any reuse.


