
Submitted:
01 September 2025
Posted:
01 September 2025
You are already at the latest version
Abstract
This study presents a systematic assessment of a leading rubber plantation company’s organizational carbon footprint in Sri Lanka, focusing on both direct and indirect greenhouse gas (GHG) emissions. In the context of increasing global concerns about climate change and sustainability in the agricultural sector, the research emphasizes emission sources beyond conventional energy use, specifically fertilizer application, employee commuting, company-owned vehicle operations, and wastewater discharge. The Greenhouse Gas Protocol standard and IPCC 2006 guidelines were used to ensure methodological rigor and context-specific relevance, along with locally adapted emission factors. Data collection involved site visits, internal company records, and stakeholder consultations. Emissions were calculated as kgCO₂e using standardized conversion approaches. Scope 3 emissions, particularly methane emissions from wastewater discharge, fertilizer emissions, and purchased electricity emissions, constitute a substantial share of the total carbon footprint.To address these impacts, three mitigation scenarios were explored: (1) reducing fertilizer usage through optimized nutrient management, (2) installing solar photovoltaic systems to offset grid electricity consumption, and (3) implementing wastewater treatment using Fenton’s reagent combined with activated carbon. This study offers practical information and a replicable methodology for improving environmental performance and guiding sustainable carbon management strategies in plantation-based industries.
Keywords:
sustainability
; rubber plantation
; carbon footprint
; greenhouse gas emissions
1. Introduction
Climate change is a significant issue of the 21st century, which requires immediate and coordinated action from all sectors [1]. Adopted at COP21 in 2015, the Paris Agreement represented a historic worldwide agreement among 197 countries to limit global warming to well below 2°C, ideally 1 to 5°C, relative to preindustrial levels to mitigate the effects of climate change. Achieving this goal is essential for preventing disastrous environmental effects. According to the Intergovernmental Panel on Climate Change [2,3], maintaining warming below the 1 to 5 °C would greatly reduce the probability of extreme weather events, such as flooding. The primary cause of this crisis is the increase in the atmospheric concentration of greenhouse gases (GHG), which worsens the greenhouse effect and causes unpredictable weather patterns [4].
In this context, the idea of a carbon footprint has become essential for measuring human activity-induced greenhouse gas emissions, allowing well-informed environmental decision-making [5]. Consequently, industries are increasingly adopting low-carbon sustainable practices in response to the growing demands of investors, consumers, and regulators [6]. The organizational carbon footprint, which includes both direct and indirect emissions from operations, provides a thorough understanding of an entity’s environmental impact.
Organizations must have a sophisticated understanding of carbon footprint measurement frameworks to effectively mitigate climate change [7]. Carbon footprints can be evaluated at the organizational, product, or individual levels [8]. According to Gandola and Asdrubali [9], individual footprints consider emissions from consumption patterns such as housing, food, clothing, and transportation. Product footprints adopt a cradle-to-grave approach, evaluating emissions at every stage of the product life cycle, from raw materials to production, use, and ultimately disposal [10]. Emissions from fleet operations, facilities, and business travel are all included in organizational footprints [11], providing a more comprehensive view of the influence of institutions [4].
To ensure consistency in carbon footprint printing, standardized methodologies are necessary. The PAS guidelines from the British Standards Institution, ISO 14064, and the GHG Protocol of the World Resources Institute and the World Business Council for Sustainable Development are some of the most well-known frameworks [12]. The GHG Protocol remains the most widely used standard and offers detailed guidance for creating organizational GHG inventories [13].
Scope 1 (direct emissions), scope 2 (indirect emissions from purchased electricity, heat, or steam), and scope 3 (all other indirect emissions, including those from supply chains, employee travel, and outsourced activities) are the three categories into which the GHG Protocol divides emissions [14]. Although scope 3 emissions occur externally frequently and require careful data collection to ensure precision and comparability, scope 1 and scope 3 emissions originate within the organizational boundary [15]. Scope 3 emissions often account for the largest portion of the overall emissions, and underestimating them could result in serious errors in footprint calculations [16].
The agricultural sector is a major contributor to anthropogenic greenhouse gas emissions globally, which requires a comprehensive understanding of its environmental impacts [5]. The natural rubber industry in Sri Lanka exemplifies this challenge. As the country’s third-largest foreign exchange earner, it had contributed ca. $930 million USD in foreign exchange revenue in 2023 [1,17] and generated approximately 300,000 direct and indirect jobs [17]. However, the sector also contributes to climate change while providing essential economic benefits, highlighting the need for sustainable practices informed by a detailed analysis of the carbon footprint [18].
A comprehensive assessment of greenhouse gas emissions from the natural rubber sector must cover all stages of the life cycle, namely, land preparation, planting, latex extraction, processing, and distribution [18,19]. Land conversion for rubber plantations, especially when it involves deforestation, results in immediate carbon emissions due to the release of stored carbon in biomass and soil [20]. Furthermore, the use of fertilizers, pesticides, and herbicides in rubber cultivation contributes to greenhouse gas emissions, particularly nitrogen oxide from nitrogen-based fertilizers [21]. The energy consumption during latex extraction, processing, and transportation further adds to the carbon footprint, highlighting the need for energy-efficient technologies and practices. Waste generated from rubber processing, including wastewater and solid waste, can also contribute to greenhouse gas emissions if not managed appropriately. Specifically, improper wastewater treatment can generate substantial amounts of methane, a potent greenhouse gas that is highly detrimental to the environment.
Scholars have investigated the carbon footprint of rubber industry through various methodological lenses. For instance, Kumara et al. [22] conducted a case study on the carbon footprint of a rubber/sugarcane intercropping system. Several studies have evaluated environmental sustainability in crepe rubber manufacturing using a life cycle assessment[23,24]. Vidanagama and Lokupitiya [25] examined energy use and greenhouse gas emissions related tothe manufacturing processes of tea and rubber. Similar carbon footprint assessments have been conducted across major rubber-producing countries , including Thailand [26], Indonesia[27], and Malaysia [28]. Furthermore, Dayaratne and Gunawardana [30] conducted a study on carbon footprint reduction strategies in rubber production within small and medium-sized enterprises (SMEs) in Sri Lanka.
However, none of these studies have incorporated non-energy-related emissions, including those arising from agricultural inputs such as fertilizers, pesticides, herbicides, and fungicides. Fugitive emissions from sources such as fire extinguishersand emissions related to solid waste disposal and wastewater discharge, are also overlooked. Additionally, the emissions generated by employee commuting, air travel for business purposes, and electricity transmission and distribution losses are often underestimated or entirely excluded from conventional carbon footprint assessments. Consequently, there is still a substantial knowledge gap in understanding the full organizational carbon footprint of rubber plantations, which hinders the formulation of comprehensive and effective mitigation strategies.
This study uses the Greenhouse Gas Protocol to assess the organizational carbon footprint in a rubber plantation company based in Sri Lanka. The scope of the assessment includes both direct and indirect GHG emissions. Specifically, it evaluates emissions from on-site energy use (e.g., generators), and fugitive sources (e.g., fire extinguishers), transportation (e.g., company-owned vehicles), solid waste (e.g., rain guard polythene), and wastewater. Indirect emissions include power consumption from the grid, transmission losses, commutes for employees, air travel, and the use of agricultural inputs. Performing such a quantification will promote a comprehensive understanding of organizations based on the carbon footprint of the natural rubber industry, enabling the identification of key emission sources, hotspots, and effective interventions.
2. Materials and Methods
2.1. Study Area and Organizational Boundaries
The company manages a rubber plantation and typically produces 2,000 tons of rubber crops. Three hundred and fifty days a year, eight hours a day, 1,921 employees work for it. Figure 1 depicts the overall boundary of the organizational system. According to the figure, the company owns ten rubber plantation estates. Each property involves a different type of emission source. According to the GHG Protocol, scope 1 (direct emissions), scope 2 (indirect emissions from purchased electricity, heat , , or steam), and scope 3 (all other indirect emissions, including those from supply chains, employee travel, outsourced activities, upstream transportation of raw materials, and end-of-life treatment of products) are the three scope categories used in this study to analyze the system boundary and determine the carbon footprint. Figure 2 shows the associated emission sources for each of these categories. Examples of scope 1 emissions that occur on-site include generators, water pumps, LPG gas consumption, fugitive emissions, mobile combustion emissions, solid waste from the disposal of polythene rain guards, wastewater discharge, and generator emissions. The only source of scope 2 emissions is the electricity purchased by the company. The use of weedicides, pesticides, fungicides, and fertilizers, employees’ commutes, and emissions from non-company vehicles and business flights associated with organizational activities are related to scope 3 emissions.
2.2. Data Collection
All major emission sources were identified to develop the organization’s greenhouse gas emission inventory. Then, the company departments provided activity data for 2023, as detailed in Table 1. Scope 1 data were obtained from the company’s fuel consumption and purchase records, including business travel and plantation estate transportation. LPG consumption data were also collected to calculate scope 1 emissions. Emissions from fossil fuels and LPG were assessed using the DEFRA methodology. Transportation emissions were calculated using the total distance driven, fuel type, and vehicle technical specifications found in the company’s documentation. The company’s records also contained fuel consumption data for diesel generators, water pumps, and plantation equipment, such as chainsaws and grass cutters. The GHG emissions from fuel consumption and mobile combustion were calculated using the DEFRA tool.
Grid-purchased electricity is included in activity data related to GHG emissions that fall into the scope 2 emission category. Energy consumption includes the use of lighting, automated building systems, and operational electricity. The monthly reading of electricity consumption provides activity data for purchasing electricity. The national grid average emission factor that best describes the relevant grid was used to calculate GHG-related electricity.
Scope 3 emissions included employee travel, hired vehicles, fertilizer use, weedicide consumption, fungicide consumption, and waste generation. Travel data in 2023 were determined from employee interviews. To evaluate fuel consumption, the total distance traveled, modes of transport, and type of vehicle employees travel to and from work were used. The GHG emissions related to travel were calculated in kilometers per km using the DEFRA tool [29]. Data on the amount of fertilizer, weedicide, and fungicide used and greenhouse gas emissions were collected from the company’s records. The type of waste and the amount produced were obtained from the company’s own paperwork and records. The activity data for rental cars and air travel were computed based on the distance traveled in 2023. For this purpose, we used company-owned documents from business trips. The amount of wastewater discharge used to calculate GHG emissions is obtained from monthly wastewater discharge readings. All scope 3 emissions were included in the DEFRA tool calculation [29]. The emissions related to wastewater discharge were calculated based on the IPCC guidelines [30] for methane emissions from wastewater discharge using equation (1).
where EFj is the emission factor for each treatment/discharge pathway or system, kg CH4/kg COD, j is each treatment/discharge pathway or system, Bo is the maximum CH4 producing capacity, kg CH4 / kg COD and MCFj is a methane correction factor (fraction).
EFj = Bo × MCFj
2.3. Carbon Footprint Methodology
The company’s carbon footprint followed the Greenhouse Gas Protocol, Greenhouse gases—Part 1: Specification with guidance at the organization level to quantify and report greenhouse gas emissions and removals [31]. This document describes the guidelines and specifications for constructing, developing, managing, and reporting GHG emission inventories at the organizational level. Greenhouse gas emissions from the company’s activities were determined by the emission factors related to each activity data. The carbon footprint approach used in this study is based on activity data multiplied by appropriate emission factors that calculate CO₂e emissions or removals per unit of activity using the following equations (2) and (3):
where ACF is the carbon footprint caused by each activity, AD is the activity data in tons (t), and EF is a standard emission factor. Emission rate per unit of activity (CO₂e/tonne), and TCF is the total carbon footprint of the organization expressed in tonnes of equivalent carbon dioxide (tCO2e).
ACF = AD × EF
TCF = ACF₁ + ACF₂ + ... + ACFₙ
The DEFRA’s conversion factors published in 2023 [29] were used to calculate each activity’s carbon footprint within operating limits. The DEFRA emission factor [29] expresses the relationship between the amount of pollutants produced and raw materials processed or burned. The government conversion factor spreadsheets provide conversion values and detailed instructions on how to use them. A new set of conversion factors is produced and published each year, along with a document detailing the factors of the key modifications to the most recent year and a methodology outlining how conversion factors are formed [32]. The national emission factor for purchased electricity is calculated based on the Ceylon Electricity Board Statistical Digest and Sri Lanka Energy Balance Report [32,33]. Furthermore, India-specific road transport emisson factors [34] were used for the employee community emission-related calculations.
2.4. Carbon Fixation Methodology
The amount of carbon fixed in rubber trees was quantified based on an allometric model (equation 4) developed based on growth indicators such as tree diameter and total tree height [35].
Total carbon (per tree) kg = −5.1+144.9 x diameter2 (at 150 cm height) (m)∗ total height (m)
The diameter of 150 cm height of the tree was taken from 0.1 hectares of randomly selected plot of each rubber field. Due to the practical difficulty in measuring total tree height, it was calculated based on the growth models available with respect to the age of the plantations as follows equations (5):
Total tree height (m) = −15.13 + 40.28 / (1 + exp (−0.13 (years after planting –1.03)))
The actual tree density of the relevant rubber fields was considered in calculating fixed carbon in the rubber fields. Rubber fields below 2 years of age were not considered in carbon stocktaking as a general procedure.
3. Results and Discussion
3.1. Organizational Carbon Footprint of Rubber Plantation Organization
The organizational carbon footprint recorded 3125.00 tCO₂e . The distribution of greenhouse gas emissions across scopes 1, 2, and 3, as outlined by the Greenhouse Gas Protocol [34], is illustrated in Figure 3. The diagram simplifies a complex emission inventory by clearly displaying relationships among emission scopes, emission types, sources, and related carbon dioxide equivalents. Scope 1 emissions represent the largest share (ca. 48%), primarily due to methane (CH₄) emissions from wastewater treatment. Scope 3 emissions constitute the second-largest portion (ca. 38%), with significant contributions from the use of chemicals, fertilizers, and rental vehicles, highlighting the environmental impact of agricultural practices and outsourced activities. The majority of scope 2 emissions (ca. 14%) arise from electricity consumption, notably within rubber factories.
3.1.1. Scope 1 Emissions
Figure 4 illustrates that the organization reported 1,486.86 tCO₂e of scope 1 emissions for 2023. Wastewater treatment processes accounted for an estimated 38.46 tonnes of methane (CH₄), equivalent to 1,076.95 tCO₂e. This methane alone represented approximately 72% of the organization's scope 1 emissions. Operational vehicles and equipment powered by petrol and diesel also significantly contributed to scope 1 emissions. The vehicle fleet was the largest single source in this category, accounting for 331.23 tCO₂e. Specifically, tractors emitted 149.02 tCO₂e and taxis emitted 74.41 tCO₂e. Standby generators consumed 14,449 L of fuel (see Table 2), producing 38.21 tCO₂e. Additionally, petrol-powered equipment—including blowers, chainsaws, grass cutters, sprayers, and water pumps—generated 11.60 tCO₂e. Fugitive emissions from fire extinguishers added another 0.12 tCO₂e. Liquefied petroleum gas (LPG) consumption was also notable, totaling 9.74 tonnes (see Table 2) and generating 28.62 tCO₂e.
3.1.2. Scope 2 Emissions
The total electricity consumed during the assessment period was 1,063,145 kWh (see Table 3), distributed among various operational units. The highest share of consumption was at 919,243 kWh (see Table 3), resulting in 393.25 tCO2e (see Figure 5), which is approximately 86.5% of the total scope 2 emissions. Other significant contributors include staff quarters, bungalows, and offices.
3.1.3. Scope 3 Emissions
Table 5 summarizes the inventory and carbon footprint related to scope 3 emissions. As per Table 4, scope 3 emissions from the organization totaled 1,182.98 tCO₂e during the reporting period. A significant portion of emissions come from agricultural inputs, particularly synthetic fertilizers, fungicides, and weedicides. This use contributed a total of 839.05 tCO₂e. The application alone represented 780.41 tCO2e, which emphasizes its dominant role in this category. Table 5 summarizes the inventory and carbon footprint associated with scope 3 emissions.
Hired transportation assets, such as tractors, bowsers, lorries, and construction machinery, contributed 113.64 tCO₂e. Although their fuel consumption was modest compared to industrial activities, their high-intensity and continuous operation notably increased the organization's scope 3 emissions.
The operations of the organization generate diverse waste streams, including solid waste from rain guard polythene and chemical residues, which collectively contributed 117.62 tCO₂e. A total of 42.59 tonnes of waste were processed through third-party recycling and disposal services. Transportation of waste to these facilities added an additional 0.57 tCO₂e to the emissions inventory. Meanwhile, the use of 141,117 kg of industrial chemicals in various operational activities contributed 116.14 tCO₂e to the emissions inventory.
Electricity transmission and distribution losses contributed 43.89 tCO₂e to Scope 3 emissions. These losses occur between electricity generation and final consumption points, and were calculated by applying nationally recognized grid loss factors to the organization's electricity consumption data. Among facilities, the rubber factory accounted for the largest share at 37.95 tCO₂e, followed by staff quarters and office buildings.
Employee commuting emissions, including private vehicles and public transport, totaled 66.91 tCO₂e. As shown in Table 4, petrol motorcycles were the dominant source, accounting for 58.51 tCO₂e. Petrol three-wheelers were the second largest contributor at 4.58 tCO₂e.
Air travel emissions were modest at 0.88 tCO₂e, generated from two recorded business trips during the reporting period.
3.2. Carbon Fixation
The plantation contributes to maintaining 137,273 tonnes of carbon stock within the defined boundary. Accordingly, the plantation is responsible for fixing 503,790 tons of atmospheric CO2 as a mitigation contribution. Table S1 provides additional information on the estate-wise contribution to fixing and maintaining carbon stocks.
3.3. Proposal of Improvement Options
Based on the final carbon footprint calculations and the subsequent Pareto analysis presented in Table 5, methane emissions from wastewater discharge, fertilizer application, and electricity consumption emerged as the main contributors to the plantation’s overall greenhouse gas emissions. Pareto analysis, a statistical method for identifying the most significant factors among a broader set, is based on the Pareto Principle, commonly referred to as the 80/20 rule, which posits that ca. 80% of effects arise from 20% of causes [36] . In light of this analysis, targeted mitigation strategies focusing on reducing fertilizer application and minimizing wastewater generation primarily through the optimization of wastewater treatment processes and energy use were identified as critical areas for emission reduction and sustainability enhancement.
3.3.1. Option 1: Reduction in Fertilization
Optimizing the timing and frequency of fertilizer applications, in conjunction with waste reduction, improves nitrogen use efficiency in agricultural contexts [37]. Slow-release fertilizers offer a potentially advantageous approach to nutrient management in rubber plantations. However, the environmental consequences, specifically the release of microplastics from polymer coatings, warrant thorough investigation. Environmentally sound alternatives, such as slow-release technologies employing biodegradable or natural coatings, are becoming increasingly viable. More empirical research is needed to comprehensively assess the nutrient release kinetics and environmental effects of these alternatives. In several countries, the adoption of enhanced fertilization strategies can decrease overall fertilizer requirements by ca. 20% [38].
3.3.2. Option 2: Installation of Solar Panels and Implementation of Energy Efficiency Practices
Electricity consumption represents a significant source of greenhouse gas (GHG) emissions within rubber plantation operations, accounting for ca. 16% of total emissions. Therefore, enhancing energy efficiency across processing activities is a critical emission mitigation strategy. The installation of inverters, which regulate the flow of electrical current by gradually increasing the power until the machinery reaches its target operating speed, is a practical intervention. This approach reduces the high energy losses associated with start-up surges and can reduce electricity consumption by approximately 10%–12% [37,39]. The adoption of broader energy-efficient measures has demonstrated substantial benefits beyond inverter technology.
For instance, the use of photovoltaic solar panels has significantly reduced electricity demand. According to Dunuwila, Rodrigo, and Goto [24], such interventions can result in a 100% reduction in electricity consumption per metric ton of dry rubber produced. Furthermore, replacing 100% of electricity consumption with solar energy can offset all electricity demand, thereby achieving complete energy savings from conventional power sources. These improvements not only decrease operational energy use but also contribute to the long-term sustainability of natural rubber processing in Sri Lanka.
3.3.3. Option 3: Use of Fenton Reagent and Activated Carbon for Wastewater Treatment
An effective strategy to reduce methane emissions from wastewater treatment in the rubber industry involves advanced chemical treatment methods aimed at significantly lowering the chemical oxygen demand (COD) content. One such approach is to combine the Fenton reagent and activated carbon adsorption. This method achieved up to 95% COD removal from rubber processing effluent under optimal conditions, specifically a Fenton reagent molar ratio of 1:250 and a reaction time of 45 minutes, followed by passage through an activated carbon column [40]. The treated wastewater achieved a final COD concentration of 71 mg/L, TSS of 70 mg/L, and a neutral pH of 7.8, which meet the industrial discharge standards of the Sri Lankan Central Environmental Authority (CEA) [41]. Applying the IPCC [30] methane emission factor (0.2 kg CH₄/kg COD), this 95% reduction in COD translates into a comparable 95% reduction in the potential for methane generation, thus significantly mitigating the industry’s wastewater treatment-related carbon footprint.
3.4. Evaluation of Potential Improvements
3.4.1. Option 1: Reduction in Fertilization
Optimizing fertilizer application represents a key mitigation strategy in reducing greenhouse gas emissions associated with agricultural operations. In the context of this study, it is projected that the implementation of better nutrient management practices will reduce fertilizer use by 20%, resulting in an estimated reduction of 156 tCO₂e from 780 tCO₂e to 624 tCO₂e.
3.4.2. Option 2: Installation of Solar Panels and Implementation of Energy Efficiency Practices
The implementation of energy efficiency measures combined with solar panel installations has the potential to significantly reduce electricity consumption in rubber processing operations. Based on the projected efficiency improvements, electricity consumption can be reduced by approximately 100%, decreasing from 1,063,145 kWh to zero, representing a savings of 1,063,145 kWh. Furthermore, this reduction in energy use leads to a corresponding decrease in electricity transmission and distribution (T&D) losses. From an original T&D loss of 102,584 kWh, an estimated zero can be avoided by reducing the demand at the source.
Consequently, associated greenhouse gas emissions are expected to decline significantly. Emissions from electricity consumption can be reduced from 455 tCO₂e to 100.1 tCO₂e, while emissions from transmission and distribution losses can be reduced from 44 tCO₂e to approximately 9.68 tCO₂e.
Furthermore, in a scenario where 100% of the electricity demand is met through photovoltaic solar panel installations, the organization can achieve complete avoidance of grid-based electricity consumption. This would eliminate all associated emissions from both electricity use and T&D losses, potentially reducing total emissions from 499 tCO₂e to zero. Such a transition would mark a significant milestone in achieving carbon neutrality and enhancing long-term environmental sustainability.
3.4.3. Option 3: Use of Fenton Reagent and Activated Carbon for Wastewater Treatment
Wastewater discharge has been identified as the single source of greenhouse gas emissions, contributing approximately 34.5% of the total emissions, primarily through the release of methane. A promising mitigation strategy involves the application of Fenton reagent coupled with activated carbon adsorption for wastewater treatment. In this context, implementing the treatment process would reduce CH₄-related emissions from an estimated 1,077 tCO₂e to 54 tCO₂e, resulting in a net emission reduction of 1,023 tCO₂e. This represents a substantial and measurable improvement in the environmental performance of the organization’s wastewater management system.
3.4.4. Combined Scenario: Application of Options 1, 2, and 3
The integrated implementation reduces total emissions from 3,125 to 1,491 tCO₂e, representing a remarkable ca. 48% reduction in overall greenhouse gas emissions. These collective improvements not only contribute to the reduction of emissions, but also drive substantial reductions in input material costs, energy expenses, and waste management expenditures, improving the operation’s environmental and economic efficiency of the operation.
3.5. Comparative Analysis of Carbon Footprint with Other Studies
Comparing the carbon footprint of rubber plantations with other studies presents inherent challenges due to spatial and temporal variations in emissions [42]. Additionally, discrepancies arise from differences in the boundaries such as whether energy use, input production, land use change and post-harvest stages are considered [43]. These variabilities were taken into account when comparing the findings of this study with the existing literature. Given the scarcity of direct studies on carbon footprint rubber plantations in Sri Lanka, additional comparisons were made with related agricultural systems such as tea, sugarcane, rice, etc.
A recent investigation by Kumara et al. [22] on rubber-sugarcane intercropping systems in Sri Lanka reported a cumulative carbon footprint of 9.71 tCO₂e over a four-year period, corresponding to an average annual emission of 2.43 tCO₂e per hectare. This value exceeds the carbon footprint estimated in the present study. The elevated levels of emission observed in their study are likely to be attributed to the integration of sugarcane cultivation, which is known for the application of intensive nitrogen fertilizers and soil disturbance practices that contribute to increased nitrous oxide (N₂O) emissions.
Despite the prominence of rubber as a perennial crop in Sri Lanka, comprehensive carbon footprint assessments of rubber plantations remain scarce in the national literature, particularly in contrast with assessments conducted for other major agricultural crops. In the current study, the carbon footprint associated with a rubber monoculture plantation was estimated at 0.848 tCO₂e ha⁻¹ yr⁻¹, a value significantly lower than those reported for other crops grown under similar agro-climatic conditions. For example, Rathnayake et al. [44] conducted an extensive inventory of greenhouse gas emissions in the Mahaweli H agricultural zone and docuented substantial variability in net CO₂e emissions per hectare per year. Their comparative analysis, presented in Figure 6, illustrates the intensities associated with key crops such as rice [44], maize, soybeans [44], vegetables [44] and Sweet potato [44], manic [44], ground nut [44], Suger Cane [44], and Rubber (this study), further underscoring the relatively lower carbon intensity of rubber monoculture systems, as evidenced by the present findings.
Overall, a robust monitoring and evaluation system is essential to ensure progress and adaptability of the improvement strategies. Establishing key performance indicators for emissions, energy use, and transportation efficiency allows for ongoing evaluation and refinement of strategies. Data-driven decision making, guided by real-time performance metrics, ensures that the organization is on track to meet its sustainability goals.
Employee participation plays a crucial role in fostering an organizational culture of sustainability. Implementing green human resource management practices such as incorporating environmental goals into performance evaluations, training programs on energy and waste reduction, and incentives for eco-friendly behavior can drive behavioral change throughout the organization [42,43,45,46,47,48]
Finally, the promotion of external collaboration and transparency can amplify the impact of these strategies. By partnering with government agencies, academic institutions, and NGOs, rubber plantation companies can access technical expertise and innovation [4,47]. Publishing sustainability reports using frameworks such as the Global Reporting Initiative or the Task Force on Climate-related Financial Disclosures enhances stakeholder trust and ensures accountability [49].
Together, these strategies offer a practical and research-informed roadmap to achieve substantial carbon footprint reductions in rubber plantation operations while supporting broader environmental and social goals. Despite the prominence of rubber as a perennial crop in Sri Lanka, comprehensive carbon footprint assessments of rubber plantations remain scarce in the national literature, particularly in contrast with assessments.
4. Conclusions
Addressing the complex greenhouse gas emission profile of the rubber plantation sector is crucial to achieving national sustainability plans and global climate commitments. This research reveals a profile where methane emissions from wastewater treatment, nitrous oxide emissions from fertilizer application, and carbon dioxide emissions from electricity consumption and internal transportation are the dominant contributors under Scope 1, 2, and 3 boundaries. It is not only an accounting exercise, but a strategic necessity to align agro-industrial operations with national sustainability agendas and international climate commitments.
Through carbon footprint measurement, the company gains an essential evidence base to comprehend its environmental impact, monitor trends over time, and prioritize mitigation options. Regular reporting and year-to-year comparison of emissions data improve organizational transparency, improve internal environmental management, and enable alignment with international reporting frameworks such as the Global Reporting Initiative and the Task Force on Climate-related Financial Disclosures. Additionally, such analyses enable proper benchmarking and encourage a data-driven culture necessary for informed decision making and strategic investment in low-carbon technologies.
Significantly, the adoption of integrated mitigation practices–from improved anaerobic digestion through covered lagoon digesters for methane recovery, precision ag via GPS-guided fertilizer application and nitrification inhibitors in fertilizer management, to incorporating renewable energy and smart transportation systems – demonstrates that emission reductions need not come at the expense of productivity or profitability. On the other hand, these interventions also yield cobenefits in the form of resource efficiency gains, cost reductions, and greater operational resilience. Furthermore, the incorporation of green human resource management practices, through training, recruitment, and performance systems, ensures that sustainability becomes embedded in organizational culture and workforce skills.
The inclusion of scope 3 emissions reflects a mature understanding of supply chain dynamics and stakeholder interdependencies. Joint carbon reduction efforts with suppliers, educating customers on product carbon footprint, and engaging the surrounding communities in reforestation efforts not only reduce upstream and downstream emissions but also strengthen the license to operate for the company in an expanding environmentally conscious world market. Integrating green infrastructure and regenerative land-use practices as well synergizes carbon sequestration potential while promoting biodiversity conservation, soil fertility, and climate resilience.
In conclusion, by implementing a strategic, multiscale carbon footprint reduction intervention based on empirical evidence and technological innovation, the rubber plantation company is positioning itself at the frontline of the global fight against climate change. The interventions signify a paradigm shift towards environmental stewardship in the long term, climate-resilient business, and sustainable development beyond regulatory compliance or reputational benefit. Through the adoption of carbon accounting and integrating sustainability into core business operations, the company not only gains environmental legitimacy, but also creates lasting value in a carbon-constrained future. The replicable methodological framework of this research provides a valuable tool for other companies in the rubber industry to take a leaf from and play their role towards a more sustainable future.
Supplementary Materials
The following supporting information can be downloaded at the website of this paper posted on Preprints.org, Figure S1: Total breakdown of greenhouse gas emissions by Source; Table S1: Carbon and CO2 stocks of the plantation
Author Contributions
Conceptualization, C.P., P.D., E.M., V.H.L.R., I.D. and N.G.; methodology, C.P., P.D., E.M., V.H.L.R., I.D. and N.G.; software, C.P. and P.D.; validation, C.P., P.D., V.H.L.R., and N.G.; formal analysis, C.P. and P.D.; investigation, C.P.; resources, N.G.; data curation, C.P., E.M., P.D. and N.G.; writing—original draft preparation, C.P.; writing—review and editing, P.D., E.M., V.H.L.R., I.D. and N.G.; visualization, C.P.; supervision, P.D.,E.M., I.D. and N.G.; funding acquisition, N.G. All authors have read and agreed to the published version of the manuscript.
Funding
This research received no external funding.
Data Availability Statement
The raw data supporting the conclusions of this article will be made available by the authors on request.
Acknowledgments
The authors would like to thank all the factory personnel involved in conducting this research.
Conflicts of Interest
The authors declare no conflicts of interest.
References
- Gunathilaka, L.F.D.Z. The Impact of Green House Gas Emission on Corporate Climate Policies in Apparel Sector Organizations in Sri Lanka. Master of Science, University of Sri Jayewardenepura: Nugegoda, 2013.
- Ur Rahman, S.; Chwialkowska, A.; Hussain, N.; Bhatti, W.A.; Luomala, H. Cross-Cultural Perspective on Sustainable Consumption: Implications for Consumer Motivations and Promotion. Environ. Dev. Sustain. 2023, 25, 997–1016. [Google Scholar] [CrossRef]
- Shivanna, K.R. Climate Change and Its Impact on Biodiversity and Human Welfare. Proc. Indian Natl. Sci. Acad. 2022, 88, 160–171. [Google Scholar] [CrossRef]
- Bataleblu, A.A.; Rauch, E.; Cochran, D.S. Resilient Sustainability Assessment Framework from a Transdisciplinary System-of-Systems Perspective. Sustainability 2024, 16, 9400. [Google Scholar] [CrossRef]
- Wassmann, R.; Van-Hung, N.; Yen, B.T.; Gummert, M.; Nelson, K.M.; Gheewala, S.H.; Sander, B.O. Carbon Footprint Calculator Customized for Rice Products: Concept and Characterization of Rice Value Chains in Southeast Asia. Sustainability 2021, 14, 315. [Google Scholar] [CrossRef]
- Adu Sarfo, P.; Zhang, J.; Nyantakyi, G.; Lassey, F.A.; Bruce, E.; Amankwah, O. Influence of Green Human Resource Management on Firm’s Environmental Performance: Green Employee Empowerment as a Mediating Factor. PLOS ONE 2024, 19, e0293957. [Google Scholar] [CrossRef]
- Čuček, L.; Klemeš, J.J.; Kravanja, Z. Overview of Environmental Footprints. In Assessing and Measuring Environmental Impact and Sustainability; Elsevier, 2015; pp. 131–193. ISBN 978-0-12-799968-5.
- Mahapatra, S.K.; Schoenherr, T.; Jayaram, J. An Assessment of Factors Contributing to Firms’ Carbon Footprint Reduction Efforts. Int. J. Prod. Econ. 2021, 235, 108073. [Google Scholar] [CrossRef]
- Gandola, D.M.; Asdrubali, F. A Methodology to Evaluate GHG Emissions for Large Sports Events. Sustainability 2024, 16, 1504. [Google Scholar] [CrossRef]
- Waddell, C.J.; Hurteau, M.D.; Huntzinger, D. Product Carbon Footprinting: A Proposed Framework to Increase Confidence, Reduce Costs and Incorporate Profit Incentive. Carbon Manag. 2011, 2, 645–657. [Google Scholar] [CrossRef]
- Groening, C.; Inman, J.J.; Ross, W.T. Carbon Footprints in the Sand: Marketing in the Age of Sustainability. Cust. Needs Solut. 2014, 1, 40–51. [Google Scholar] [CrossRef]
- Peters, G.; Svanström, M.; Roos, S.; Sandin, G.; Zamani, B. Carbon Footprints in the Textile Industry. In Handbook of Life Cycle Assessment (LCA) of Textiles and Clothing; Elsevier, 2015; pp. 3–30. ISBN 978-0-08-100169-1.
- Green, J.F. Private Standards in the Climate Regime: The Greenhouse Gas Protocol. Bus. Polit. 2010, 12, 1–37. [Google Scholar] [CrossRef]
- Downie, J.; Stubbs, W. Corporate Carbon Strategies and Greenhouse Gas Emission Assessments: The Implications of Scope 3 Emission Factor Selection. Bus. Strategy Environ. 2012, 21, 412–422. [Google Scholar] [CrossRef]
- Alvarez, S.; Rubio, A. Carbon Footprint in Green Public Procurement: A Case Study in the Services Sector. J. Clean. Prod. 2015, 93, 159–166. [Google Scholar] [CrossRef]
- Matthews, H.S.; Hendrickson, C.T.; Weber, C.L. The Importance of Carbon Footprint Estimation Boundaries. Environ. Sci. Technol. 2008, 42, 5839–5842. [Google Scholar] [CrossRef]
- Central Bank of Sri Lanka Press Release External Sector Performance – December 2023 2024.
- Guinee, J.B. Handbook on Life Cycle Assessment Operational Guide to the ISO Standards. Int. J. Life Cycle Assess. 2002, 7, 311–BF02978897. [Google Scholar] [CrossRef]
- Muthukumarana, T.T.; Karunathilake, H.P.; Punchihewa, H.K.G.; Manthilake, M.M.I.D.; Hewage, K.N. Life Cycle Environmental Impacts of the Apparel Industry in Sri Lanka: Analysis of the Energy Sources. J. Clean. Prod. 2018, 172, 1346–1357. [Google Scholar] [CrossRef]
- Bhowmik, I. Impact of Rubber Plantations on the Environment of Tripura. SSRN Electron. J. 2006. [Google Scholar] [CrossRef]
- Zhou, W.-J.; Ji, H.; Zhu, J.; Zhang, Y.-P.; Sha, L.-Q.; Liu, Y.-T.; Zhang, X.; Zhao, W.; Dong, Y.; Bai, X.-L.; et al. The Effects of Nitrogen Fertilization on N2O Emissions from a Rubber Plantation. Sci. Rep. 2016, 6, 28230. [Google Scholar] [CrossRef]
- Kumara, P.R.; Munasinghe, E.S.; Rodrigo, V.H.L.; Karunaratna, A.S. Carbon Footprint of Rubber/Sugarcane Intercropping System in Sri Lanka: A Case Study. Procedia Food Sci. 2016, 6, 298–302. [Google Scholar] [CrossRef]
- Dunuwila, P.; Rodrigo, V.H.L.; Goto, N. Financial and Environmental Sustainability in Manufacturing of Crepe Rubber in Terms of Material Flow Analysis, Material Flow Cost Accounting and Life Cycle Assessment. J. Clean. Prod. 2018, 182, 587–599. [Google Scholar] [CrossRef]
- Dunuwila, P.; Rodrigo, V.H.L.; Goto, N. Sustainability of Natural Rubber Processing Can Be Improved: A Case Study with Crepe Rubber Manufacturing in Sri Lanka. Resour. Conserv. Recycl. 2018, 133, 417–427. [Google Scholar] [CrossRef]
- Vidanagama, J.; Lokupitiya, E. Energy Usage and Greenhouse Gas Emissions Associated with Tea and Rubber Manufacturing Processes in Sri Lanka. Environ. Dev. 2018, 26, 43–54. [Google Scholar] [CrossRef]
- Cucci, G.; Valentini, F.; Dorigato, A. Cradle to Gate Life Cycle Assessment of Tyre-Grade Natural Rubber Produced in Thailand. Sci. Total Environ. 2025, 987, 179653. [Google Scholar] [CrossRef] [PubMed]
- Susilawati, H.L.; Setyanto, P. Opportunities to Mitigate Greenhouse Gas Emission from Paddy Rice Fields in Indonesia. IOP Conf. Ser. Earth Environ. Sci. 2018, 200, 012027. [Google Scholar] [CrossRef]
- Yusoff, S.; Mohamed, Z.; Zuriani Ahmad, A. Environmental Impact Evaluation of Rubber Cultivation and Industry in Malaysia. In Climate Change and Agriculture; Hussain, S., Ed.; IntechOpen, 2019. ISBN 978-1-78985-667-5.
- Department for Environment, Food & Rural Affairs, D. for E.S. and N.Z. Greenhouse Gas Reporting: Conversion Factors 2023 2023.
- 2006 IPCC Guidelines for National Greenhouse Gas Inventories; Eggleston, H.S., Ed.; Institute for Global Environmental Strategies: Hayama, Japan, 2006; ISBN 978-4-88788-032-0. [Google Scholar]
- The Greenhouse Gas Protocol: A Corporate Accounting and Reporting Standard; Smith, B., World Business Council for Sustainable Development, World Resources Institute, Eds.; revised ed; World Resources Institute and World Business Council for Sustainable Development: o.O, 2004; ISBN 978-1-56973-568-8. [Google Scholar]
- Ceylon Electricity Board CEB Statistical Digest Report 2021 2021.
- Sri Lanka Sustainable Energy Authority Sri Lanka Energy Balance 2021.
- India GHG Program India Specic Road Transport Emission Factors.
- Munasinghe, E.S.; Rodrigo, V.H.L.; Gunawardena, U.A.D.P. MODUS OPERANDI IN ASSESSING BIOMASS AND CARBON IN RUBBER PLANTATIONS UNDER VARYING CLIMATIC CONDITIONS. Exp. Agric. 2014, 50, 40–58. [Google Scholar] [CrossRef]
- Chompu-inwai, R.; Jaimjit, B.; Premsuriyanunt, P. A Combination of Material Flow Cost Accounting and Design of Experiments Techniques in an SME: The Case of a Wood Products Manufacturing Company in Northern Thailand. J. Clean. Prod. 2015, 108, 1352–1364. [Google Scholar] [CrossRef]
- Jawjit, W.; Pavasant, P.; Kroeze, C.; Tuffrey, J. Evaluation of the Potential Environmental Impacts of Condom Production in Thailand. J. Integr. Environ. Sci. 2021, 18, 89–114. [Google Scholar] [CrossRef]
- Dunuwila, P.; Rodrigo, V.H.L.; Goto, N. Improving Financial and Environmental Sustainability in Concentrated Latex Manufacture. J. Clean. Prod. 2020, 255, 120202. [Google Scholar] [CrossRef]
- Department of Industrial Work, Ministry of Industry. Industrial Sector Codes of Practice for Pollution PREVENTION (Cleaner Technology) - Concentrated Latex and Blocked Rubber (STR 20) 2001.
- Emilia Agustina, T.; Jefri Sirait, E.; Silalahi, H. TREATMENT OF RUBBER INDUSTRY WASTEWATER BY USING FENTON REAGENT AND ACTIVATED CARBON. J. Teknol. 2017, 79. [Google Scholar] [CrossRef]
- Central Environmental Authority Waste_Water_Discharge_standards.
- Cabot, M.I.; Lado, J.; Bautista, I.; Ribal, J.; Sanjuán, N. On the Relevance of Site Specificity and Temporal Variability in Agricultural LCA: A Case Study on Mandarin in North Uruguay. Int. J. Life Cycle Assess. 2023, 28, 1516–1532. [Google Scholar] [CrossRef]
- Iriarte, A.; Yáñez, P.; Villalobos, P.; Huenchuleo, C.; Rebolledo-Leiva, R. Carbon Footprint of Southern Hemisphere Fruit Exported to Europe: The Case of Chilean Apple to the UK. J. Clean. Prod. 2021, 293, 126118. [Google Scholar] [CrossRef]
- Rathnayake, H.; Mizunoya, T. A Study on GHG Emission Assessment in Agricultural Areas in Sri Lanka: The Case of Mahaweli H Agricultural Region. Environ. Sci. Pollut. Res. 2023, 30, 88180–88196. [Google Scholar] [CrossRef] [PubMed]
- Ms, S.; Pn, K.; G, N.; H, S. The Role of Agricultural Engineering in Enhanced Food Security. Int. J. Res. Agron. 2024, 7, 691–701. [Google Scholar] [CrossRef]
- Ogwu, M.C.; Kosoe, E.A. Integrating Green Infrastructure into Sustainable Agriculture to Enhance Soil Health, Biodiversity, and Microclimate Resilience. Sustainability 2025, 17, 3838. [Google Scholar] [CrossRef]
- Mehta, K.; Chugan, P.K. Green HRM in Pursuit of Environmentally Sustainable Business. Univers. J. Ind. Bus. Manag. 2015, 3, 74–81. [Google Scholar] [CrossRef]
- Raghuwanshi, S.; Acharya, Dr.S. GREEN HRM–STRATEGIES FOR GREENING PEOPLE. Int. J. Tech. Res. Sci. 2020, 5, 11–15. [Google Scholar] [CrossRef]
- Saeed, B.B.; Afsar, B.; Hafeez, S.; Khan, I.; Tahir, M.; Afridi, M.A. Promoting Employee’s Proenvironmental Behavior through Green Human Resource Management Practices. Corp. Soc. Responsib. Environ. Manag. 2019, 26, 424–438. [Google Scholar] [CrossRef]
Figure 1.
Organizational structure of the rubber plantation estates (e1–e10) managed by the rubber plantation company.
Figure 1.
Organizational structure of the rubber plantation estates (e1–e10) managed by the rubber plantation company.
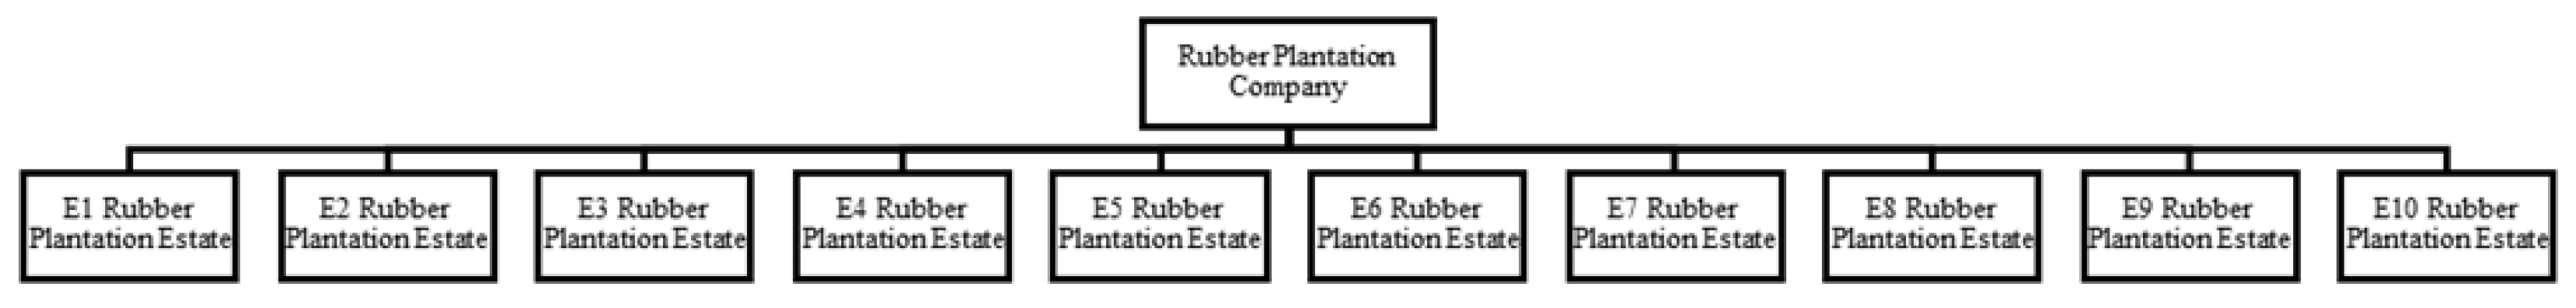
Figure 2.
Categorization of scope 1, 2 , and 3 emissions emission sources in operational activities of the rubber plantation company.
Figure 2.
Categorization of scope 1, 2 , and 3 emissions emission sources in operational activities of the rubber plantation company.
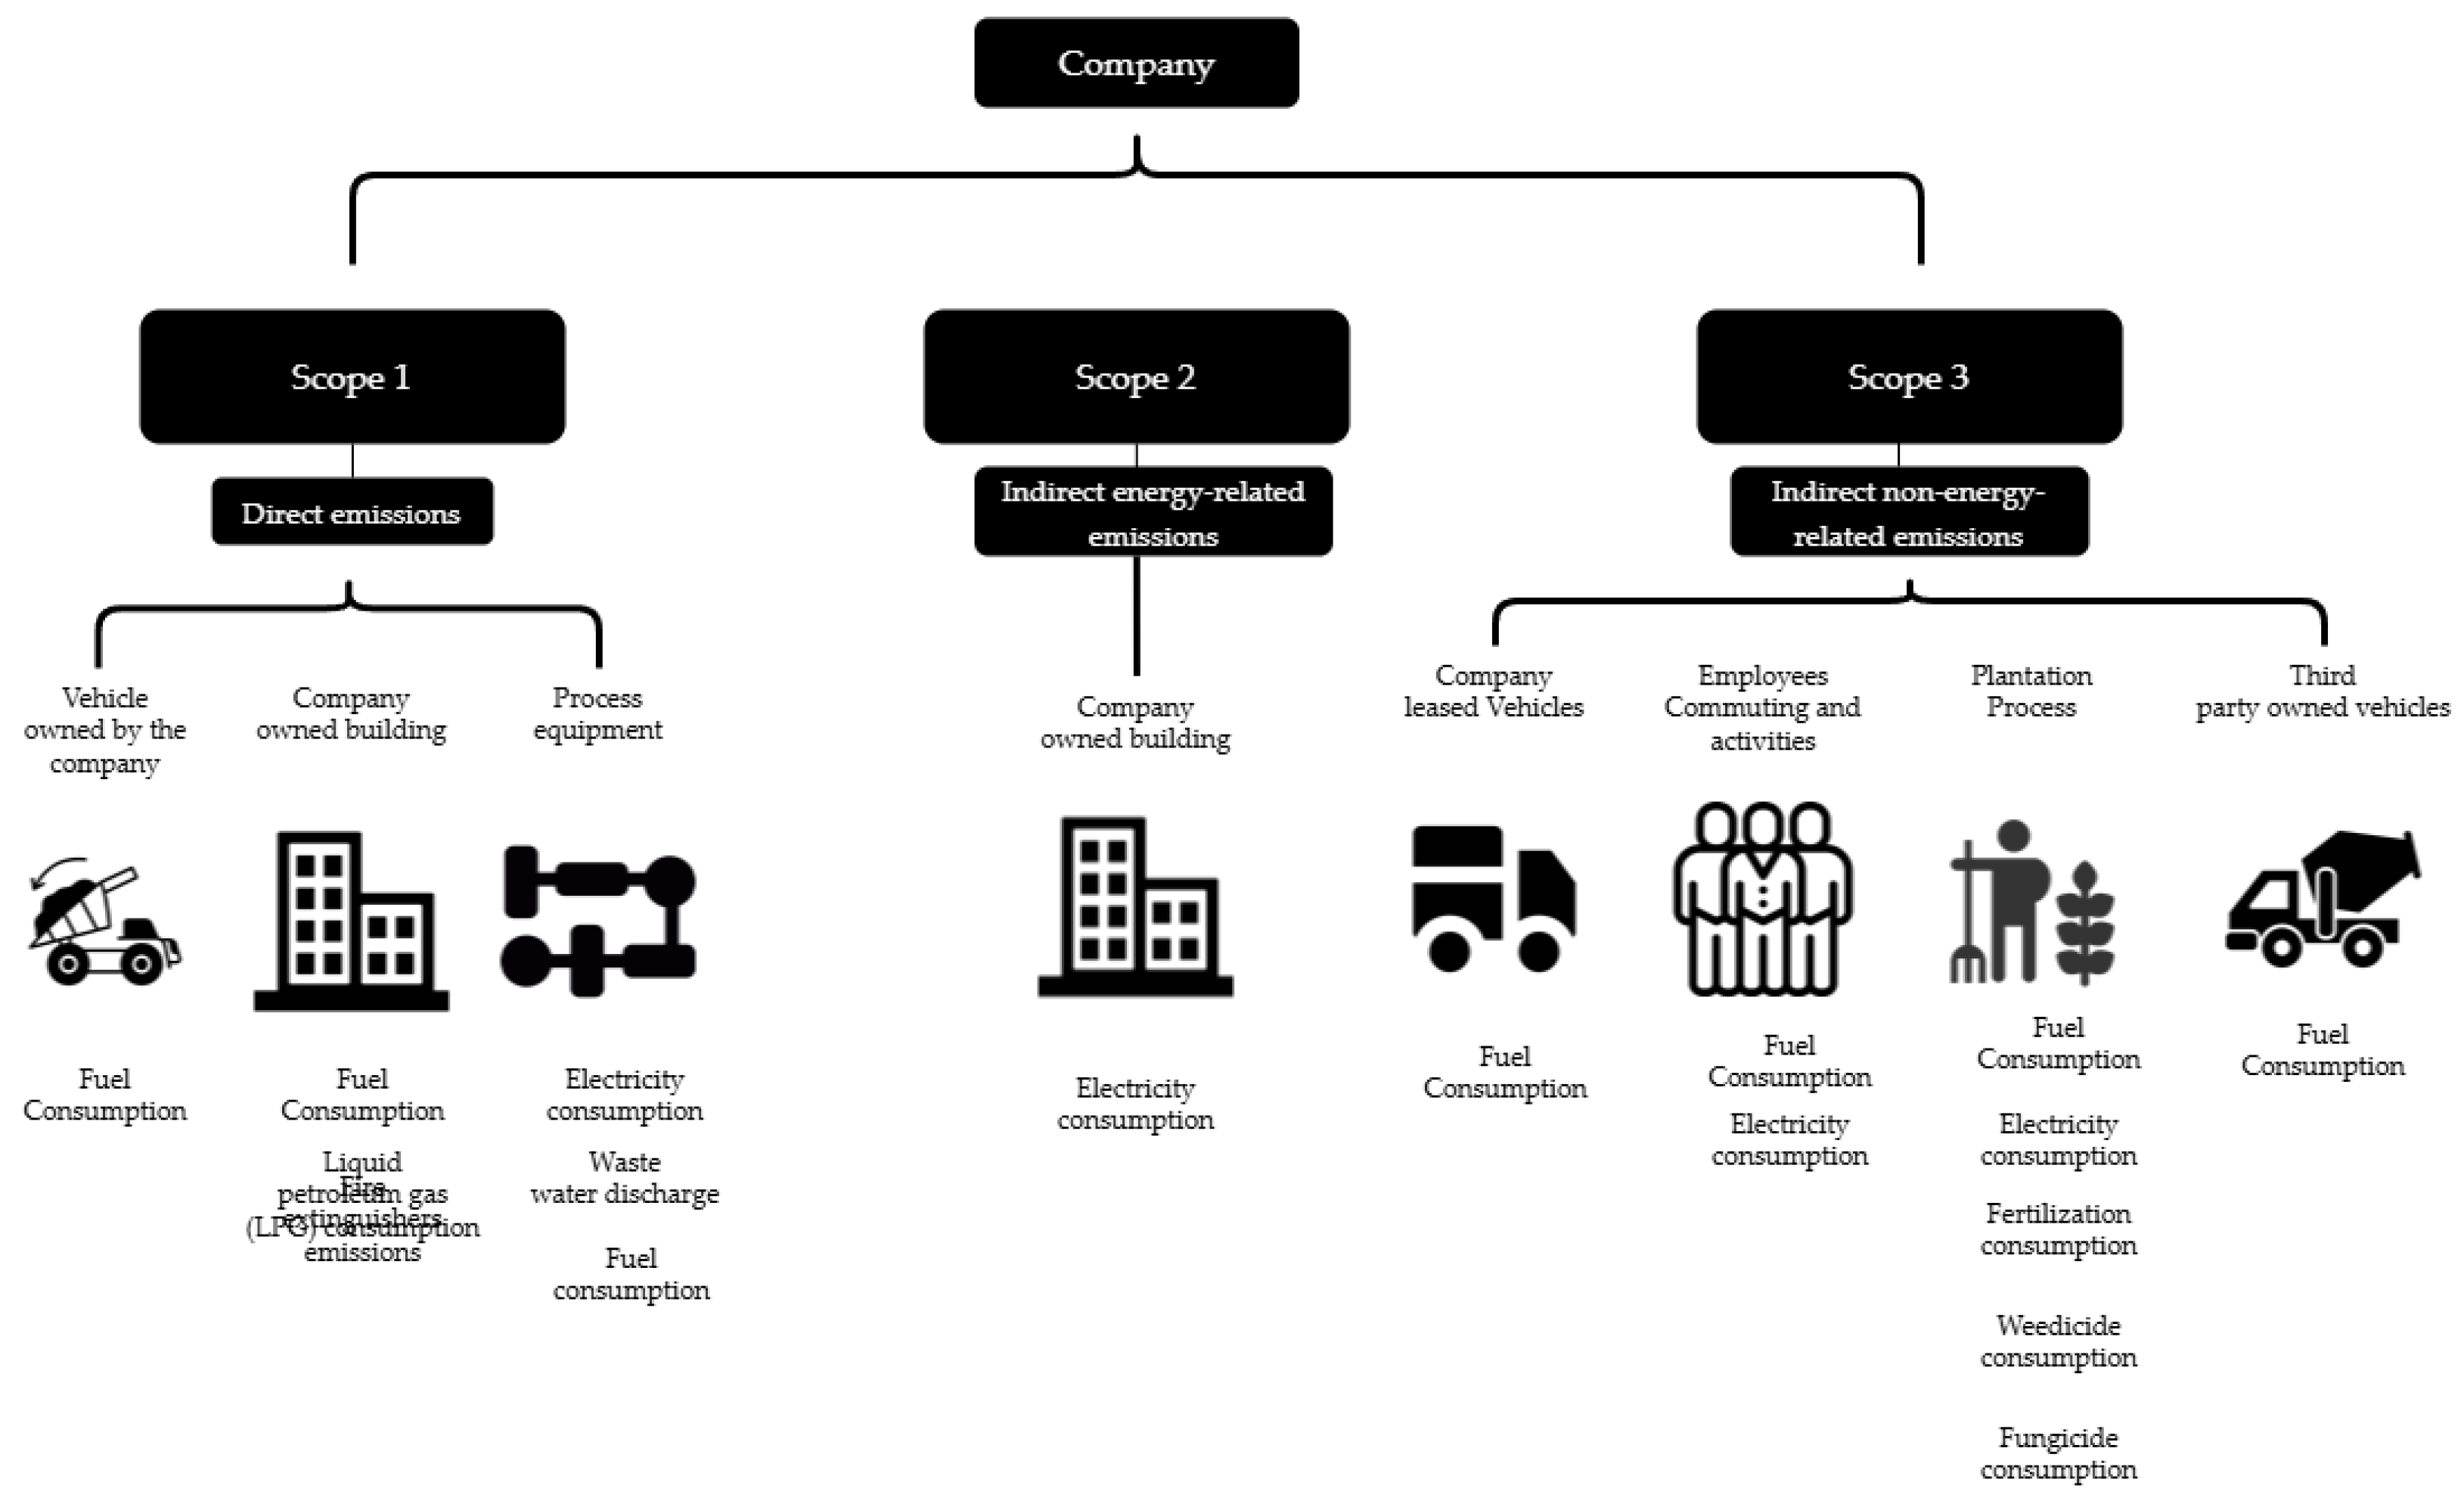
Figure 3.
Carbon emission flows (tCO₂e) in the rubber plantation company.
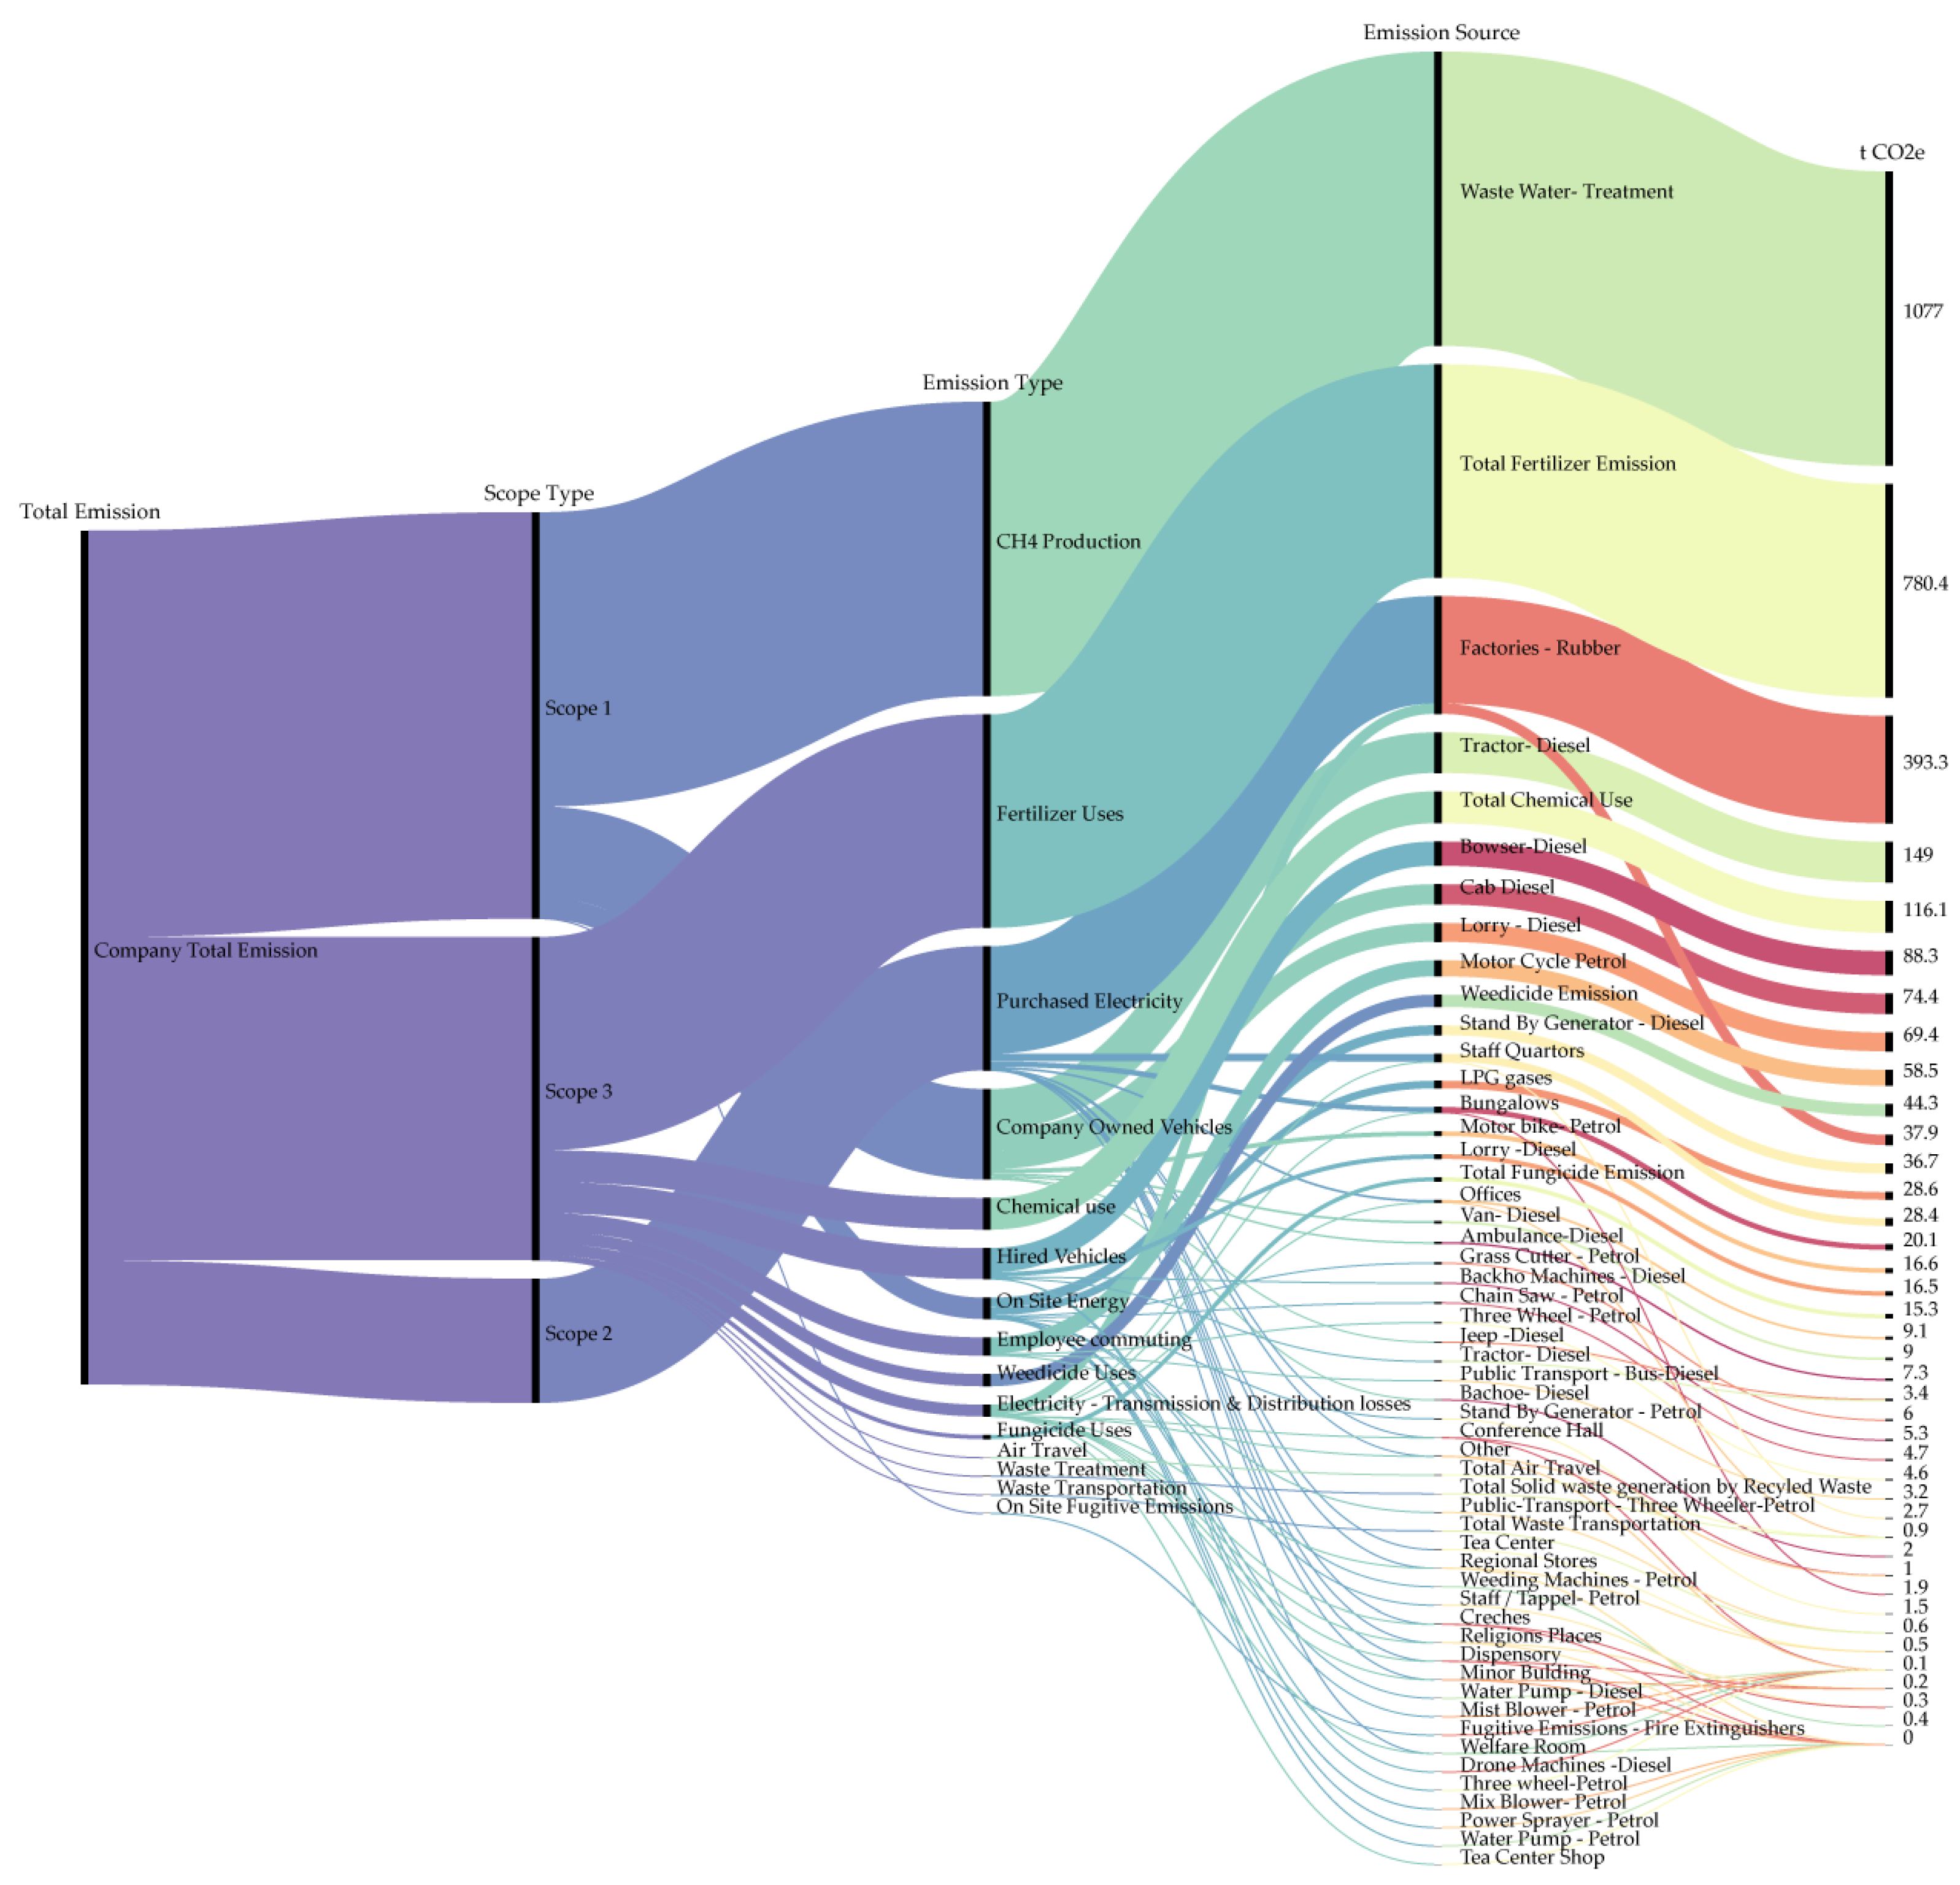
Figure 4.
Scope 1 emission flows (tCO₂e) in a rubber plantation company.
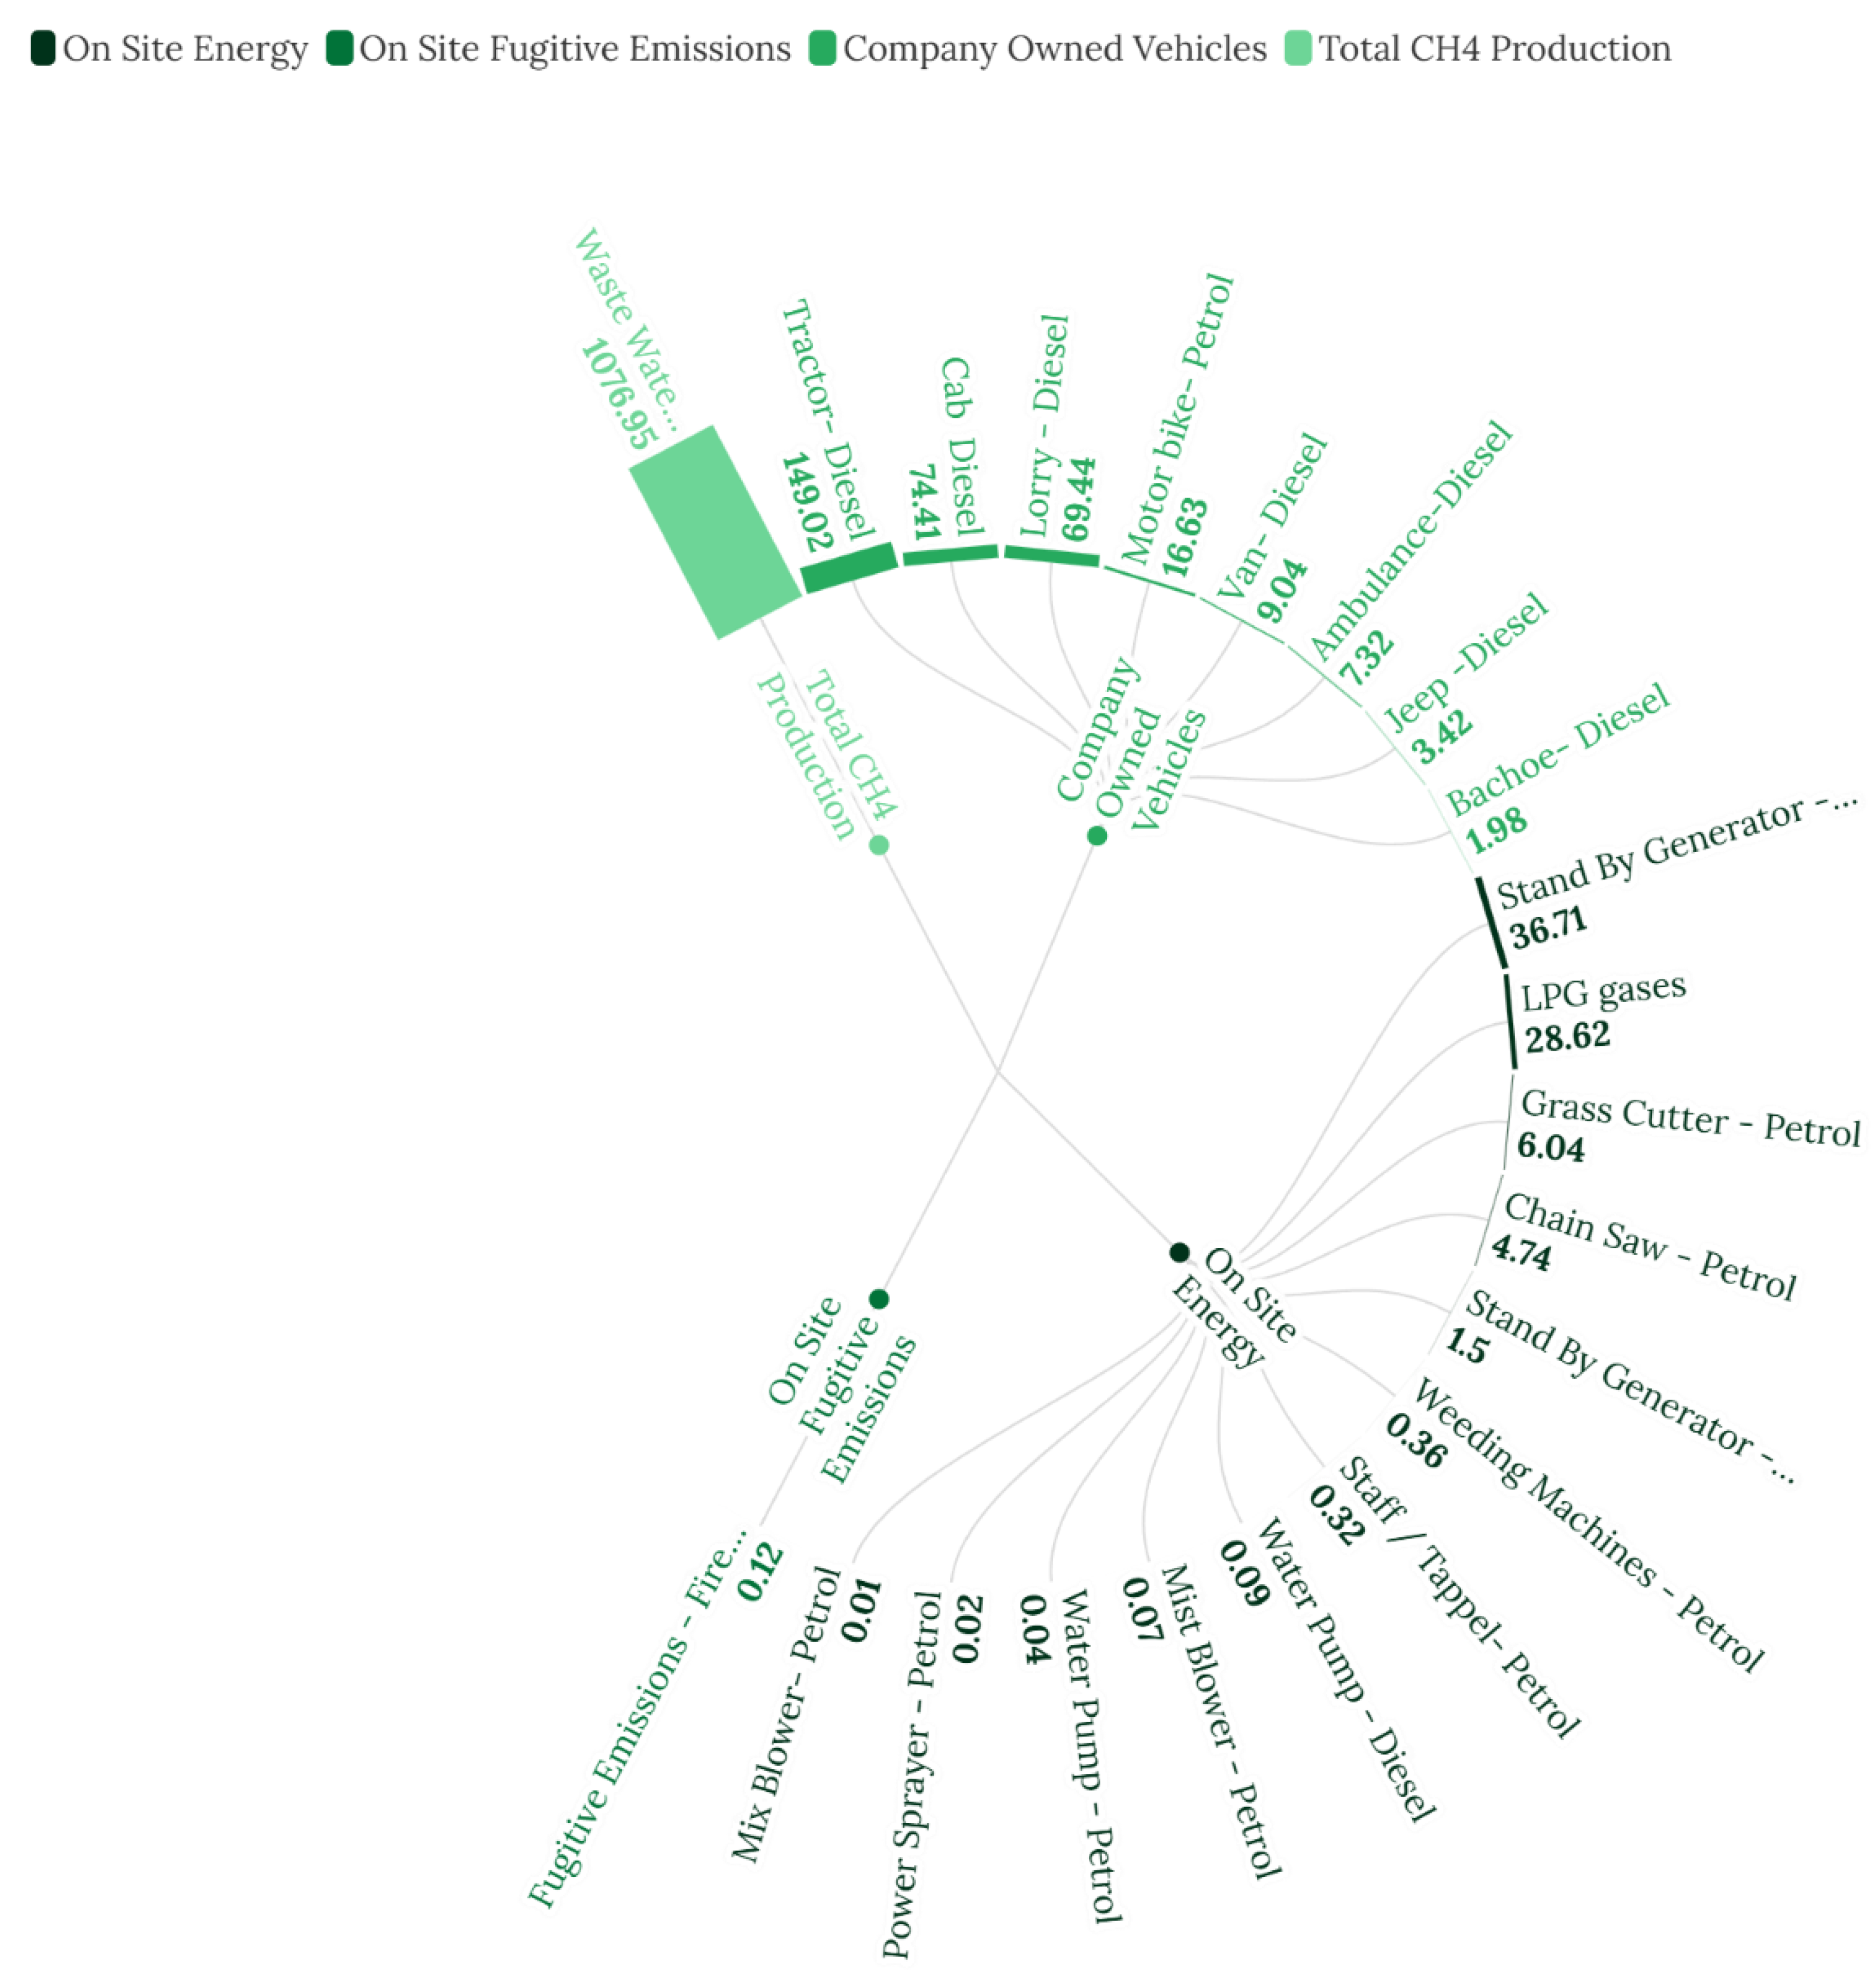
Figure 5.
Scope 2 emission flows (tCO₂e) in a rubber plantation company.
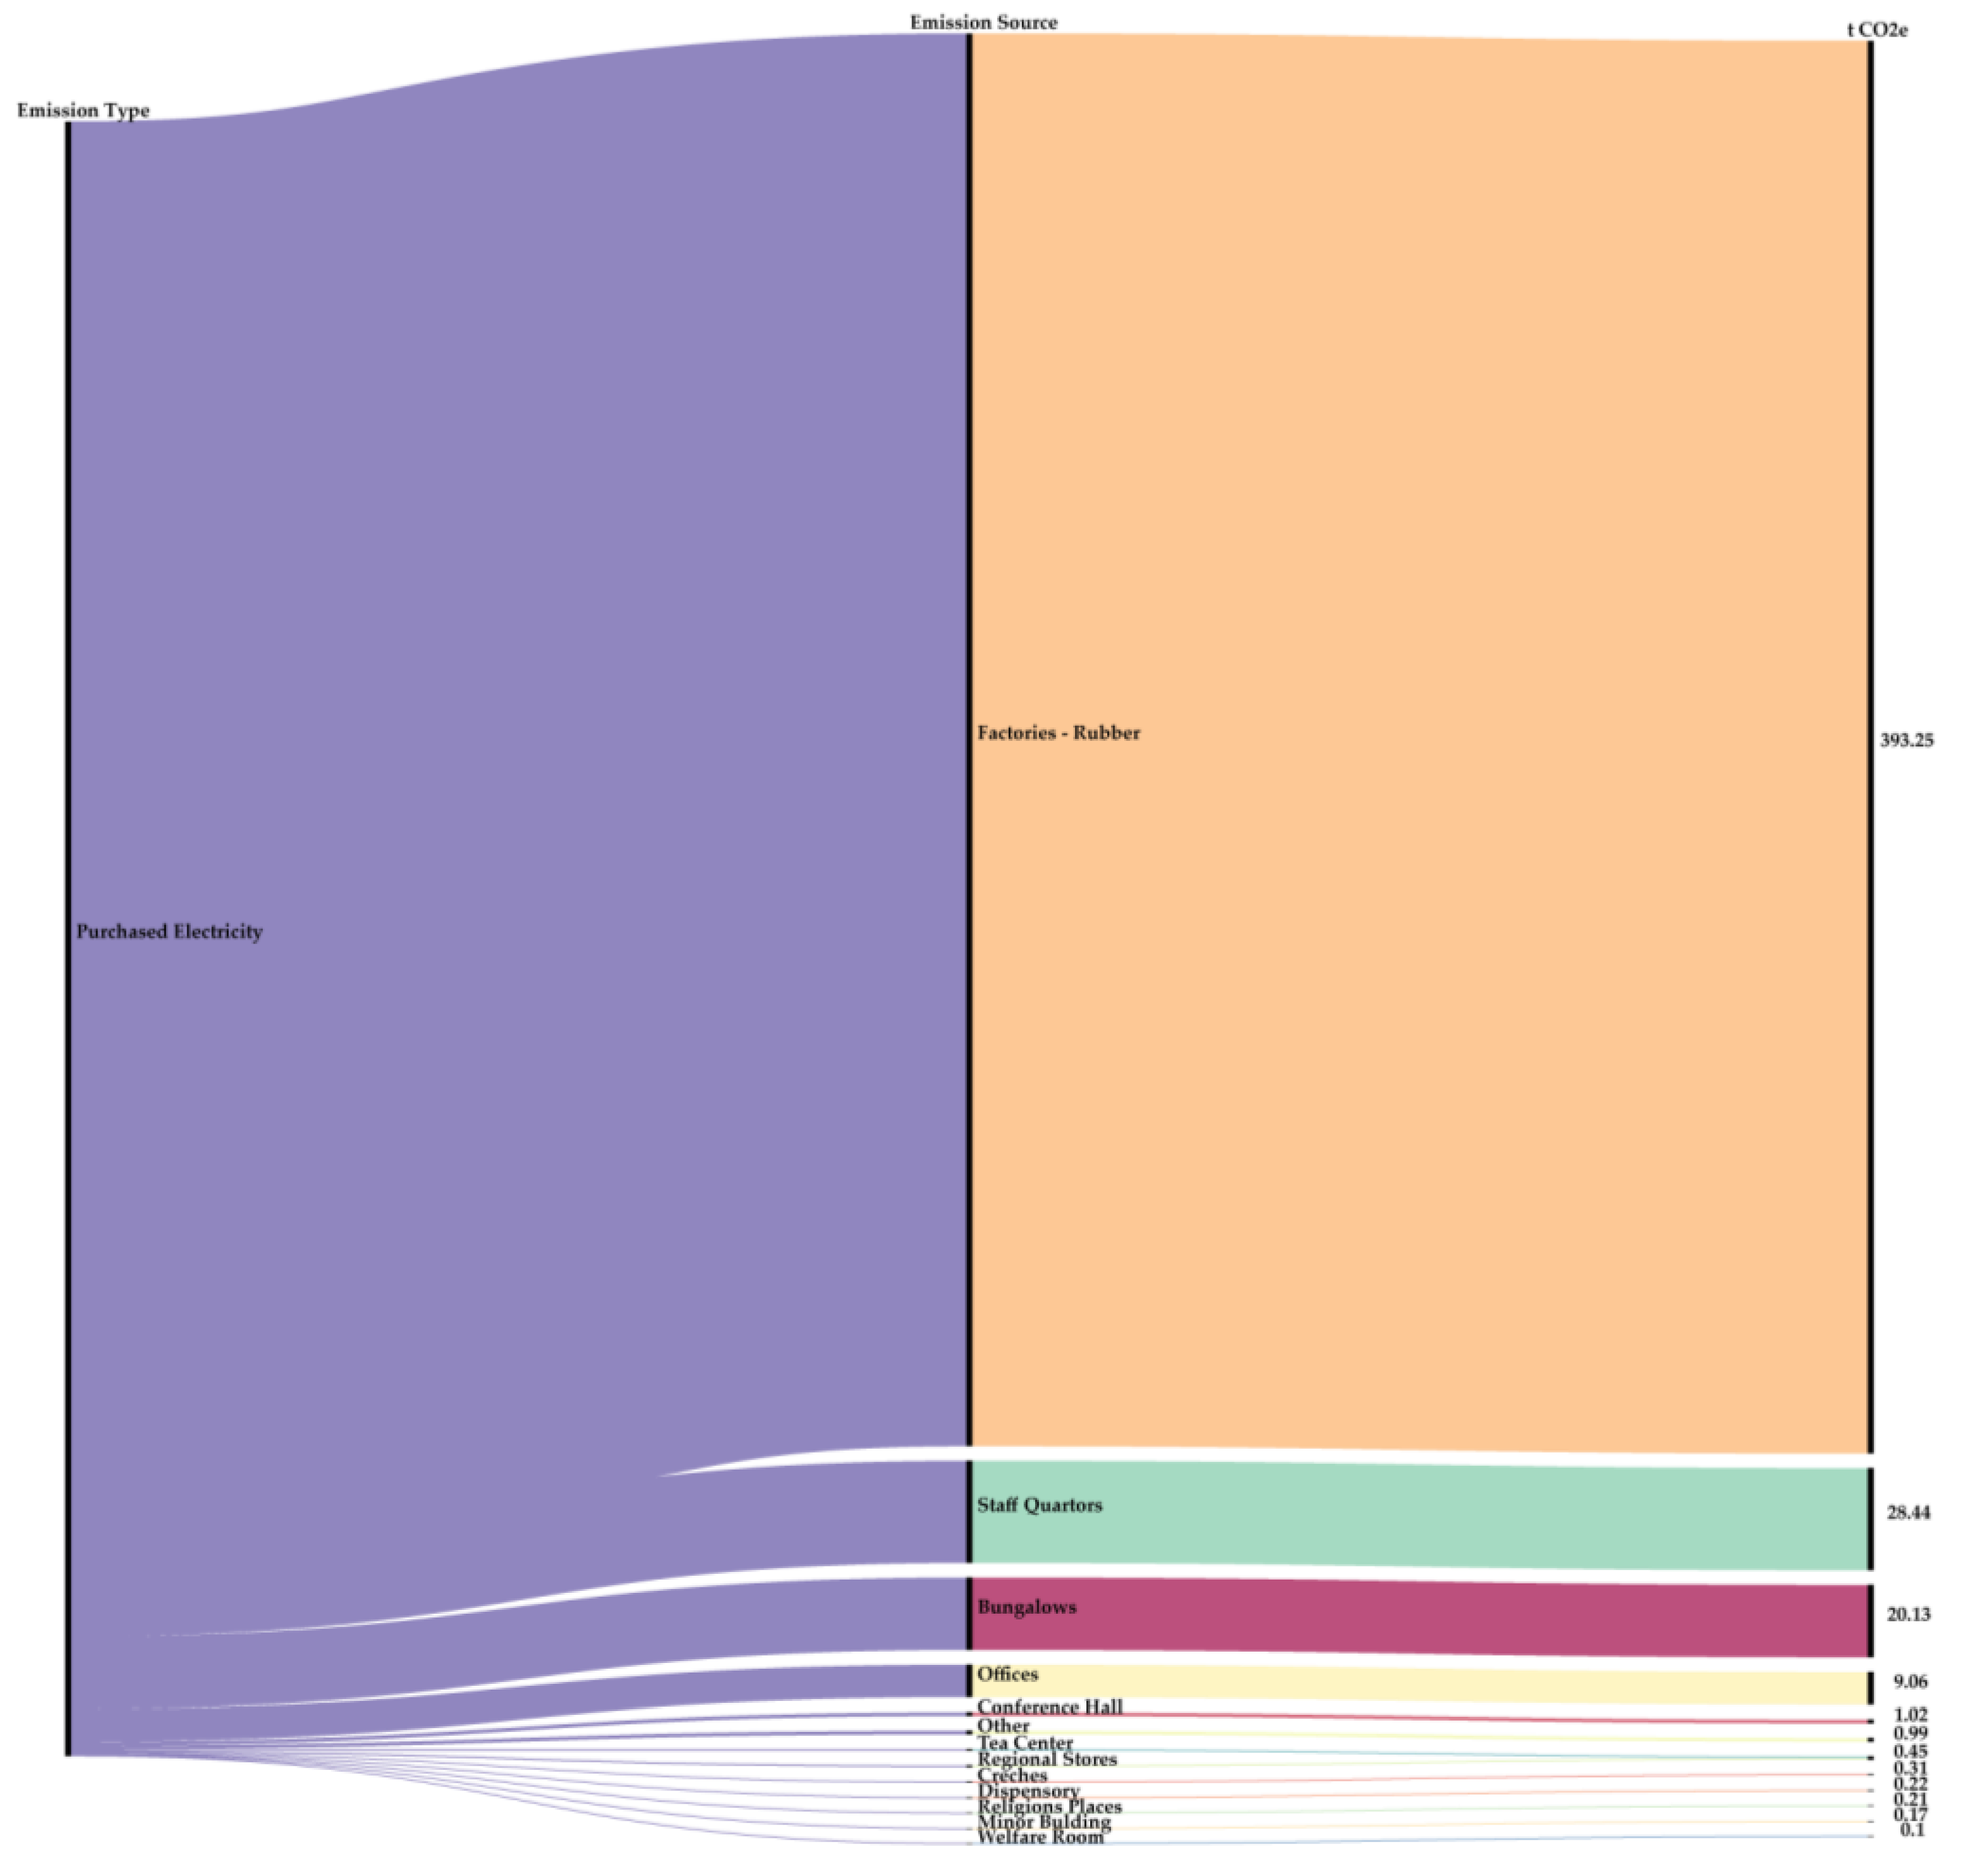
Figure 6.
Comparative annual carbon footprint (tCO₂e ha⁻¹ yr⁻¹) of selected agricultural crops under similar agroclimatic conditions in Sri Lanka, showing the results of this study alongside those reported in previous research.
Figure 6.
Comparative annual carbon footprint (tCO₂e ha⁻¹ yr⁻¹) of selected agricultural crops under similar agroclimatic conditions in Sri Lanka, showing the results of this study alongside those reported in previous research.
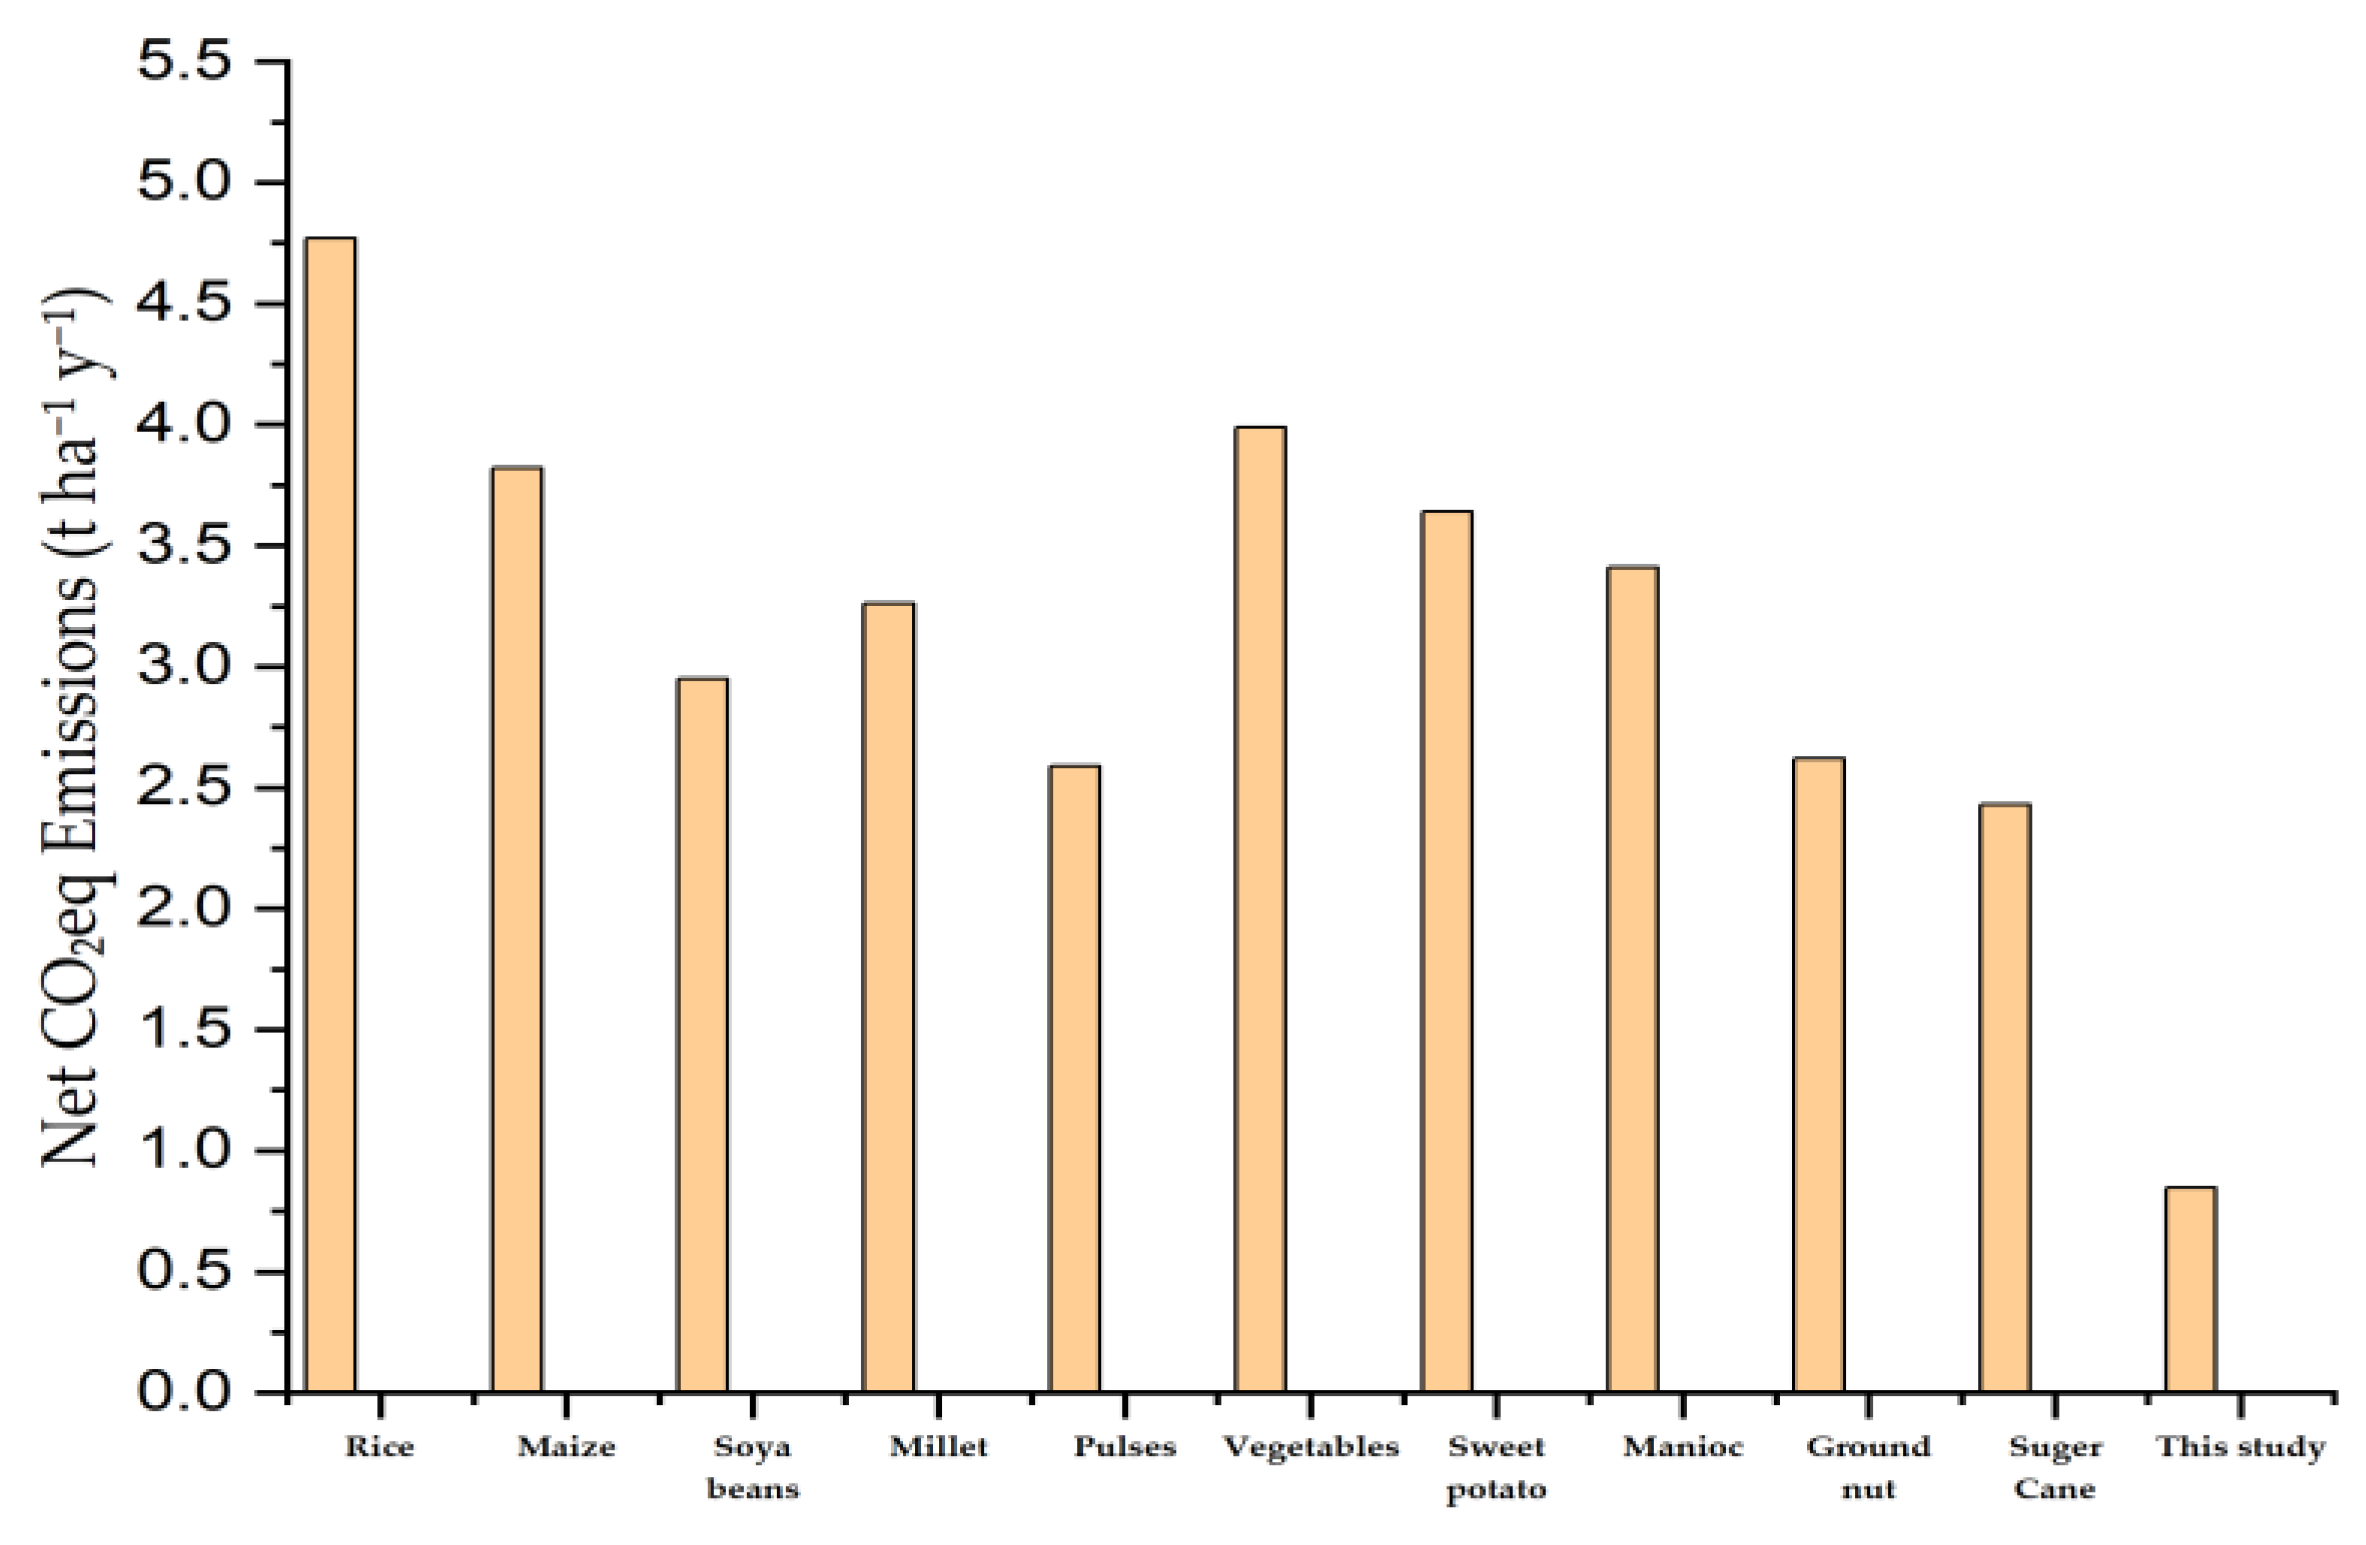

Table 1.
Data on the activities of a rubber plantation company in 2023.
| Emission type | Activity | Data | Unit | Source |
|---|---|---|---|---|
| Scope 1 | Use of the diesel generator | 13,804 | L | Running chart |
| Use of the petrol generator | 645 | L | Running chart | |
| Use of the LPG gases | 10 | tonnes | Running chart | |
| Use of petrol equipment’s and machines | 4,983 | L | Running chart | |
| Use of fugitive emissions - fire extinguishers | 120 | kg | Running chart | |
| Use of factory owned diesel vehicles | 118,621 | L | Running chart | |
| Use of factory owned petrol motor bike | 7,093 | L | Running chart | |
| Discharge of waste water | 75,479,359 | L | Running chart | |
| Scope 2 | Purchased electricity | 1,063,145 | kWh | Electricity bills |
| Scope 3 | Consumption of weedicide | 4,527 | kg | Running chart |
| Consumption of fungicide | 1,446 | kg | Running chart | |
| Consumption of fertilizer | 468,107 | kg | Running chart | |
| employee commuting use of staff own vehicles | 26,905 | L | Questionnaire | |
| Employee commuting use of public transport | 218,405 | km | Questionnaire | |
| Hired vehicles | 42,736 | L | Invoices | |
| Air travel | 2 | Number of travels | Invoices | |
| Waste transportation | 967 | km | Questionnaire | |
| Solid waste generation | 43 | tonnes | Invoices | |
| Chemical use | 141,117 | kg | Running chart |
Table 2.
Scope 1 emission sources and their consumption on the rubber plantation estate.
| Emission source | Amount of consumption | Unit |
|---|---|---|
| On site energy | ||
| Stand by generator - diesel | 13804.00 | L |
| Stand by generator - petrol | 645.00 | L |
| Water pump - diesel | 35.00 | L |
| LPG gases | 9.74 | tonnes |
| Grass cutter - petrol | 2574 | L |
| Chain saw - petrol | 2022.75 | L |
| Mix blower- petrol | 4.00 | L |
| Power sprayer - petrol | 10.00 | L |
| Staff / tappel - petrol | 137.50 | L |
| Mist blower - petrol | 28.00 | L |
| Weeding machines - petrol | 155.50 | L |
| Water pump - petrol | 16.00 | L |
| Fugitive emissions | ||
| Fire extinguishers | 120.00 | kg |
| Company owned vehicles | ||
| Ambulance - diesel | 2751.40 | L |
| Lorry - diesel | 26112.00 | L |
| Cab - diesel | 28291.57 | L |
| Tractor - diesel | 56037.00 | L |
| Motor bike - petrol | 7092.82 | L |
| Jeep - diesel | 1286.00 | L |
| Van - diesel | 3400.40 | L |
| Bachoe - diesel | 743.00 | L |
| Wastewater treatment | ||
| CH4 | 38462.61 | kg |
Table 3.
Scope 2 emissions from purchased electricity consumption across various facilities in the rubber plantation organization.
Table 3.
Scope 2 emissions from purchased electricity consumption across various facilities in the rubber plantation organization.
| Emission Source | Amount of consumption | Unit |
|---|---|---|
| Purchased electricity | ||
| Bungalows | 47050 | kWh |
| Staff quarters | 66489 | kWh |
| Offices | 21179 | kWh |
| Religions places | 495 | kWh |
| Factories - rubber | 919243 | kWh |
| Creches | 719 | kWh |
| Conference hall | 2389 | kWh |
| Tea center | 1059 | kWh |
| Dispensary | 512 | kWh |
| Other | 2319 | kWh |
| Welfare room | 223 | kWh |
| Regional stores | 1063 | kWh |
| Minor building | 404 | kWh |
Table 4.
Scope 3 emissions from rubber plantations.
| Emission Source | Amount of consumption | Unit | Emissions of carbon dioxide tCO₂e |
|---|---|---|---|
| Electricity - transmission & distribution losses | |||
| Bungalows | 4539.91 | kWh | 1.94 |
| Staff quartos | 6415.61 | kWh | 2.75 |
| Offices | 2043.64 | kWh | 0.87 |
| Religions places | 47.76 | kWh | 0.02 |
| Factories - rubber | 88698.89 | kWh | 37.95 |
| Creches | 69.38 | kWh | 0.03 |
| Conference hall | 230.52 | kWh | 0.10 |
| Tea center shop | 102.23 | kWh | 0.04 |
| Dispensary | 49.40 | kWh | 0.02 |
| Other | 223.76 | kWh | 0.10 |
| Welfare room | 21.52 | kWh | 0.01 |
| Regional stores | 102.57 | kWh | 0.04 |
| Minor building | 38.98 | kWh | 0.02 |
| Electricity - transmission & distribution losses | 102584.17 | kWh | 43.89 |
| Weedicide use | 4526.70 | kg | 44.32 |
| Fungicide use | 1446.00 | kg | 15.31 |
| Fertilizer use | 468106.50 | kg | 780.41 |
| Staff own vehicle transport | |||
| Motor cycle petrol | 24952.30 | L | 58.51 |
| Three wheel - petrol | 1953.00 | L | 4.58 |
| Public transport | |||
| Bus-diesel | 213287.20 | km | 3.23 |
| Three-wheeler-petrol | 5118.00 | km | 0.58 |
| Hired vehicles | |||
| Bowser-diesel | 33211.00 | L | 88.32 |
| Backho machines - diesel | 1985.00 | L | 5.28 |
| Drone machines -diesel | 20.00 | L | 0.05 |
| Tractor- diesel | 1278.00 | L | 3.40 |
| Lorry -diesel | 6207.50 | L | 16.51 |
| Three wheel-petrol | 34.00 | L | 0.08 |
| Air travel | 2.00 | travel | 0.88 |
| Waste transportation | 966.70 | km | 0.57 |
| Solid waste generation by waste recycled (rain guard polytene) waste |
42.59 | tonnes | 0.91 |
| Chemical use | 141117.12 | kg | 116.14 |
Table 5.
Summary of the Pareto analysis for emission types.
| Emission Type/source | Emissions of carbon dioxide tCO₂e |
% of total | Cumulative percentage [%] |
|---|---|---|---|
| CH4 | 1077 | 34.5 | 34.5 |
| Fertilizer | 780 | 25.0 | 59.4 |
| Purchased electricity | 455 | 14.6 | 74.0 |
| Owned vehicles transport | 331 | 10.6 | 84.6 |
| Chemical use | 116 | 3.7 | 88.3 |
| Hired vehicles | 114 | 3.6 | 92.0 |
| On site energy | 78 | 2.5 | 94.5 |
| Employee commuting | 67 | 2.1 | 96.6 |
| Weedicide | 44 | 1.4 | 98.0 |
| Electricity transmission & distribution losses | 44 | 1.4 | 99.4 |
| Fungicide | 15 | 0.5 | 99.9 |
| Waste | 1 | 0.0 | 99.9 |
| Air Travel | 1 | 0.0 | 100.0 |
| Total | 3125 | 100 | 100.0 |
Disclaimer/Publisher’s Note: The statements, opinions and data contained in all publications are solely those of the individual author(s) and contributor(s) and not of MDPI and/or the editor(s). MDPI and/or the editor(s) disclaim responsibility for any injury to people or property resulting from any ideas, methods, instructions or products referred to in the content. |
© 2025 by the authors. Licensee MDPI, Basel, Switzerland. This article is an open access article distributed under the terms and conditions of the Creative Commons Attribution (CC BY) license (http://creativecommons.org/licenses/by/4.0/).
Copyright: This open access article is published under a Creative Commons CC BY 4.0 license, which permit the free download, distribution, and reuse, provided that the author and preprint are cited in any reuse.


