
Submitted:
28 August 2025
Posted:
29 August 2025
You are already at the latest version
Abstract
Since the late 1970s, satellite missions have monitored Total Solar Irradiance (TSI), providing a long-term record of solar variability. The Digital Absolute Radiometer (DARA), onboard the Chinese FY3E spacecraft since 4 July 2021, contributes to extending this record. In this study, we evaluate DARA observations in both the World Radiometric Reference (WRR) and International System of Units (SI) scales, and compare them with VIRGO/PMO6, TSIS-1/TIM, and the Solar Irradiance Absolute Radiometer (SIAR), which is co-located on the same platform (FY3E/JTSIM). We identify and correct an artifact in the thermal aperture model caused by annual satellite maneuvers. A statistical analysis of the measurements in the SI or WRR scale shows that the mean value of the DARA TSI observations is lower than the ones recorded by the VIRGO/PMO6 and TSIS-1/TIM but higher than the SIAR measurements. We estimate a relatively small degradation of ∼49 ppm over 46 months due to the exposure of the instrument to the UV/EUV radiations. Finally, the corrected DARA observations are incorporated into the long-term TSI composite time series. Comparison with the PMOD/WRC composite shows only marginal differences (less than 0.015 W m−2), confirming the consistency and reliability of including the new TSI product (JTSIM-DARAv1).
Keywords:
total solar irradiance
; digital absolute radiometer (DARA)
; FY3E/JTSIM
; world radiometric reference (WRR)
; degradation UV/EUV
1. Introduction
Total Solar Irradiance (TSI) stands as a critical parameter for comprehending and predicting Earth’s climate system, exerting a pivotal role in establishing the planet’s energy balance of incoming and outgoing electromagnetic radiation. TSI is defined as the integrated solar energy flux across its entire spectrum at the mean Sun-Earth distance of 1 AU (the astronomical unit). The reliable and continuous monitoring of TSI’s absolute value is indispensable for understanding, reconstructing, and forecasting Earth’s climate. However, accurately measuring TSI has been a challenging task, requiring the deployment of radiometers on spacecraft that have continuously recorded observations since the late 1970s. discussed the TSI data records, contributing to our understanding of this important parameter. Studies, e.g., [1,2,3,4,5,6,7,8], have analysed TSI measurements recorded from overlapping missions since the 1980s.
To further advance TSI monitoring capabilities, the Joint Total Solar Irradiance Monitor (JTSIM) is based on a new generation of radiometers for long-term TSI monitoring in space. The JTSIM, developed and built by the Changchun Institute of Optics, Fine Mechanics and Physics Chinese Academy of Sciences (CIOMP/CAS) in Changchun, China, is embedded into the Chinese Fengyun-3E spacecraft. The Fengyun program, supported by the National Satellite Meteorological Center (NSMC) of China, aims to develop a series of Chinese meteorological spacecraft. The JTSIM comprises the Digital Absolute Radiometer (DARA) from PMOD/WRC, and the Solar Irradiance Absolute Radiometer (SIAR) from CIOMP/CAS. These two radiometers are mounted on the same pointing system to measure TSI accurately. The DARA is an electrical substitution radiometer consisting of three cavities, cavity A, B, and C. Two cavities (nominal and backup) are operated in closed loop to match the temperature rise of the third (reference) cavity, which remains closed and is heated electrically at a constant rate. The DARA is the latest type of radiometers developed by PMOD/WRC, featuring several innovations compared to the previous generation. The SIAR employs an electrically calibrated differential heat-flux transducer with a cavity for efficient radiation absorption [9].
Here, we evaluate the TSI measurements recorded by the DARA. A previous study [10] has already discussed the radiometer’s characteristics (e.g., cavity reflectivity, radiative loss, aperture size), the pre-flight calibration of the first light and the data reduction from raw observations to Level 1. The nominal cavity is alternately shielded and exposed to the sun by periodically activating the shutter every 15 seconds. The backup cavity is operated in sync with the nominal cavity during one orbit every 10 days to track degradation of the nominal cavity but remains closed otherwise. Cavity B is assigned for nominal, C for backup, and A for reference, respectively. Cavity assignment can be changed freely, e.g. to use the reference channel for degradation tracking of the backup channel. The cavities are arranged in a regular triangle which differs from older radiometer configurations developed at PMOD such as the PMO6 on board the VIRGO/SOHO mission. The new design offers enhanced redundancy and degradation tracking capabilities. Other design improvements reduce internal stray light, and improve the equivalence of electrical and optical heating [10,11] with respect to the PMO6. The different duty cycles of cavities A, B, and C are used for modelling the degradation of the cavity absorptance due to exposure to UV/EUV radiation.
In this study, we focus on the irradiance measurements and the time-frequency analysis of the TSI time series from the first light (18th of August 2021) to the 4th of April 2025. The observed solar features are compared with other TSI products recorded by other active missions (i.e. VIRGO/SOHO or TSIS-1/TIM). The DARA TSI measurement is expressed in the World Radiometric Reference (WRR) scale, which is a conventional scale established by the World Meteorological Organization (WMO) in 1977 and maintained by the Physikalisch-Meteorologisches Observatorium Davos—World Radiation Center (PMOD/WRC) in Switzerland. The DARA TSI readings are offset by Wm−2 if the WRR-to-SI ratio from [12] is applied. We use this conversion to the International System of Units (SI) in order to compare all the instruments with the same scale.
Moreover, we include the new product into the so-called TSI composite time series, incorporating all the observations available recorded by successive space instruments spanning 4 decades. As all satellite observations are limited in time, creating composites is a key aspect to the investigation of TSI fluctuations over several decades. Merging all these observations is a difficult exercise with both a scientific and a statistical challenge [13]. Various algorithms have produced the TSI composite time series either without [14,15,16] or with modelling the stochastic noise properties [13,17]. A comprehensive discussion of the robustness of these various methodologies is out of the scope of the presented work. Readers can refer to [13,17,18,19]. Here, we compare the TSI composite time series including the new DARA product with other available datasets.
The next section is an overview of the various past and currently active radiometers on board of spacecrafts together with the released TSI datasets. The Section 3 focuses on the new TSI products at various data rates (i.e., minute, 6-hourly and daily) and the comparison with TSI observations recorded by some currently active radiometers. We perform a time-frequency statistical analysis in order to understand the various noise backgrounds (i.e. solar noise, instrumental artifacts) influencing the data. We also discuss the influence of the degradation of the radiometer due to long exposure to UV/EUV light. The last section, Section 4, is the integration of the DARA TSI product (daily rate) within the TSI composite time series.
2. Description of the TSI Missions over the Past 45 Years
Table 1 displays the instruments and the processing centers providing the observations relative to the various missions past and present. The data processing, including corrections for all a priori known influences such as the distance from the sun (normalized to 1 AU), radial velocity of the sun, and thermal, optical, and electrical corrections, are usually implemented by each processing center, leading to Level 1 data. Most of these instruments observe on a daily basis, with occasional interruptions. Usually, one to three of them operate simultaneously, although some days are devoid of observations. Note that PMODv21a (also called PMO6v8) is the new VIRGO/SOHO dataset released in March 2021 by PMOD using a new software described in [20]. PREMOS (v1) is the released version described in [3]. ERBE/ERBS and HF/NIMBUS-7 ERB datasets are retrieved from the PMOD archive and the corrections made by C. Fröhlich, which are explained in [21].
We have not included the previous test missions using a similar radiometer as the FY3E/JTSIM/SIAR on board of FY3A/B/C satellites. For a comprehensive overview, the reader can refer to [22]. For this study, we had limited access to SIAR (degradation-corrected) observations.
3. Data Analysis
This section focuses mostly on the time-frequency analysis of the observations recorded by the DARA and some comparisons with other TSI products at different rates (i.e. daily, 6-hourly). The second subsection is the analysis of the degradation of the observations recorded by the nominal cavity due to the long exposure to UV/EUV.
3.1. Time-Frequency Analysis
We have re-evaluated the first light due to various changes in the modeling of the observations. These new values differ slightly from previous publications [23]. The first light took place on August 18 2021 (01h 22min UTC) for DARA at Wm−2 for cavity B. The cavity A recorded the first TSI value at Wm−2 at 13h 12 min UTC and Wm−2 on cavity C at 04h 56min UTC. All these values are in WRR scale. In the SI scale, the values are equal to Wm−2, Wm−2 and Wm−2 for cavities A, B and C respectively. Figure 1 shows the recorded TSI observations in WRR scale for channel B (blue), C (green) and A (red). The time series displays a good consistency without many outliers, because we select only the observations when the instrument is aligned with the sun based on the onboard sun tracker sensor.
A specific feature of this mission is the rotation of the JTSIM platform every 4 days in order to perform the Deep Space (DS) measurements which were only used during the commissioning phase in order to evaluate mainly the DS corrections [10,11]. During these measurements, the cavity of the radiometers exchanges radiation with a different thermal background in the shutter-open case, when the cavity radiates to deep space, compared to the closed case when the cavity’s thermal emission is reflected by the (gold-coated) backside of the shutter. The DS correction is then required to compensate the thermal background effect which is linked with the geometry of the cavity and the electronics of the instruments [10,24]. The platform movement is hard-coded in the spacecraft software system and can be neither interrupted nor overwritten. During this maneuver, the cavity temperature variations look like a seesaw dropping between 6K and 14K over a period between 1h30 and 5h. Figure 2 and Figure A1 (see appendices) display the cavity temperature with an emphasis on the large excursions. These variations are artificial due to the DS measurements and the satellite maneuvers. In particular, the temperatures decrease every year from May to August and then increase again. This specific feature results from a series of small maneuvers of the satellite to rotate the spacecraft and the solar panels.
We have identified an issue in the thermal aperture correction model, which fails to fully account for variations in TSI measurements caused by annual satellite maneuvers between May and end of August every year. These events introduce an artificial step in the data, estimated at approximately Wm−2. The offsets were computed by modeling the data as discrete steps and fitting them using a least-squares algorithm. To correct for this artifact, we apply these adjustments on 30 June each year, coinciding with the middle of the maneuver period. This correction is essential for isolating the true degradation signal driven by long-term UV/EUV exposure. Without it, the underlying degradation cannot be accurately assessed. It is worth emphasizing that both channels (nominal and backup) are affected by these artifacts. The precise phenomena inducing these step changes are still under investigation, and further improvements are ongoing. In the subsequent sections, these corrections are applied except where explicitly stated otherwise.
To further study the signals and processes recorded in the DARA observations, we perform a frequency analysis displayed in Figure 3. Previous works, e.g., [17,25,26,27], have analysed the Power Spectral Density (PSD) of the solar noise. This noise results from photospheric activity associated with granules varying at different timescales over a few hours (e.g., sunspots) to a decade (e.g., solar cycle), which generate fluctuations in the recorded irradiance values [27].
In the minute rate time series, we look at two frequency bands: G1 at [1-100] days and G2 at [1-60] minutes. The G1 frequency group is generally associated with the solar activity with events varying over days or longer [13,17,26,27]. The vertical dotted lines (black) F0, F1, F2 and F3 are associated with the frequencies at years, 27 days, 9 days and 7 days, respectively. These frequencies correspond to the year solar cycle, the solar rotation (27 days) and its third and fourth harmonics (9, 7 days). Below 1 Hz/day, we observe photospheric activity associated with P-modes ( ∼ 5 min), granulation (ranging from ∼ 6 to 16 minutes), meso-granulation (from ∼ 16 to 166 minutes), and supergranulation (extending up to 1 day) [25,26]. These solar processes generate fluctuations in TSI across various timescales. Additionally, [27] discuss the presence of instrumental noise at high frequencies (below 5 min), which is challenging to distinguish from solar noise.
In Figure 3, the SIAR frequency spectrum displays four prominent peaks at approximately 20 minutes, 26 minutes, 34 minutes, and 51 minutes (see orange box). The peak at 20 minutes is likely associated with the instrument’s recording window (20–25 minutes). The peak around 101 minutes, corresponding to the satellite’s orbital period, is also observed. The peaks at 34 minutes, and 51 minutes are likely sub-harmonics of the orbital period. The peak at 26 minutes is difficult to separate between the sub-harmonics of the orbital period and the recording rate of the instrument.Conversely, the DARA frequency spectrum (dark blue) shows fewer distinct frequency peaks, with the most notable one appearing at approximately 130 minutes. This frequency is associated with the harmonics of the DS measurements. Separating the contributions of frequencies arising from the satellite’s orbital motion, different solar rotation modes, and instrumental effects (e.g., cavity temperature variations) remains a significant challenge. In addition, the SIAR, DARA and VIRGO/PM06 frequency spectra exhibit a similar shape and slope (i.e. decreasing approximately in a power-law of ) in the G1 frequency band. As discussed in [17], the slope of the frequency spectrum is linked to colored noise (power-law noise), suggesting that VIRGO/PMO6, SIAR and DARA observations contain similar stochastic noise processes (i.e. white and power-law noises). The PSDs of the 6-hourly and daily DARA observation rates exhibit similar shapes and are discussed in the appendices (see Figure A2 and Figure A3). Note that the PSD of the TSI observations recorded by the VIRGO/PM06 radiometer shows the P-modes. Previous works [25,26] demonstrate that in the granulation, the meso-granulation and super-granulation no activity can be detected in the VIRGO/PMO6 spectrum due to the level of signal-to-noise ratio.
Now, Table 2 presents the statistics computed on the observations recorded by the DARA, VIRGO/PMO6, TSIS-1/TIM, and the SIAR at various sampling rates (i.e., minute, 6-hourly, and daily). The DARA observations are corrected from UV/EUV degradation. In the WRR scale or SI scale, the mean value of VIRGO/PMO6 is higher than the estimates of the DARA and SIAR. The statistics associated with the DARA measurements show that the observations are on average higher than the measurements recorded with SIAR. In SI scale, with the 6-hourly sampling rate, the observations recorded with TSIS-1/TIM is the highest in terms of mean value and the lowest estimate is associated with the SIAR.
3.2. Degradation-Correction
The degradation of satellite radiometers due to UV/EUV radiation has been extensively studied over the past three decades, leading to the development of various correction methods. Each TSI dataset in Table 1 consists of measurements from a continuously operated active channel and at least one backup channel, which allows scientists to assess degradation by comparing their readings. Recently, [20] introduced a machine learning (ML)-based algorithm that models degradation as a smooth, monotonic decrease without requiring filtering or pre-processing. This algorithm has been applied to correct observations from the VIRGO/PMO6 radiometer (channel A) and is now used for the DARA nominal cavity (channel B).
Figure 4 illustrates the estimated degradation of channel B, showing that the ML correction follows a smooth monotonic function. Unlike earlier VIRGO/PMO6 and PREMOS/PMO6 observations [3,20,28], no early increase phenomenon is observed in the ratio of the two channels. Interestingly, [29] previously reproduced this phenomenon in laboratory tests using the same coating as DARA, making its absence in the current data unexpected.
We cannot totally exclude that the early increase phenomenon which should last less than 10 exposure days ( e.g., 5 exposure days for the VIRGO/PMO6 [20]) could be somehow masked by the instrumental noise. We observe in Figure 4 that the degradation does not really start before mission days 700 (2024-01-01) with a smooth decreasing curve which continues until mission days 1250 (205-02-01) and totalizing a degradation of ∼ 49 ppm. Overall, this correction is relatively small for a period covering 46 months within the scatter of the observations of around ± 500 ppm.
Last, Figure 5 shows the difference between the daily PMO6v8 product and the degradation-corrected DARA TSI time series. Two linear trends are displayed: the green curve stops early 2023 and its slope is small (∼ 2 ppm/yr (i.e. below W.m−2.yr−2), whereas the red curve fits all the available data until April 2025 with a larger slope of (∼ 6 ppm/yr). This slight drift between the observations recorded by the two instruments is marginal.
4. TSI Composite Including the JTSIM-DARA Product
The TSI composite time series, constructed from satellite data since the late 1970s, is analysed to assess the integration of the DARA daily rate dataset. This study follows a time-frequency analysis similar to the approaches of [13] and [17]. The algorithm generating the TSI composite time series, developed by [17], is based on the former PMOD/WRC TSI composite [21]. In this work, the previous time series released by [13], [30] and [17] are called respectively Composite 1 (C1), Composite 2 (C2) and Composite 3 (C3). The product when including the daily DARA product is called Composite 4 (C4), and with the SIAR product Composite 5 (C5). Composite 6 (C6) is the latest TSI time series published by [31] and updated by [32]. The results are presented in Table 3. A comparative analysis of solar minima reveals discrepancies among the composites, particularly in the difference between Solar Cycles and (). Notably, C1 exhibits a positive difference for this transition, whereas C2, C3, C4, and C5 show negative or null trends, an issue previously discussed by [17] and linked to processing differences in early TSI observations. Despite these variations, C3, C4, and C5 show minimal differences at the solar minima level, with deviations below Wm−2, indicating that the inclusion of the DARA or SIAR datasets does not significantly alter the stability of composite.
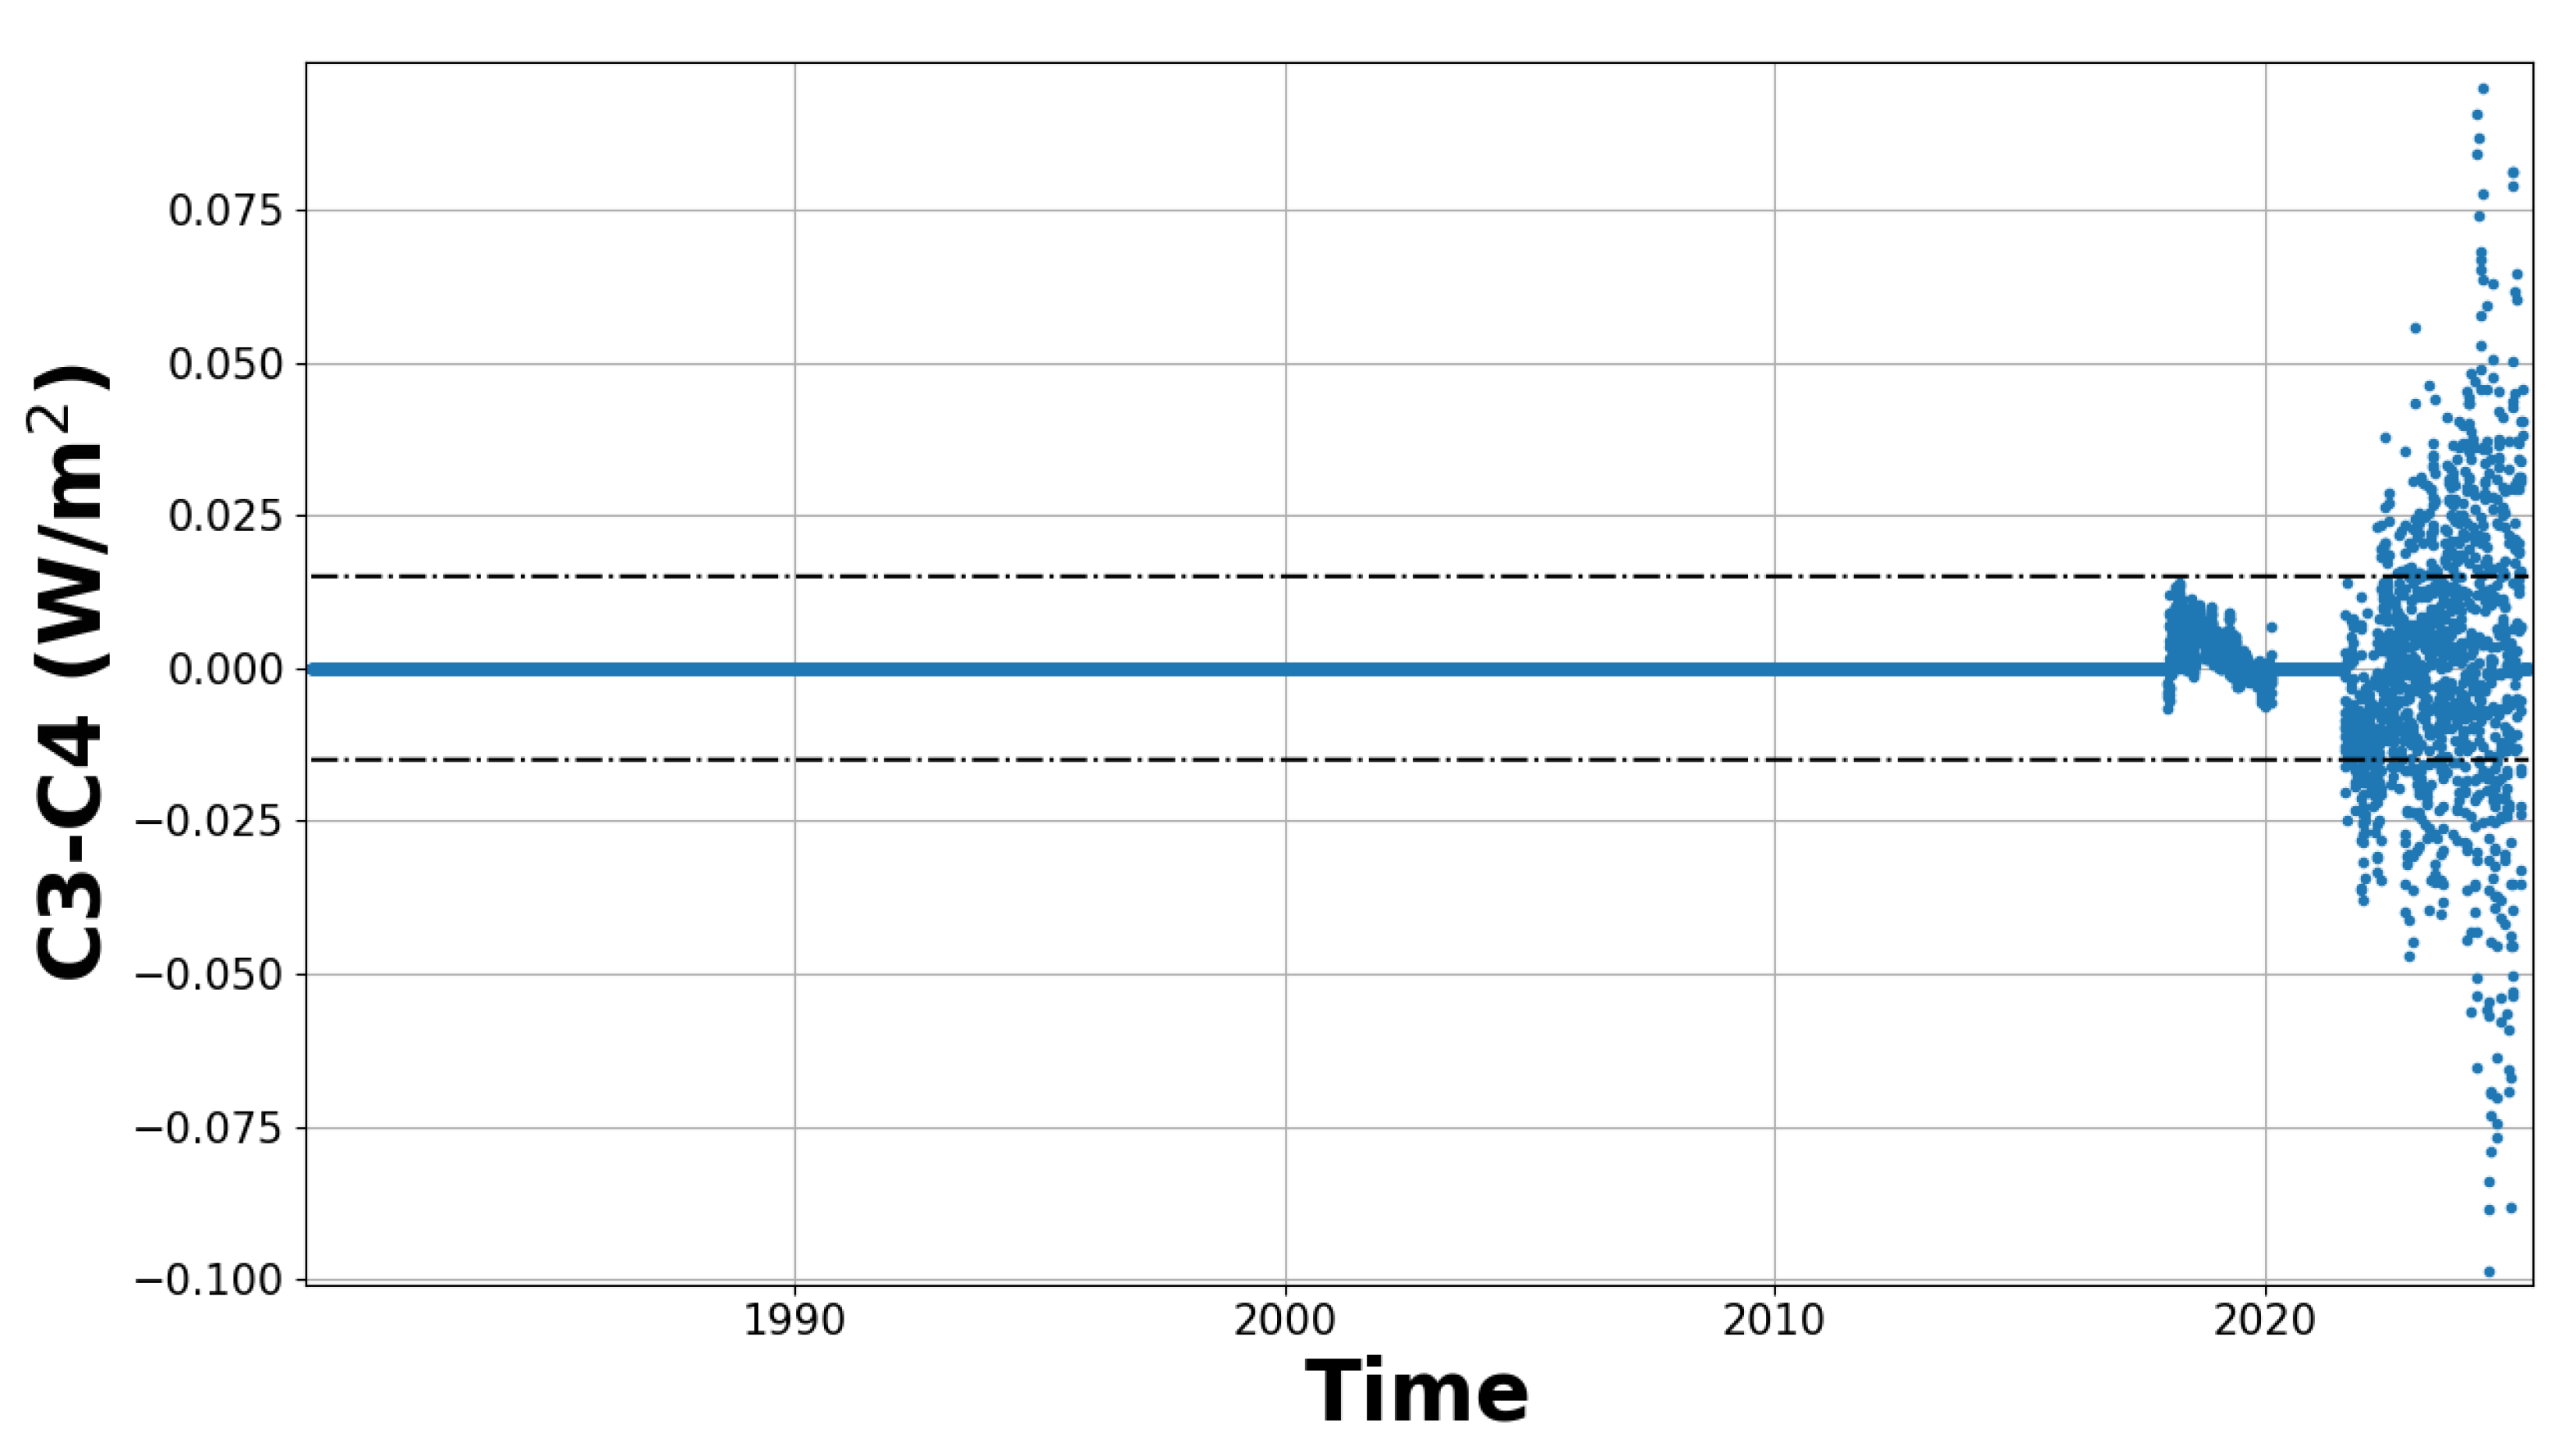
Figure 6 presents the TSI composite time series C3 and C4. The corresponding power spectral density (PSD) in the appendices — shown in Figure A4 — compares the frequency spectra of C1, C2, and C4. The analysis reveals that their power spectra are very similar, indicating that all three series contain comparable stochastic noise with similar amplitude. The difference between C3 and C4 is shown in Figure A5, also in the appendices. Approximately 90 % of the data points fall within ± Wm−2, with a mean value of about Wm−2 and an uncertainty of Wm−2. The large scatter of points (below ± Wm−2) arises from incorporating JTSIM-DARA observations into the fusion with TSIS-1/TIM and VIRGO/SOHO data. A slight discrepancy between the two time series is also visible from 2018 to 2020, which stems from the method used to construct the TSI composite when integrating the additional dataset.
5. Conclusions
This work focuses on a comprehensive analysis of TSI observations recorded by the DARA instrument onboard the FY3E spacecraft. The study encompasses various sampling rates, i.e. minute, (6-)hourly, and daily data, and includes comparisons with other active radiometers (i.e. VIRGO/PMO6 and TSIS-1/TIM) together with the SIAR which is also mounted on the same platform (JTSIM) as the DARA. We have identified an issue in the thermal aperture correction model, which fails to fully account for variations in TSI measurements caused by these satellite maneuvers each year. We have modelled and corrected the data accordingly. This correction is essential for isolating the true degradation signal driven by long-term UV/EUV exposure. Our study of the differences between the observations recorded by VIRGO/PMO6 and DARA shows that there is a marginal slope of ∼ 6 ppm/yr.
Moreover, we have only accessed to the filtered SIAR data for this study and therefore we cannot conclude on the sensitivity of the SIAR to the in-orbit maneuvers. The inter-comparison between instruments reveals that, in SI scale, the DARA mean value is below the one estimated for the observations recorded by the VIRGO/PMO6 and TSIS-1/TIM, but above the estimate with the SIAR observations. A similar conclusion can be drawn for the observations in WRR scale between DARA, SIAR and VIRGO/PMO6. Our work also discusses the evaluation of degradation caused by exposure to UV/EUV radiations in space, employing the algorithm developed by [20]. The results show a degradation of ∼ 49 ppm which is relatively small for a period covering 46 months since the spacecraft launch.
Finally, the DARA or the SIAR observations have been inserted in the TSI composite time series using the algorithm developed by [17]. The TSI composite gathers all the TSI observations recorded since the late 1970s. A comparison with the TSI composite released regularly by PMOD/WRC [33] showcases only marginal differences (i.e. below Wm−2). This result demonstrates the overall consistency and reliability of including the JTSIM-DARAv1 product into the composite. Looking ahead, future releases of the TSI composite time series by the PMOD team will consistently include the JTSIM-DARAv1 product, ensuring a robust and continuous record for the scientific community.
Author Contributions
Conceptualization, J-P.M., W.F., P.Z. and M.H.; methodology, J-P.M., W.F., P.Z. and M.H.; software, J-P.M., W.F., P.Z. and M.H.; validation, all co-authors; formal analysis, J-P.M., W.F., P.Z. and M.H.; investigation, J-P.M., W.F., P.Z. and M.H.; resources, J-P.M., W.F. and M.H.; data curation, J-P.M., D. W, D. Y., J.Q. and X. Y; writing—original draft preparation, J-P.M., W.F., D.P., S.K. and M.H.; writing—review and editing, J-P.M., W.F. and M.H.; visualization, X.X.; supervision, J-P.M., W.F., W.F., P.Z. and M.H.; project administration, W.F., W.F. and P.Z.; funding acquisition, J-P.M. and W.F. All authors have read and agreed to the published version of the manuscript.
Funding
Dr. J.-P. Montillet, Dr. W. Finsterle, Dr. M. Haberreiter gratefully acknowledge the support from the Karbacher-Funds. Dr. J.-P. Montillet. also thanks the Swiss Space Office for support via the PRODEX funds supporting the making of the DARA dataset. Dr. D. Wu, Dr. X. Ye, Prof. P. Zhu, Dr. D. Yang, Prof. W. Fang, Dr. J. Qi and Dr. P. Zhang acknowledge the National Nature Science Foundation of China (Grant Number 41974207) and CIOMP International Fund. This research is partially supported by the International Space Science Institute (ISSI) in Bern, through ISSI International Team project No.500 (Towards Determining the Earth Energy Imbalance from Space).
Data Availability Statement
The composite C3 can be obtained from the open archive repository [33,34,35]. It is also presented on (last accessed 09 June 2025) for additional information. The TSI composite C1 is available for downloading at (last accessed 10 November 2024). The composite C6 is available at (last accessed 09 June 2025). The data related to the monthly/daily mean sunspot numbers are retrieved from (last accessed 30th May 2025). TIM /SORCE, TCTE/TIM and TSIS-1/TIM time series are downloaded from (last accessed 02 June 2025). PREMOS (v1) can be accessed at (last accessed 10 November 2024). PMODv21a (also called PMODv8) is available at (last accessed 09 June 2025). The dataset has also been recently added to the open archive repository [36]. The DARA 6-hourly product (JTSIM-DARAv1) is released either via the PMOD website ( - see link to the ftp server) or via the open archive repository [37]. Note that two TSI products are released with and without any corrections.
Acknowledgments
We would like to acknowledge the help of Mr J. Vermeirssen in the development of this work.
Conflicts of Interest
conflicts of interest or state “The authors declare no conflicts of interest. The funders had no role in the design of the study; in the collection, analyses, or interpretation of data; in the writing of the manuscript; or in the decision to publish the results.
Appendix A Additional Figures and Discussions
Figure A2 displays the PSD of the 6-hourly rate for the DARA, SIAR and TSIS-1/TIM. The slopes of the spectrum associated with the various instruments are similar which means that similar stochastic noise processes (i.e. coloured and white noises) are contained in the observations, supporting our previous results with the minute rate products. The frequency spectrum of the TSIS-1/TIM and the DARA (or the SIAR) seem to be slightly shifted (i.e. less than 5 minutes) due to the large number of missing observations in the TSIS-1/TIM product which is supported by the lower rate (h) compared with the SIAR (h) or the DARA (h). In the red box, one observes some frequency peaks which are at approximately at 1 day, day and day. All these frequencies correspond to the sub-harmonics of the DS measurements performed every 4 days. However, the amplitude of the peaks is small, i.e. just above the noise floor, therefore the impact of the DS measurements is relatively negligible on the TSI time series.
Figure A1.
Cavity temperature in Kelvin (K). Zoom on one of the periods (04.2023 -10.2023) where the temperature decreased due to the satellite maneuver.
Figure A1.
Cavity temperature in Kelvin (K). Zoom on one of the periods (04.2023 -10.2023) where the temperature decreased due to the satellite maneuver.
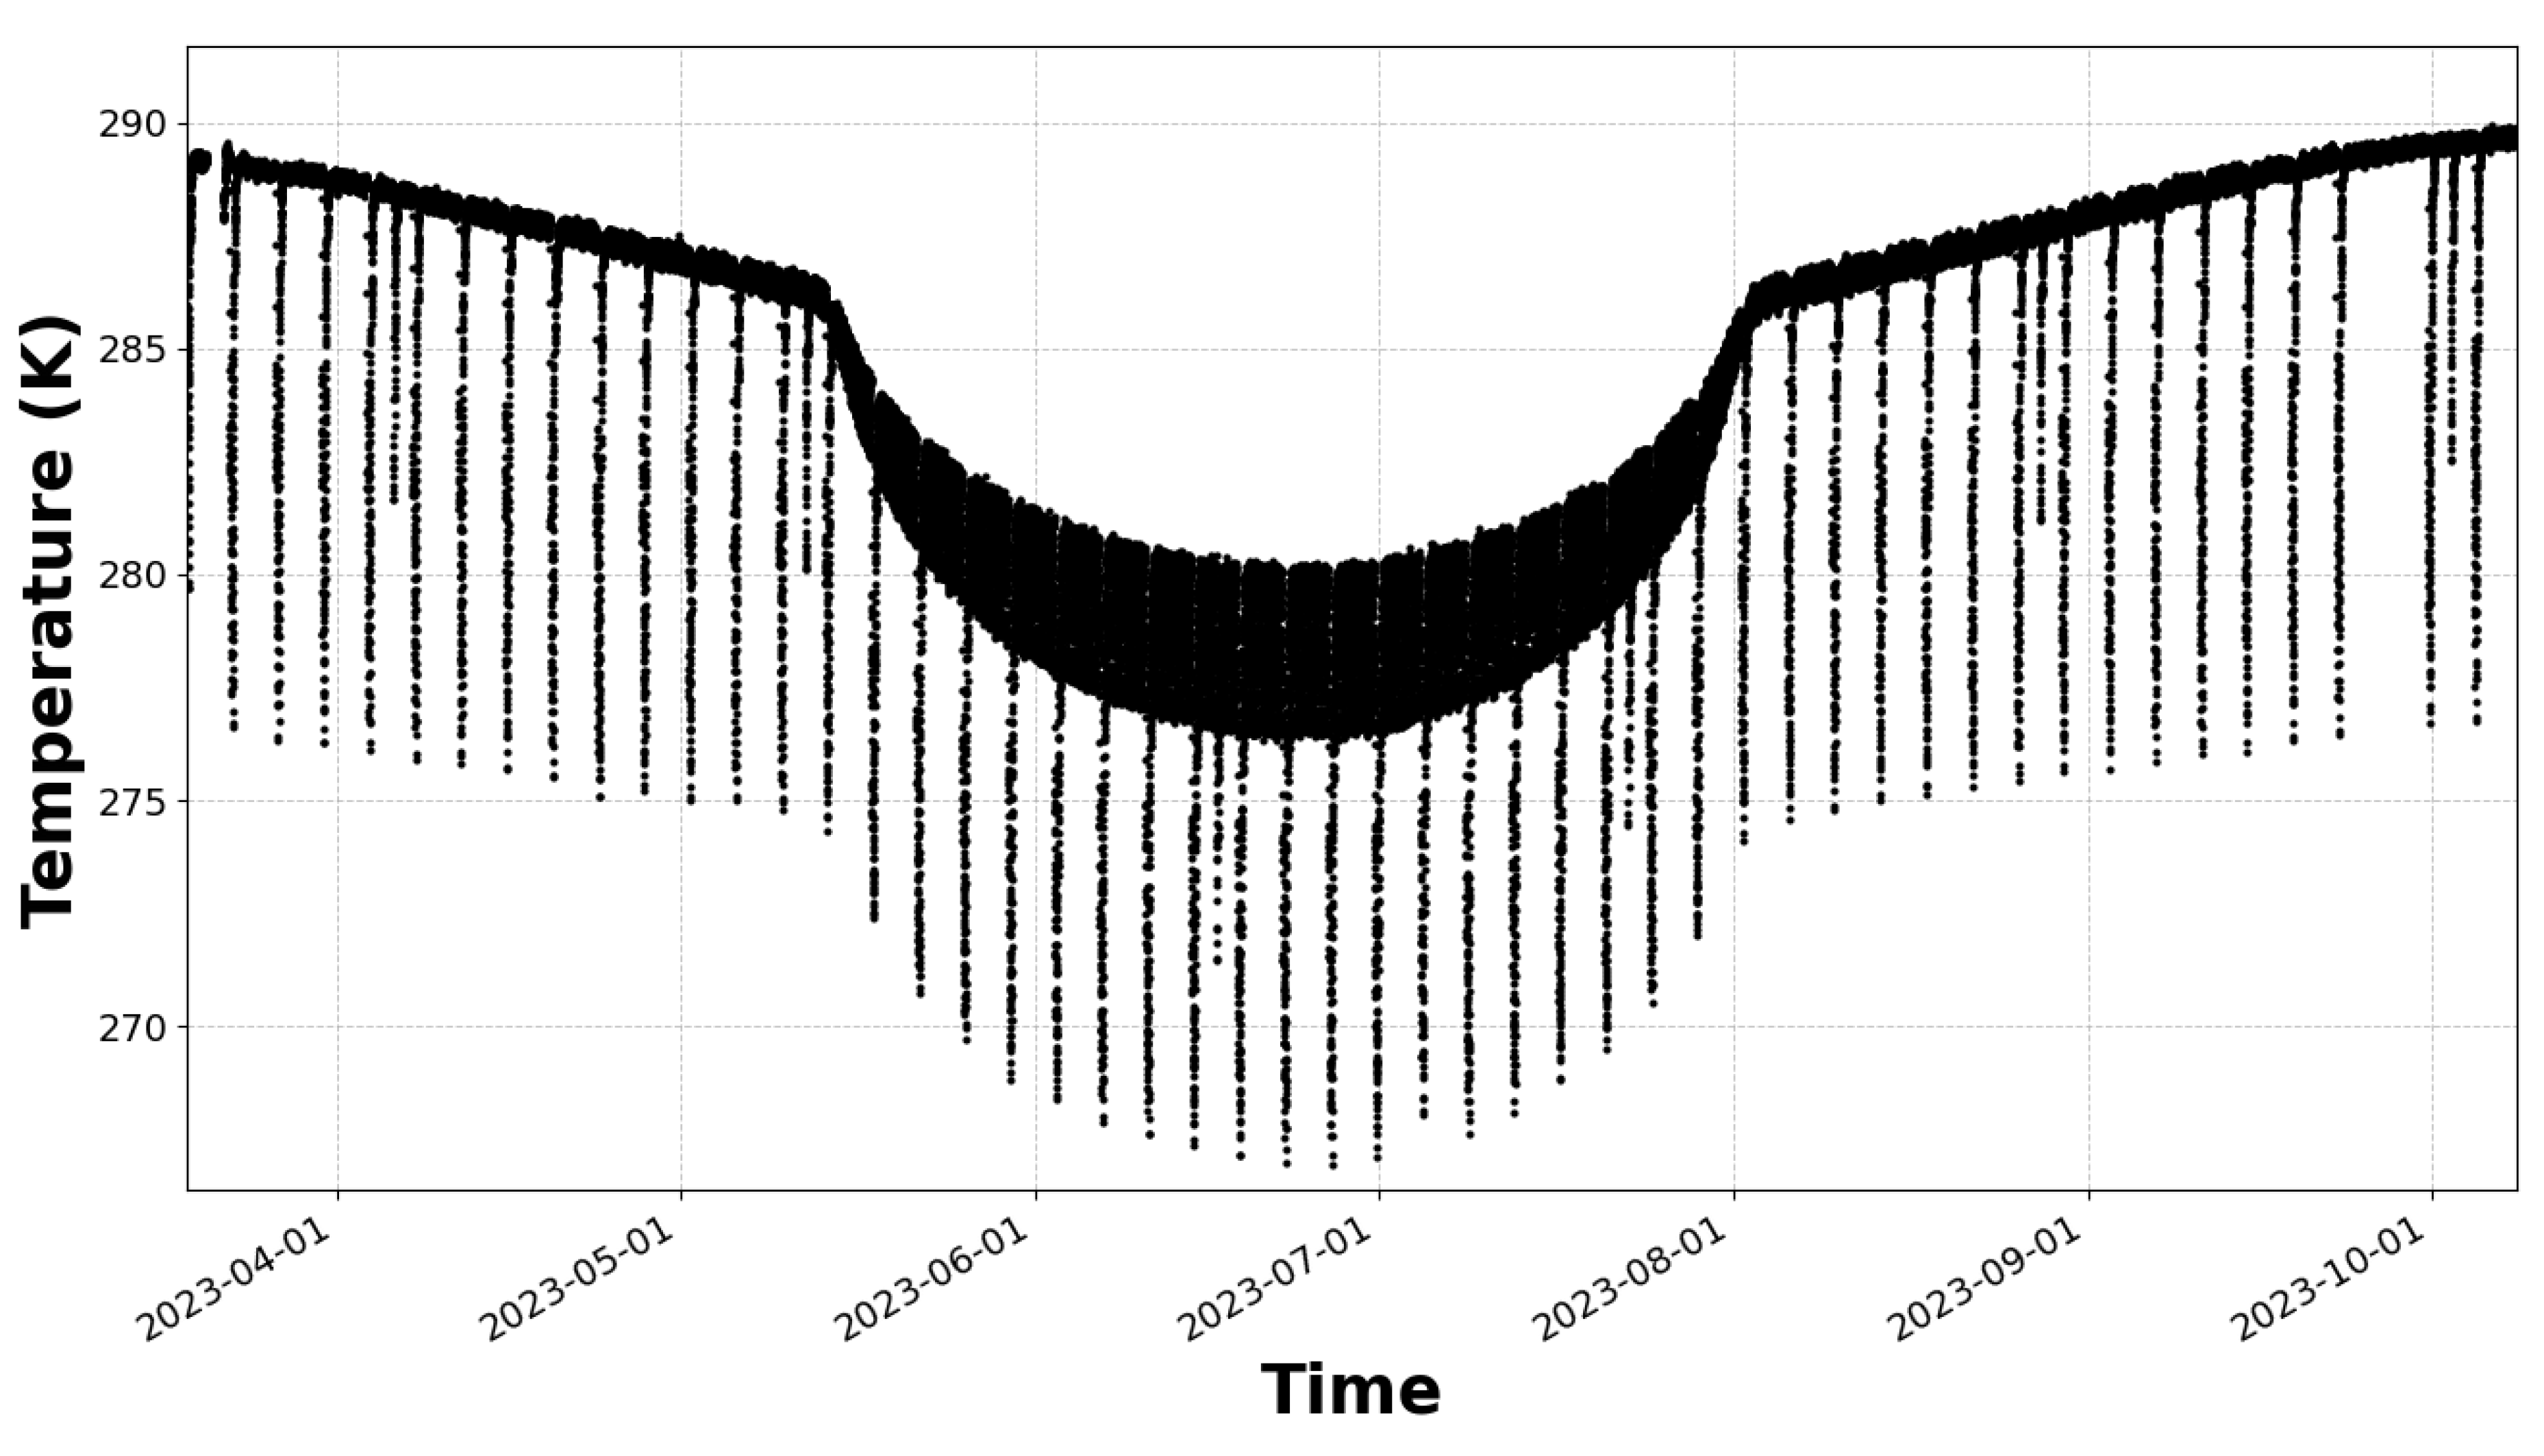
Figure A2.
Power spectrum analysis of the DARA 6-hourly rate TSI time series using the Welch’s method. We also display the 6-hourly data rate of the observations recorded by the SIAR and TSIS-1/TIM radiometers. We emphasize the frequency band G1 at [1-100] days. The black vertical dotted lines correspond to 27 days (F1), 9 days (F2) and 7 days (F3) (shown for context).
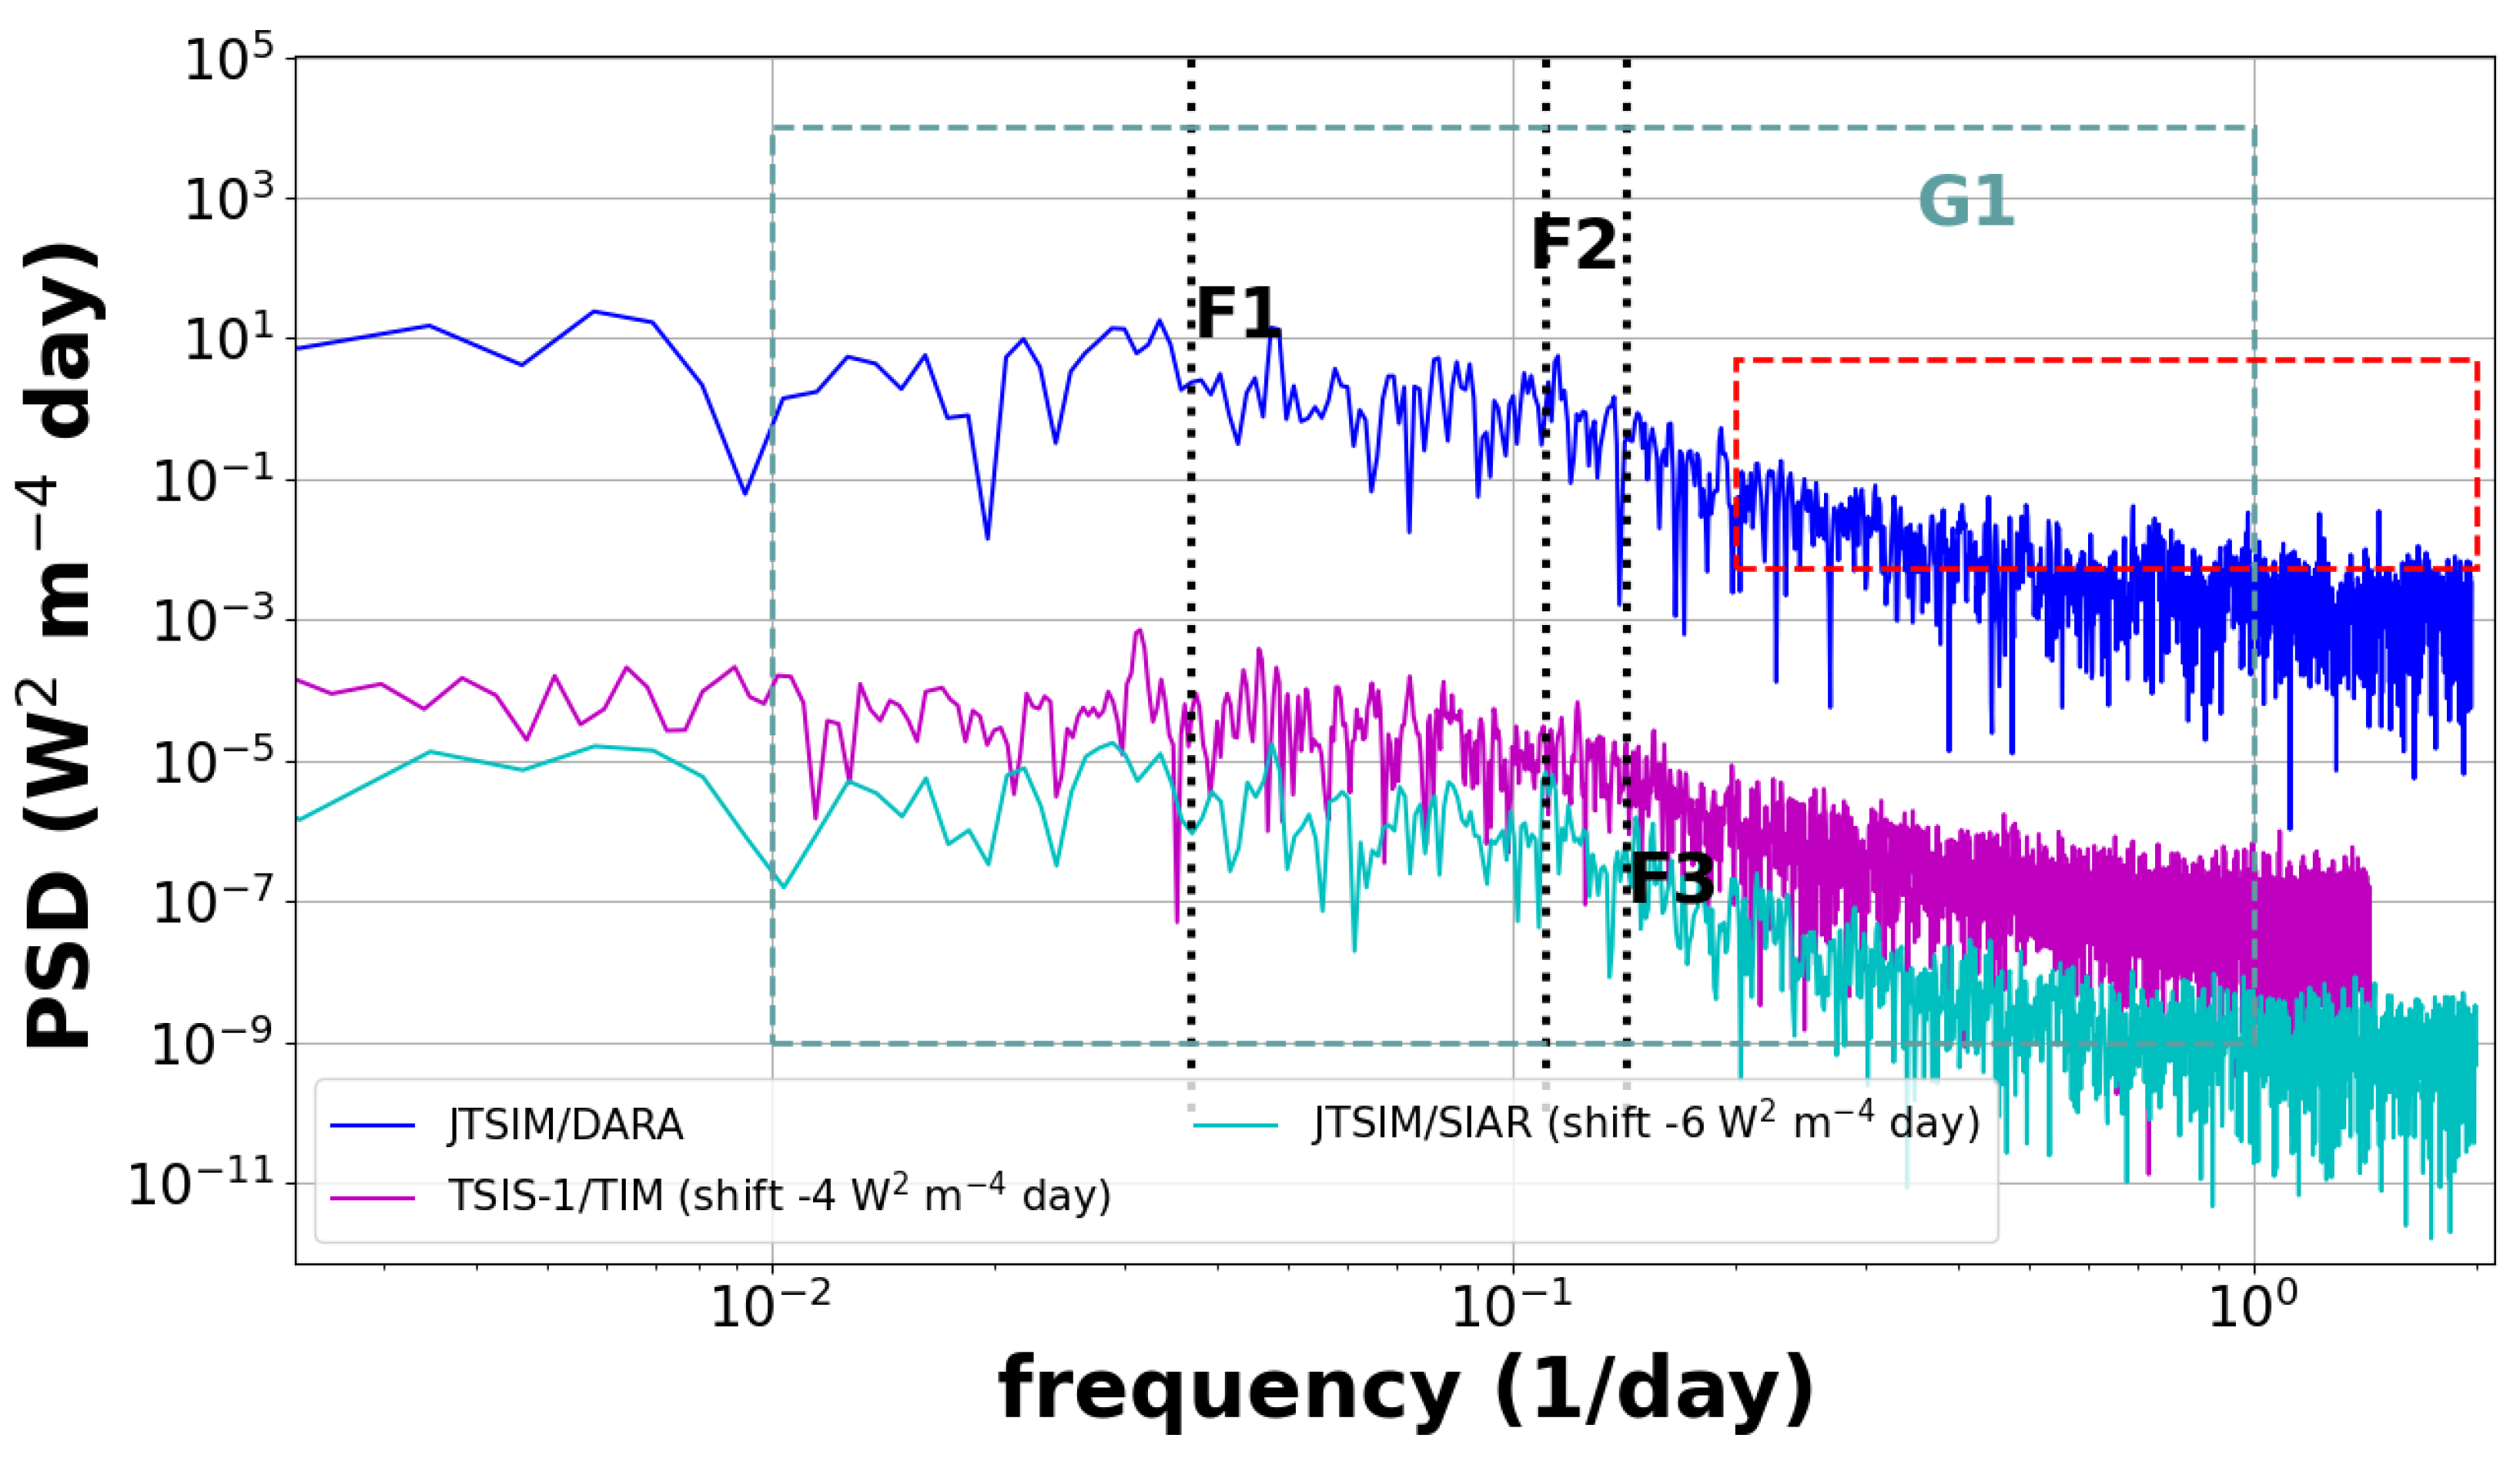
Figure A3 shows the PSD of the TSI observations recorded by the various instruments for the daily sampling rate. The PSD of the instruments are very similar.
Figure A3.
Power Spectrum Density of the DARA daily rate TSI time series using the Welch’s method. We also display the daily data rate of the observations recorded by the VIRGO/PMO6, TSIS-1/TIM and SIAR radiometers. We emphasize the frequency band G1 at [1-100] days. The black vertical dotted lines correspond to years (F0), 27 days (F1), 9 days (F2) and 7 days (F3) (shown for context).
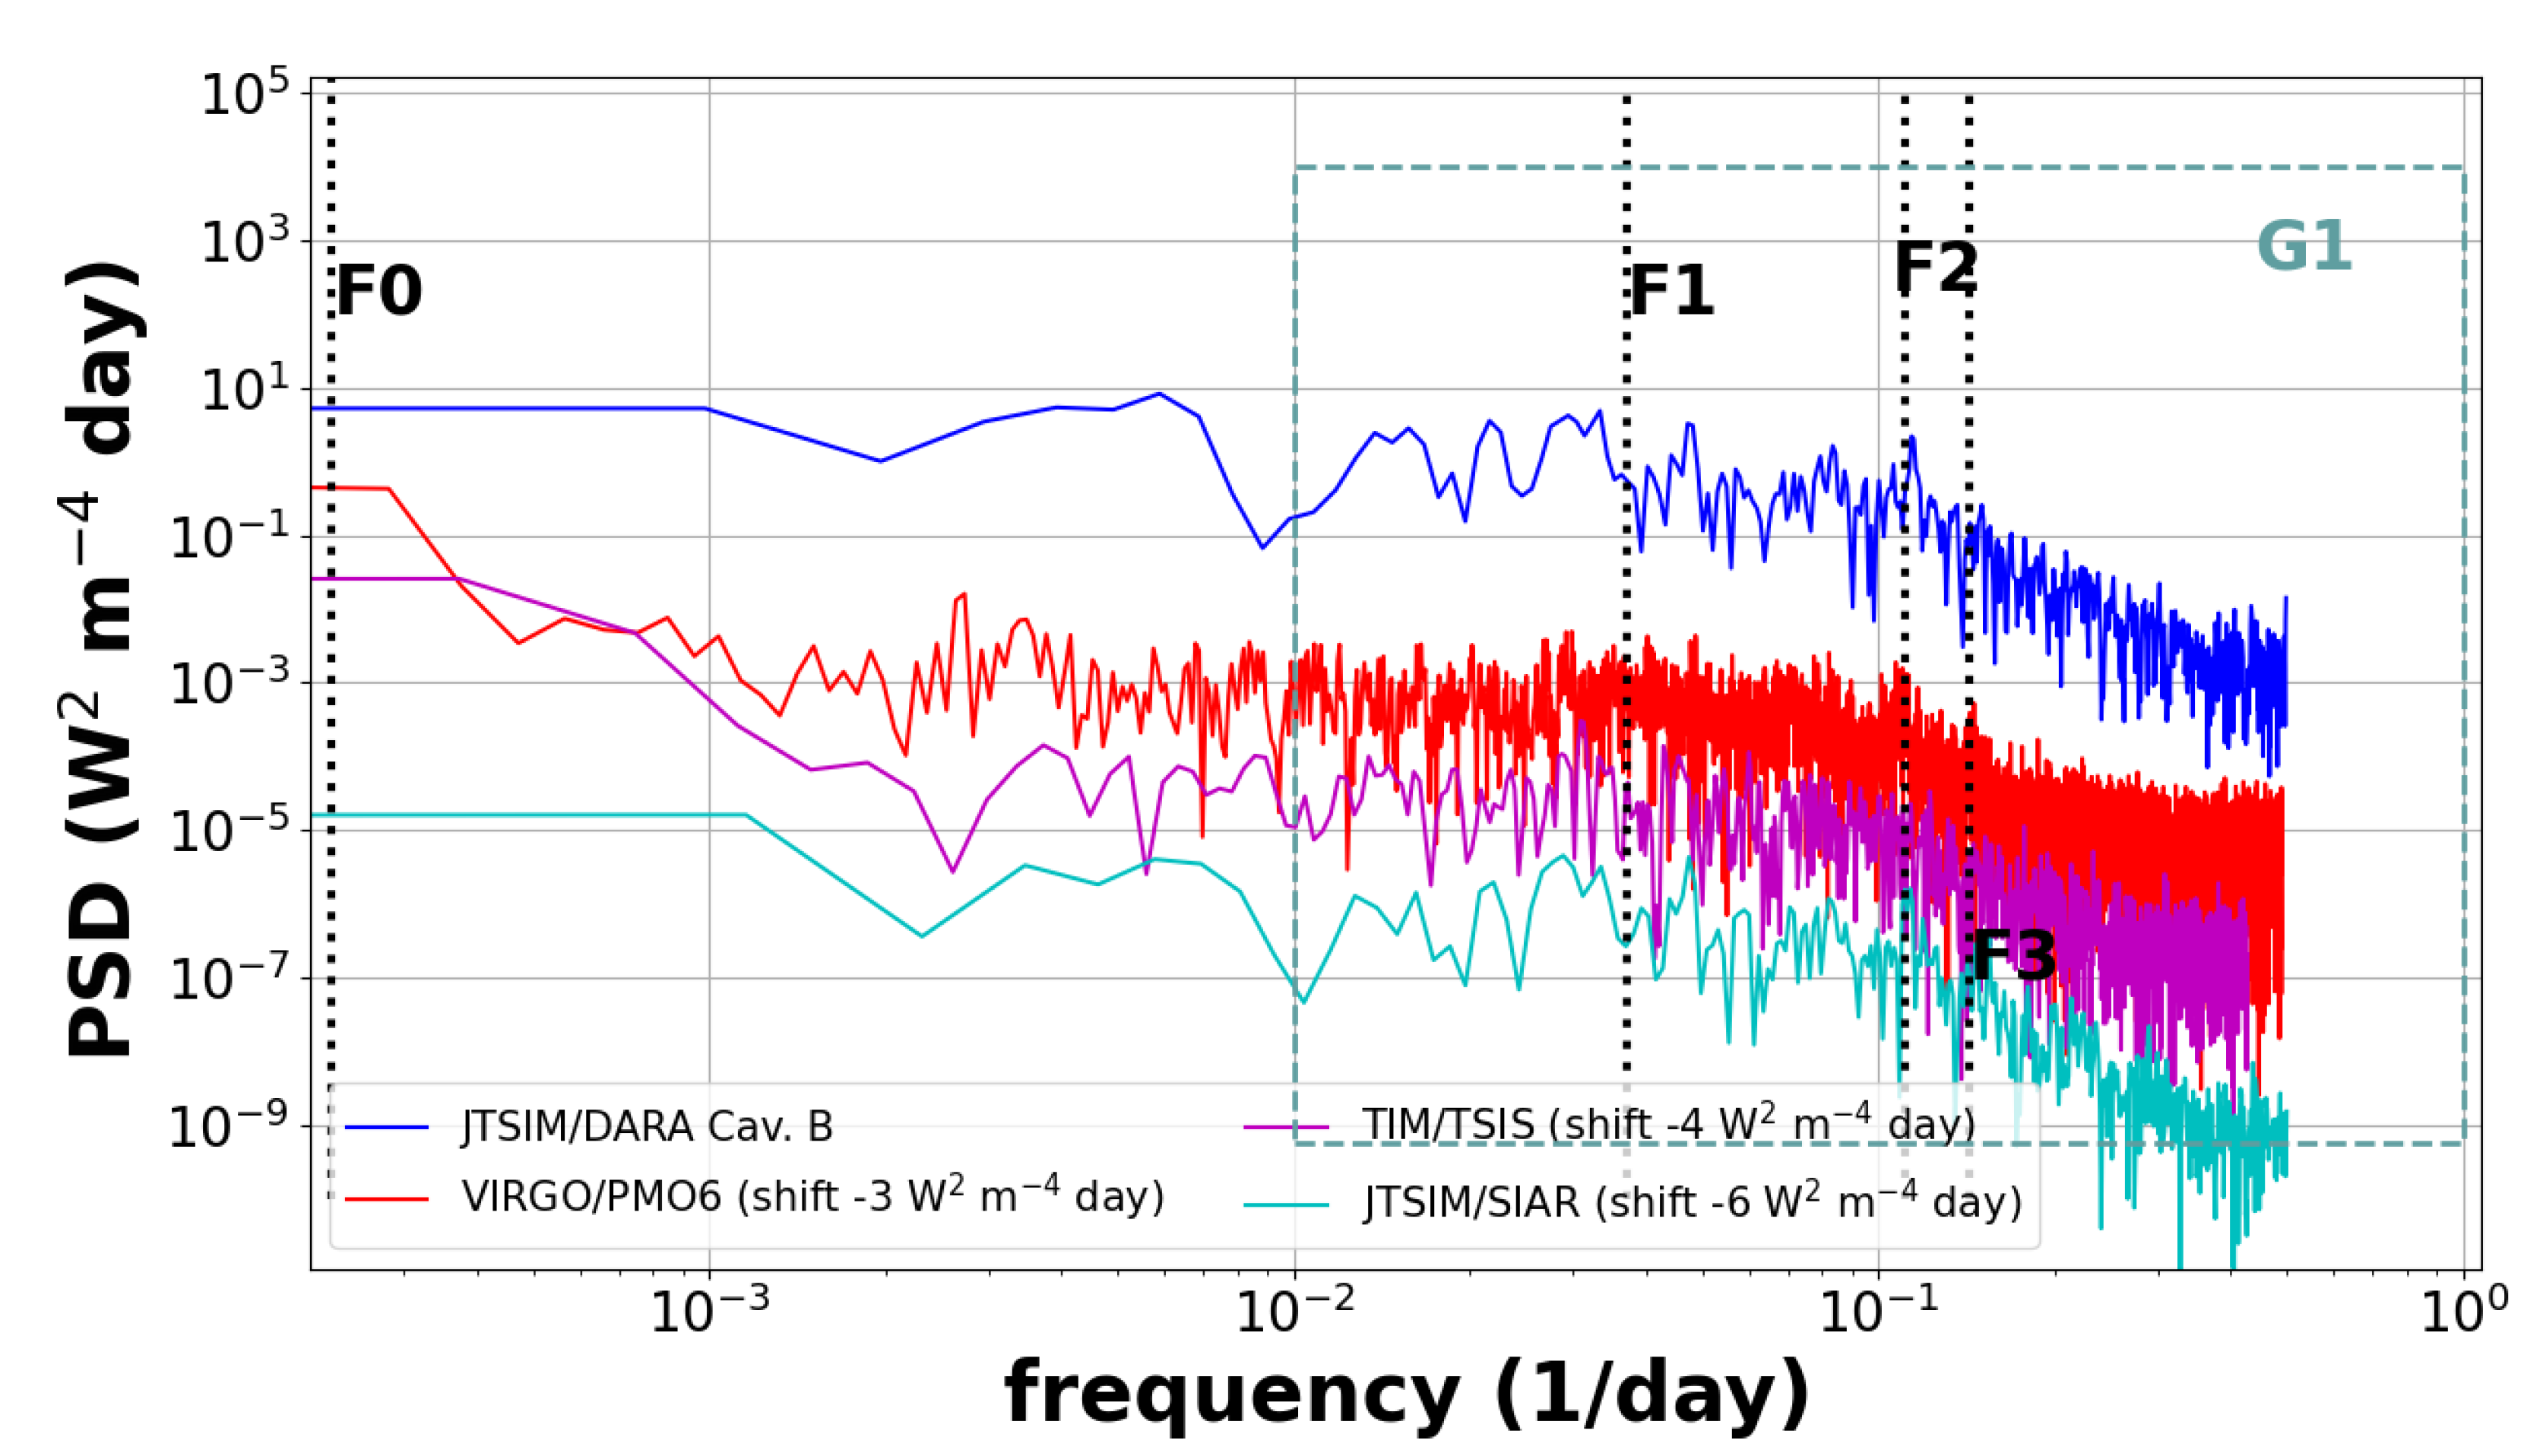
Figure A4.
Power Spectrum Density of TSI C1 [13], C2 [21], together with the new TSI composite including the JTSIM-DARA product C4. The means that the time series are shifted by rescaling the amplitude by W−2 m−4 day in the log-log plot. The dashed lines are the various power-law models when varying the exponent, which are only shown for context. The vertical doted lines (black) mark the frequencies at 27 (F1), 9 (F2) and 7 (F3) days (shown for context).
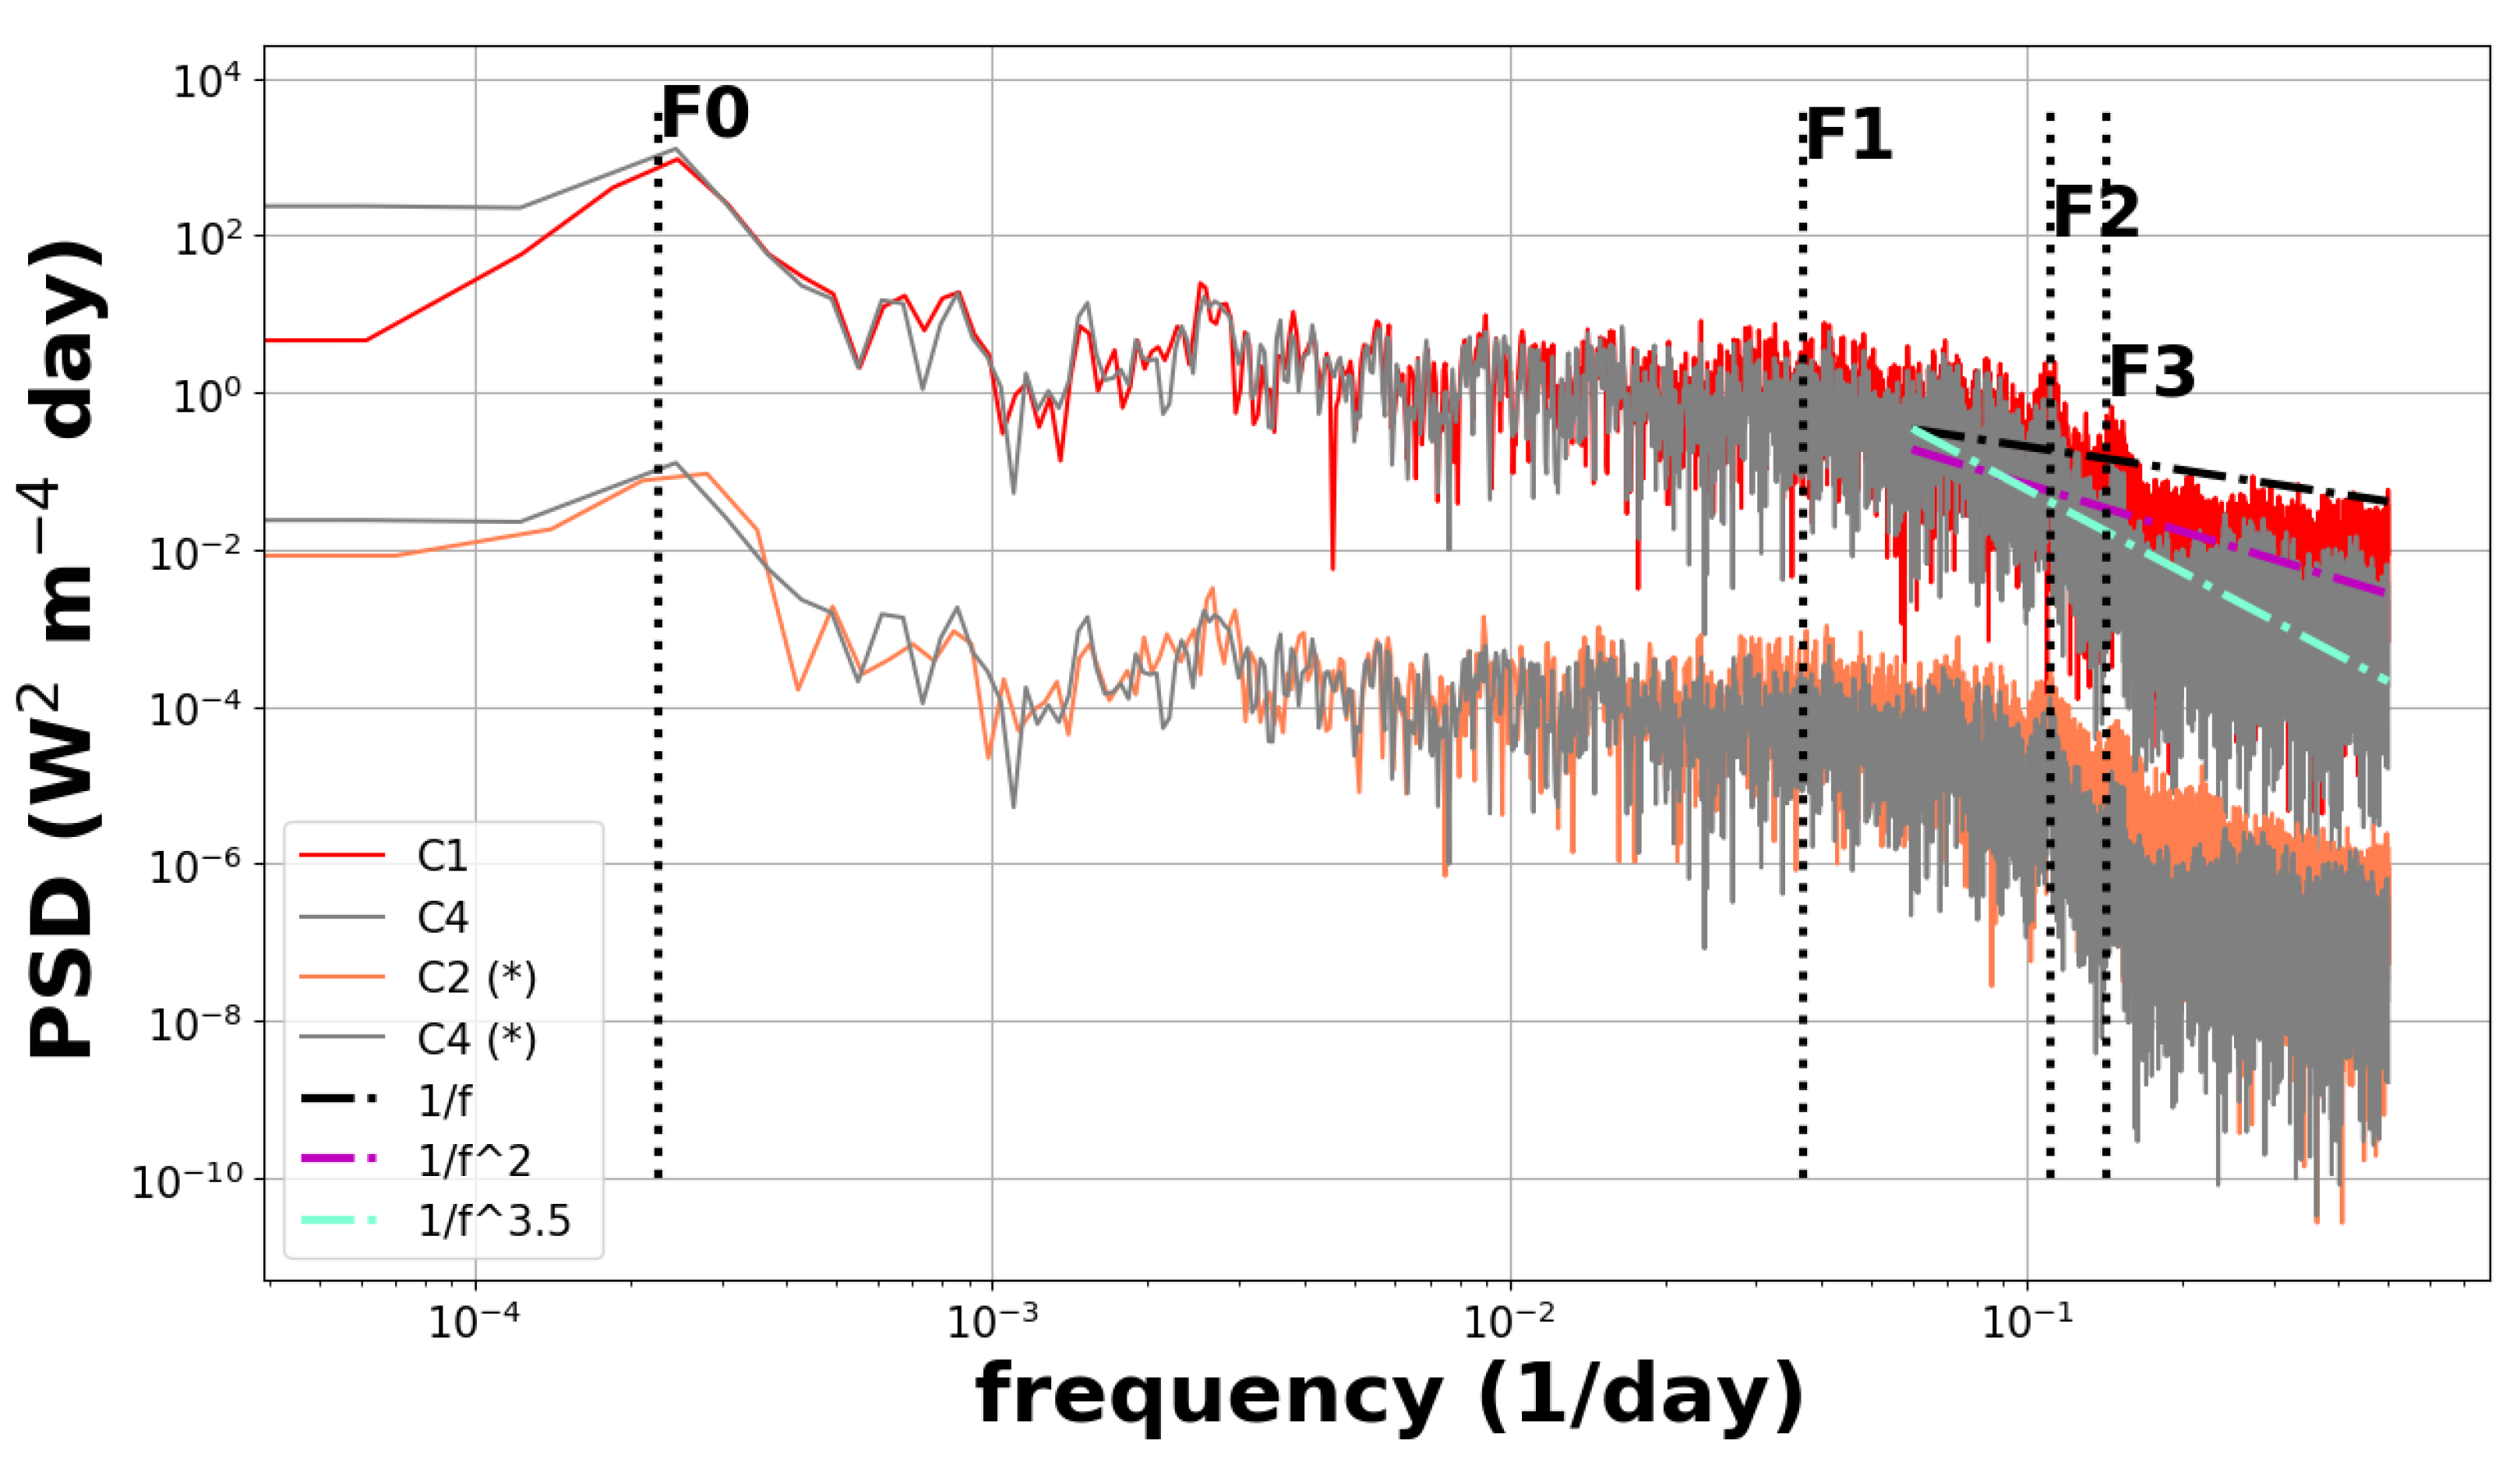
Figure A5.
Difference between the TSI composite C3 [33] and the time series including the JTSIM-DARA product C4. The horizontal doted lines show the limit at Wm−2.
Figure A5.
Difference between the TSI composite C3 [33] and the time series including the JTSIM-DARA product C4. The horizontal doted lines show the limit at Wm−2.
References
- Kopp, G.; Lawrence, G.; Rottman, G. The Total Irradiance Monitor (TIM): Science Results. Sol. Phys. 2005, 230, 129–139. [Google Scholar] [CrossRef]
- Schmutz, W.; Fehlmann, A.; Hülsen, G.; Meindl, P.; Winkler, R.; Thuillier, G.; Blattner, P.; Buisson, F.; Egorova, T.; Finsterle, W.; et al. The PREMOS/PICARD instrument calibration. Metrologia 2009, 46, S202–S206. [Google Scholar] [CrossRef]
- Schmutz, W.; Fehlmann, A.; Finsterle, W.; Kopp, G.; Thuillier, G. Total solar irradiance measurements with PREMOS/PICARD. In Proceedings of the American Institute of Physics Conference Series, 2013, Vol. 1531, American Institute of Physics Conference Series, pp. 624–627. [CrossRef]
- Kopp, G.; Lean, J.L. A new, lower value of total solar irradiance: Evidence and climate significance. Geophys. Res. Lett. 2011, 38, L01706. [Google Scholar] [CrossRef]
- Yeo, K.L.; Krivova, N.A.; Solanki, S.K. Solar Cycle Variation in Solar Irradiance. Space Science Reviews 2014, 136, 137–167. [Google Scholar] [CrossRef]
- Kopp, G. Science Highlights and Final Updates from 17 Years of Total Solar Irradiance Measurements from the SOlar Radiation and Climate Experiment/Total Irradiance Monitor (SORCE/TIM). sol. phys. 2021, 296, 133. [Google Scholar] [CrossRef]
- Chatzistergos, T.; Krivova, N.A.; Yeo, K.L. Long-term changes in solar activity and irradiance. Journal of Atmospheric and Solar-Terrestrial Physics 2023, 252, 106150. [Google Scholar] [CrossRef]
- Chatzistergos, T. A Discussion of Implausible Total Solar-Irradiance Variations Since 1700. Solar Physics 2024, 299, 21. [Google Scholar] [CrossRef]
- Wang, Y.; Fang, W.; Gong, C.; Yu, B. Dual cavity inter-compensating absolute radiometer. Opt. Precis. Eng. 2007, 15. [Google Scholar] [CrossRef]
- Song, B.; Ye, X.; Finsterle, W.; Gyro, M.; Gander, M.; Oliva, A.R.; Pfiffner, D.; Zhao, Y.; Fang, W. The Fengyun-3E/Joint Total Solar Irradiance Absolute Radiometer: Instrument Design, Characterization, and Calibration. Solar Physics 2021, 296. [Google Scholar] [CrossRef]
- Zhu, P.; Ye, X.; Montillet, J.P.; Finsterle, W.; Yang, D.; Duo, W.; Qi, J.; Fang, W.; Zhang, P. The first light from the joint total solar irradiance measurement experiment onboard the FY3-E meteorological satellite. Earth and Space Science (manuscript submitted) 2025. [Google Scholar]
- Fehlmann, A.; Kopp, G.; Schmutz, W.; Winkler, R.; Finsterle, W.; Fox, N. Fourth World Radiometric Reference to SI radiometric scale comparison and implications for on-orbit measurements of the total solar irradiacne. Metrologia 2012, 49. [Google Scholar] [CrossRef]
- Dudok de Wit, T.; Kopp, G.; Fröhlich, C.; Schöll, M. Methodology to create a new total solar irradiance record: Making a composite out of multiple data records. Geophys. Res. Lett. 2017, 44, 1196–1203. [Google Scholar] [CrossRef]
- Wilson, R. Total solar irradiance trend during solar cycles 21 and 22. Science 1997, 277, 1963–1965. [Google Scholar] [CrossRef]
- Fröhlich, C.; Lean, J. Solar radiative output and its variability: Evidence and mechanisms. Astron. Astrophys. Rev. 2004, 12, 273–320. [Google Scholar] [CrossRef]
- Mekaoui, S.; Dewitte, S. Total solar irradiance measurement and modelling during cycle 23. Sol. Phys. 2008, 247, 203–216. [Google Scholar] [CrossRef]
- Montillet, J.; Finsterle, W.; Kermarrec, G.; Sikonja, R.; Haberreiter, M.; Schmutz, W.; Dudok de Wit, T. Data Fusion of Total Solar Irradiance Composite Time Series Using 41 Years of Satellite Measurements. Journal of Geophysical Research: Atmospheres 2022, 127, e2021JD036146, [https://agupubs.onlinelibrary.wiley.com/doi/pdf/10.1029/2021JD036146]. e2021JD036146 2021JD036146. [Google Scholar] [CrossRef]
- Scafetta, N.; Willson, R.C. Comparison of Decadal Trends among Total Solar Irradiance Composites of Satellite Observations. Advances in Astronomy 2019, 2019. [Google Scholar] [CrossRef]
- Amdur, T.; Huybers, P. A Bayesian Model for Inferring Total Solar Irradiance From Proxies and Direct Observations: Application to the ACRIM Gap. Journal of Geophysical Research: Atmospheres 2023, 128, e2023JD038941. [Google Scholar] [CrossRef]
- Finsterle, W.; Montillet, J.; Schmutz, W.; Sikonja, R.; Kolar, L.; Treven, L. The total solar irradiance during the recent solar minimum period measured by SOHO/VIRGO. Scientific Reports 2021, 11, 10. [Google Scholar] [CrossRef]
- Fröhlich, C. Solar irradiance variability since 1978. Space Sci. Rev. 2006, 125, 53–65. [Google Scholar] [CrossRef]
- Qi, J.; Zhang, P.; Qiu, H.; Fang, W.; Ye, X.; Yu, P. Analysis of total solar irradiance observed by FY-3C Solar Irradiance Monitor-II. Chinese Science Bulletin 2015, 60, 2447–2454. [Google Scholar] [CrossRef]
- Montillet, J.P.; Finsterle, W.; Haberreiter, M.; Schmutz, W.; et al. Solar Irradiance monitored by DARA/JTSIM : first light observations. In Proceedings of the EGU General Assembly, 2022, Vol. EGU22-616. [CrossRef]
- Walter, B.; Andersen, B.; Beattie, A.; Finsterle, W.; Kopp, G.; Pfiffner, D.; Schmutz, W. First TSI results and status report of the CLARA/NorSat-1 solar absolute radiometer. In Proceedings of the Astronomy in Focus; Lago, M.T., Ed. International Astronomical Union, Cambridge University Press, 2020, Vol. 14, Proceedings of the International Astronomical Union. [CrossRef]
- Andersen, B.N.; Leifsen, T.; Toutain, T. Solar noise simulations in irradiance. Sol. Phys. 1994, 152, 247–252. [Google Scholar] [CrossRef]
- Fröhlich, C.; Andersen, B.; Appourchaux, T.e.a. First Results from VIRGO, the Experiment for Helioseismology and Solar Irradiance monitoring on SOHO. Solar Physics 1997, 170, 1–25. [Google Scholar] [CrossRef]
- Shapiro, A.; Solanki, S.; Krivova, N.; Cameron, R.; Yeo, K.; Schmutz, W. The nature of solar brightness variations. Nat. Astron. 2017, 1, 612–616. [Google Scholar] [CrossRef]
- Ball, W.T.; Schmutz, W.; Fehlmann, A.; Finsterle, W.; Walter, B. Assessing the beginning to end-of-mission sensitivity change of the PREcision MOnitor Sensor total solar irradiance radiometer (PREMOS/PICARD). Journal of Space Weather and Space Climate 2016, 6, A32. [Google Scholar] [CrossRef]
- Remesal Oliva, A. Understanding and improving the cavity absorptance for space TSI radiometers. PhD thesis, University of Zurich, 2021.
- Fröhlich, C. Solar Irradiance Variability Since 1978. Revision of the PMOD Composite during Solar Cycle 21. Space Science Reviews 2006, 125, 53–65. [Google Scholar] [CrossRef]
- Dewitte, S.; Nevens, S. The Total Solar Irradiance Climate Data Record. The Astrophysical Journal 2016, 830, 25. [Google Scholar] [CrossRef]
- Dewitte, S.; Cornelis, J.; Meftah, M. Centennial Total Solar Irradiance Variation. Remote Sensing 2022, 14. [Google Scholar] [CrossRef]
- Montillet, J.; Finsterle, W.; Schmutz, W.; Haberreiter, M.; Dudok de Wit, T.; Kermarrec, G.; Sikonja, R. [Dataset]. Composite PMOD Data Fusion - updated December 2024. Interdisciplinary Earth Data Alliance (IEDA), https://doi.org/10.60520/IEDA/113611 2024, Accessed 2025-03-09. [CrossRef]
- Montillet, J.; Finsterle, W.; Schmutz, W.; Haberreiter, M.; Dudok de Wit, T.; Kermarrec, G.; Sikonja, R. [Dataset]. Composite PMOD Data Fusion. Interdisciplinary Earth Data Alliance (IEDA), https:/doi.org/10.26022/IEDA/112238 2022, Accessed 2022-06-07. [CrossRef]
- Montillet, J.; Finsterle, W.; Schmutz, W.; Haberreiter, M.; Dudok de Wit, T.; Kermarrec, G.; Sikonja, R. [Dataset]. Composite PMOD Data Fusion. Interdisciplinary Earth Data Alliance (IEDA), https://doi.org/10.26022/IEDA/112940 2023, Accessed 2023-06-01. [CrossRef]
- Montillet, J.; Finsterle, W. [Dataset]. PMO6v8 - Total Solar Irradiance Dataset from VIRGO/PMO6 - 12/2024. Interdisciplinary Earth Data Alliance (IEDA), https://doi.org/10.60520/IEDA/113609 2024, Accessed 2025-03-09. [CrossRef]
- Montillet, J.; Finsterle, W.; Koller, S.; Pfiffner, D.; Gyo, M. Total Solar Irradiance Recorded by the FY3E/DARA-JTSIM Radiometer, Version 1.0. [CrossRef]
Figure 1.
TSI observations in WRR scale recorded by the DARA from the various cavities: channel B (blue), channel C (green) and A (red). The channel B operates at 1 min. rate, C at day rate, and A irregularly acting as reference cavity.
Figure 1.
TSI observations in WRR scale recorded by the DARA from the various cavities: channel B (blue), channel C (green) and A (red). The channel B operates at 1 min. rate, C at day rate, and A irregularly acting as reference cavity.
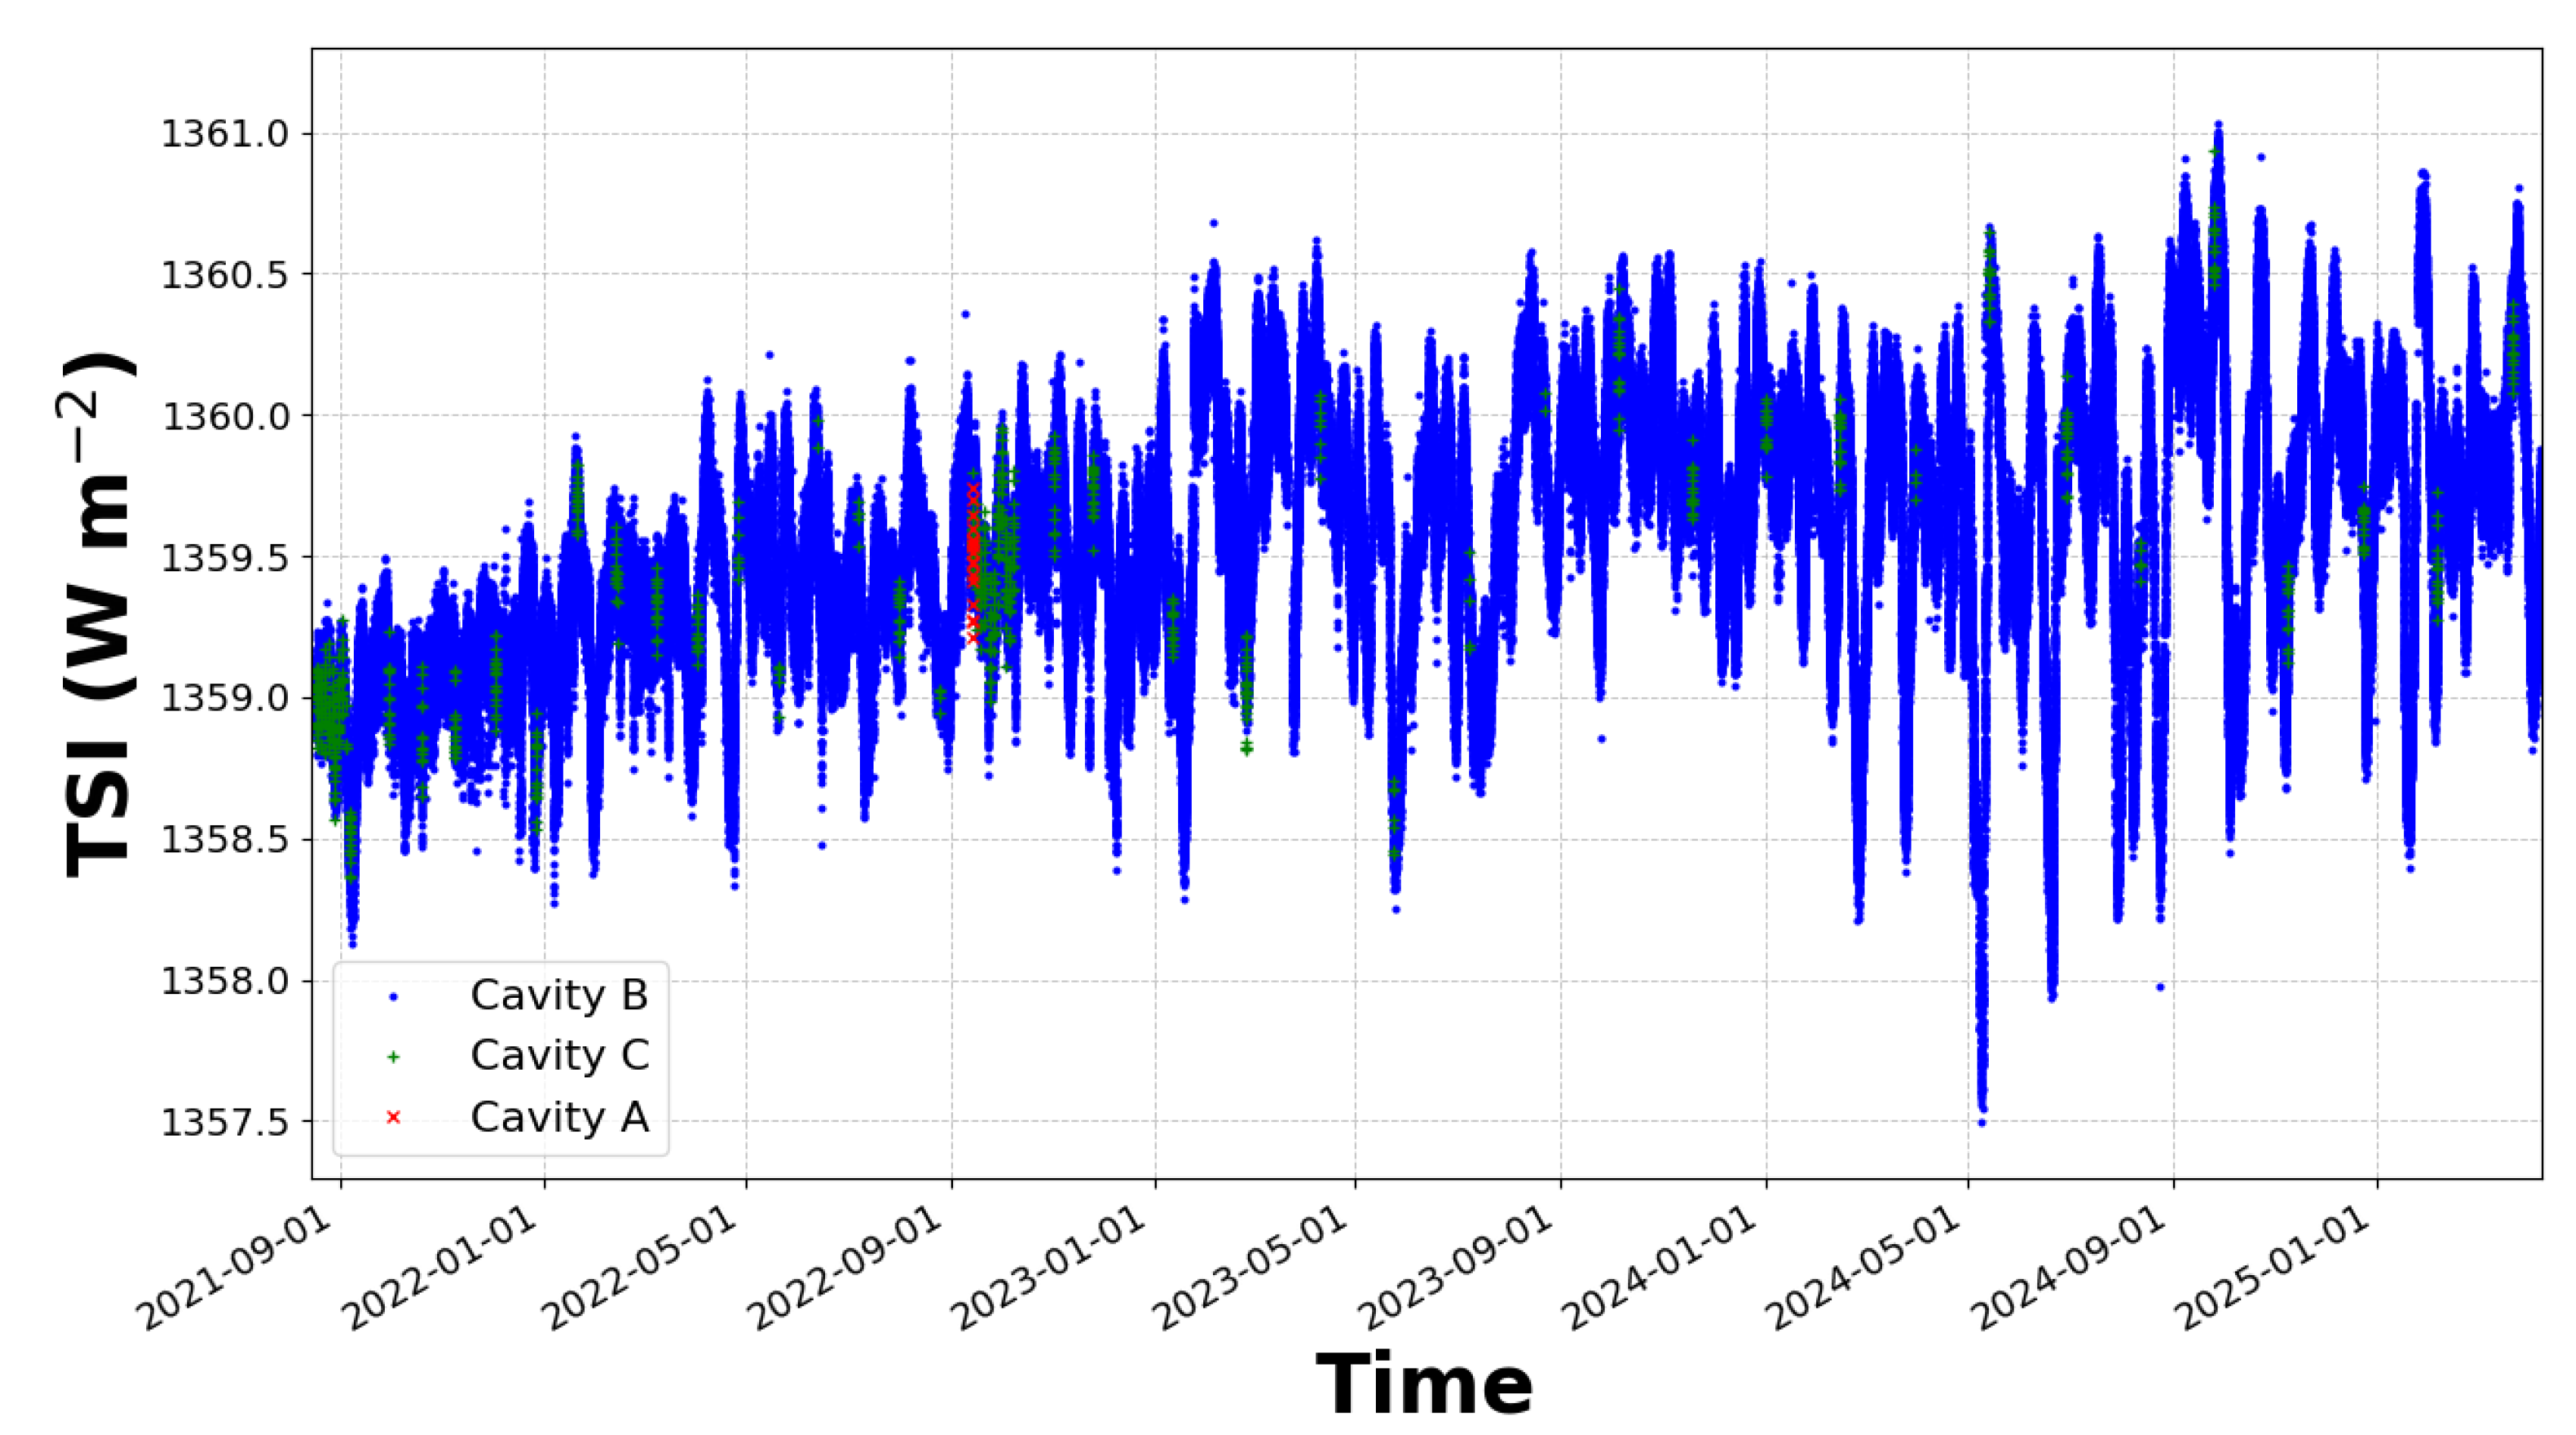
Figure 2.
Cavity temperature in Kelvin (K). Note that the temperature fluctuates due to the deep space measurements and maneuvers of the satellite.
Figure 2.
Cavity temperature in Kelvin (K). Note that the temperature fluctuates due to the deep space measurements and maneuvers of the satellite.
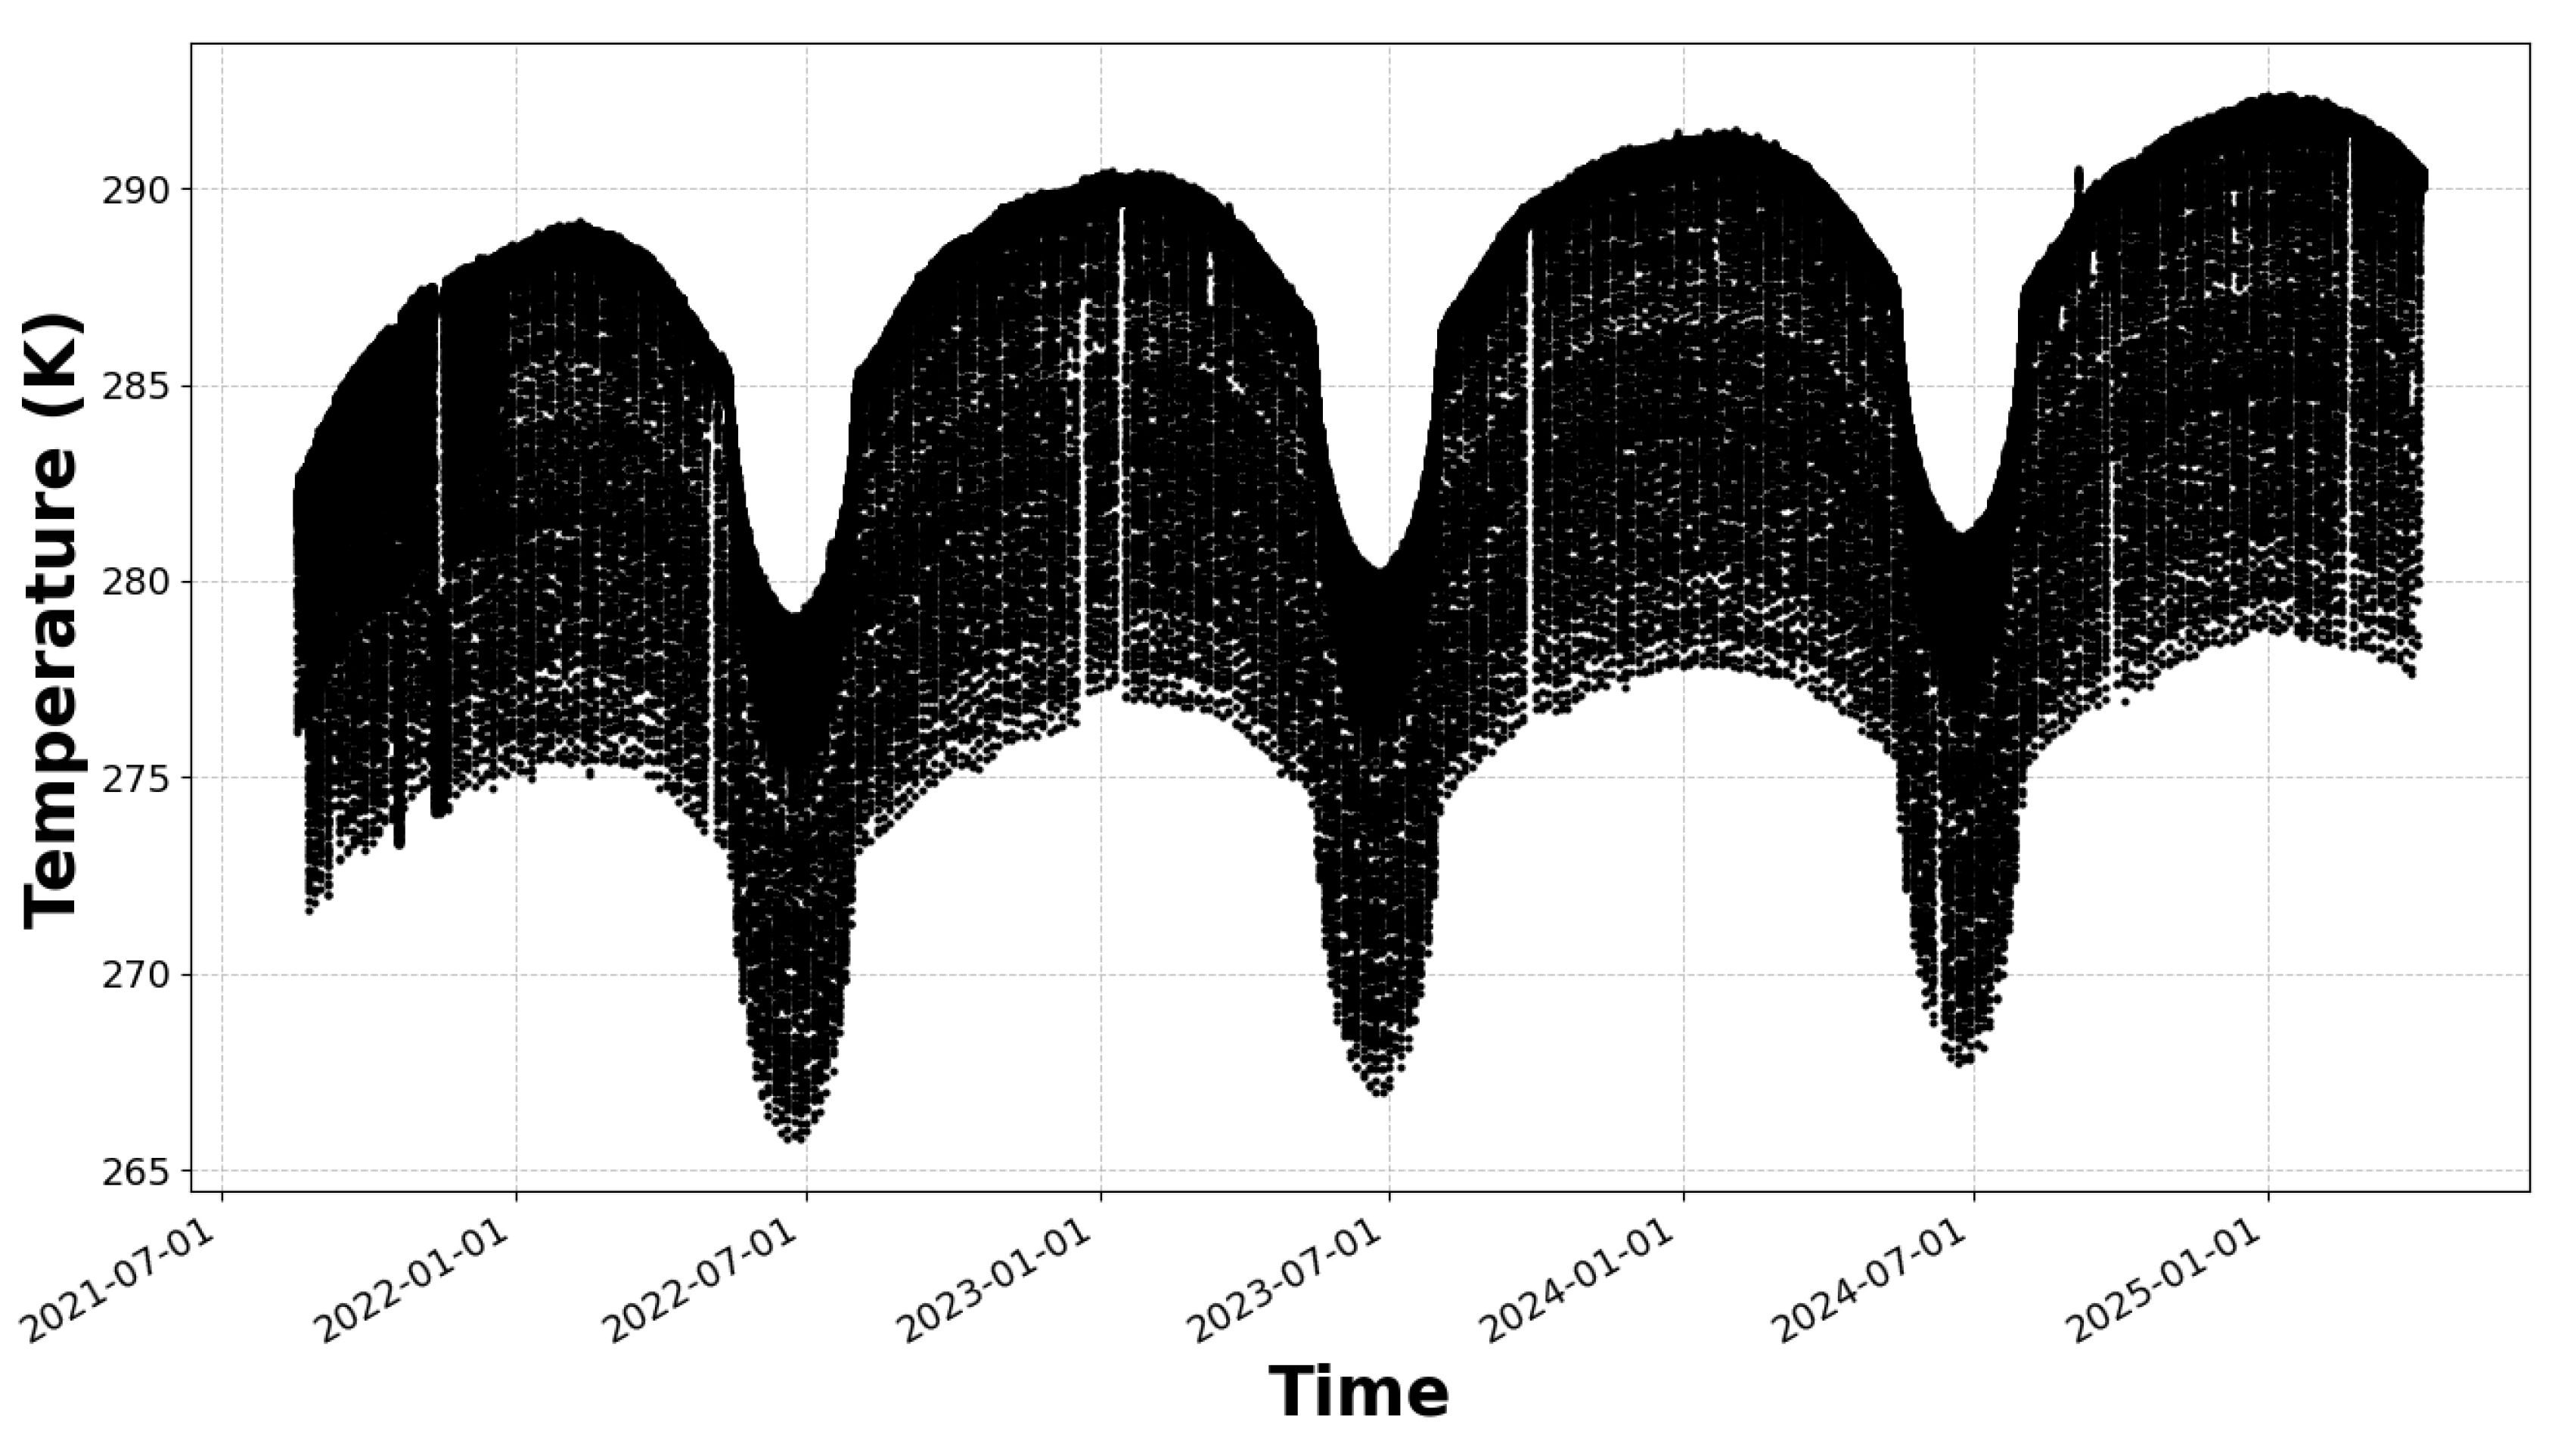
Figure 3.
Power spectrum analysis of the DARA 1 min rate TSI time series using the Welch’s method (blue) and SIAR (cyan). The gray PSD is the 1 minute data rate of the observations recorded by the PMO6 radiometer on board of the SOHO/VIRGO mission. We emphasize the frequency band G1 at [1-100] days, G2 at [1-60] minutes and the P-modes (dashed purple box). The orange box underlines the frequencies associated with the satellite orbital period. The black vertical dotted lines correspond to years (F0), 27 days (F1), 9 days (F2) and 7 days (F3). The dashed line is the power-law model when varying the exponent (shown for context).
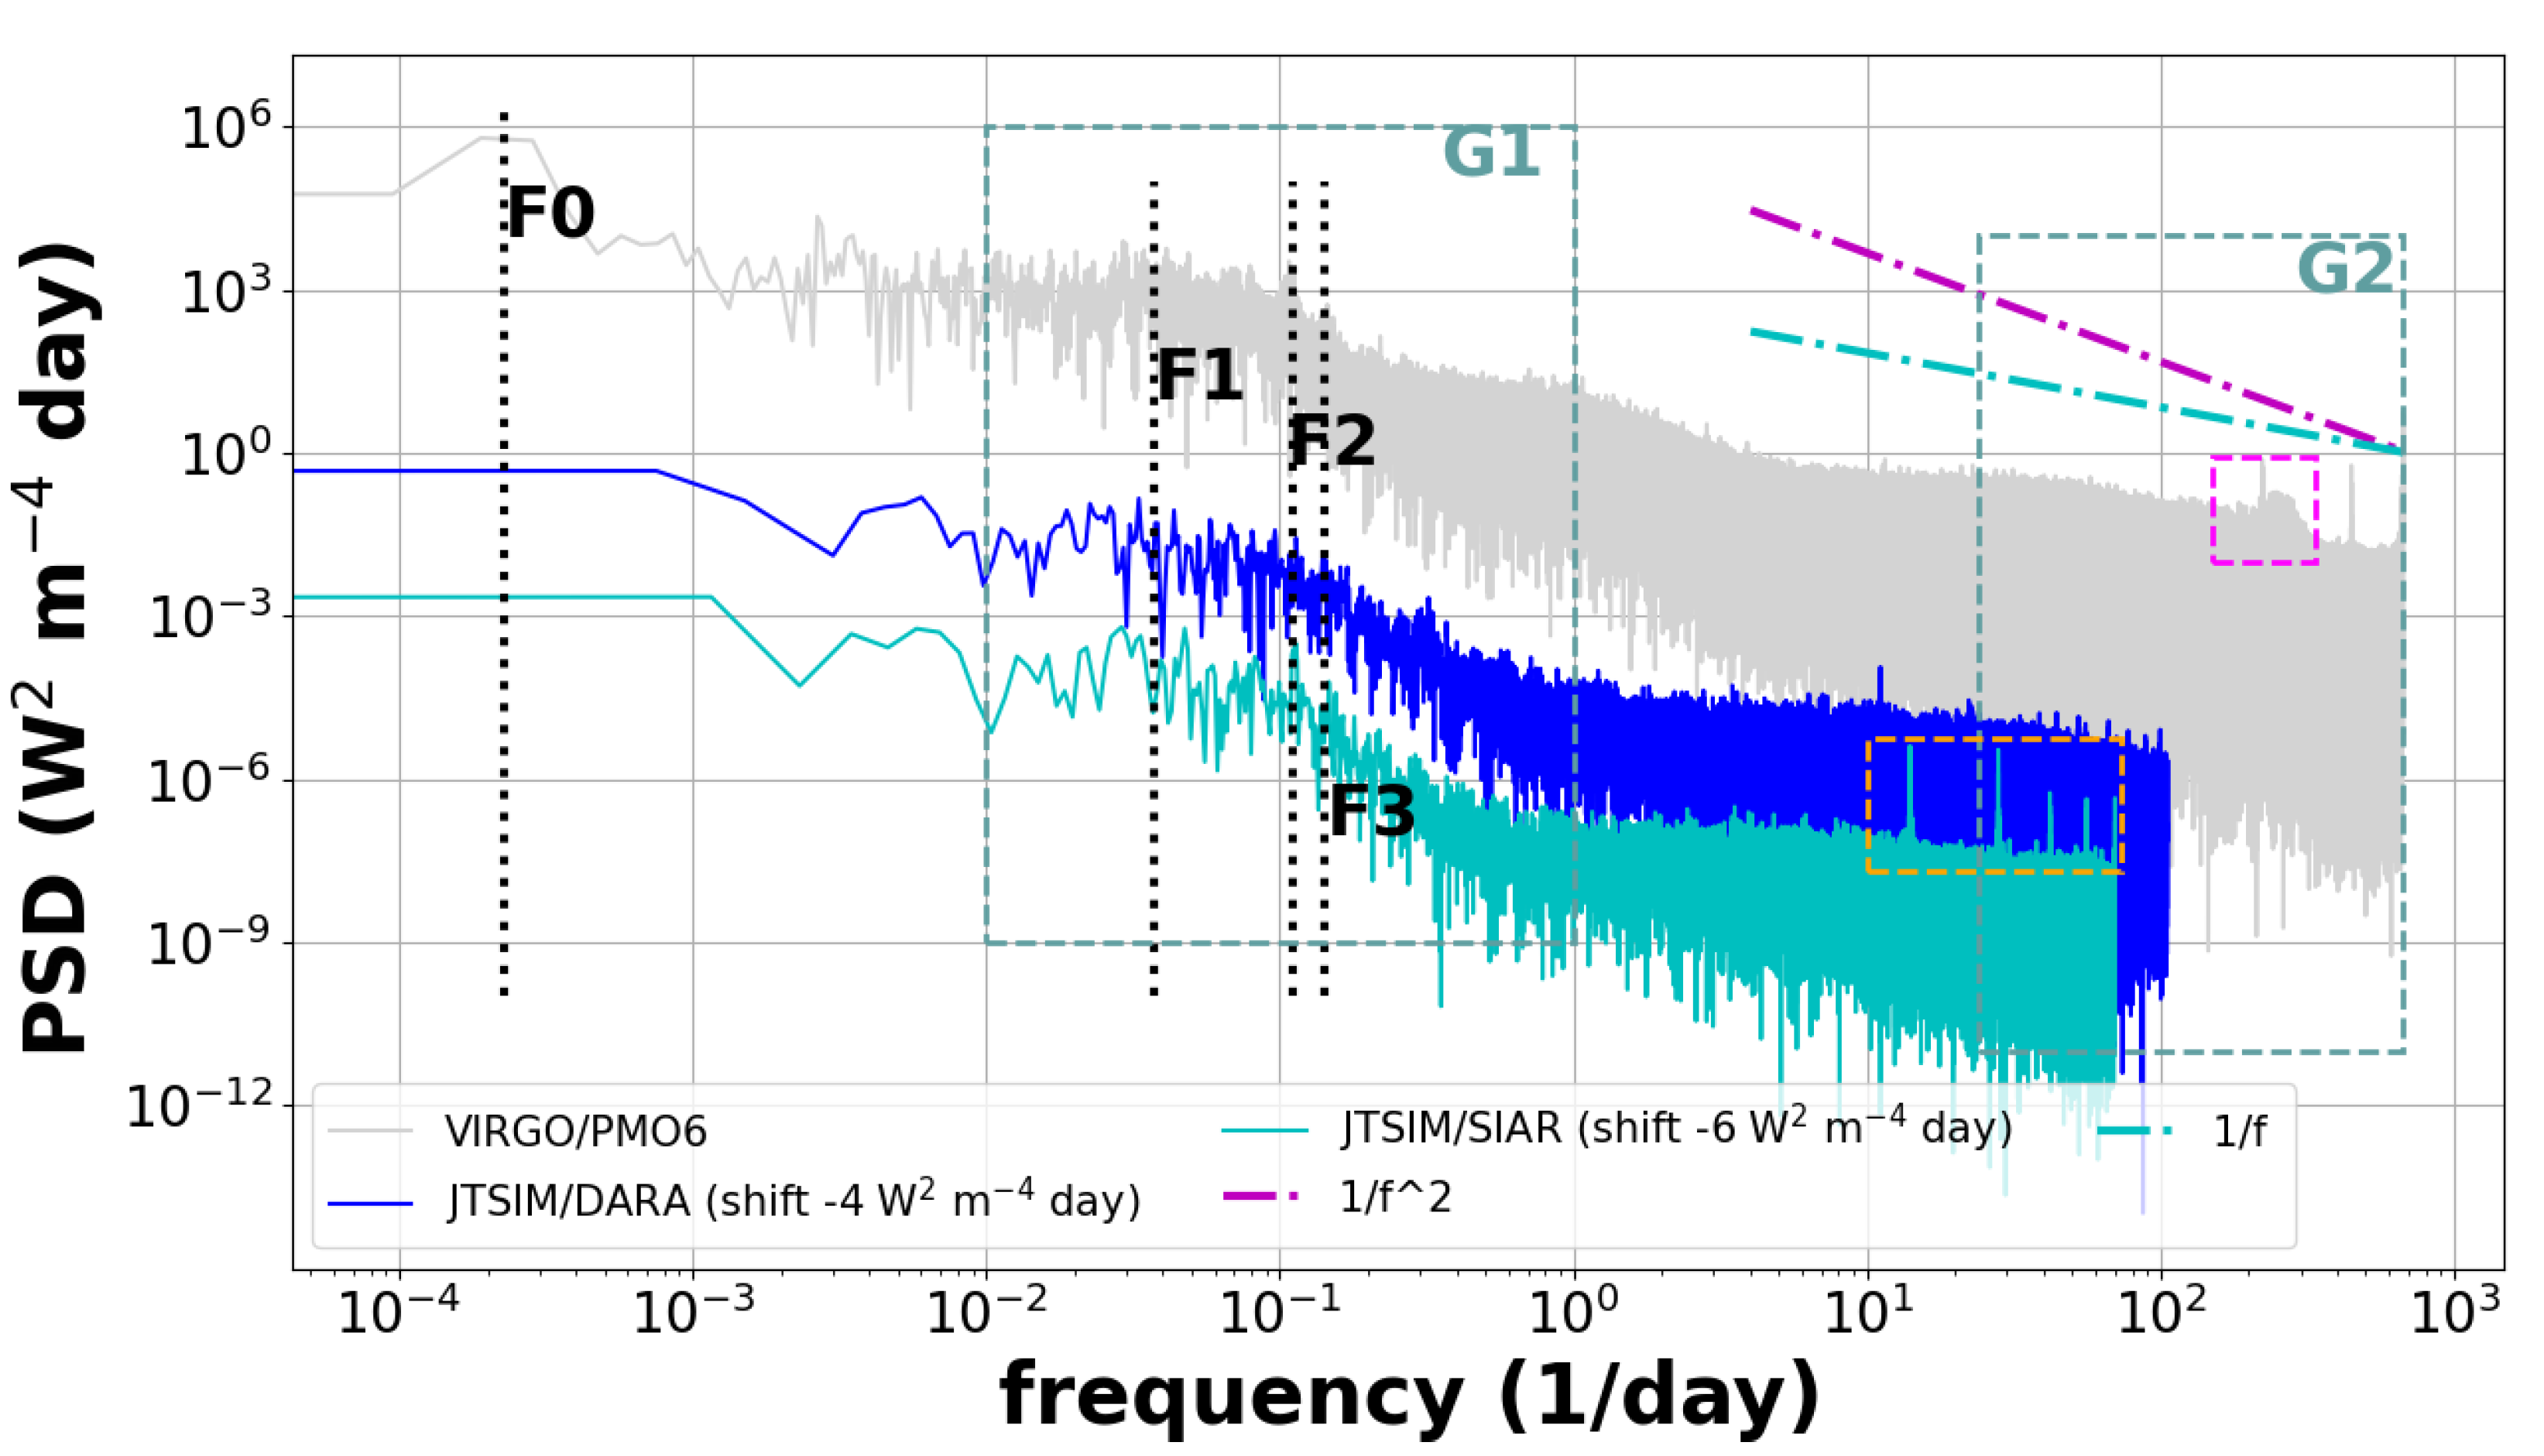
Figure 4.
Ratio of the nominal channel (channel B) and the backup channel (channel C) as a function of the mission days. The red line is the degradation curve for the observations recorded by the cavity B. There is no degradation at this time for the back-up channel (black crosses).
Figure 4.
Ratio of the nominal channel (channel B) and the backup channel (channel C) as a function of the mission days. The red line is the degradation curve for the observations recorded by the cavity B. There is no degradation at this time for the back-up channel (black crosses).
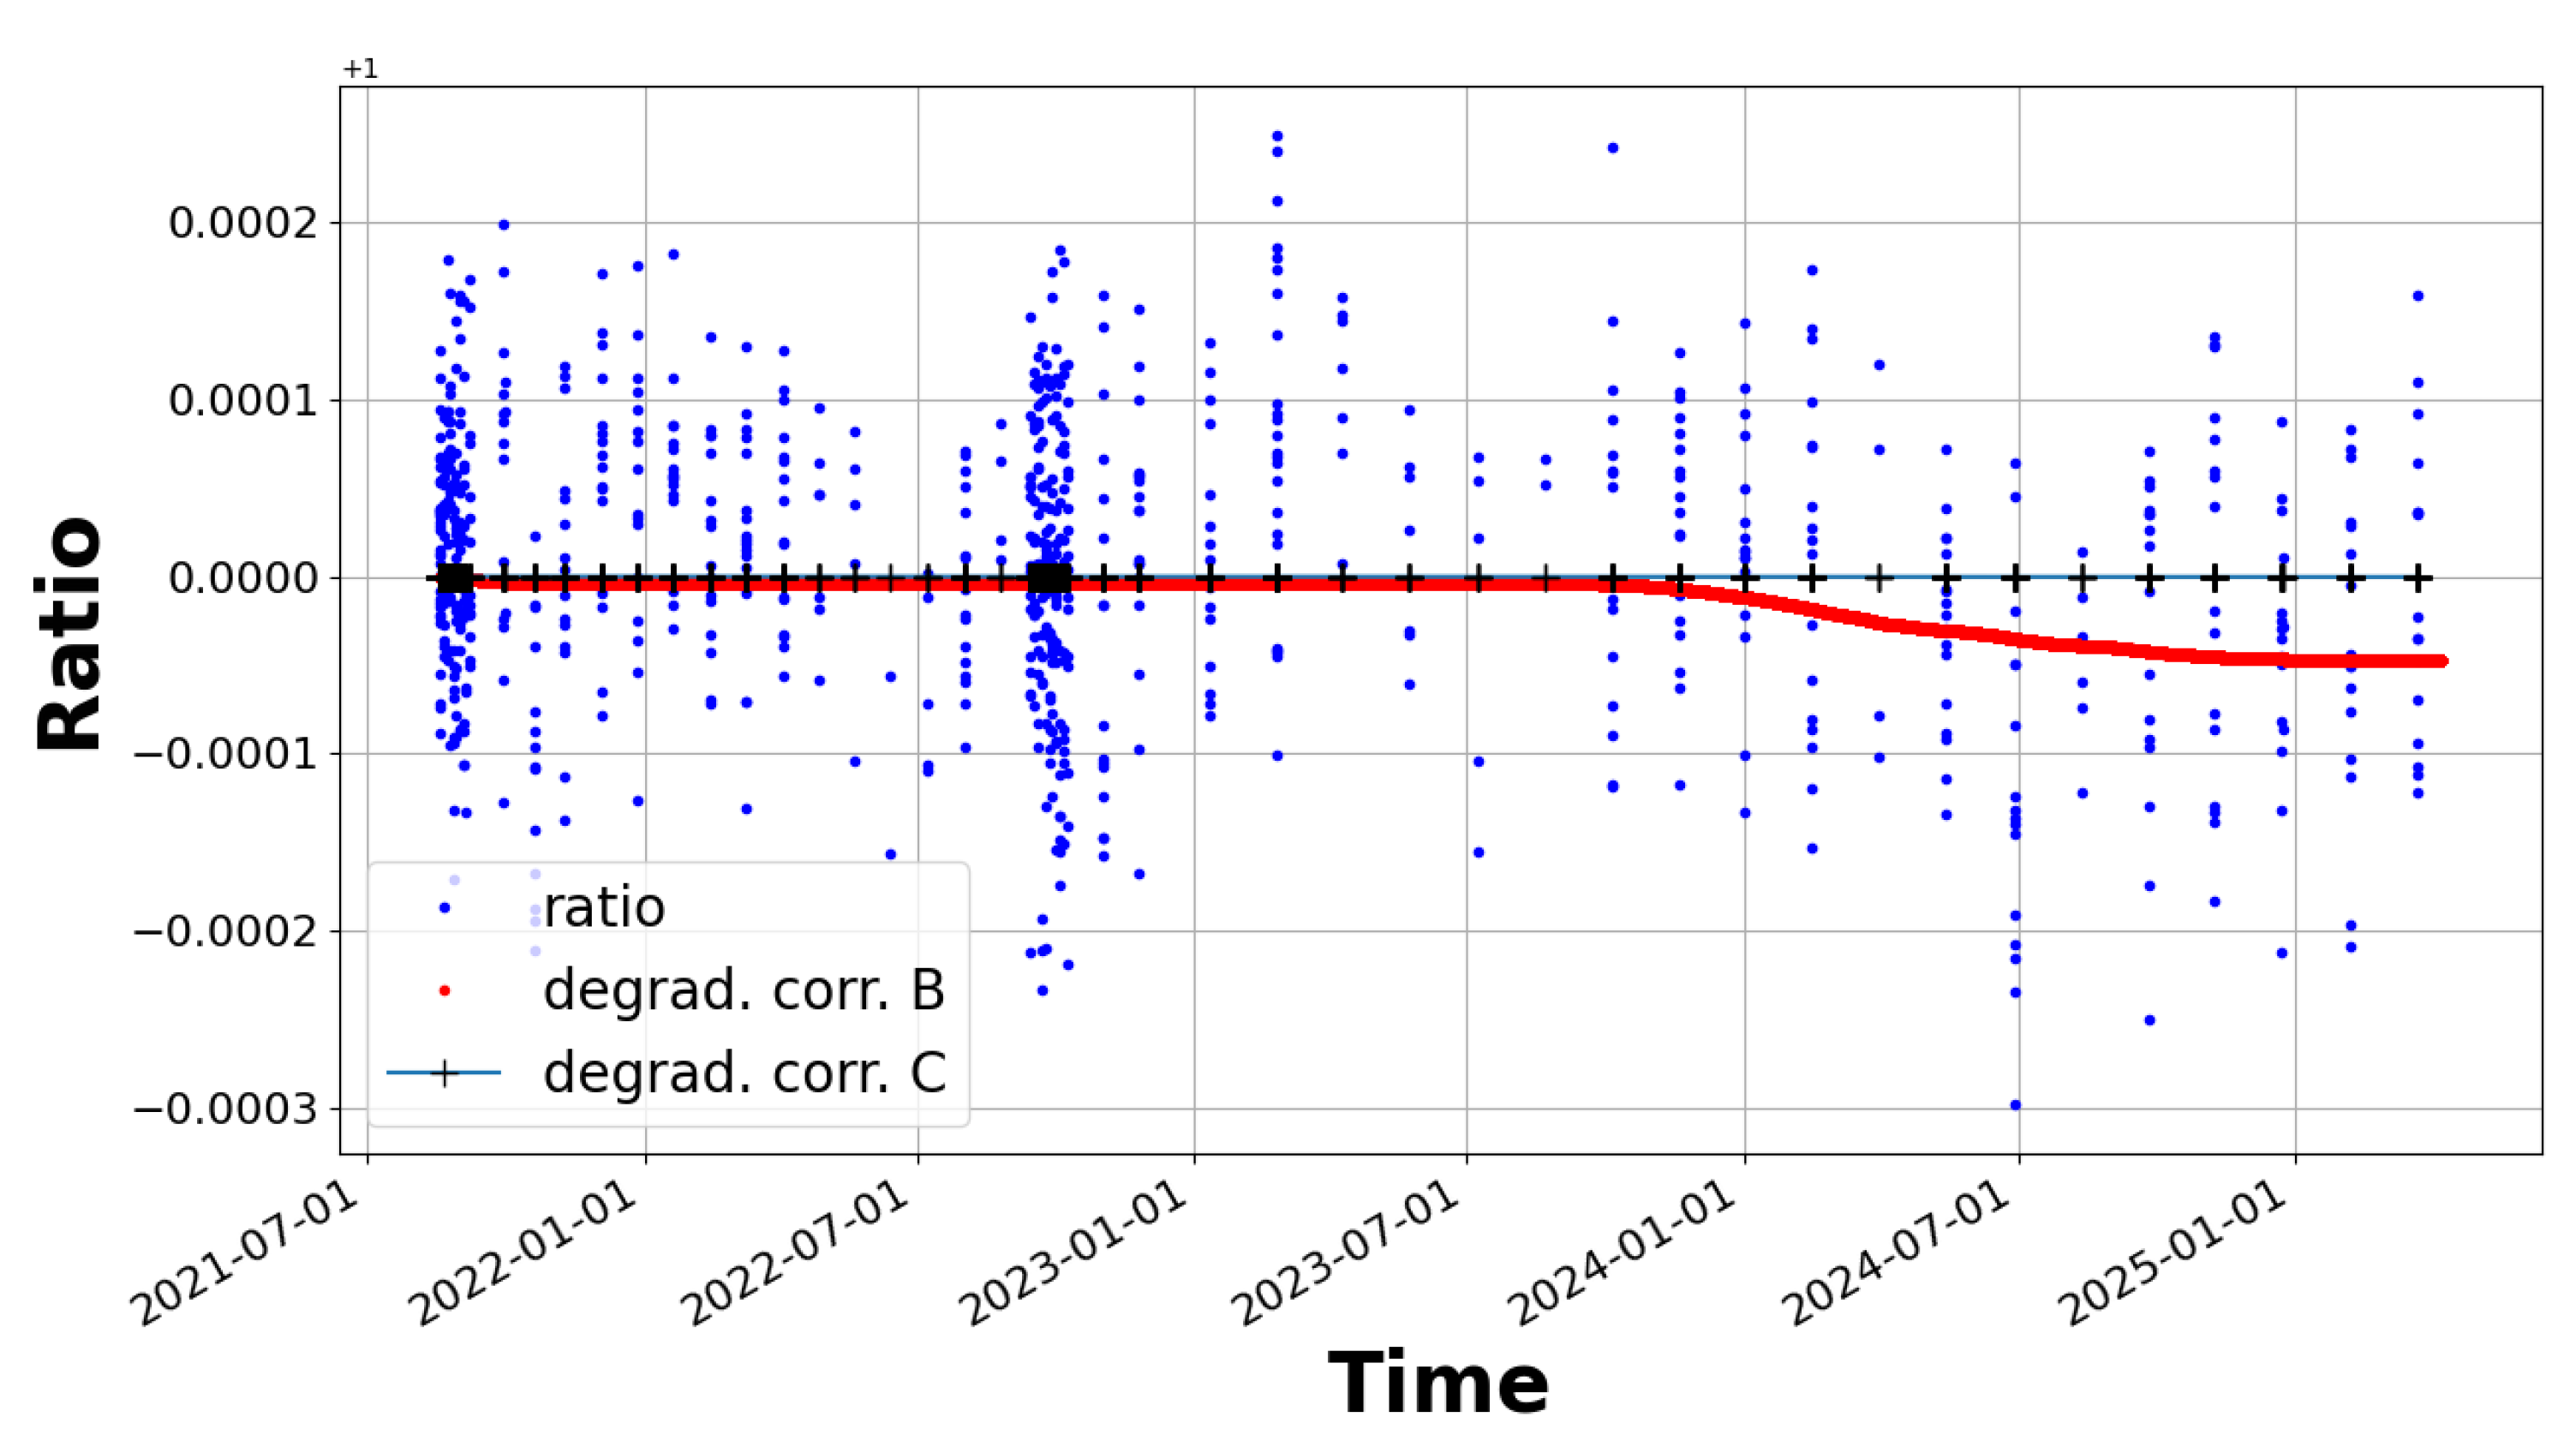
Figure 5.
Difference between the daily PMO6v8 product and the degradation-corrected TSI time series. Two linear trends are displayed: the green curve stops early 2023, whereas the red curve fits all the available data until April 2025.
Figure 5.
Difference between the daily PMO6v8 product and the degradation-corrected TSI time series. Two linear trends are displayed: the green curve stops early 2023, whereas the red curve fits all the available data until April 2025.
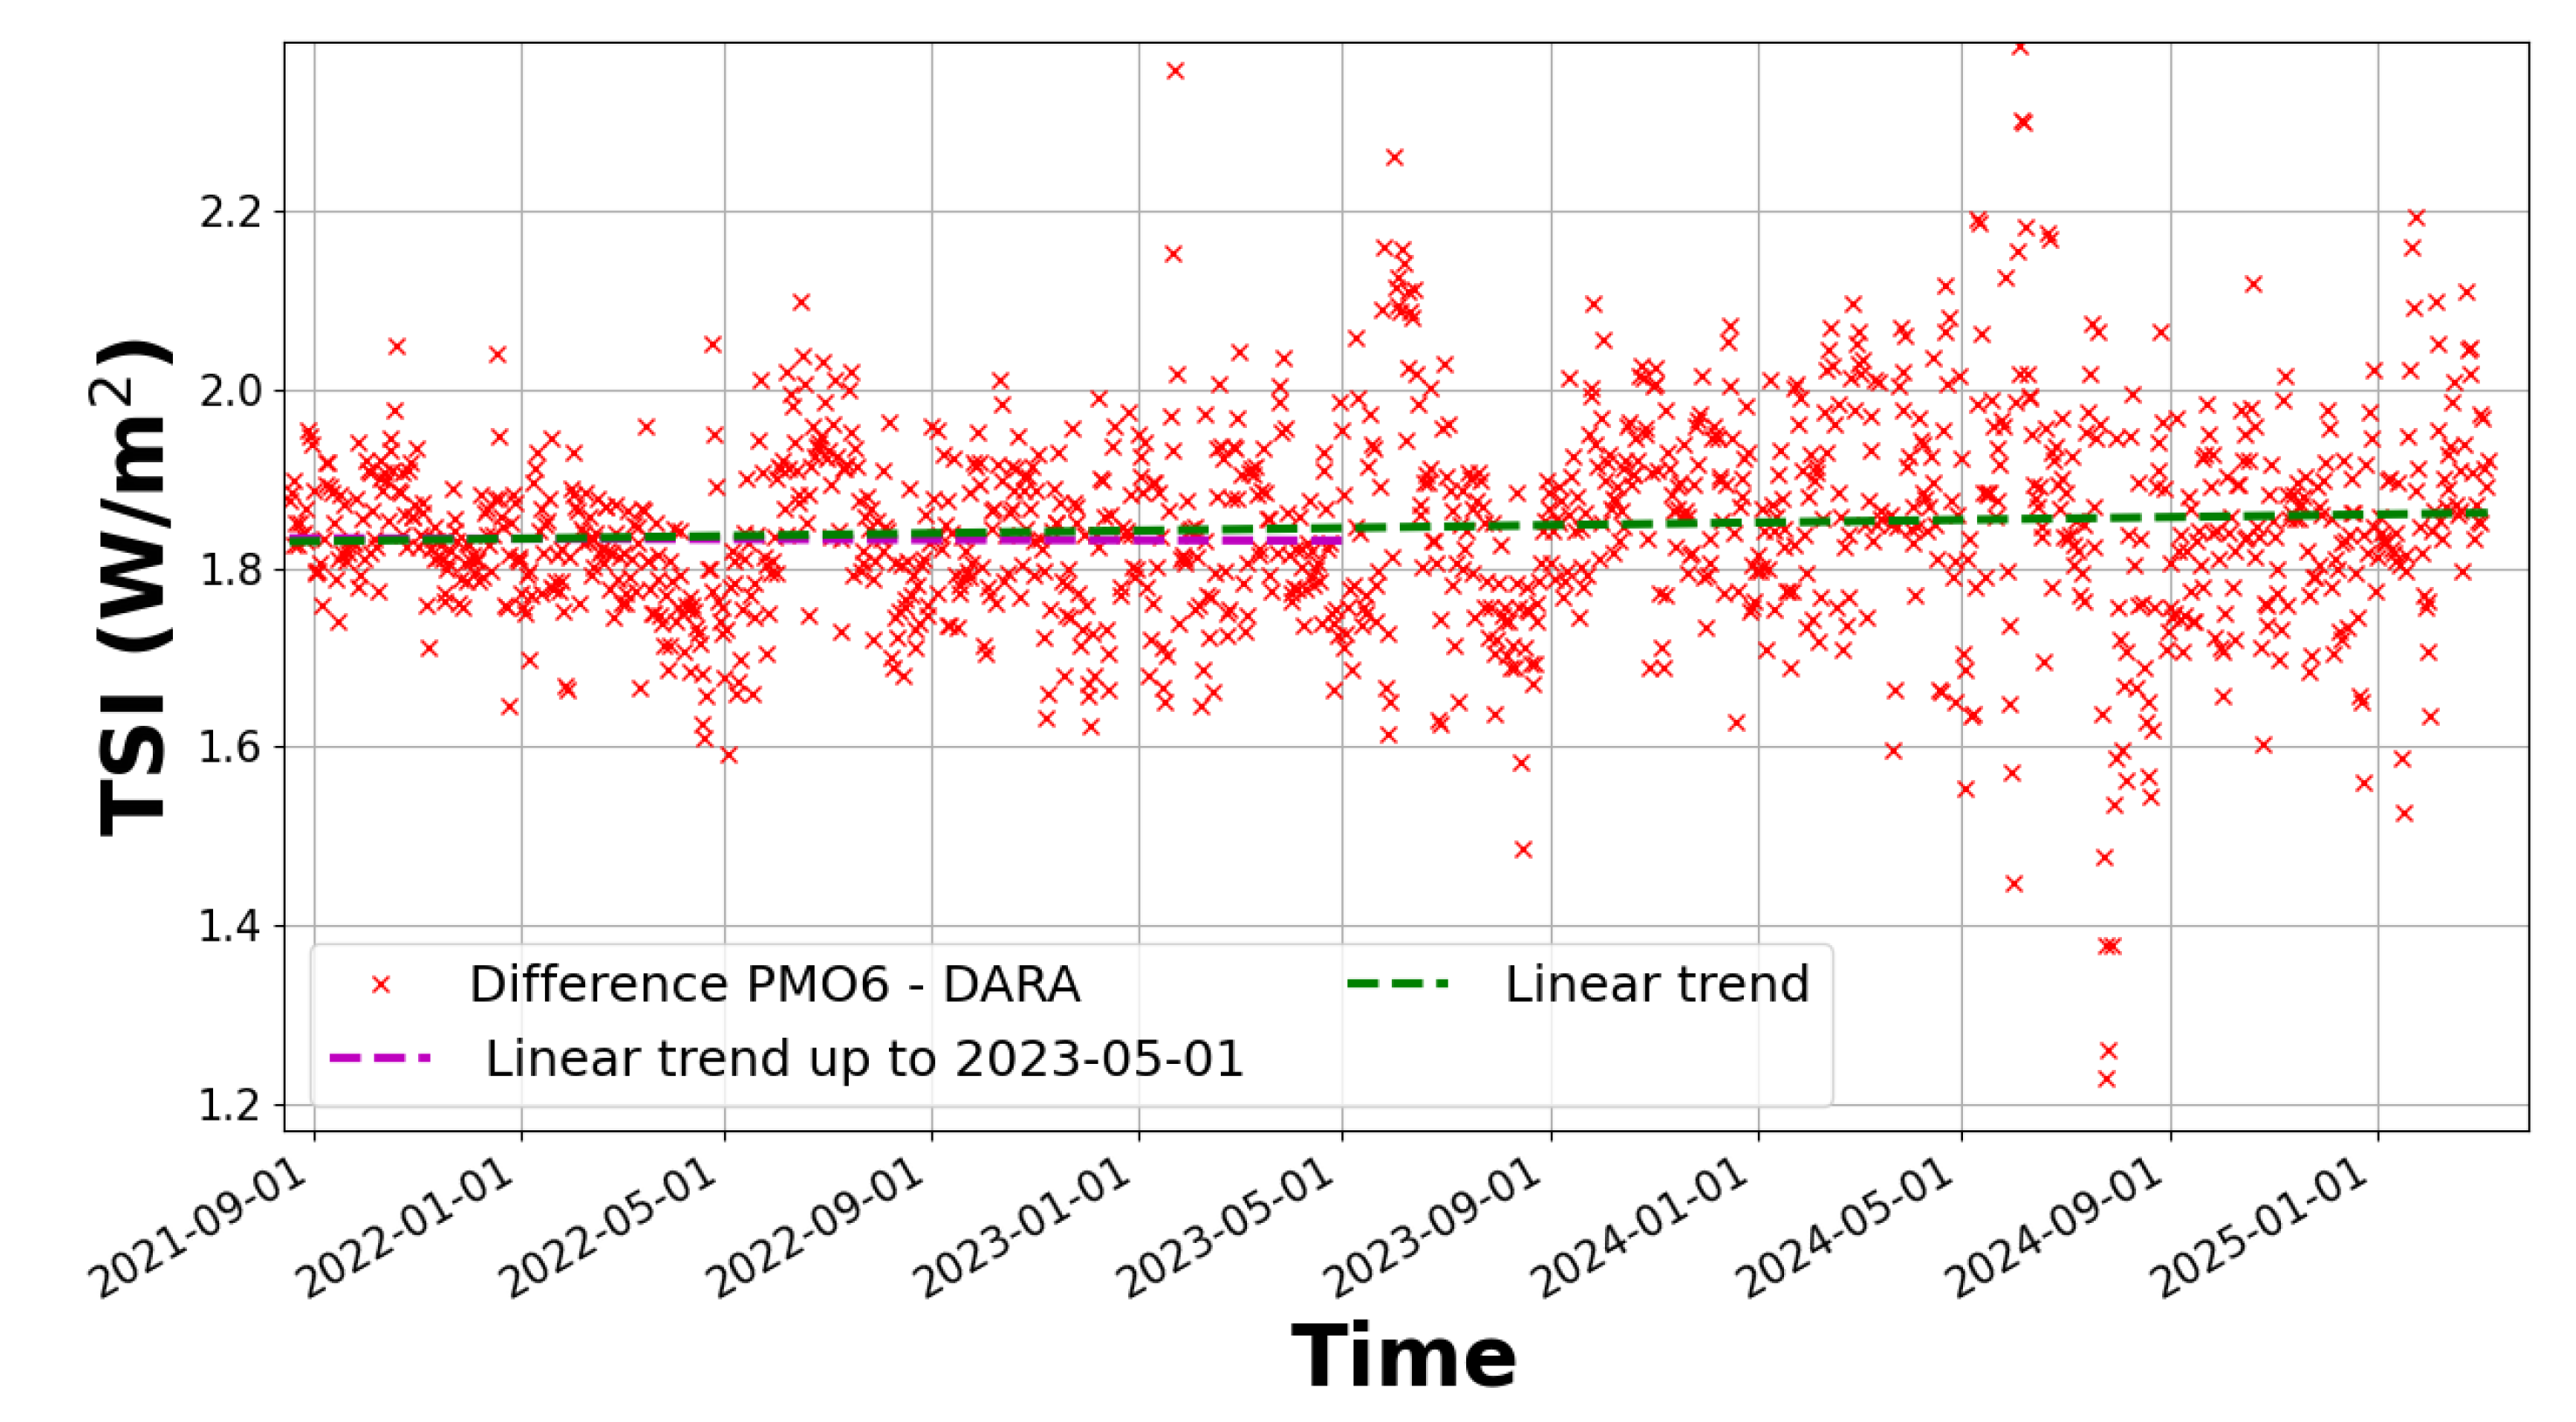
Figure 6.
New composite (C4, orange) based on merging 45 years of TSI measurements. For comparison, C2 [21] and C1 [13] are also shown (grey line). A 30-day running mean of C4 is shown as a yellow/purple dashed line. The orange boxes are associated with the solar minima (SM) for each solar cycle described in Table 3. For context, the monthly sunspot number is also displayed.
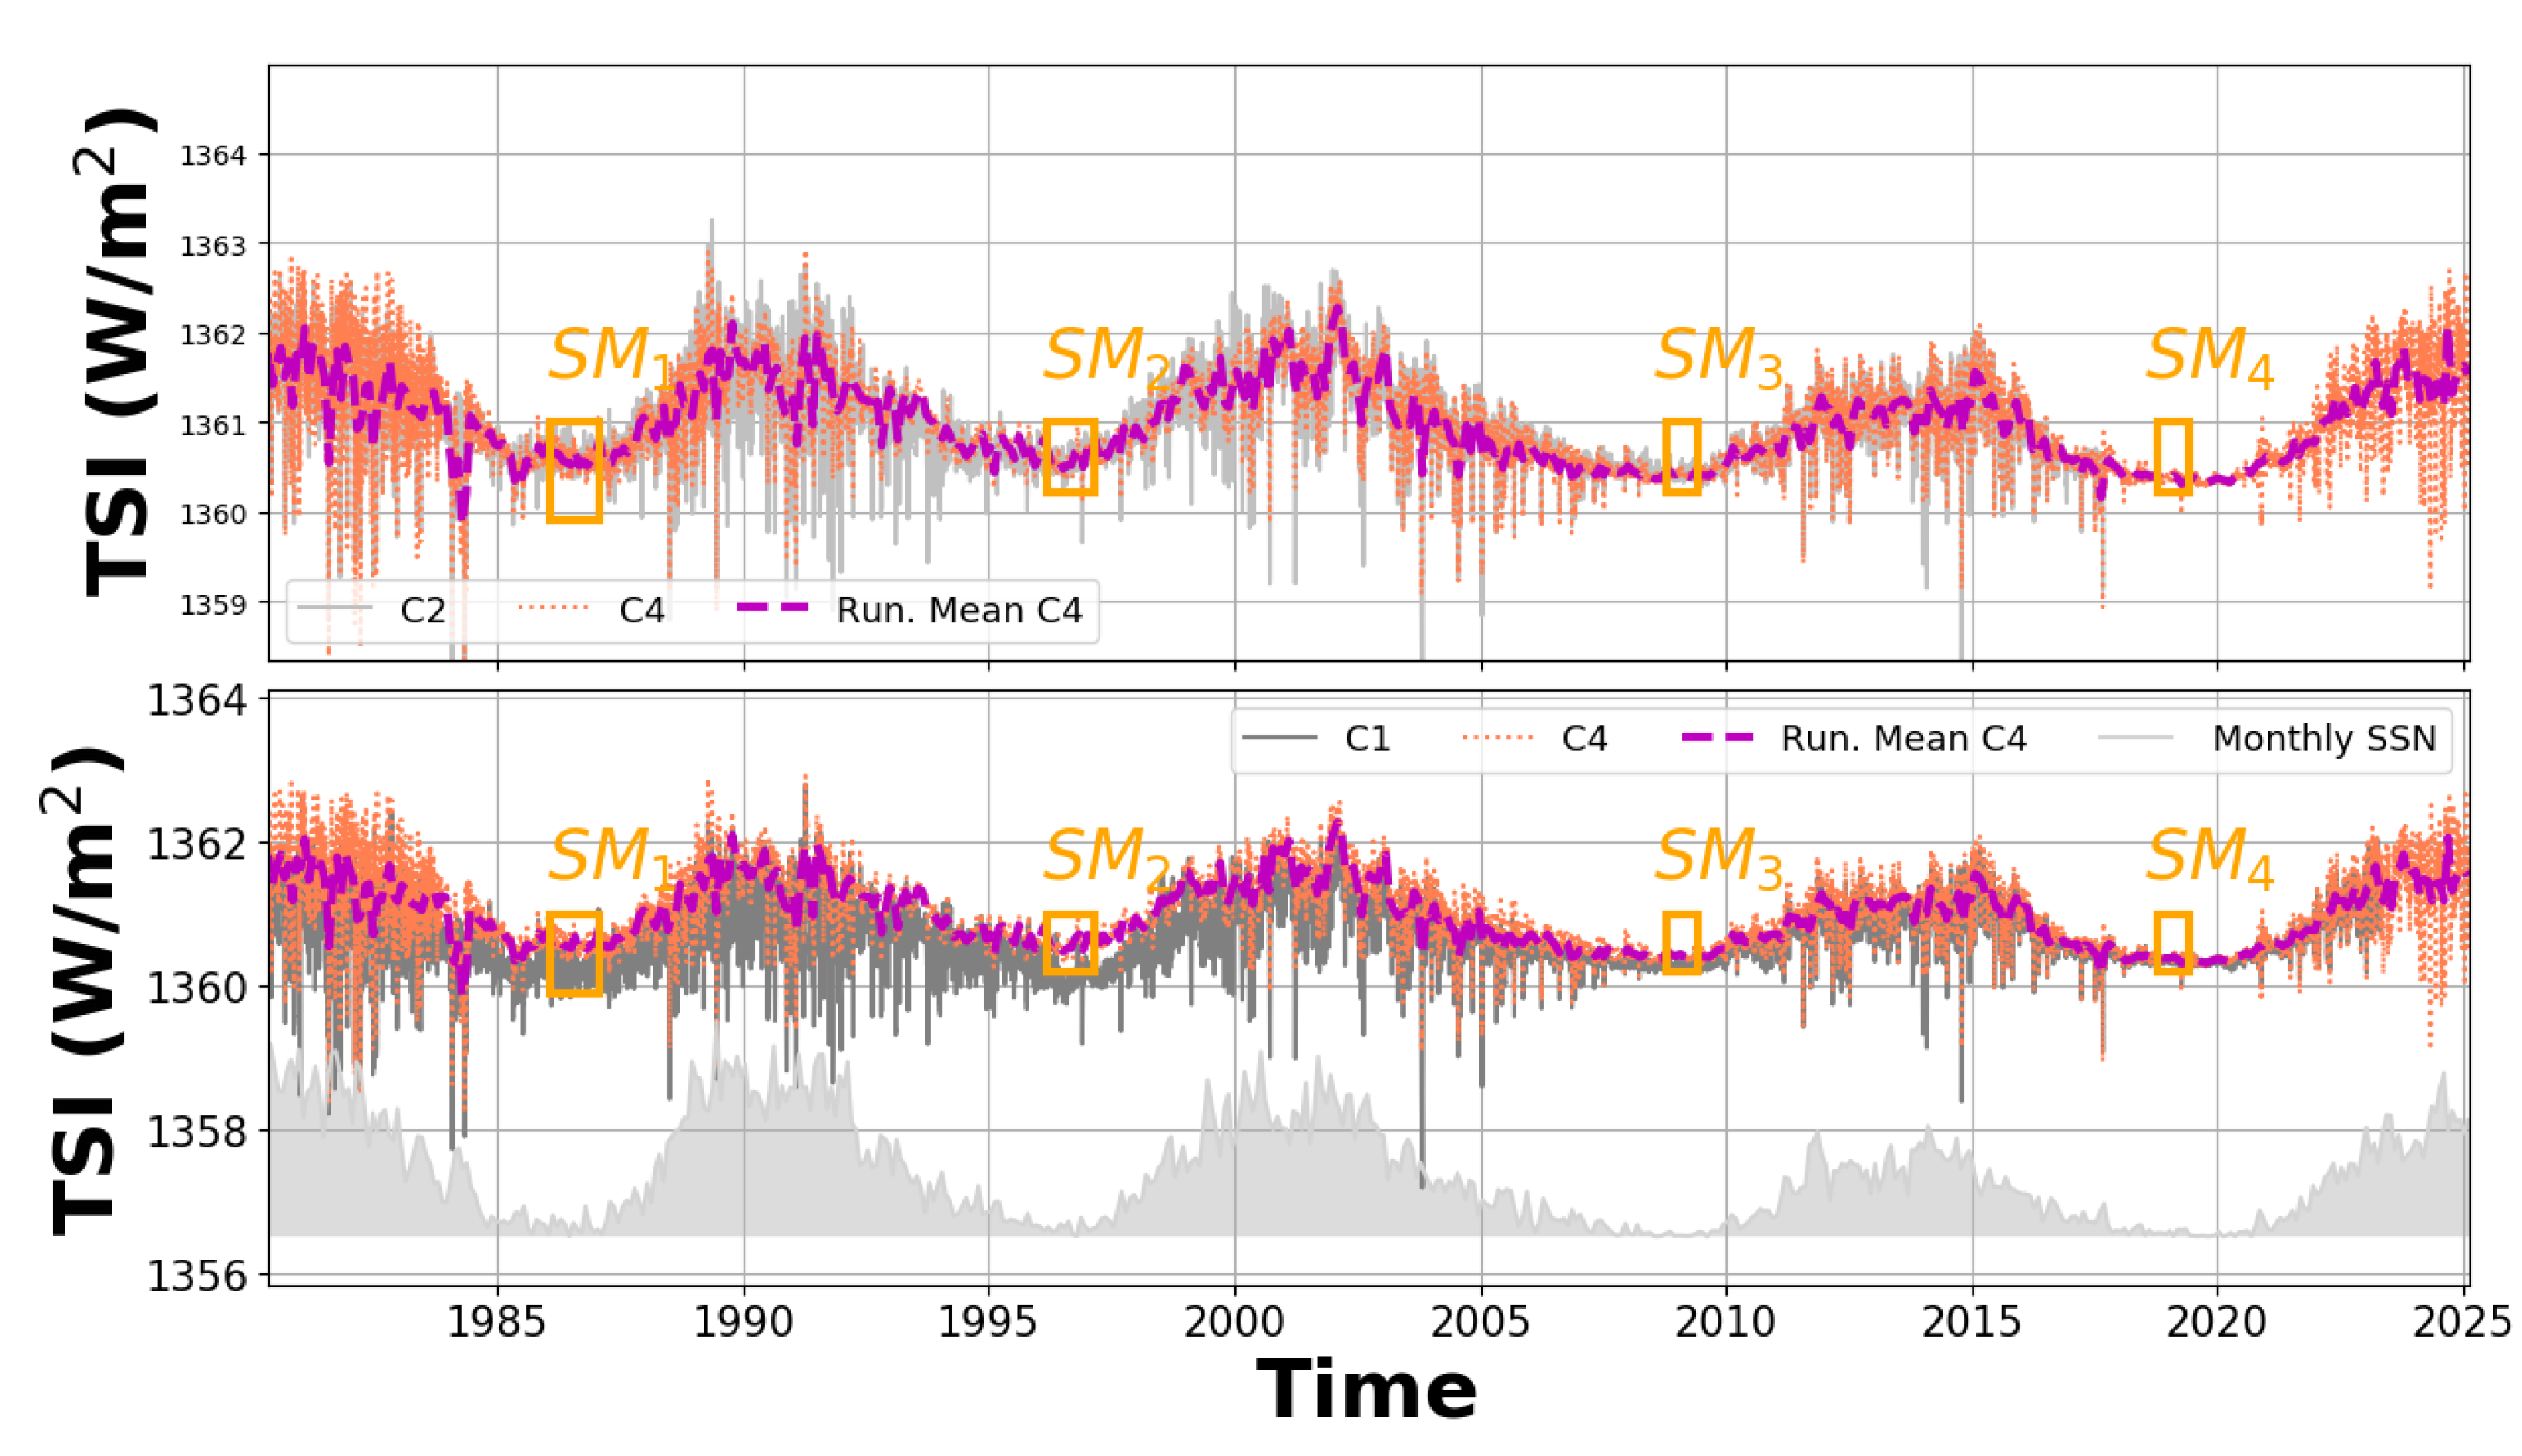

Table 1.
Overview of the datasets used in this study including the start and end dates for each mission and the latest version released by the various centers. * means that the SIAR dataset used in this study ends in November 2024. The DARA dataset ends in April 2025. active means that the instrument is still operating.
| Mission/Experiment/Instrument | Version | Start Date | End Date |
| HF/NIMBUS-7 ERB | - | 11/1978 | 1/1993 |
| ERBE/ERBS | - | 10/1984 | 8/2003 |
| VIRGO/SOHO | PMODv21a (PMO6v8) | 01/1996 | active |
| PREMOS/PICARD | v1 | 06/2010 | 03/2014 |
| ACRIM1/SMM | 1 | 2/1980 | 7/1989 |
| ACRIM2/UARS | 7/14 | 10/1991 | 9/2000 |
| ACRIM3/ACRIMSAT | 11/13 | 04/2000 | 11/2013 |
| TIM/SORCE | 19 | 02/2003 | 02/2020 |
| TIM/TCTE | 4 | 12/2013 | 05/2019 |
| TSIS-1/TIM | 3 | 11/01/2018 | active |
| NORSAT/CLARA | 1 | 07/2017 | active |
| FY3E/JTSIM/DARA | 1 | 07/2021 | active |
| FY3E/JTSIM/SIAR(*) | 1 | 07/2021 | active |
Table 2.
Statistics - mean () ± Uncertainties () in Wm−2 - for various active missions estimated for the period 18 August 2021 - 04 April 2025 . (*) means that we use the hourly product for VIRGO/PMO6. The sampling rate of the TSIS-1/TIM observations is only available in 6-hourly and daily products. The table is divided in two sections corresponding to the statistics estimated on the observations converted in WRR or SI scale.
| Mission/Experiment/Instrument | Minute | (6-)Hourly | Daily | ||||
| TSI level ( [Wm−2]) | |||||||
| WRR Scale | |||||||
| VIRGO/PMO6 | 1365.77 | 0.54 | 1366.05 (*) | 0.47 | 1366.06 | 0.47 | |
| FY3E/JTSIM/DARA | 1364.21 | 0.46 | 1364.22 | 0.46 | 1364.22 | 0.46 | |
| FY3E/JTSIM/SIAR | 1362.12 | 0.47 | 1362.12 | 0.46 | 1362.12 | 0.46 | |
| SI Scale | |||||||
| VIRGO/PMO6 | 1361.13 | 0.54 | 1361.40 (*) | 0.47 | 1361.42 | 0.47 | |
| TSIS-1/TIM | - | - | 1362.48 | 0.44 | 1362.55 | 0.48 | |
| FY3E/JTSIM/DARA | 1359.57 | 0.46 | 1359.58 | 0.46 | 1359.58 | 0.46 | |
| FY3E/JTSIM/SIAR | 1357.49 | 0.47 | 1357.49 | 0.46 | 1357.49 | 0.46 | |
Table 3.
Estimation of TSI at solar minimum (Minimum) over the last 45 years from TSI time series (mean and standard deviation ) released by [13] (C1), by [21] (C2), by [17]Composite 3 (C3) and by [31] (C6). The new TSI composite including the daily JTSIM-DARAv1 product and the daily sampling of the SIAR observations are abbreviated to (C4) and (C5). The difference in irradiance between solar minima (SM) from consecutive solar cycles (e.g., ) is also displayed with the uncertainties (bold text)
| TSI level ( [Wm−2]) | Composite Name | ||||||||||||||
| C1 | C2 | C3 | C4 | C5 | C6 | ||||||||||
| Solar Cycle 21/22 | Minimum () | 1360.51 | 0.13 | 1360.59 | 0.12 | 1360.59 | 0.13 | 1360.59 | 0.13 | 1360.59 | 0.13 | 1360.53 | 0.11 | ||
| - | - | - | - | - | - | - | - | - | - | - | - | ||||
| Solar Cycle 22/23 | Minimum () | 1360.69 | 0.14 | 1360.57 | 0.15 | 1360.59 | 0.13 | 1360.59 | 0.13 | 1360.59 | 0.13 | 1360.51 | 0.12 | ||
| 0.18 | 0.27 | -0.02 | 0.27 | 0.0 | 0.26 | 0.0 | 0.26 | 0.0 | 0.26 | -0.02 | 0.23 | ||||
| Solar Cycle 23/24 | Minimum () | 1360.53 | 0.04 | 1360.42 | 0.06 | 1360.42 | 0.04 | 1360.42 | 0.04 | 1360.42 | 0.04 | 1360.47 | 0.04 | ||
| -0.17 | 0.18 | -0.15 | 0.21 | -0.17 | 0.17 | -0.17 | 0.17 | -0.17 | 0.17 | -0.05 | 0.16 | ||||
| Solar Cycle 24/25 | Minimum () | - | - | - | - | 1360.36 | 0.07 | 1360.36 | 0.07 | 1360.37 | 0.07 | 1360.49 | 0.06 | ||
| - | - | - | - | -0.06 | 0.11 | -0.06 | 0.11 | -0.04 | 0.11 | -0.02 | 0.21 | ||||
Disclaimer/Publisher’s Note: The statements, opinions and data contained in all publications are solely those of the individual author(s) and contributor(s) and not of MDPI and/or the editor(s). MDPI and/or the editor(s) disclaim responsibility for any injury to people or property resulting from any ideas, methods, instructions or products referred to in the content. |
© 2025 by the authors. Licensee MDPI, Basel, Switzerland. This article is an open access article distributed under the terms and conditions of the Creative Commons Attribution (CC BY) license (http://creativecommons.org/licenses/by/4.0/).
Copyright: This open access article is published under a Creative Commons CC BY 4.0 license, which permit the free download, distribution, and reuse, provided that the author and preprint are cited in any reuse.


