
Submitted:
27 August 2025
Posted:
28 August 2025
You are already at the latest version
Preprints on COVID-19 and SARS-CoV-2
Abstract
COVID-19 pandemic significantly disrupted global economies, health systems, and people’s social lives. To this day, some countries still report new cases of COVID-19 infections supporting the need for therapeutic strategies to combat this disease, tar-geting conserved regions within the viral proteins and key host proteins involved in viral entry and replication. This study is built on a previous publication that virtually screened for small molecules strongly binding to the HSPA8–spike protein complex through molecular docking simulations. The current study aimed to provide in-depth insights into the ligand-mediated disruptions of the HSPA8–spike protein complex, focusing on NSC36398 and NSC281245 small molecules. An all-atom molecular dy-namics simulation was performed using GROMACS v2018.6 to determine the dynamic behaviour of the HSPA8–spike protein complex in ligand-free and ligand-bound sys-tems. Post-MD analysis was performed using various tools and software, focusing mainly on structural analysis, conformational dynamics analysis, interaction analysis, and binding free energy calculations. The post-MD analysis validated the previous docking results, highlighting NSC36398 and NSC281245 as promising HSPA8–spike protein complex inhibitors. NSC36398 displayed a modest and stable binding interac-tion characterised by multiple hydrogen bonds and allosterically destabilising the HSPA8–spike protein interaction surface. NSC281245 displayed strong binding to the protein complex with minimal allosteric disruption. These findings suggest that NSC36398 is a promising allosteric inhibitor for HSPA8–spike protein complex, and NSC281245 is also a promising candidate, providing a framework for designing next-generation small-molecule compounds with inhibitory properties towards the host-viral interaction.
Keywords:
SARS-CoV-2 spike protein
; heat shock protein
; molecular dynamics simulations
1. Introduction
Virus to fuse with the host cell membrane. The spike protein is cleaved into S1 and S2 subunits, allowing the spike's S1 subunit, which has the receptor-binding domain (RBD), to interact and bind with ACE2, mediating viral entry [4].
SARS-CoV-2 as a pathogen lacks the necessary components for replication within the host. Hence, the virus depends on the host biomolecules for its survival and propagation. Heat shock proteins (HSPs) are molecular chaperones primarily targeted by viruses and pathogens. Heat shock proteins are regarded as 'housekeepers’ and/or ‘guardians of protein homeostasis' because of the pivotal roles they play in maintaining cell homeostasis, protecting cells from harsh conditions, assisting in protein folding, and presenting immune and inflammatory compounds [5]. HSPs are classified according to molecular weight, with HSP70 being the most studied molecular chaperone. Its counterparts, known as heat shock cognates, are expressed under non-stress conditions. For example, heat shock cognate (HSC70), which is also known as heat shock 70 kDa protein 8 (HSPA8), plays vital roles in regulating protein translocation, protein quality control, and the refolding of misfolded proteins [6,7].
Numerous studies have established that HSPA8 is one of the key molecular chaperones hijacked and manipulated by viruses at various stages of the viral life cycle. A study by Paladino et al. (2020)8 revealed that molecular chaperones HSPA8 and GRP78 bind to the spike glycoprotein on the surface of the cell membrane. Comprehensive review studies by Wang et al. (2020)9 and Chen et al. (2024)10 reviewed that the Dengue virus (DENV) is associated with HSPA8 in facilitating viral entry, in addition to the beta-3 integrin, viral envelope glycoprotein E, and GRP78 (BiP). Moreover, HSPA8 was depicted to participate in the rotavirus invasion, where different strains of rotavirus required the involvement of HSPA8 in their multi-step process for entry into epithelial cells [10]. Pre-treating and incubating HSPA8 with antibodies to HSPA8 significantly blocked both rotavirus and DENV, as reported in studies by Chen et al. (2024)10 and Méndez et al. (1999)11.
In a study conducted by Zhu et al. (2020)12 which aimed to identify molecules localised at the host cell membrane associated with Infectious Bronchitis Virus (IBV), it was determined that HSPA8 potentially interacts with the IBV and is localised on both chicken tissues and cell membranes. IBV is the first coronavirus to be identified. It belongs to the genus gamma-coronavirus in the Coronaviridae family and primarily targets chickens. Previous studies showed that IBV uses heparin sulphate (HS) and alpha-2,3 sialic acid as binding molecules onto the host cells, but its functional receptor was unknown. Zhu et al. (2020)12 employed an immunoprecipitation assay and mass spectrometry analysis and identified HSPA8 as the host cell molecule vital to IBV infection. Zhu et al. (2020)12 stated that HSPA8 has been identified in previous research studies as a biomolecule localised in the cell membrane, which binds with several viruses on the cell surface.
Another known virus, the Japanese encephalitis virus (JEV), is known to initiate infection via clathrin-mediated endocytosis. JEV is a flavivirus transmitted by mosquitoes that causes human encephalitis. The virus is known to enter cells via clathrin-mediated endocytosis. The virus receptor on C6/36 mosquito cells has not yet been identified. In a study by Ren et al. (2007)13, HSC70 found on the C6/36 cell membrane was recognised as a possible receptor that promotes JEV entry into these cells. Subsequent studies have indicated that at 4℃, there was no notable change in the viral RNA levels in both non-knockdown and HSC70 knockdown C6/36 cells. However, at 28°C, HSC70 knockdown cells exhibited reduced viral RNA levels [10].
Moreover, there was a significant decrease in the number of acidic vesicles when HSC70 was knocked down, which suggests that HSC70 does not function as a receptor, as it does not impact the attachment of JEV to the C6/36 cell surface. Instead, HSC70 plays a role in the later stages of clathrin-mediated endocytosis, specifically during the final stages of JEV uncoating. HSC70 facilitates the release of viral RNA from particles internalised via CCVs or endosomes, which is crucial for viral replication. Evidence from the research study suggested that HSPA8 impacts JEV infection in C6/36 cells, but no conclusive experimental evidence demonstrates a direct interaction between JEV proteins and HSC70 [14].
No other paucity of research has been conducted to identify novel selective hits that may interact with the HSPA8–spike protein complex. Our previous studies depicted that the SARS-CoV-2 spike glycoproteins form multiple extensive bonds with molecular chaperone HSPA8, thereby forming a stable complex (HSPA8–spike protein complex) [15,16]. From our virtual screening through ADMET analysis, molecular docking simulations and Prime Molecular Mechanics with Generalized Born and Surface Area solvation (MM/GBSA), two naturally occurring compounds from literature [16,17], 2-(3,4-Dihydroxyphenyl)-3,6,7-trihydroxy-2,3-dihydro-4H-chromen-4-one (NSC36398) and mevastatin (NSC281245) were depicted as promising inhibitors for the protein complex. Key residues (positions 1014−1023 and 1035−1068) making part of the S2 central helix and β-hairpin were determined as the residues involved in the interactions with NSC36398 and NSC281245. These regions have been reported to have high structural and sequence conservation among β-coronaviruses, meaning that small-molecule binders to these regions retain inhibitory activities against the wild-type and future variants [16].
In this study, an all-atom molecular dynamics (MD) simulation on the wild-type ligand–free system (apo state) of the HSPA8–spike protein complex (protein) and the ligand–bound system (protein–NSC36398 complex and protein–NSC281245 complex) (holo state) was performed to study the dynamics of proteins and protein complexes as a function of time, analysing the flexibility behaviour of proteins and interactions in protein complexes. Post-MD analysis focused on structural analysis, conformational dynamics analysis, interaction and exposure analysis, and binding free energy calculations.
2. Results
2.1. Initial Post-MD Analysis: KDE and C-alpha RMSD Analysis
Figure 1 shows the Kernel Density Estimation (KDE) plots of the three systems: ligand-free (Figure 1a), NSC36398–bound (Figure 1b), and NSC281245–bound systems (Figure 1c) generated from the last 50 ns of the simulation. The ligand–free KDE peaks were tightly clustered around 0.48 nm to 0.7 nm, approximately. Slight shifts were observed in the ligand–bound systems KDE peaks, which clustered approximately around 0.6 nm to 1.1 nm (NSC36396-bound system; Figure 1b) and 0.49 nm to 1.1 nm (NSC281245–bound system; Figure 1c).
Over the last 50 ns of the simulation trajectory, the ligand–free system (Figure 2) showed an average RMSD value of 0.623 nm with fluctuations between approximately 0.50 and 0.70 nm. In contrast, the NSC36398–bound system (Figure 2) showed an average RMSD value of 0.733 nm. NSC281245–bound system (Figure 2) displayed an average RMSD value of 0.694 nm. The NSC281245–bound system Cα-RMSD plot fluctuated with occasional transient spikes approaching 1.0 nm
2.2. Structural Analysis
2.2.1. Cα-RMSD Analysis of Functional Domains: HSPA8 SBD
Cα-RMSD analysis was performed on the human HSPA8 substrate-binding domain (SBD) from residue positions 405 to 495 to understand this domain's structural behaviour throughout the simulation (Figure 3). Figure 3 illustrates the ligand–free system’s captured Cα-RMSD plot (red), showing relatively higher structural fluctuations than the two ligand–bound systems, with an average RMSD value of 0.168 nm (from approximately 0.13 to 0.21 nm). In contrast, the NSC36398–bound system exhibited the lowest RMSD values, with an average RMSD value of 0.140 nm (approximately 0.13 to 0.17 nm). The NSC281245–bound system captured Cα-RMSD plot displayed intermediate fluctuations with an average RMSD value of 0.158 nm (ranging from approximately 0.14 to 0.19 nm)
2.2.2. Cα-RMSD Analysis of Functional Domains: Spike Chain A and B RBD
The chain A SARS-CoV-2 spike protein receptor-binding domain (residue positions 455 to 495) was involved in interactions with the host HSPA8. Hence, the Cα-RMSD plots of this RBD portion were generated from both ligand–free and ligand–bound systems. The ligand–free system exhibited the lowest RMSD values, with an average RMSD value of 0.123 nm (ranging from approximately 0.1 to 0.19 nm) (Figure 4a). In contrast, the NSC36398–bound system (Figure 4a) exhibited the highest average RMSD value of 0.202 nm. The NSC36398–bound system had fluctuations between 0.15 and 0.23 nm with frequent peaks above 0.25 nm. The ligand binding of NSC281245 displayed intermediate behaviour, with an average RMSD value of 0.179 nm oscillating between 0.1 and 0.22 nm, frequently reaching maxima peaks above 0.22 nm but below 0.25 nm (Figure 4a).
The spike protein’s chain B region, from residue 333 to 371, interacted with the host molecular chaperone. Figure 4b illustrates the captured Cα-RMSD plots of the ligand–free, NSC36398–bound, and NSC281245–bound systems’ chain B RBD from the last 50 ns of the simulation. The ligand–free system displayed a stable RMSD profile with an average RMSD value of 0.117 nm, fluctuating between 0.11 and 0.13 nm. In contrast, the NSC281245–bound system demonstrated an average RMSD value of 0.121 nm. In contrast, the NSC36398–bound system demonstrated the lowest average RMSD value of 0.108 nm, with deviations consistently below 0.12 nm except for the interval between 155 ns and 160 ns, where it peaked at 0.16 nm.
2.2.3. Cα-RMSD Analysis of Functional Domains: Binding Pocket Relative to NSC36398 and NSC281245
The local structural dynamics of the binding pocket residues relative to each ligand were analysed using amino acid residues within 5 Å of the ligand. Within 5 Å of the ligand NSC36398, a total of 16 amino acid residues were identified which included ALA1016, ARG1019, ALA1020, ASN1023, LEU1024 and THR1027 from chain A of the spike protein, ALA1016 and ALA1020 from chain B, and ALA1016, GLU1017, ALA1020, SER1021, LEU1024, LYS1028, ARG1039 and PHE1042 from chain C of the spike protein (Figure 5a).
A total of 22 amino acid residues were identified within 5 Å of the ligand NSC281245, including residues ALA1016, GLU1017, ARG1019, SER1021, ASN1023, LEU1024, THR1027 and PHE1042 from the spike protein’s chain A, ALA1016, GLU1017, ARG1019, ALA1020, SER1021, ASN1023, LEU1024 and THR1027 from chain B and lastly, ALA1016, ALA1020, SER1021, ASN1023 and LEU1024 from chain C (Figure 5b).
Figure 6a shows the captured RMSD plots of the binding pockets relative to NSC36398. The ligand–free system binding pocket relative to NSC36398 displayed a lower average RMSD value of 0.058 nm, oscillating mostly around 0.045 and 0.065nm (Figure 6a). On the other hand, the NSC36398–bound system displayed an average RMSD value of 0.0674 nm with some fluctuations extending 0.1 nm (Figure 6a). Figure 6b illustrates the RMSD of the binding pocket relative to NSC281245. The ligand–free system had an average RMSD value of 0.056 nm, with fluctuations predominantly between 0.05 and 0.07 nm. Upon NSC281245 binding to the binding pocket, the RMSD plot was slightly reduced, with an average RMSD value of 0.052 nm, fluctuating between 0.04 and 0.065 nm (Figure 6b).
2.2.4. Cα-RMSF Analysis of Functional Domains: HSPA8 SBD
Root mean square fluctuations (RMSF) were carried out on the alpha-carbons (Cα) atoms of each of the functional domains, such as the substrate-binding domain (SBD) of the human HSPA8, the receptor-binding domain of the SARS-CoV-2 spike protein chains and the binding pocket residues relative to each ligand of interest. In addition to the RMSD, the structural dynamics of the HSPA8 SBD in the protein complex in both ligand–free and ligand–bound states were further analysed using RMSF. Figure 7 illustrates the RMSF of the human HSPA8 SBD in the ligand–free and ligand–bound system. The RMSF plot of the ligand–free system demonstrated moderate residue-level fluctuations (average RMSF value of 0.055 nm), with notable peaks around residues 405–412 (the SBD-linker junction), 430–435 (β-subdomain), 480–483 (β6-β7 loop) and 489–495 (β-strand 7).
The NSC36398–bound system RMSF profile (Figure 7), however, indicated a localised increase in residue fluctuations between residue positions 405–410 (the SBD-linker junction), 430–437 (the β-subdomain essential for substrate binding), 450–453 (loop between β4-β5), 462–473 (contributing to co-chaperone interactions and structural stability), (β5-β6 regions), and 480–485 (β6-β7 loop) (Figure 7) with an average RMSF of 0.069 nm. On the other hand, the NSC281245–bound system displayed an intermediate average RMSF value of 0.553 nm, with its RMSF profile closely resembled that of the ligand–free system, with peaks at residue positions 405–410, 430–437, 450–453, 450–453, 462–473, and residue position 480–485.
To determine structural changes over time, the 3D structures of the chaperone’s SBD were extracted at 0 ns, 150 ns and 200 ns in both ligand–free and ligand–bound systems and superimposed using PyMOL (Figure 8). In the ligand–free system, the central SBD β-sandwich remained well-superimposed in all three snapshots. The SBD-linker junction showed an inward compaction and relaxation matching the peaks observed at 405–412 in Figure 8a. The β-strand 2 substrate groove (430–435) showed an outward shift at 150 ns, partially retracting at 200 ns. The β6–β7 loop (480–483) swung outward at 150 ns, followed by a return toward the core, and the β7 (489–495).
The superimposed structures from the NSC36398–bound system displayed that the SBD β-sandwich maintained its rigidity with minimal inter-strand deviations (Figure 8b). In the NSC36398–bound system, the compaction seen in the apo system is almost completely annulled, and the residues 405–410 closely overlap each other in all three structures. The β2 substrate groove (430–437) exhibited increased flexibility in the NSC36398–bound system, and the β6–β7 loop exhibited reduced motions (Figure 8b).
From the RMSF profile, the NSC281245–bound system displayed an intermediate average RMSF value of 0.553 nm. The superimposed structures from the NSC281245–bound structure displayed a rigid β-sandwich as in the other systems (Figure 8c). The SBD-linker junction at residue positions 405–410 displayed a mix of overlapping and deviated conformations across the three conformations. The β2 substrate groove in the NSC281245–bound system displayed a stable conformation with minimal deviations compared to that observed in the NSC36398–bound system. NSC281245 binding resulted in reduced excursions of the β6–β7 loop.
2.2.5. Cα-RMSF Analysis of Functional Domains: Spike Chain A and B RBD
The Cα-RMSF plot of the receptor-binding domain (RBD) of chain A demonstrated notable variation in flexibility between the ligand–free and ligand–bound states (Figure 9a). The ligand–free system exhibited mild fluctuations throughout the region, with an average RMSF value of 0.060 nm, peaking at amino acid residue positions 475 to 477 and 481 to 483. NSC36398 binding increased local residue mobility (with an average RMSF value of 0.087 nm), particularly peaking between residues 481 and 485, depicting enhanced local flexibility. In contrast, NSC281245 binding exhibited reduced fluctuations relative to NSC36398–bound system (with an average RMSF value of 0.062 nm). Compared to NSC36398 binding, NSC281245 binding results in greater stabilisation of the glycoprotein chain A’s RBD (Figure 9a).
Figure 9b provided valuable insights into the residue flexibility over time of residue positions 333 to 371 of chain B RBD. In the ligand–free system, the RMSF values ranged from approximately 0.039 nm to 0.122 nm, with peaks at residue positions 340, 344 to 346, 358 and 370 (with an average RMSF of 0.057). The binding of ligand NSC36398 induced increased residue-level fluctuation, particularly around residues 337 to 341, 355 to 360 and 362 to 369. The captured RMSF of the NSC36398–bound system (Figure 9b) exhibited fluctuations spanning from 0.04 nm to 0.103 nm, with an average RMSF value of 0.065 nm. In contrast, NSC281245 binding displayed a relatively stable RMSF profile ranging from 0.037 nm to 0.101 nm with an average RMSF value of 0.052 nm (Figure 9b). NSC281245 displayed RMSF values that remain significantly lower than those of the ligand–free and NSC36398–bound system. In the NSC281245–bound system, residues 344–346 exhibit identifiable RMSF peaks (~0.062–0.081 nm), still lower than those observed in both the ligand–free system (0.039–0.122 nm, mean 0.057 nm) and the NSC36398–bound system (0.040–0.103 nm, mean 0.065 nm).
The structural changes of chain A RBD over time were assessed by superimposing structures extracted at 0 ns (green), 150 ns (red), and at 200 ns (beige) from both ligand–free and ligand–bound systems (Figure 10). Analysis of the ligand–free RBD from chain A (Figure 10a) displayed reversible fluctuations with no persistent distortions. The receptor-binding motif (residues 456–459) remained tightly clustered across 0 ns, 150 ns and 200 ns with RMSF peaking modestly at approximately 0.073 nm. The adjacent loops at positions 467–469 and 470–472 gradually tightened by 200 ns, consistent with the observed slight decrease in loop-to-core separation. The β-sheet segment of the RBD (at residue positions 475–479 transiently opened at 150 ns, which then partially recovered by 200 ns. The disulphide-anchored region, made up of residues 480–483, displayed a structural deviation at 150 ns with structures at 0 ns and 200 ns remaining relatively superimposed, confirming its role as a rigid scaffold.
The RBM core (residues 456–460) in the NSC36398–bound system (Figure 10b) deviated from the 0 ns conformation at both 150 ns and 200 ns, corresponding to a pronounced RMSF peak. The β-sheet section (residues 475–477) fully disassembled, detaching from its original framework. The disulphide-anchored loop (residues 480–491) gradually elongated throughout time, with its midpoint migrating outward. The extreme C-terminus (residues 493–495) displaced outward simultaneously with the disulphide loop (Figure 10b). In contrast, the RBM (456–460) in the NSC281245–bound system remained mostly superimposed (Figure 10c). The adjacent loop at residues 469–472 showed a transient separation at 150 ns that reverts to a near-baseline by 200 ns. The co-chaperone-interface region (residues 462–467) and the C-terminal tail at residues 489–495 exhibited higher flexibility.
Structural changes of the spike’s chain B residues were also assessed in both ligand–free and ligand–bound systems (Figure 11). The ligand–free system (Figure 11a), the chain B RBD exhibited moderate but distinct conformational flexibility across key loops and regions. The β-sheet motif (residues 335–347) revealed pronounced conformational mobility. The region 364–371 underwent reversible displacements shown by the divergence at 150 ns, which was followed by a partial re-alignment by 200 ns. Similarly, the β-strand region 356–360 underwent a minor reversible displacement, which is evidenced by a similar divergence at 150 ns, followed by re-alignment at 200 ns (Figure 11a).
In contrast, residues 333–347 from the NSC36398–bound system (Figure 11b) displayed a persistent divergence across 150 ns (red) and 200 ns (beige), with minor reversals to the initial structure (0 ns). NSC36398 binding also propagated enhanced flexibility of β3 (residues 353–360), which was characterised by loop separation (deviation of 150 ns and 200 ns from the initial structure). The region consisting of residues 365–371 displayed a C-terminal displacement at 200 ns. NSC281245 binding resulted in the stabilisation of the majority of RBD regions (Figure 11c). Residues 333–347 exhibited minimal structural deviations, supported by the observed RMSF values, notably lower than those in the ligand–free and NSC36398–bound systems. While residues 365–371 from Figure 11c retained minor flexibility, residues 353–361 displayed a somewhat rigidified character, characterised by notable structural deviations, especially at 150 ns, that reverted to the initial structure by 200 ns.
2.2.6. Cα-RMSF Analysis of Functional Domains: Binding Pocket Residues Relative to NSC36398 and NSC281245
This study performed Cα-RMSF analysis relative to the ligands NSC36398 and NSC281245 using amino acid residues found within 5 Å of each ligand. Figure 12 shows the captured Cα-RMSF of the residues within 5 Å of each ligand in both ligand–free and ligand–bound systems. The captured Cα-RMSF analysis revealed apparent differences between the ligand–free (average RMSF of 0.037 nm) and NSC36398–bound simulations (average RMSF of 0.039 nm) (Figure 12a). In Figure 12a, residues ALA1019 and ALA1020 from chain A, ALA1016 from chain B, and ALA1016, GLU1017 and LYS1028 from chain C demonstrated a decreased fluctuation (became constrained) in the presence of NSC36398 compared to that of the ligand–free system. In the apo-state of the system, residues ALA1019 and ALA1020 from chain A, ALA1016 from chain B, and ALA1016, GLU1017 and LYS1028 exhibited elevated RMSF values.
While notable ligand-induced rigidifications were noted in key residues, the holo-state Cα-RMSF profile also revealed increased residue-level fluctuations. Particularly, chain A amino acid residues ALA1016, ASN1023, LEU1024 and THR1027; chain B amino acid residues ALA1020; and chain C amino acid residues ALA1020, SER1021, LEU1024, ARG1039 and PHE1042 all showed increased mobility upon NSC36398 binding, mirroring the mixed fluctuation/rigidity behaviour (Figure 12a).
Figure 12b illustrates how NSC281245 binding alters local residue behaviour within the identified S2 subunit binding pocket. In the ligand–free state, binding pocket residues demonstrated moderate overall fluctuation, with an average RMSF of 0.039 nm. Binding pocket residues fluctuated between 0.033 nm and 0.047 nm. In contrast, NSC281245 binding revealed a decrease in RMSF values in residues ALA1016, GLU1017, ALA1020, SER1021, LEU1024 and THR1027 from chain A, ARG1019, ALA1020, SER1021, ASN1023, LEU1024 and THR1027 from chain B, and lastly ALA1020 and SER1021 from chain C (Figure 12b).
2.2.7. Radius of Gyration Analysis of Functional Domains: HSPA8 SBD
This study examined the compactness of the human chaperone SBD in complex with the viral RBD portion of the spike protein using the gmx gyrate module in both ligand–free and ligand–bound systems (Figure 13). The ligand–free system HSPA8 SBD within the protein complex displayed an average Rg value of 1.472 nm, fluctuating between 1.444 nm and 1.499 nm. These values indicate moderate compactness of the SBD.
In contrast, NSC36398 binding induced a decrease in the Rg values. The NSC36398–bound system had an average Rg value of 1.418 nm, fluctuating between 1.388 nm and 1.455 nm. On the other hand, NSC281245–bound system exhibited a slightly higher average Rg value of 1.477 nm, fluctuating between 1.452nm and 1.503 nm, relative to the ligand–free system.
2.2.8. Radius of Gyration Analysis of Functional Domains: Spike Chain A and B RBD
The radius of gyration of chains A and B RBD was calculated similarly, using the gmx gyrate module of GROMACS. Figure 14 shows the Rg plots of chain A RBD (Figure 14a) and chain B RBD (Figure 14b) in ligand–free and ligand–bound systems. Ligand–free system’s chain A RBD exhibited the lowest average Rg value of 1.206 nm, fluctuating between 1.166 nm and 1.243 nm. NSC36398 binding to the HSPA8–spike protein complex slightly increased Rg values, with an average Rg of 1.224 nm and stable fluctuations between 1.172 nm and 1.297 nm. NSC281245–bound system had an average Rg value of 1.231 nm and stable fluctuations from 1.195 nm to 1.268 nm (Figure 14a).
Figure 14b displays the Rg profiles of the complex’s spike protein chain B in its apo–state with SBD, and its holo–state. Ligand–free system displayed an average Rg value of 1.223 nm, fluctuating within the range of 1.230 nm and 1.248 nm. In contrast, NSC36398 binding resulted in slightly higher average Rg values of 1.230 nm, fluctuating within the range of 1.197 nm to 1.270 nm. The NSC281245–bound system Rg profile exhibited the highest average Rg value of 1.248 nm, fluctuating between 1.208 nm and 1.289 nm.
2.2.9. Radius of Gyration Analysis of Functional Domains: Binding Pocket Relative to NSC36398 and NSC281245
The radius of gyration plots (Figure 15) of the binding pocket relative to the ligands NSC36398 (Figure 15a) and NSC281245 (Figure 15b) revealed distinct structural compactness in both the HSPA8–spike protein complex’s apo– and holo–states. Relative to NSC36398, the apo–state binding pocket exhibited an average Rg value of 0.960 nm, ranging from 0.932 nm to 0.990 nm. NSC36398–bound system Rg profile displayed a more compact structure with an average Rg value of 0.901 nm, fluctuating from 0.874 nm to 0.927 nm (Figure 15a).
In the computed Rg profile of the binding pocket relative to NSC281245, ligand–free system binding pocket had an average Rg value of 0.913 nm, fluctuating between 0.878 nm and 0.950 nm (Figure 15b). Upon NSC281245 binding, the NSC281245–bound system demonstrated an average Rg value of 0.858 nm, fluctuating from 0.839 nm to 0.881 nm. In contrast to the NSC36398–bound system, NSC281245–bound system demonstrated a low Rg value.
2.3. Conformational Dynamics Analysis
2.3.1. HSPA8 Substrate-Binding Domain Principal Component Analysis
Figure 16 shows the PCA projection plots (PC1 and PC2) of the ligand–free and ligand–bound systems’ SBD. The PCA projection plots for the human HSPA8 SBD revealed distinct differences in sampled conformational landscapes across all three systems. The apo–SBD PCA projections revealed a unimodal distributed, wide ensemble of conformational space starting from 150 ns (purple) to 200 ns (yellow). In the ligand–free system, the SBD’s PC1 had ~15.9% variance, with PC2 accounting for ~12.1%, and a cumulative variance of ~28.0% (Figure 16a).
The NSC36398–bound system’s PC distribution shifted towards PC1 as the simulation progressed (Figure 16b). The human HSPA8 SBD PC1 from the NSC36398–bound system accounted for 40.5% of the variance, and PC2 accounted for 9.3%, capturing a cumulative variance of 49.8%. The 2D projections of the NSC36398–bound system displayed a bimodal distribution, indicating reduced conformational diversity. In contrast, NSC281245–bound system’s SBD PC1 (14.0%) and PC2 (10.3%) (Figure 16c). The NSC281245–bound system exhibited a cumulative variance of 24.3%, lower than that of the ligand–free and NSC36398–bound systems. The 2D projections of the NSC281245–bound system revealed two moderately separated clusters: at early frames (approximately frame 2000) and late frames (approximately 4000–5000).
2.3.2. Spike Protein Chain A Receptor-Binding Domain Principal Component Analysis
Across all three systems, the PC1–PC2 of viral chain A RBD displayed the most dominant motions and accounted for the most significant cumulative variance. The PCA projections of the chain A RBD in the ligand–free system (Figure 17a) displayed a unimodal and continuous conformational ensemble. In the ligand–free system, chain A RBD’s PC1 accounted for 29.1% of the variance, and PC2 captured 12.2%. Chain A RBD sampled a cumulative variance of 41.3%. NSC36398 binding to the viral S2 subunit in the HSPA8–spike protein complex induced a bimodal conformational ensemble in the chain A RBD, shifting mostly towards PC1 (Figure 17b). In the NSC36398–bound system, PC1 accounted for 31.6% of the variance, and PC2 accounted for 21.7%. The PCs accounted for a cumulative variance of 53.3%, higher than that exhibited in the ligand–free system (with a cumulative frequency of 41.3%).
In contrast, the NSC281245–bound system’s PCA projections exhibited distinct conformational preferences with a more complex conformational distribution. PC1 is still a significant component in the system, but the chain A RBD explores a restricted range of conformations across the two components. PC1 accounted for 22.3% of the variance and PC2 accounted for 16.8%, with a cumulative variance of 39.1%. The PCA projections of the NSC281245–bound system (Figure 17c) exhibited two preferred conformational clusters, which aren’t separated as those of the NSC36398–bound system.
2.3.3. Spike Protein Chain B Receptor-Binding Domain Principal Component Analysis
The PCA of spike chain B RBD indicated that PC1–PC2 primarily captured the most significant combined variance across (Figure 18). In the ligand–free system (Figure 18a), PC1–PC2 projection (cumulative variance of 34.9%) displayed a bimodal conformational distribution along PC1 (accounting for 20.6%), with PC2 (accounting for 14.3%) tightly constrained. Interestingly, NSC36398 binding shifted the PCA distribution from the bimodal conformation depicted in the ligand–free system to three compact clusters in PC1–PC2 (cumulative variance of 35.7%) (Figure 18b).
From the PCA calculations of the chain B RBD in the NSC36398–bound system, PC1 accounted for 22.4% of the variance, and PC2 accounted for 13.3%. In contrast, NSC281245 binding resulted in a moderate modulation of chain B RBD, as shown in Figure 18c. In the NSC281245–bound system, chain B RBD displayed a unimodal distribution while maintaining a dynamic heterogeneity. PC1–PC2 (cumulative variance of 27.0%) exhibited a dampened conformational distribution, showing the overlap between the early and late frames.
2.3.4. Principal Component Analysis of the HSPA8–Spike Protein Complex Binding Pocket Relative to NSC36398
In both systems, PC1–PC2 captured the most significant cumulative variance (Figure 19). In the ligand–free system (Figure 19a), PC1–PC2 of the binding pocket located on the S2 subunit sampled a broad, unimodal isotropic cloud with no distinct clustering. PC1 accounted for 17.7% of the variance, and PC2 accounted for 10.9% (cumulative variance 28.6%). In the NSC36398–bound system (Figure 5.26b), PC1–PC2 projection (cumulative variance 28.5%) displayed a slight narrowing along PC1 (16.0%) and a weak temporal shift along PC2 (12.5%).
2.3.5. Principal Component Analysis of the HSPA8–Spike Protein Complex Binding Pocket Relative to NSC281245
As in the NSC36398 binding pocket principal component analysis, PC1–PC2 projections of the binding pocket relative to NSC281245 were the primary view in both systems. In the ligand–free system’s binding pocket, PC1 projection accounted for 18.4% of the variance, and PC2 accounted for 12.4%, giving a total cumulative variance of 30.8%. PC1–PC2 projection exhibited conformational heterogeneity with no dominant clusters, indicating high-apo state flexibility with no stable sub states (Figure 20a).
In contrast, NSC281245 induced moderate local rearrangement, dampening amplitude motions captured by PC1, whilst retaining significant secondary flexibility. PC1 of the NSC281245–bound system accounted for 14.6% of the variance, and PC2 accounted for 14.7%. PC1–PC2 (cumulative variance of 23.6%) of the holo binding pocket indicated a reduced conformational heterogeneity (Figure 20b). Compared to the PC1–PC2 (cumulative variance of 30.8%) projections from the NSC36398–bound system, there are no transparent temporal gradients along PC1 or PC2.
2.4. Interaction Analysis
2.4.1. Analysis of Hydrogen Bond Interactions between the S2 Binding Pocket and NSC36398
This study counted the number of hydrogen bonds present throughout the last 50 ns. Three complementary representations, as shown in Figure 22, were generated from the hydrogen bond interaction analysis. From Figure 22a, an average hydrogen bond count of around 3–4 was identified from the NSC36398–bound system’s hydrogen bond interaction. NSC36398 formed 1–3 hydrogen bonds with the S2 binding pocket for most of the simulation trajectory. Between ~155–175 ns, the number of hydrogen bonds rose to 4–5, which indicated a portion of enhanced polar complementarity. After ~175 ns, the number of hydrogen bonds stabilises again around 1–3.
Figure 21.
Temporal analysis of hydrogen-bond interactions between the HSPA8–spike protein complex and the small-molecule ligand NSC36398 (a) Number of inter-molecular hydrogen bonds detected over the 150–200 ns trajectory simulation. (b) Number of donor–acceptor atom pairs within 0.35 nm over the same timeframe. (c) Existence map of individual hydrogen bonds (indexed 1–18).
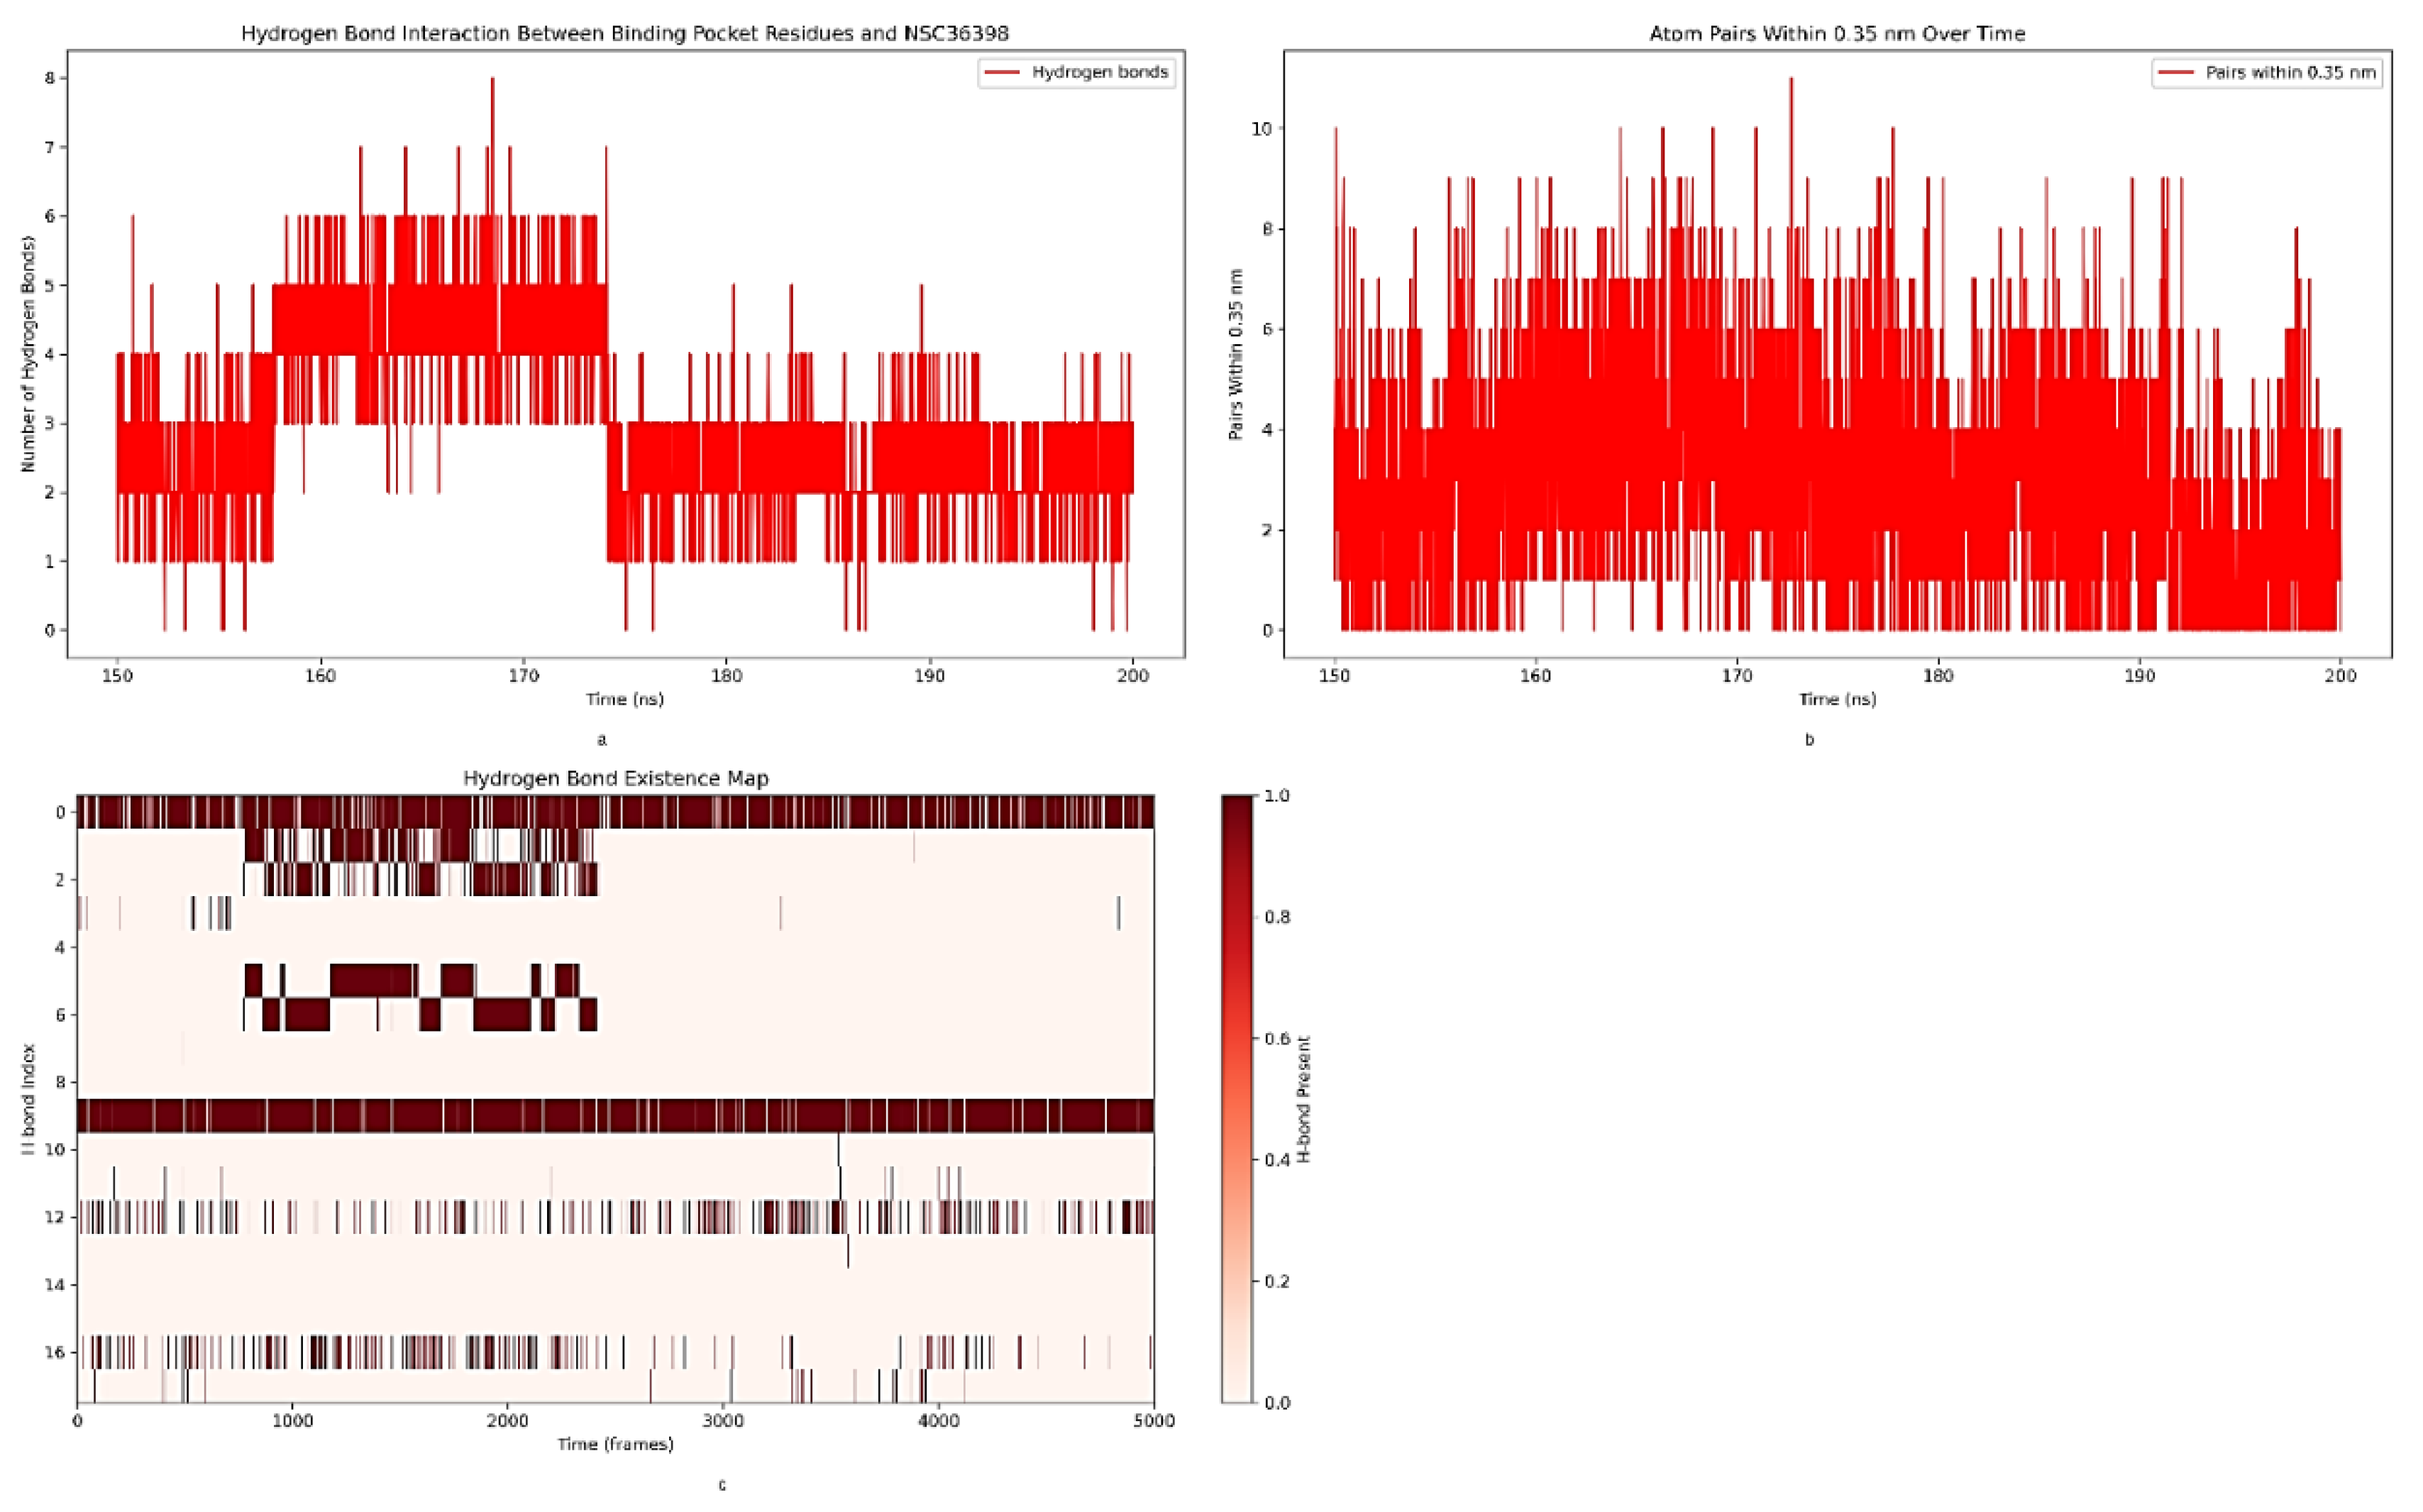
Figure 22b shows the calculated donor-acceptor atom pairs within 0.35 nm over the 150–200 ns trajectory. The image highlighted transient close contacts beyond the defined hydrogen bonds. Significant fluctuations were exhibited from the generated donor-acceptor atom pairs within 0.35 nm, indicative of variability in atom pair interactions. The number of atom pairs varied widely, from 0 to 10. Figure 22c displayed an occupancy of hydrogen bonds, which ranged between 0 % and 100 % throughout the simulation. The hydrogen bond existence map exhibited persistent hydrogen bonds with high occupancy (H-bond index 0 and 9). Other hydrogen bonds exhibited intermediate occupancy (H-bond index 5–7), whereas others showed low occupancy (H-bond index 12, 14 and 16).
2.4.2. Analysis of Hydrogen Bond Interactions between the S2 Binding Pocket and NSC281245
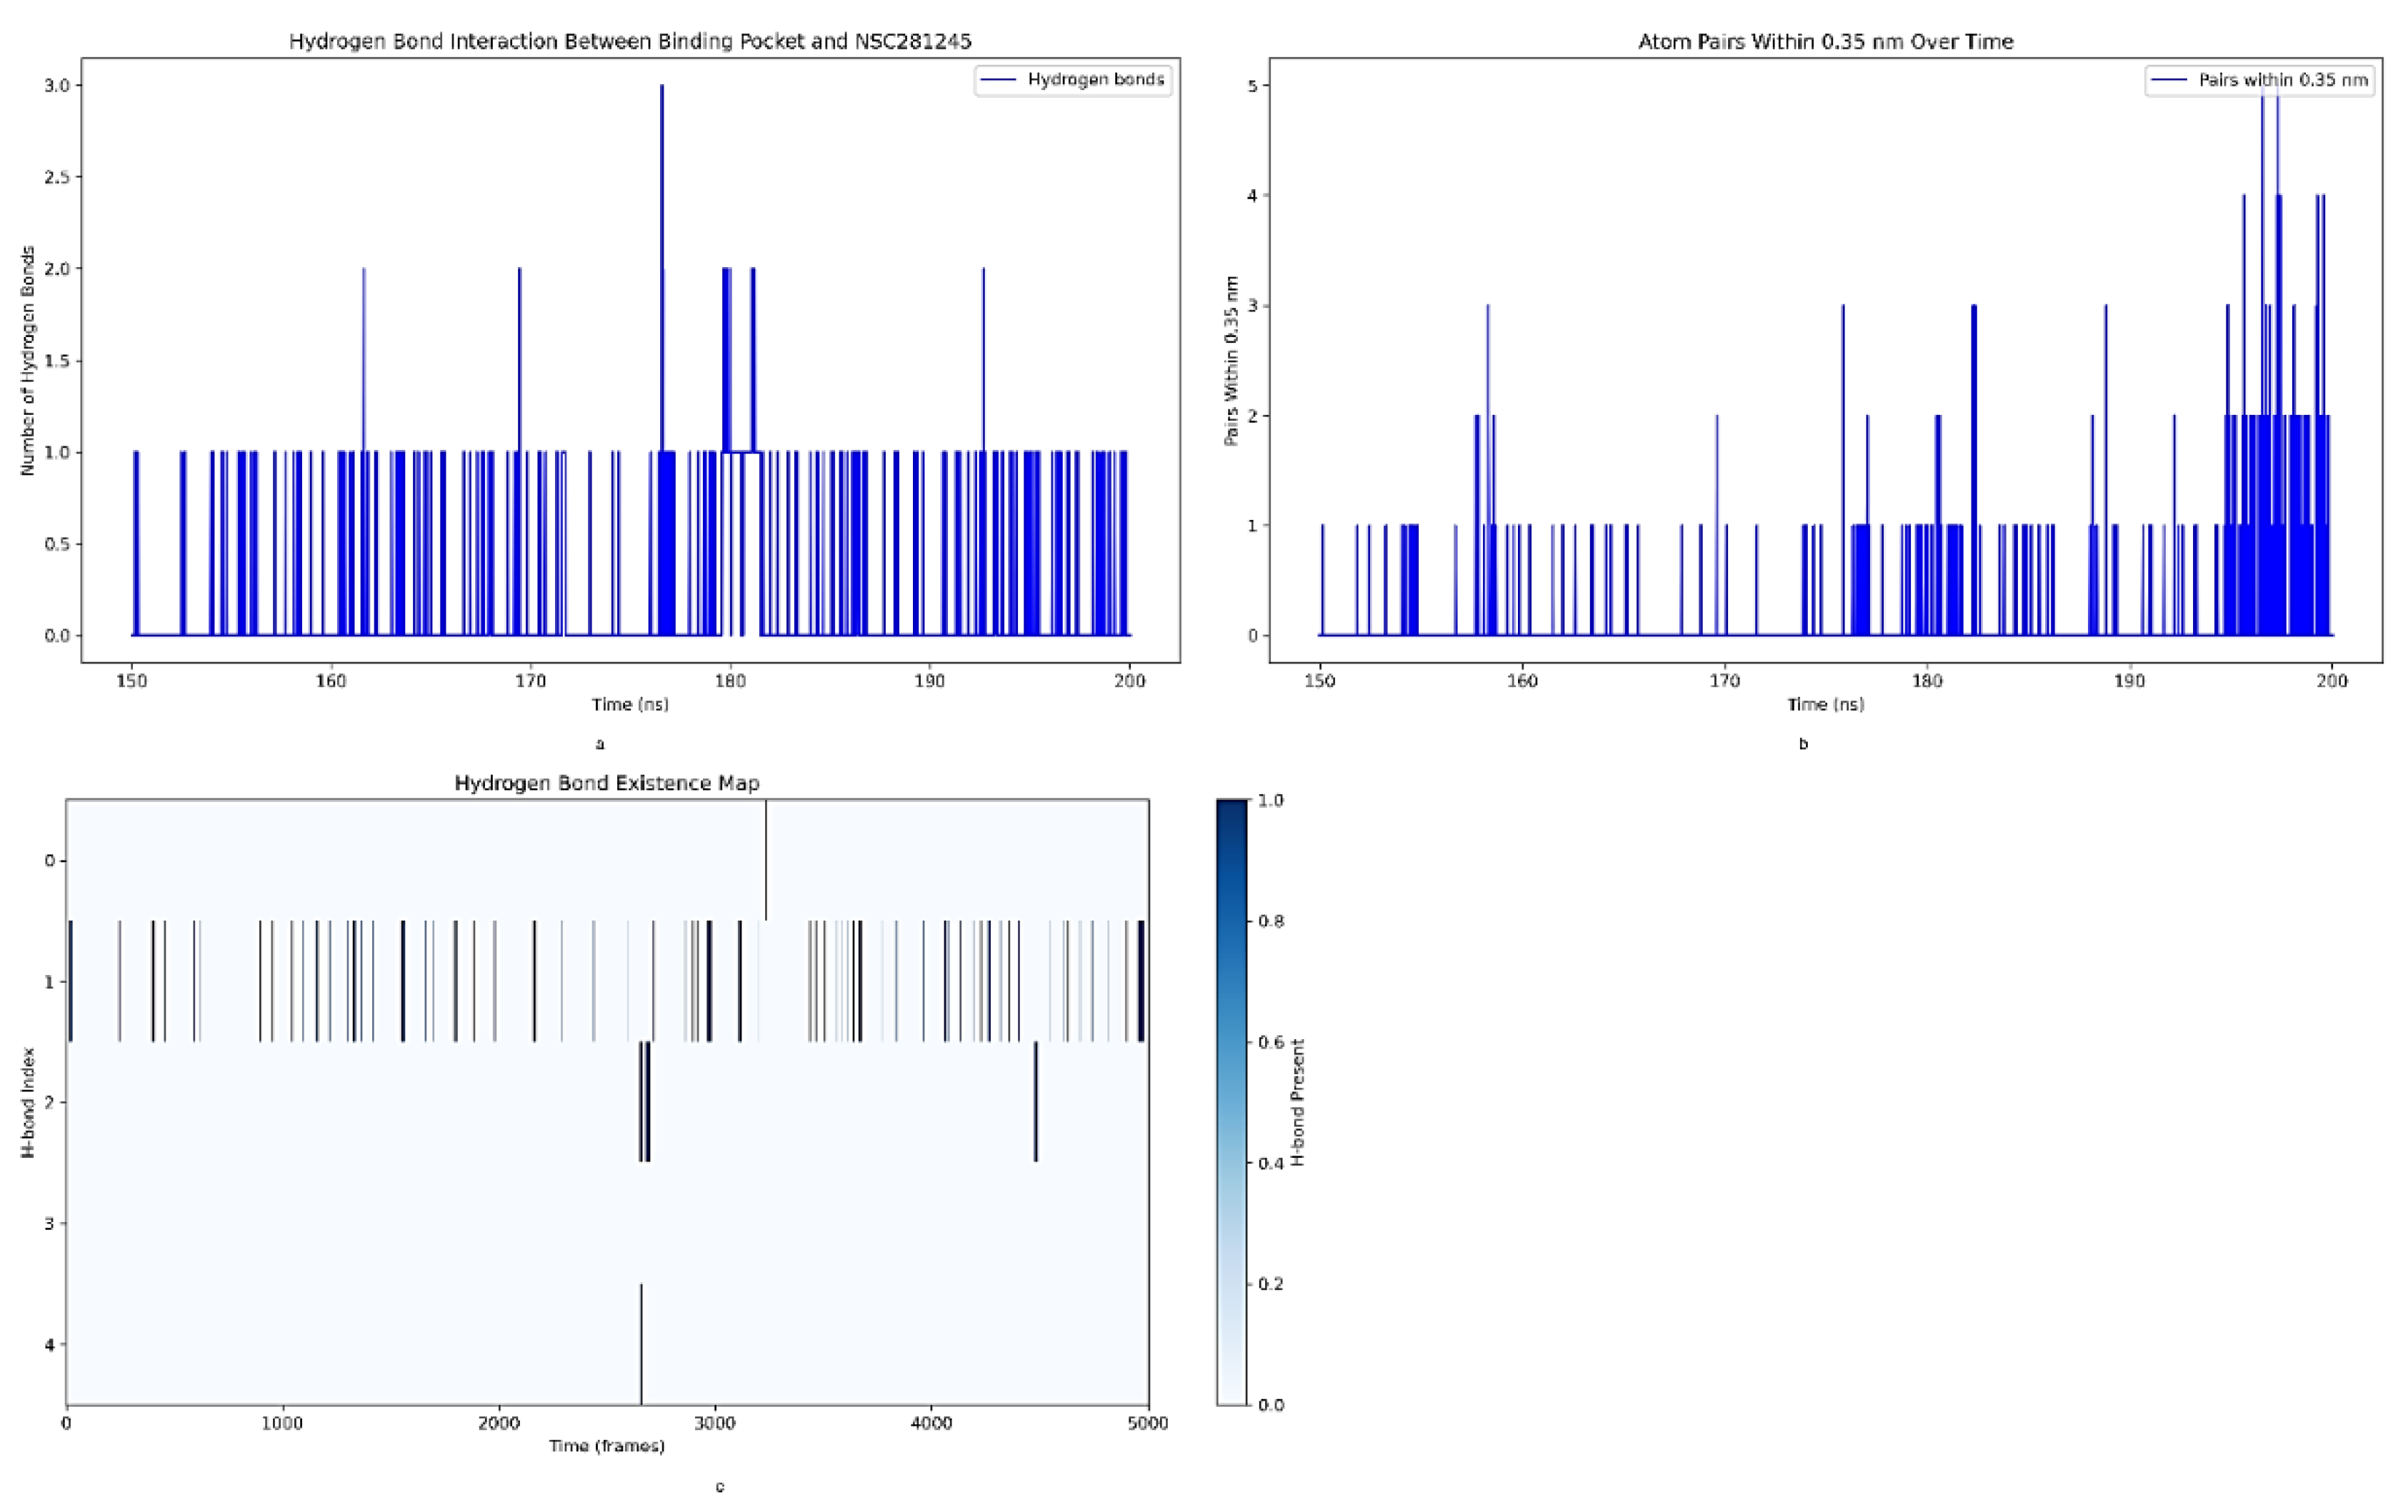
Three complementary images of the number of hydrogen bonds identified, the atom-pairs within 3.5 nm and the hydrogen bond existence map throughout the last 50 ns of the simulation were generated from NSC281245 and HSPA8–spike protein complex hydrogen bond interaction analysis as shown in Figure 23. NSC281245 formed fewer and more transient hydrogen bonds with the S2 binding pocket. For most of the 50 ns trajectory, NSC281245 exhibited 0–1 hydrogen bond with occasional bursts up to 2–3 bonds that appeared around ~175–180 ns (Figure 23a).
The number of heavy-atom contacts within 0.35 nm seldom exceeded 1–2 pairs, corroborating the limited H-bonding (Figure 23b). Brief peaks of 3–5 atom pairs were observed at ~195–200 ns, which aligns with the small H-bond spikes, reflecting tighter ligand packing. The H-bond existence map displayed five distinct donor-acceptor pairs indexed at 0–4 (Figure 23c). Only one pair exhibited moderate occupancy (~20–30%) of the frames. In contrast, others exhibited sporadic occupancy (less than 10%).
Figure 22.
Temporal analysis of hydrogen-bond interactions between the HSPA8–spike protein complex and the small-molecule ligand NSC281245 (a) Number of inter-molecular hydrogen bonds detected over the 150–200 ns trajectory simulation. (b) Number of donor–acceptor atom pairs within 0.35 nm over the same timeframe. (c) Existence map of individual hydrogen bonds (indexed 1–18).
2.5. Binding Free Energy Analysis
2.5.1. gmx_MMPBSA Binding Affinity Estimates
NSC36398 binding to the protein complex resulted in a modest yet thermodynamically favourable binding free energy (ΔGbind = –7.07 0.04 kcal/mol). Energy decomposition of the free energy revealed that the ΔGbind of NSC36298 at the S2 binding pocket was driven by strong van der Waals (ΔVDWAALS = –10.35 kcal/mol) and electrostatic charged/polar (ΔEEL = –9.45 kcal/mol) interactions. The average energy components and their standard errors are summarised in Table 1.
However, the favourable gas-phase interactions were neutralised by significant polar solvation penalties. The polar solvation energy (ΔEGB) showed a significant unfavourable contribution of 14.88 kcal/mol. Conversely, the nonpolar solvation energy (ΔESURF) component contributed a modest favourable energy of –2.15 kcal/mol. The net solvation free energy (ΔGSOLV = ΔEGB + ΔESURF) was an unfavourable 12.72 kcal/mol (Table 1), demonstrating how solvation costs counteract gas-phase stabilisation.
In contrast, NSC281245 binding exhibited a more favourable binding free energy (ΔGbind = –27.63 0.10 kcal/mol) with the S2 binding pocket of the HSPA8–spike protein complex. The decomposition of the free energy revealed that the ΔGbind of NSC281245 at the S2 binding pocket was primarily driven by strong van der Waals (ΔVDWAALS of –37.80 kcal/mol) and electrostatic charged/polar (ΔEEL = –12.99 kcal/mol). Table 2 summarises the average energy components (kcal/mol) and the sample standard error of the mean (SEM) of the NSC281245–bound system.
NSC281245–bound system displayed a ΔEGB of 28.72 kcal/mol, which partially counteracts the previously mentioned van der Waals and electrostatic interactions. It also exhibited a ΔESURF of –5.56 kcal/mol, which adds a small favourable component to the binding free energy. The large negative van der Waals contribution indicated that hydrophobic contacts dominated NSC281245’s binding to the S2 binding pocket.
2.6. HawkDock Server 2 Binding Affinity Estimates
The computed MM/GBSA-derived binding free energies (ΔGbind) of the HSPA8–spike protein interaction interface in both ligand–free and ligand–bound systems displayed intriguing results, indicating the spontaneous formation of the protein complex and the allosteric modulation of small molecule binding. The interaction surface of the ligand–free system exhibited a strong ΔGbind of –76.30 kcal/mol. MM/GBSA-derived binding free energies for the ligand–bound systems revealed significant differences in the impact of NSC36398 and NSC281245 on the HSPA8–spike protein interface. NSC36398 binding to the S2 subunit significantly weakened the HSPA8–spike protein interface binding affinity (ΔGbind = –41.70 kcal/mol). In contrast, NSC281245 binding preserved a much stronger SBD–RBD interaction interface affinity (ΔGbind = –76.53 kcal/mol), comparable to the ligand–free system.
3. Discussion
3.1. Insights from Structural Analysis
The MD simulations demonstrated that all systems remained globally equilibrated with only modest fluctuations. The KDE analysis (Figure 1) from the three independent simulation replicates of the systems revealed a consistent distribution and reproducibility for each system, signifying stable and comparable structural deviations over time [18,19]. The ligand-free system RMSD plot displayed an RMSD shift at approximately 155 ns to 160 ns, followed by a return to the initial levels, which is suggestive of a brief conformational adjustment which can be linked to intrinsic protein flexibility. Similarly, a subtle shift was observed at approximately 195 ns to 198 ns (0.70 nm to 0.85 nm), followed by a return to baseline levels, which may potentially suggest transient structural fluctuations [19]. Both ligand–bound systems’ overall RMSDs were slightly elevated relative to the ligand–free system, indicating enhanced structural flexibility (Figure 1). The lack of significant drifts suggests that all systems were structurally equilibrated and retained global stability during the observed course of the simulation. These findings aligned with the KDE profiles, corroborating the stability and the reproducibility of the simulations [18,19,20].
Domain-specific analyses revealed distinct ligand effects (Figure 3 – Figure 20). These domains included the HSPA8 substrate-binding domain (known for recognising and binding to misfolded and unfolded proteins, acting as a chaperone), the spike's receptor binding domain from chain A and chain B (responsible for viral attachment to host cell receptors and initiating viral entry), and lastly the respective ligand–binding pocket residues 5 Å within each ligand [21]. Notably, the molecular docking simulation results in our previous study showed that the ligands do not bind directly to HSPA8 or the viral RBD. Instead, both ligands target the spike protein's S2 subunit in the protein complex, at the trimeric interface formed by all three chains of the spike protein [16].
NSC36398 binding to the S2 binding site increased the SBD structural rigidity (Figure 3, Figure 8b and Figure 13), indicating increased stabilisation with local residue fluctuations (Figure 7), whereas NSC281245 binding displayed moderate stabilisation upon ligand binding. This depicted global stabilisation and local residue fluctuations suggest a long-range allosteric ligand effect on the host SBD [22]. The stronger stabilisation effect of the ligand NSC36398 on the chaperone’s SBD suggests a more effective allosteric communication pathway than that of NSC281245. This provides critical insights into how the ligands of interest binding at distal sites influence the behaviour of the interacting partners in the multimeric protein complex [23,24,25].
The spike’s chain A RBD was involved in the formation of intermolecular interactions between itself and the HSPA8 SBD using amino acid residues from positions 455 to 495, which makes a portion of the RBD and receptor-binding motif (RBM) [4,9,17]. Due to its function and direct interaction with the host HSPA8, its structural dynamics were investigated in the absence and presence of a ligand (Figure 4). The ligand–free system displayed a relatively stable RBD from both chains A and B. The observed stability of the RBD-HSPA8 interface is consistent with previous studies reporting that the spike RBD-ACE2 interface also maintains a stable conformation within the native complex [26,27,28].
Due to spike trimer asymmetry and possible differences in interchain exposure and contacts, the structural and conformational behaviour of chain B RBD during ligand–binding may differ from that of chain A [28]. Ligand binding introduced distinct structural perturbations. NSC36398 induced pronounced destabilisation of the viral RBDs, most notably in the chain A RBD and NSC281245 binding induces molecular flexibility to the viral spike RBD, though weaker than that induced by NSC36398 binding (Figure 4a and Figure 14a).
Although chain B’s RBD also exhibited increased flexibility upon NSC36398 binding (Figure 4b and Figure 14b), the effect was substantially less severe than that observed for chain A. NSC281245–bound system indicated an enhanced flexibility than that of the NSC36398–bound system due to allosteric communication from the S2 subunit of the spike protein within the protein complex. This suggests that NSC36398 binding induces minimal disruption, in contrast to its considerable destabilisation on the chain A RBD. This implies that NSC36398 potentially stabilises the chain B RBD due to chain-specific allosteric response within the trimer of the spike protein [29,30].
The local structural analysis of the binding pocket identified specific alterations and the key amino acid residues situated within 5 Å of each ligand (Figure 5, Figure 6, and Figure 12) [31]. The combined residues identified within 5 Å of each ligand constitute part of the S2 subunit’s central helix (residues 986–1035) and the connector domain (residues 1036–1068). Both ligands exhibited interactions with multiple conserved residues located within 5 Å across the spike protein chains, specifically, ALA1016, ARG1019, ASN1023, LEU1024, and THR1027 from chain A and ALA1016, ALA1020, and LEU1024 from chain B. These shared residues are crucial for binding to the HR1, indicating that both ligands might interfere with the helix bundle formation necessary for viral entry [32,33].
Both ligands exhibited distinct residues within 5 Å of each ligand. For instance, amino acid residues ARG1019, ALA1020, ASN1023 from chain A and GLU1017, LYS1028, ARG1039, PHE1042 from chain C were found to be in the vicinity of NSC36398’s binding pocket. NSC281245 had the following amino acid residues in its binding pocket: GLU1017, SER1021, PHE1042 from chain A, GLU1017, ALA1020, SER1021 from chain B; and SER1021, ASN1023 from chain C [16,34]. GLU1017 (from chain A/B) and PHE1042 (chain A) interact with the ligand NSC281245. On the other hand, the ligand NSC36398 targets LYS1028 and ARG1039 from chain C, which suggests a strong amino acid residue specificity and reliance on electrostatic interactions with residues that are positively charged [32,33,35].
With respect to NSC36398 and NSC281245, the binding pockets in the ligand–free system exhibited a lower average RMSD values than those in the ligand–bound systems (Figure 6), suggesting a compact and stable binding pocket, expected of the S2 subunit of the spike protein, which is in turn supported by the pockets’ compactness (Figure 15) (16-37]. NSC36398 binding initiated structural perturbations, due to conformational adjustments in the residues to accommodate the introduced ligand (Figure 5b). On the other hand, NSC281245 interacts with a more extensive binding pocket (Figure 5b), which results in a more stable binding affinity, indicated by the observed rigidity of the binding pocket core residues. However, some residues indicated notable fluctuations in the holo state which is attributed to induced-fit adaptations due to NSC281245 binding to the binding pocket.
NSC281245–bound system demonstrated a low Rg value than that of the NSC36398–bound system indicating that its binding pocket is more compact. Similarly, the NSC281245–bound system demonstrated a low Rg value against the binding pocket of the ligand–free system relative to NSC281245. This suggests that ligand binding stabilises the binding pocket, resulting in a more compact structure. Overall, rigidifying of the binding pocket due to NSC281245 binding may dampen the helical breathing motions that are essential for prefusion to post-fusion transitions, thereby inhibiting viral membrane fusion [31,38].
3.2. Insights into Conformational Dynamics Analysis
Conformational dynamic analysis studies how a protein fluctuates over time, relating to a protein’s function by capturing its full ensemble motions. According to Monama et al. (2023)19, Moradi et al. (2024)39 and Valério et al. (2022)40, the first few mutually orthogonal components known as principal components define the direction of maximum variance in the data. Most conformational sub states that a particular protein can access are described by the first few eigenvectors (PC1 and PC2). This indicates that the key changes and characteristics differentiating the protein’s many sub states are captured within the dominating motions that the original eigenvectors capture.
The chaperone's SBD's principal components (PC), PC1–PC2, displayed the dominant motions across all three systems (Figure 16). The apo–SBD unimodal distribution suggests that the SBD in the protein complex undergoes continuous conformational sampling and reflects the native dynamic equilibrium of the domain (Figure 16a). The cumulative variance of ~28.0%, indicates high-dimensional data, suggesting that the two principal components were sufficient to describe the predominant motions based on the individual PC and cumulative variances [41,42].
NSC36398 binding resulted in a 21.8% increase in the captured cumulative variance compared to the ligand–free system. Sankar et al. (2015)43 stated that PCs involved in the largest-scale motions are associated with the functional mechanism of the protein. NSC36398 binding induced ligand stabilisation, locking the SBD and reducing its motion within the HSPA8–spike protein complex. This suggests that NSC36398 allosterically induced a hinge-like motion in the protein’s domain, potentially influencing the domain’s interaction with the viral protein (Figure 16b). In contrast, NSC281245 binding induces a weak allosteric dampening effect towards the HSPA8 SBD, interconverting the SBD into two closely related sub states indicated by its low cumulative variance and its two moderately separated clusters (Figure 16c).
The chain A RBD remains a dynamic, potentially due to the transient binding of HSPA8 to the viral RBD (Figure 17a). The observed RBD dynamic behaviour aligns with findings by Valério et al. (2022)40, who demonstrated in their study that the wild-type RBD dynamics included reversible transitions between the ‘open’ and ‘closed’ states of the RBM, supporting the plausibility of the observed conformational changes in the current study. NSC36398 binding restricts the range of conformational shift of the chain A RBD, inducing it to adopt conformations characterised by PC1 as shown in Figure 17b. NSC36398 binding restricts the range of conformational shift of the chain A RBD, inducing it to adopt conformations characterised by PC1, whereas NSC281245 binding induced a weaker allosteric constraint on the RBD, resulting in two more pronounced sub-ensembles than the ligand–free RBD (Figure 17c).
As potential HSPA8–spike inhibitors, NSC36398 appeared to amplify the chain A RBD dominant motion (PC1), whilst NSC281245 appeared to suppress it. Prior cryo-EM and MD studies depicted PC1 of the SARS-CoV-2 spike glycoprotein to be correlated with the RBD’s open/closed conformational states [44,45]. The amplified PC1 in the NSC36398–bound system is consistent with shifts towards a destabilised open/closed state of the RBD. On the other hand, the observed reduction of PC1 in the NSC281245–bound system aligns with a more stabilised open/closed dynamic state. These allosteric modulations may alter the RBD’s conformation, disrupting the HSPA8–spike protein interaction and potentially compromising viral entry.
The PCA of spike chain B RBD indicated that PC1–PC2 primarily captured the most significant combined variance with a bimodal distribution that is attributed to the open/closed states of the spike RBD in the ligand–free system (Figure 18a) as reported in studies by Melero et al. (2021)44 and Ray et al. (2021)45. NSC36398 allosterically introduces a third intermediate sub state and channels the viral RBD into a narrow conformational state (Figure 18b), likely interfering with the domain’s ability to transition between functional states, that is, the open/closed states of the spike RBD previously reported by Melero et al. (2021)44. These findings align with RMSD and RMSF results of the chain B RBD, where NSC36398 binding induces residue flexibility in some regions but reduces the overall sampling of distinct global conformers.
PCA calculations were performed on Cα residues of the binding pocket relative to NSC36398 in both the ligand–free and NSC36398–bound systems using MDM-TASK web (Amamuddy et al., 2021)41. In the ligand–free system, the S2 subunit retains its dynamic flexibility which was indicated by a broad unimodal isotropic cloud with no distinct clusters (Figure 19a). NSC36398 binding modestly rigidified the S2 binding pocket, reducing its conformational spread, which may impede the S2 subunit’s conformational transitions required for membrane fusion. The observed rigidification of the S2 binding pocket supports the dual-stability model of ligand-binding sites reported by Luque and Freire (2000)46. The PCA projections in the NSC36398–bound system revealed a modest induced-fit adjustment along PC2, describing how NSC36398 binding constraints optimise the binding pocket, inducing allosteric effects to the rest of the protein complex (Figure 19b). In contrast, NSC281245 induced moderate local rearrangement, with no transparent temporal gradients, suggesting that the binding pocket in the NSC281245–bound system retains much of its original local flexibility (Figure 20b).
3.3. Comparison of PCA Behaviour with Literature-Reported SARS-CoV-2 Mpro Inhibitors
Although this study is the first to characterise PCA-derived conformational dynamics of these NCI natural products at the HSPA8–spike protein S2 binding pocket, both NSC36398 and NSC281245 were initially identified by Durgam and Guruprasad (2023)17 as promising SARS-CoV-2 Mpro inhibitors. In their study, PCA was applied to the SARS-CoV-2 Mpro–ligand trajectories to study the overall motion of the SARS-CoV-2 Mpro in all simulations using MODE-TASK, similarly applied in this study. Their study showed that the NSC36398–bound molecular system had greater conformational changes than all the other systems. From their PC1–PC2 projections, SARS-CoV-2 Mpro–NSC36398 sampled a wider array of conformations, which reflected pronounced induced-fit perturbations in the protein’s catalytic site compared to the apo form of SARS-CoV-2 Mpro [17].
In contrast, this study provided a domain-level PCA of the HSPA8–spike protein complex, which revealed different patterns when these identical ligands were used to target five functional domains within the complex. In the HSPA8 SBD, NSC36398 binding funnelled the SBD into two tightly clustered ensembles along PC1–PC2. NSC281245 binding partially narrowed the SBD conformational distribution, indicating weak allosteric perturbations. In the viral chain A RBD, both ligands shifted the RBD conformations. NSC36398 binding induced a bimodal conformational ensemble in the chain A RBD, whereas NSC281245 binding induced a slightly narrowed bimodal conformational envelope.
In the chain B RBD, NSC36398 allosterically induced a trimodal conformational ensemble, whereas NSC281245 binding restricted and dampened the observed bimodal distribution into a unimodal conformational ensemble. PCA analysis of the S2 binding pocket relative to NSC36398 displayed a contracted sampling post-binding, with a subtle PC2-axis relaxation indicating an induced-fit rearrangement. In contrast, the S2 binding pocket relative to NSC281245 revealed a moderate contraction, which denoted minor pocket adjustments. The comparisons above underscored that the same small molecule induced divergent conformational signatures. Whereas NSC36398 induced greater overall conformational variability in the SARS-CoV-2 Mpro [17], in the HSPA8–spike context, it promotes both local rigidification of the S2 pockets and domain-level diversity. NSC281245, on the other hand, exerted subtle constrained perturbations.
3.4. Insights into Hydrogen Bond Interactions of the S2 Binding Pocket with NSC36398 and NSC281245
Multiple intermolecular interactions, such as hydrogen, van der Waals, ionic and pi bonds, are formed throughout the MD simulations. According to Gowo (2021)47 and Spassov (2024)58, hydrogen bonds are one of the main molecular structures stabilising intermolecular bonds. Figure 22 demonstrated a dynamic change in hydrogen bond interactions between NSC36398 and the S2 subunit binding pocket. The presence of these hydrogen bonds throughout the last 50 ns of the simulation underscores important interactions anchoring the NSC36398 within the S2 binding pocket. The high-occupancy hydrogen bonds potentially contribute to the stability of the complex [47]. The transient hydrogen bond interactions of NSC36398 and S2 subunit potentially facilitate induced-fit adaptations as explicitly discussed by Csermely et al. (2010)48, allowing the ligand to induce allosteric effects on distal domains within the protein complex, a hypothesis that aligns with the observed results from PCA and RMSF.
In contrast to NSC36398 (which averaged 2–3 persistent bonds), NSC281245 formed fewer and more transient hydrogen bonds, which suggests a weaker network of polar interactions. This observation is consistent with the ligand’s docking affinity towards the HSPA8–spike protein observed in Chapter 3 and its partial allosteric effect towards distal domains of the protein complex. The observed spikes in H-bond count and atom-pair contacts at ~175–180 ns indicate momentary induced-fit adjustments, in which the binding pocket briefly reorganises to maximise polar contacts [49,50].
NSC281245 occupied a larger S2 binding site than NSC36398, potentially attributed to its large size. Given the observed stabilisation of the S2 subunit binding pocket relative to NSC281245 (observed in the binding pocket’s Rg) and the paucity of sustained H-bonds, other forces such as van der Waals, hydrophobic and pi-pi interactions likely play a larger role in the ligand’s binding stability. The intermittent H-bond formation coincides with the observed slight decrease (pocket tightening), increased compactness of the binding pocket and minor shifts in PCA, reinforcing a model of brief polar interactions accompanied by conformational adjustments well documented by Nussinov et al. (2014)49.
3.5. Implications of Binding Free Energy Calculation Results
The binding free energy calculations yielded quantitative insights into two key interactions: firstly, ligand affinities within the HSPA8–spike–ligand ternary complex (via gmx_MMPBSA), and ligand-induced modulation of the HSPA8–spike protein–protein interface via HawkDock Server 2. Both approaches converged on strongly favourable binding energetics (ΔG < 0) [51,52].
The derived binding free energy calculations revealed an interesting dual mechanism underlying small-molecule allosteric inhibition. While NSC36398 binds modestly stable to the S2 binding site (ΔGbind = –7.07 ± 0.04 kcal/mol) through persistent hydrogen bonds. This negative value confirms the stability of NSC36398 within the protein-ligand complex, consistent with the fundamental principle that a negative ΔGbind indicates spontaneous binding and complex stability (Mandal and Mandal, 2024)53. This binding significantly destabilises the native HSPA8–spike protein interface. The ligand–free HSPA8-SBD/spike-RBD complex displayed a robust stability (ΔGbind = –76.30 kcal/mol). These findings align with and provide quantitative support for the domain-level binding of inducible HSP70 SBD to the SARS-CoV-2 spike RBD previously reported by Joshi et al. (2024)54. However, the interaction interface’s stability dropped substantially upon NSC36398 binding (ΔGbind = –41.70 kcal/mol).
Critically, the destabilisation of the HSPA8–spike protein interface in the NSC36398–bound system directly correlated with the observed reduced binding affinity. This indicates that small-molecule NSC36398 is an allosteric inhibitor that disrupts the distal functional interface (HSPA8–spike protein) through long-range dynamic effects originating from its S2 binding site. This mechanism of allosteric disruption and interference aligns with the established models of allosteric communication in the spike protein (Verkhivker and Di Paola, 2021)55.
In contrast, NSC281245 strongly binds to the spike S2 site in the complex (ΔGbind = –27.63 ± 0.07 kcal/mol). NSC281245 engaged a more extensive interface on the S2 binding pocket surface, maximising hydrophobic contacts. PCA of the S2 binding pocket revealed partial rigidification of the pocket (Figure 20b), indicating a binding mode that relies on hydrophobic complementarity as reported in the study by Amadei et al. (1993)56. Converse to NSC36398 binding, NSC281245 binding preserves a near-native interface affinity (ΔGbind = –76.53 kcal/mol), which suggests that NSC281245 induce minimal allosteric disruption. These findings highlight NSC36398 as a promising allosteric inhibitor for the HSPA8–spike protein complex. NSC281245, by stably engaging key interfacial residues, provides a quantitative framework for rational design of next-generation small-molecule compounds that more effectively destabilise this host–virus interaction [57].
4. Materials and Methods
This study performed ligand–free and ligand–bound MD simulations using GROMACS v2018.6. Ligand–free MD simulations comprised of the protein (HSPA8–spike protein complex) without a ligand. In contrast, the ligand–bound MD simulations comprised a system with one ligand from previous docking simulations, either NSC36398–bound or NSC281245–bound [16].
4.1. MD System Preparation: Ligand-free and Ligand-bound System Parameter Definition
In the ligand–free system, the AMBER99SB-ILDN force field was assigned to the system within GROMACS using the gmx pdb2gmx tool [58]. ACPYPE was used for ligand–bound systems to convert AMBER-compatible parameters and generate ligand topology files into GROMACS format [59]. Protein and ligand complexes were built by manually merging the ligand atoms into the protein. gro file, and the protein topology file was updated to integrate ligand parameters. To the newly built ligand–bound system, a triclinic simulation box was generated with gmx editconf with a buffer size of 1.8 nm from the protein to the box edges. The system was solvated with the TIP3P water model using gmx solvate, and Na+ ions were added to neutralise the system utilising the gmx grompp and gmx genion commands [58].
Energy minimisation of both systems was performed using the GROMACS (v2018.6) gmx mdrun. The systems were relaxed using the steepest descent algorithm, applying a force tolerance of 1000 kJ/mol/nm, with an upper limit of 50,000 steps. Both systems were equilibrated in terms of pressure and temperature on the Centre for High-Performance Computing (CHPC) cluster. The temperature equilibration in both systems was performed using a constant number of particles, volume, and temperature ensemble for 100 ps with a 2 fs timestep at 300 K. The pressure was equilibrated throughout 100 ps at 1 atm using the NPT ensemble with a maximum of 50,000 steps [47].
4.2. Molecular Dynamics Simulation Run
Dynamic simulations of the ligand–free and ligand–bound systems were produced using the gmx mdrun command of GROMACS, which allowed for thorough sampling of the system's conformational space [47]. The CHPC resources were leveraged to run the entire 200 ns simulation using the GROMACS (v2018.6) module. Duplications of the MD simulations were carried out to check the reproducibility of the results.
4.3. Post-MD Analysis
After the 200 ns simulations were completed, post–MD simulation analyses were conducted with GROMACS (v2018.6). The last 50 ns (150 ns to 200 ns) of the three systems, ligand–free, NSC36398–bound, and NSC281245–bound systems, were used in this analysis to demonstrate the equilibration phase and reproducibility of the results.
4.3.1. Structural Analysis
Structural analysis of the ligand–free system (apo state), NSC36398–bound system, and NSC281245–bound system was conducted using GROMACS (v2018.6) tools (gmx rms, gmx rmsf, and gmx gyrate). All plots for structural metrics (RMSD, RMSF, and Rg) were generated using Python 3.12.7 in Jupyter Notebook. Root mean square deviation (RMSD), root mean square fluctuation (RMSF), and radius of gyration (Rg) were calculated under structural analysis to evaluate and assess the conformational changes, stability, flexibility, and compactness of the systems [23,60]. Functional domain characterisation of the HSPA8 substrate-binding domain (SBD) from amino acid residue positions 405 to 495, the SARS-CoV-2 spike protein receptor-binding domain (RBD) comprising chain A RBD residues 455 to 495, chain B RBD residues 333 to 371, as well as the binding site and residues within 5 Å of the ligand of interest, was performed on the last 50 ns of the simulation [26,61].
4.3.2. Conformational Dynamics Analysis
Conformational dynamic analysis of the ligand–free and ligand–bound systems was performed on the selected functional domains, HSPA8 SBD (residues 405 to 495), viral spike protein chains A RBD (residues 455 to 495), and chain B RBD (residues 333 to 371), and two binding pockets relative to each ligand. Principal Component Analysis (PCA) was performed using an online tool, MDM-TASK-web (https://mdmtaskweb.rubi.ru.ac.za/#pca; Accessed 31 March 2025) [41] using Cα atoms from the last 50 ns of the simulation to generate the topology input and trajectory files for the standard PCA. Variance-contribution analysis was performed by taking each eigenvalue λi from the variance file and computing the percentage variance using the equation below, then obtaining a cumulative variance (∑_j λ_j) from the sum.
4.3.3. Hydrogen Bond Calculation Protocol
The hydrogen bond calculation was performed to analyse the interactions between the protein complex S2 subunit binding site and NSC36398 and NSC281285, respectively. The calculation was conducted using the gmx hbond tool from GROMACS, with a cut-off distance of 0.35 nm and an angle of 30°, using the last 50 ns of the trajectory. The protein was selected as the donor, and the ligands were selected as the acceptor [58].
4.3.4. Binding Free Energy Calculations
4.3.4.1. Binding Free Energy Calculations –gmx_MMPBSA
Binding free energy calculations of the ligand–bound systems were performed using the MM/GBSA approach within the gmx_MMPBSA pipeline (v1.6.3). This approach calculated binding free energy (ΔGbind) as the difference between the free energy of the complex (Gcomplex) and the sum of free energies for the isolated receptor (Greceptor) and ligand components (Gligand) as shown in the equation below:
Each G included Molecular Mechanics (MM), polar solvation (GB), and nonpolar solvation (SA). The analysis used 1001 frames extracted from 190–200 ns of the simulation trajectory. Topologies generated in GROMACS (AMBER99SB for protein; GAFF for ligand) were converted to AMBER compatibility, and solvation effects were modelled using the Generalised Born model (igb = 5, mbondi2 radii) alongside a SASA-based nonpolar term (γ = 0.0072 kcal/molÅ⁻²). A single-trajectory protocol ensured identical conformational sampling of the complex, receptor, and ligand states, minimising statistical noise. Per-frame energy components (MM, G_GB, G_SA) were computed in parallel (8 CPUs), while entropy contributions were omitted, resulting in a purely enthalpic ΔGbind [51,63].
4.3.4.2. Binding Free Energy Calculations – HawkDock Server (v2)
The MM/GBSA method was used in HawkDock Server (v2) (http://cadd.zju.edu.cn/hawkdock/; accessed 31 March 2025) [52] to compute binding free energies (ΔGbind). The analysis assessed how small-molecule binding at the spike protein’s S2 subunit affects the HSPA8–spike protein interaction interface. The HSPA8–spike protein interaction interface was defined by the SBD (residues 405–495) of human HSPA8 and the spike RBD (residues 455–495 from chain A; residue positions 333–371 from chain B). Missing hydrogens and heavy atoms of the SBD–RBD complexes were added by the tleap module in Amber16, and then the ff02 force field parameters were added to the protein complex. The polar desolation energy was then calculated by the modified GB (GBOBC1) model (interior dielectric constant = 1), which was developed by Onufriev et al. (2004)64. The system was minimised for 5000 steps with a cut-off distance of 999 Å for van der Waals interactions (2000 cycles of steepest descent and 3000 cycles of conjugate minimisations). The results of the MM/GBSA, the pre-processed PDB files of the receptor and ligand, were downloaded and analysed.5. Conclusions
The persistent threat of COVID-19 underscores the critical need for novel and effective therapeutic strategies. This study focused on the HSPA8–spike protein complex as a potential target, employing in-silico techniques to screen and identify repurposed small-molecule compounds towards COVID-19 drug development. Molecular dynamics simulations were used to validate the docking simulations that determined the small-molecule compounds with stable, viral-preferential binding and high binding affinities. Our previous docking experiments identified small molecules NSC36398 and NSC281245 as potential compounds exhibiting stable interactions and the best binding affinities towards key regions within the spike protein’s conserved S2 subunit, particularly in complex with HSPA8. Subsequent molecular dynamics simulations confirmed stable complex formation and revealed distinct compound effects on the complex. NSC36398 induced significant, thermodynamically favourable allosteric modulations, affecting host and viral domains' flexibility, stability and the interaction surface. NSC281245 induced mild allosteric perturbations that partially affected the host and viral domains and the interaction interface. Instead, it preserved near-native interface affinity with stable interactions at the S2 binding site. Thus, this work identified NSC36398 as a promising repurposed candidate targeting the HSPA8–spike protein complex and identified NSC281245 as a quantitative framework for rational design of drug compounds that stably engage key S2 subunit residues and effectively destabilise this host–viral spike interaction. The computationally validated binding, stability and drug-like properties provide a strong rationale for further experimental validation.
Further analysis should be built from the current project, conducting deep computational analysis, such as per-residue energy decomposition and dynamic residue network (DRN) calculations. These analyses will provide detailed findings on the overall interactions of residues with time, the betweenness, centrality, the average shortest path of residues and the energy contribution of each residue. Experimentally, the predicted HSPA8–spike protein interactions should be validated in vitro via co-immunoprecipitation or surface plasmon resonance (SPR). Subsequently, cell-based inhibitor screening assays should be implemented to quantify the impact of small compounds on the HSPA8–spike binding. Afterwards, pseudo virus entry inhibitor assays in relevant cell models should be conducted to confirm functional blockade. Lastly, rational structure-based optimisation of the identified compounds NSC36398/NSC281245 scaffolds should be undertaken to enhance ligand potency and selectivity.
Author Contributions
Conceptualization, X.H.M., L.T.N. and T.M.M.; methodology, L.T.N. and M.Z.M.; software: selection and use of pre-existing applications, L.T.N. and M.Z.M.; validation, L.T.N.; formal analysis, L.T.N.; investigation, L.T.N.; writing—original draft preparation, L.T.N.; writing—review and editing, X.H.M.; visualization, L.T.N.; supervision, X.H.M. and T.M.M.; project administration, T.M.M.; funding acquisition, X.H.M., L.T.N. and T.M.M. All authors have read and agreed to the published version of the manuscript.
Funding
The work reported herein was made possible through funding by the South African Medical Research Council through its Division of Research Capacity Development under the SAMRC-Chan Soon-Shiong Family Foundation Scholarship Programme with funding received from the Chan Soon-Shiong Family Foundation and the National Department of Health.
Institutional Review Board Statement
Not applicable.
Informed Consent Statement
Not applicable.
Data Availability Statement
The data utilized to substantiate the study’s conclusions are providedin this article.
Acknowledgments
The authors would like to express their gratitude to MZ Monama for his thoughtful mentorship and valuable guidance throughout this work. His support has been greatly appreciated. The authors would like to acknowledge the Centre for High Performance Computing (CHPC) for the invaluable support and computational resources they provided to perform the simulations.
Conflicts of Interest
The authors declare no conflicts of interest. The funders had no role in the design of the study; in the collection, analyses, or interpretation of data; in the writing of the manuscript; or in the decision to publish the results.
Abbreviations
The following abbreviations are used in this manuscript:
| ACE2 | Angiotensin-Converting Enzyme 2 |
| ACPYPE | AnteChamber Python Parser Interface |
| ADMET | Absorption, Distribution, Metabolism, Excretion and Toxicity |
| AMBER | Assisted Model Building with Energy Refinement |
| CHPC | Centre of High Computing |
| COVID-19 | Coronavirus Disease 2019 |
| GROMACS | GROningen MAchine for Chemical Simulations |
| HSP | Heat shock protein |
| HSPA8 | Heat Shock Protein Family A Member 8 |
| IBV | Infectious Bronchitis Virus |
| JEV | Japanese Encephalitis Virus |
| MD | Molecular Dynamics |
| MM/GBSA | Molecular Mechanics Generalised Born Surface Area |
| MM-PBSA | Molecular Mechanics Poisson-Boltzmann Surface Area |
| PC | Principal Component |
| PCA | Principal Component Analysis |
| RBD | Receptor-Binding Domain |
| RBM | Receptor-Binding Motif |
| Rg | Radius of Gyration |
| RMSD | Root Mean Square Deviation |
| RMSF | Root Mean Square Fluctuation |
| SARS-CoV-2 | Severe Acute Respiratory Syndrome Coronavirus 2 |
| SARS-CoV-2 Mpro | Severe Acute Respiratory Syndrome Coronavirus 2 Membrane Protease |
| SBD | Substrate-Binding Domain |
References
- Mallah, S.I.; Ghorab, O.K.; Al-Salmi, S.; Abdellatif, O.S.; Tharmaratnam, T.; Iskandar, M.A.; Sefen, J.A.N.; Sidhu, P.; Atallah, B.; El-Lababidi, R.; Al-Qahtani, M. COVID-19: Breaking Down a Global Health Crisis. Ann. Clin. Microbiol. Antimicrob. 2021, 20, 35. [Google Scholar] [CrossRef]
- Rossi, G.A.; Sacco, O.; Mancino, E.; Cristiani, L.; Midulla, F. Differences and Similarities between SARS-CoV and SARS-CoV-2: Spike Receptor-Binding Domain Recognition and Host Cell Infection with Support of Cellular Serine Proteases. Infection 2020, 48, 665–669. [Google Scholar] [CrossRef]
- Li, T.; Cai, H.; Zhao, Y.; Li, Y.; Lai, Y.; Yao, H.; Liu, L.D.; Sun, Z.; van Vlissingen, M.F.; Kuiken, T.; GeurtsvanKessel, C.H. Uncovering a Conserved Vulnerability Site in SARS-CoV-2 by a Human Antibody. EMBO Mol. Med. 2021, 13, e14544. [Google Scholar] [CrossRef]
- Hu, B.; Guo, H.; Zhou, P.; Shi, Z.L. Characteristics of SARS-CoV-2 and COVID-19. Nat. Rev. Microbiol. 2021, 19, 141–154. [Google Scholar] [CrossRef]
- Bolhassani, A.; Agi, E. Heat Shock Proteins in Infection. Clin. Chim. Acta 2019, 498, 90–100. [Google Scholar] [CrossRef]
- Makhoba, X.H.; Makumire, S. The Capture of Host Cell’s Resources: The Role of Heat Shock Proteins and Polyamines in SARS-CoV-2 (COVID-19) Pathway to Viral Infection. Biomol. Concepts 2022, 13, 220–229. [Google Scholar] [CrossRef]
- Makhoba, X.H. Two Sides of the Same Coin: Heat Shock Proteins as Biomarkers and Therapeutic Targets for Some Complex Diseases. Front. Mol. Biosci. 2025, 12, 1491227. [Google Scholar] [CrossRef] [PubMed]
- Paladino, L.; Vitale, A.M.; Caruso Bavisotto, C.; Conway de Macario, E.; Cappello, F.; Macario, A.J.L.; Marino Gammazza, A. The Role of Molecular Chaperones in Virus Infection and Implications for Understanding and Treating COVID-19. J. Clin. Med. 2020, 9, 3518. [Google Scholar] [CrossRef] [PubMed]
- Chen, Q.; Chen, Y.; Bao, C.; Xiang, H.; Gao, Q.; Mao, L. Mechanism and Complex Roles of HSC70/HSPA8 in Viral Entry. Virus Res. 2024, 347, 199433. [Google Scholar] [CrossRef] [PubMed]
- Wang, Z.; Li, Y.; Yang, X.; Zhao, J.; Cheng, Y.; Wang, J. Mechanism and Complex Roles of HSC70 in Viral Infections. Front. Microbiol. 2020, 11, 1577. [Google Scholar] [CrossRef]
- Méndez, E.; López, S.; Cuadras, M.A.; Romero, P.; Arias, C.F. Entry of Rotaviruses Is a Multistep Process. Virology 1999, 263, 450–459. [Google Scholar] [CrossRef]
- Zhu, P.; Lv, C.; Fang, C.; Peng, X.; Sheng, H.; Xiao, P.; Kumar Ojha, N.; Yan, Y.; Liao, M.; Zhou, J. Heat Shock Protein Member 8 Is an Attachment Factor for Infectious Bronchitis Virus. Front. Microbiol. 2020, 11, 1630. [Google Scholar] [CrossRef] [PubMed]
- Ren, J.; Ding, T.; Pan, Y.; Zhu, X.; Zhou, R.; Xie, M.; Wei, D.; Lu, M. Dysfunction of Cellular Proteostasis in Rotaviral Infection. Virol. J. 2007, 4, 33. [Google Scholar] [CrossRef]
- Chuang, C.K.; Yang, T.H.; Hsiao, Y.J.; Ma, Y.P.; Syu, W.J.; Wang, Y.C. Cyclophilin A Interacts with Influenza A Virus M1 Protein and Impairs the Early Stage of Viral Replication. J. Gen. Virol. 2015, 96, 793–803. [Google Scholar] [CrossRef] [PubMed]
- Navhaya, L.T.; Blessing, D.M.; Makumire, S.; Makhoba, X.H. HSP90B1 and HSP90AB1 Prevent Rotavirus Entry into Host Cells by Promoting Proteasome-Mediated Degradation of Heat Shock Cognate 70 (HSC70/HSPA8). Biomol. Concepts 2024, 15, 20220027. [Google Scholar] [CrossRef]
- Navhaya, L.T.; Blessing, D.M.; Makhoba, X.H. HSP70A1A (HSPA1A) Promotes Rotavirus Entry into Host Cells by Mediating Heat Shock Protein 90 (HSP90)-Dependent Folding of Heat Shock Cognate 70 (HSC70/HSPA8). Viruses 2024, 16, 1726. [Google Scholar] [CrossRef] [PubMed]
- Durgam, L.; Guruprasad, L. Deciphering the Role of a Distant Exosite in Human Cyclophilin A for Shedding Coronavirus Spike Protein. J. Biomol. Struct. Dyn. 2023, 41, 3741–3751. [Google Scholar] [CrossRef]
- Manyumwa, C.V.; Tastan Bishop, Ö. Mechanism of Virus Inhibition and Immunomodulation by Antiviral Peptides toward SARS-CoV-2. Catalysts 2021, 11, 1177. [Google Scholar] [CrossRef]
- Monama, M.Z.; Makhoba, X.H.; Abrahams, D. Phosphorylation Cascades Associated with Class I Phosphatidylinositol 3-Kinase Isoforms. Int. J. Mol. Sci. 2023, 24, 3313. [Google Scholar] [CrossRef]
- Bhattacharjee, A.; Kar, S.; Ojha, P.K. Unveiling G-Protein Coupled Receptor Kinase-5 Inhibitors to Explore Their Potency for COVID-19: A Combined Computational Study. Int. J. Biol. Macromol. 2024, 269, 131784. [Google Scholar] [CrossRef]
- Leja, M.; Knutsson, R.; Hedenstierna, G.; Brufau, M.; Hajdu, J.; Lindahl, E.; Lindbom, L. T020 – Analyzing Molecular Dynamics Simulations to Extract Ion Binding Sites: An Educational Exercise. TeachOpenCADD 2021. [Online] Available from: https://projects.cosch.info/teaching-material/teachopencadd21/t020. (accessed on 18 April 2025).
- Srivastava, M.; Rathod, P.; Monama, M.Z.; Goswami, D.; Makhoba, X.H. An Integrative Virtual Screening Methodology to Identify Novel Anti-COVID-19 Compounds Utilizing Both Sequence and Structure of 3CLpro (Mpro) Target. Oncotarget 2018, 9, 34289. [Google Scholar] [CrossRef] [PubMed]
- Penkler, D.L.; Kruger, P.G.; Smith, M.T.; Smith, M.C.; Eksomtramage, T.; Patel, H.; Barnes, J.; Markel, E.J.; van Deventer, H.; Jordaan, M. Investigating the Global Dynamics of a Clade 2 Influenza A Neuraminidase Reveals a Shift in Low Frequency Motions upon Drug Binding. Sci. Rep. 2019, 9, 1600. [Google Scholar]
- Bhattarai, A.; Rohamare, S.; Kim, D.; Oh, K.S. Reassessment of the Binding Modes of OXA-66 with OXA-51-Like and OXA-23-Like Proteins in Acinetobacter baumannii Using Accelerated Molecular Dynamics Simulation. J. Biomol. Struct. Dyn. 2023, 41, 13438–13453. [Google Scholar] [CrossRef]
- Tan, Z.W.; Tan, T.K.; Tria, M.A.; Pang, M.Y.; Yue, B.Y.; Ho, B.; Ding, J.L. Human Bone Marrow Endothelial Progenitor Cells: A Novel Target for Flavivirus Infections. Structure 2022, 30, 590–607. [Google Scholar] [CrossRef]
- Alaofi, A.L.; Shahid, M. SARS-CoV-2 Hotspot Mutations Associated with the Pathogenesis of COVID-19. Biomolecules 2021, 11, 1273. [Google Scholar] [CrossRef]
- Ahamad, S.; Akhtar, N.; Alam, P.; Kumar, R.; Shahab, U. Updated Drug Repurposing for 2019-nCov/SARS-CoV-2. 3 Biotech 2022, 12, 87. [Google Scholar] [CrossRef]
- Dokainish, H.M.; Re, S.; Clouser, A.F.; Mattos, C. Adaptive Pathways of the TRP Channel through Cooling and Heating Reveals Mechanistic Insights via Molecular Dynamics Simulations. eLife 2022, 11, e75720. [Google Scholar] [CrossRef]
- Toelzer, C.; Gupta, K.; Yadav, S.K.N.; Borucu, U.; Davidson, A.D.; Kavanagh Williamson, M.; Shoemark, D.K.; Garzoni, F.; Staufer, O.; Milligan, R.; Capin, J.; Mulholland, A.J.; Spatz, J.P.; Fitzgerald, D.; Berger, I.; Schaffitzel, C.; Laue, E.D. Free Fatty Acid Binding Pocket in the Locked Structure of SARS-CoV-2 Spike Protein. Science 2020, 370, 725–730. [Google Scholar] [CrossRef]
- Tian, H.; Tao, P. Exploring the Binding of SF2523 Analogues with PI3K-α Protein: How Different Binding Modes Affect Conformational Dynamics and Protein Stabilization. J. Biomol. Struct. Dyn. 2021, 39, 6705–6712. [Google Scholar] [CrossRef] [PubMed]
- Stank, A.; Kokh, D.B.; Fuller, J.C.; Wade, R.C. Protein Binding Pocket Dynamics. Acc. Chem. Res. 2016, 49, 809–815. [Google Scholar] [CrossRef] [PubMed]
- Kneller, D.W.; Phillips, G.; O’Neill, H.M.; Jedrzejczak, R.; Stols, L.; Langan, P.; Joachimiak, A.; Coates, L.; Kovalevsky, A. Structural Plasticity of SARS-CoV-2 3CL M<sup>pro</sup> Active Site Cavity Revealed by Room Temperature X-Ray Crystallography. Nat. Commun. 2020, 11, 3202. [Google Scholar] [CrossRef]
- Xia, S.; Zhu, Y.; Liu, M.; Lan, Q.; Xu, W.; Wu, Y.; Ying, T.; Liu, S.; Shi, Z.; Jiang, S.; Lu, L. Fusion Mechanism of 2019-nCoV and Fusion Inhibitors Targeting HR1 Domain in Spike Protein. Cell Res. 2020, 30, 343–355. [Google Scholar] [CrossRef] [PubMed]
- Borisevich, S.S.; Kirpichnikov, M.P.; Grischenko, A.B.; Moshkovskii, S.A.; Dymova, O.A.; Eremina, E.A.; Ivanova, O.V.; Tuzikov, F.V.; Potemkin, S.A. HSP70-Targeting Inhibitors Enhance the Efficacy of an Oncolytic Adenovirus in Glioblastoma Therapy. Viruses 2022, 14, 119. [Google Scholar] [CrossRef]
- Safaeeardebili, E. Analysis of CD147 Inhibitors Using Molecular Dynamics, Quantum and Pharmacophore Approaches. Ph.D. Thesis, Politecnico di Torino, Turin, Italy, 2022. [Google Scholar]
- Jackson, C.B.; Farzan, M.; Chen, B.; Choe, H. Mechanisms of SARS-CoV-2 Entry into Cells. Nat. Rev. Mol. Cell Biol. 2022, 23, 3–20. [Google Scholar] [CrossRef] [PubMed]
- Xia, X. Domains and Functions of Spike Protein in SARS-CoV-2 in Context of Vaccine Design. Viruses 2021, 13, 109. [Google Scholar] [CrossRef] [PubMed]
- Wankowicz, S.A.; de Oliveira, S.H.; Hogan, D.W.; van den Bedem, H.; Fraser, J.S. Ligand Binding Remodels Protein Side-Chain Conformational Heterogeneity. eLife 2022, 11, e74114. [Google Scholar] [CrossRef]
- Moradi, S.; Evora, L.; Menezes, R.; Mahdavifar, M.D.; Forli, E.; Soares, T.A. Exploration of Druggable Cavities within SARS-CoV-2 Spike Glycoprotein. Comput. Biol. Med. 2024, 183, 109245. [Google Scholar]
- Valério, M.; Sampaio, F.M.; Sterpone, F. A Multiscale In Silico Modeling for SARS-CoV-2 Research (MISCORE). Front. Med. Technol. 2022, 4, 1009451. [Google Scholar]
- Amamuddy, O.S.; Glenister, M.; Tshabalala, T.; Bishop, Ö.T. MDM-TASK-Web: MD-TASK and MODE-TASK Web Server for Analyzing Protein Dynamics. Comput. Struct. Biotechnol. J. 2021, 19, 5059–5071. [Google Scholar] [CrossRef]
- Amusengeri, A.; Singh, A.; Bishnoi, S.; Makhoba, X.H. In Silico Discovery and Molecular Mechanistic Insight into Drugs as Potential Inhibitors of IKBKE in the Treatment of COVID-19. Int. J. Mol. Sci. 2019, 20, 5574. [Google Scholar] [CrossRef]
- Sankar, K.; Magarkar, A.; Malik, R.; Raghunandan, D.; Nag, A.; Agrawal, V. Sulfobetaine-Containing Lipid Bilayers: Insights from a Molecular Dynamics Simulation. J. Chem. Phys. 2015, 143, 245103. [Google Scholar]
- Melero, R.; Grubaugh, N.D.; Wyss, R.; Subramaniam, S.; Chacon, P.; Borgnia, M.J. Continuous Flexibility Analysis of SARS-CoV-2 Spike Prefusion Structures. IUCrJ 2014, 7, 1059–1069. [Google Scholar] [CrossRef]
- Ray, D.; Jia, R.; Zucker, J.; Verma, S.; Cho, W.; Tao, P.; Bowen, J.D.; Hartman, M.G.; Bloom, M.E.; Kapoor, T.M.; Rao, Z.; Iyengar, R. Structural Insights into the Small Molecule Antiviral Compound Arbidol and SARS-CoV-2 S-Protein Interaction. Proc. Natl. Acad. Sci. U.S.A. 2021, 118, e2100943118. [Google Scholar] [CrossRef]
- Luque, I.; Freire, E. Structure of Proteins: Energy, Entropy and Free Energy. Proteins 2000, 41 (Suppl. 4), 63–71. [Google Scholar] [CrossRef]
- Gowo, P. In Silico Identification of Potential Vaccine Targets for the Prevention of Clinical Dengue Fever. Ph.D. Thesis, Rhodes University, 2021.
- Csermely, P.; Sandhu, K.S.; Hazai, E.; Hoksza, Z.; Kiss, H.J.; Miozzo, F.; Olbei, M.; Rákhely, Z.; Szalay, M.S.; Veres, D.V. Disordered Proteins and Network Disorder in Network Descriptions of Protein Structure, Dynamics and Function: Hypotheses and Facts. Trends Biochem. Sci. 2010, 35, 539–546. [Google Scholar] [CrossRef]
- Nussinov, R.; Tsai, C.-J. Allostery in Disease and in Drug Discovery. Biophys. Chem. 2014, 186, 22–30. [Google Scholar] [CrossRef]
- Ravasio, R.; Romanovski, V.; Maritan, A.; Micheletti, C. Inferring Contact Energies from a Two-Dimensional Gaussian Graph Model of the Protein Structure. Biophys. J. 2019, 117, 1954–1962. [Google Scholar] [CrossRef] [PubMed]
- Miller, B.R.; McGee, T.D.; Swails, J.M.; Homeyer, N.; Gohlke, H.; Roitberg, A.E. MMPBSA.py: An efficient program for end-state free energy calculations. J. Chem. Theory Comput. 2012, 8, 3314–3321. [Google Scholar] [CrossRef] [PubMed]
- Zhang, J.; Xiao, T.; Cai, Y.; Chen, B. Structure of SARS-CoV-2 spike protein. Curr. Opin. Virol. 2021, 50, 173–182. [Google Scholar] [CrossRef] [PubMed]
- Mandal, M.; Mandal, S. MM/GB(PB)SA integrated with molecular docking and ADMET approach to inhibit the fat-mass-and-obesity-associated protein using bioactive compounds derived from food plants used in traditional Chinese medicine. Pharmacol. Res. Mod. Chin. Med. 2024, 11, 100435. [Google Scholar] [CrossRef]
- Joshi, P.; Garg, S.; Mani, S.; Shoaib, R.; Jakhar, K.; Almuqdadi, H.T.A.; Sonar, S.; Marothia, M.; Behl, A.; Biswas, S.; Singhal, J. Targeting host inducible-heat shock protein 70 with PES-Cl is a promising antiviral strategy against SARS-CoV-2 infection and pathogenesis. Int. J. Biol. Macromol. 2024, 279, 135069. [Google Scholar] [CrossRef] [PubMed]
- Verkhivker, G.M.; Di Paola, L. Dynamic network modeling of allosteric interactions and communication pathways in the SARS-CoV-2 spike trimer mutants: differential modulation of conformational landscapes and signal transmission via cascades of regulatory switches. J. Phys. Chem. B 2021, 125, 850–873. [Google Scholar] [CrossRef]
- Amadei, A.; Linssen, A.B.; Berendsen, H.J.C. Essential dynamics of proteins. Proteins 1993, 17, 412–425. [Google Scholar] [CrossRef] [PubMed]
- Bhattacharya, S. Small molecule inhibitors. In Spatially Variable Genes in Cancer: Development, Progression, and Treatment Response; Raghavan, R., Ed.; IGI Global: Hershey, PA, USA, 2024; p. 447. [Google Scholar]
- Abraham, M.J.; Murtola, T.; Schulz, R.; Páll, S.; Smith, J.C.; Hess, B.; Lindahl, E. GROMACS: High performance molecular simulations through multi-level parallelism from laptops to supercomputers. SoftwareX 2015, 1, 19–25. [Google Scholar] [CrossRef]
- Sousa da Silva, A.W.; Vranken, W.F. ACPYPE—AnteChamber PYthon Parser interfacE. BMC Res. Notes 2012, 5, 367. [Google Scholar] [CrossRef]
- Sasidharan, S.; Shukla, R.; Tripathi, T.; Saudagar, P. pH-based molecular dynamics simulation for analysing protein structure and folding. In Protein Folding Dynamics and Stability: Experimental and Computational Methods; Saudagar, P., Tripathi, T., Eds.; Springer Nature Singapore: Singapore, 2023; pp. 203–219. [Google Scholar] [CrossRef]
- Piplani, S.; Singh, P.K.; Winkler, D.A.; Petrovsky, N. In silico comparison of SARS-CoV-2 spike protein-ACE2 binding affinities across species and implications for virus origin. Sci. Rep. 2021, 11, 13063. [Google Scholar] [CrossRef]
- Wei, G.; Xi, W.; Nussinov, R.; Ma, B. Protein ensembles: how does nature harness thermodynamic fluctuations for life? Chem. Rev. 2016, 116, 6516–6551. [Google Scholar] [CrossRef]
- Valdés-Tresanco, M.S.; Valdés-Tresanco, M.E.; Valiente, P.A.; Moreno, E. gmx_MMPBSA: A new tool to perform end-state free energy calculations with GROMACS. J. Chem. Theory Comput. 2021, 17, 6281–6291. [Google Scholar] [CrossRef]
- Onufriev, A.; Bashford, D.; Case, D.A. Exploring protein native states and large-scale conformational changes with a modified generalized Born model. Proteins 2004, 55, 383–394. [Google Scholar] [CrossRef] [PubMed]
Figure 1.
Kernel Density Estimation plots for (a) Ligand–free system, (b) NSC36398–bound system, and (c) NSC281245–bound system, the last 50 ns of the simulation trajectory.
Figure 1.
Kernel Density Estimation plots for (a) Ligand–free system, (b) NSC36398–bound system, and (c) NSC281245–bound system, the last 50 ns of the simulation trajectory.
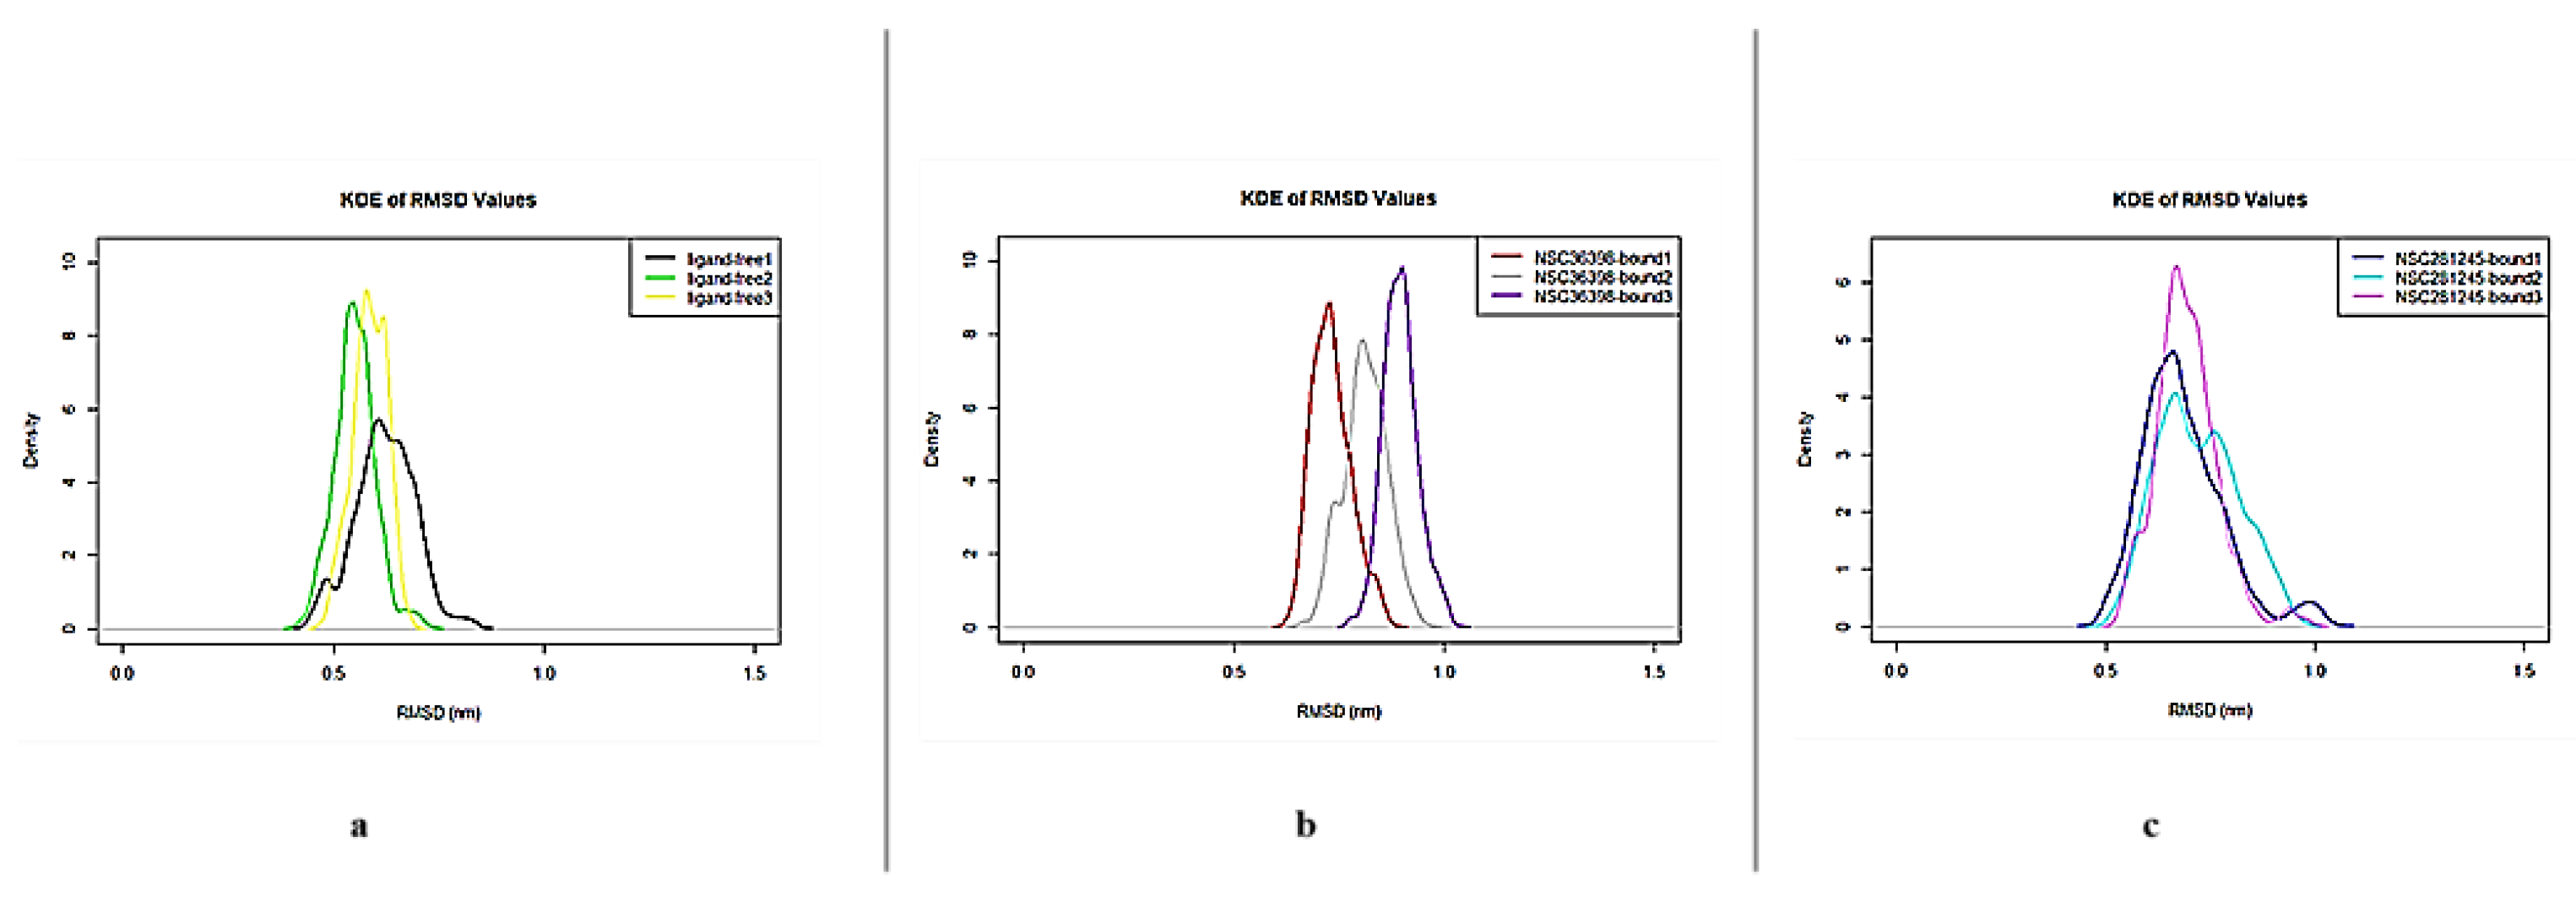
Figure 2.
The captured Cα-RMSD plots of the ligand–free system, NSC36398–bound system, and NSC281245–bound system, generated using gmx rms of the last 50 ns, showing the equilibration phase of the MD simulations referencing their initial structures.
Figure 2.
The captured Cα-RMSD plots of the ligand–free system, NSC36398–bound system, and NSC281245–bound system, generated using gmx rms of the last 50 ns, showing the equilibration phase of the MD simulations referencing their initial structures.
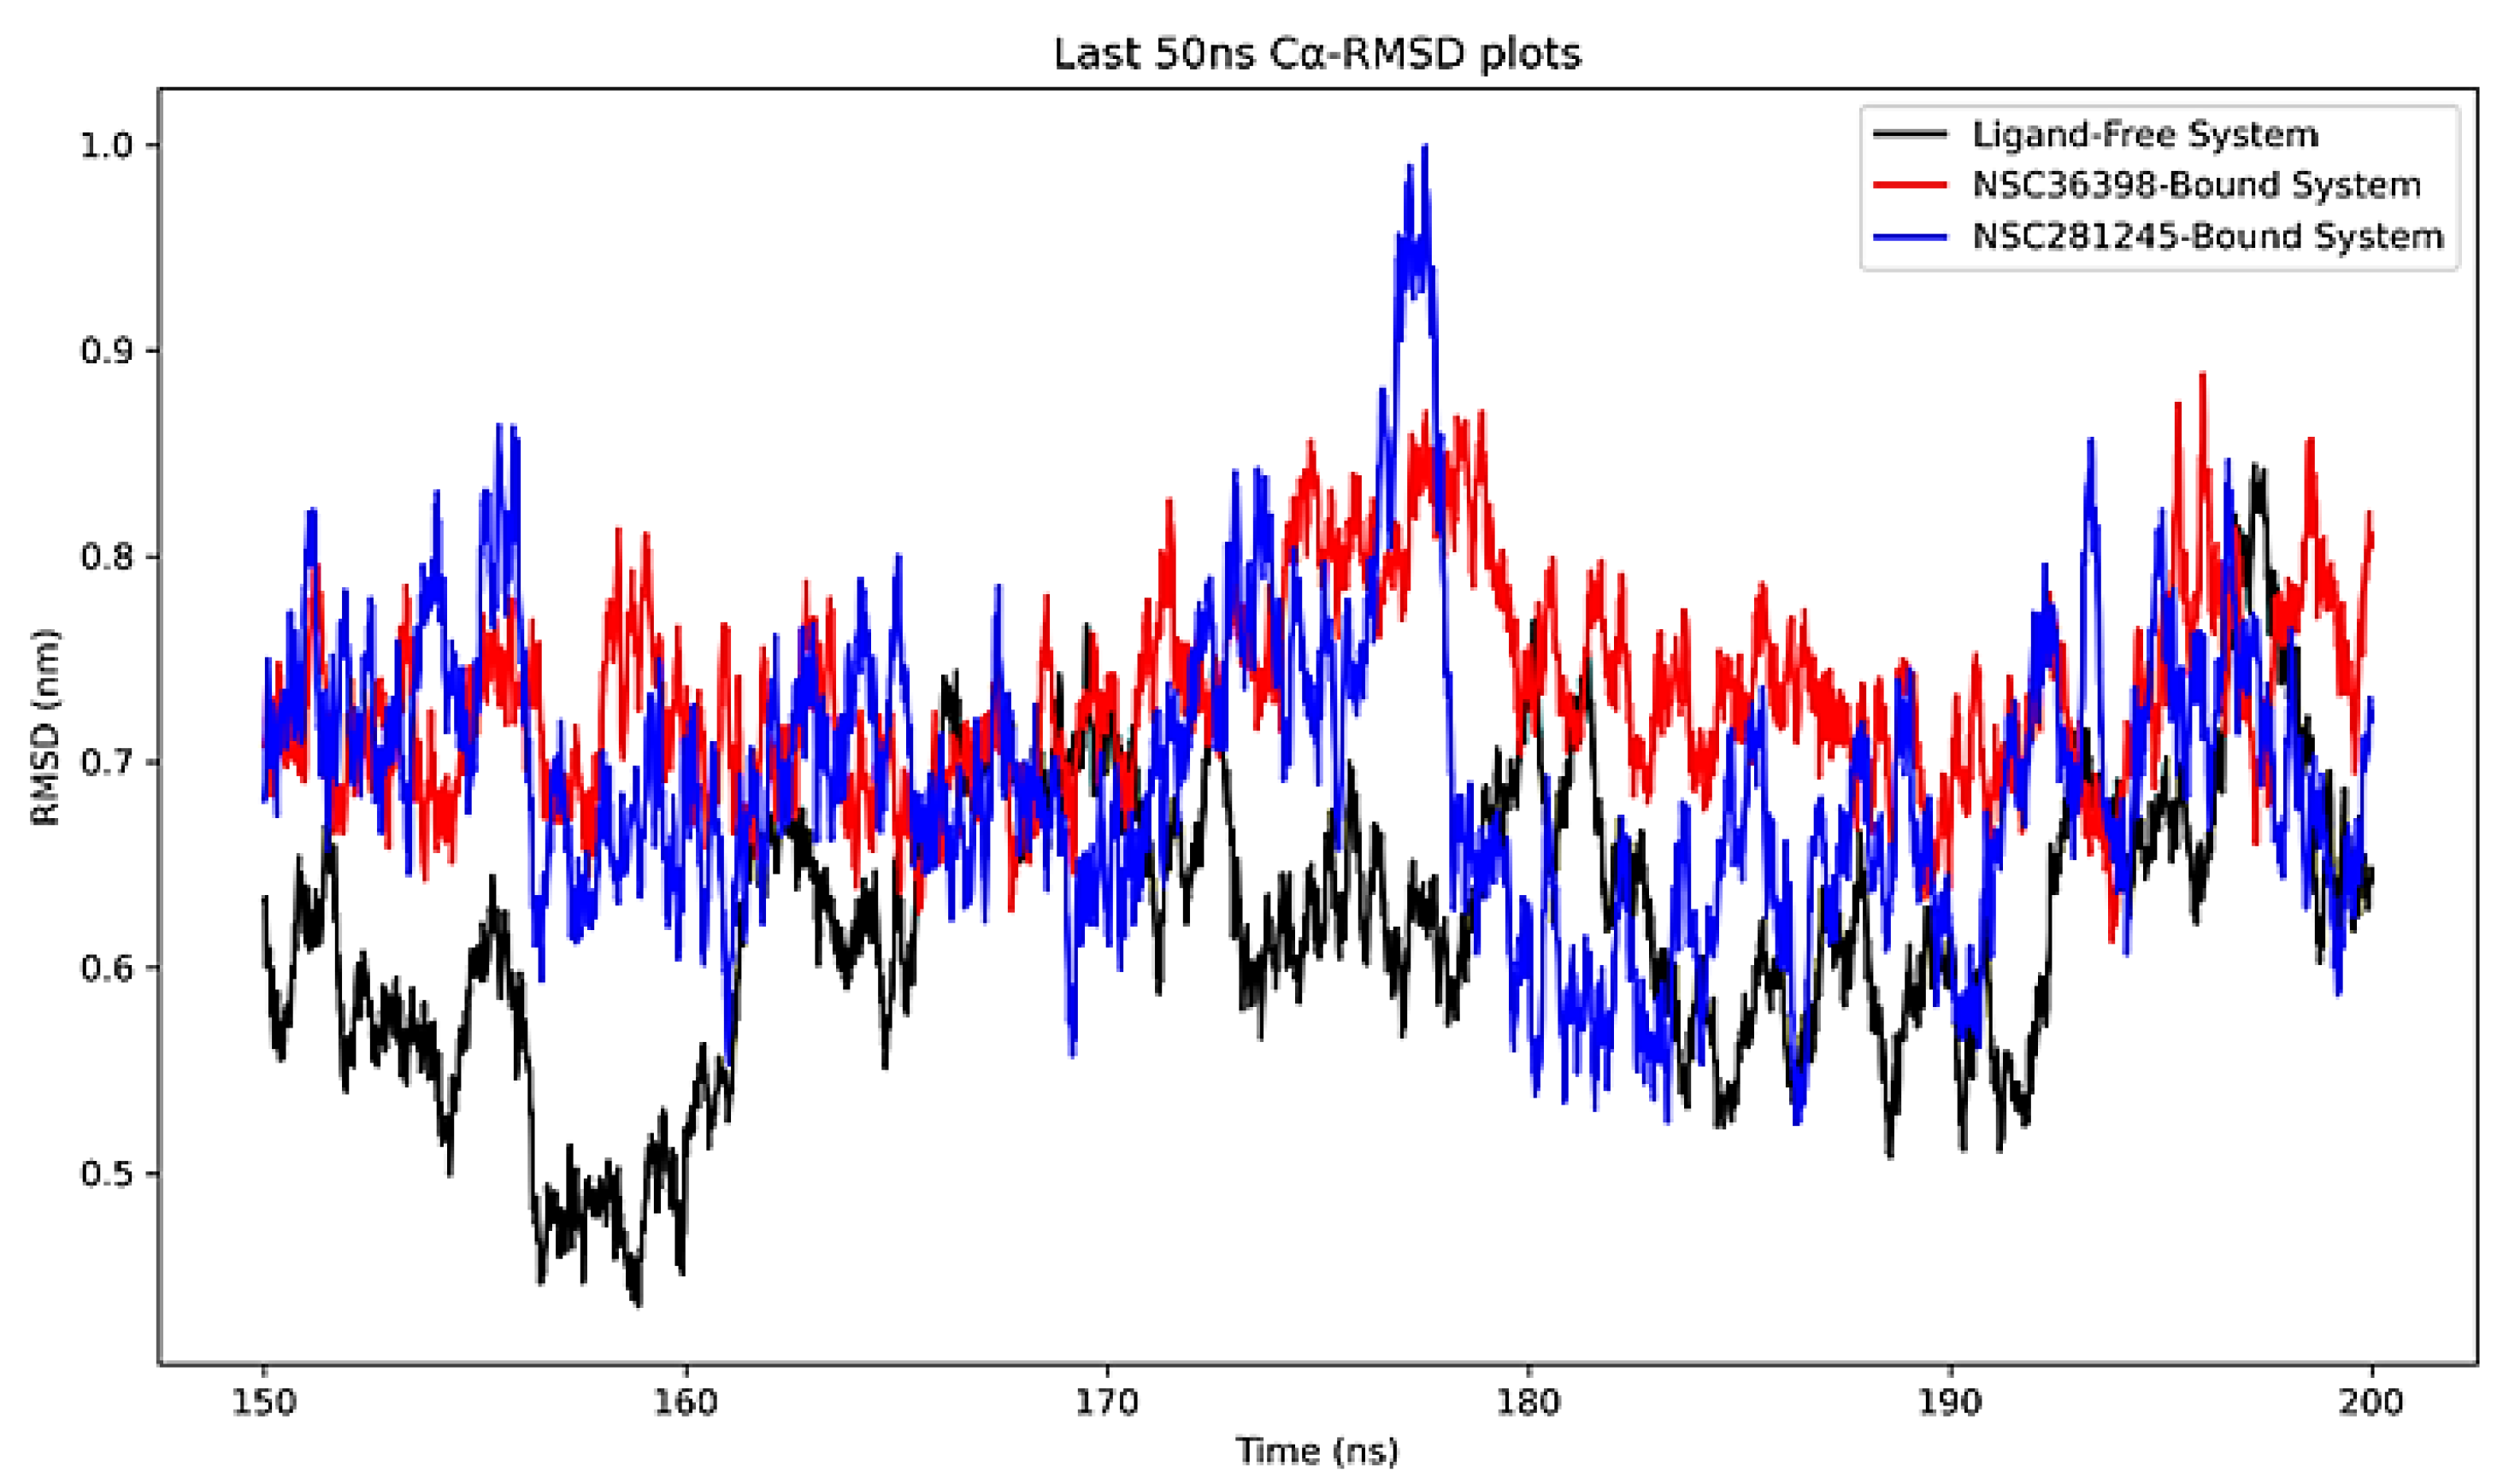
Figure 3.
Captured Cα-RMSD plots of the HSPA8 SBD (amino acid residue positions 405 to 495) of the ligand–free system, NSC36398–bound system, and NSC281245–bound system about their initial structures.
Figure 3.
Captured Cα-RMSD plots of the HSPA8 SBD (amino acid residue positions 405 to 495) of the ligand–free system, NSC36398–bound system, and NSC281245–bound system about their initial structures.
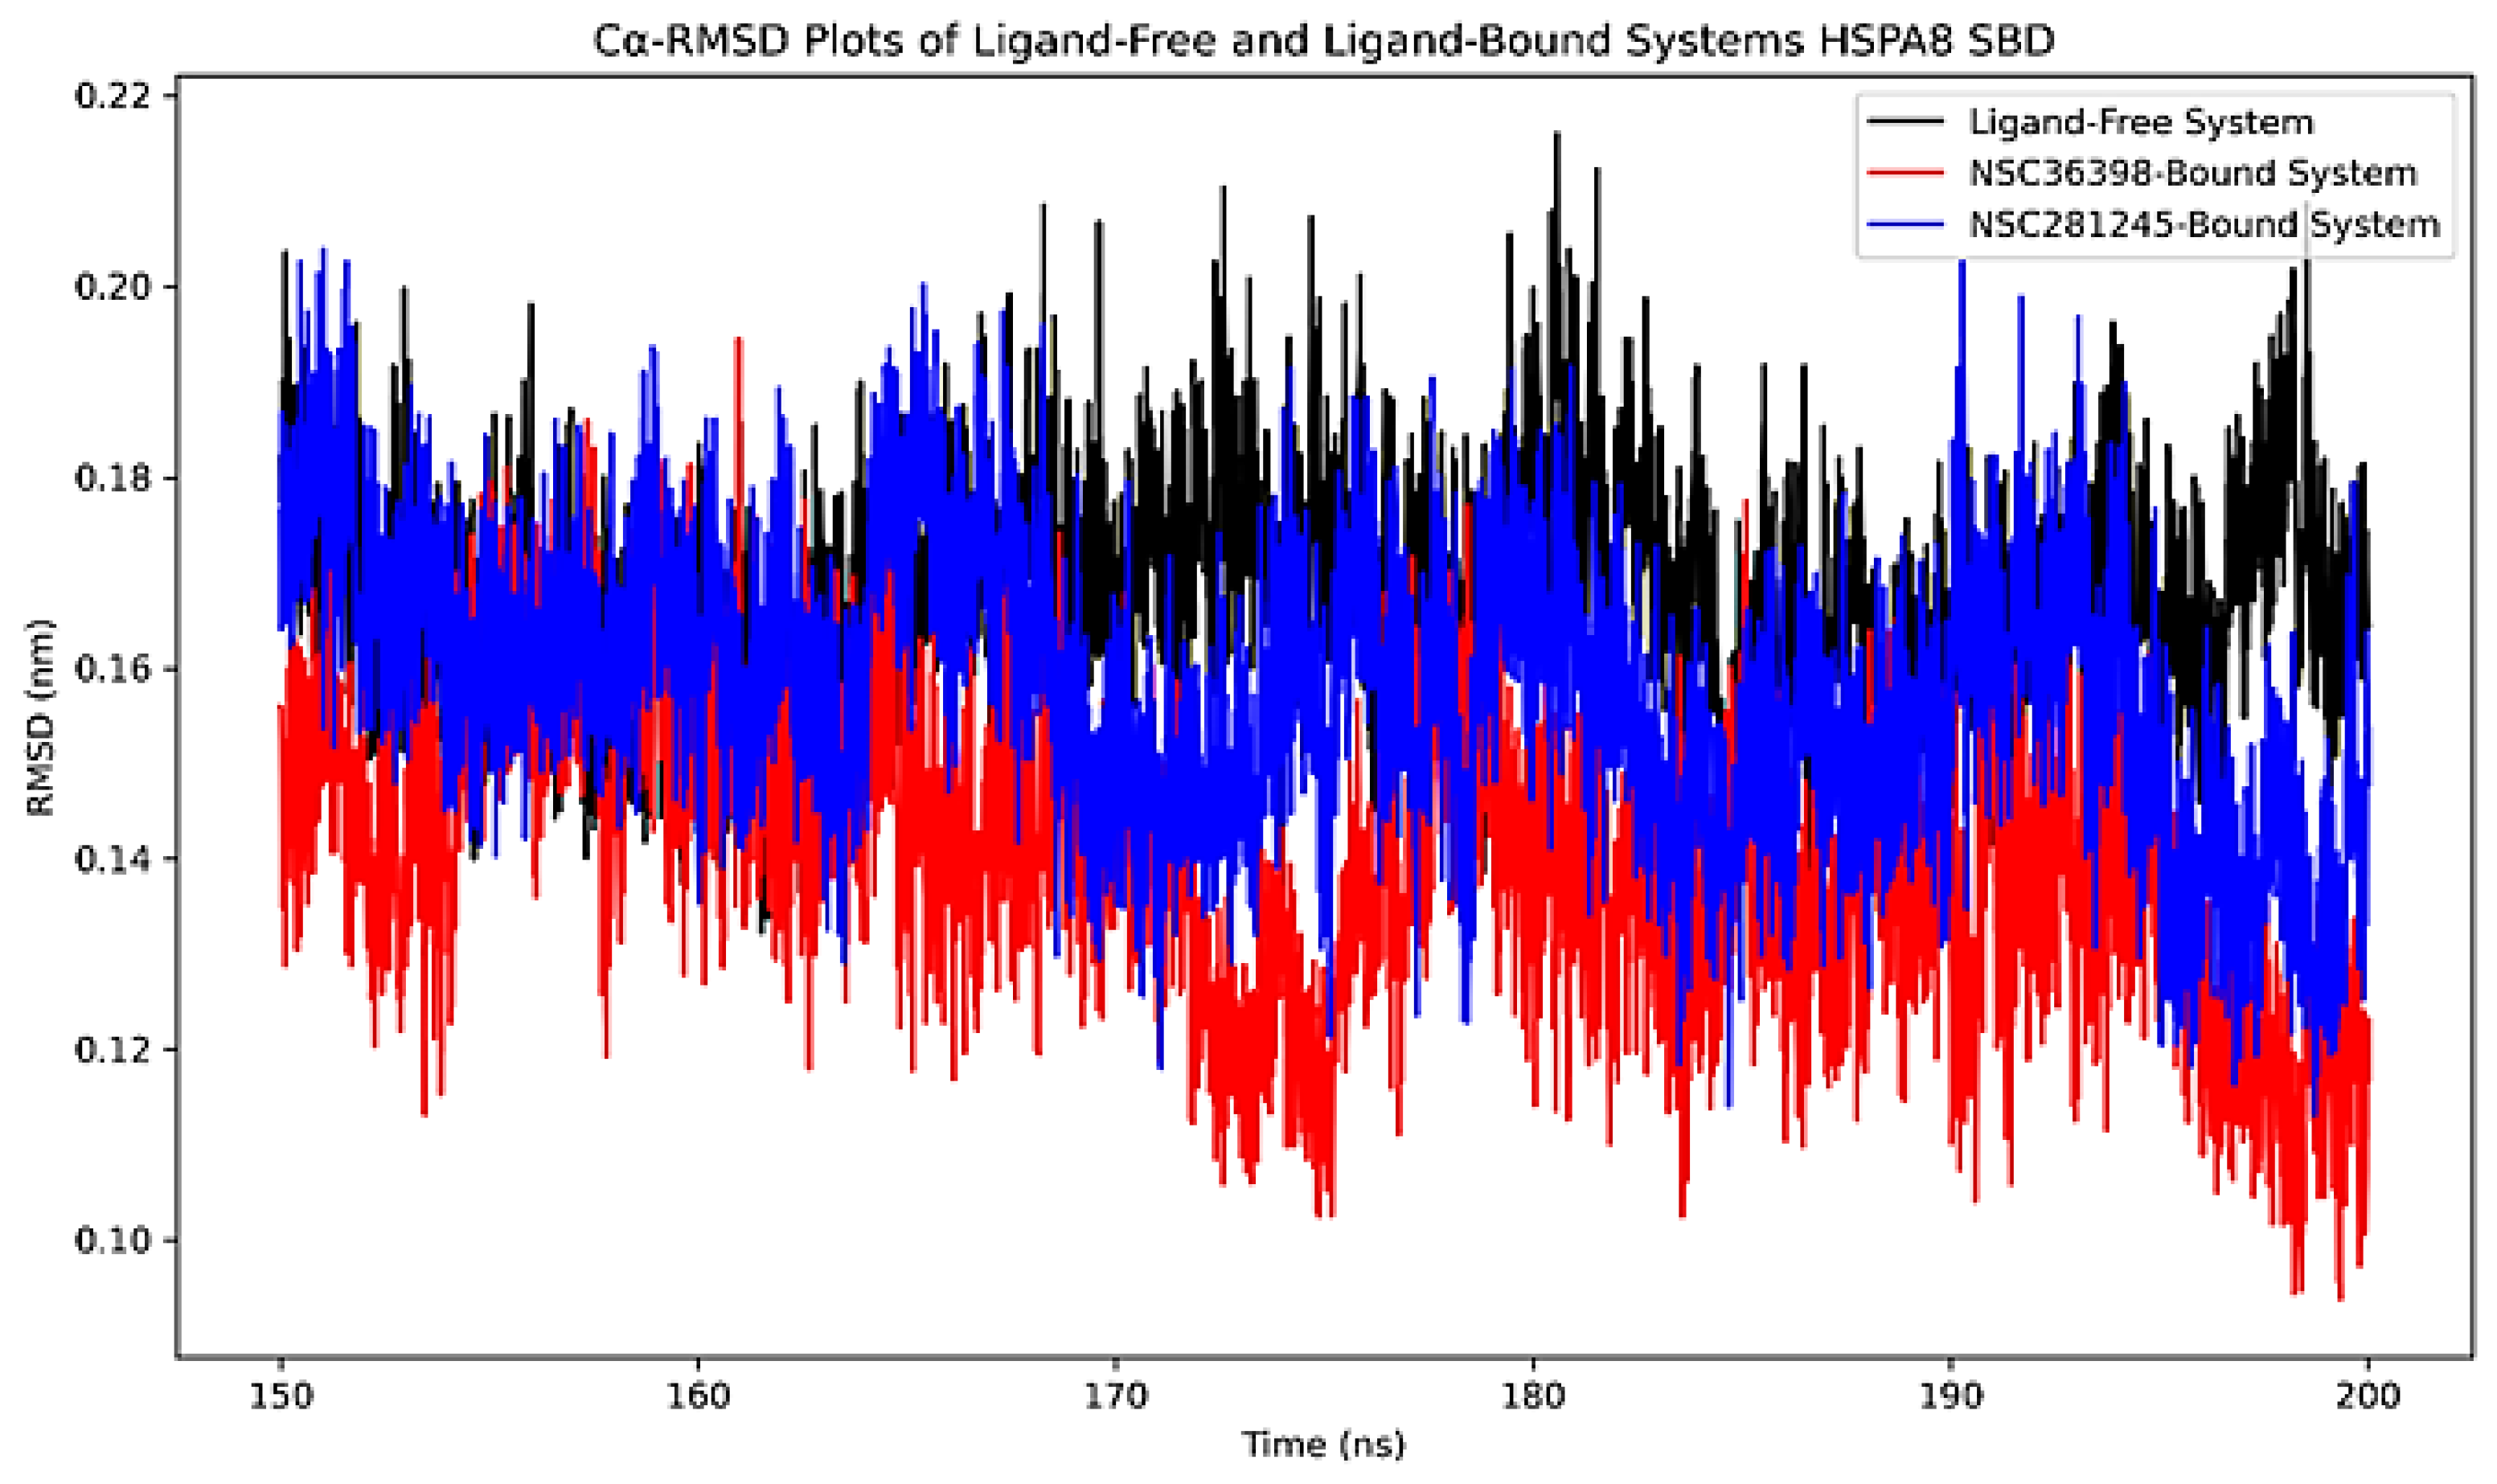
Figure 4.
Captured Cα-RMSD plots of the (a) spike protein’s chain A RBD (amino acid residue positions 455 to 495), (b) spike protein’s chain B RBD (residue positions 333 to 371) from the ligand–free system, NSC36398–bound system and NSC281245–bound system, with reference to their initial structures.
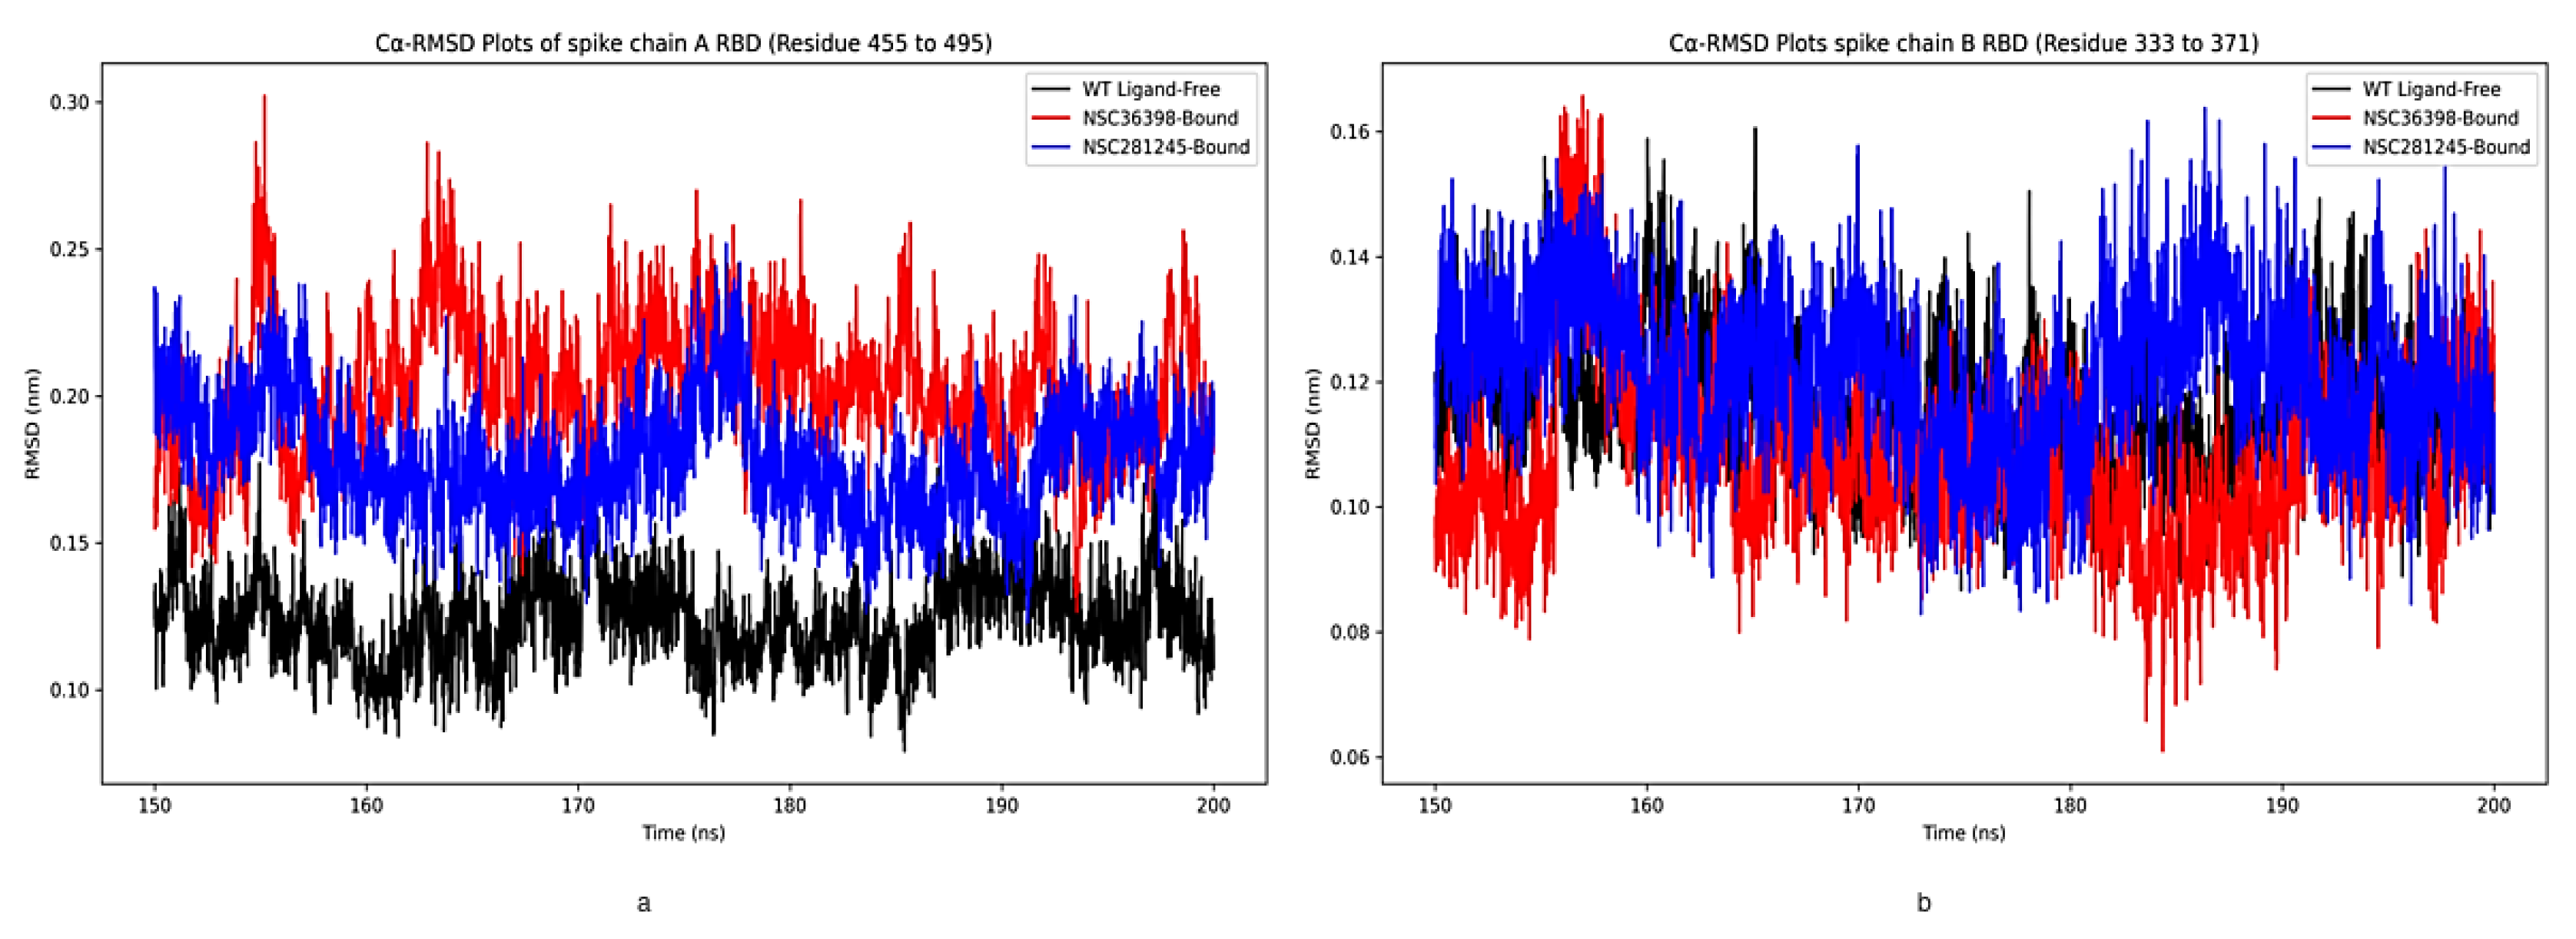
Figure 5.
Structural representation of the binding pocket residues within 5 Å of the ligand in (a) NSC36398–bound system, (b) NSC281245–bound system.
Figure 5.
Structural representation of the binding pocket residues within 5 Å of the ligand in (a) NSC36398–bound system, (b) NSC281245–bound system.
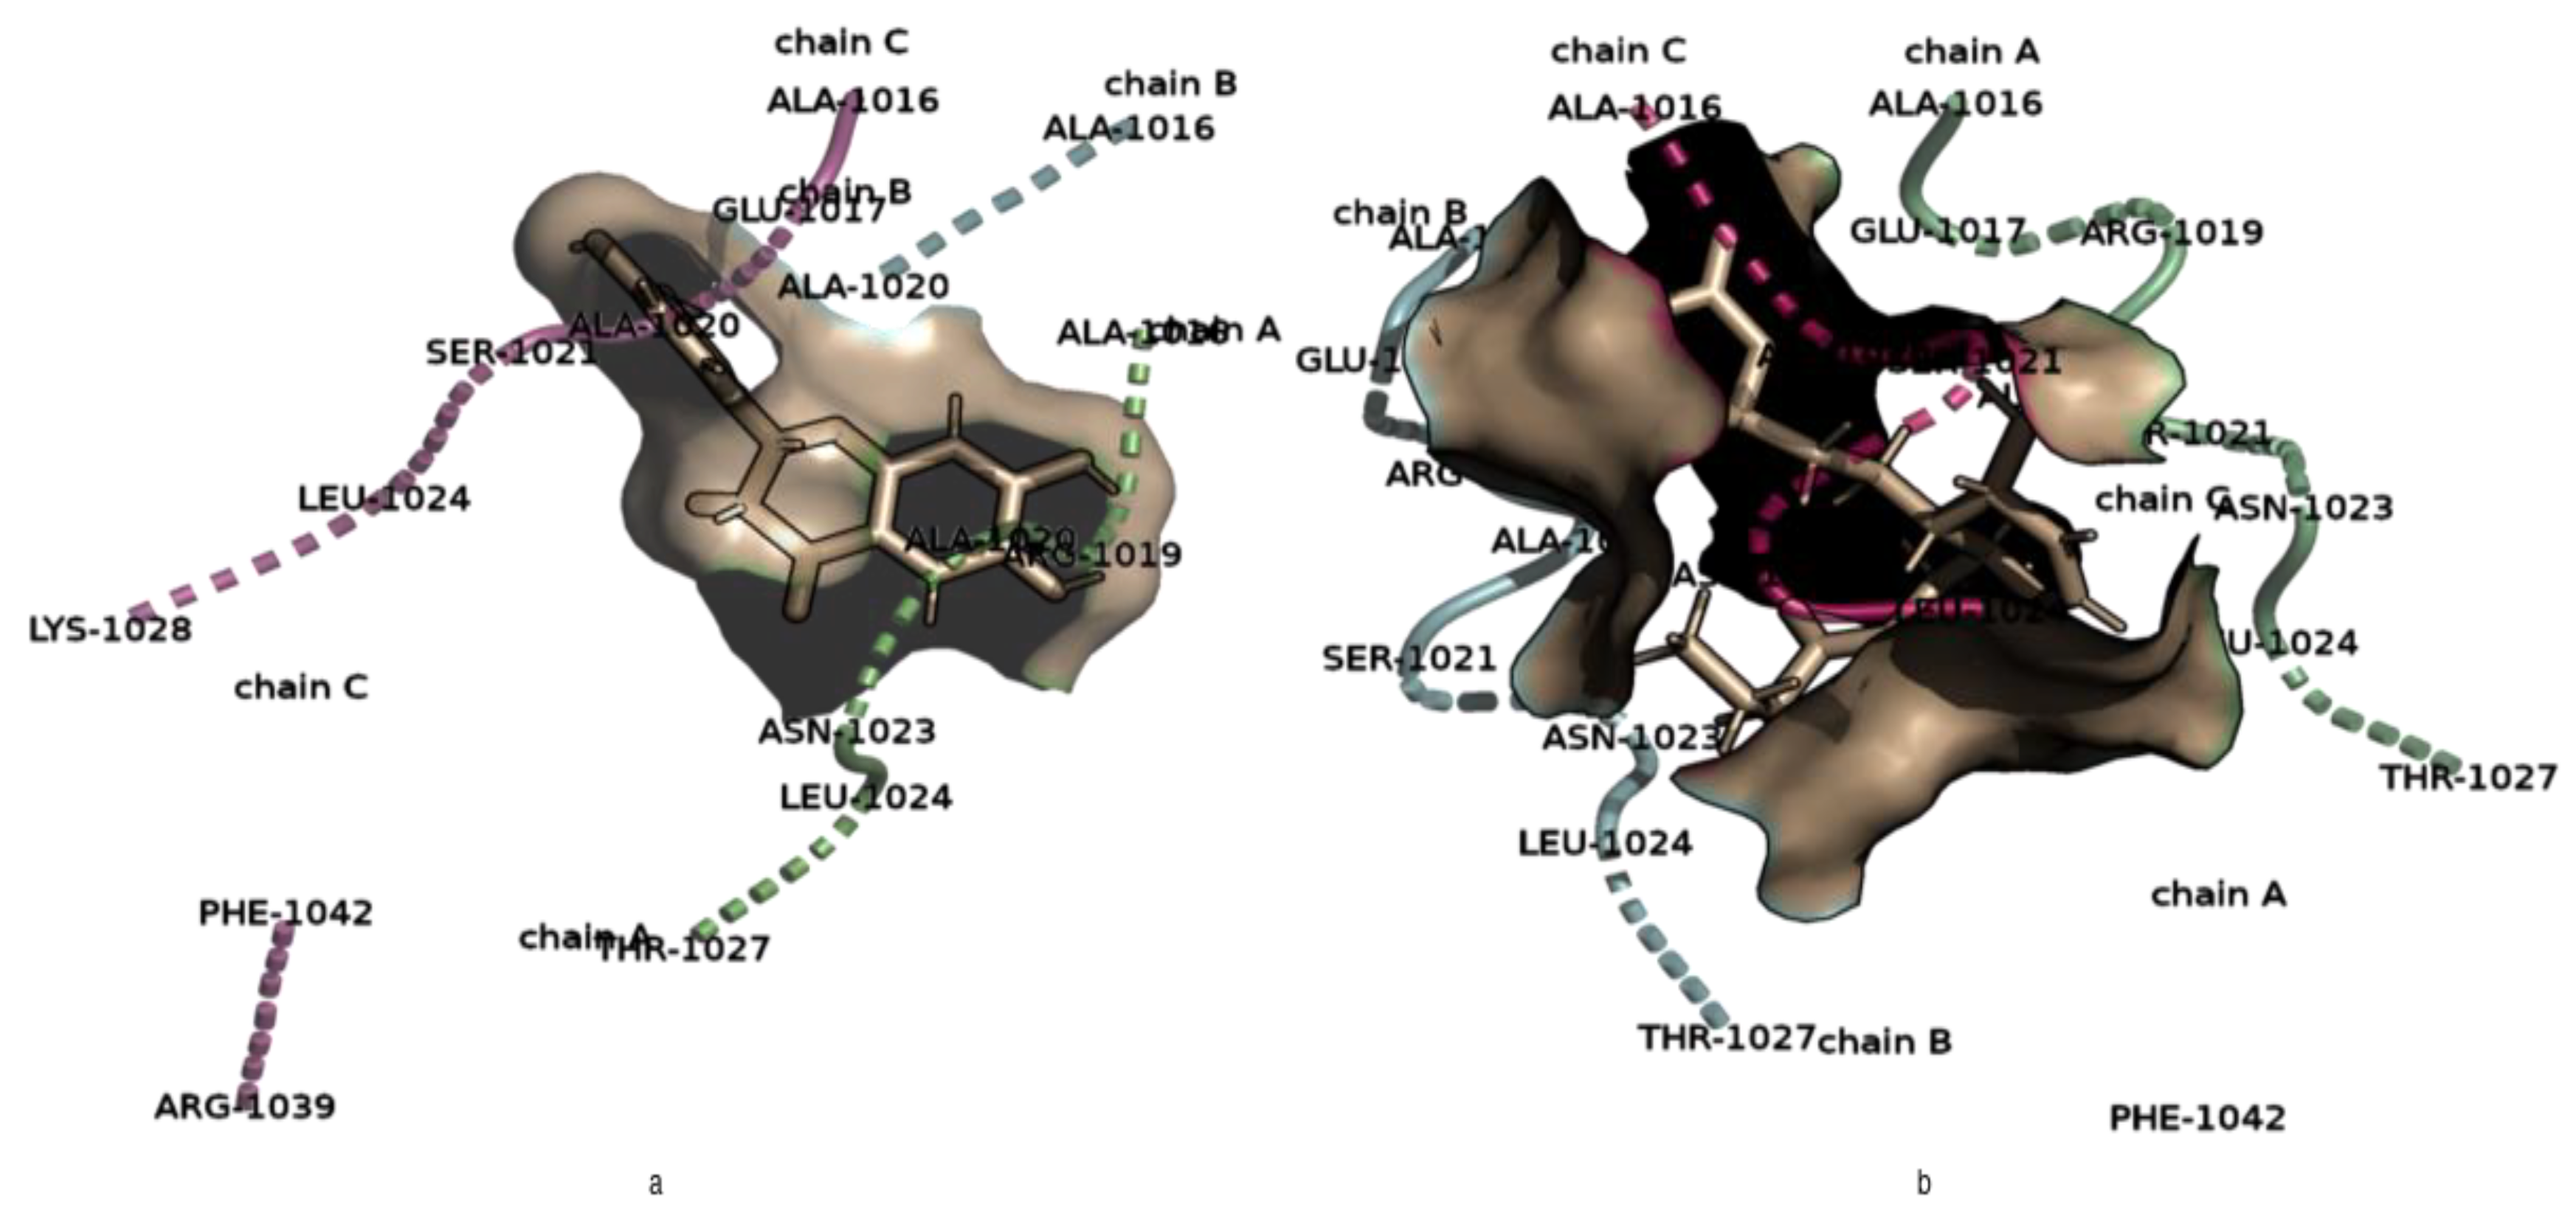
Figure 6.
Captured Cα-RMSD plots of the binding pocket of the Ligand–free system and ligand–bound systems within 5 Å of (a) NSC36398, and (b) NSC281245 relative to the initial structure.
Figure 6.
Captured Cα-RMSD plots of the binding pocket of the Ligand–free system and ligand–bound systems within 5 Å of (a) NSC36398, and (b) NSC281245 relative to the initial structure.
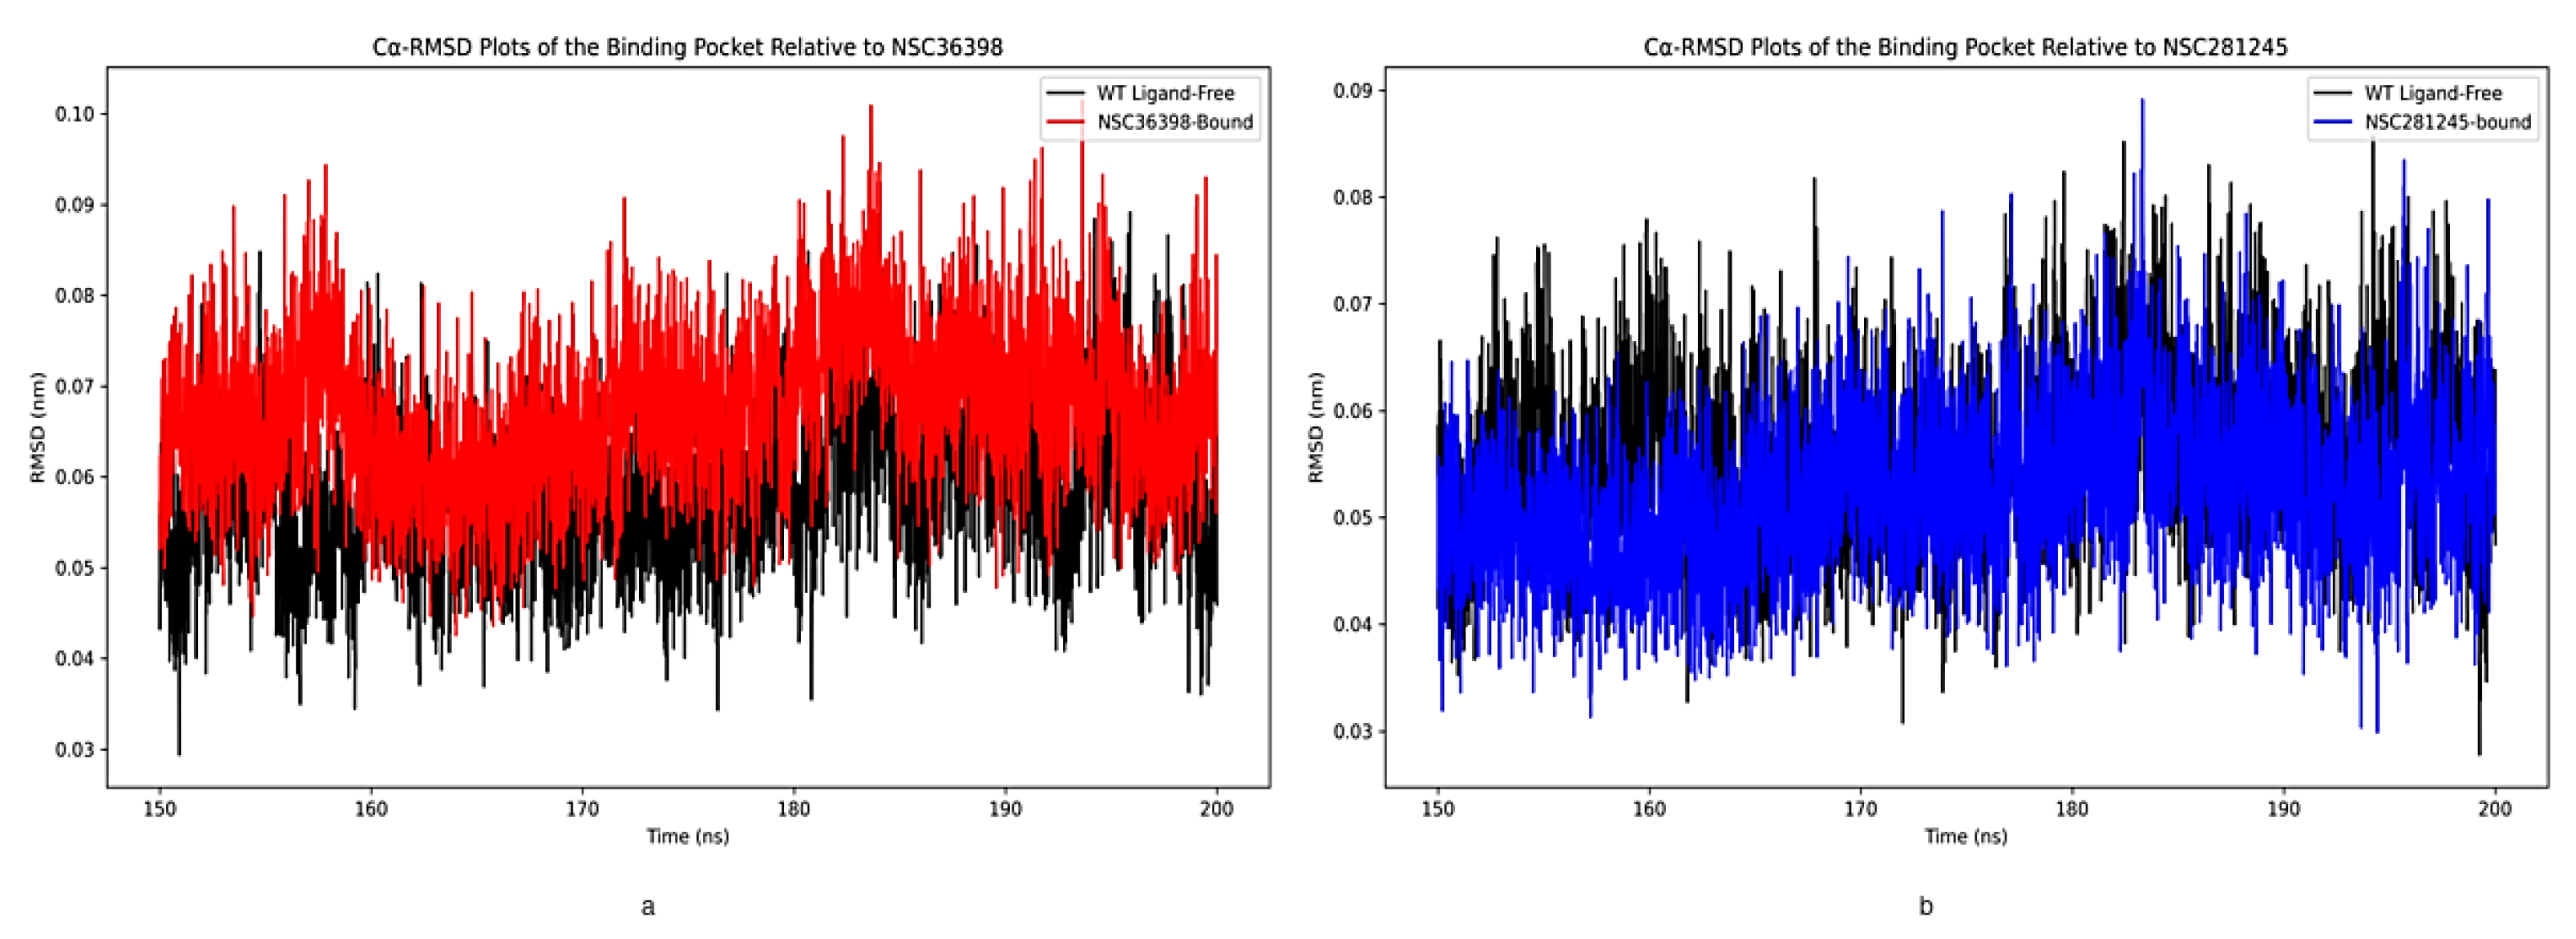
Figure 7.
Captured Cα-RMSF plots of the HSPA8 SBD (residue positions 405 to 495) from the ligand–free system, NSC36398–bound system and NSC281245–bound system.
Figure 7.
Captured Cα-RMSF plots of the HSPA8 SBD (residue positions 405 to 495) from the ligand–free system, NSC36398–bound system and NSC281245–bound system.
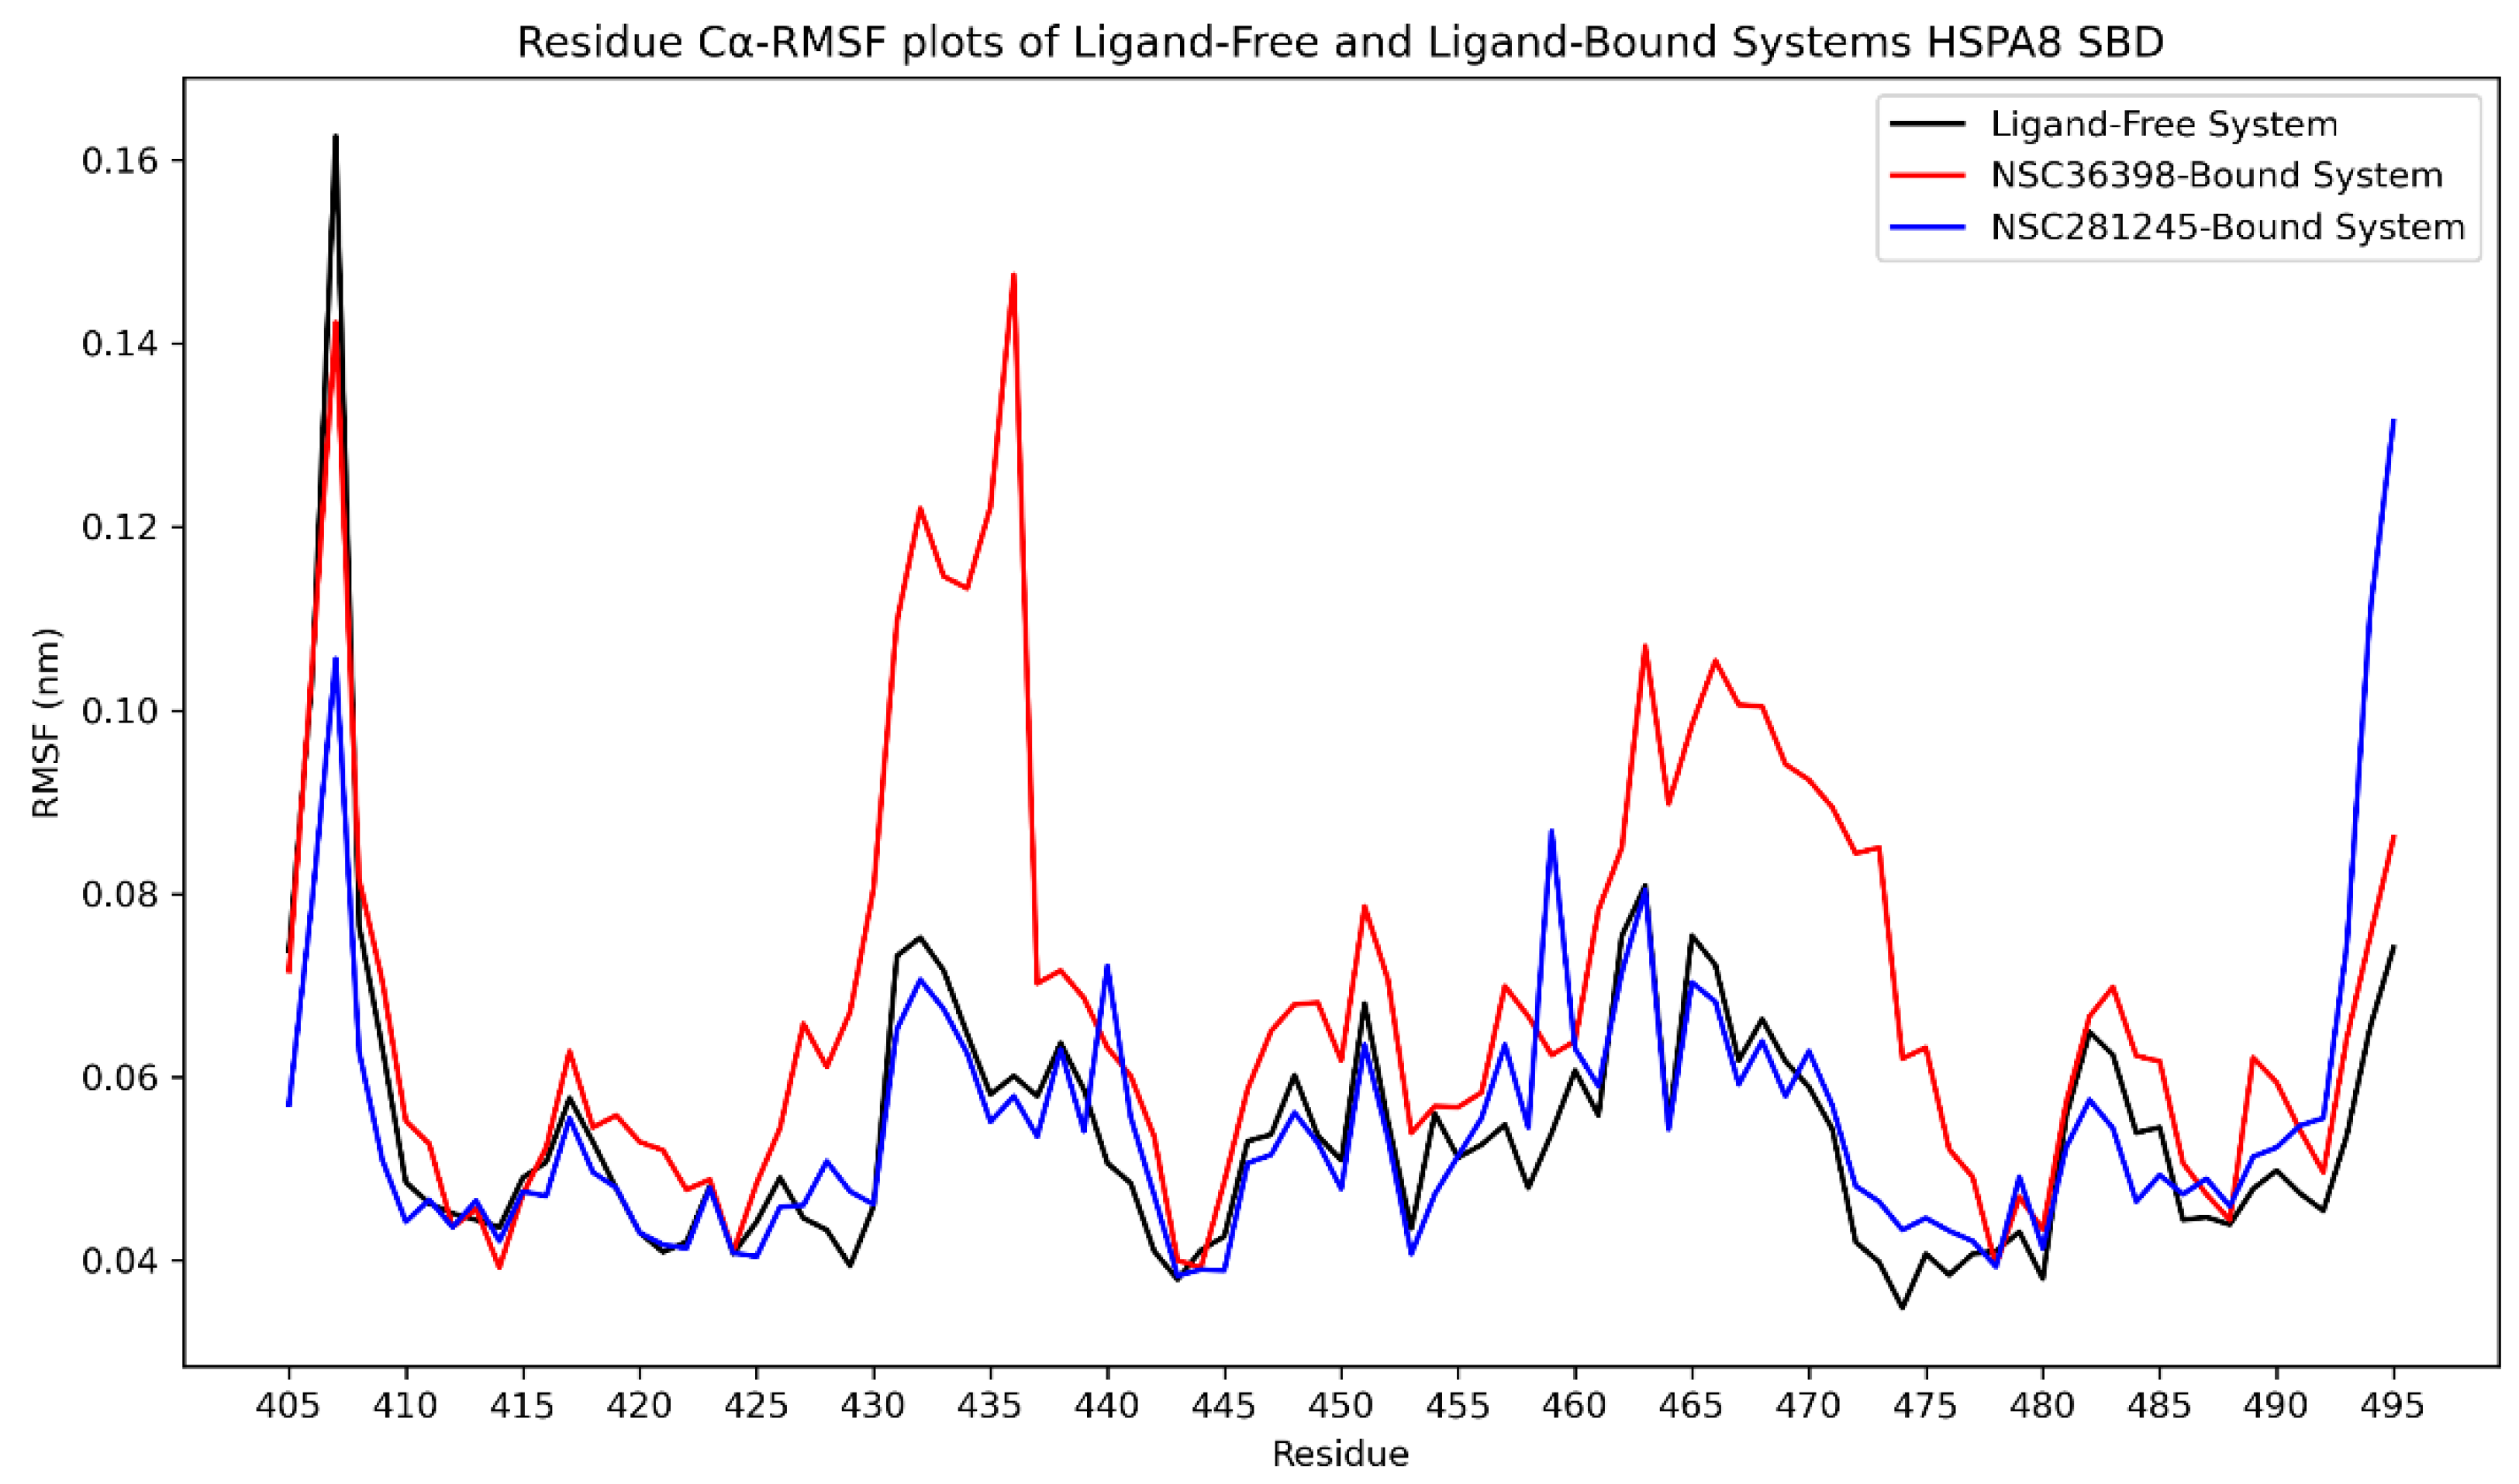
Figure 8.
Structural representation of the superimposed human HSPA8 substrate-binding domain in the (a) ligand-free, (b) NSC36398–bound systems and (c) NSC281245–bound system protein deviations with time. The structures were extracted from 0 ns (green), 150 ns (purple) and 200 ns (pink).
Figure 8.
Structural representation of the superimposed human HSPA8 substrate-binding domain in the (a) ligand-free, (b) NSC36398–bound systems and (c) NSC281245–bound system protein deviations with time. The structures were extracted from 0 ns (green), 150 ns (purple) and 200 ns (pink).
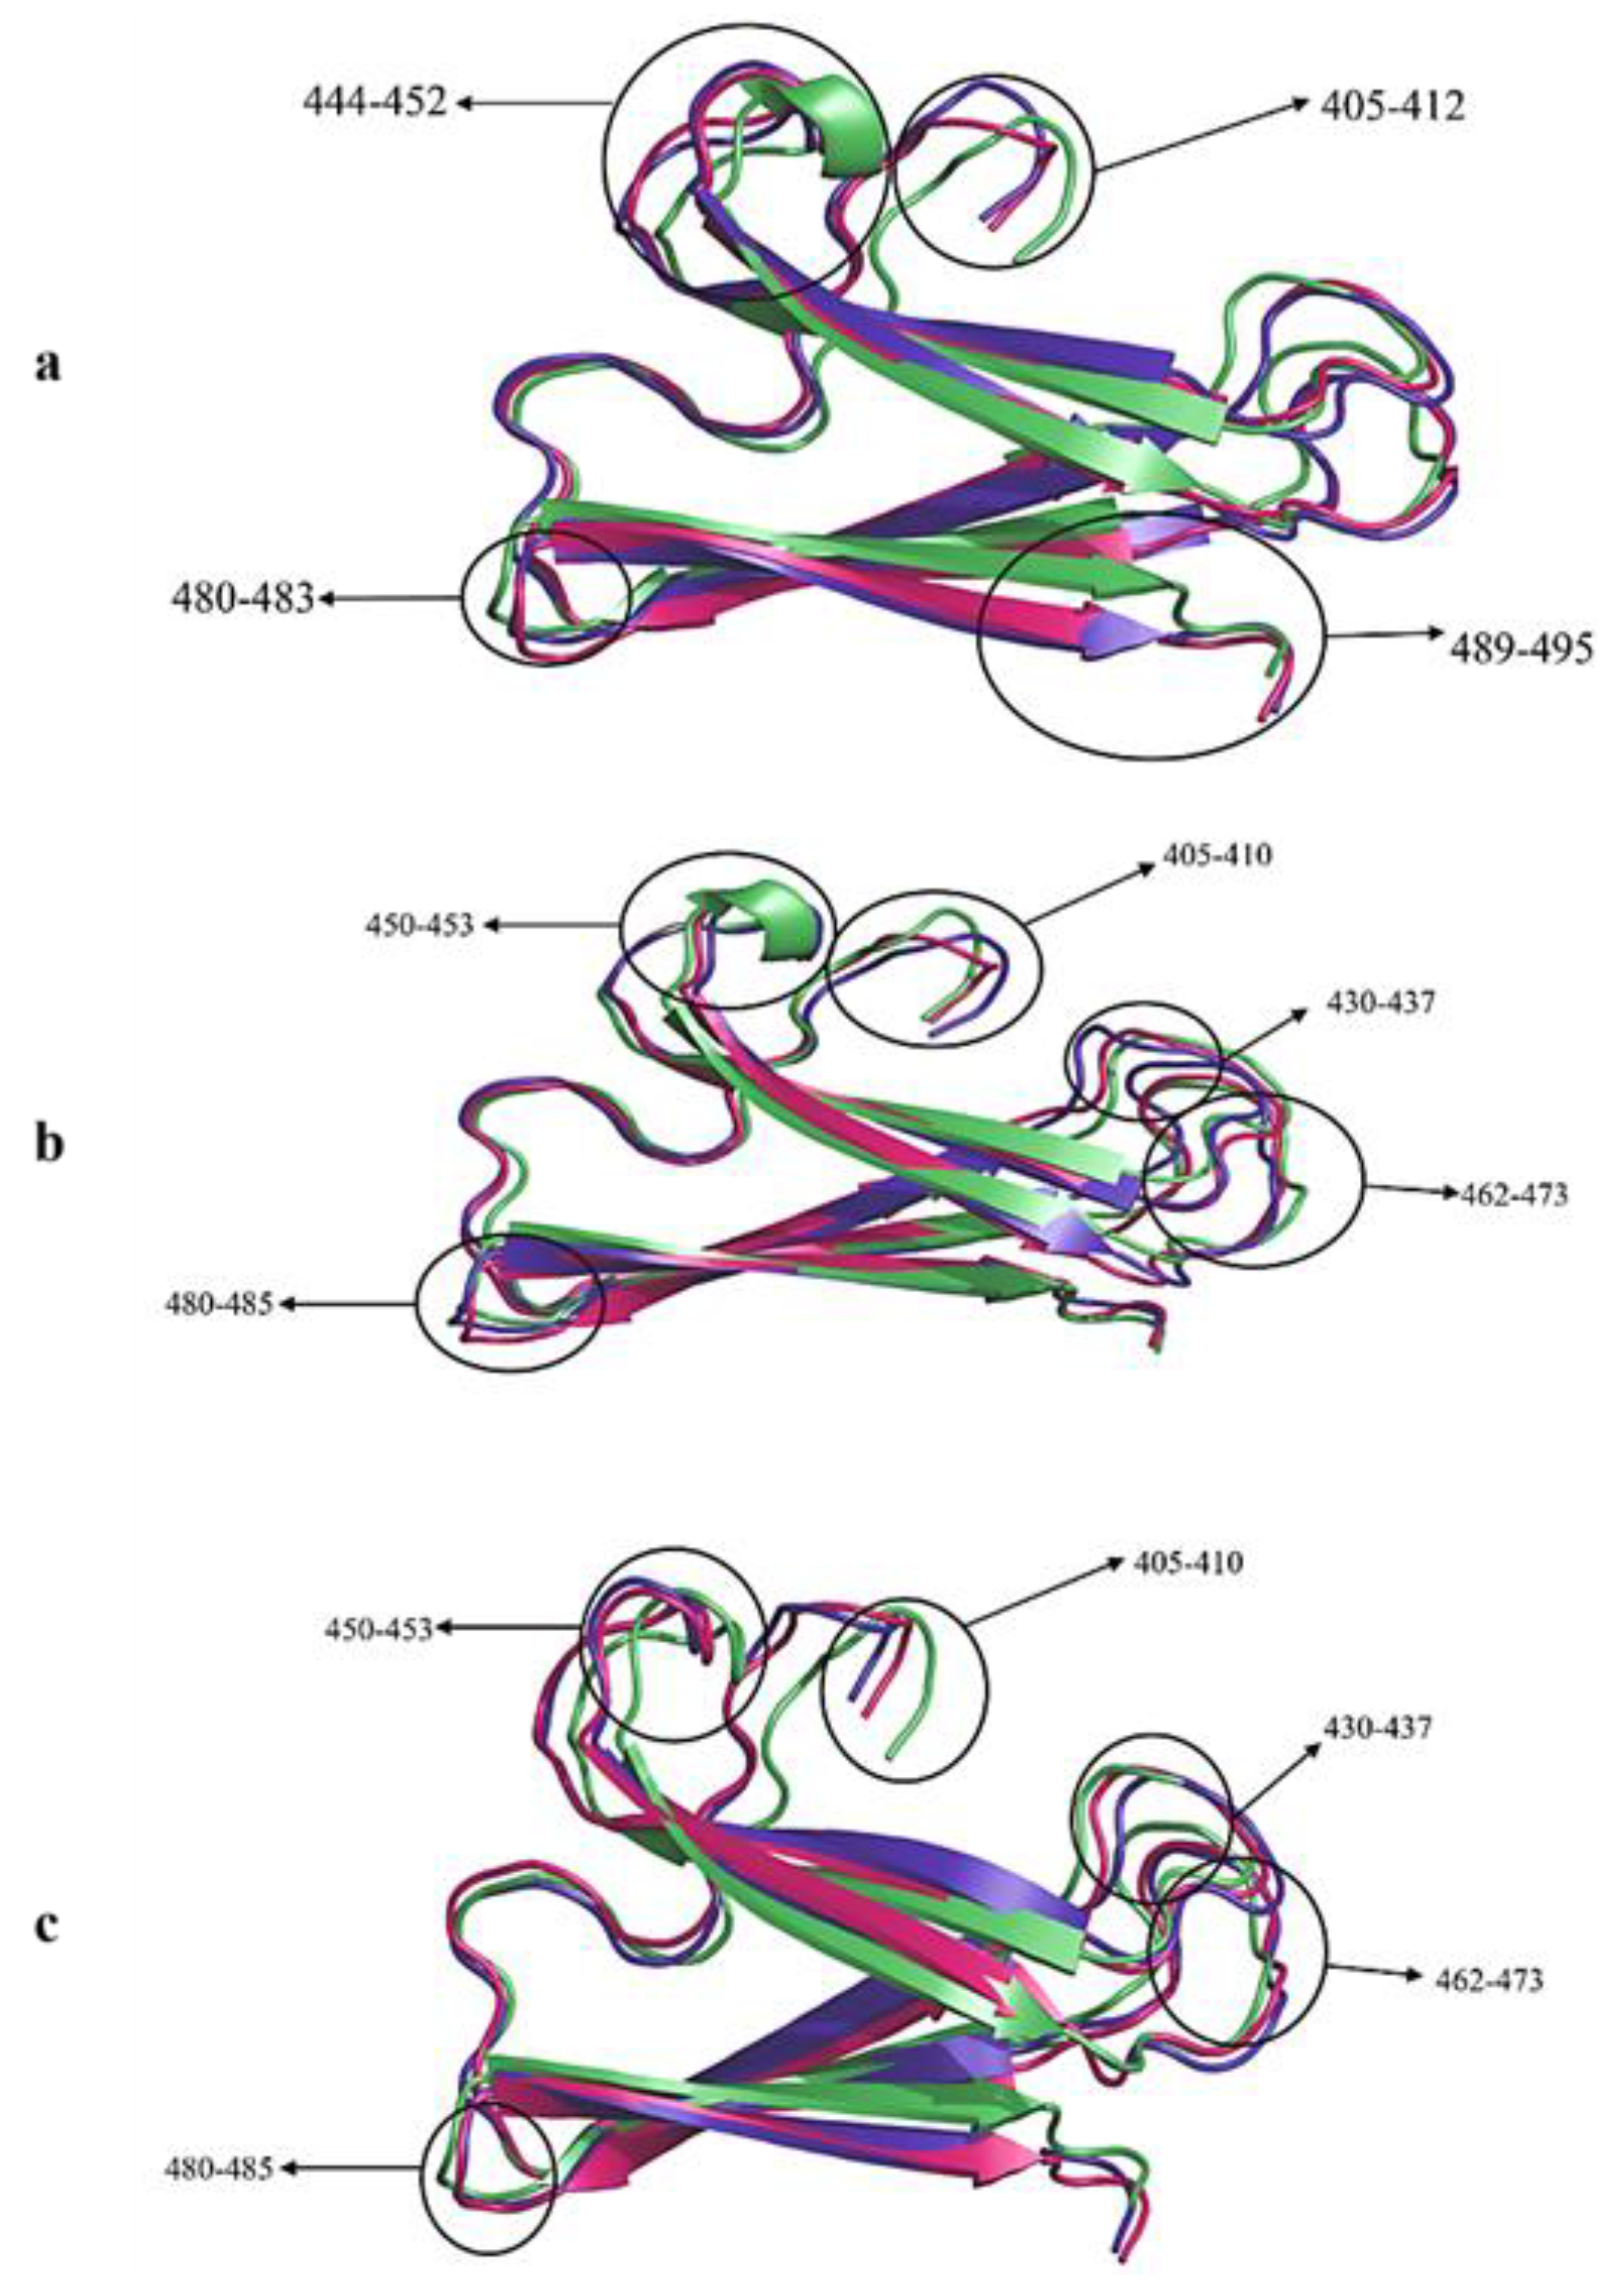
Figure 9.
Captured Cα-RMSF of the (a) spike protein’s chain A RBD (residue positions 455 to 495) (b) spike protein’s chain B RBD from the ligand–free system, NSC36398–bound system and NSC281245–bound system.
Figure 9.
Captured Cα-RMSF of the (a) spike protein’s chain A RBD (residue positions 455 to 495) (b) spike protein’s chain B RBD from the ligand–free system, NSC36398–bound system and NSC281245–bound system.
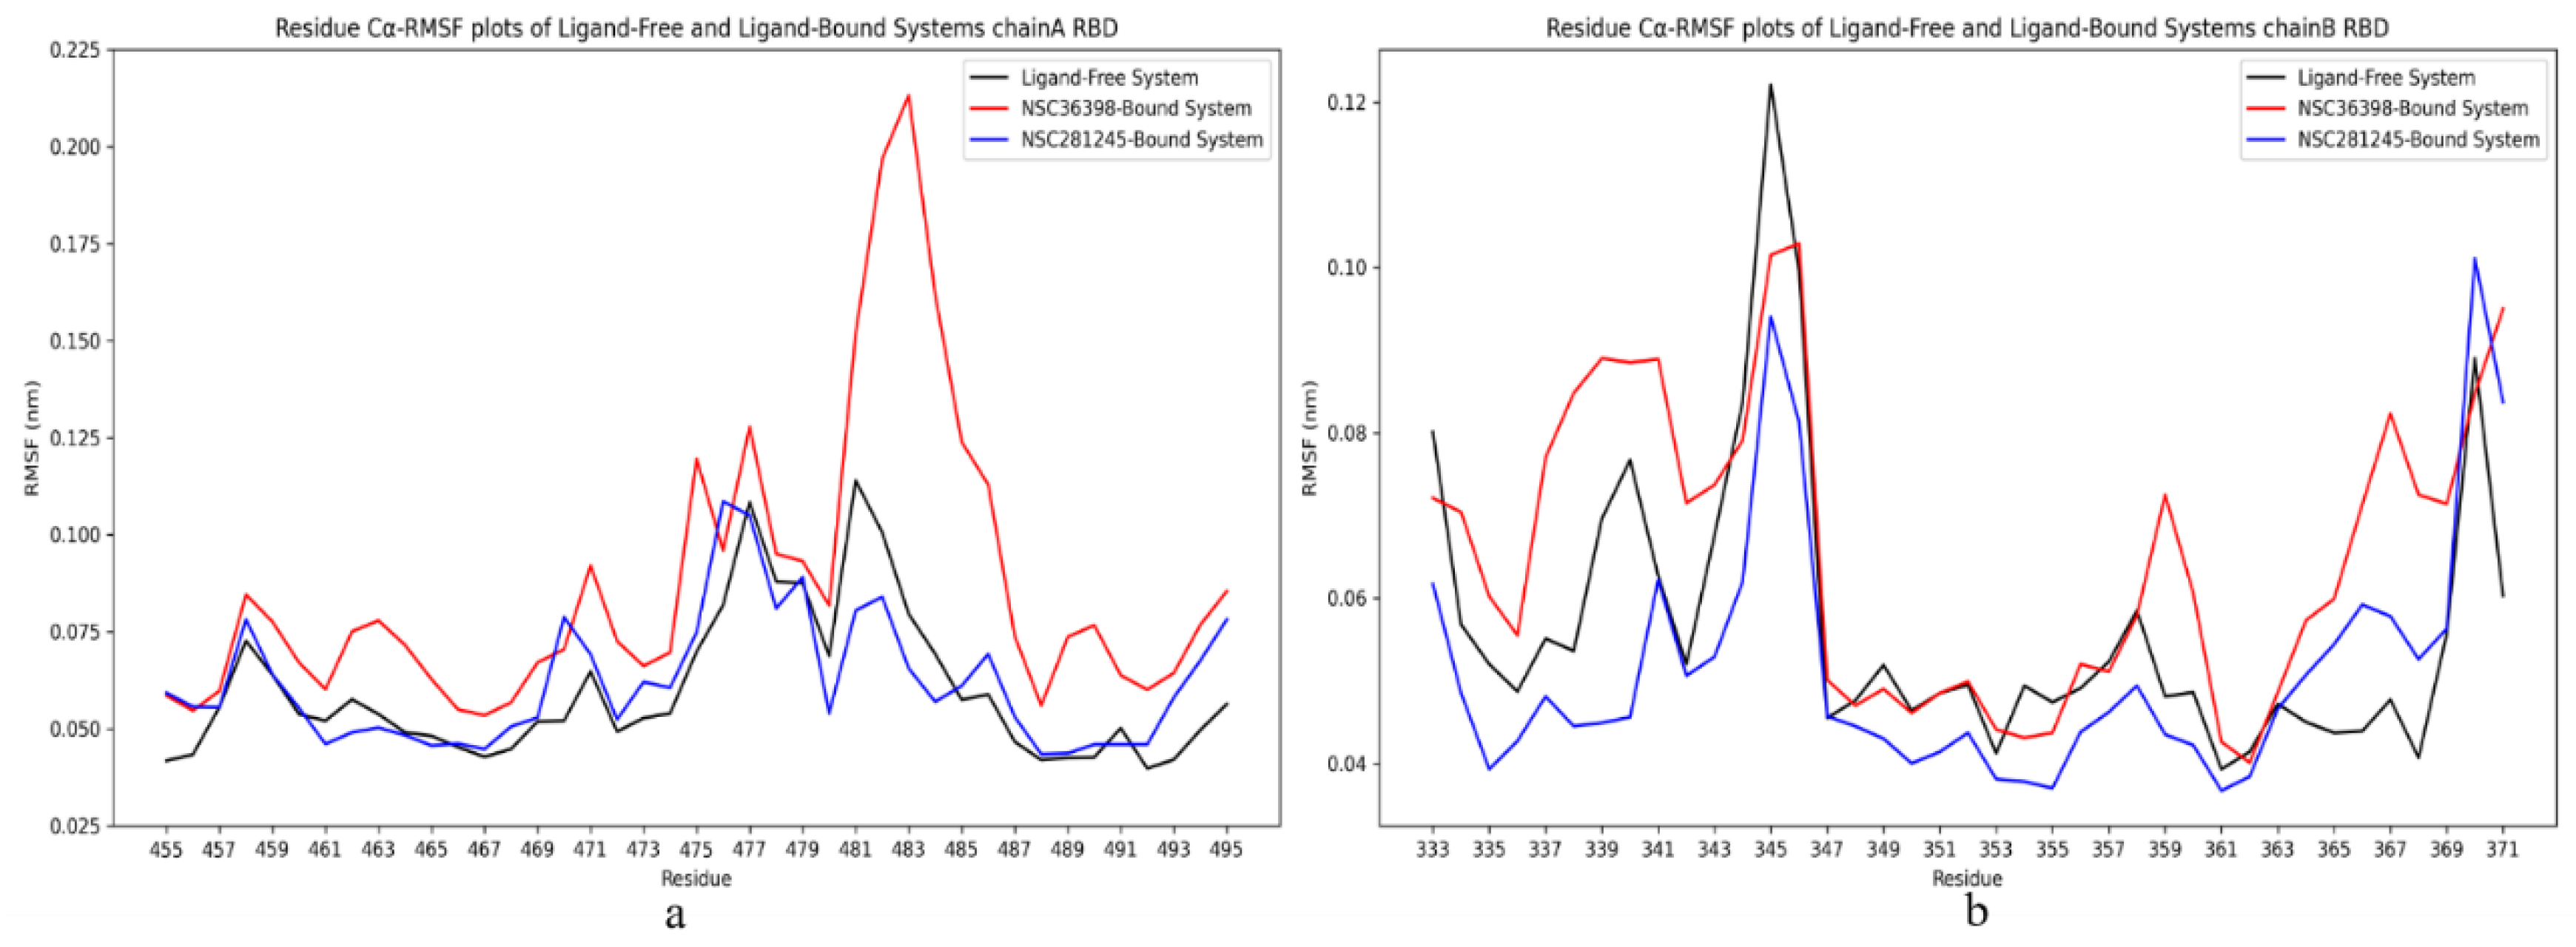
Figure 10.
Structural representation of the superimposed chain A RBD in the (a) ligand-free, (b) NSC36398–bound systems, and (c) NSC281245–bound system protein deviations with time. The structures were extracted from 0 ns (lime green), 150 ns (red) and 200 ns (beige).
Figure 10.
Structural representation of the superimposed chain A RBD in the (a) ligand-free, (b) NSC36398–bound systems, and (c) NSC281245–bound system protein deviations with time. The structures were extracted from 0 ns (lime green), 150 ns (red) and 200 ns (beige).
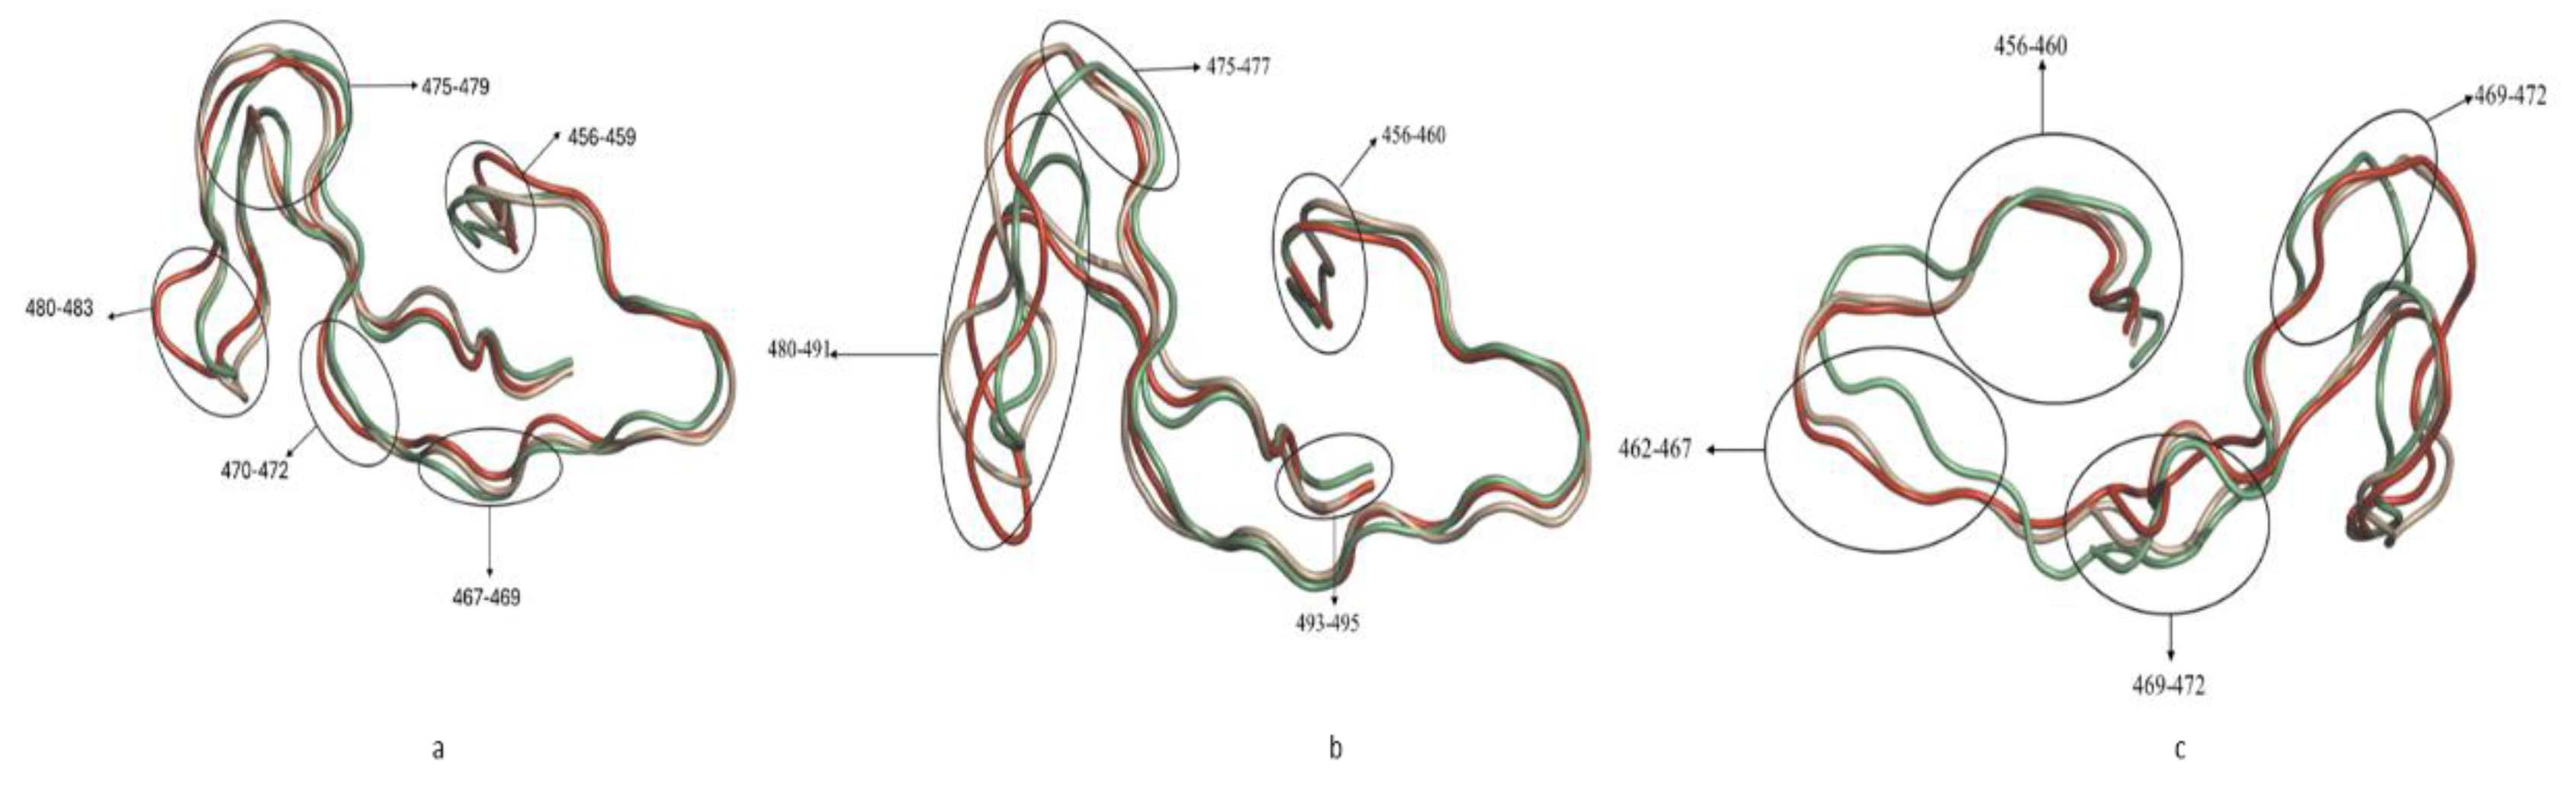
Figure 11.
Structural representation of the superimposed chain B RBD in the (a) ligand-free, (b) NSC36398–bound systems, and (c) NSC281245–bound system protein deviations with time. The structures were extracted from 0 ns (lime green), 150 ns (red) and 200 ns (beige).
Figure 11.
Structural representation of the superimposed chain B RBD in the (a) ligand-free, (b) NSC36398–bound systems, and (c) NSC281245–bound system protein deviations with time. The structures were extracted from 0 ns (lime green), 150 ns (red) and 200 ns (beige).
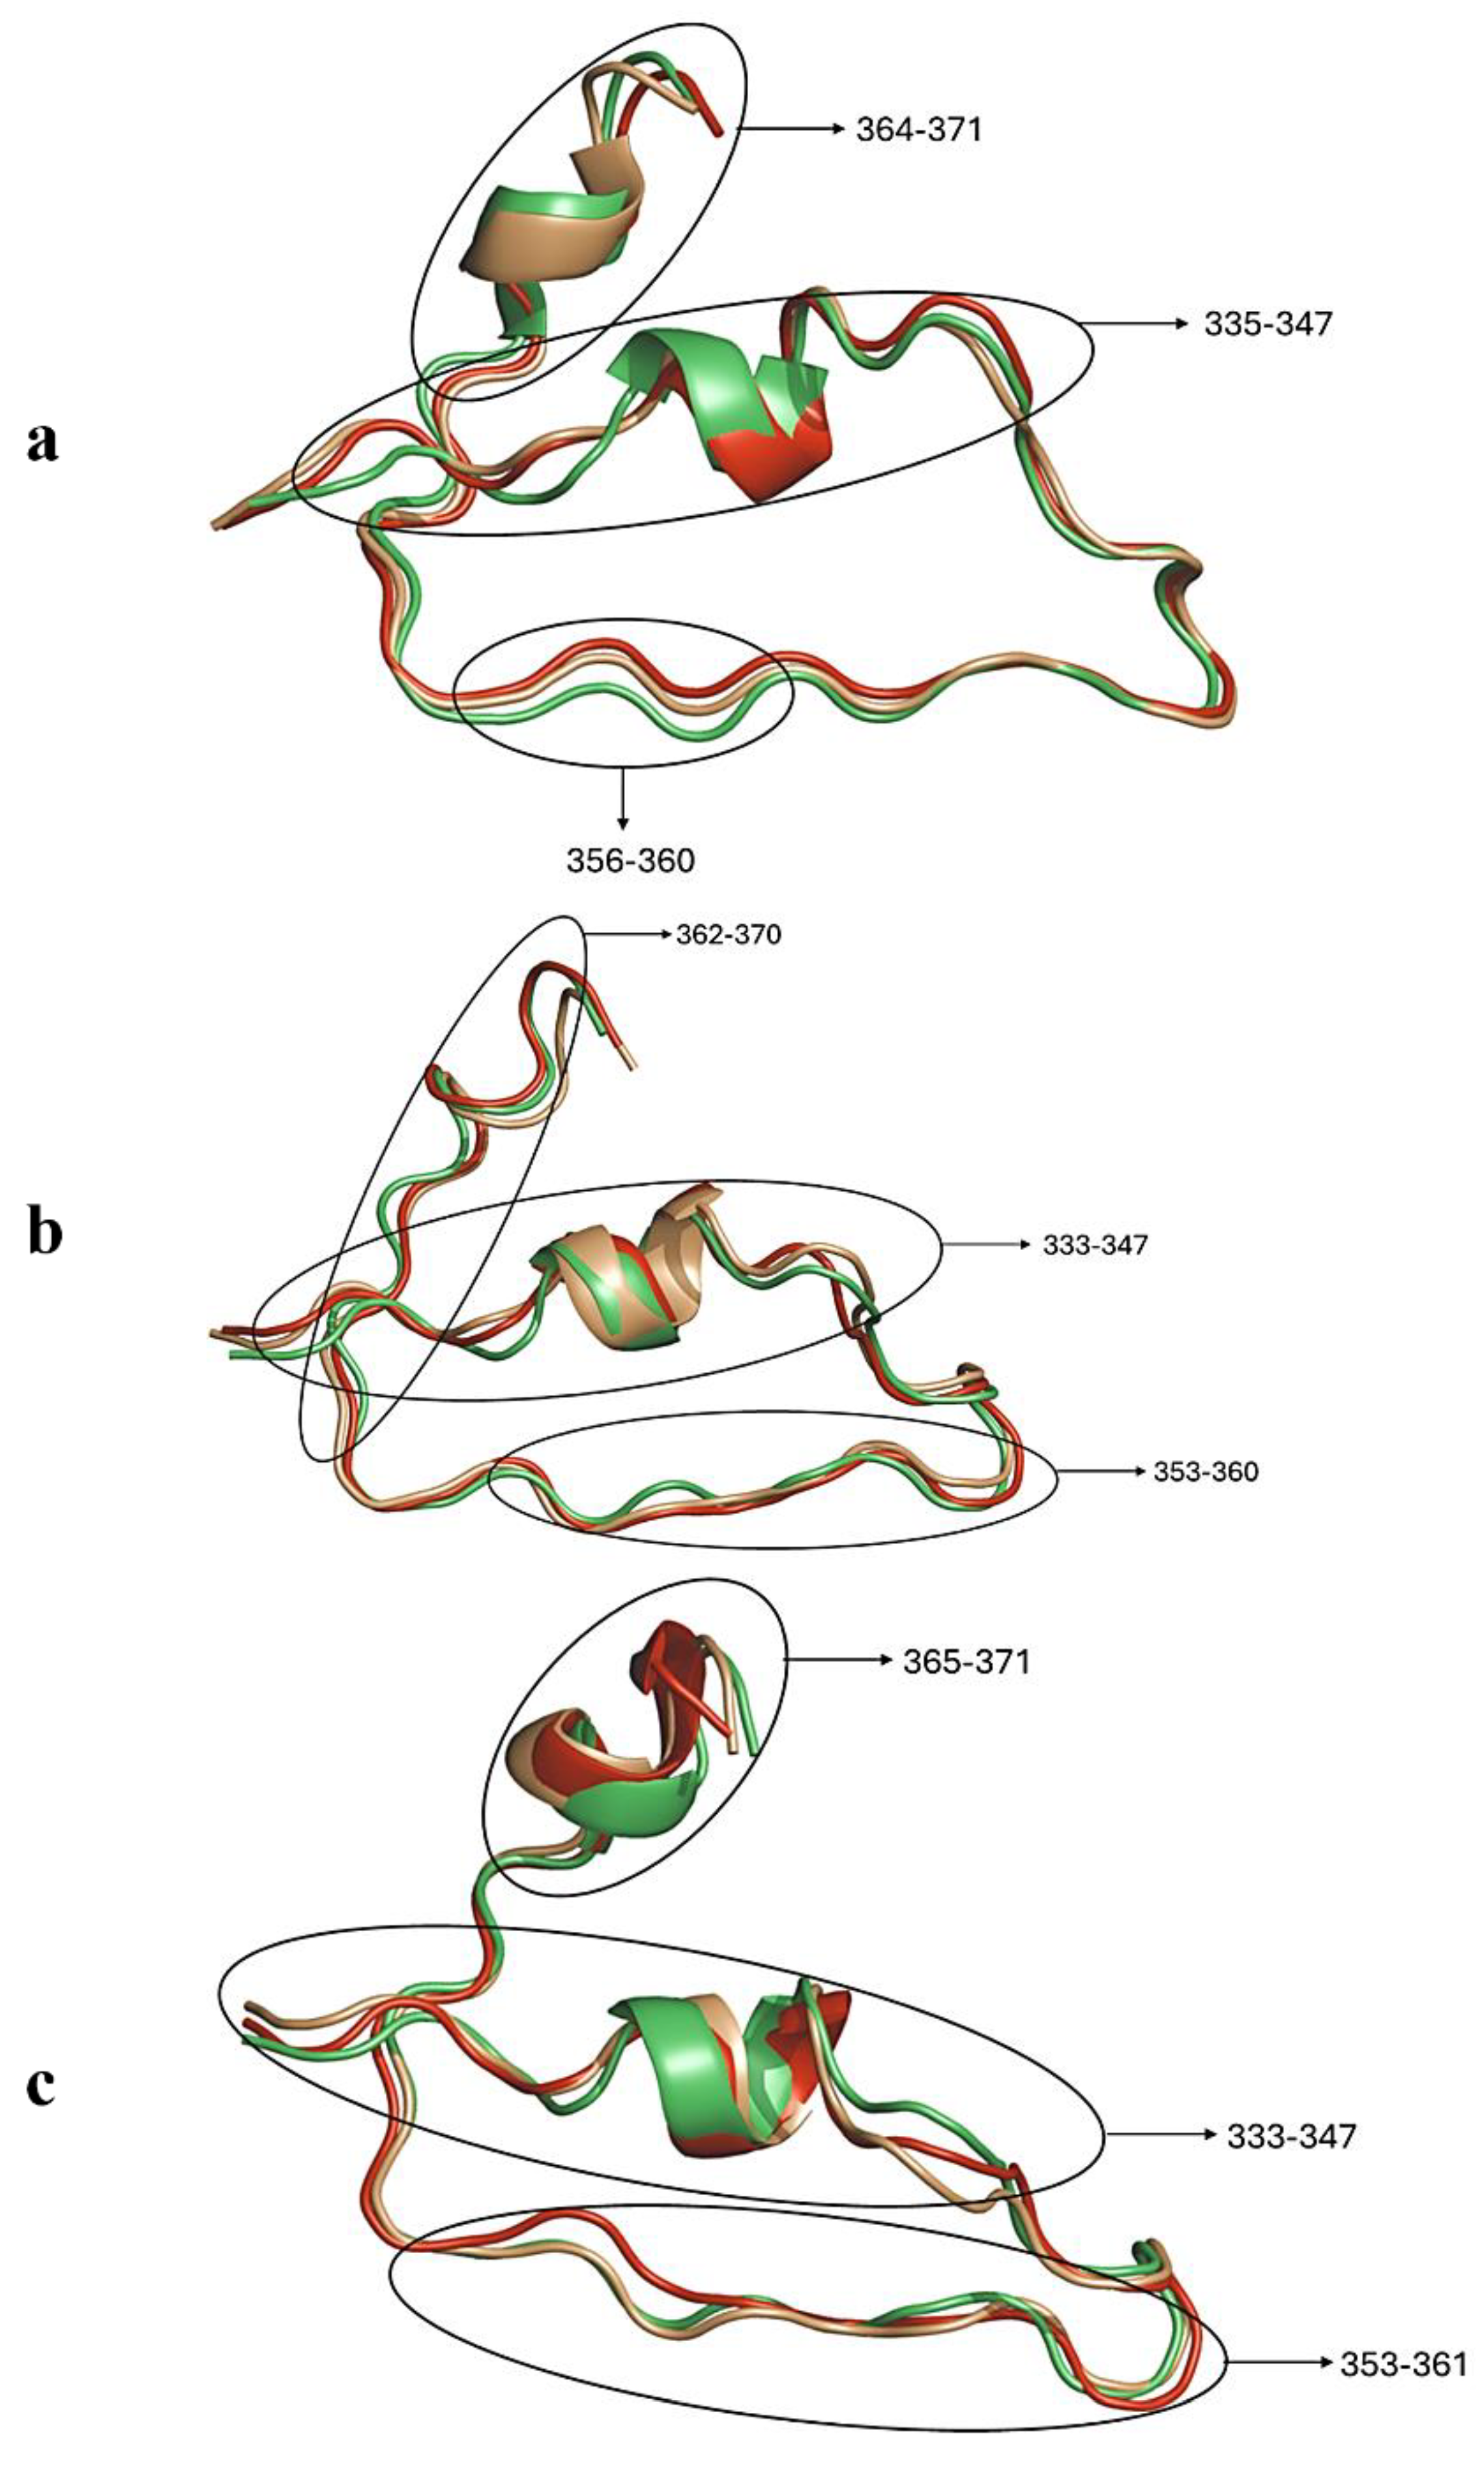
Figure 12.
Captured per-residue Cα-RMSF of the binding pocket of the ligand–free system and the NSC36398–bound system within 5 Å of the (a) NSC36398 small-molecule compound and (b) NSC281245 small-molecule compound.
Figure 12.
Captured per-residue Cα-RMSF of the binding pocket of the ligand–free system and the NSC36398–bound system within 5 Å of the (a) NSC36398 small-molecule compound and (b) NSC281245 small-molecule compound.
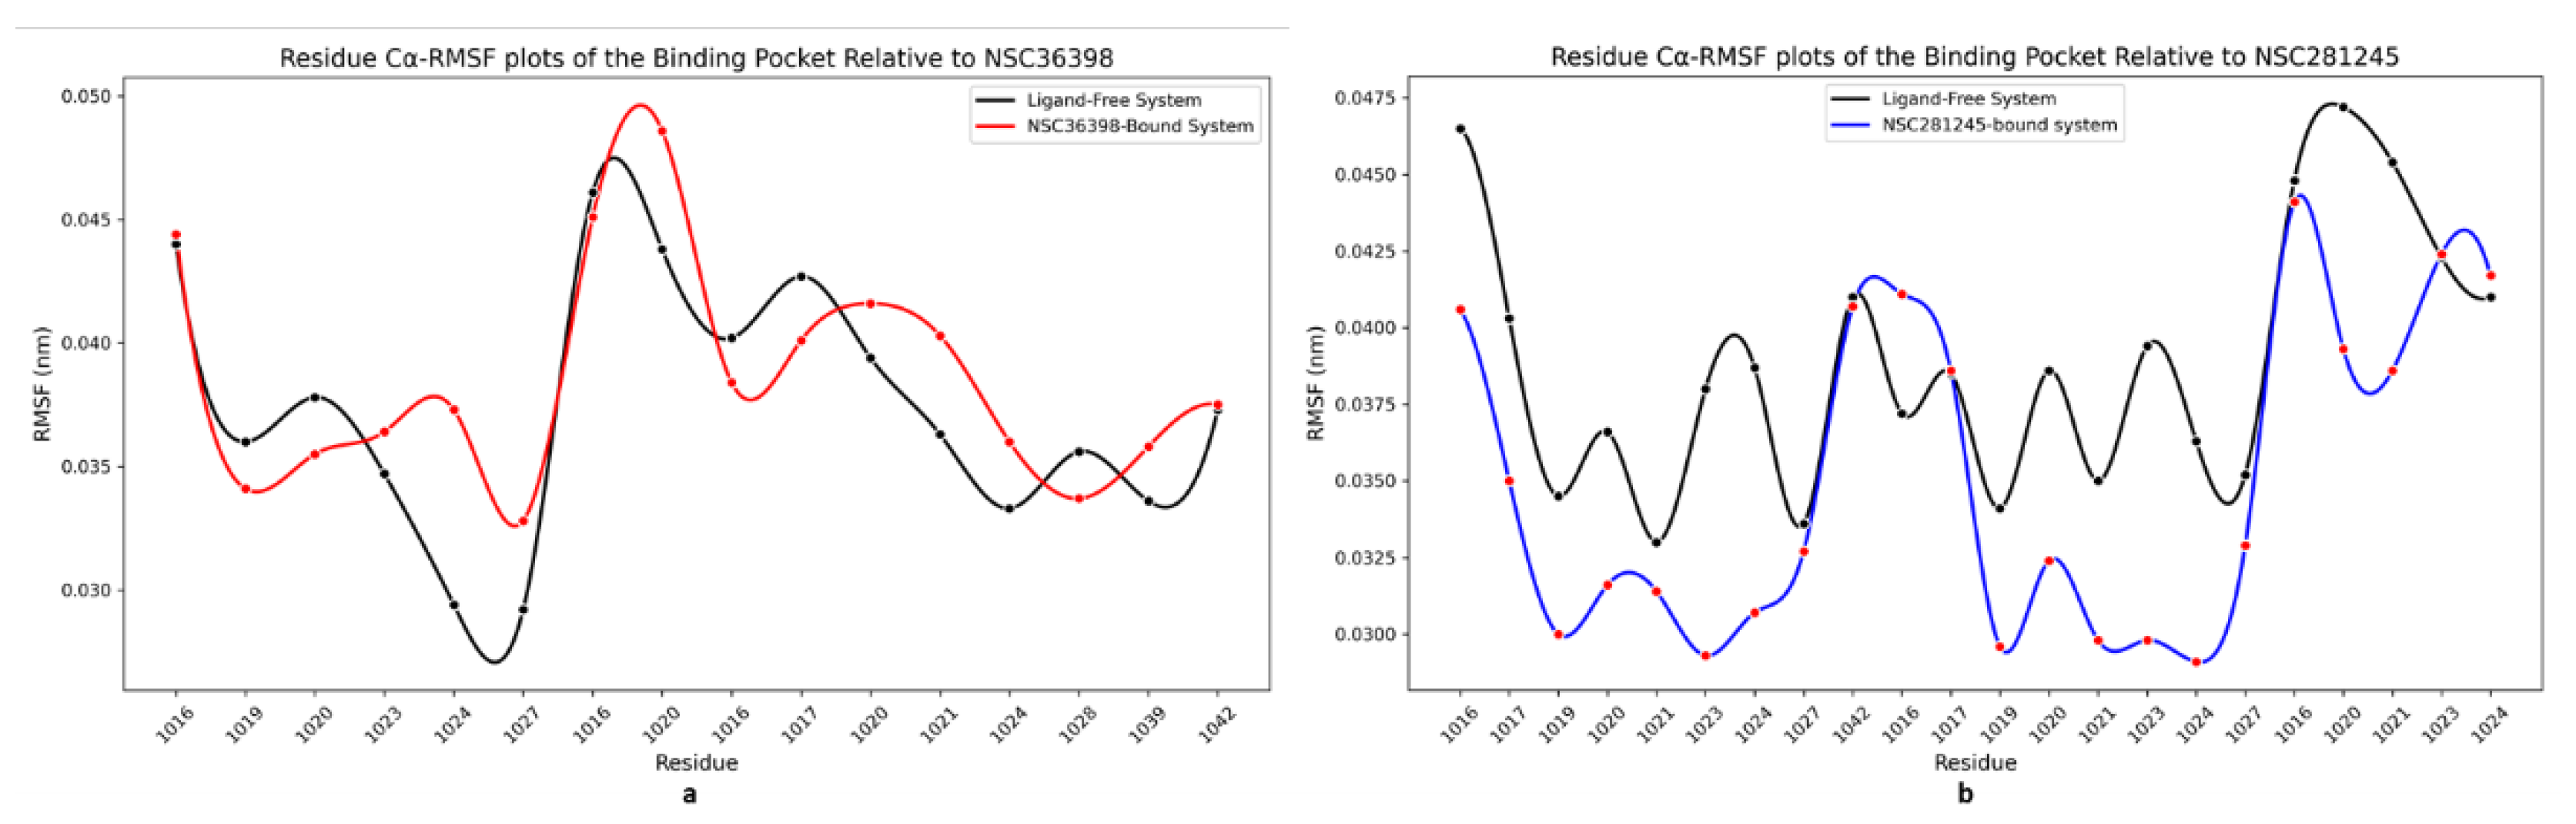
Figure 13.
Captured Rg of the HSPA8 SBD (amino acid residues 405 to 495) of the ligand–free, NSC36398–bound and NSC281245–bound systems relative to their initial structures.
Figure 13.
Captured Rg of the HSPA8 SBD (amino acid residues 405 to 495) of the ligand–free, NSC36398–bound and NSC281245–bound systems relative to their initial structures.
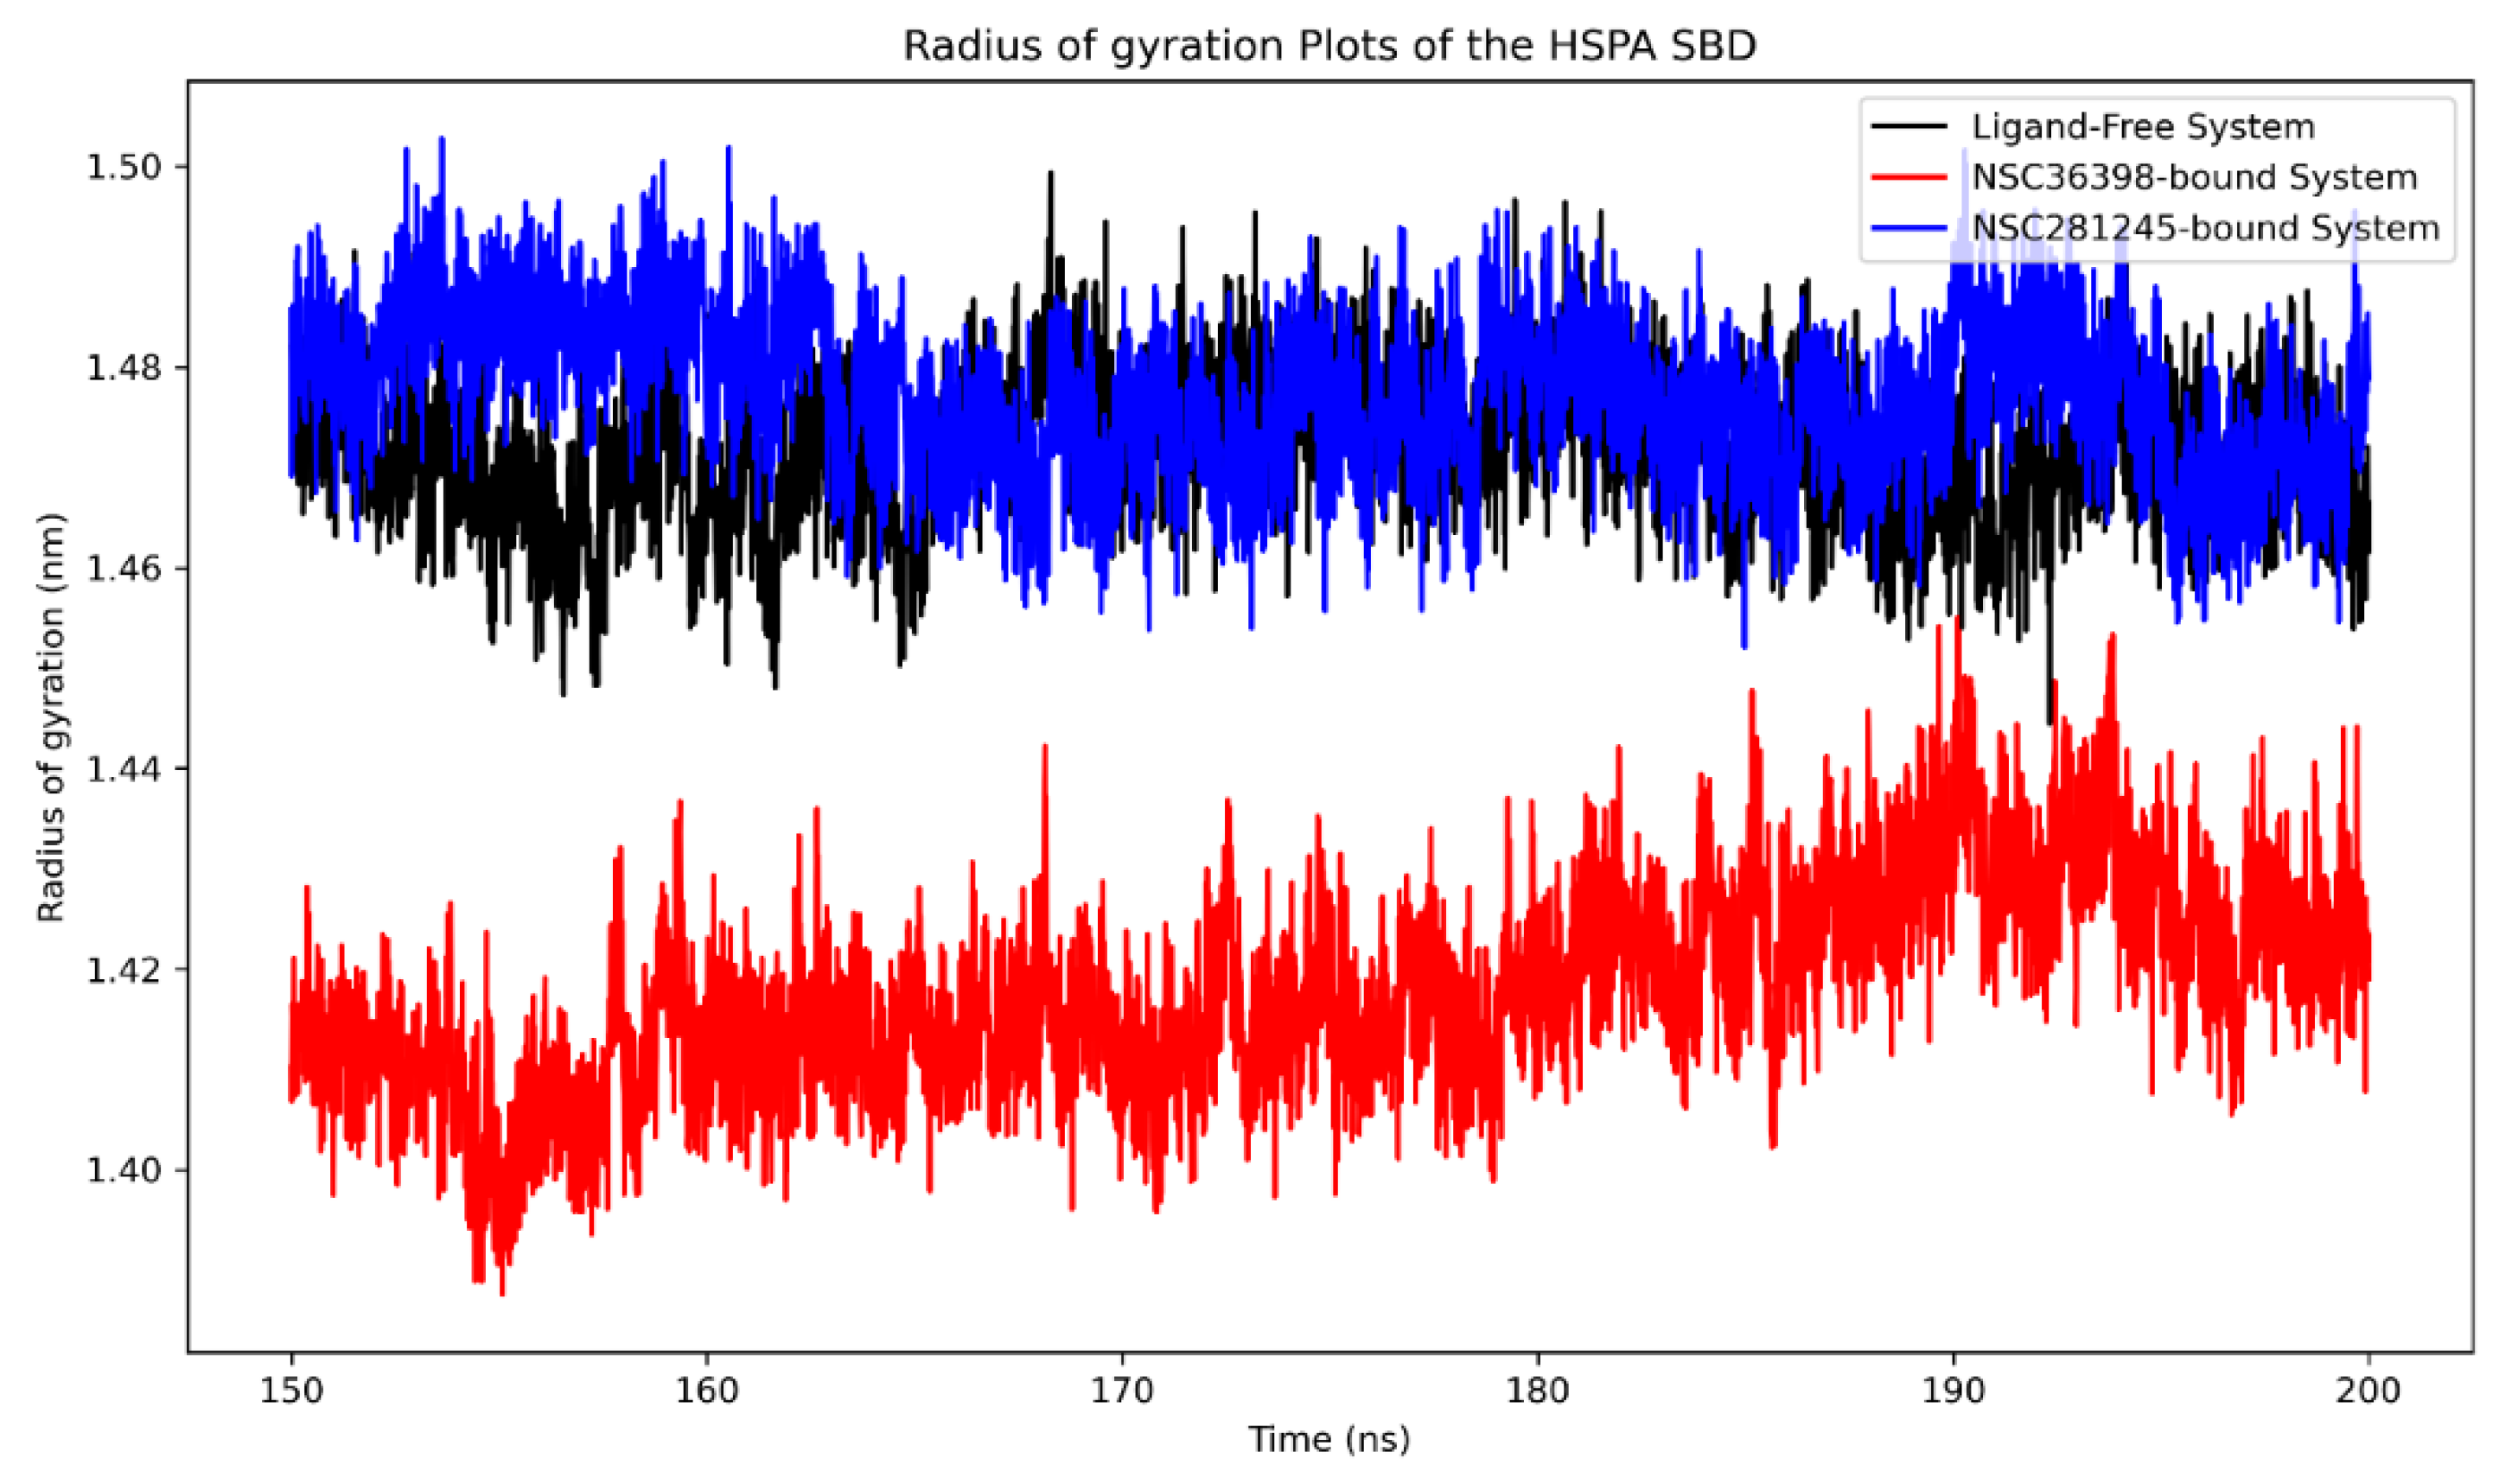
Figure 14.
Captured Rg of (a) spike chain A RBD (amino acid residues 455 to 495) and, (b) spike chain B RBD (amino acid residues 333 to 371) of the ligand–free, NSC36398–bound and NSC281245–bound systems relative to their initial structures.
Figure 14.
Captured Rg of (a) spike chain A RBD (amino acid residues 455 to 495) and, (b) spike chain B RBD (amino acid residues 333 to 371) of the ligand–free, NSC36398–bound and NSC281245–bound systems relative to their initial structures.
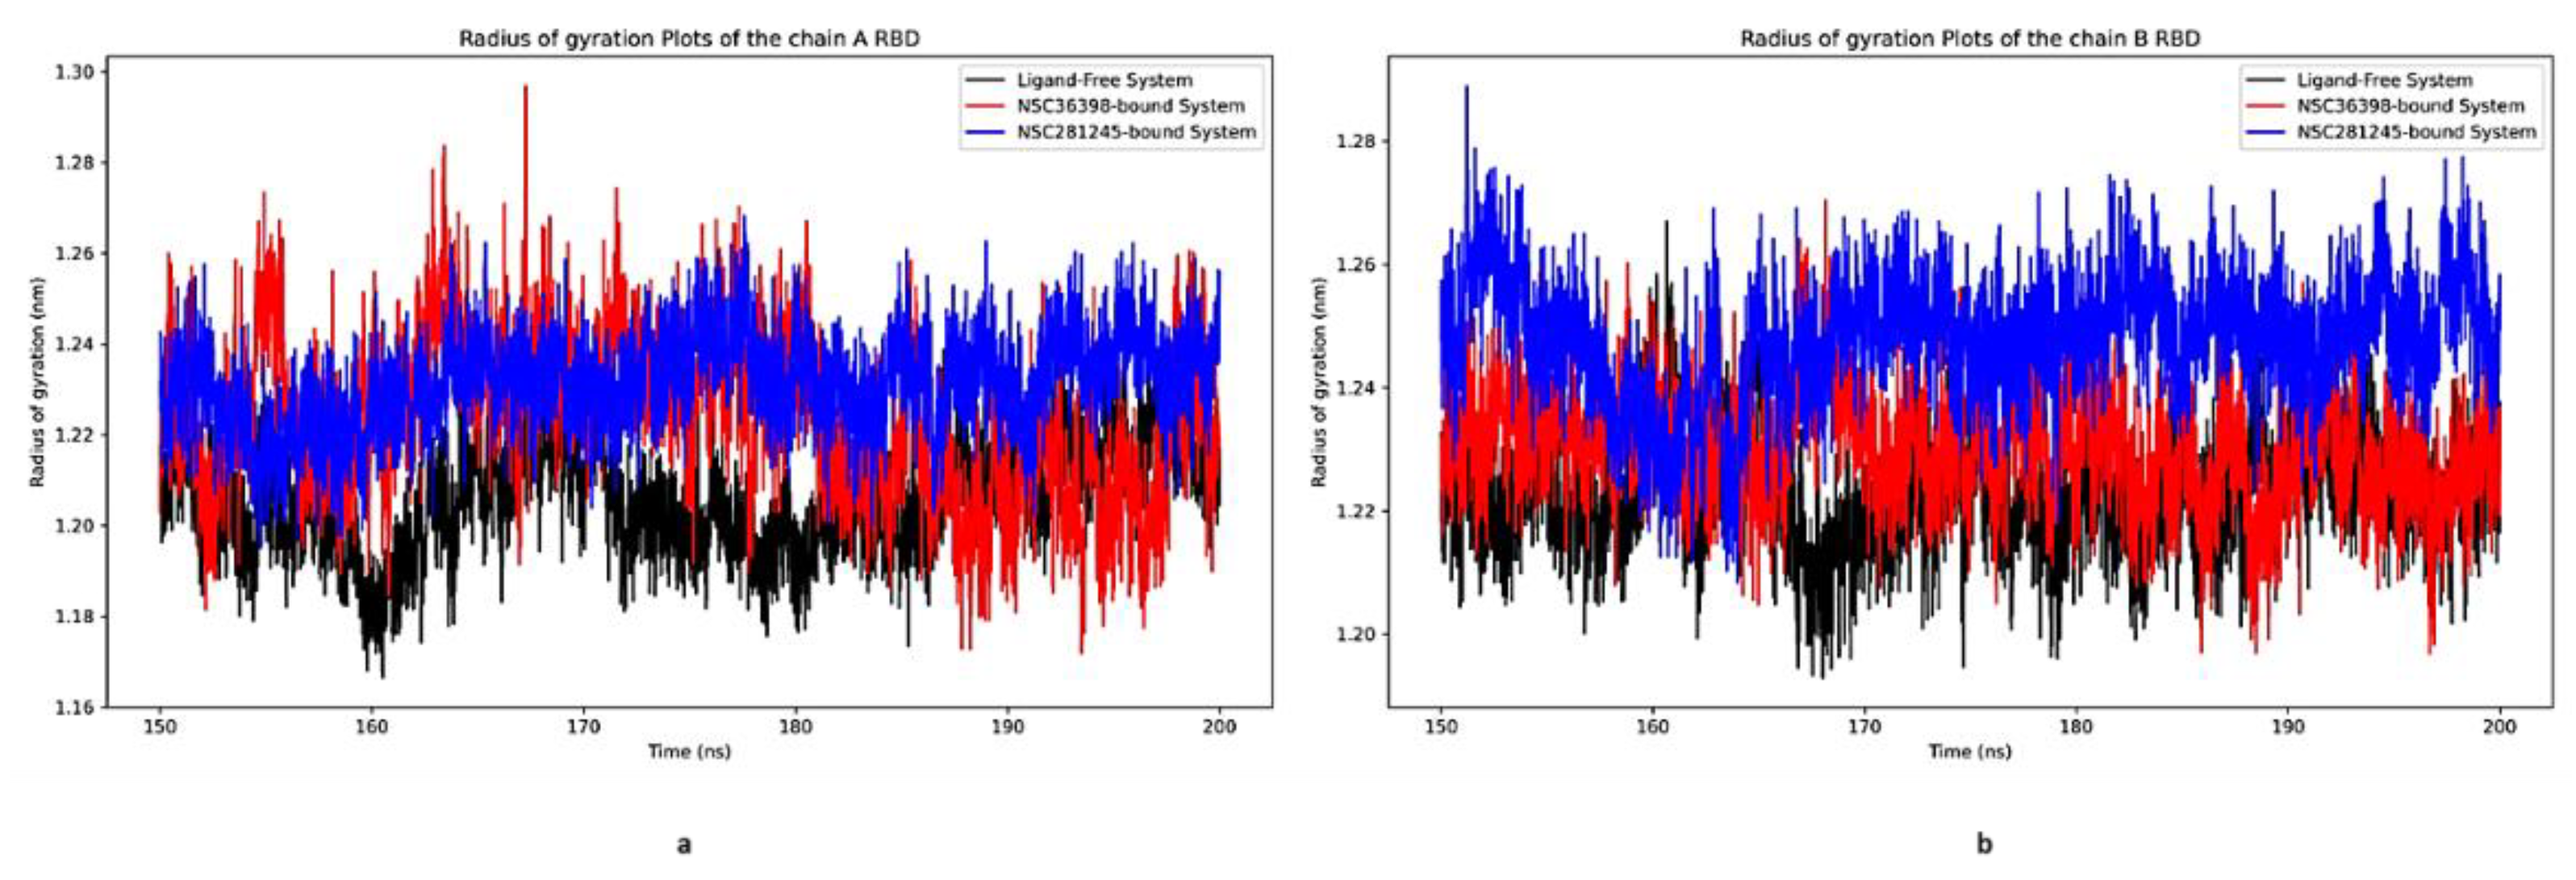
Figure 15.
Captured Rg of the binding pocket of the ligand–free system and the ligand–bound systems within 5 Å of (a) NSC36398 small-molecule compound, (b) NSC281245 small-molecule compound.
Figure 15.
Captured Rg of the binding pocket of the ligand–free system and the ligand–bound systems within 5 Å of (a) NSC36398 small-molecule compound, (b) NSC281245 small-molecule compound.
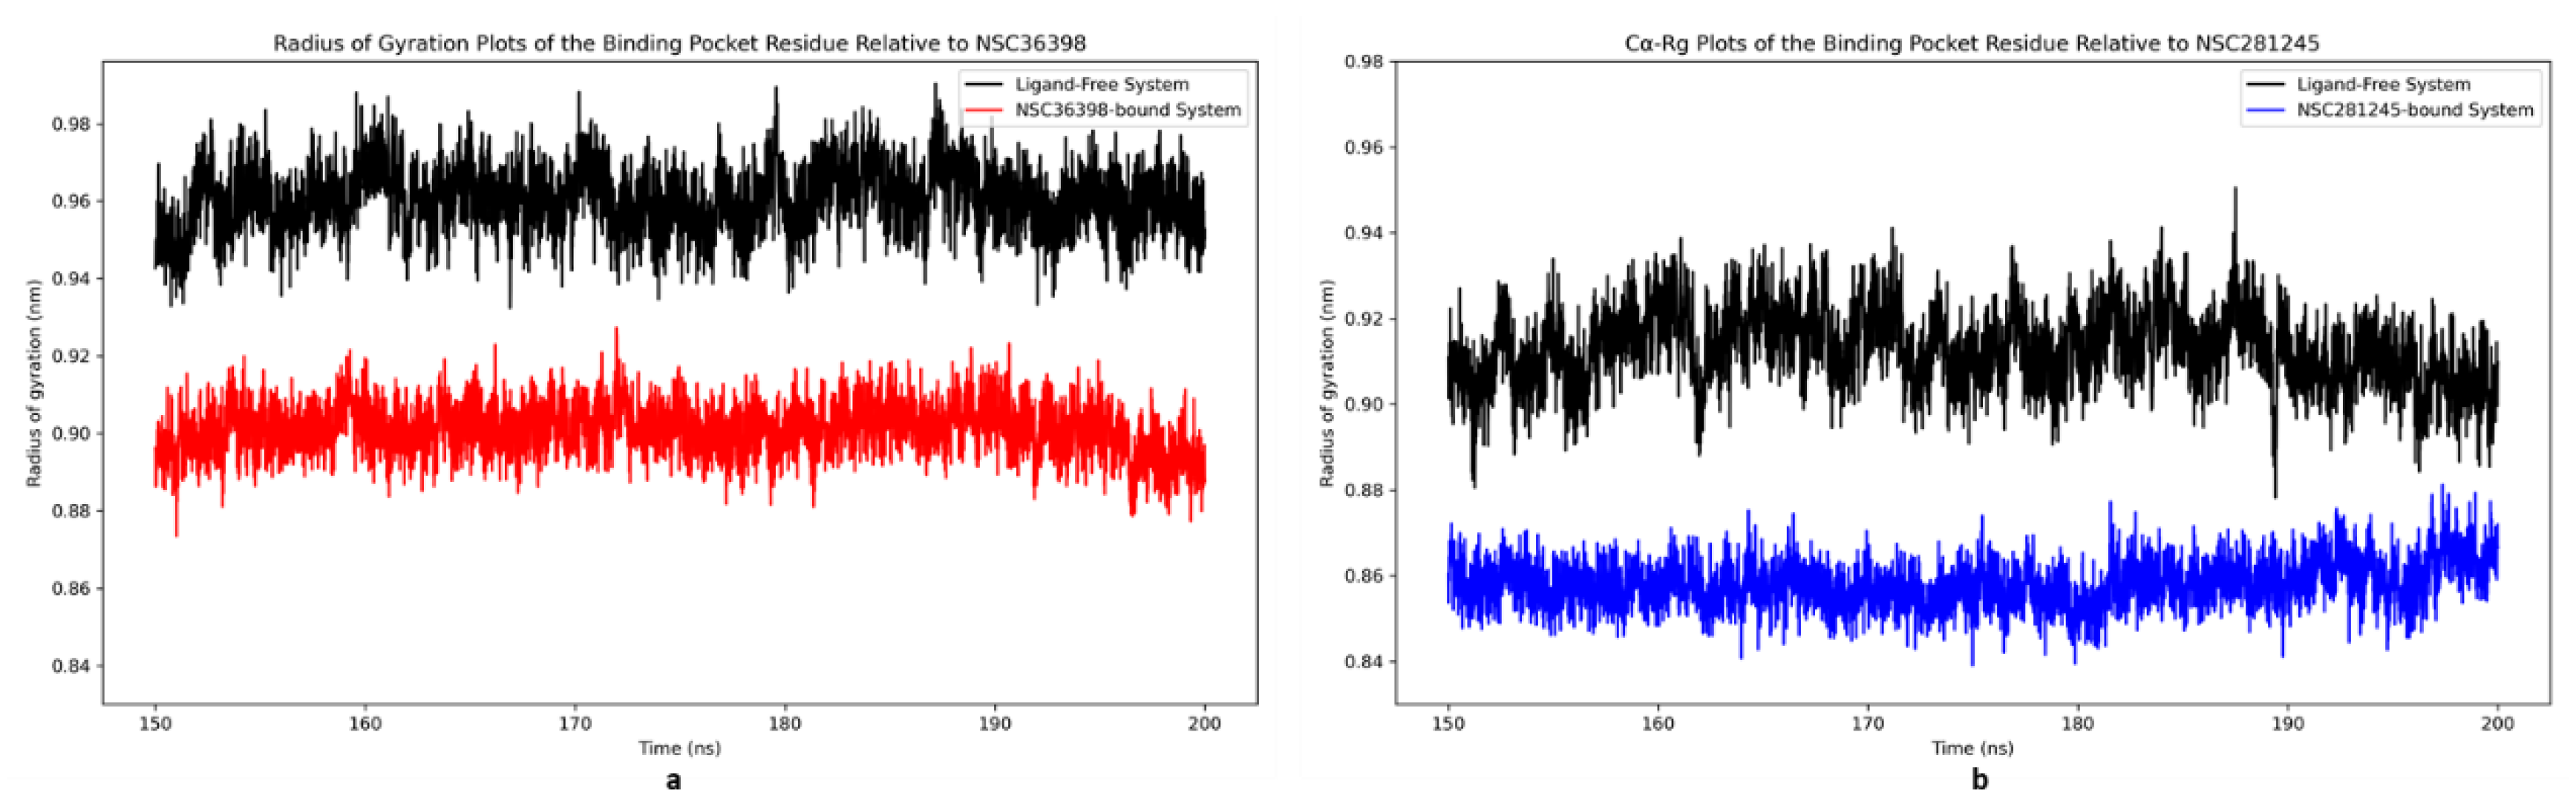
Figure 16.
Pairwise PCA plots (PC1–PC2) of the human HSPA8 SBD in (a) ligand–free system, (b) NSC36398–bound system, and (c) NSC281245–bound system. Each marker represents a conformation, and the markers are coloured according to the sampling time, i.e., purple at 150 ns and yellow at 200 ns.
Figure 16.
Pairwise PCA plots (PC1–PC2) of the human HSPA8 SBD in (a) ligand–free system, (b) NSC36398–bound system, and (c) NSC281245–bound system. Each marker represents a conformation, and the markers are coloured according to the sampling time, i.e., purple at 150 ns and yellow at 200 ns.
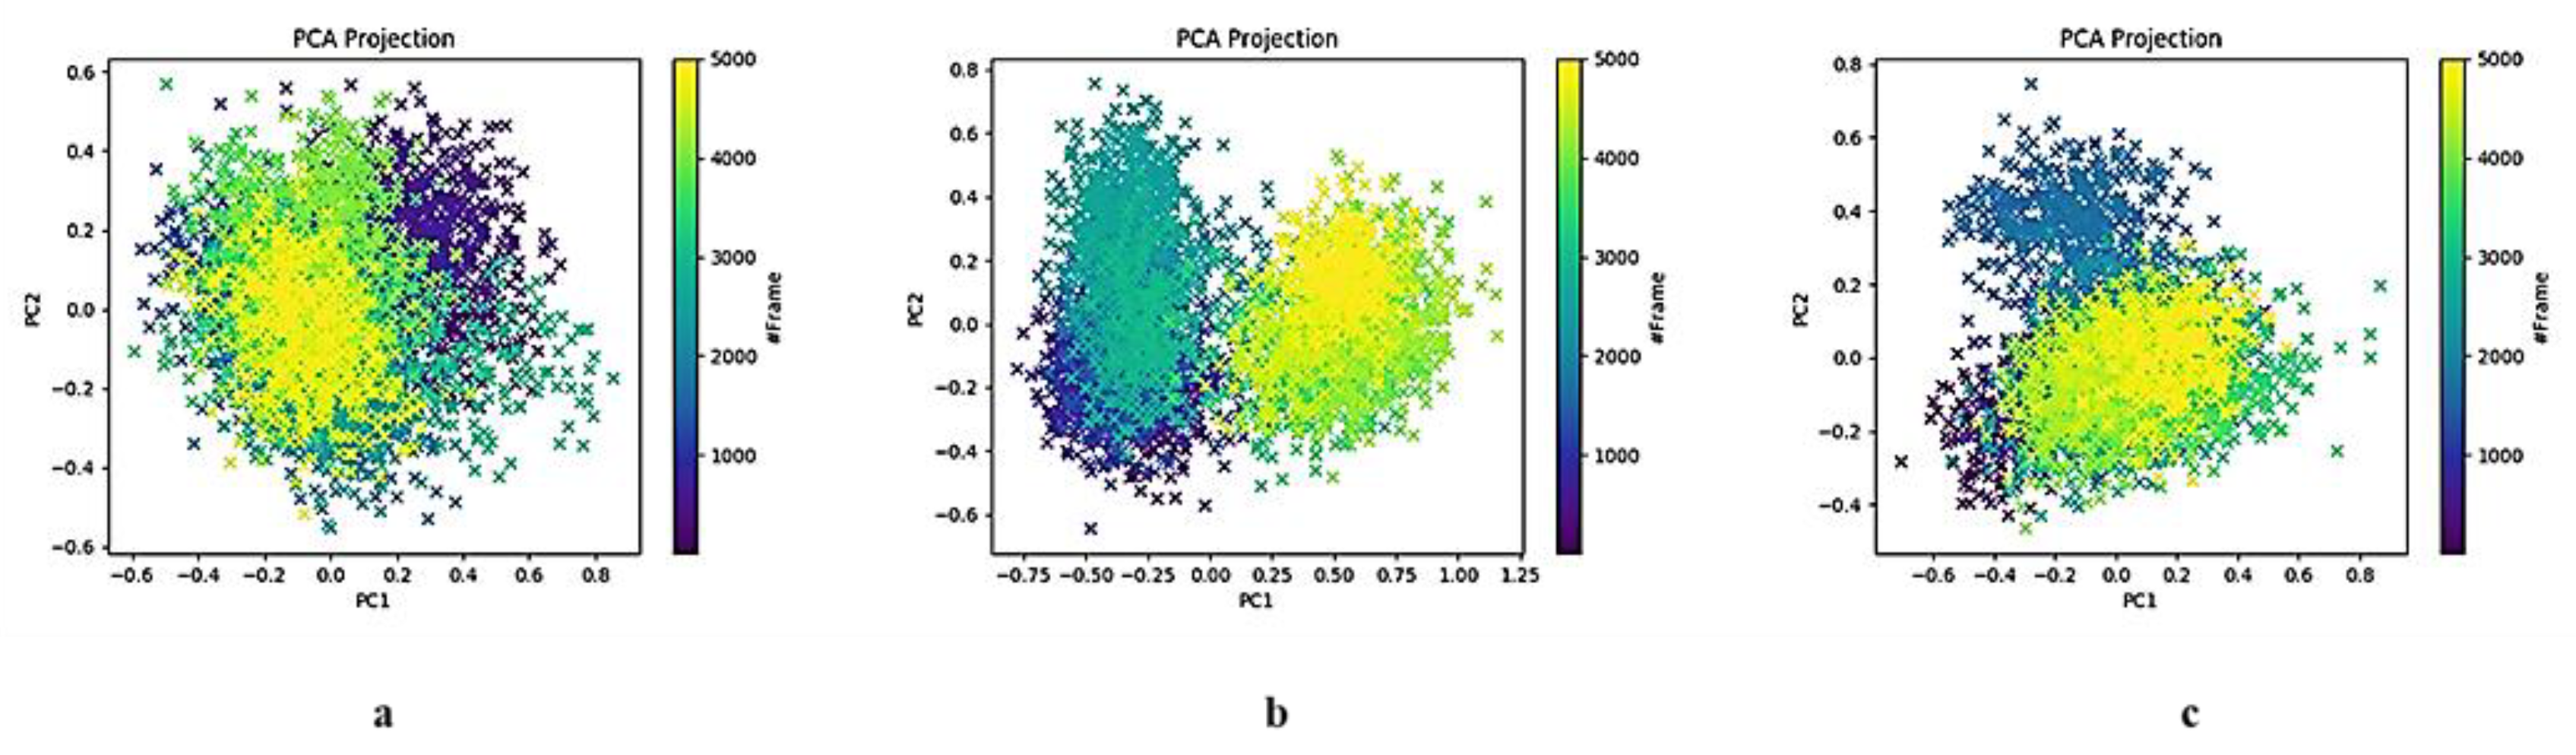
Figure 17.
Pairwise PCA plots (PC1–PC2) of the SARS-CoV-2 spike protein chain A RBD in (a) ligand–free system, (b) NSC36398–bound system, and (c) NSC281245–bound system.
Figure 17.
Pairwise PCA plots (PC1–PC2) of the SARS-CoV-2 spike protein chain A RBD in (a) ligand–free system, (b) NSC36398–bound system, and (c) NSC281245–bound system.
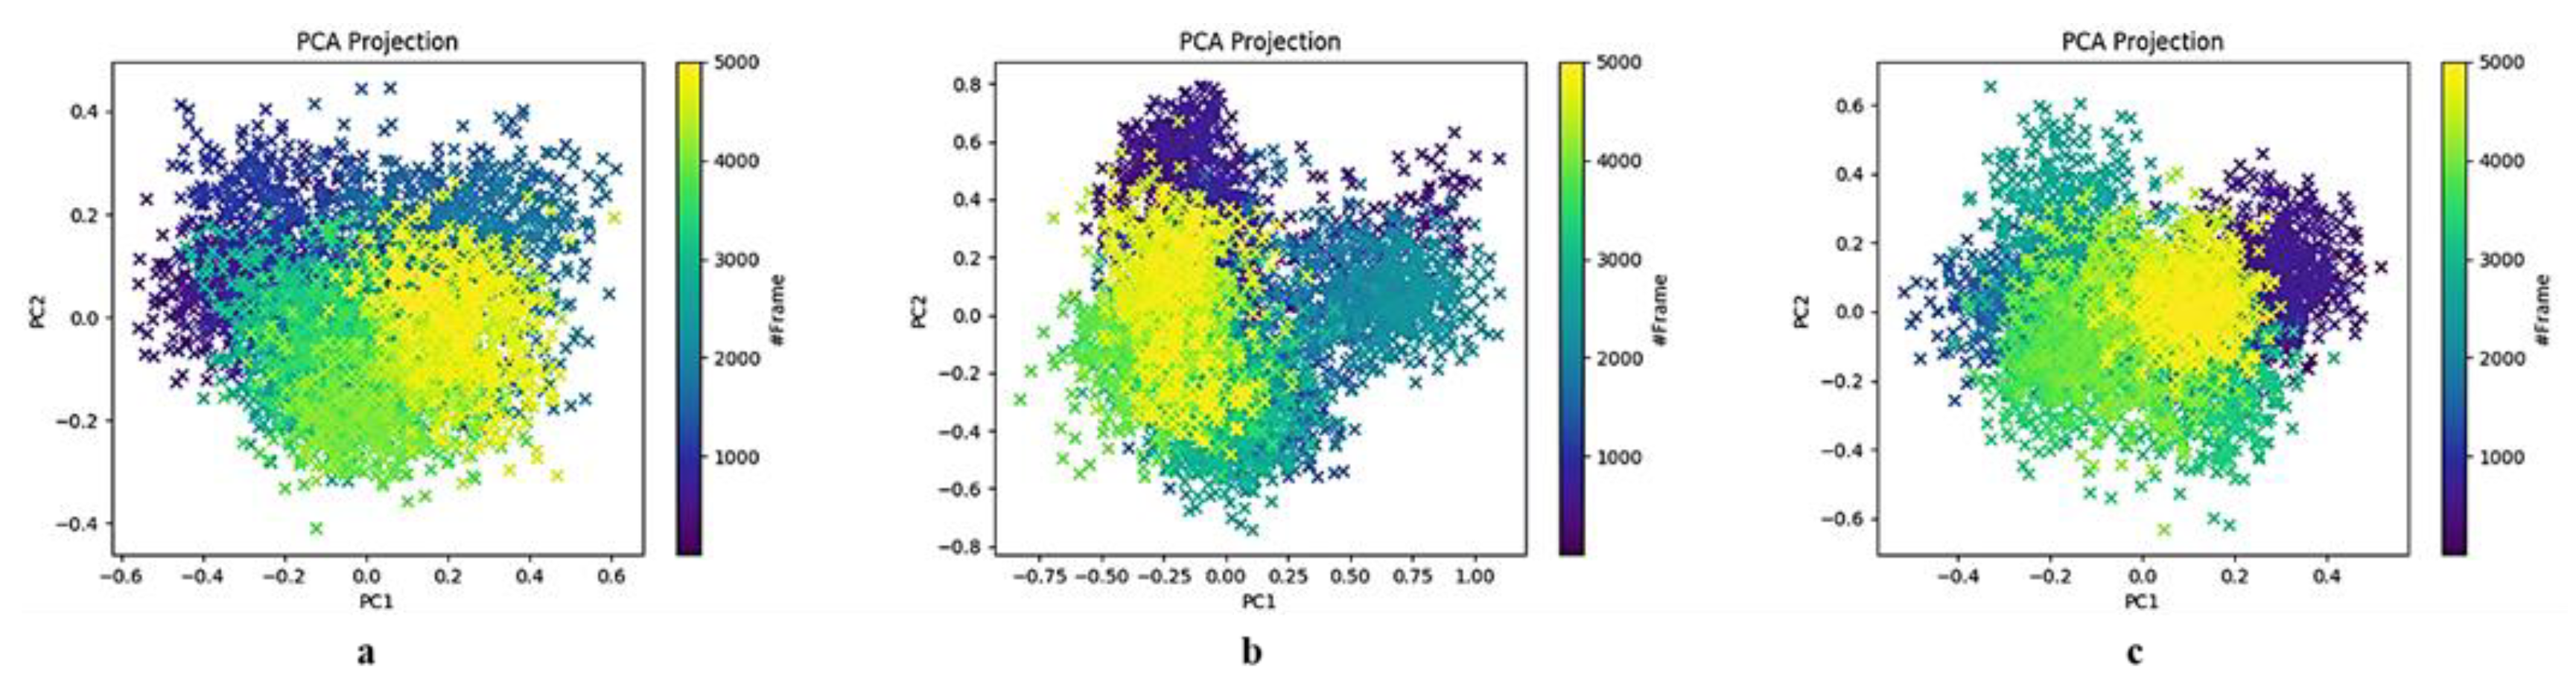
Figure 18.
Pairwise PCA plots (PC1–PC2) of the SARS-CoV-2 spike protein chain A RBD in (a) ligand–free system, (b) NSC36398–bound system, and (c) NSC281245–bound system.
Figure 18.
Pairwise PCA plots (PC1–PC2) of the SARS-CoV-2 spike protein chain A RBD in (a) ligand–free system, (b) NSC36398–bound system, and (c) NSC281245–bound system.
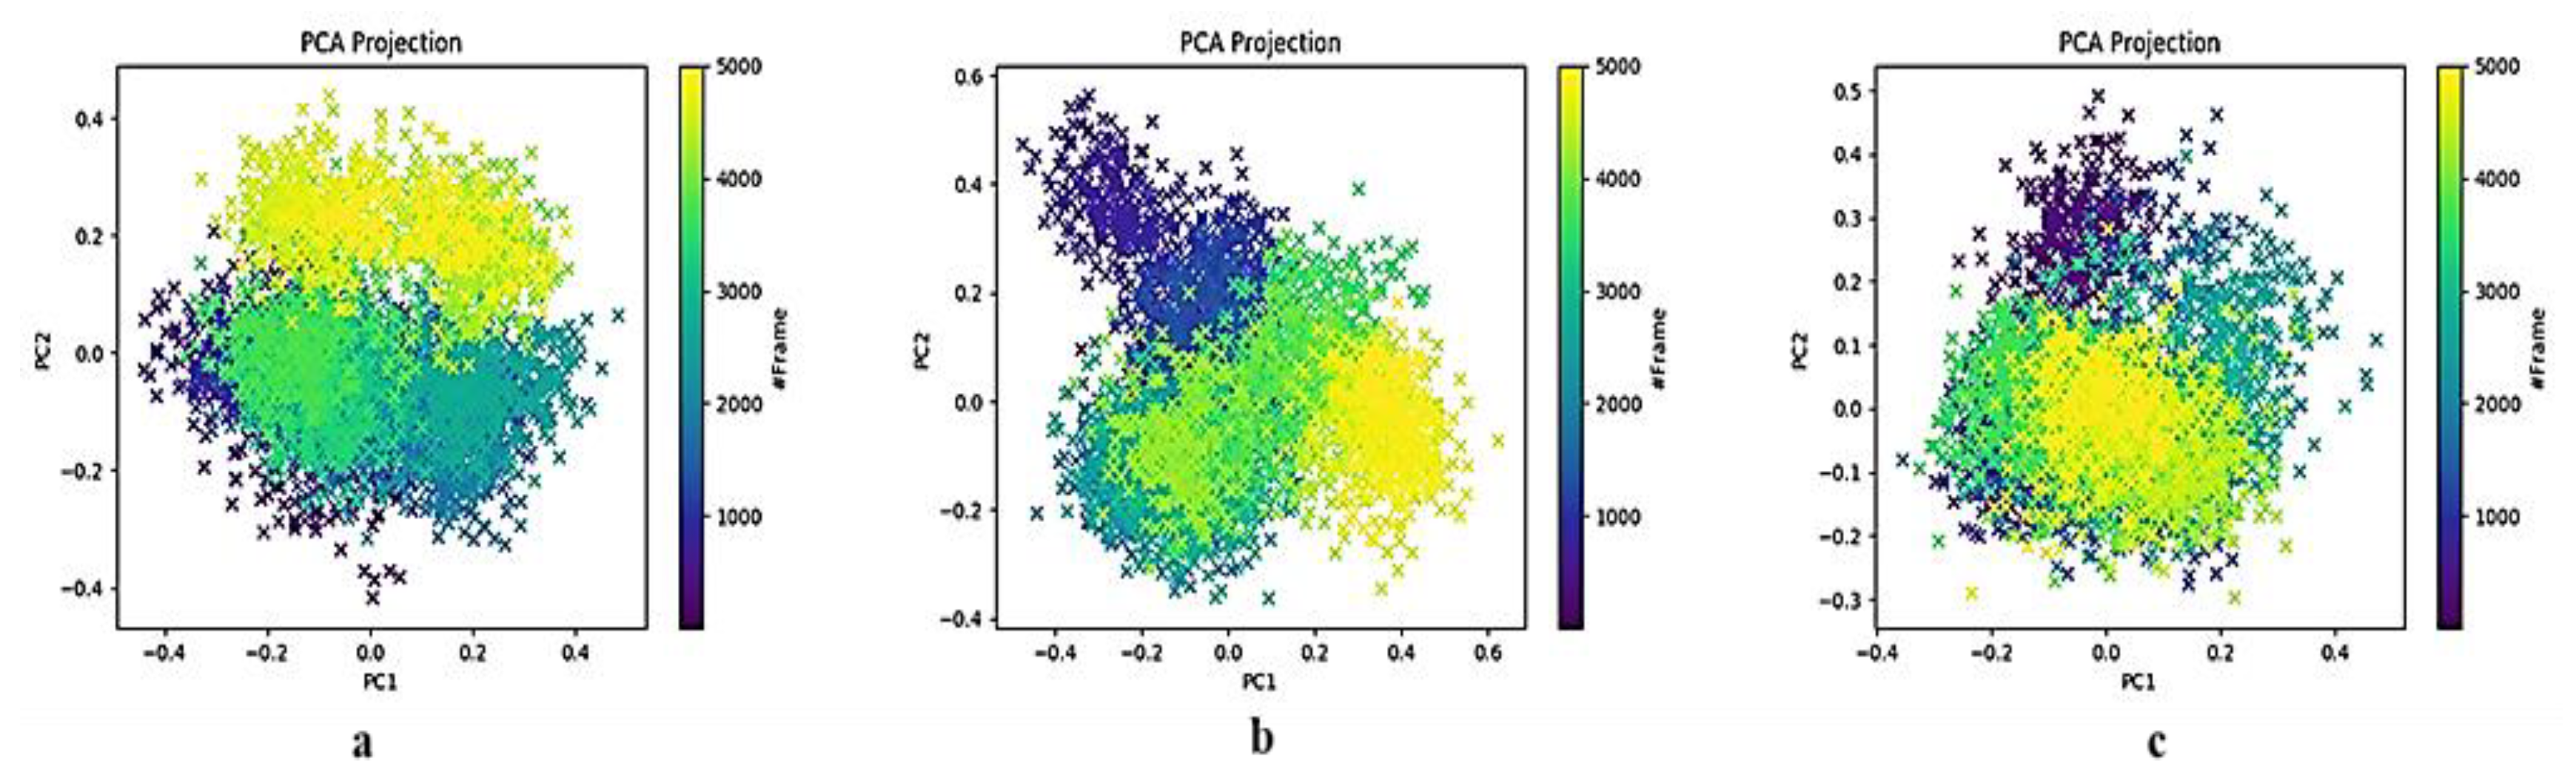
Figure 19.
Pairwise PCA plots (PC1–PC2) of the binding pocket located at the S2 subunit of the viral protein relative to NSC36398 in (a) ligand–free system, (b) NSC36398–bound system.
Figure 19.
Pairwise PCA plots (PC1–PC2) of the binding pocket located at the S2 subunit of the viral protein relative to NSC36398 in (a) ligand–free system, (b) NSC36398–bound system.
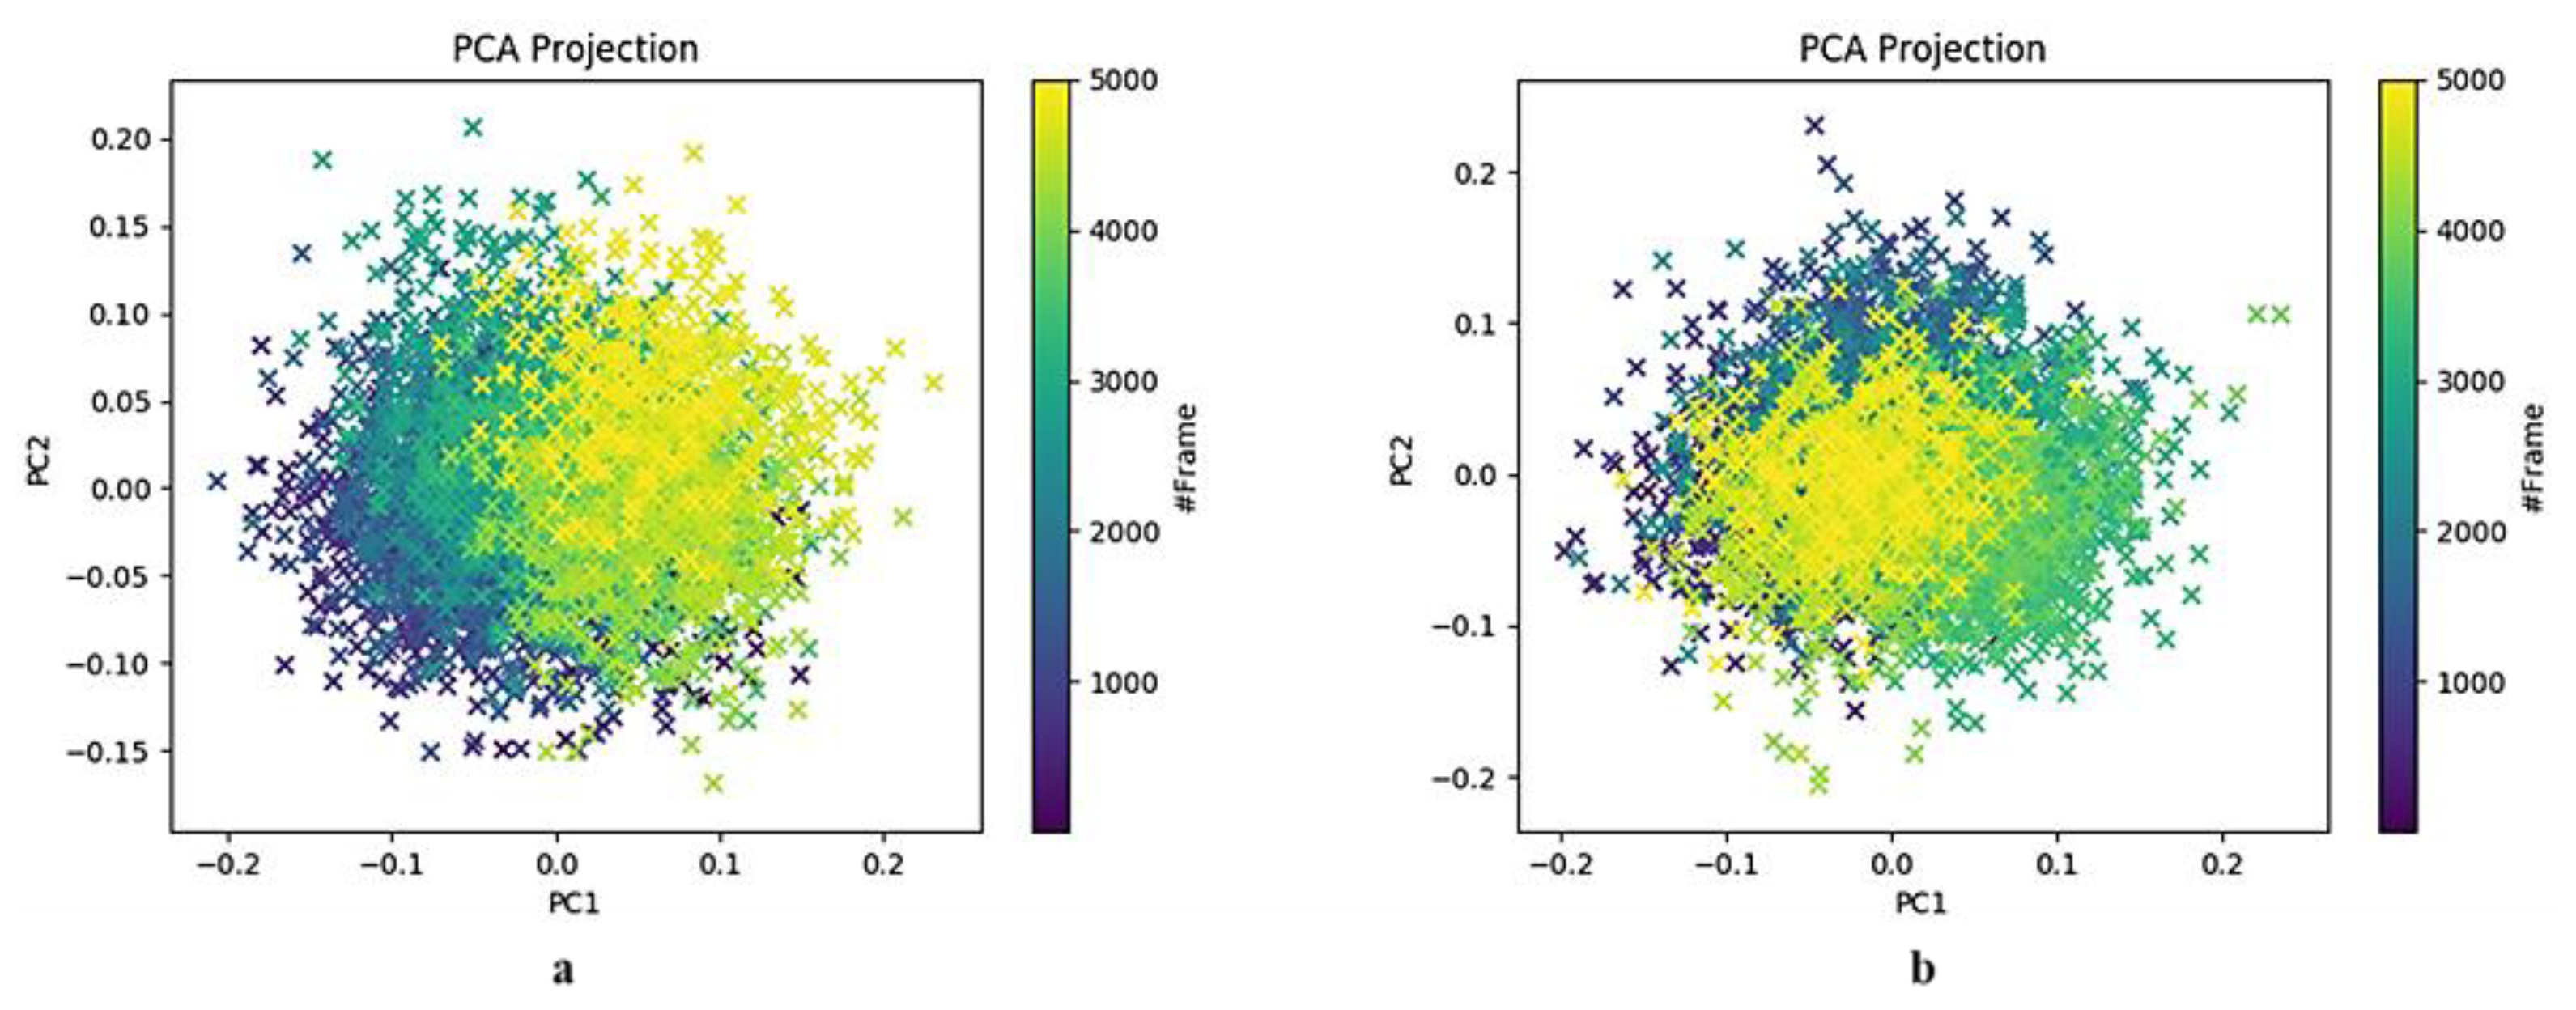
Figure 20.
Pairwise PCA plots (PC1–PC2) of the binding pocket located at the S2 subunit of the viral protein relative to NSC281245 in (a) the ligand–free system and (b) the NSC281245–bound system.
Figure 20.
Pairwise PCA plots (PC1–PC2) of the binding pocket located at the S2 subunit of the viral protein relative to NSC281245 in (a) the ligand–free system and (b) the NSC281245–bound system.
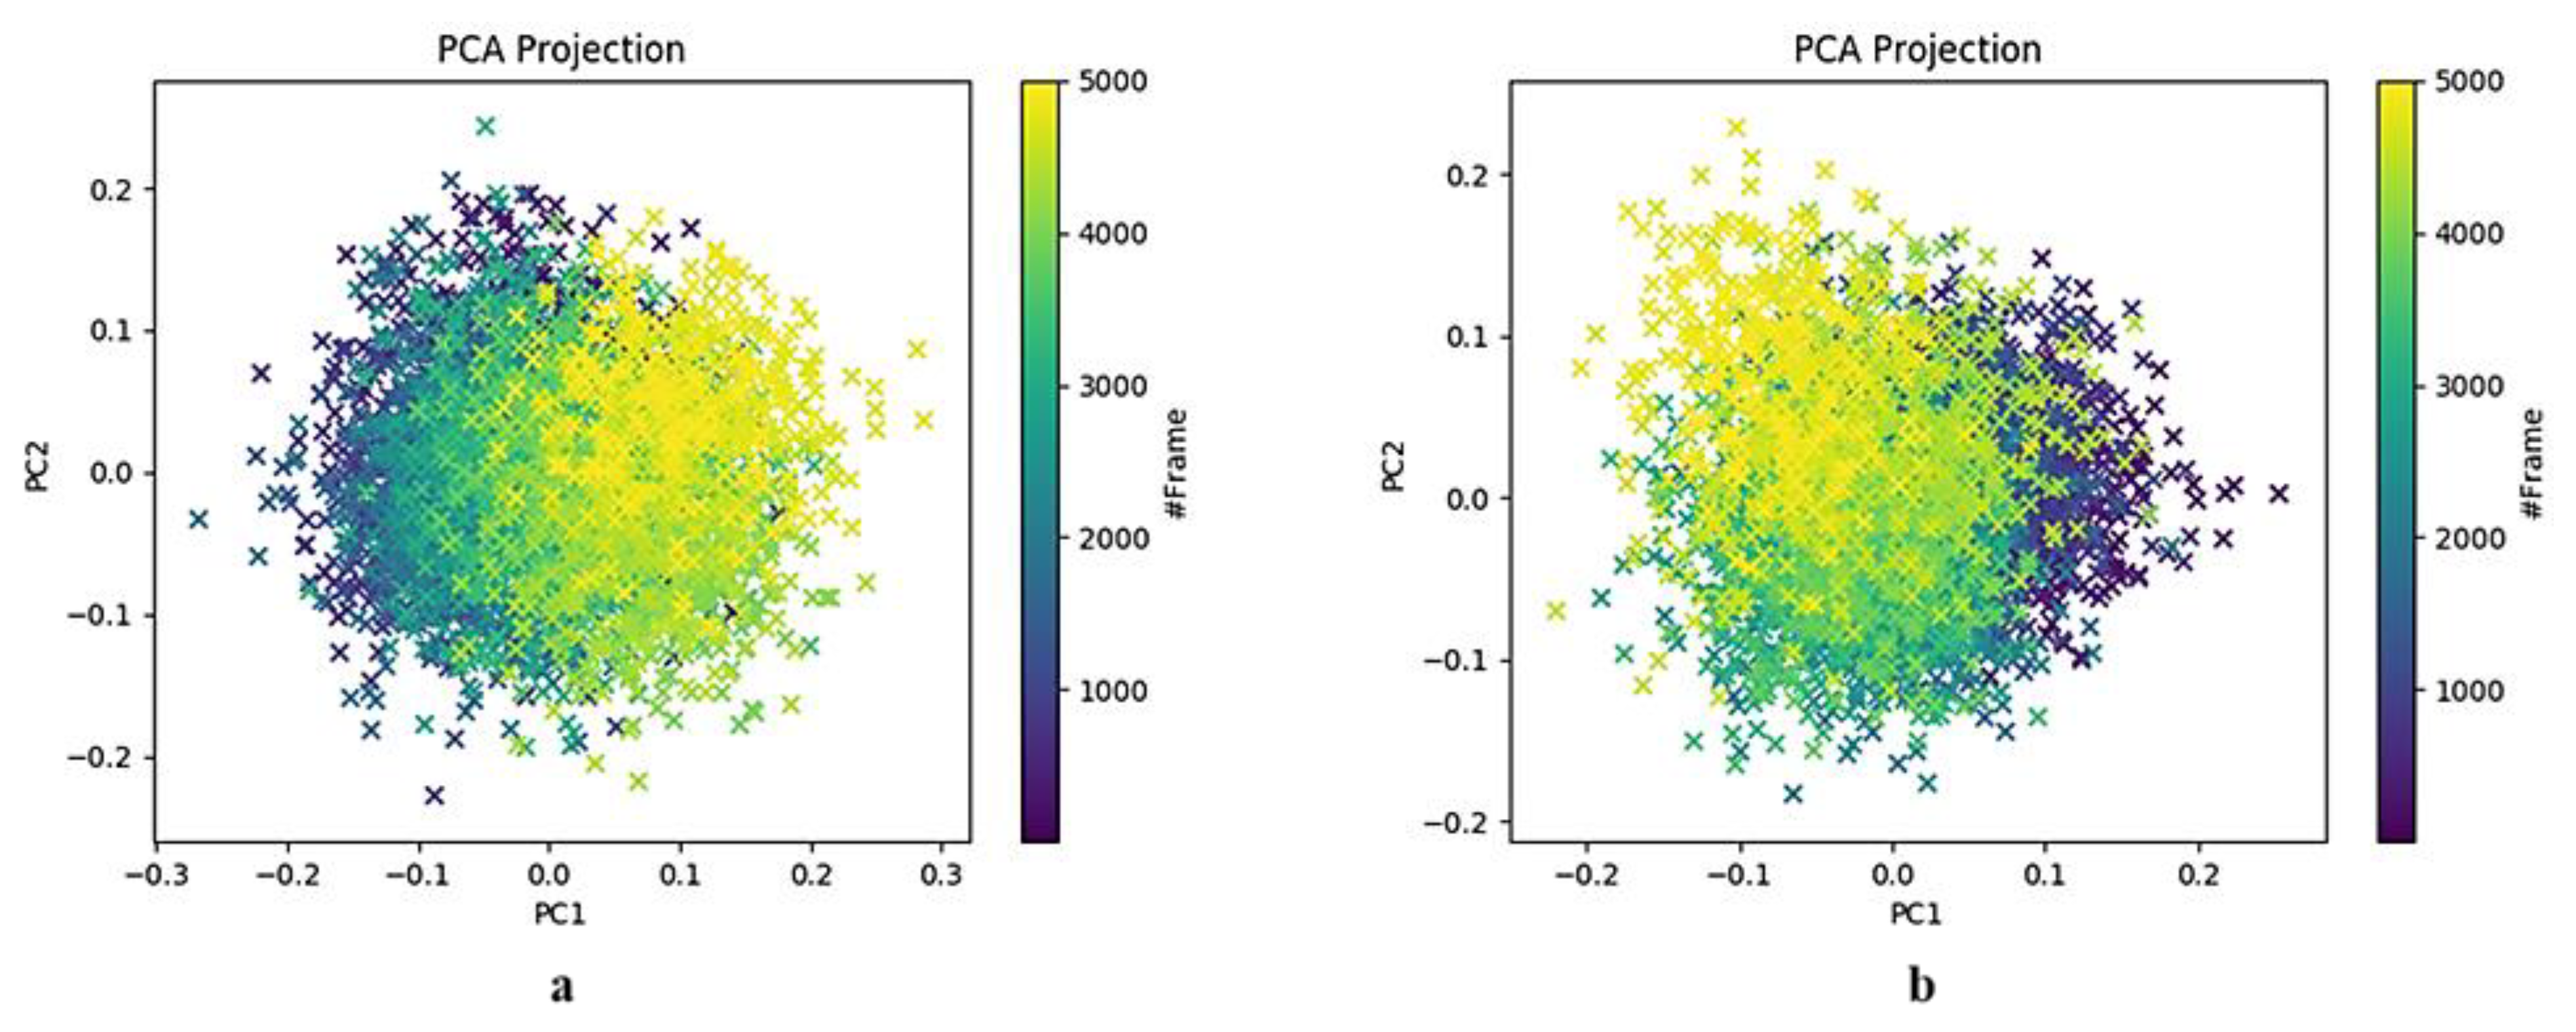

Table 1.
Summarised average energy components and their standard mean errors (SEM) of NSC36398–bound system.
Table 1.
Summarised average energy components and their standard mean errors (SEM) of NSC36398–bound system.
| Energy Component | ΔEnergy (Complex–Receptor–Ligand) (kcal/mol) |
SEM |
|---|---|---|
| ΔVDWAALS | –10.35 | 0.05 |
| ΔEEL | –9.45 | 0.08 |
| ΔEGB | 14.88 | 0.06 |
| ΔESURF | –2.15 | 0.00 |
| ΔGGAS | –19.80 | 0.08 |
| ΔGSOLV | 12.72 | 0.06 |
| ΔTOTAL/BIND | –7.07 | 0.04 |
Table 2.
Summarised average energy components and their standard mean errors (SEM) of NSC281245–bound system.
Table 2.
Summarised average energy components and their standard mean errors (SEM) of NSC281245–bound system.
| Energy Component | ΔEnergy (Complex–Receptor–Ligand) (kcal/mol) |
SEM |
|---|---|---|
| ΔVDWAALS | –37.80 | 0.07 |
| ΔEEL | –12.99 | 0.13 |
| ΔEGB | 28.72 | 0.11 |
| ΔESURF | –5.56 | 0.01 |
| ΔGGAS | –50.79 | 0.14 |
| ΔGSOLV | 23.16 | 0.11 |
| ΔTOTAL/BIND | –27.63 | 0.07 |
Disclaimer/Publisher’s Note: The statements, opinions and data contained in all publications are solely those of the individual author(s) and contributor(s) and not of MDPI and/or the editor(s). MDPI and/or the editor(s) disclaim responsibility for any injury to people or property resulting from any ideas, methods, instructions or products referred to in the content. |
© 2025 by the authors. Licensee MDPI, Basel, Switzerland. This article is an open access article distributed under the terms and conditions of the Creative Commons Attribution (CC BY) license (http://creativecommons.org/licenses/by/4.0/).
Copyright: This open access article is published under a Creative Commons CC BY 4.0 license, which permit the free download, distribution, and reuse, provided that the author and preprint are cited in any reuse.


