
Submitted:
27 August 2025
Posted:
28 August 2025
You are already at the latest version
Abstract
Agriculture is the dominant source of ammonia emission in the UK. Ammonia emissions arise from livestock manures and from the application to land of some manufactured fertilisers. Mitigation measures have been developed, for example, by reducing the exposure of manures to air, or filtering air emitted from livestock buildings. However, reducing air pollution from agriculture remains challenging. This research aimed to explore farmers perceptions of the benefits and barriers of adopting ammonia mitigation measures. This is an essential step toward increasing uptake and reducing agricultural ammonia emissions. To provide a comprehensive industry perspective, stakeholder views were also gathered. The study focussed on the housed dairy, pig and poultry sectors. The research was delivered through an online survey and focus groups with farmers from the dairy, pig and poultry sectors. Farmers from other sectors such as beef and arable who used manures were also invited to share their views. One-to-one interviews were carried out with industry stakeholders who represented a range of sectors. The research took place from March 2022 until May 2023. Farmer participants were self-selected, and selection bias was minimised by recruiting via well-known farming stakeholder organisations, to ensure good representation across sectors and devolved administrations. The study found farmers were interested to understand how to mitigate ammonia emission from their farms and reduce their environmental impact. Farmers predominantly favoured mitigation measures aimed at reducing emissions from housing, such as amending diet or extending the grazing season, while those involving technologies, such as air scrubbers, or those relating to slurry storage were perceived as less suitable. The main barriers to the adoption of mitigation measures were a lack of knowledge and cost. All mitigation measures will incur some cost to the farmer, but measures often build on familiar practices, such as extending the grazing season, or increasing bedding material in housing. Enhancing familiar practices can reduce the barriers to uptake. It is important to highlight the benefits for the farmers and their livestock, such as reduced manufactured fertiliser use, or better animal welfare. Greater clarity on benefits is essential. Most participants were from the cattle sector, which may have influenced the types of benefits and barriers identified. Gaining responses from farmers through an online survey was difficult, likely due to the time demands of the sector. Most survey respondents were in England. Farmers predominantly favoured housing mitigation measures, while measures involving technologies were perceived as less suitable. The research highlighted that the main barriers to the adoption of mitigation measures are a lack of knowledge and high costs. If the UK is to reduce overall ammonia emissions, it is important that future policy addresses the identified barriers and emphasises the environmental and business benefits for farmers to implement ammonia mitigation measures. This project was funded by the National Institute for Health and Care Research (NIHR) AIM-HEALTH programme.
Keywords:
ammonia
; agriculture
; mitigation
; emissions
; air pollution
; livestock
; survey
; perceptions
; farmer
; pig
; poultry
; dairy
1. Introduction
Agriculture is the dominant source of ammonia in the UK. Estimates from the UK National Atmospheric Emissions Inventory (NAEI) show that agriculture accounted for 87% of total ammonia emissions in 2021.[1] Livestock excreta is the main source of these emissions. In 2021, manures exposed to the atmosphere during housing made up 26% of ammonia emissions from agriculture, manures in storage made up 9%, manures during and following application to land contributed to 26% and emissions from urine and manure deposited during grazing contributed to 8%. Ammonia is also emitted following the application of some manufactured fertilisers, in 2021 this made up 16% of ammonia emissions from agriculture.[2]
Various mitigation measures (i.e. farm practices) have been developed to mitigate emissions of ammonia, such as covering slurry stores, or using automatic scrapers in housing, however, reducing air pollution from agriculture remains challenging. Reasons for this include the complexities of the sector, the limited policies targeting these emissions[3] and the relationship of ammonia and livestock numbers i.e. as livestock numbers fluctuate, as do ammonia emissions. Because of this, it is vital to evaluate the drivers and challenges facing farmers in introducing ammonia mitigation measures to understand the limitations to uptake.[4]
Ammonia reacts with other pollutants to form aerosols, contributing to particulate matter (PM), e.g. PM2.5, which have damaging effects to the environment through nitrogen deposition on sensitive ecosystems, leading to habitat damage, eutrophication and soil acidification.[5] The effects of this are becoming more prominent. In 2020, 64.3% of the UK was above the critical level of ammonia set to protect lichens and bryophytes (1 μm m-3), areas of England and Northern Ireland were particularly impacted, with 90.5% and 97.1% of land area above the critical level respectively.[6]
PM, such as PM2.5, i.e. particles with diameter of 2.5 μm or less, or PM10, i.e. particles with diameter of 10 μm or less, also damage human health.[7] Direct emissions of PM10 are predominantly from poultry and pig farming, with a smaller contribution from arable farming. Emissions of PM from livestock buildings are influenced by the type of bedding, factors that influence animal activity (e.g. age), feeding systems, manure management systems, and building design.[8]
Measures to mitigate ammonia include changes to manure management practices to limit exposure of manures to the atmosphere, such as covering slurry stores, or spreading slurry with a trailing hose. The condition of the manure can be altered through acidification, which reduces the pH and ammonia emissions. Mitigation measures can also target livestock directly, for example by adjusting the crude protein content of their feed. This approach is particularly relevant for housed livestock, where manure is collected, and livestock are typically fed a controlled diet. This study primarily focussed on measures to reduce emissions from housed dairy, pigs and poultry, while emissions from other sources such as manufactured fertilisers were not within its scope.
Few published studies have covered this topic. This research team delivered a study in 2018 with farmer workshops to understand the benefits, trade-offs and barriers to implementing various ammonia mitigation measures. These workshops uncovered several key points, however farmers focussed mostly on the barriers to implementation, which were similar to those found in this research[9]. One study from 2022 surveyed 40 farms from eight European countries to understand farmers’ knowledge and perceptions on ammonia and greenhouse gas emissions, and reasons for adopting mitigation measures.[10] This European study found that participants were generally willing to try new technologies to reduce emissions and to improve the efficiency and economics of the business. It involved farms engaged in research, which may have influenced this conclusion.
Our work engages a proportion of the farming population across the UK. The research aimed to improve the understanding of the farming industry’s perceptions of mitigation measures. This is crucial to evaluate the potential for further uptake of mitigation measures. Farmers identified drivers for uptake, and the practical challenges that should be considered. Activities (online survey, focus groups, one-to-one interviews) were designed to engage farmers and industry stakeholders.
2. Methodology
An online survey, focus groups, and one-to-one interviews were conducted to estimate the current uptake of ammonia mitigation measures and better understand the associated drivers and barriers. The target audience for the farmer survey and focus groups was dairy, pig and poultry sectors. Farmers in other sectors who use slurry and manures, e.g. beef and arable, were also given the opportunity to contribute. One-to-one interviews were carried out with industry stakeholders who represented a range of sectors.
Across all activities, participants were briefed about the project background and aims. It was clarified that all comments made during engagement activities would be recorded anonymously and no identifying information would be detailed in publication of the findings. Ethical approval for the study was granted by the Reading Independent Ethics Committee (RIEC).
2.1. Farmer Survey
The farmer survey was hosted online using Alchemar[11] with different question formats, including multiple choice, free-text and drop-down lists. The survey was co-designed with the project steering group, including farmer representatives and UK Government agencies, to ensure the questions were unbiased, aligned with the target audience, and effectively captured the study objectives and enterprise information to assess any impact this had on views.
Mandatory questions were limited to essential information only. Prior to launch, the survey questions were piloted with representatives from farmer organisations (e.g. NFU and CLA) and finalised based on feedback. The sample size was expected to be between 200-300 responses and was a self-selected population, selection bias was minimised by recruiting participation via well-known stakeholders to the farming industry. The survey was promoted through stakeholder mailing lists, social media and the English Farming Advice Service (FAS) newsletter (contact list of around 70,000). The survey was first launched in March 2022.
The survey asked multiple choice questions for: farm sector, location, number of livestock and size of holding. The multiple-choice options for these questions were based on Defra surveys (i.e. Farm Business Survey). Anyone not from the dairy, pig, poultry sectors, or did not use manures or slurries, was directed to the end of the questionnaire and thanked for their time.
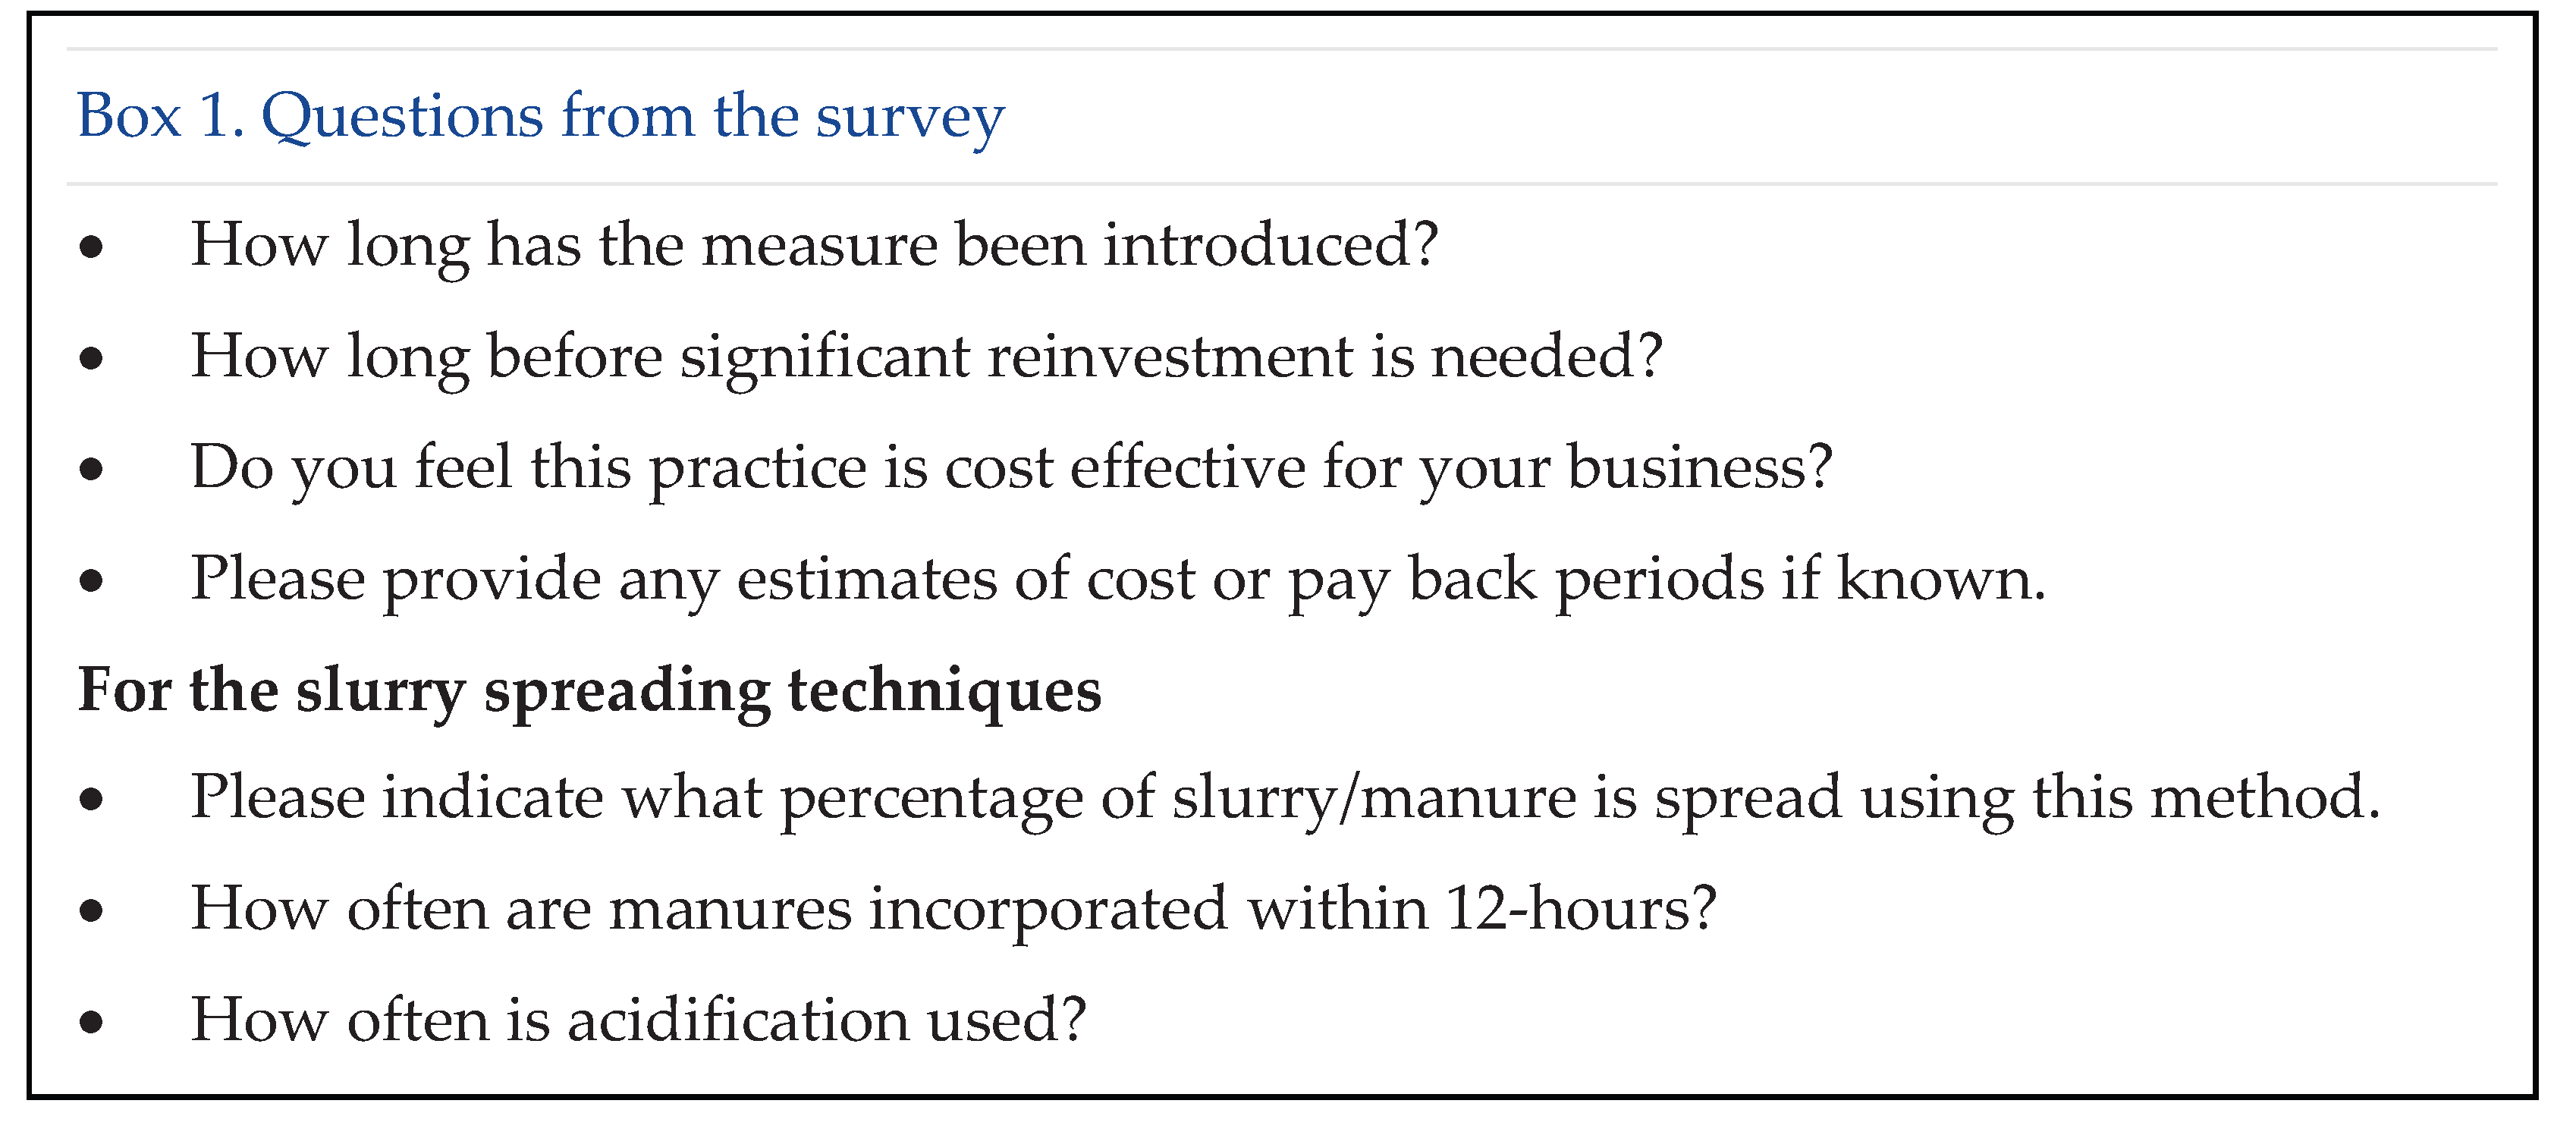
The survey then presented a list of mitigation measures for each sector (presented in Table 1 and defined in Appendix 1), split by housing, storage and spreading. Measures were based on Defra’s Code of good agricultural practice (COGAP) for reducing ammonia emissions[12] and the European Commission’s Best Available Techniques (BAT) reference document for the intensive rearing of poultry or pigs.[13] Participants then answered questions on for example, how long a measure has been introduced (see Box 1).
Respondents were then presented with a list of benefits and barriers to introducing mitigation measures (developed based on previous research by the study team9) and asked to select the top three, from their perspective (see Appendix 2).
The survey was monitored weekly, and follow-ups were issued to encourage responses. Despite this, the study team faced challenges with low engagement in the survey. This could have been because the topic was unfamiliar, or simply due to the time commitment required from those working in a busy sector. Because of this, the study team redrafted and shortened the survey, launching again in January 2023. This compromised on some of the detail but was deemed necessary to recruit the volume of responses required. The refreshed survey presented a table of mitigation measures relevant to the participant’s sector, and requested information on whether a measure was adopted, planning to be adopted, or was unsuitable. Questions regarding enterprise information, benefits/barriers and introducing additional measures remained the same (see Appendix 3). The second survey was promoted via the same routes and was taken to in-person farmer events around England.
Following two launches, the survey closed in July 2023 with 120 responses, 115 of which could be used in the analysis. Five responses were omitted due to incompleteness.
2.2. Focus Groups
Focus groups were held to allow space for discussions. One was held for each sector, with a fourth mixed sector group for those unable to attend a sector-specific session. Attendees were recruited via promotion in the FAS newsletter and through industry stakeholder groups. Registrations for the sessions were capped at 10. It is generally accepted that a group of 7-10 is the optimum size for such groups, for a range of views, while creating an environment where individuals feel comfortable to contribute.[14]
Before each focus group, attendees were sent briefing material with a list of the ammonia measures to be discussed. Each focus group was delivered by two facilitators and a note taker. The agenda was split into three sessions: an introduction to ammonia, discussion of the mitigation measures and the priorities and need for support (see Appendix 4). In each session, introductory slides were presented with discussion and questions welcomed throughout.
The dairy focus group was held in-person, with the remaining groups online. Experience showed that online delivery worked well and were most popular. Engagement from the poultry sector was low in the survey, however, this focus group was the best attended.
There were 31 attendees in total, 61% of these were farmers, other attendees included advisers sharing experience of their farmer clients.
2.3. Stakeholder Interviews
Stakeholder interviews were held online with 15 policy makers, regulators, academics and farmer representatives. A target list of organisation and individuals was compiled to ensure good representation across sectors and devolved administrations.
Semi-structured interviews were undertaken to gather information and gain a broader understanding of the barriers and enablers for increasing adoption of the mitigation measures from the stakeholder’s perspective, providing a different perspective to the farmer engagement activities.
The interview questions were designed and informed by consideration of the results of the farmer survey. These were sent to stakeholders ahead of the interview. This included questions regarding the key benefits and barriers raised by farmers and what is needed to support uptake in the industry (see Appendix 5).
2.4. Analysis of Findings
The results from the survey, focus groups and stakeholder interviews were analysed in Microsoft Excel to identify the uptake rates and key discussion themes. The results from each engagement activity were collated separately to allow the researchers to understand if different viewpoints were raised by farmers and stakeholders.
The responses on the same issues (e.g. uptake, benefits, barriers) were brought together to present a percentage of respondents giving particular answers and to undertake a thematic analysis. This allowed the researchers to see which mitigation measures were most adopted, and which were seen as being unsuitable. These results are discussed further in the following sections.
3. Results
The online survey and focus groups received comments from 146 people across the agriculture sector, 92% being farmers. 44% of respondents were from ‘other’ sectors (i.e., beef or mixed farming sectors); 27% from dairy; 20% from poultry and 9% from pigs. The survey respondents were from a mix of holding sizes, 52% with a holding of 99ha or less and 48% from 100ha or more.
Most farmers were located in England (87%) with a small proportion in Scotland (12%) and Wales (1%), we did not have any farmers from Northern Ireland in the survey and focus groups. However, over a quarter (27%) of interviewed stakeholders were in Northern Ireland. The following section presents the results from the engagement activities.
3.1. Uptake of Mitigation Measures
Table 1 shows the adoption of mitigation measures by respondents of the survey and focus groups. It outlines whether participants adopted a mitigation measure or deemed it unsuitable for their business. While the survey directly asked about these aspects, data regarding unsuitable measures from the focus groups was not quantified. The measures most often selected are discussed in more detail in the following sections.
3.1.1. Adopted Measures
Table 2 shows the top three mitigation measures adopted by respondents of the survey and focus groups, for each sector.
Amended diet was a top measure for all sectors. Adjusting feed to better align with the growth rate of livestock, reduces the excretion of nitrogen, leading to lower ammonia emissions throughout the manure management cycle.[15] Ammonia reductions will vary between livestock and is highly dependent on the specific feed amendment. For example, one research study reduced crude protein (CP) by 2% reducing cattle emissions by 35%, but for pigs, the same adjustment reduced emissions by 25%.[16] This measure was received positively in the engagement activities, with cost-saving benefits noted by all sectors. It was however reported that if done poorly, there is a risk of reducing production.
Nearly half of dairy sector respondents had extended their grazing season further into the spring or autumn. This can reduce ammonia in two ways, as urine infiltrates into the grass, exposure to air and mixing with manure is reduced; secondly, less manure to store and spread. Research indicates that an extra month of 24-hour grazing could reduce emissions by 10%.[17] Farmers noted reduced costs from less manure and slurry management and savings on winter feed from a shorter housing period. Challenges included weather conditions. Farmers in high-rainfall areas noted that cattle treading up the ground could lead to “costly grassland damage, leading to later spring turnouts”. Cattle breed is another important consideration, one stakeholder discussed thinner-skinned Holsteins might be less suitable to graze in colder periods compared to Ayrshires.
Using more bedding (e.g. straw, sand) material was a top measure in the dairy and pig sectors. This absorbs urine, reducing mixing with manure. Research indicates that increasing straw bedding for cattle by 25% could reduce ammonia by up to 50%.5 In the pig sector, the co-benefit of “more enrichment material for the pigs” which improves animal welfare was raised. Similarly in the dairy sector, co-benefits included a “cleaner, more comfortable environment for the cattle”. Challenges were similar for the sectors, relating to costs of additional straw and labour to bale and store it. A crucial consideration is availability of straw which can be location dependent.
Planting shelter belts was popular for the pig and poultry sectors; trees intercept ammonia from dispersing onto sensitive habitats[18], benefits raised included increased shade and privacy. However, focus group participants noted that in artificially ventilated buildings (i.e. pig and poultry units), extractor fans can blow the air above the trees, so emission benefit depends on tree density and height. This measure was less popular in the dairy sector because housing is not artificially ventilated, therefore reduced airflow from trees could negatively impact livestock health by increasing stress and flies.
Housing measures were the most popular in each sector, likely due to their lower capital investment compared to manure storage and spreading technologies.
Only a few stakeholders were aware of ammonia mitigation measures being practiced by farmers, such as farmers covering slurry stores to reduce rainfall entering the store. It was also mentioned that regulation in Northern Ireland[19] and Scotland[20] meant more farmers were required to use low emission spreading equipment, but at the time of the research, there was not the same requirement for England or Wales.
Collectively, the measures in Table 2 were reported to have co-benefits for a business, including cost savings, for example though more efficient feeding; or preventing water leaks which requires less bedding to absorb excess water and extended grazing seasons which can reduce the management needs of housed livestock. Some of the measures can also contribute to improved animal welfare (which subsequently benefits the economics of a farming business) this includes increasing bedding material and checking structures for water leaks. Measures can reduce the workload of farmers, such as an extended grazing season which reduces the amount of manure to be managed. Other measures help to avoid negative public perception, this includes extended grazing season and planting trees.
3.1.2. Measures Considered Unsuitable by Respondents
Table 3 shows the measures most selected as being unsuitable by respondents to the survey (data on this was not collected in the focus groups).
In the dairy sector, three measures received the same score and all related to slurry.
Slurry bags store pumpable slurry in an impermeable membrane and can be placed within an existing slurry lagoon pit. Barriers included cost and the pollution risk if they are damaged.
Covering slurry stores was also unpopular in the dairy sector (both with a floating plastic sheet and a fixed, solid cover), with barriers raised around health and safety and limitations to stirring. There were benefits discussed around reducing rainfall from entering a store, so some regional differences may be expected depending on the level of rainfall.
Deep injection of slurry was also indicated as being unsuitable by many respondents.
None of these measures were discussed in the focus groups and very few comments were raised in the survey, which makes it possible that they were unsuitable because they are not well understood.
The surveys low response rate from the pig sector resulted in several mitigation measures receiving the same percentage of responses. Consequently, comments from the focus group discussion were considered to identify the three most unsuitable measures which all related to using technologies to reduce emissions from housing.
Using automatic or robotic scrapers to remove slurry from passages and walkways was discussed as being challenging to introduce due to the cost of slurry collectors and potential alterations to housing to install the equipment.
Acidification of slurry in underfloor storage tanks adds acid (typically sulphuric acid) to an underfloor slurry store, reducing the pH of the slurry and decreases emissions of ammonia. This was discussed as being practically challenging due to “current infrastructure not suitable to take acidification without causing damage and problems”. In the pig sector focus group, there were strong views against acidification. The key reasons were due to the costs for installation and maintenance, and lack of practical information on how to do it effectively.
Vacuum/flushing system for slurry removal, removes slurry from slatted floor storage pits to a covered store. Concerns were raised that it would be costly, and without the means to pass on the increased cost to consumers, it would be a high investment with little return.
In the poultry sector installing air scrubbers was the most unpopular measure. Air scrubbers pass exhaust air through a solution of acid, dissolving the volatile ammonia, emitting cleaner air. While effective at reducing ammonia emissions (up to 90%[21]), it was not popular with respondents. Barriers included practicalities of retrofitting scrubbers on older buildings, it being a “new and unproven technology” and the high cost to install and run the units (including acid and electricity costs), with no clear benefit to bird performance (and therefore to the farmer) due treating exhaust air. In the focus group, the same points were discussed. In regard to costs, it was discussed that farmers may install them in a new building but cannot operate them because of the high costs (for example, electricity). In addition, there was reluctance due to handling chemicals.
In-house manure drying was also unpopular, challenges raised by participants included the high costs to operate and install the equipment, one farmer had investigated it but considered it too expensive.
Moving livestock housing away from sensitive sites, such as water courses, or sensitive habitats, was also unpopular in the poultry sector. There were no direct comments made about this measure, however based on comments received by other sectors this was considered impractical, particularly for housed livestock due to relocating buildings.
The measures identified in each sector as being most unsuitable generally involve the use of technology, investment or specialist knowledge, all of which can create a barrier to uptake. Despite this, there are some benefits to using these. For example, covering slurry stores in high-rainfall areas can reduce the need for constructing additional storage. For a farm using air scrubbers, there is an opportunity to capture nitrogen (depending on the type of scrubber). If the farm is mixed sector and applies fertiliser, this can offer an alternative to purchasing manufactured fertiliser.
3.2. Benefits of Mitigation Measures
Many of the mitigation measures can offer opportunities for retaining nitrogen and savings in labour and costs. Identifying the benefits to introducing ammonia practices is crucial in understanding how future uptake could be encouraged. In the survey, respondents were asked to select three benefits from a set list. The same benefits were also discussed in the focus groups and stakeholder interviews.
Table 4 shows that nearly a quarter of survey respondents indicated reduced management costs as a key benefit. Mitigation measures that improve efficiencies can do this, including automatic or robotic scrapers, or extending the grazing season. Other responses related to the reduced need to purchase fertiliser. This is relevant to measures which apply slurry more accurately, such as trailing hose and trailing shoe. The survey was active during a period of inflated fertiliser costs[22] which is likely to have influenced this result.
In the stakeholder interviews, 56 different benefits were raised. These were categorised into nine thematic areas which largely aligned with the benefits in Table 4: moral responsibility, cost-benefit, environmental benefit, health (human and animal), legislation, planning, practicalities, public perception and retaining nitrogen. The most common benefit categories were environmental benefit and practicalities, with 18% of benefits each. Environmental benefits included benefits to biodiversity and air quality. Practicalities included benefits such as cleaner grass, improved accuracy of spreading and reducing rainfall entering stores. Retaining nitrogen was the next most common benefit, due to more precise and accurate spreading leading to more efficient use of nitrogen.
Responses in the focus groups were also like those in Table 4. At the end of each focus group, the key benefits were summarised into categories which were agreed with participants, these are presented in Table 5.
The dairy focus group identified saving labour as a top benefit, in comparison, only 1% of survey respondents chose this. Animal health and nitrogen savings were also identified which align with popular benefits raised by survey participants. In addition to drivers in Table 5, human health benefits were also discussed, for example one dairy farmer adopted automatic scrapers due to personal health problems. As a result, they could reduce the labour effort and therefore the strain on their health.
The pig and poultry focus groups raised compliance, regulation and odour control as key drivers. These were discussed in relation to planning and environmental permitting as pig and poultry units over a certain size are subject to environmental permitting. Focus group participants discussed the requirement to include ammonia mitigation measures in planning applications to receive approval.
The mixed sector group raised environmental benefits as a key driver, noting that this group was mostly non-farmers which may have influenced the result. Commercial relations were also raised as a driver, in relation to retailers requiring evidence of mitigation from suppliers (typically of carbon) and biodiversity restoration. However, it was acknowledged that it is unlikely this will be done with ammonia as the focus.
3.3 Barriers to Mitigation Measures
Recognising the barriers raised by farmers and stakeholders helps to understand what might be preventing wide-scale uptake. As shown from the survey, farmers are engaged and willing to reduce their environmental impact, however there are barriers preventing this.
Based on previous studies and experience, the researchers expected cost to be the most significant barrier, and findings from the engagement activities supported this, with cost receiving 30% of responses, (see Table 6).
A lack of knowledge about ammonia mitigation measures was the next most common barrier, it is expected that this links with the barrier of cost. For example, if farmers do not know the detail of ammonia mitigation measures, the perceived cost may be just as significant a barrier as actual costs. Having knowledge about the measures also helps farmers to decide what will suit their farming system best.
The two common barriers are closely linked with the measures identified as being most unsuitable in Table 3, which typically require high levels of investment.
The responses in the ‘other’ barrier category were mostly associated with practicalities. For example, changing diet affecting production levels, old buildings or stores not being suitable for retrofitting or the operations not being of a significant scale to justify investment.
In the stakeholder interviews, 65 barriers to uptake were identified. These were categorised into seven thematic areas: practicalities, knowledge, costs, labour, attitude, regulation and availability of equipment. The most common barrier category was practicalities, making up 51% of responses. Examples include retrofitting on existing stores and housing which were not built with the purpose of having additions; slurry injectors and trailing shoe were discussed as being challenging to use on anything apart from grass and low emission spreading equipment taking longer so requiring more labour and costs.
Knowledge was also discussed as a key barrier by stakeholders. Points were raised around conflicting messages between government agencies, making it unclear to farmers what is required, making them reluctant to adopt new practices. In addition to this, farmers may be familiar with the practices, but perhaps not how they link to reducing emissions. A key point raised around costs was that it does not only include the equipment, but also operating and maintenance costs. For example, one stakeholder discussed that units using acid or moving parts such as a slurry injector can degrade overtime, creating large maintenance costs.
The focus group barriers and challenges were also largely linked around cost and knowledge, these are presented in Table 7.
The dairy sector focus group discussed the lack of clear information regarding the cost-benefits for farmers, linking to the main barrier of lack of information. In addition, good contractors were identified as a barrier, as many of the mitigation measures require expensive pieces of technology (e.g. trailing shoe and injectors), so farmers may contract out this work. However, as the increase in the need to use these practices rises, the availability of contractors at the appropriate time for spreading may become a barrier.
The pig focus group discussed how they felt there was no market return to encourage investment in technologies such as acidification and would prefer to invest efforts into technologies for efficiency improvement which provide a return. Grants were discussed as a barrier rather than enabler, for example changing from spreading slurry with a splash plate to an injector would incur higher operating costs due to more wearing parts and participants felt the grants were not sufficient to cover this.
In the poultry sector, high costs were discussed in relation to acid air scrubbers and the cost of retrofitting, handling the acid and running costs. There were also concerns around inconsistent messaging from Government agencies in different parts of the country along with outdated advice on best practices.
In the mixed sector focus group, knowledge and cost were discussed together, for example a lack of information for farmers around what is most cost-effective for them. It was also discussed how the practicalities will be different for every farm, between sectors and within sectors.
3.4. The Need for Support in Overcoming the Barriers and Challenges
A key point of discussion in the focus groups and stakeholder interviews was how to overcome the barriers.
Points raised in the stakeholder interviews fit into four thematic areas: education/advice, clarifying the benefits, funding, and support with understanding data. Points raised in the focus group fit into three thematic areas: improving knowledge, grant funding and support with understanding data. This showed that the views from stakeholders and farmers are largely aligned.
Overcoming the lack of knowledge was the most frequently identified need. Stakeholders identified communication channels to disseminate information to farmers, including farm visits, case studies, articles and peer-to-peer learning to see the measures in practice. Improving the communication between researchers, policy and farmers was also discussed to pass information to farmers to improve confidence in new techniques. Transparent information and reliable, impartial advisory support regarding the measures was also raised.
Highlighting benefits will support building knowledge around mitigation measures. One stakeholder said, “farmers might understand it’s a good practice but without incentive or requirement, more retained nitrogen isn’t a large enough incentive”. Stakeholders also discussed the importance of phrasing benefits in a clear, non-technical way, clarifying the practical co-benefits in addition to air quality improvements. The focus groups agreed with this stating they need to understand the benefits to their business before investing time and money.
Improved data and research will reduce the knowledge barrier. Farmers felt that data and information on the measures was limited, but if it was scientifically validated, it may lead to greater trust and uptake of measures. Some farmers also felt industry bodies gave different messages.
Financial support was highlighted for purchasing and installing the equipment. The focus groups raised concerns over grants and their limitations, some found the upfront cost prohibitive and would not apply unless it covered at least 75% of costs. Differences between sectors was also raised, pig and poultry participants felt the grants available were “nothing compared to what is available to dairy”.
3.5. Introducing New Measures/Applying for a Grant
The survey asked respondents if they plan to introduce new or further practices which reduce ammonia emissions. Overall responses were positive with respondents providing examples of mitigation measures they plan to introduce, such as low emissions spreaders. While others responded that they try to reduce emissions where they can. A few respondents indicated that they would introduce more measures once they knew more about it. Of the respondents indicating that they do not intend to introduce further practices, the reasons related to cash-flow; three respondents did not feel they had a problem with ammonia – indicating knowledge is a barrier.
The survey also asked respondents if they would apply for a grant relating to ammonia, most responses were positive, highlighting the need for support with costs.
4. Discussion
The research found farmers predominantly favoured mitigation measures aimed at reducing ammonia emissions from housing. Conversely, measures involving the implementation of technologies, often associated with high costs, were perceived as less suitable.
The primary barriers to implementing mitigation measures were cost and knowledge, a recurring theme throughout the research. Cost was also closely linked to the drivers for adopting measures, such as reducing management costs. Despite this, we found that farmers had a genuine interest in reducing their environmental impact.
4.1. The Types of Measures Being Adopted
Housing measures were common across all sectors (see Table 2). Amending livestock diet stood out as a popular measure, with over 20% of respondents in each sector adopting it. This measure received positive comments highlighting the cost-benefit through reduced feed waste and improved livestock performance. Other popular measures built on existing practices, for example, extending the grazing season for dairy, using more bedding in dairy and pigs, or increased checking for water leaks in poultry. Building on existing practices can reduce barriers to uptake and offer tangible benefits like a cleaner, dryer bedding environment. Tree shelter belts were popular in the pig and poultry sectors, having benefits such as increasing privacy for the farmer. The measures in Table 2 generally require lower upfront investment compared to the technologies in Table 3, meaning they are potentially more widely accepted. These measures still involve costs however, such as time and money to secure fencing for an extended grazing season.
4.2. The Measures Not Being Adopted
Measures involving technologies were the least common (see Table 3). This included slurry bags, covering slurry stores, using automatic scrapers, acidification of slurry, and air scrubbers. Barriers included high costs for purchase and installation, in particular regarding issues with retrofitting. This was discussed in all sectors. Some dairy farmers spoke about the difficulty in making alterations to older buildings, while in the pig and poultry sector, which is subject to environmental permitting, discussions were around air scrubbers only being possible on new buildings. The poultry sector had strong feelings against acid air scrubbers, due to the high purchase cost and ongoing running costs for electricity.
4.3. Measures That Have an Important Impact on Emissions
Estimating the emission reductions from ammonia mitigation measures depends on many factors. For example, the reductions in ammonia from covering a store will depend on the size and surface area of the store. Because of this, it is challenging to assign a specific emission reduction value to each measure, therefore the emission reductions here are indicative values.
Three of the key sources of ammonia from agriculture include the exposure of manures to the air in storage, during and following application to land, and from housing. Measures which reduce the exposure of manures at each of these stages can have significant reductions.
During and following application to land, measures such as trailing hose and trailing shoe apply slurry in a smaller surface area compared to a splash plate. Estimated ammonia reductions from using a trailing hose and trailing shoe are 30-40% and 30-65% respectively.12
At the housing stage, measures having an important impact on emissions include air scrubbers (estimated 70-90% reduction) but this was met with significant barriers in the engagement activities. Acidification of slurry in underfloor storage tanks offers reductions from storage through to spreading, however none of the participants had adopted this, so we did not receive many comments on the benefits. Another important measure is adjusting livestock feed; by doing this, it reduces the amount of nitrogen throughout the whole cycle, so there are lower emissions at storage and spreading.
Covering manures or slurries provide the highest reductions of ammonia at that stage. Some data states that slurry bags can reduce ammonia emissions by 100%10, and covering slurry stores can reduce emissions by 60-80%. These measures were not discussed in much detail by participants of the research.
4.4. The Support Required to Encourage Uptake of Measures That Farmers Are More Reluctant to Adopt
Knowledge was highlighted as an important barrier in all engagement activities. Several stakeholders said results of research are not always passed down to farmers. Similarly, it was said that farmers are being told they must adopt certain practices, but without detail on how.
A farmer stated: “I don't think there is enough information out there for farmers to act upon”. For example, farmers are told to cover slurry stores, with little guidance on how to manage (i.e. stir) the slurry with a cover. The same farmer suggested that if it was proven that farmers and livestock are affected by ammonia from agriculture, there would be a greater impact. Research has shown that agricultural ammonia contributes to PM2.5, which contributes to respiratory illnesses, however there is less research on the impacts to those working closely with livestock. A 2022 review by Wyer et al., found those working closely with livestock may have low exposure of ammonia over a long period of time which may could impact their health.5
To overcome this barrier, it will be important to provide information and clarity on the benefits to farmers in introducing these practices. Nearly all the practices involve a cost, so benefits such as improved animal welfare, or retaining nitrogen need to be clear to encourage uptake. This aligns with the top benefits selected by survey participants (Table 4). For example, farms which spread slurry will benefit from practices that retain nitrogen, such as acidification. This means that support will need to be tailored to different sectors, noting there will be differences between and within sectors.
4.5. How the Findings of This Research Advance Understanding in This Area
At the time of writing, the researchers did not find another study which gathered the perceptions of farmers on ammonia mitigation measures, aside from their published in 20199. Therefore, this research will help to better understand the views of the user, e.g. the farmer, on these practices. One study done in Flanders, Belgium in 2022 undertook a similar methodology of workshops and interviews, however focussed on interviewing technology developers, rather than users of the technology.[23] In the UK, data is collected on farming practices, for example an annual survey by Defra,[24] however this does not ask for the views of farmers, but rather collects data on the proportion of holdings doing a certain practice (not specific to reducing emissions).
4.6. Limitations of the Study
The researchers found engaging with the farming sector to be challenging. When considering the demands of the industry, it may be difficult for farmers to sit at a computer to complete a detailed survey or take part in an online focus group. The researchers attempted to promote the engagement activities through several means, online and in-person, but struggled to get high engagement.
Due to the challenge of engaging farmers in the research, the sample size is not significant enough to be representative of UK farming. Additionally, while our findings demonstrate the perceptions of a proportion of the farming sector, the external validity may be limited. The sample consisted primarily of cattle farmers located in England, which may not reflect broader sectors and geographical groups facing different challenges. The researchers aimed to mitigate this by engaging with stakeholders in each sector and Devolved Administration. Future research should replicate this study with more diverse participants.
5. Conclusions
Agriculture is the dominant source of ammonia emissions in the UK, primarily from livestock manures and some manufactured fertilisers. While various mitigation measures exist, reducing air pollution from agriculture remains challenging. Our research underscores the importance of understanding farmers’ perspectives to improve the adoption of these measures.
Through surveys, focus groups and one-to-one interviews, we found that farmers are generally open to learning about ammonia mitigation, particularly regarding housing-related mitigations compared to high-technology options, which were seen as costly and impractical. The research highlighted that the main barriers to mitigation measures include limited knowledge and high costs.
However, measures that align with familiar practices, such as extending the grazing season, or maintaining water systems had fewer barriers. Additionally, it is important to highlight the benefits of these measures, not just for the environment, but also for the farmers and their livestock. Greater clarity on the benefits is essential to encourage farmers to understand not only what they need to do but also how and why they should do it.
Notably, some of the most effective mitigation measures frequently discussed in academic literature, such as precision slurry spreading techniques and covers for slurry stores, were not popular in practice due to their high operational and installation costs.
By addressing the economic and knowledge barriers, while clearly communicating the practical benefits, broader uptake of ammonia mitigation measures and reductions in ammonia emissions from agriculture can be achieved.
Appendices
Appendix 1: Ammonia Practice Descriptions
Ammonia (NH3) is key air pollutant which can have significant effects on human health and the environment. In the UK, agriculture is the dominant source of ammonia, most of which comes from livestock manures and nitrogen fertilisers.

Table 8.
Practices that reduce ammonia emissions, with a short description of how they reduce emissions.
Table 8.
Practices that reduce ammonia emissions, with a short description of how they reduce emissions.
| Practices that reduce ammonia emissions | How does it reduce ammonia emissions? | |
|---|---|---|
| Housing | Extending the grazing season | Grazing animals urinate directly on the grass. The urine then infiltrates, reducing the exposure to air. |
| Increasing bedding material (e.g. straw, sand) | Increasing the amount of bedding helps to absorb more urine, reducing exposure to air. | |
| Increasing washing and scraping in yards areas | Scraping urine, slurry and manure into a covered store reduces the exposure to the air and the reaction to produce ammonia. | |
| Increasing cleaning by using automatic or robotic scrapers | As above, more frequent cleaning reducing the exposure to air. | |
| Acidification of slurry (usually in housing with an under-floor slurry pit) | Lowering the pH, by adding an acid such as sulphuric acid, decreases emission. | |
| Amending livestock diet to match N content to the amount of growth | Matching feed to the required amount for growth reduces the excretion of excess N, some of which will be emitted as ammonia. | |
| Planting tree shelter belts near livestock housing | Emissions are dispersed and/or taken up by the tree foliage. | |
| Moving livestock housing away from sensitive sites (e.g. SSSIs) | A drastic option, but effective because ammonia is deposited near the place of emission. This measure moves the sources of ammonia away from sites sensitive to ammonia depositions. | |
| Reducing stocking densities near sensitive sites (e.g. SSSIs) | Moves the sources of ammonia away from sites sensitive to ammonia depositions. | |
| Installing air scrubbers to filter pollutants | Fitted to housing units to remove ammonia. | |
| Increased checking of water structures to reduce leaks | More ammonia is emitted if bedding is wet | |
| Increasing litter removal (e.g. by belt removal) | For layers, collecting and removing manure to a covered store, reducing exposure to air. | |
| Storage/spreading | Slurry bags | Creates a physical barrier between the manure/slurry and the air. |
| Covering stores with a fixed solid cover | ||
| Covering stores with an impermeable floating sheet | ||
| Using a permeable floating cover (chopped straw or clay balls) | ||
| Covering a manure heap on permeable ground | ||
| Trailing hose | Applies slurry in narrow bands at grass level, reducing the surface area, helping quicker infiltration and reducing exposure to air. | |
| Trailing shoe | Applies slurry in narrow bands at soil level, reducing the surface area, helping quicker infiltration, reducing the exposure to air. | |
| Shallow injection | Injecting slurry into the ground, helping quicker infiltration and reducing exposure to air. |
|
| Deep injection |
Appendix 2: Initial Launch of Survey
| 1. Do you own or manage a dairy, pig or poultry business, and/or utilise livestock manure or slurry on your land? | ||||||
| 2. Which region of the UK are you in? | ||||||
| 3. What is the size of your holding (hectares)? | ||||||
| 4. Please select the main sector of your business (✓): | ||||||
| □ Dairy | □ Breeding pigs | □ Finishing pigs | □ Poultry (layers) | Poultry (broilers) | Other | |
| 5. Please provide the number of livestock during a cycle on your holding. | ||||||
6. The following questions will ask you about practices related to housing that reduce ammonia emissions.
|
Practice that reduces ammonia emissions |
How long has it been in place? Less than a year 1 – 2 years 3 – 5 years + 5 years |
Estimate how long it will be before it needs substantial re-investment? Less than a year 1 – 2 years 3 – 5 years + 5 years |
Is this practice cost effective for your business? Please provide any estimates of cost or pay back periods if known. |
| Extended the grazing season | |||
| Increasing bedding material (e.g. straw, sand) | |||
| Increasing washing and scraping in yards or handling areas | |||
| Increasing cleaning using automatic or robotic scrapers | |||
| Amended livestock diet | |||
| Improved the design of pens to keep solid parts of the floor as clean as possible | |||
| Increased checking of structure to reduce water leaks | |||
| In-house poultry manure drying | |||
| Increased litter removal (e.g. by belt removal) | |||
| Sending poultry litter away to be used in a biomass plant | |||
| Acidification of slurry (in-housing in an under-floor slurry pit) | |||
| Installing air scrubbers to filter pollutants | |||
| Planting tree shelter belts near livestock housing | |||
| Moving livestock housing away from sensitive sites (e.g. SSSIs) | |||
| Reduce stocking densities near sensitive sites (e.g. SSSIs) | |||
| Other – please describe |
7. The following questions will ask you about practices related to storing manure or slurry that reduce ammonia emissions.
Practice that reduces ammonia emissions
How much manure or slurry is stored this way?
0% - 100%
Is acidification used?
Yes / No
How long has the practice been used?
Less than a year
1 – 2 years
3 – 5 years
+ 5 years
Estimate how long it will be before it needs substantial
re-investment?
Less than a year
1 – 2 years
3 – 5 years
+ 5 years
Is this practice cost effective for your business?
Please provide any estimates of cost or pay back periods
if known
Slurry bags
Cover stores with a fixed solid cover
Cover stores with an impermeable floating sheet
Using a permeable floating cover
Cover a manure heap on permeable ground
Other – please describe
8. The following questions will ask you about practices related to spreading manure or slurry that reduce ammonia emissions.
| Practice that reduces ammonia emissions | How much manure or slurry was spread this way in the last 12-months? 0 – 100% |
Is acidification used? Yes / No |
How often do you incorporate within 12-hours of spreading? Always Usually About half the time Rarely Never |
In years, please estimate how long this spreading technique has been used Less than a year 1 – 2 years 3 – 5 years + 5 years |
How long do you estimate it will be before it needs substantial re-investment? Less than a year 1 – 2 years 3 – 5 years + 5 years |
Is this practice cost effective for your business? Please provide any estimates of cost or pay back periods if known |
| Trailing hose | ||||||
| Trailing shoe | ||||||
| Shallow injection | ||||||
| Deep injection | ||||||
| Other - describe |
9. What are the top 3 benefits to introducing the practices in the table (✓):
| □Increase the nitrogen content of manure/slurry □Reduced manufactured fertiliser □Improved animal health/welfare □Reduced management costs □Improved crop yield (including grass) |
□Reduced odour □Reduced dust from animal housing □Reduced labour □Reduced environmental impact |
□Improved relationships with local residents □Help to comply with permitting requirements □Improve the air quality around your holding □Keep rainwater out of storage tanks |
10. What are the top 3 challenges to introducing the practices in the table (✓):
| □Too expensive □Don’t have the space □Don’t have the time □Not enough labour |
□Not a priority for me/my business □Focusing on a different area of environmental improvement □Requires a change in farming system □I do not know enough about them |
11. Do you intend on introducing new/further practices which aim to reduce ammonia emissions?
| □Yes - please provide any comments: | □No - please indicate why: |
12. If there was a new grant introduced to help with the cost of introducing practices to reduce ammonia emissions, would you consider applying?
| □Yes - please provide any comments: | □No - please indicate why: |
Appendix 3: Second Launch of Survey
| 1. Which county are you in? | |||
| 2. What is the size of your holding (hectares)? | |||
| 3.State the number of livestock during a cycle on your holding. | |||
| All these practices reduce ammonia emissions, please (✓) as appropriate | Done | Plan to | Not suitable |
| Extended grazing season | |||
| More bedding (e.g. straw) | |||
| More washing/scraping in yards/parlours | |||
| Using automatic or robotic scrapers | |||
| Acidification of slurry | |||
| Amended diet (e.g. matching N content to growth rate) | |||
| Planted tree near livestock housing | |||
| Moved livestock housing away from sensitive sites (e.g. SSSIs) | |||
| Reduced stocking densities near sensitive sites (e.g. SSSIs) | |||
| Installed air scrubbers to filter pollutants | |||
| Increased checking of water structures to reduce leaks | |||
| In-house poultry manure drying | |||
| Increased litter removal (e.g. by belt removal) | |||
| Sending poultry litter to be used in a biomass plant | |||
| Slurry bags | |||
| Fixed solid cover on slurry stores | |||
| Impermeable floating sheet on slurry store | |||
| Permeable floating cover on slurry store | |||
| Covered manure heap on impermeable ground | |||
| Trailing hose | |||
| Trailing shoe | |||
| Shallow injection | |||
| Deep injection |
4. What are the top 3 benefits to introducing the practices in the table:
□Increase the nitrogen content of manure/slurry
□Reduced manufactured fertiliser
□Improved animal health/welfare
□Reduced management costs
□Improved crop yield (including grass)
□Reduced odour
□Reduced dust from animal housing
□Reduced labour
□Reduced environmental impact
□Improved relationships with local residents
□Help to comply with permitting requirements
□Improve the air quality around your holding
□Keep rainwater out of storage tanks
5. What are the top 3 challenges to introducing the practices in the table:
□Too expensive
□Don’t have the space
□Don’t have the time
□Not enough labour
□Not a priority for me/my business
□Focusing on a different area of environmental improvement
□Requires a change in farming system
□I do not know enough about them
6. Do you think you’ll introduce any of these practices in the future (please use turn over if you need more space):
□Yes - please provide any comments:
□No - please indicate why:
7.Please use this space to provide any further comments for example:
•The costs of any of the practices (capital and/or operational)
•Your additional thoughts about these practices
•Practicalities of introducing these
•Any additional benefits or barriers
Appendix 4 – Focus Groups
Agenda
| 12.00 | Welcome and introductions |
| 12.20 | First discussion session: awareness of ammonia issues |
| 12.50 | Break |
| 12.55 | Second discussion session: focus on practices |
| 13.30 | Break |
| 13.35 | Third discussion session: priorities and need for support |
| 13.50 | Closing discussions |
| 14.00 | Finish |
Ammonia Practice Score Sheet Sent to Focus Group Participants Ahead of the Meeting
The table shows a list of practices that reduce ammonia emissions, please score the practicality and cost 1-5 and indicate if you have introduced it, or if you feel there is potential for you to introduce it.
| Practice that reduces ammonia emissions | Practicality score 1 = not practical 5 =very practical |
Cost score 1= too expensive 5=cost effective |
Already introduced? (✓) | Potential to introduce? (✓) |
| Housing practices | ||||
| Extending the grazing season | ||||
| Increasing bedding material (e.g. straw, sand) | ||||
| Increasing washing and scraping in yards or handling areas | ||||
| Increasing cleaning by using automatic or robotic scrapers | ||||
| Acidification of slurry (usually in housing with an under-floor slurry pit) | ||||
| Amending livestock diet to better match growth rate | ||||
| Planting tree shelter belts near livestock housing | ||||
| Moving livestock housing away from sensitive sites (e.g. SSSIs) | ||||
| Reduce stocking densities near sensitive sites (e.g. SSSIs) | ||||
| Installing air scrubbers to filter pollutants | ||||
| Increasing litter removal (e.g. by belt removal) | ||||
| Sending poultry litter away to be used in a biomass plant | ||||
| Slurry/manure storage practices | ||||
| Slurry bags | ||||
| Covering stores with a fixed solid cover | ||||
| Covering stores with an impermeable floating sheet | ||||
| Using a permeable floating cover (e.g. chopped straw or clay balls) | ||||
| Covering a manure heap on impermeable ground | ||||
| Covering a manure heap on permeable ground | ||||
| Slurry/manure spreading practices | ||||
| Trailing hose | ||||
| Trailing shoe | ||||
| Shallow injection | ||||
| Deep injection | ||||
Appendix5: Stakeholder Interview Questions
1. Are you familiar with ammonia emissions in agriculture?
2. Where do you think are the biggest risks for ammonia emissions in agriculture?
3. Are you familiar with on-farm ammonia mitigation measures?
4. What do you think are the main drivers or incentives to farmers introducing mitigation measures for ammonia?
5. We have been running a survey for farmers on ammonia mitigation measures, in a question about the benefits, the most common response was the reduced need for manufactured fertiliser– what are your thoughts on this, would you agree?
6. What do you think other benefits are?
7. In our survey to farmers, the most common barrier to implementing these practices was cost – what are your thoughts on this, would you agree?
8. Do you have ideas on how this barrier could be reduced?
9. What do you think the other barriers or challenges are, particularly around practicalities?
10. Another barrier to respondents introducing measures was that they don’t know enough about them – what are your thoughts on the level of understanding about ammonia and mitigation measures in the industry?
11. What do you think the wider sector, such as the NFU and AHDB, can do to inform farmers of the risks of ammonia and the mitigation measures?
12. Based on your experience in working in agriculture, do you feel there has been a change in attitude to ammonia in the industry over the years?
13. Have you seen examples of ammonia mitigation measures in practice, if so, please provide detail on what the measures were, the driver behind the farmer decisions, and how successful the measures were.
Acknowledgements
The project team thank the steering group members who supported the delivery of this project, along with all of the farmers and stakeholders who set aside time to participant in our research.
References
- NAEI.BEIS About Ammonia; 2023. URL: https://naei.beis.gov.uk/overview/pollutants?pollutant_id=21#:~:text=Agriculture%20is%20the%20dominant%20source,emissions%20are%20related%20to%20cattle. (Accessed April 2024).
- Misselbrook TH, Gilhespy SL, Carswell AM, Cardenas LM. Inventory of Ammonia Emissions from UK Agriculture, 2021. Defra Contract SCF0107; 2023.
- Carnell E, Vieno M, Vardoulakis S, Beck R, Heaviside C, Tomlinson S., et al. Modelling public health improvements as a result of air pollution control policies in the UK over four decades—1970 to 2010. Environmental Research Letters, 2019. 14(7): p. 074001.
- Wiltshire J, Cowie H, Vardoulakis S., Evidence assessment of interventions to improve ambient air quality – agricultural interventions. IOM report commissioned by PHE. 2019.
- Wyer KE, Kelleghan DB, Blanes-Vidal V, Schauberger G, Curran TP. Ammonia emissions from agriculture and their contribution to fine particulate matter: A review of implications for human health. Journal of Environmental Management. 2022 Dec 1;323:116285.
- Rowe E, Sawicka K, Hilna N, Carnell E, Hernandez CM, Vieno M et al., Air Pollution Trends Report 2023: Critical load and critical level exceedances in the UK. Report to Defra under Contract AQ0849, UKCEH project 07617; 2023. URL: https://uk-air.defra.gov.uk/library/reports?report_id=1130. (Accessed February 2024).
- Bodor K, Szép R, Bodor Z. The human health risk assessment of particulate air pollution (PM2. 5 and PM10) in Romania. Toxicology Reports. 2022 Jan 1;9:556-62.
- Heederik D, Sigsgaard T, Thorne PS, Kline JN, Avery R, Bønløkke JH, Chrischilles EA., et al., Health effects of airborne exposures from concentrated animal feeding operations. Environ Health Perspect, 2007. 115(2): p. 298-302.
- Wiltshire J. Ammonia futures: understanding implications for habitats and requirements for uptake of mitigation measures. Stakeholder Feasibility Workshops and supporting review. Report for Defra ecm_53127. URL: https://uk-air.defra.gov.uk/assets/documents/reports/cat09/1909040930_Ammonia_futures_Understanding_implications_for_habitats_requirements_for_uptake_of_mitigation_measures_Stakeholder_feasibility_workshops&supporting_review.pdf. (Accessed January 2024).
- Vera E, Paul H, Becciolini V. View of farmers on GHG and ammonia emissions by survey in eight countries. InBook of Abstracts of the 73rd Annual Meeting of the European Federation of Animal Science 2022 (pp. 2-761). Wageningen Academic Publishers.
- Alchemer; 2024. URL: https://www.alchemer.com/ (Accessed July 2024).
- GOV. Code of Good Agricultural Practice (COGAP) for Reducing Ammonia Emissions; 2024. URL: https://www.gov.uk/government/publications/code-of-good-agricultural-practice-for-reducing-ammonia-emissions/code-of-good-agricultural-practice-cogap-for-reducing-ammonia-emissions#contents. (Accessed May 2024).
- JRC. Best Available Techniques (BAT) Reference Document for the Intensive Rearing of Poultry or Pigs; 2017. URL:https://eippcb.jrc.ec.europa.eu/sites/default/files/2019-11/JRC107189_IRPP_Bref_2017_published.pdf. (Accessed May 2024).
- Central Connecticut State University. Helpful Hints for Conducting a Focus Group. No year. URL: https://www.ccsu.edu/sites/default/files/document/FocusGroupsHints.pdf (Accessed July 2024).
- Ndegwa PM, Hristov AN, Arogo J, Sheffield RE. A review of ammonia emission mitigation techniques for concentrated animal feeding operations. Biosystems engineering. 2008 Aug 1;100(4):453-69.
- Sajeev EP, Amon B, Ammon C, Zollitsch W, Winiwarter W. Evaluating the potential of dietary crude protein manipulation in reducing ammonia emissions from cattle and pig manure: A meta-analysis. Nutrient cycling in agroecosystems. 2018 Jan;110:161-75.
- Misselbrook TH, Chadwick DR, Chambers BJ, Smith KA, Sutton MA, Dore CA. An Inventory of Methods to Control Ammonia Emissions from Agriculture. Ammonia Mitigation User Manual; 2008.
- Bealey WJ, Dore AJ, Dragosits U, Reis S, Reay DS, Sutton MA. The potential for tree planting strategies to reduce local and regional ecosystem impacts of agricultural ammonia emissions. Journal of environmental management. 2016 Jan 1;165:106-16.
- GOV.IE. Fifth Nitrates Action Programme 2022-2025; 2022. URL: https://www.gov.ie/en/publication/f1d01-fifth-nitrates-action-programme-2022-2025/. (Accessed February 2024).
- Farmingandwaterscotland.org. New General Binding Rules on Silage & Slurry Frequently Asked Questions;No year. URL: https://www.farmingandwaterscotland.org/know-the-rules/new-general-binding-rules-on-silage-and-slurry-whats-changed/new-general-binding-rules-on-silage-slurry-faqs/. (Accessed February 2024).
- Afbini.gov.uk. Ammonia reduction strategies for the pig & poultry sectors: Sixth article in a series of seven being released by AFBI to address Ammonia Emissions in Northern Ireland; 2021. URL: https://www.afbini.gov.uk/news/ammonia-reduction-strategies-pig-poultry-sectors-sixth-article-series-seven-being-released-by. (Accessed February 2024).
- AHDB.co.uk. GB fertiliser prices; 2024. URL: https://ahdb.org.uk/GB-fertiliser-prices. (Accessed July 2024).
- Van Der Velden D, Dessein J, Klerkx L, Debruyne L. Constructing legitimacy for technologies developed in response to environmental regulation: the case of ammonia emission-reducing technology for the Flemish intensive livestock industry. Agriculture and Human Values. 2023 Jun;40(2):649-65.
- Defra. Farm practices survey; 2024. URL: https://www.gov.uk/government/collections/farm-practices-survey. (Accessed June 2024).
Table 1.
Percentage uptake of ammonia mitigation measures from participants of the survey and focus groups. Data for ‘not suitable’ measures is for survey respondents only. Bold numbers indicate the three most common measures in each sector, blank cells indicate the measure is not relevant. Measures are defined in Appendix 1.
| Dairy (%) | Pigs (%) | Poultry (%) | |||||
|---|---|---|---|---|---|---|---|
| Adopted | Not suitable | Adopted | Not suitable | Adopted | Not suitable | ||
| Housing | Extended the grazing season | 45 | 17 | ||||
| More bedding (e.g. straw) | 33 | 17 | 23 | 0 | |||
| More washing/scraping in yards/parlours | 25 | 11 | 15 | 0 | |||
| Using automatic or robotic scrapers | 18 | 17 | 0 | 14 | |||
| Acidification of slurry | 3 | 31 | 0 | 0 | |||
| Amended diet (e.g. matching N content to growth rate) | 30 | 11 | 23 | 0 | 34 | 6 | |
| Planted trees near livestock housing | 13 | 26 | 15 | 0 | 41 | 0 | |
| Moved livestock housing away from sensitive sites (e.g. SSSIs) | 10 | 26 | 8 | 0 | 7 | 24 | |
| Reduced stocking densities near sensitive sites (e.g. SSSIs) | 10 | 23 | 0 | 14 | |||
| Vacuum/flushing system for slurry removal from pits under slatted flooring | 0 | 14 | |||||
| Improved pen design to keep solid parts of the floor as clean as possible | 8 | 0 | |||||
| Installed air scrubbers to filter pollutants | 0 | 0 | 0 | 29 | |||
| Increased checking of structures and water drinkers to reduce leaks | 34 | 0 | |||||
| In-house poultry manure drying | 14 | 24 | |||||
| Increased litter removal (e.g. by belt removal) | 21 | 18 | |||||
| Sending poultry litter away to be used in a biomass plant | 10 | 24 | |||||
| Storage/spreading | Slurry bags | 0 | 37 | 0 | 14 | ||
| Fixed solid cover on slurry stores | 5 | 34 | 0 | 14 | |||
| Impermeable floating sheet on slurry store | 0 | 37 | 0 | 14 | |||
| Permeable floating cover (e.g. chopped straw) on slurry store | 8 | 20 | 8 | 14 | |||
| Covered manure heap on impermeable ground | 10 | 11 | 8 | 0 | 10 | 12 | |
| Trailing hose | 25 | 20 | 0 | 0 | |||
| Trailing shoe | 25 | 11 | 8 | 0 | |||
| Shallow injection | 8 | 29 | 0 | 0 | |||
| Deep injection | 0 | 37 | 0 | 0 | |||
Table 2.
Top three mitigation measures adopted by respondents of the survey and focus groups, for each sector.
Table 2.
Top three mitigation measures adopted by respondents of the survey and focus groups, for each sector.
| Sector | Ammonia mitigation measures | Percentage of respondents (%) |
|---|---|---|
| Dairy | Extended grazing season | 45 |
| Using more bedding | 33 | |
| Amended diet | 30 | |
| Pigs | Using more bedding | 23 |
| Amended diet | 23 | |
| Planted tree shelter belts near livestock houses | 15 | |
| Poultry | Planted tree shelter belts near livestock houses | 41 |
| Increased checking of structures and water drinkers to reduce leaks | 34 | |
| Amended diet | 34 |
Table 3.
Measures indicated as being unsuitable from respondents of the survey.
| Dairy | Slurry bags | 37 |
| Fixed solid cover on a slurry store | 37 | |
| Deep injection | 37 | |
| Pigs | Using automatic or robotic scrapers | 14 |
| Vacuum/flushing system for slurry removal | 14 | |
| Acidification of slurry in underfloor storage tanks | 14 | |
| Poultry | Installed air scrubbers to filter pollutants | 29 |
| In-house poultry manure drying | 24 | |
| Moved livestock housing away from sensitive sites (e.g. SSSIs) | 24 |
Table 4.
The benefits to introducing ammonia mitigation practices from the farmer survey.
| What are the top 3 benefits to practices that reduce ammonia emissions on farm? | Percentage of respondents (%) |
|---|---|
| Reduced management costs | 24 |
| Reduced manufactured fertiliser | 19 |
| Increase the nitrogen content of manure/slurry | 12 |
| Reduced environmental impact | 11 |
| Improved crop yield (including grass) | 9 |
| Improved animal health/welfare | 6 |
| Reduced odour | 5 |
| Help to comply with permitting requirements | 4 |
| Keep rainwater out of storage tanks | 4 |
| Improved relationships with local residents | 3 |
| Improve the air quality around your holding | 2 |
| Reduced labour | 1 |
| Reduced dust from animal housing | 1 |
| Other: Treat ammoniacal materials on site with minerals like quicklime to lock up gaseous ammonia | 0.3 |
Table 5.
The key benefits and/or drivers to mitigation measures discussed in the focus groups.
| Top benefits/ drivers | Dairy | Pigs | Poultry | Mixed sector |
| Saving labour | Grants | Cost savings (e.g. feed, fertiliser) | Environmental benefit | |
| Animal health | Odour control | Regulation | Commercial and customer relations | |
| Saving nitrogen | Compliance | Odour control | Cost savings (e.g. reduced fertiliser costs) |
Table 6.
The barriers to introducing ammonia mitigation practices from the farmer survey.
| What are the top 3 barriers to reducing ammonia emissions on your farm? | Percentage of respondents (%) |
|---|---|
| Too expensive | 30 |
| I do not know enough about them | 13 |
| Focusing on a different area of environmental improvement | 11 |
| Not a priority for me/my business | 10 |
| Requires a change in farming system | 10 |
| Other | 8 |
| Not enough labour | 8 |
| Do not have the space | 6 |
| Don’t have the time | 5 |
Table 7.
The key barriers and challenges to introducing ammonia mitigation measures discussed in the focus groups.
Table 7.
The key barriers and challenges to introducing ammonia mitigation measures discussed in the focus groups.
| Top barriers and challenges | Dairy | Pigs | Poultry | Mixed sector |
| Lack of information | Cost | Cost | Cost | |
| Cost-benefit | Practicalities | Government agencies | Lack of knowledge | |
| Good contractors | Lack of knowledge | Lack of research and data | Planning restrictions |
Disclaimer/Publisher’s Note: The statements, opinions and data contained in all publications are solely those of the individual author(s) and contributor(s) and not of MDPI and/or the editor(s). MDPI and/or the editor(s) disclaim responsibility for any injury to people or property resulting from any ideas, methods, instructions or products referred to in the content. |
© 2025 by the authors. Licensee MDPI, Basel, Switzerland. This article is an open access article distributed under the terms and conditions of the Creative Commons Attribution (CC BY) license (http://creativecommons.org/licenses/by/4.0/).
Copyright: This open access article is published under a Creative Commons CC BY 4.0 license, which permit the free download, distribution, and reuse, provided that the author and preprint are cited in any reuse.


