Submitted:
25 August 2025
Posted:
26 August 2025
You are already at the latest version
Abstract
The main purpose of the study was to obtain symbiotic juices of fruit origin, which can successfully substitute the well-known symbiotic dairy products and thus be introduced into the diet of vegetarians or people with certain intolerances to animal products. In this regard, 2 fermented blueberries juices were obtained: NC, using kefir cultures and NP with L. plantarum inoculation. In the analysis of these functional products, 2 more simple blueberries juices were used as control products: NCM, thermostated at 24°C and NPM, at 37°C. The 4 types of juices were physicochemical and microbiological evaluated. Thus, it can be concluded that NP juice corresponds the most from the physicochemical point of view, presenting the highest polyphenols content and the highest antioxidant activity after the refrigeration storage of 5 days. Also, the microbiological results of the analyzed juices can recommend these products for industrial production.
Keywords:
symbiotic
; blueberries juice
; kefir culture
; Lactobacillus plantarum
; fermentation
1. Introduction
Berry fruits are highly consumed throughout the world because they have attractive colors and their chemical composition highlights their sweet taste, fruity aroma, and beneficial health properties [1]. Due to the exceptional properties that blueberries possess, they have been certified by the International Food and Agriculture Organization (FAO) as one of the five healthy human foods [2]. Blueberry shrub is a member of Vaccinium genus of the Ericaceae family with small fruits known for their important content in organic acids, phenolic acids, flavonoids, anthocyanins and other active substances [3].
The bioactive compounds are the secondary metabolites of the plant tissues which include vitamins and polyphenols. Polyphenols can be divided into flavonoids and non-flavonoids. Flavonoids are comprised of anthocyanins, flavonols, flavanols, flavones and flavanones, while non-flavonoids of tannins, stilbenes and phenolic acids like hydroxybenzoic and hydroxycinnamic acids [4]. The most encountered flavonols in blueberries are quercetin, myricetin, and kaempferol and flavanols are catechin, epicatechin, and gallocatechin [5,6,7]. Anthocyanins, the most potent antioxidants in blueberries, are natural pigment composed of 2 benzene rings linked by 3 carbon atoms which can react with glucose, rhamnose, galactose and arabinose. There are 5 kinds of typical anthocyanins: delphinidin, malvidin, peonidin, cyanidin, and pelunidin [8]. After the human ingestion, the anthocyanins are deglycosylated in the small intestine and degraded into anthocyanidins for further absorbtion [9].
Fruits and vegetables regular consumption is recommended for a healthy lifestyle due to their content of fibers, vitamins, minerals and phytochemicals [1]. Blueberries can be considered as functional food due to their high anthocyanin content which generates the health increase due to the antioxidant capacity [10]. But all the bioactive compounds of the blueberry’s composition lead to the health improvement through their multiple roles as antioxidants, anti-inflammatory, antiseptic, antiproliferative, antiaging, astringent, neuroprotective, cardio, vision and kidney protective [8].
The highest disadvantage of this superfood exploitation is the fact that it is very perishable because it can be easily damaged under the influence of mechanical or microbiological factors. Thus, blueberries present a strong seasonal availability, a reduced shelf life, and accordingly economic losses [11]. Thereby, it is necessary to enhance the blueberries consumption mainly by functional derived-products in order to make their active compounds available to a more diversified market. Among these derived-products the blueberries juice is the most popular because it is highly palatable and healthy [12].
Saud et al. (2024) [13] consider the fruit and vegetable juices obtained by lactic acid fermentation as a novel nutritional approach for improving health. Especially as fermentation is a simple and sustainable technology that involves low-costs but also extends the shelf life of fruits and vegetables [14]. A series of new compounds are generated following the fruits fermentation process that improve the sensory characteristics of the finished product and bring great benefits to the consumers health; in addition, this process can maintain a series of essential nutrients and degrade toxic components [15]. Thus, the content of phenolic compounds, exopolysaccharides, vitamins and minerals increases, determining a series of functional properties in the finished product, such as antioxidant, hypoglycemic and antihypertensive activity [16]. Fermented juices also help maintain a healthy gut microbiota, which prevents or improves chronic metabolic diseases such as obesity, diabetes, cardiovascular and cerebrovascular diseases [17].
Lactobacillus plantarum fermented jujube generated more aroma, volatile organic components and exhibited lower bitterness, astringency, and aftertaste [18]. Combination of Lactobacillus plantarum and Pichia pastoris may supply a new mixed fermentation agent towards fermented jujube products and provides reference values for flavor regulation in the co-fermentation of jujube juice [19]. Probiotics-fermented blueberry juice is more effective than blueberry juice in preventing obesity and hyperglycemia in mice [20]. Litchi juice fermented with probiotics enhanced immunomodulatory function and protected the intestinal tract better than unfermented litchi juice [21]. Furthermore, fermented apple juice (FAJ) has stronger biological activities and hypoglycemic effects than unfermented apple juice (AJ) [22]. However, the effects of FAJ by probiotic strains on gut dysbiosis remain largely unknown.
The quality of the fermented fruit juices is influenced by factors such as the microorganisms used for fermentation, the fermentation conditions, and the type and quality of the fruits used [17].
In this study, the use of kefir and Lactobacillus plantarum cultures for the production of fermented blueberry juices was explored. The aim of the study was to evaluate the impact of these cultures on the physicochemical and microbiological properties of the fermented blueberry juices, as well as their stability during the refrigerated storage of 5 days.
2. Materials and Methods
2.1. Preparation of the Blueberry Juices
Blueberries were provided by the Bluettes Saveur blueberry plantation from Satu Mare, Romania. The blueberries juice was obtained by crushing and pressing fresh blueberries, followed by filtering the resulting juice. After pasteurization (71.7 °C/15 s), the obtained juice was divided into 4 equal parts. 2 parts were used to produce the 2 functional juices: one with 0.1 % Lactobacillus plantarum (L. Plantarum Probiotic by Swanson) and one with 0.1 % kefir cultures (Probiotic ferment for kefir, eco-bio, by My.Yo, Germany) and 2 parts represented the simple control juices. All juices were subjected to thermostatation at different temperatures for 24 hours: the ones for Lactobacillus plantarum study were kept at 37°C, and those for kefir cultures at a temperature of 25°C.
Codification of the 4 types of juice experimentally analyzed in the laboratory:
NPM = control blueberries juice for the product fermented with Lactobacillus plantarum;
NP = blueberries juice fermented with Lactobacillus plantarum;
NCM = control blueberries juice for the product fermented with kefir cultures;
NC = blueberries juice fermented with kefir cultures.
The 4 types of juices were analyzed at:
- Moment 0 - the day before fermentation, when the cultures were added (M0),
- Moment 1 - the day when the fermented juices were obtained (M1),
- Moment 2 - 3 days after opening and keeping under refrigeration (M2),
- Moment 3 - 5 days after opening and keeping under refrigeration (M3).
2.2. pH Determination by the Potentiometric Method
The determination was carried out using the Voltcraft PH-100 ATC pH Meter which measures the potential difference between a reference electrode and a measuring electrode, introduced into the juice sample. The calibration of the device was done using two buffer solutions with a pH close to the possible pH of the sample. The electrodes were introduced into the sample to be analyzed and after 1-2 minutes the pH was read. The pH measurement was performed three times for each sample, the pH value being thus given by the arithmetic mean of the 3 measurements as long as the difference between the extreme values does not exceed 0.15 pH units.
2.3. Determination of the Refractive Index
It was performed using the PAL-RI digital refractometer (ATAGO). For the fruit juices, the refractive index depends on the sugar concentration and also on the concentration of other soluble materials (organic acids, minerals, amino acids, etc.).
The juices must be thoroughly mixed before determination and brought to a temperature of approx. 20 °C (± 0.5 °C). A small portion of the sample was placed on the lower prism of the refractometer, then the measurement was carried out according to the instructions of the device. Three determinations were made on the same sample according to the International Federation of Fruit Juice Producers (IFU) methods [23].
2.4. Determination of Vitamin C by the Iodometric Method
According to Varga et al. 2004 [24], the iodometric method for determining the vitamin C content is based on the oxidation of this vitamin (ascorbic acid) to dehydroascorbic acid in an acidic medium, using iodine. Starch is used as an indicator, which turns blue when all the vitamin C has been oxidized. The iodine required for the reaction came from a prior reaction between potassium iodate and potassium iodide in an acidic medium. For the vitamin C extraction, 5 ml of the sample were mixed with 20 ml of 2% hydrochloric acid solution. The mixture was left to stand for 15-20 minutes and then filtered. Meanwhile, the sample was prepared for titration: in a 50 ml Erlenmeyer flask, 1 ml of the vitamin C solution (or the obtained filtrate) was added together with 3 ml of distilled water, 0.5 ml of potassium iodide (KI) solution and 2 ml of starch solution. The mixture was immediately titrated with a potassium iodate solution until a persistent blue color appeared. The blank sample was processed under identical conditions, replacing the vitamin C solution with 1 ml of 2% hydrochloric acid solution.
The vitamin C concentration was expressed in mg% according to the relationships:
where:
N = Pd − Pm
C = Nx0.088x100
Pd - the number of ml of potassium iodate solution used for the analyzed sample,
Pm - the number of ml of potassium iodate solution used for the blank sample,
C - vitamin C concentration, in mg%.
2.5. Antioxidant Activity Determination
The antioxidant activity was determined spectrophotometrically using a Perkin Elmer Lambda 35 spectrometer. The method was proposed by Tongnuanchan et al. (2012) [25]. A quantity of 0.5 g sample was treated with 10 mL methanol and homogenized for 3h. Then it was filtered and a volume of 3 mL methanolic extract was treated with 3 mL of 0.15mM DPPH ethanolic solution (DPPH in 95% ethanol) and kept in the dark for 30 minutes at room temperature. The mixture was stirred. For the blank sample, 3 ml of methanol was mixed with 3 ml DPPH solution and kept in the dark for 30 minutes. The absorbance was read at 517 nm and the antioxidant activity was determined with the formula:
Antioxidant activity (%) = [1 – (A517 nm sample/ A517 nm blank)] x 100
2.6. Determination of the Total Polyphenol Content
For the polyphenol’s analysis, the method based on their oxidation reaction under the action of the Folin-Ciocalteu reagent was used, which is a mixture of sodium phosphotungstate, phosphomolybdic acid and phosphoric acid according to an adapted procedure based on the method proposed by [26] and used in other researches [27,28]. The analysis method comprises three important steps, such as drawing the calibration curve with gallic acid (standard polyphenol), polyphenols extraction from the samples to be analyzed using an extractant solution consisting of 1% HCl in 40% methanol or 1% HCl in 40% ethanol, and the spectrophotometric determination of polyphenols from the extract with the Folin-Ciocalteu reagent.
To plot the calibration curve, a series of gallic acid standard solutions were prepared with concentrations ranging from 10-500 mg/L. Then 1 mL of each standard solution was mixed with 60 mL of distilled water and 1 mL of Folin-Ciocalteu reagent, left to stand for 1 minute, and finally 15 mL of 7.5% Na2CO3 solution was added and the mixture was made up to 100 mL in a volumetric flask. The solution was left to stand for 30 minutes for the color development, then the absorbance was read at 750 nm against distilled water. A blank was also prepared containing the same reagents, but instead of 1 mL of the gallic acid standard solution, 1 mL of 1% HCl solution in 40% methanol was added (the solution used to extract polyphenols from fruits or plants).
The spectrophotometric determination of the polyphenols for the liquid samples using Folin-Ciocalteu reagent was done by mixing 1 mL of the liquid sample with 60 mL of distilled water in a 100 mL volumetric flask. Then 1 mL of Folin-Ciocalteu reagent was added and left to stand for 1 minute. Afterwards, 15 mL of 7.5% Na2CO3 solution was mixed with the solution and made up to 100 mL in a volumetric flask. The absorbance of the resulting solution was measured after 30 minutes at a wavelength of 750 nm against distilled water, and the results were expressed in mg/L gallic acid equivalents (GAE).
2.7. Microbiological Determinations
The microbiological profiles of the blueberries juice samples were determined by ISO standardized analyses: aerobic mesophilic bacteria [29] and yeasts and molds [30].
For each analysis, the samples were mixed with sterile saline solution (NaCl, 8.5%) in a ratio of 1:9, and subsequently, a series of dilutions were performed according to the mentioned standards.
For the total number of aerobic mesophilic bacteria, the PCA (Plate Count Agar) culture medium was used. It was sterilized and cooled to 45°C, then poured onto the inoculated plates. The inoculum was mixed with the culture medium, left for solidification, and then the Petri dishes were incubated at 30°C for 72 hours. To calculate the number of aerobic mesophilic bacteria/ml sample, plates containing less than 300 colonies were taken into account.
For the enumeration of yeasts and molds, the Sabouraud Chloramphenicol medium was used. It was distributed in the Petri dishes over the inoculum, and after solidification, incubation at 25°C for 3-5 days followed. The selected plates were the ones where the number of colonies was up to 200, taking into account both yeast colonies that are smooth, moist, raised or superficial and mold colonies that show abundant hyphal growth and may appear in different colors.
For the detection of Staphylococcus sp. in the juice samples, the standard ISO 6888-1:2021 method [31] was applied. The inoculum was dispersed in Petri dishes containing Baird-Parker agar medium and incubated for 24-48 hours at 37 °C. After 48 hours of incubation, specific colonies of staphylococci may be observed, which are shiny black with a narrow white border, surrounded by a clear halo.
Isolation and identification of Escherichia coli was performed according to ISO 16649-2:2007 [32], with slight modifications. 1 ml of each dilution of the juice sample was transferred to two sterile Petri dishes and then tryptone bile X-glucuronide (TBX) agar (~15 ml selective medium) precooled to 44-47 °C was poured. The solidified mixture was incubated at 44 °C for 24 hours, and the development of blue-green colonies was monitored.
After all incubation steps of bacteria, yeasts and molds, the obtained results were presented as log CFU/ml. All measurements were performed in triplicate.
3. Results
The 4 types of juices obtained after fermentation were monitored over 5 days of storage under refrigerated conditions.
3.1. pH Values Variation for the 4 Types of Blueberries Juices
According to Table 1, it can be seen that the control blueberries juice for L. Plantarum, NPM, is characterized by a pH value of 3.66 on the day before thermostation at 37°C, and then the pH registers an increase in value to 3.67 at M1 and to 3.86 at M2. Five days after opening and storage under refrigeration conditions, the pH increases slightly to a value of 3.93. The NP blueberries juice also registers an increase in pH from the day of L. plantarum seeding until post-fermentation time M1, because this bacterium ferments plant substrates at low pH values, contributing to the increase of the environment pH from approximately 3.5 to values around 4.0. After opening, with storage under refrigeration conditions, the pH remains almost constant from 3.94 at 3 days to 3.95 at 5 days.
In the case of the juices prepared for the kefir culture study, a decrease in pH value can be observed both in the case of the control and in the juice inoculated with kefir-specific strains. Thus, NCM records a decrease in pH value from 3.86 to 3.67 following the thermostatation operation at 24°C, reaching 3.65 after 5 days of opening and storage under refrigerated conditions. NC is characterized by the most pronounced decrease in pH value, from 3.93 on the day of inoculation to 3.65 after thermostatation and to 3.66 after 5 days of opening. The decrease in pH value is due to the dissociation of organic acids and the use of sugars by lactic bacteria of the kefir culture for the production of lactic acid, but also to the formation of carbon dioxide [33].
3.2. Refractive Indices Variation for the 4 Types of Blueberries Juices
The refractive index value increases on the day of thermostatation in the case of juices treated at 37°C, NPM and NP and then remains almost constant during the 5 days of post-opening storage under refrigerated conditions. Regarding the values recorded in the case of NCM and NC juices, the refractive index decreases almost constantly in the case of NC juice inoculated with kefir culture from moment M0 corresponding to thermostatation at 24°C until the fifth day after opening due to the fermentation phenomenon, but remains almost constant in the case of NCM juice from M0 until M3.

Table 2.
Refractive indices values of the blueberries juices at moments M0, M1, M2 si M3.
|
Bluberries juice code/ refractive index |
M0 | M1 | M2 | M3 |
| NPM | 1.3531±0.0002*a**,i*** | 1.3554±0.0002b,j | 1.3553±0.0002b,i | 1.3555±0.0002b,j |
| NP | 1.3542±0.0003a, j | 1.3553±0.0002b,j | 1.3552±0.0002b,i | 1.3551±0.0003b,ij |
| NC | 1.3554±0.0001b, l | 1.3552±0.0001a,ij | 1.3550±0.0002b,i | 1.3546±0.0003a,i |
| NCM | 1.3550±0.0002a, k | 1.3550±0.0002a,i | 1.3549±0.0003a,i | 1.3549±0.0004a,i |
*Data are expressed as mean standard deviation of triplicate samples. **Different letters a, b, c, d, in the same line indicate statistically significant differences at p = 95% according to Fisher’s LSD procedure for the refractive index at different moments. ***The letters i, j, k, l indicate the statistically significant differences at p = 95% between the data in column respective between the type of blueberries juice.
3.3. The Variation of the Ascorbic Acid (AA) Concentration for the 4 Types of Blueberries Juices
According to the previous table, the vitamin C content at M0, corresponding to the thermostation day, is equal for all 4 type of juices, with a value of 1.76 mg %. After thermostation, it decreases only in the case of NCM treated at 24°C. The vitamin C concentration decreases in the same proportion for NPM, NP and NC after 3 days after opening, reaching the same concentration with NCM, 1.32 mg %, which has remained constant since M1 moment.
Table 3.
Ascorbic acid (AA) concentration values of the blueberries juices at moments M0, M1, M2 si M3.
Table 3.
Ascorbic acid (AA) concentration values of the blueberries juices at moments M0, M1, M2 si M3.
|
Bluberries juice code/AA concen- tration, mg % |
M0 | M1 | M2 | M3 |
| NPM | 1.76±0.02*c**, i*** | 1.76±0.02 c, i | 1.32±0.02b, i | 0.88±0.03a, j |
| NP | 1.76±0.02b,i | 1.76±0.02b, i | 1.32±0.02a, i | 1.32±0.02 a. k |
| NCM | 1.76±0.02c,i | 1.32±0.03b, j | 1.32±0.03b, i | 0.44±0.02,a, i |
| NC | 1.76 ±0.02c, i | 1.76 ±0.02c, i | 1.32±0.03b, i | 1.32±0.01b, k |
* Data are expressed as mean standard deviation of triplicate samples. **Different letters a, b, c, d in the same line indicate statistically significant differences at p = 95% according to Fisher’s least significant difference (LSD) procedure for the AA concentration of juice at different moments. ***The letters i, j, k indicate the statistically significant differences at p = 95% between the data in column respective between the type of blueberries juice treatment.
At five days after opening - M3 moment, the highest concentration of vitamin C is recorded by the samples inoculated with the 2 cultures, kefir and L. plantarum, with a value of 1.32 mg %. This may be due to the reaction between pectin and functional components of the juices through hydrophobic or hydrogen bonds [34]. The control juices suffer a significant decrease in vitamin C concentration, reaching 0.88 mg % in the case of NPM or even 0.44 mg % in the case of NCM.
3.4. Antioxidant Activity Variation for the 4 Types of Blueberries Juices
The antioxidant activity values increase from M0 to M1, in the case of NP, NCM and NC juices. The highest antioxidant activity at M1 is recorded by the juice inoculated with kefir culture, of 56.77%, which starts from an activity of 40.88% at the moment before the thermostation operation at 24°C. For 3 days after opening, the NC juice remains with the highest antioxidant activity value, of 51.2%, which decreases to 40.66% five days after opening. For the juice inoclated with L. plantarum, the antioxidant activity remains quite high even after 5 days after opening, recording a value of 47.74%. The control juices present an antioxidant activity whose value is reduced quite drastically after 5-day storage in refrigeration.
Table 4.
Antioxidant activity (AA) as DPPH scavenging capacity of the blueberries juices at moments M0, M1, M2 si M3.
Table 4.
Antioxidant activity (AA) as DPPH scavenging capacity of the blueberries juices at moments M0, M1, M2 si M3.
|
Bluberries juice code/anti- oxidant activity, % |
M0 | M1 | M2 | M3 |
| NPM | 38.55±0.87*c*,* i*** | 34.33±1.10 b,i | 46.23±0.96d, i | 18.37±0.48a, j |
| NP | 38.40±0.92a,i | 51.20±0.49d,k | 48,64±0.69 c, j | 47.74±0.41b, l |
| NCM | 41.41±0.56b,j | 48.64±0.87c,j | 49.39±0.98c, j | 16.71±0.62 a, i |
| NC | 40.88 ±0.90 a,j | 56.77 ±0.68c,l | 51.20±0.63b, k | 40.66±0.58a, k |
* Data are expressed as mean standard deviation of triplicate samples. ** Different letters a, b, c, d, in the same line indicate statistically significant differences at p = 95% according to Fisher’s LSD procedure for the AA at different moments. *** The letters i, j, k, l indicate the statistically significant differences at p = 95% between the data in column respective between the type of blueberries juice.
3.5. The variation of the polyphenols concentration for the 4 types of blueberries juices
In the previous table, it can be observed a significant increase of the polyphenols content in all types of inoculated juices after the thermostation operation. This fact is due to the disintegration of macromolecular polyphenols into smaller phenolic compounds, possibly through deglycosylation [35]. 3 days after opening, the polyphenols content decreases to values close to the M0 moment. At 5 days after opening, the M3 moment, the values are similar to those at the M2 moment, the highest value of the polyphenols content being recorded by the juice inoculated with L. plantarum NP, of 132.63 mg EAG/100 ml juice, followed by NC of 130.74 mg EAG/100 ml juice.
Table 5.
Polyphenols concentration of the blueberries juices at moments M0, M1, M2 si M3, in mg equivalent gallic acid (EAG)/100 mL.
Table 5.
Polyphenols concentration of the blueberries juices at moments M0, M1, M2 si M3, in mg equivalent gallic acid (EAG)/100 mL.
|
Bluberries juice code/poly- phenols in mgEAG/100mL |
M0 | M1 | M2 | M3 |
| NPM | 125.61±1.02* b**, j*** | 127.41±1.18 b, i | 120.91±1.15a, j | 126.85±1.25 b, j |
| NP | 123.83±1.10 a, ij | 274.84±1.41 c, j | 122,72±1.25 a, j | 132.63±1.14 b, k |
| NCM | 123.74±1.31 c, i | 126.07±0.74 d, i | 114.34±1.35 a, i | 120.32±1.51 b, i |
| NC | 129.22 ±0.95 a, k | 275.83 ±1.48 c, j | 135.62±1.23 b, k | 130.74±1.08 a, k |
* Data are expressed as mean standard deviation of triplicate samples. ** Different letters a, b, c, d, in the same line indicate statistically significant differences at p = 95% according to Fisher’s LSD procedure for the polyphenols concentration at different moments. *** The letters i, j, k, l indicate the statistically significant differences at p = 95% between the data in column respective between the type of blueberries juice.
3.6. The Microbiological Determinations Results of the 4 Types of Blueberries Juices
3.7.1. Determination of the Total Number of Aerobic Mesophilic Bacteria
In order to highlight the microbiological evolution of the blueberries juices during the five days of refrigerated storage, the total number of aerobic mesophilic bacteria was determined. Thus, in Figure 1, the average values obtained, expressed as log CFU/mL, are presented.
Juices inoculated with L. plantarum and kefir cultures present a high number of aerobic mesophilic bacteria, with values ranging between 7.24-7.65 log CFU/mL on moment M0. Then these values decrease as storage progresses, due to their sensitivity to refrigeration conditions, reaching values of 6.27-6.55 log CFU/mL on day 5. The control juices do not show any viable microorganisms due to the pasteurization operation within their production flow during the first days. The slight growth observed after 3 and 5 days shows a weak contamination, possibly from the storage environment.
3.7.2. The Total Yeast and Mold Counts
The presence of yeasts and molds in the blueberries juices was determined in order to evaluate the microbiological quality, safety for consumption and shelf life of the products under refrigerated conditions. As a result of the juices pasteurization, a good efficiency of the process was found, with yeasts and molds being detected only on the fifth day of refrigeration storage and in a reduced number, both in the control samples and in the one inoculated with L. plantarum. In the case of the blueberry juice inoculated with kefir cultures, the analysis evaluated the microbiological behavior of the product during refrigeration, as well as the monitorization of the controlled fermentative activity of the introduced cultures.
The recorded values are expressed in log CFU/mL and are graphically represented in Figure 2.
The juice inoculated with kefir culture has a high number of yeasts and molds, which decrease with storage due to sensitivity to refrigeration conditions and to the phenolic composition of the juice. The microbial density decreased over the 5-days interval from 5.97 to 4.06 log CFU/mL. This reduction may limit the probiotic potential of the final product, indicating the need to adjust the fermentation conditions (e.g., higher temperature or addition of nutrients) to maintain high viability of the probiotic strains.
3.7.3. Detection of Staphylococcus sp. and Escherichia coli
During the microbiological analysis of the blueberries juices, specific tests were performed to detect the presence of pathogenic bacteria Staphylococcus sp. and Escherichia coli.
Thus, it was found that during the storage period of 5 days at 4°C, these bacteria were not detected, being a short interval for a possible significant proliferation of these microorganisms, especially in pasteurized acidic juices.
4. Discussion
The control juice and the one inoculated with L. plantarum subjected to the thermostating operation at 37 °C recorded a slight increase in pH, due to the fermentation conditions of this microorganism, but also the maintenance of almost constant pH values during the storage period. Instead, the control juice and the one inoculated with the kefir culture thermostated at 24 °C, showed a decrease in the pH values due to the resulting acids and the carbon dioxide [33].
The refractive index values increased in the case of the juices intended for inoculation with L. Plantarum, NPM and NP, from M0 moment to M1 moment, due to the fermentation operation at 37°C. This process is accompanied by exopolysaccharides generation [36], an increase in the content of B vitamins [37,38] and mineral salts, through the decomposition of mineral-polyphenol compounds [39], but also by hydrolysis processes with water consumption, which lead to the concentration of the products and thus to higher valuesof the refractive index [13]. Then, during the refrigeration storage, the refractive index values of these types of juice remained almost constant. In the case of the juices studied for the kefir cultures, the refractive index decreased slightly due to the fermentation process and the binding of sugars to anthocyanidins (malvidin) with the generation of anthocyanins [40], and then remained almost constant.
After the fermentation process, the polyphenol content increased remarkably: in the case of NP juice, it recorded the highest increase of 2.22 times at M1 compared to M0, and for NC, 2.13 times at M1 compared to M0. The significant increase of the polyphenol content is also correlated with other studies [2,41,42,43,44,45,46], the changes in the phenolic compounds being generated by the glucosidase produced by lactic bacteria, which led to phenolic metabolism and their release.
Also, the fermentation process produced by lactic bacteria led to a significant increase in the antioxidant activity in the case of the juices inoculated with the 2 studied strains. Thus, in the case of NP juice, there is a 33.33% increase in the antioxidant activity of M1moment compared to M0, and in the case of NC juice this increase is even about 38.86% at the moment M1 compared to M0. This increase in the antioxidant activity is also found in other studies [47,48], according to which the radical scavenging abilities of the blueberries juices were significantly improved by the inoculation of lactic bacteria due to structure and compositions of these bacteria or their metabolites; also, antioxidant activities of phenolic compounds and anthocyanin have been specified, because these compounds could break the chain reaction of free radicals by transporting hydrogen atoms, or chelating metal ions through passing a single electron. Also, the antioxidant activity values remained the highest for the 2 juices inoculated with lactic acid strains during the refrigerated storage period, recording after 5 days quite high values of 47.74% for NP and 40.66% for NC, which also presented the highest values of vitamin C concentration, of 1.32 mg%.
The microbiological characteristics of the analyzed juices are favorable, this being due to both the effect of pasteurization and the natural properties of blueberry juice.
The research of Nualkaekul et al. 2011 [49], shows that L. plantarum inoculated to fruit juices survives excellently at 4 °C, with a modest decrease in viability over several weeks. Thus, in the case of the blueberries juice with L. plantarum addition a decrease in cell viability of ~0.5–1 log over 5 days is normal [50].
The initial value of 7.65 log CFU/mL and the decline to 6.55 log CFU/mL on moment M3 indicated the survival of L. plantarum under cold storage. Also, in the case of the blueberries juice inoculated with kefir, values ranged between 7.24-6.27 log CFU/mL over the same period. This aspect is beneficial for the analyzed juices, because other studies [51,52,53] also mentioned that maintaining a concentration above 6 log CFU/mL is recommended to ensure the probiotic effect, as well as to confer a biopreservation effect, through mechanisms such as acidification and competition against undesirable microflora.
In pasteurized juices case, yeasts/molds are usually below the detection limit immediately after the treatment [54]. If there is a minimal contamination during storage after opening the containers, yeasts remain undetectable until around day 3 and can slowly reach ~0.5–1 log CFU/mL by day 5 [55]. This fact was also observed in the samples analyzed as a control, respectively with the addition of L. plantarum. For the juice with kefir inoculation, the yeasts gradually decreased at 4 °C, with a modest decline of ~0.5–1 log in the first five days, a fact also indicated by the research of Fan et al.,2018 [56], whose study took place for several weeks. Usually, in acidic environment and under refrigeration temperatures, molds are not significantly evident in the first 5 days.
Regarding the presence of pathogenic bacteria, various fruit juices heat-treated and stored at 4 °C, showed undetectable levels of E. coli and S. aureus immediately after pasteurization and maintained this level for up to 7 days [57]. Blueberries juices have naturally an acidic pH which, together with the heat treatment, leads to the complete inactivation of vegetative bacteria, including S. aureus and E. coli, immediately after their processing [58], this being also observed in the analyzed samples. An analysis of the effect of the phenolic fractions from blueberries demonstrated that residual extracts actively inhibit E. coli O157:H7 and S. aureus in liquid media [59], suggesting that the growth of these pathogens remains strongly inhibited.
5. Conclusions
The purpose of these 4 types of juices analysis was to evaluate if the addition of lactic microorganisms cultures can lead to the production of plant origin fermented juices, with optimal characteristics of symbiotic products. These juices contained also the prebiotics represented by the carbohydrates of the blueberry juice in addition to the added probiotics. The behavior of these functional products was also evaluated during a refrigeration storage of 5 days. The both symbiotic juices present optimal physicochemical and microbiological characteristics and can be considered for further industrial production.
Author Contributions
Conceptualization, A.D. and L.G.; methodology, A.D., Z.V., C.M.; software, C.M.; validation, A.D., C.M. and L.G.; formal analysis, L.M.; investigation, A.D., Z.V., C.M.; resources, L.M.; data curation, A.D., C.M.,Z.V.; writing—original draft preparation, A.D, L.M.; writing—review and editing, A.D., Z.V., L.G.; visualization, C.M., L.M.; supervision, A.D., L.G.
Data Availability Statement
The original contributions presented in the study are included in the article material; further inquiries can be directed to the corresponding author.
Acknowledgments
The authors acknowledge to Technical University of Cluj Napoca, North University Center of Baia Mare, and to Bluettes Saveur blueberries plantation from Satu Mare, Romania for the material base provided.
Conflicts of Interest
The authors declare no conflicts of interest.
References
- Tobar-Bolaños, G.; Casas-Forero, N.; Orellana-Palma, P.; Petzold, G. Blueberry juice: Bioactive compounds, health impact, and concentration technologies—A review. J. Food Sci. 2021, 86, 5062–5077. [Google Scholar] [CrossRef]
- Zhang, Y.; Liu, W.; Wei, Z.; Yin, B.; Man, C.; Jiang, Y. Enhancement of functional characteristics of blueberry juice fermented by Lactobacillus plantarum. LWT 2021, 139, 110590. [Google Scholar] [CrossRef]
- Zhang, Q.; Zang, H.; Guo, X.; Li, S.; Xin, X.; Li, Y. A systematic study on composition and antioxidant of 6 varieties of highbush blueberries by 3 soil matrixes in China. Food Chem. 2025, 472, 142974. [Google Scholar] [CrossRef]
- Shinwari, K.J.; Rao, P.S. Stability of bioactive compounds in fruit jam and jelly during processing and storage: A review. Trends Food Sci. Technol. 2018, 75, 181–193. [Google Scholar] [CrossRef]
- Lavefve, L.; Howard, L.R.; Carbonero, F. Berry polyphenols metabolism and impact on human gut microbiota and health. Food Funct. 2020, 11, 45–65. [Google Scholar] [CrossRef]
- Pertuzatti, P.B.; Hermosín-Gutiérrez, I.; Godoy, H.T. Blueberries: Market, Cultivars, Chemical Composition and Antioxidant Capacity. In Blueberries: Harvesting Methods, Antioxidant Properties and Health Effects; Marsh, M., Ed.; Nova Science Publishers: New York, NY, USA, 2016; pp. 1–30. [Google Scholar]
- Silva, S.; Costa, E.M.; Veiga, M.; Morais, R.M.; Calhau, C.; Pintado, M. Health promoting properties of blueberry: A review. Crit. Rev. Food Sci. Nutr. 2020, 60, 181–200. [Google Scholar] [CrossRef] [PubMed]
- Duan, Y.; Tarafdar, A.; Chaurasia, D.; Singh, A.; Bhargava, P.C.; Yang, J.; Li, Z.; Ni, X.; Tian, Y.; Li, H.; et al. Blueberry Fruit Valorization and Valuable Constituents: A Review. Int. J. Food Microbiol. 2022, 381, 109890. [Google Scholar] [CrossRef] [PubMed]
- Wu, Y.Q.; Han, T.Y.; Yang, H.; Lyu, L.F.; Li, W.L.; Wu, W.L. Known and potential health benefits and mechanisms of blueberry anthocyanins: A review. Food Biosci. 2023, 55, 103050. [Google Scholar] [CrossRef]
- Liu, M.; Zhang, A.; Yu, H.; Zeng, Q.; Liu, X. Postharvest application of ultraviolet-A and blue light irradiations boosted the accumulation of acetylated anthocyanins in the blueberry fruit and its potential regulatory mechanisms. Postharvest Biology and Technology. 2025, 222. [Google Scholar] [CrossRef]
- Yan, Y.; Zhang, F.; Chai, Z.; Liu, M.; Battino, M.; Meng, X. Mixed fermentation of blueberry pomace with L. rhamnosus GG and L. plantarum-1: Enhance the active ingredient, antioxidant activity and health-promoting benefits. Food Chem. Toxicol. 2019, 131, 110541. [Google Scholar] [CrossRef]
- Nunes, S.; Viana, S.; Rolo, A.; Palmeira, C.; André, A.; Cavadas, C.; Pintado, M.; Reis, F. Blueberry juice as a nutraceutical approach to prevent prediabetes progression in an animal model: Focus on hepatic steatosis. Eur. J. Public Health 2019, 29, ckz034-011. [Google Scholar] [CrossRef]
- Saud, S.; Xiaojuan, T.; Fahad, S. The Consequences of Fermentation Metabolism on the Qualitative Qualities and Biological Activity of Fermented Fruit and Vegetable Juices. Food Chem. X 2024, 21, 101209. [Google Scholar] [CrossRef]
- Paramithiotis, S.; Das, G.; Shin, H.-S.; Patra, J.K. Fate of Bioactive Compounds during Lactic Acid Fermentation of Fruits and Vegetables. Foods 2022, 11, 733. [Google Scholar] [CrossRef]
- Küçükgöz, K.; Trząskowska, M. Nondairy probiotic products: Functional foods that require more attention. Nutrients 2022, 14, 753. [Google Scholar] [CrossRef]
- Chiou, S.Y.; Sung, J.M.; Huang, P.W.; Lin, S.D. Antioxidant, antidiabetic, and antihypertensive properties of Echinacea purpurea flower extract and caffeic acid derivatives using in vitro models. J. Med. Food 2017, 20, 171–179. [Google Scholar] [CrossRef] [PubMed]
- Yuan, X.; Wang, T.; Sun, L.; Qiao, Z.; Pan, H.; Zhong, Y.; Zhuang, Y. Recent advances of fermented fruits: A review on strains, fermentation strategies, and functional activities. Food Chem X 2024, 22, 101482. [Google Scholar] [CrossRef] [PubMed]
- Cai W., Tang F., Zhao X., Guo Z., Zhang Z., Dong Y., Shan C. Different lactic acid bacteria strains affecting the flavor profile of fermented jujube juice. J. Food Process. Preserv. 2019, 43, e14095.
- Feng, T.; Cai, W.; Sun, W.; Yu, S.; Cao, J.; Sun, M.; Wang, H.; Yu, C.; Kang, W.; Yao, L. Co-Cultivation effects of Lactobacillus plantarum and Pichia pastoris on the key aroma components and non-volatile metabolites in fermented jujube juice. RSC Adv. 2025, 15, 10653–10662. [Google Scholar] [CrossRef]
- Zhong, H.; Deng, L.; Zhao, M.; Tang, J.; Liu, T.; Zhang, H.; Feng, F. Probiotic-Fermented Blueberry Juice Prevents Obesity and Hyperglycemia in High Fat Diet-Fed Mice in Association with Modulating the Gut Microbiota. Food Funct. 2020, 11, 9192–9207. [Google Scholar] [CrossRef]
- Wen, J.; Ma, L.; Xu, Y.; Wu, J.; Li, L. Effects of probiotic litchi juice on immunomodulatory function and gut microbiota in mice. Food Res. Int. 2020, 137, 109433. [Google Scholar] [CrossRef] [PubMed]
- Wang, X.; Wang, Y.; Han, M.; Liang, J.; Zhang, M.; Bai, X.; Yue, T.; Gao, Z. Evaluating the changes in phytochemical composition, hypoglycemic effect, and influence on mice intestinal microbiota of fermented apple juice. Food Res. Int. 2022, 155, 110998. [Google Scholar] [CrossRef] [PubMed]
- International Federation of Fruit Juice Producers (IFU). Methods of Analysis; IFU: Zurich, Switzerland, 2005. [Google Scholar]
- Varga, C.; Peter, A.; Ambrus, A.; Dunca, I. Practical Biochemistry Exercises. Part II; Risoprint Publishing House: Cluj-Napoca, Romania, 2004. [Google Scholar]
- Tongnuanchan, P.; Benjakul, S.; Prodpran, T. Properties and antioxidant activity of fish skin gelatin film incorporated with citrus essential oils. Food Chem. 2012, 134, 1571–1579. [Google Scholar] [CrossRef] [PubMed]
- Singleton, V.L.; Orthofer, R.; Lamuela-Raventos, R.M. Analysis of total phenols and other oxidation substrates and antioxidants by means of Folin-Ciocalteu reagent. Method Enzymol. 1999, 299, 152–178. [Google Scholar]
- Bunea, A.; Rugină, D.O.; Pintea, A.M.; Sconţa, Z.; Bunea, C.I.; Socaciu, C. Comparative Polyphenolic Content and Antioxidant Activities of Some Wild and Cultivated Blueberries from Romania. Not. Bot. Horti Agrobo. 2011, 39, 70–76. [Google Scholar] [CrossRef]
- Desiderio, F.; Szilagyi, S.; Békefi, Z.; Boronkay, G.; Usenik, V.; Milić, B.; Mihali, C.; Giurgiulescu, L. Polyphenolic and fruit colorimetric analysis of Hungarian sour cherry genebank accessions. Agriculture 2023, 13, 1287. [Google Scholar] [CrossRef]
- International Organization for Standardization. Microbiology of the Food Chain—Horizontal Method for the Enumeration of Microorganisms—Part 1: Colony Count at 30 Degrees C by the Pour Plate Technique; ISO 4833-1:2013; ISO: Geneva, Switzerland, 2013. [Google Scholar]
- International Organization for Standardization. Microbiology of Food and Animal Feeding Stuffs—Horizontal Method for the Enumeration of Yeasts and Moulds—Part 1: Colony Count Technique in Products with Water Activity Greater than 0.95; ISO 21527-1:2008; ISO: Geneva, Switzerland, 2008. [Google Scholar]
- International Organization for Standardization. Microbiology of the Food Chain—Horizontal Method for the Enumeration of Coagulase-Positive Staphylococci (Staphylococcus aureus and Other Species)—Part 1: Method Using Baird-Parker Agar Medium; ISO 6888-1:2021; ISO: Geneva, Switzerland, 2021. [Google Scholar]
- International Organization for Standardization. Microbiology of Food and Animal Feeding Stuffs—Horizontal Method for the Detection and Enumeration of Escherichia coli β-Glucuronidase Positive; ISO 16649-2:2007; ISO: Geneva, Switzerland, 2007. [Google Scholar]
- Khouryieh, H.A.; Aramouni, F.M.; Herald, T.J. Physical, Chemical and Sensory Properties of Sugar-Free Jelly. J. Food Qual. 2005, 28, 179–190. [Google Scholar] [CrossRef]
- Kaunsar, J. S.; Pavuluri, S. R. Stability of bioactive compounds in fruit jam and jelly during processing and storage: A review. Trends Food Sci. Technol. 2018, 75, 181–193. [Google Scholar] [CrossRef]
- Kwaw, E.; Ma, Y.; Tchabo, W.; Apaliya, M. T.; Xiao, L.; Li, X. Effect of fermentation parameters and their optimization on the phytochemical properties of lactic-acid-fermented mulberry juice. J. Food Meas. Charact. 2017, 11(3), 1462–1473. [Google Scholar] [CrossRef]
- Chen, H.; Xiao, G.; Xu, Y.; Yu, Y.; Wu, J.; Zou, B. High hydrostatic pressure and co-fermentation by Lactobacillus rhamnosus and gluconacetobacter xylinus improve flavor of yacon-litchi-longan juice. Foods 2019, 8, 308. [Google Scholar] [CrossRef] [PubMed]
- Presti, I.; D’Orazio, G.; Labra, M.; La Ferla, B.; Mezzasalma, V.; Bizzaro, G.; Giardina, S.; Michelotti, A.; Tursi, F.; Vassallo, M.; Di Gennaro, P. Evaluation of the probiotic properties of new Lactobacillus and Bifidobacterium strains and their in vitro effect. Appl. Microbiol. Biotechnol. 2015, 99, 5613–5626. [Google Scholar] [CrossRef]
- Kaprasob, R.; Kerdchoechuen, O.; Laohakunjit, N.; Somboonpanyakul, P. B Vitamins and prebiotic fructooligosaccharides of cashew apple fermented with probiotic strains Lactobacillus spp., Leuconostoc mesenteroides and Bifidobacterium longum. Process Biochem. 2018, 70, 9–19. [Google Scholar] [CrossRef]
- Sevindik, O.; Guclu, G.; Agirman, B.; Selli, S.; Kadiroglu, P.; Bordiga, M.; Capanoglu, E.; Kelebek, H. Impacts of selected lactic acid bacteria strains on the aroma and bioactive compositions of fermented gilaburu (Viburnum opulus) juices. Food Chem. 2022, 378, 132079. [Google Scholar] [CrossRef] [PubMed]
- Zhang, J.; Li, D.; Tian, Q.; Ding, Y.; Jiang, H.; Xin, G.; Cheng, S.; Tang, S.; Jin, C.; Tian, J.; Li, B. The Effect of kiwi berry (Actinidia arguta) on preventing and alleviating loperamide-induced constipation. Food Innov. Adv. 2023, 1, 1–8. [Google Scholar] [CrossRef]
- Madeira Junior, J.V.; Teixeira, C.B.; Macedo, G.A. Biotransformation and Bioconversion of Phenolic Compounds Obtainment: An Overview. Crit. Rev. Biotechnol. 2015, 35, 75–81. [Google Scholar] [CrossRef] [PubMed]
- Zhou, Y.; Wang, R.; Zhang, Y.; Yang, Y.; Sun, X.; Zhang, Q.; Yang, N. Biotransformation of phenolics and metabolites and the change in antioxidant activity in kiwifruit induced by Lactobacillus plantarum fermentation. J. Sci. Food Agric. 2020, 100, 3283–3290. [Google Scholar] [CrossRef] [PubMed]
- Muhialdin, B.J.; Meor Hussin, A.S.; Kadum, H.; Abdul Hamid, A.; Jaafar, A.H. Metabolomic Changes and biological activities during the lacto-fermentation of jackfruit juice using Lactobacillus casei ATCC334. LWT–Food Sci. Technol. 2021, 141, 110940. [Google Scholar] [CrossRef]
- Melini, F.; Melini, V. Impact of fermentation on phenolic compounds and antioxidant capacity of quinoa. Fermentation 2021, 7, 20. [Google Scholar] [CrossRef]
- Yang, F.; Chen, C.; Ni, D.; Yang, Y.; Tian, J.; Li, Y.; Chen, S.; Ye, X.; Wang, L. Effects of Fermentation on Bioactivity and the Composition of Polyphenols Contained in Polyphenol-Rich Foods: A Review. Foods 2023, 12, 3315. [Google Scholar] [CrossRef]
- Shi, F.; Wang, L.; Li, S. Enhancement in the physicochemical properties, antioxidant activity, volatile compounds, and non-volatile compounds of watermelon juices through Lactobacillus plantarum JHT78 fermentation. Food Chem. 2023, 420, 136146. [Google Scholar] [CrossRef]
- Cheng, Y.; Wu, T.; Chu, X.; Tang, S.; Cao, W.; Liang, F.; Fang, Y.; Pan, S.; Xu, X. Fermented blueberry pomace with antioxidant properties improves fecal microbiota community structure and short chain fatty acids production in an in vitro mode. LWT 2020, 125, 109260. [Google Scholar] [CrossRef]
- Martin-Gomez, J.; Varo, M.A.; Merida, J.; Serratosa, M.P. Influence of drying processes on anthocyanin profiles, total phenolic compounds and antioxidant activities of blueberry (Vaccinium corymbosum). LWT–Food Sci. Technol. 2020, 120, 108897. [Google Scholar] [CrossRef]
- Nualkaekul, S.; Charalampopoulos, D. Survival of Lactobacillus plantarum in model solutions and fruit juices. Int. J. Food Microbiol. 2011, 146, 111–117. [Google Scholar] [CrossRef]
- Plessas, S. Advancements in the use of fermented fruit juices by lactic acid bacteria as functional foods: Prospects and challenges of Lactiplantibacillus (Lpb.) plantarum subsp. plantarum application. Fermentation 2022, 8, 6. [Google Scholar] [CrossRef]
- Rizzi, F.; Juan, B.; Espadaler-Mazo, J.; Capellas, M.; Huedo, P. Lactiplantibacillus plantarum KABP051: Stability in fruit juices and production of bioactive compounds during their fermentation. Foods 2024, 13, 3851. [Google Scholar] [CrossRef]
- Rahman, M.S.; Emon, D.D.; Toma, M.A.; Nupur, A.H.; Karmoker, P.; Iqbal, A.; Aziz, M.G.; Alim, M.A. Recent advances in probiotication of fruit and vegetable juices. J. Adv. Vet. Anim. Res. 2023, 10, 522–537. [Google Scholar] [CrossRef]
- Maia, M.S.; Domingos, M.M.; de São José, J.F.B. Viability of probiotic microorganisms and the effect of their addition to fruit and vegetable juices. Microorganisms 2023, 11, 1335. [Google Scholar] [CrossRef]
- Mandha, J.; Shumoy, H.; Matemu, A.O.; Raes, K. Characterization of fruit juices and effect of pasteurization and storage conditions on their microbial, physicochemical, and nutritional quality. Food Biosci. 2023, 51, 102335. [Google Scholar] [CrossRef]
- Tournas, V.H.; Heeres, J.; Burgess, L. Moulds and yeast in fruit salads and fruit juices. Food Microbiol. 2006, 23, 684–688. [Google Scholar] [CrossRef]
- Fan, L.; Martynenko, A.; Doucette, C.; Hughes, T.; Fillmore, S. Microbial quality and shelf life of blueberry purée developed using cavitation technology. J. Food Sci. 2018, 83, 732–739. [Google Scholar] [CrossRef] [PubMed]
- Dong, P.; Zhou, B.; Zou, H.; Wang, Y.; Liao, X.; Hu, X.; Zhang, Y. High pressure homogenization inactivation of Escherichia coli and Staphylococcus aureus in phosphate buffered saline, milk and apple juice. Lett. Appl. Microbiol. 2021, 73, 159–167. [Google Scholar] [CrossRef] [PubMed]
- Pérez-Lavalle, L.; Carrasco, E.; Valero, A. Strategies for microbial decontamination of fresh blueberries and derived products. Foods 2020, 9, 1558. [Google Scholar] [CrossRef] [PubMed]
- Lacombe, A.; Wu, V.C.; White, J.; Tadepalli, S.; Andre, E.E. The Antimicrobial properties of the lowbush blueberry (Vaccinium angustifolium) fractional components against foodborne pathogens and the conservation of probiotic Lactobacillus rhamnosus. Food Microbiol. 2012, 30, 124–131. [Google Scholar] [CrossRef] [PubMed]
Figure 1.
Evolution of the total number of mesophilic aerobic bacteria (log CFU/mL) in the blueberries juices during the 5 days of storage.
Figure 1.
Evolution of the total number of mesophilic aerobic bacteria (log CFU/mL) in the blueberries juices during the 5 days of storage.
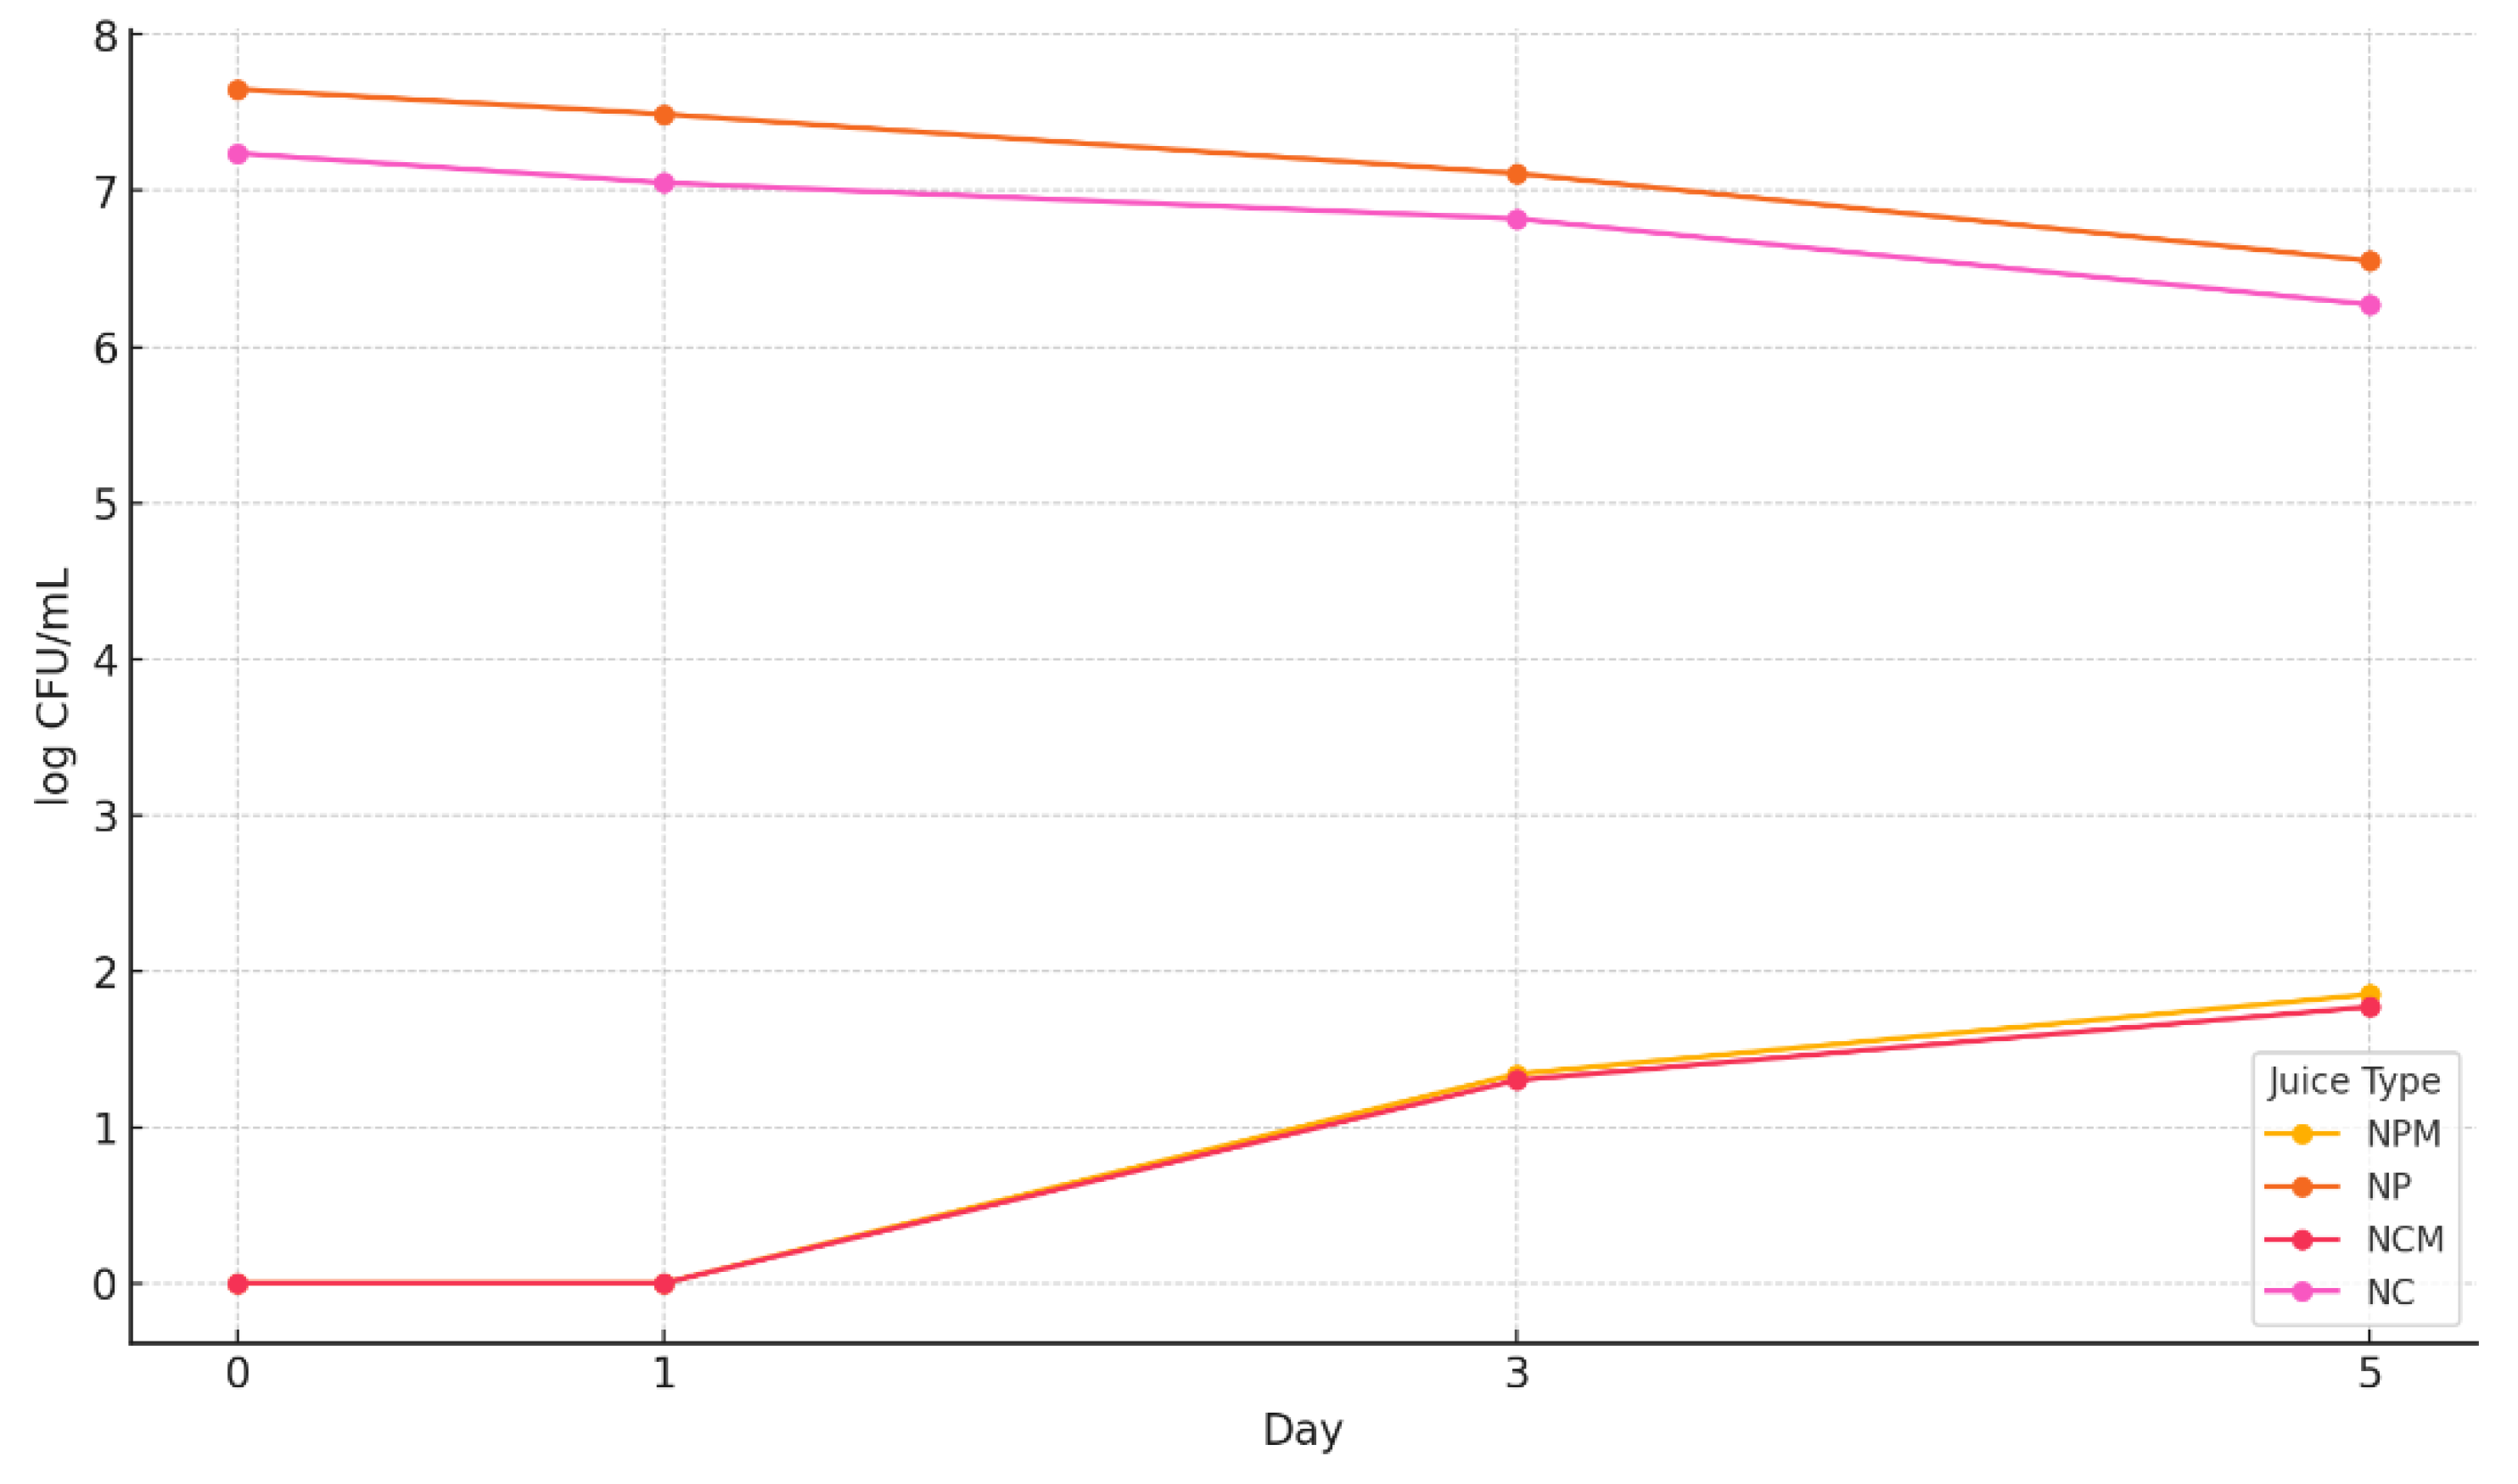
Figure 2.
Yeasts and molds evolution (log CFU/mL) in the blueberries juices during the 5 days of storage.
Figure 2.
Yeasts and molds evolution (log CFU/mL) in the blueberries juices during the 5 days of storage.
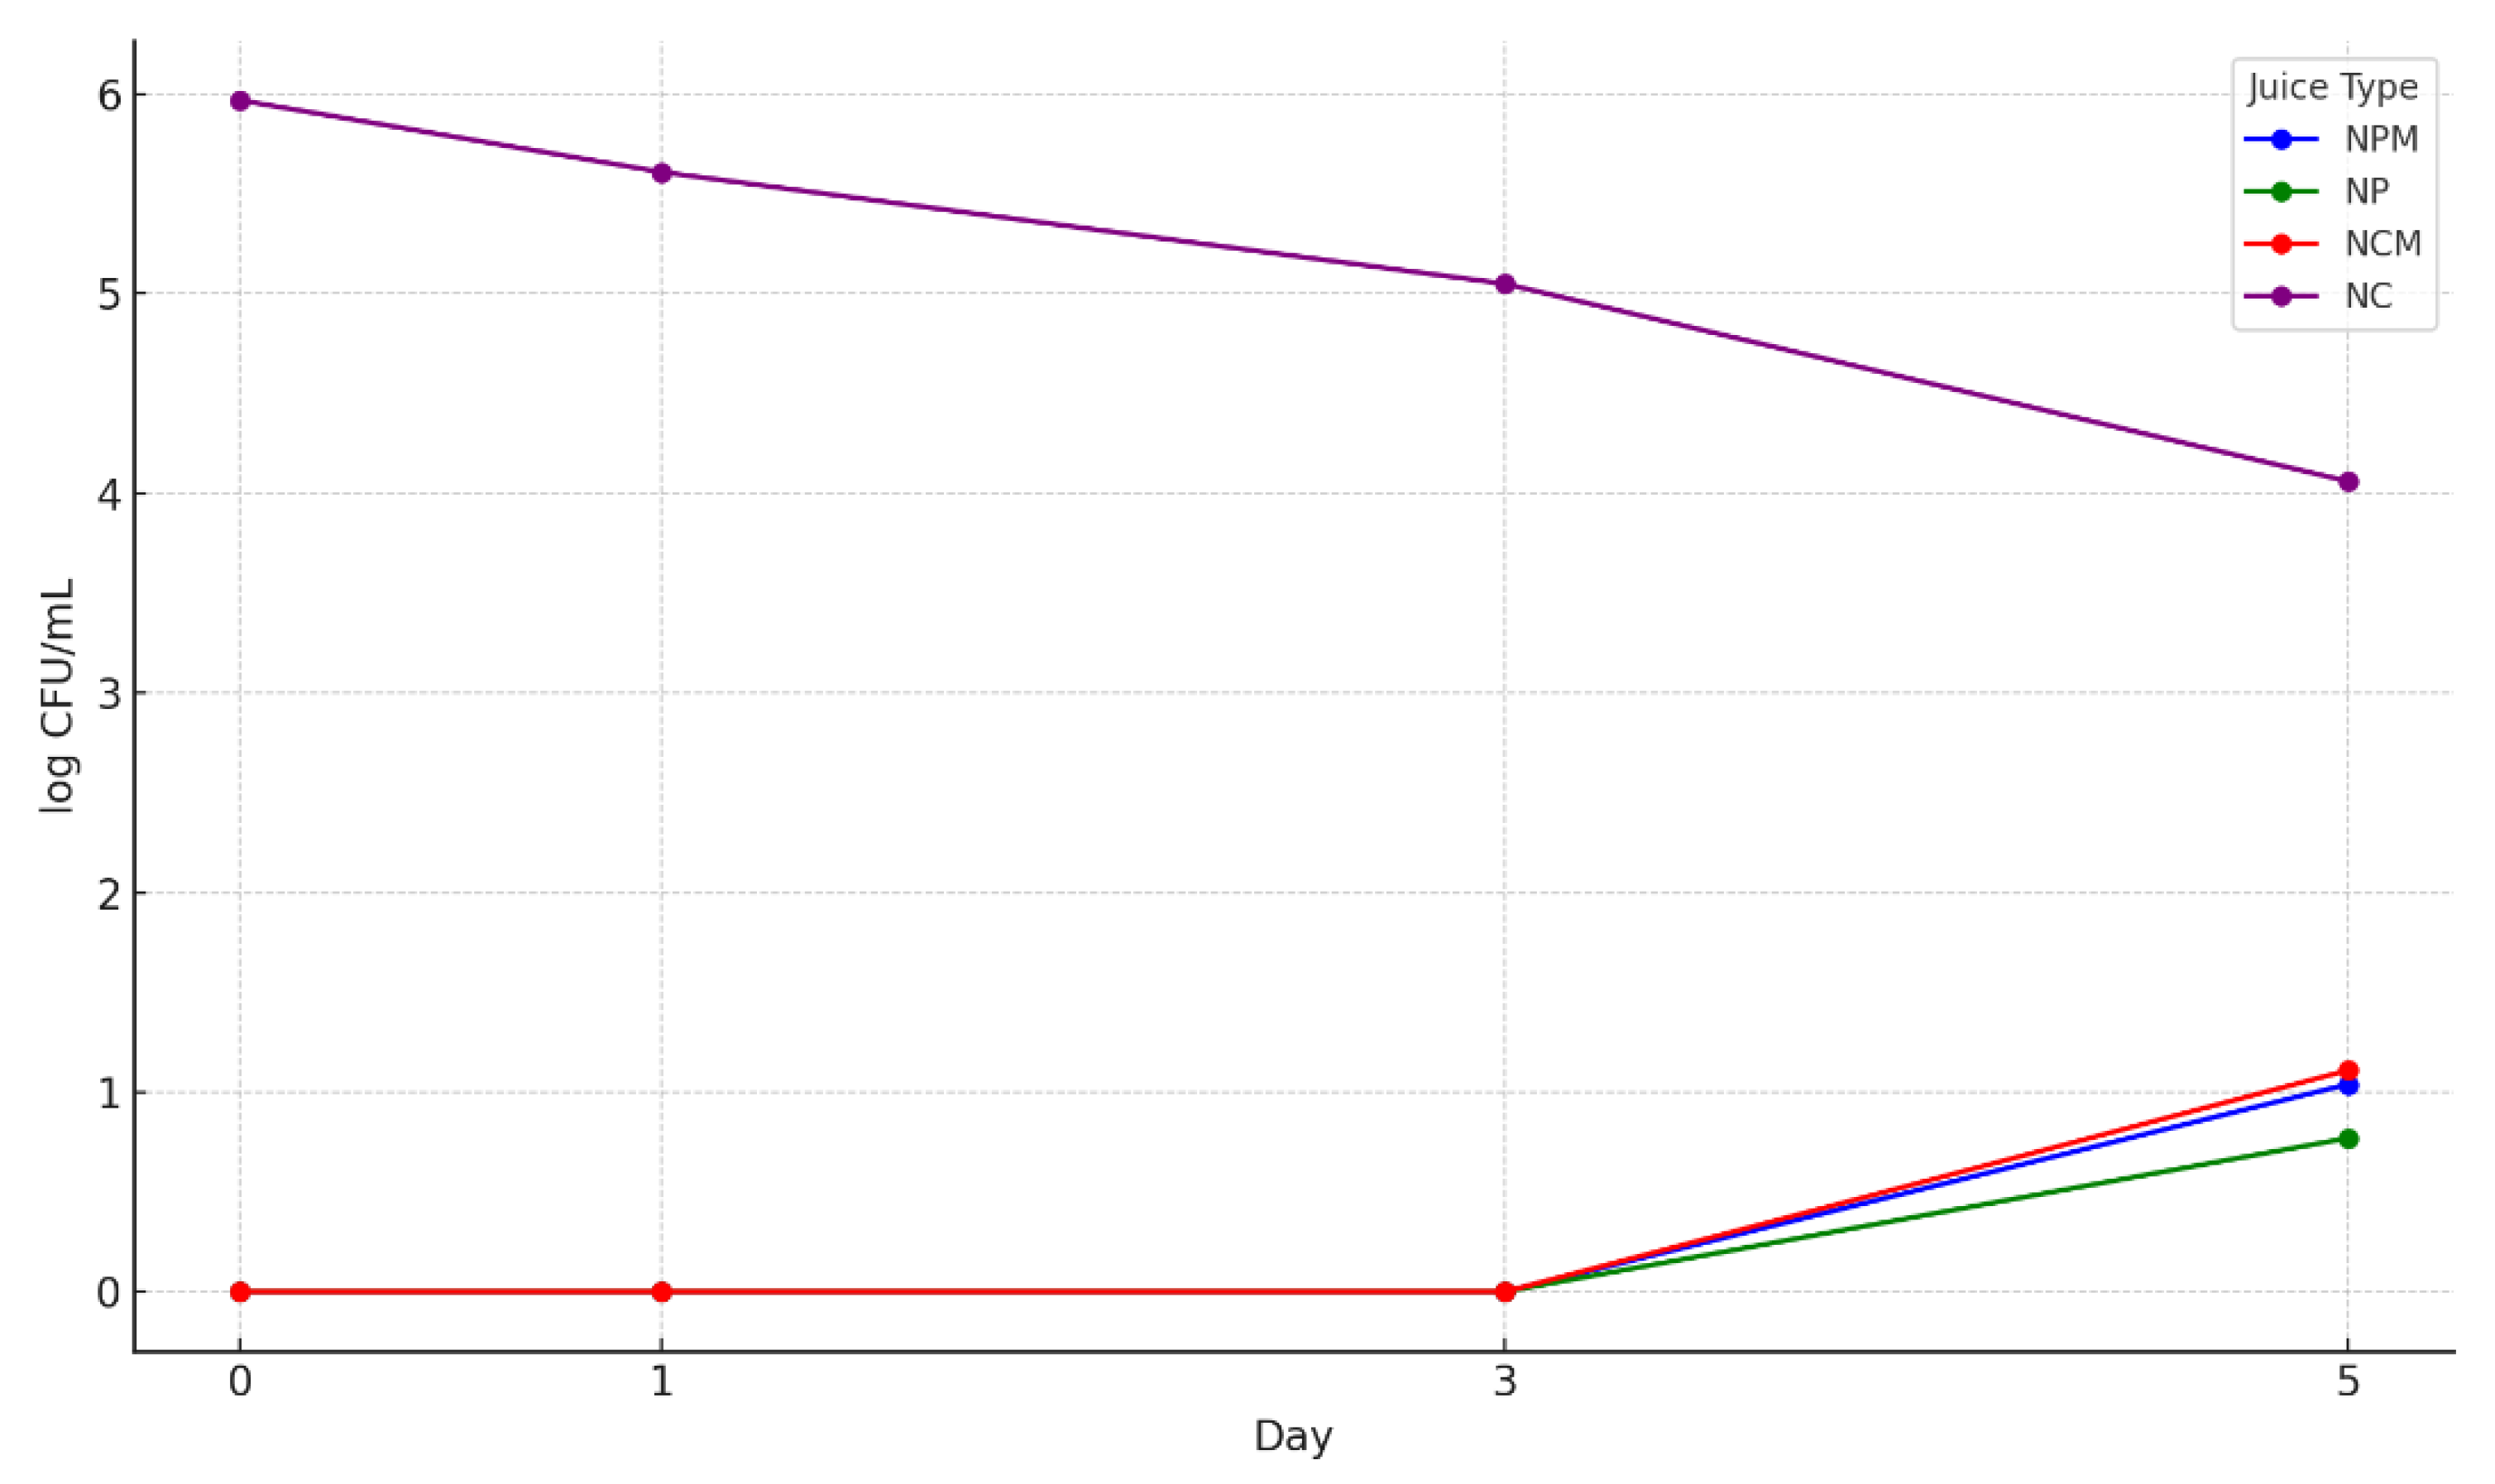
Table 1.
pH values of the blueberries juices at M0, M1, M2 si M3.
| Bluberries juice code/pH | M0 | M1 | M2 | M3 |
| NPM | 3.66±0.01*a**, i*** | 3.67±0.02c, i | 3.86±0.02c,j | 3.93±0.03b, j |
| NP | 3.67±0.01 a,i | 3.94±0.02b,j | 3,94±0.03b,k | 3.95±0.02b,j |
| NCM | 3.86±0.02 b,j | 3.67±0.03a, i | 3.64±0.03a,i | 3.65±0.02a, i |
| NC | 3.93 ±0.02 b,k | 3.65 ±0.02a,i | 3.65±0.02a,i | 3.66±0.03a, i |
*Data are expressed as mean and standard deviation of triplicate samples. **Different letters a, b, c, d, in the same line indicate statistically significant differences at p = 95% according to Fisher’s least significant difference (LSD) procedure for the pH indicator at different moments. ***The letters i,j,k indicate the statistically significant differences at p = 95% between the data in column respective between the variant (type) of blueberries juices.
Disclaimer/Publisher’s Note: The statements, opinions and data contained in all publications are solely those of the individual author(s) and contributor(s) and not of MDPI and/or the editor(s). MDPI and/or the editor(s) disclaim responsibility for any injury to people or property resulting from any ideas, methods, instructions or products referred to in the content. |
© 2025 by the authors. Licensee MDPI, Basel, Switzerland. This article is an open access article distributed under the terms and conditions of the Creative Commons Attribution (CC BY) license (http://creativecommons.org/licenses/by/4.0/).
Copyright: This open access article is published under a Creative Commons CC BY 4.0 license, which permit the free download, distribution, and reuse, provided that the author and preprint are cited in any reuse.


