
Submitted:
11 August 2025
Posted:
27 August 2025
You are already at the latest version
Abstract
Tropical cyclone Wipha brought destructive winds to Hong Kong in July 2025, resulting in many injuries and substantial property damage. Wipha posed considerable challenges for warning services because of (1) the high sensitivity of local wind strength to track errors given its relatively small size and proximity to Hong Kong; (2) uncertainty in the intensification of typhoon intensity during approach; and (3) rapid intensification occurring close to the territory.In this study, we examined the observational and forecasting aspects of Wipha from an operational warning perspective. Multiplatform observations, including lightning detection, satellite imagery, and Doppler LiDAR, confirmed the rapid intensification phase of Wipha near Hong Kong. Numerical experiments revealed that only the atmosphere–ocean–wave coupled model accurately predicted this intensity change, which was attributable to improved initial and lateral boundary conditions in addition to its air–sea interactions. These findings provide a historical reference for tropical cyclone warning services in Hong Kong and practical insights for meteorological authorities operating similar warning services in coastal regions worldwide.
Keywords:
tropical cyclone
; NWP
; AI
Introduction
The Hong Kong Observatory (HKO) began providing tropical cyclone (TC) warning services to the local public in 1884 and introduced its first numbered signal system in 1917. Over the last hundred years, signal systems have been modified several times (Lui et al., 2018). Currently, the highest signal in this system is the Hurricane Signal No. 10, which indicates or forecasts the occurrence of hurricane-force winds, that is, wind speeds ≥ 32.8 m/s (64 knots), near sea level anywhere in Hong Kong. Since hurricane-force winds are largely confined to a relatively narrow strip around the eyewall of a TC, they typically requires a TC with typhoon intensity, with maximum sustained winds of 32.8–41.6 m/s (64–80 knots) (Supplementary Table 1) or above to pass within 100 km of Hong Kong. This is commonly referred to as a ‘direct hit’. Despite an average of approximately 15 typhoons forming annually over the South China Sea (SCS) and western North Pacific (WNP), only a dozen have directly hit Hong Kong, given the city's small size along the long coastline of eastern Asia. Since 1946, only 18 TCs necessitated the issuance of the Signal No. 10, including Typhoon Wipha (international ID number: 2506) in July 2025.
Although Wipha only reached typhoon intensity, its impact on Hong Kong in terms of wind strength recorded at various stations within the territory was comparable to that of Super Typhoon Saola in 2023 (HKO, 2024; Chan et al., 2024a). A critical point in operating the TC warning signal for Wipha was its rapid intensification (RI) when approaching Hong Kong. The intensity was estimated at approximately 26 m/s (50 knots) at 00 UTC (8 am local time, with Hong Kong time = UTC + 8 h) on 19 July 2025 intensifying to around 39 m/s (75 knots) between 00 and 03 UTC on 20 July 2025 when Wipha was located approximately 50–60 km to the south of HKO Headquarters. This represents an increase of approximately 10–13 m/s (20–25 knots) in 24 h. Determination of the maximum wind strength of Wipha is not straightforward in the northern part of the SCS due to (1) the availability of a limited amount of surface observations only, including wind and pressure, from buoys, oil rigs, ships and island stations; (2) difficulty in determining the maximum Doppler velocity from the weather radars by unfolding the radial velocity because of the various contaminations of the radar signal, particularly due to high sea waves associated with the extremely strong winds; and (3) applicability of Dvorak analysis based on meteorological satellite images to determine the maximum wind strength at a coastal zone in south China coastal waters instead of over the open ocean where Dvorak analysis was first developed.
In this study, we have provided a brief account of selected meteorological observations to determine the wind strength of Wipha, summarised the observational data that show the RI of Wipha, and examined weather model performance in forecasting RI based on operational model outputs and a set of numerical experiments. The impact of the RI on the operation of TC warning services has also been discussed. The findings can provide a reference for monitoring the RI of TCs near coastal areas and for operating TC warning services in similar coastal cities.
Life of Typhoon Wipha
Wipha formed as a tropical depression over the seas east of the central part of the Philippines on the evening of 16 July 2025 (Figure 1a). It then tracked northwestward towards the Luzon Strait and intensified into a tropical storm over the following two days. It entered the northern part of the SCS and moved west–northwestward, edging closer to the coast of Guangdong on 19 July. Wipha intensified into a typhoon that night and reached its peak intensity with an estimated maximum sustained wind of 39 m/s (75 knots) near its centre on the morning of 20 July, when it skirted approximately 60 km south of HKO Headquarters (Figure 1b). While moving westward along the coastal areas of western Guangdong, it weakened later that day. It turned west–southwestward across Beibu Wan and the northern part of Vietnam and continued to weaken gradually in the following two days. Wipha weakened into an area of low pressure in Laos on the morning of 23 July. A summary of the observations and reanalysis of the Wipha intensity near Hong Kong based on various sources of meteorological information is given in Table 1.
Impacts on Hong Kong
The hurricane-force winds in the eyewalls of Wipha battered many places in Hong Kong on 20 July (Figure 2), justifying the issuance of Hurricane Signal No. 10 for Wipha. Maximum 10-min mean winds of 38.3, 36.6, and 36.6 m/s and maximum gusts of 43.3, 48.9, and 48.0 m/s were recorded at Waglan Island, Green Island, and Cheung Chau Beach, respectively. Maximum 10-min mean winds and gusts recorded at various weather stations in the territory during the passage of Wipha are listed in Table 2. The overall wind strength in Hong Kong is comparable to that of Hato in 2017 (HKO, 2018; Choy et al., 2022) and Saola in 2023 (HKO, 2024; Chan et al., 2024a). However, it is lower than that of Mangkhut in 2018.
During Wipha’s passage, more than 33 people were injured in Hong Kong. There were at least 2,284 reports of fallen trees and seven reports of flooding. Over 500 flights were cancelled at Hong Kong International Airport. There have been at least five reports on collapsed scaffolds. Public utilities, including traffic lights and lampposts, were damaged, and glass curtain walls on commercial buildings were shattered. Farmland in the New Territories and fishing rafts were also damaged. A three-story ship was adrift and crushed into a wharf during heavy waves.
Selected Surface and Radar Observations Near Hong Kong
Three sets of surface observations at different stages of Wipha evolution were considered. The first set is shown in Figure 3, in which Wipha approaches Hong Kong from the east. At approximately 2:25 am on 20 July 2025 (Figure 3a), winds were found to have reached a maximum of at least 26 m/s (50 knots). The pressure was as low as 970 hPa near the sea surface in the vicinity of the TC centre. Later (Figure 3b), winds reached approximately 31 m/s (60 knots) at Waglan Island, the southeasternmost corner of the territory (Figure 2). The pressure of a buoy near the centre of Wipha dropped to at least 969 hPa. During this period, Wipha gained typhoon strength and continued to intensify as it approached Hong Kong.
In the second set, Wipha crossed the seas south of Hong Kong, and the maximum winds were recorded in the offshore waters of the territory. The wind distribution is shown in Figure 4. At approximately 10 am on 20 July (Figure 4a), hurricane-force winds (coloured orange) as strong as approximately 36 m/s (70 knots) were recorded over Waglan Island and on the high ground. As Wipha moved westward, the winds over the eastern part of Hong Kong subsided. Meanwhile, those over the western part of the territory increased (Figure 4b), approximately 36 m/s (70 knots) at Cheung Chau, located in Figure 2, at approximately 11:36 am on 20 July). The pressure near the centre of Wipha dropped to approximately 972 hPa at that time.
Wipha then continued to move west, and an island station with an anemometer installed on the high ground of the island recorded maximum winds of approximately 41 m/s (80 knots) (Figure 5a). The pressure was maintained at as low as 964 hPa. This was when Wipha reached the climax of its lifespan in terms of intensity. Wipha then moved towards the western coast of Guangdong and gradually weakened (Figure 5b).
Weather radars in Hong Kong and Zhuhai provided useful Doppler velocities to estimate the wind strength of Wipha, although the radar signals were occasionally contaminated by high sea waves. At approximately 6:39 am on 20 July 2025 (Figure 6a), folding was observed in the inbound flow of Wipha from Tate’s Cairn weather radar in Hong Kong. The folded region (purple colour in Figure 6a) persisted between 6:37 am and 6:47 am, with an unfolded velocity in the region of −48 m/s, that is, around −93 knots. Based on radar wind profiler data for Hong Kong around that time (not shown), the reduction factor from the height of the radar beam at approximately 1.6 km above sea level to a height of 10 m was in the region of 0.6 to 0.8. The estimated surface winds were found to be 28.8–38.4 m/s, that is, 56–75 knots. This was the period when Wipha experienced typhoon/near-typhoon strength, which intensified.
Another instance under consideration was at approximately 11 am on 20 July, which was the peak intensity of Wipha (Figure 6b), based on the Zhu Ao weather radar at Zhuhai, China. The maximum inbound velocity was found to be −47.5 m/s, that is, −92 knots, a ray with an azimuth of 70° from the north, 0.1° elevation Plan Position Indicator (PPI), at a distance of 74.75 km, and an altitude of approximately 0.68 km. Taking a reduction factor of 0.7 to 0.8, which is generally consistent with the findings of Lee (2010), the estimated surface winds were found to be 33–38 m/s, that is, 64–74 knots. This is consistent with surface observations at that time (Figure 5a).
Evidence of RI of Wipha Near Hong Kong
The RI is commonly defined as an increase in the central maximum wind speed of a certain threshold within 24 h. Some take RI as the 95th percentile of 24-h intensity changes (Kaplan and DeMaria, 2003). Taking the 95th percentile of intensity change based on the HKO’s TC best-track data from 1986 to 2015, the RI thresholds for a 24-h period were 13 m/s (25 knots) in the WNP and 10 m/s (20 knots) in the SCS (Tam et al., 2021).
In the monitoring of Wipha near Hong Kong, there was evidence showing its RI, based on which it is more confident in scaling up the warning intensity of typhoons in preparation for the operation of TC warning services for the public and special users in Hong Kong. This evidence is summarised in the following subsections.
- (a)
- Lightning flashes and meteorological satellite images
When Wipha was located southeast of Hong Kong, lightning flashes started to appear on the eyewall after 3 am. They became more extensive and intense at approximately 9 am on 20 July 2025 when there was an extensive area of strong radar reflectivity in the southern flank of the eyewall (Figure 7a), and cloud-to-cloud lightning (squares) and cloud-to-ground lightning, that is, circles and plus signs, showing negative and positive currents, respectively, in the flashes. At around this time, in the hot tower coloured geostationary meteorological satellite images (Figure 7b), rapid development of overshooting cloud tops with strong updrafts and rapid cooling of cloud top temperatures were observed. The lowest brightness temperature was ≤ 192 K, showing signs of RI of Wipha. These two independent sets of observations support Wipha’s possible RI at that time.
- (b)
- 3D wind field derived from weather radars
Following the method described by Chan et al. (2024c), three-dimensional wind fields around the typhoon eye were generated in near real time up to a height of 10 km, mainly constrained by computational resources. At 9 am or 01 UTC on 20 July 2025 (Figure 8a), wavy motions were found in the vertical velocity field near the core of the higher radar reflectivity on the southern side of the eyewall. Vertical cross-sections along the positive vertical velocity (upward motion) bands showed that there were significant updrafts from a height of 2 to 4 km above sea level, all the way upwards. In a cut perpendicular to the eyewall 30 min earlier (Figure 8b, upper left panel), substantial upward motion was analysed in a tall column of intense radar echoes at approximately 40 dBZ shooting up to approximately 9 km high. The lower-left panel further indicates that the top of such a column can reach as high as 15 km, well exceeding the average echo top taken as the 20-dBZ iso-surface in other parts of the eyewall. This is consistent with the rapid cooling of the cloud top in the updraft captured by the satellite (Figure 7b) and the radar signatures of the convective hot towers previously identified for Severe Typhoon Vicente in 2012 (Yeung, 2013). The vertical velocity field is not measured directly by weather radar but is derived using a 3D variational (3DVAR) analysis technique (Jackson et al., 2020). At later times (say at 11 am or 03 UTC on 20 July 2025) when Wipha has gone through the RI and is located to the southwest of HKO, significant updraft was no longer analysed in the 3D wind field based on weather radars (not shown). The derived vertical motion was generally consistent with the observed occurrence of densely packed lightning flashes and convective hot tower signatures identified from radar and satellite data.
- (c)
- Doppler LiDAR observation
A Doppler LiDAR network was set up in Hong Kong during Wipha to measure upper-air wind and turbulence profiles. Here, the vertical wind profile was studied based on the LiDAR at the southernmost tip of Hong Kong Island, namely, Cape D’Aguilar (CD), which is located at approximately 40–50 km to the north of Wipha’s eye at approximately 9 am on 20 July 2025. The location of CD is shown in Figure 2. As shown in the horizontal wind plot (Figure 9a), there was a descending hurricane-force wind (coloured orange) as Wipha approached Hong Kong. It reached a maximum of approximately 42.1 m/s (82 knots) at a height of 56 m above sea level at approximately 10 am on 20 July. Using a log wind profile with a roughness length of 0.0002–0.005 (reduction factor = 0.815–0.863), the winds were reduced to 10 m above sea level in the region of 34.3–36.3 m/s (67–71 knots), thus supporting a strength of approximately 36 m/s (70 knots) and continuous intensification of Wipha when close to the territory. At approximately the same time, the vertical velocity measured by the LiDAR showed an upward motion (positive velocity in red, Figure 9b) and a descending cloud base height (higher signal-to-noise ratio, SNR, in Figure 9c). This information showed that the CD was close to or within the eye of Wipha, with substantial upward motion recorded. This further supports the intensification of the cyclone at that moment.
- (d)
- Sea temperature and salinity analysis
The sea temperatures and salinity along the track of Wipha were analysed to determine whether they provided hints of the RI of Wipha when it was approaching Hong Kong. Taking the reference values as suggested in the study of Chan et al. (2024b) based on the daily ocean analysis data from the China Ocean Real-Time Analysis (CORTA) 2.0 of the National Marine Data and Information Service (NMDIS) and the Key Laboratory of Marine Environment Information Assurance Technology of the State Oceanic Administration of China on 19 July 2025, the relevant plots are shown in Figure 10. Although high sea temperatures of 30 °C were found to be extremely shallow over the waters south of Hong Kong, sea temperatures of 29 °C or above extended for a whole layer of at least 20 m of seawater over the continental shelf near the coastal region of Guangdong. Sea surface salinity was rather low at 33.8 psu or below at a depth of approximately 20 m. There was a relatively strong salinity stratification of at least 1 psu per 100 m of water depth. The sea temperature and salinity conditions were largely met, as suggested in the study by Chan et al. (2024b), for RI based on thermodynamic considerations. This provides useful information, suggesting the possible intensification of Wipha as it approaches the coast of Guangdong.
Performance of Numerical Models and Numerical Experiments
HKO uses several global numerical weather prediction (NWP) models, including Integrated Forecasting System (IFS) of European Centre for Medium-Range Weather Forecasts (ECMWF), Global Spectral Model (GSM) of Japan Meteorological Agency (JMA), the Unified Model of UK Met Office (EGRR), and Global Forecast System (GFS) of US’s National Centers for Environmental Prediction (NCEP), regional mesoscale NWP model (UWIN-CM; Lai et al., 2024) and global artificial intelligence (AI) models, including Pangu-Weather, Fengwu, Fuxi, Graphcast, ECMWF AIFS and Aurora, for operational track and intensity forecasts of TCs over the WNP and the SCS. The forecast track and intensity errors are shown in Figure 11a,b, respectively. The forecast data were homogenised to obtain a consistent number of cases across each lead time for all models. The track error covers the 12 UTC runs of 13 July 2025 to the 12 UTC runs on 20 July 2025. Meanwhile, the intensity error covers the 00 UTC runs of 16 July 2025 to the 12 UTC run of 20 July 2025. Their respective T + 0 hour to T + 132 or 120 h forecasts were then averaged to produce two plots.
Similar to other TCs in the region (He and Chan, 2025), global AI models generally have smaller errors for tracks compared to global NWP models. Meanwhile, their intensity errors are larger, in the order of 5 to 15 m/s (10 to 30 knots). The AI models have difficulty in capturing the RI of Wipha, resulting in relatively large intensity errors. However, UWIN-CM driven by Pangu, which, in turn, is based on ECMWF IFS analysis, achieves a relatively small track error comparable with Pangu itself. However, the intensity errors are significantly reduced compared with the AI models, in the order of 5 m/s (10 knots) or less throughout the forecast period under consideration. The relatively superior performance of UWIM-CM makes it possible to consider a possible scenario of RI when Wipha approaches the coast of southern China.
The intensity forecast error is considered further, focusing on the forecast based on the 00 UTC run on 19 July 2025 for the possibility of RI in Wipha when approaching Hong Kong by studying the performance of various global NWP models and regional mesoscale NWP models, including HWRF (Kim et al., 2014), HAFS-A (Aristizábal et al., 2024), and TRAMS (Xu et al., 2022). Both HWRF and HAFS-A have sophisticated ocean and/or wave coupling modules comparable to the UWIN-CM used in HKO. The intensity errors are presented in Fig. 11c. All models, including most mesoscale NWP models, failed to forecast that Wipha could attain typhoon strength, that is, a maximum wind speed of 32.8 m/s (64 knots) (red dotted line in Figure 11c), with the mention RI, except UWIN-CM. The forecast of Wipha’s intensity by UWIN-CM closely follows the actual operational intensity analysis.
A set of numerical experiments was performed to determine why only UWIN-CM in the current configuration could capture typhoon strength and RI. All four experiments were initialised at 00 UTC on 19 July 2025.
- (a)
- Fully coupled run with atmosphere, ocean, and wave components, in which the atmosphere model is driven by Pangu, which is the same as the real-time operational configuration.
- (b)
- Fully coupled as in (a), but the atmospheric model is driven by the ECMWF IFS.
- (c)
- Atmosphere model (WRF) only, driven by Pangu.
- (d)
- Atmospheric model (WRF) coupled with ocean (HYCOM); the atmospheric model was driven by Pangu.
The forecast track and Wipha intensity for the four model configurations are shown in Figure 12a–b, respectively. For forecast intensity, smoothing using a 3-h window was applied to reduce short-term fluctuations. Figure 12a shows that there is not much difference in the forecast tracks, and all of them are reasonably close to the actual track of Wipha. However, for intensity, the results of configuration (b) underestimated the peak strength of Wipha on 20 July and failed to forecast its subsequent weakening. Meanwhile, the differences in forecast intensities among the other three configurations were substantially smaller. As such, while ocean and wave coupling should play a role in intensity forecasting. The largest impact appears to come from the initial and lateral boundary conditions of the driving global model, as shown in the intensity estimation by TRAMS. This does not have sophisticated ocean and wave couplings. With the change in the driving model from Pangu to the ECMWF IFS, the intensity forecast error increases. Even the WRF (atmosphere only) driven by Pangu, as in configuration (c), can forecast the RI of Wipha with intensity forecasts comparable to those from a fully coupled setup of UWIN-CM. In contrast, HWRF and HAFS-A are driven by the GFS of the NCEP, which generally has larger track errors (Figure 11a). This may have contributed to the larger intensity errors in HWRF and HAFS-A. This highlights the importance of selecting an appropriate global model to provide the initial conditions and lateral boundary conditions for regional mesoscale NWP models.
Impacts on TC Warning Services
Before the issuance of Hurricane Signal No. 10, there was a No. 9 signal for increasing gale or storm force winds, which served as preparation for the possible occurrence of a higher signal. When Signal No. 9 was issued, the open sections of the railway stopped. This would have a considerable impact on the normal life of Hong Kong because (1) local people cannot use the Mass Transit Railway (MTR) and Light Rail to travel within Hong Kong, as these rails have several open sections, and (2) the operation of the Hong Kong International Airport (HKIA) would be severely limited because the Airport Express (AE) transports passengers between the airport and urban areas, and a large section of the AE is open. As such, to get the public and aviation stakeholders to prepare for the essential ‘shutdown’ of the railway systems, an early alert of the No. 9 signal is required, preferably one or two hours before the issuance of the signal. However, the operation of signals No. 9 and No. 10 would be challenging from a meteorological service perspective because (1) the TC is already near Hong Kong, and slight changes in its location, such as a couple of tens of kilometres, could have a different impact on wind strength within the territory, and (2) there would be a different impact following intensity changes of the TC near Hong Kong.
As shown in the discussion on the performance of the NWP and AI models, the various global and mesoscale models have sufficient skills in capturing the movement of Wipha. However, there are still fluctuations in the closest approach distance of Wipha to Hong Kong, with an uncertainty of a few tens of kilometres. This uncertainty in track, together with the uncertainty in the intensity of Wipha, that is, whether it is already a typhoon when approaching Hong Kong and, if it is a typhoon, whether RI would occur, poses considerable challenges for earlier alerting of the No. 9 signal. This would preferably be issued early in the morning before the daily activities of most Hong Kong citizens and the operation of the HKIA. Based on the reanalysis above, at approximately 5–6 am local time on 20 July 2025, the strength of Wipha was just that of a marginal typhoon (31–36 m/s or 60–70 knots, Table 1). At that time, only the UWIN-CM model forecasts further intensification of Wipha later that morning (UWIM-CM is used in real-time by the HKO only at the beginning of summer 2025). All other models, including global NWP models, global AI models, and regional mesoscale NWP models, such as HWRF, HAFS-A, and TRAMS, do not forecast RI and have a substantially longer history of development and real-time operation.
For the earlier warning of signal no. 9, the HKO faced the dilemma of overwarning, if Wipha turned out to be only a marginal typhoon with hurricane-force winds recorded in limited areas of Hong Kong, or taking a wait-and-see approach, in which Hong Kong citizens would start their daily activities. However, this was a Sunday, and the HKIA would begin operations. To balance meteorological and social factors, based on safety considerations, it was eventually determined to issue a pre-alert message for signal no. 9 at 5:45 am on 20 July 2025, indicating that Signal No. 9 would be issued at 7:20 am that day. The decision was justified based on the actual impact of Wipha on Hong Kong from the recorded wind strength and the resulting damage.
Several studies have shown the RI of TCs approaching the coastal areas of southern China (Chen et al., 2021). In the face of global warming, there seems to be a higher chance for TCs to intensify over warmer oceans, especially near coasts, such as based on the SST data in Figure 10. The IPCC (2021) states that the global frequency of RI events of TCs has increased over the last four decades. Against this background, a safer approach may be more appropriate for operating TC warning services.
Conclusions
Wipha was a challenging TC in terms of warning services for Hong Kong because of its proximity to the territory with uncertainty in its forecast track, the uncertainty of whether Wipha had already reached typhoon strength, and thus, the need for the No. 9 and No. 10 TC warning signals, and its RI near Hong Kong. In this study, we have documented the scientific basis for the consideration of warning services, including intensity determination, evidence of RI, performance of weather prediction models in forecasting RI, and potential reasons for RI forecasting using a regional mesoscale coupled model based on preliminary numerical experiments. The impacts of track and intensity uncertainties on TC warning services is briefly discussed, and potential strategies for providing warnings are suggested against the background of climate change.
The RI of Wipha may require further investigation, such as examining the role of sea temperature and sea salinity gradients, given that frequently updated and high-spatial-resolution analyses are already available in real time for the northern part of the SCS. The Wipha case also highlights the importance of using regional mesoscale NWP models for operating TC warning services, given the severe limitations of global models (both NWP and AI) in forecasting TC intensity and RI.
In recent years, there have been many cases of RI for typhoons near the coast of Guangdong, including the well-known Hato in 2017 (Choy et al., 2022) and Vicente in 2012 (Yeung, 2013). All these have caused substantial damage to coastal areas and have considerable implications for engineering applications such as wind code in Hong Kong. There are many studies in the literature on RI, such as Pun et al. (2019) and Ye et al. (2024). However, forecasting the RI of typhoons in this region, especially marginal typhoons such as Wipha, remains operationally challenging. This represents an urgent need for more rapid research-to-operation (R2O) transitions in research results to better support the operation of TC warning services. HKO will continue to explore additional NWP and AI weather prediction models in day-to-day operations to address similar challenges in the future.
Supplementary Material
The following supporting information can be downloaded at the website of this paper posted on Preprints.org.
Acknowledgements
The authors thank the Guangdong Meteorological Service for providing the automatic weather station, buoy, and oil rig data used in this study.
References
- Aristizábal, M. et al., 2024: Ocean and Wave Coupling in the HAFS System. HFIP Annual Meeting, 12–15 November 2024. Available online: https://vlab.noaa.gov/documents/17693964/41655053/4C.4_Ocean_Wave_Coupling_HFIP_2024.pdf (accessed on 28 July 2025).
- Chan, P. W. , Choy, C. W., Chiu, Y. Y., and He, J., 2024a: Observational study of Super Typhoon Saola in 2023 when it was close to Hong Kong. Weather. [CrossRef]
- Chan, P. W. Lam, C. C., Hui, T. W., Gao, Z., Fu, H., Sun, C., and Su, H The effects of upper-ocean sea temperatures and salinity on the intensity change of tropical cyclones over the western North Pacific and the South China Sea: an observational study. Atmosphere 2024, 15, 674. [Google Scholar] [CrossRef]
- Chan, Y. W. Lo, K. W., Cheung, P., Chan, P. W., and Lai, K. K Observation and numerical simulation of cross-mountain airflow at the Hong Kong International Airport from Range Height Indicator Scans of Radar and LIDAR. Atmosphere 2024, 15, 1391. [Google Scholar] [CrossRef]
- Chen, Y. Gao, S., Li, X., and Shen, X Key environmental factors for rapid intensification of the South China Sea tropical cyclones. Frontiers in Earth Science 2021, 8, 609727. [Google Scholar] [CrossRef]
- Choy, C. W. Lau, D. S., and He, Y Super typhoons Hato and Mangkhut, part I: Analysis of maximum intensity and wind structure. Weather 2022, 77, 314–320. [Google Scholar] [CrossRef]
- He, Y. H. and Chan, P. W A study of the extended-range weather forecasts by artificial intelligence models Pangu-Weather and FengWu. Weather 2025, 80, 134–138. [Google Scholar] [CrossRef]
- HKO, 2018: Report of Super Typhoon Hato (1713): 20 – 24 August. Available online: https://www.hko.gov.hk/en/publica/tc/tc2017/pdf/files/section3_3.pdf (accessed on 28 July 2025).
- HKO, 2024: Report of Super Typhoon Saola (2309): 23 August to 3 September 2023. Available online: https://www.hko.gov.hk/common/publica/tc/tc2023/pdf/files/section3_3.pdf (accessed on 28 July 2025).
- Jackson, R. , Collis, S., Lang, T., Potvin, C., and Munson, T. PyDDA: A Pythonic direct data assimilation framework for wind retrievals. Journal of Open Research Software 2020, 8. [CrossRef]
- Lui, W.H. Lee, T.C., and Shun, C.M., 2018: Evolution of the Tropical Cyclone Warning Systems in Hong Kong since 1884, Hong Kong Observatory Technical Note No. 109. Available online: https://www.hko.gov.hk/tc/publica/tn/files/tn109.pdf (accessed on 28 July 2025).
- Kaplan, J. , and DeMaria, M Large-scale characteristics of rapidly intensifying tropical cyclones in the North Atlantic basin. Weather and forecasting 2003, 18, 1093–1108. [Google Scholar] [CrossRef]
- Kim, H. S. Lozano, C., Tallapragada, V., Iredell, D., Sheinin, D., Tolman, H. L., Gerald, V.M. and Sims, J Performance of ocean simulations in the coupled HWRF–HYCOM model. Journal of Atmospheric and Oceanic Technology 2014, 31, 545–559. [Google Scholar] [CrossRef]
- Lai, S. K. Chan, P. W., He, Y., Chen, S. S., Kerns, B. W., Su, H., and Mo, H Real-time operational trial of atmosphere–ocean–wave coupled model for selected tropical cyclones in 2024. Atmosphere 2024, 15, 1509. [Google Scholar] [CrossRef]
- Lee, S.M. 2010. Estimation of tropical cyclone surface wind distribution using Doppler wind of radar. The 24th Guangdong-Hong Kong-Macao Seminar on Meteorological Science and Technology, Shenzhen. 20-22 January 2010. Available online: https://www.weather.gov.hk/tc/publica/reprint/files/r865.pdf (accessed on 28 July 2025).
- Pun, I.-F. Chan, J. C. L., Lin, I.-I., Chan, K. T. F., Price, J. F., Ko, D. S., Lien, C.-C., Wu, Y.-L., and Huang, H.-C Rapid Intensification of Typhoon Hato (2017) over Shallow Water. Sustainability 2019, 11, 3709. [Google Scholar] [CrossRef]
- Tam, H.F. Choy, W.C., Wong, W.K Development of objective forecast guidance on tropical cyclone rapid intensity change. Meteorol. Appl. 2021, 28, e1981. [Google Scholar] [CrossRef]
- United Nations Intergovernmental Panel on Climate Change (IPCC), 2021: Climate Change 2021: The Physical Science Basis. Contribution of Working Group I to the Sixth Assessment Report of the Intergovernmental Panel on Climate Change. Chapter 11.7.
- Xu, D.-S. Liang, J.-H., Lu, Z.-B., Zhang, Y.-X., Huang, F., Feng, Y.-R., and Zhang, B.-L Improved Tropical Cyclone Forecasts with Increased Vertical Resolution in the TRAMS Model. Journal of Tropical Meteorology 2022, 28, 377–387. [Google Scholar] [CrossRef]
- Ye, L. Li, Y., Zhu, P., Gao, Z., and Zeng, Z Comprehensive Comparison of Seven Widely Used Planetary Boundary Layer Parameterisations in Typhoon Mangkhut Intensification Simulation. Atmosphere 2024, 15, 1182. [Google Scholar] [CrossRef]
- Yeung, H.Y. “Convective Hot Tower” Signatures and Rapid Intensification of Severe Typhoon Vicente (1208). Tropical Cyclone Research and Review 2013, 2, 96–108. [Google Scholar] [CrossRef]
Figure 1.
(a) Provisional track of Wipha on 16–23 July 2025. (b) Same as (a), but the track is near Hong Kong.
Figure 1.
(a) Provisional track of Wipha on 16–23 July 2025. (b) Same as (a), but the track is near Hong Kong.
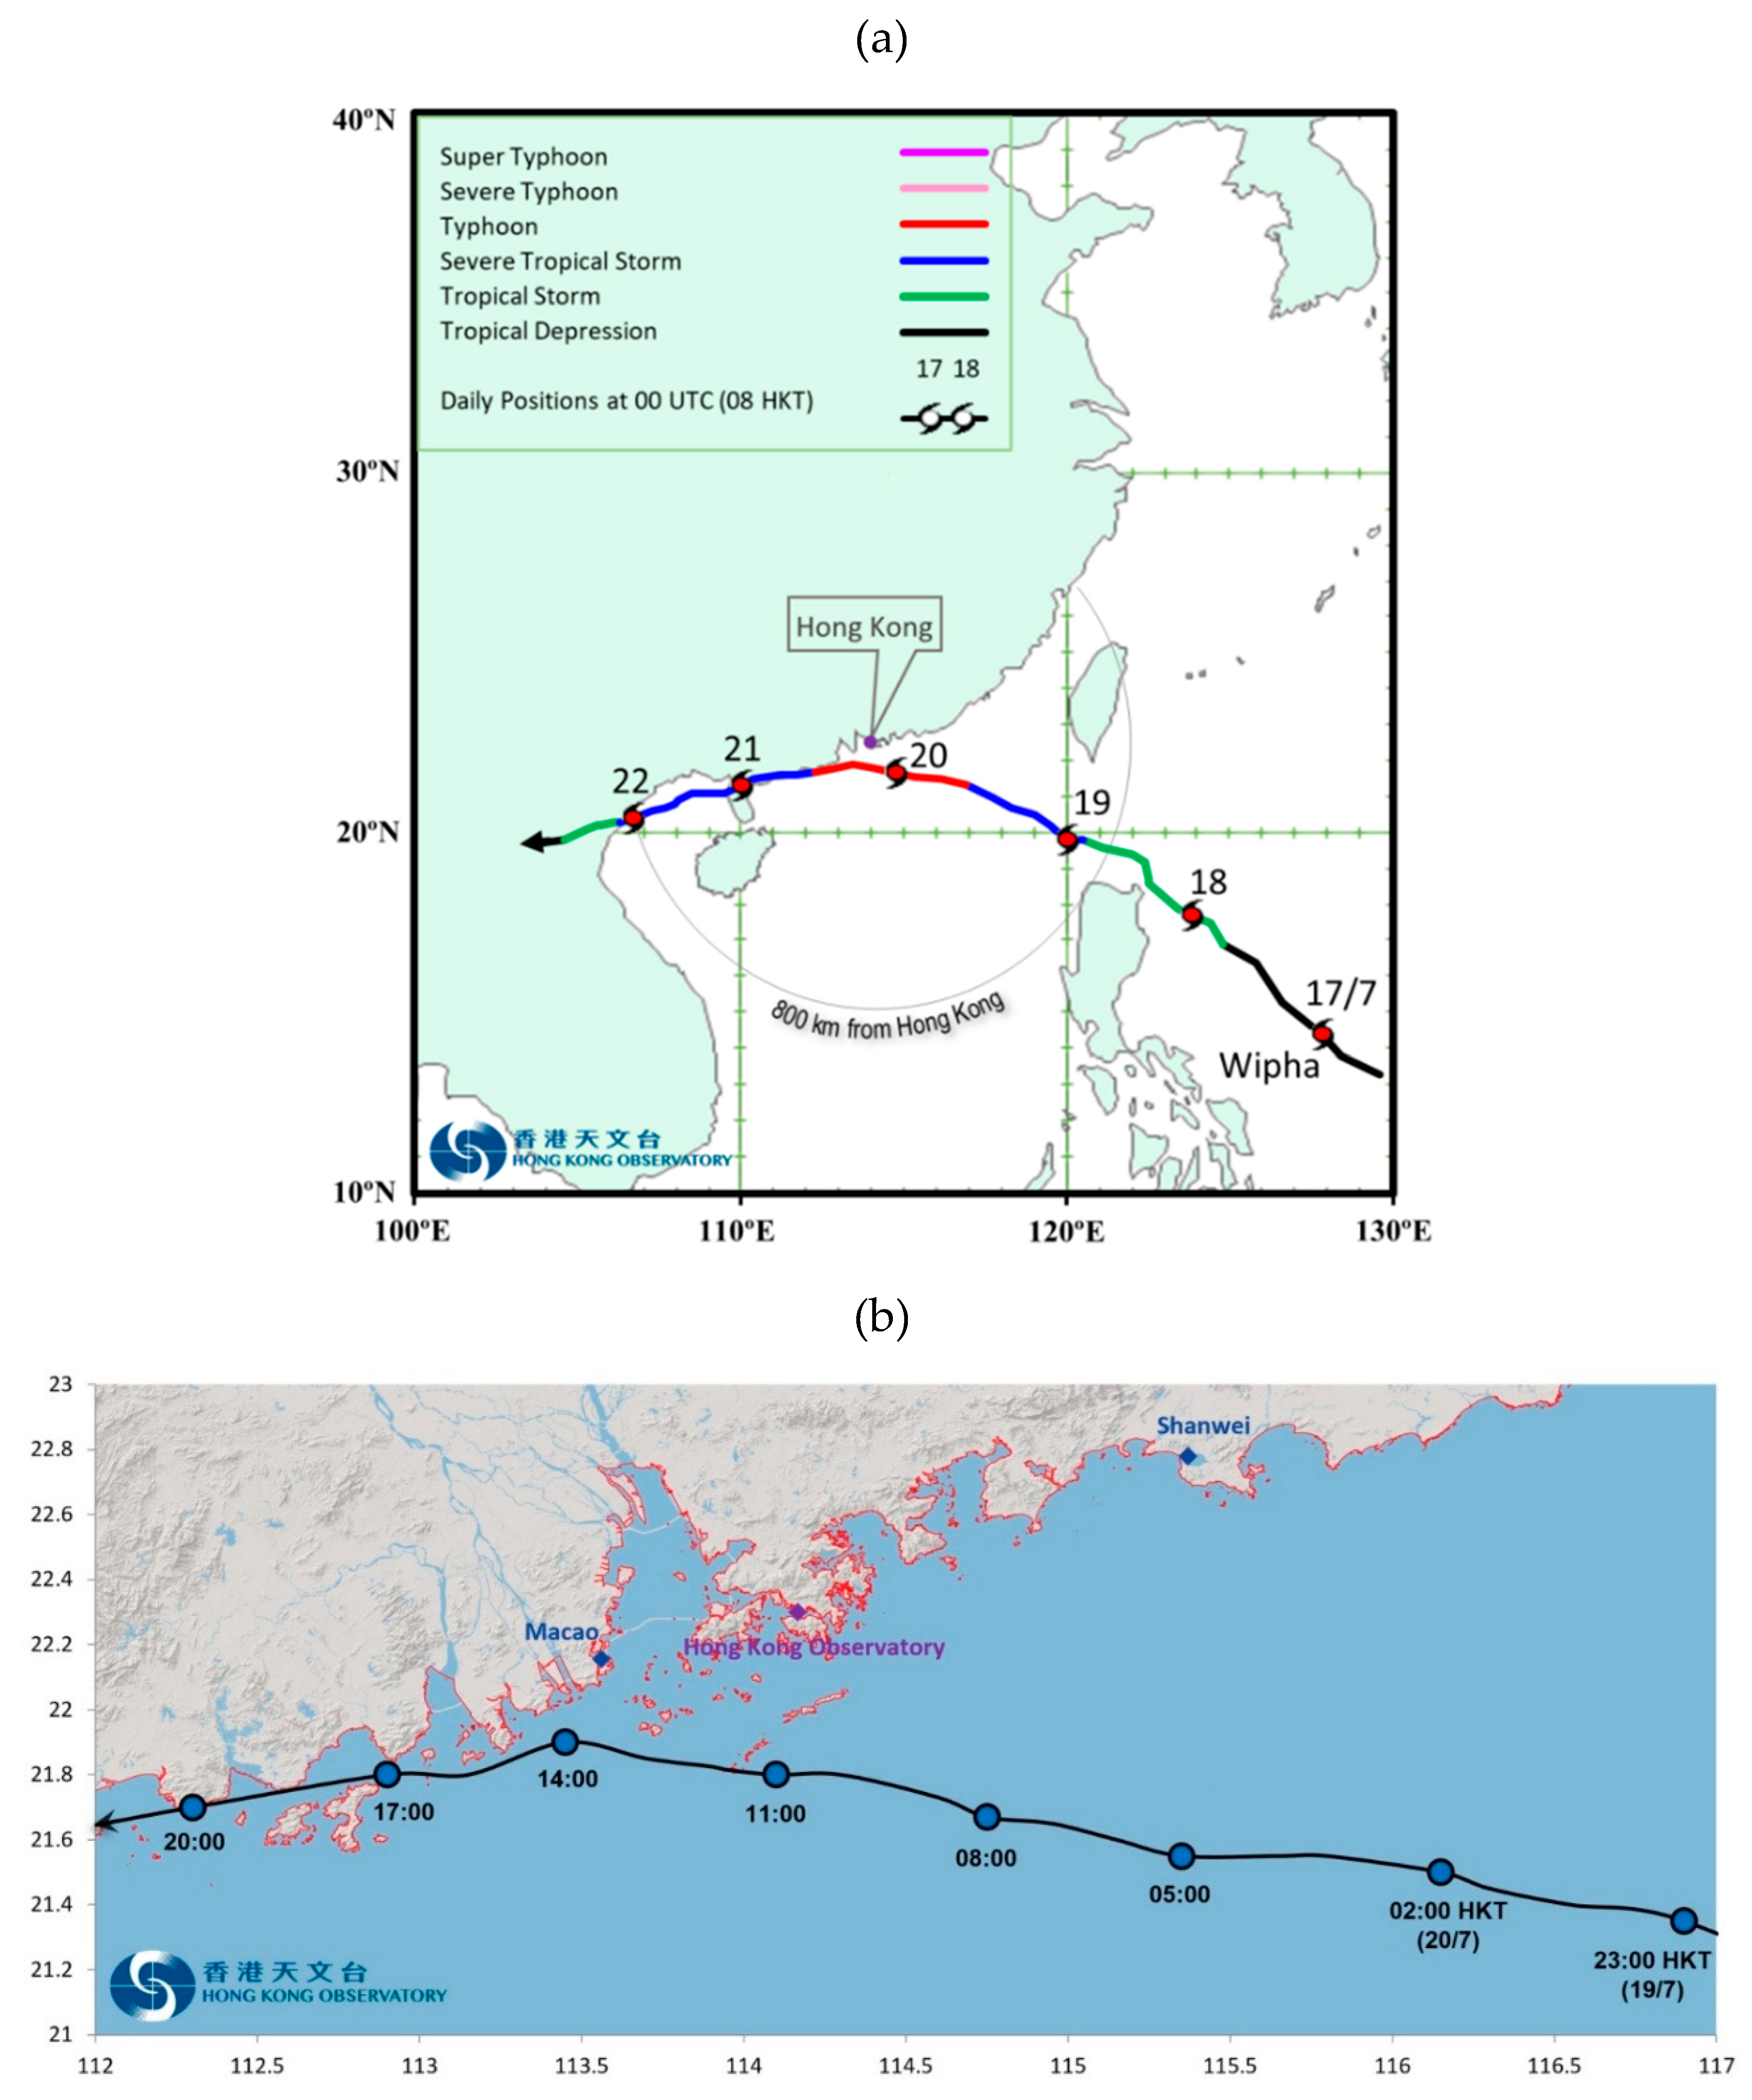
Figure 2.
10-min mean winds recorded at various stations in Hong Kong during the passage of Wipha on 20 July 2025: (a) at 10:00 am, (b) at 11:35 am local time, and (c) maximum values, not necessarily concurrent. Data were unavailable for Ngong Ping, Shek Kong and Stanley. The location of Cape D’Aguilar is marked with a red triangle.
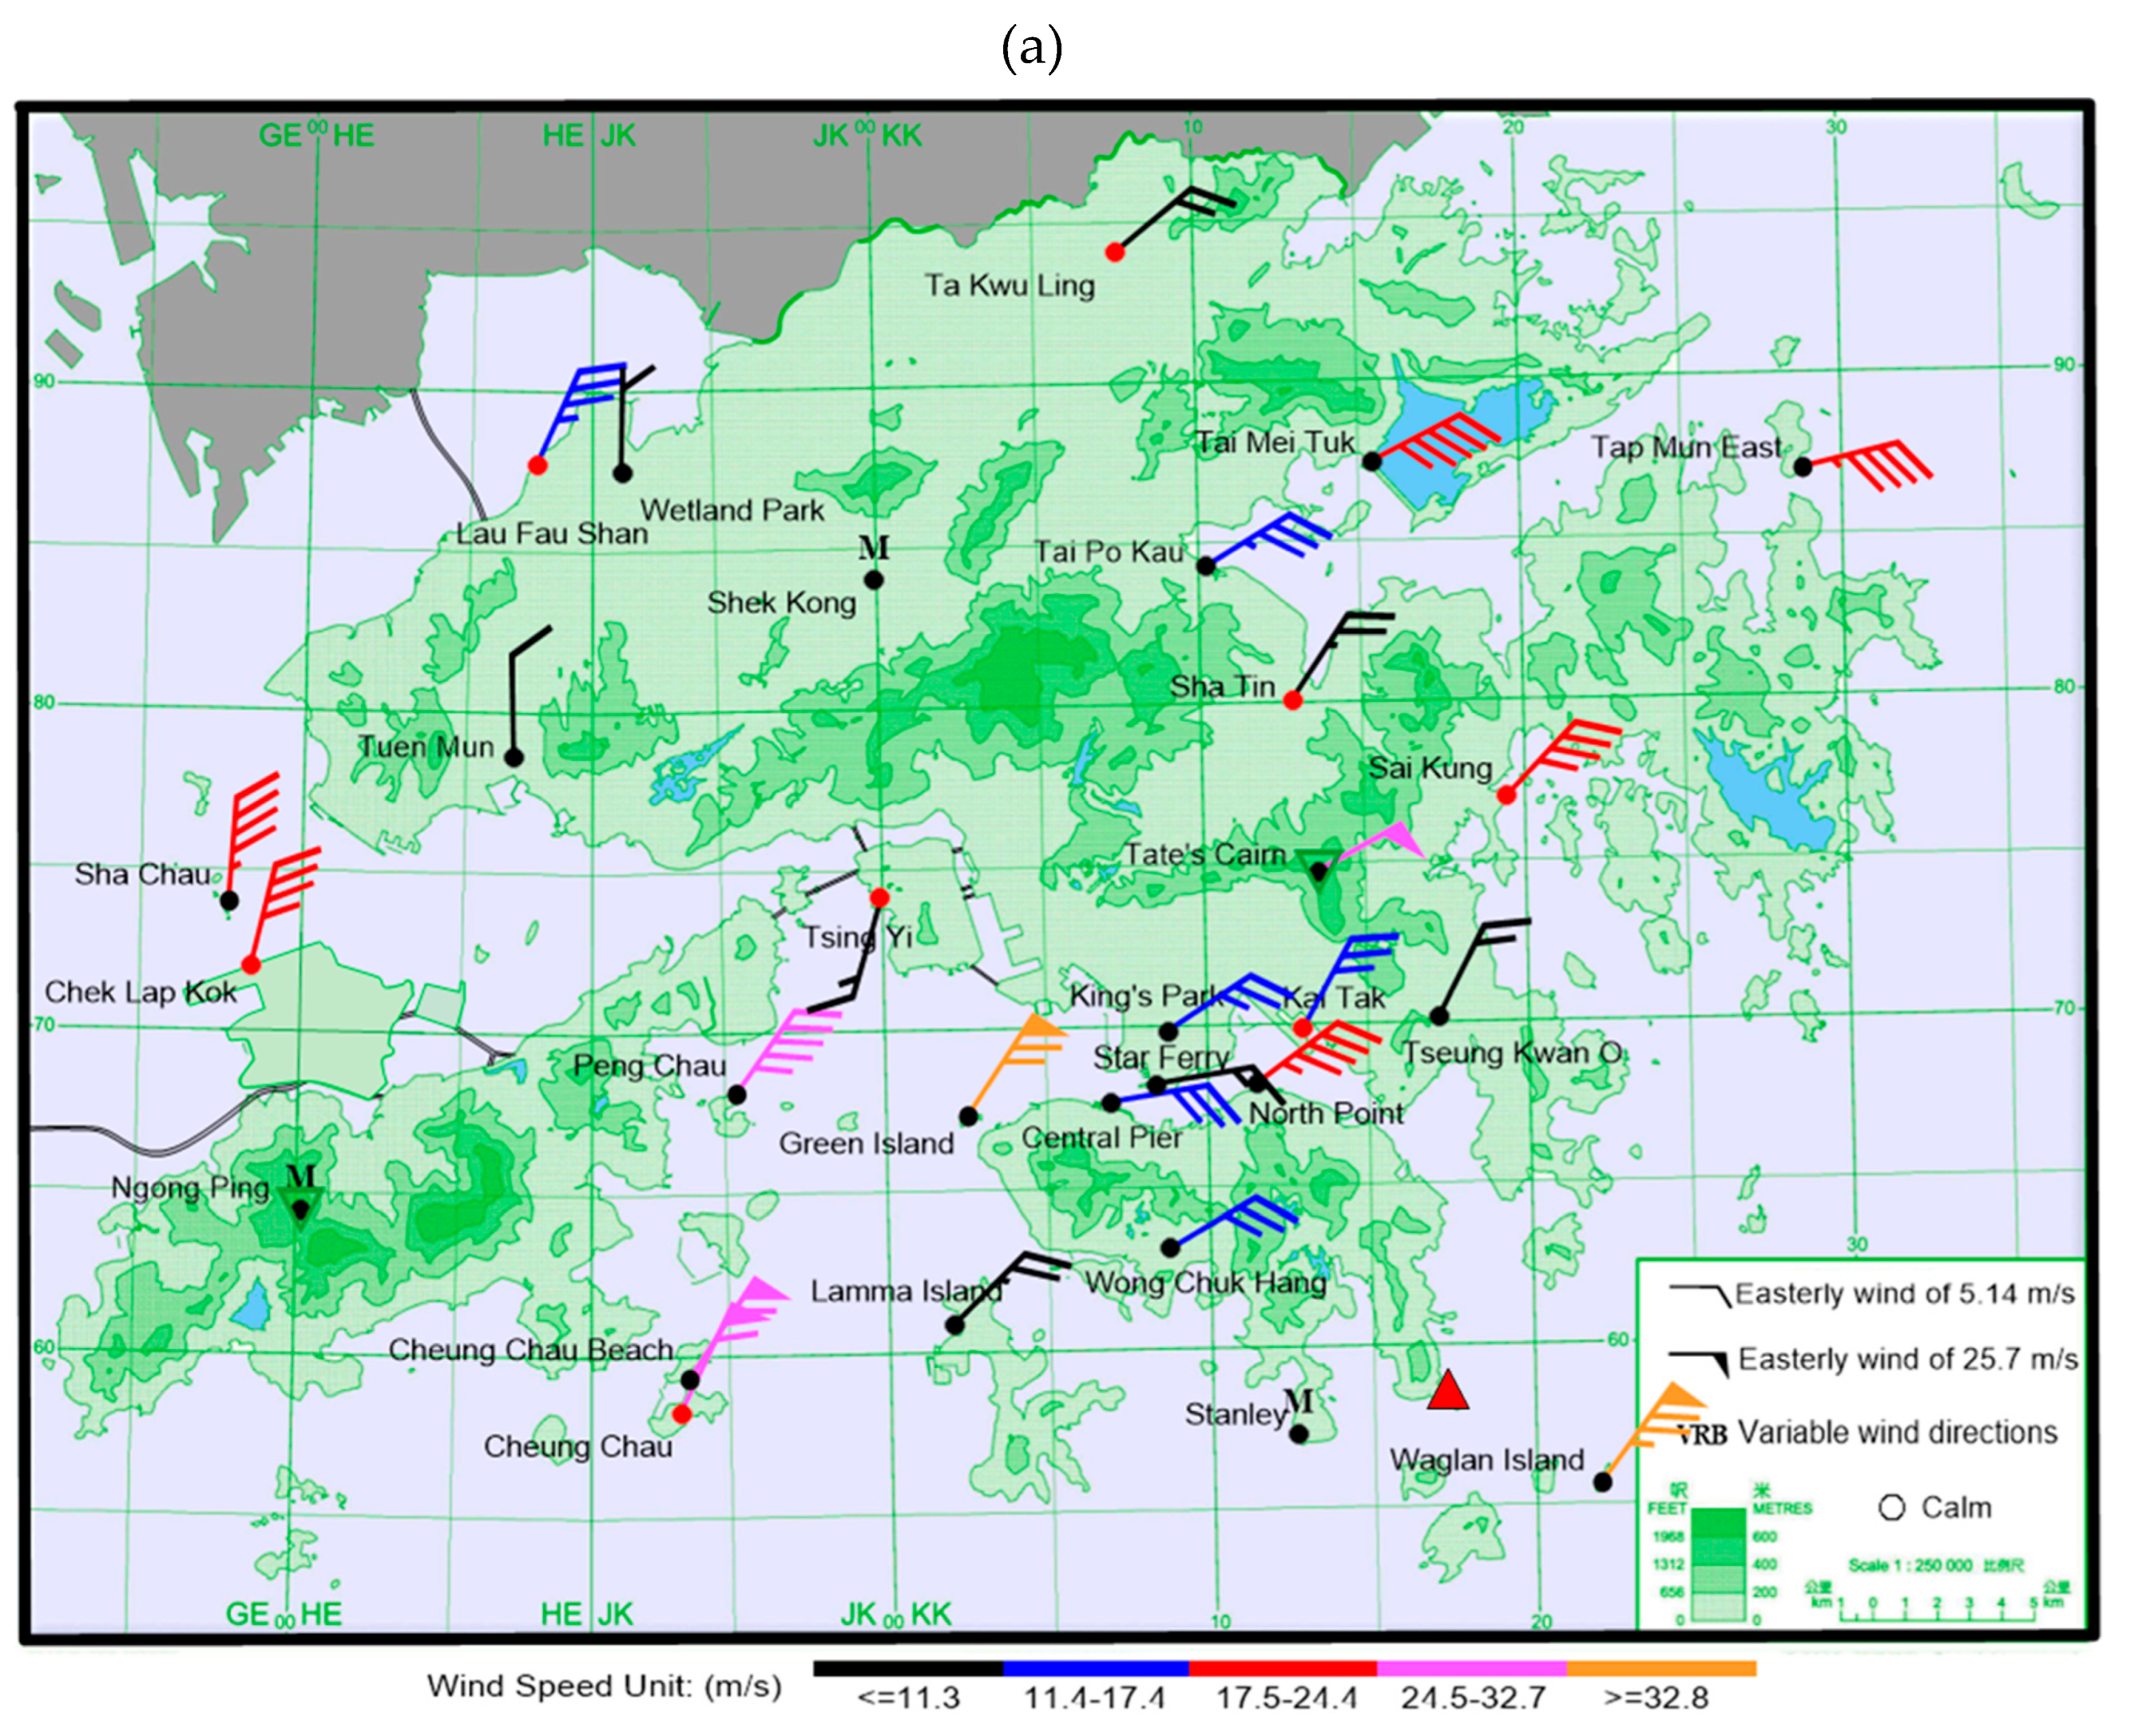
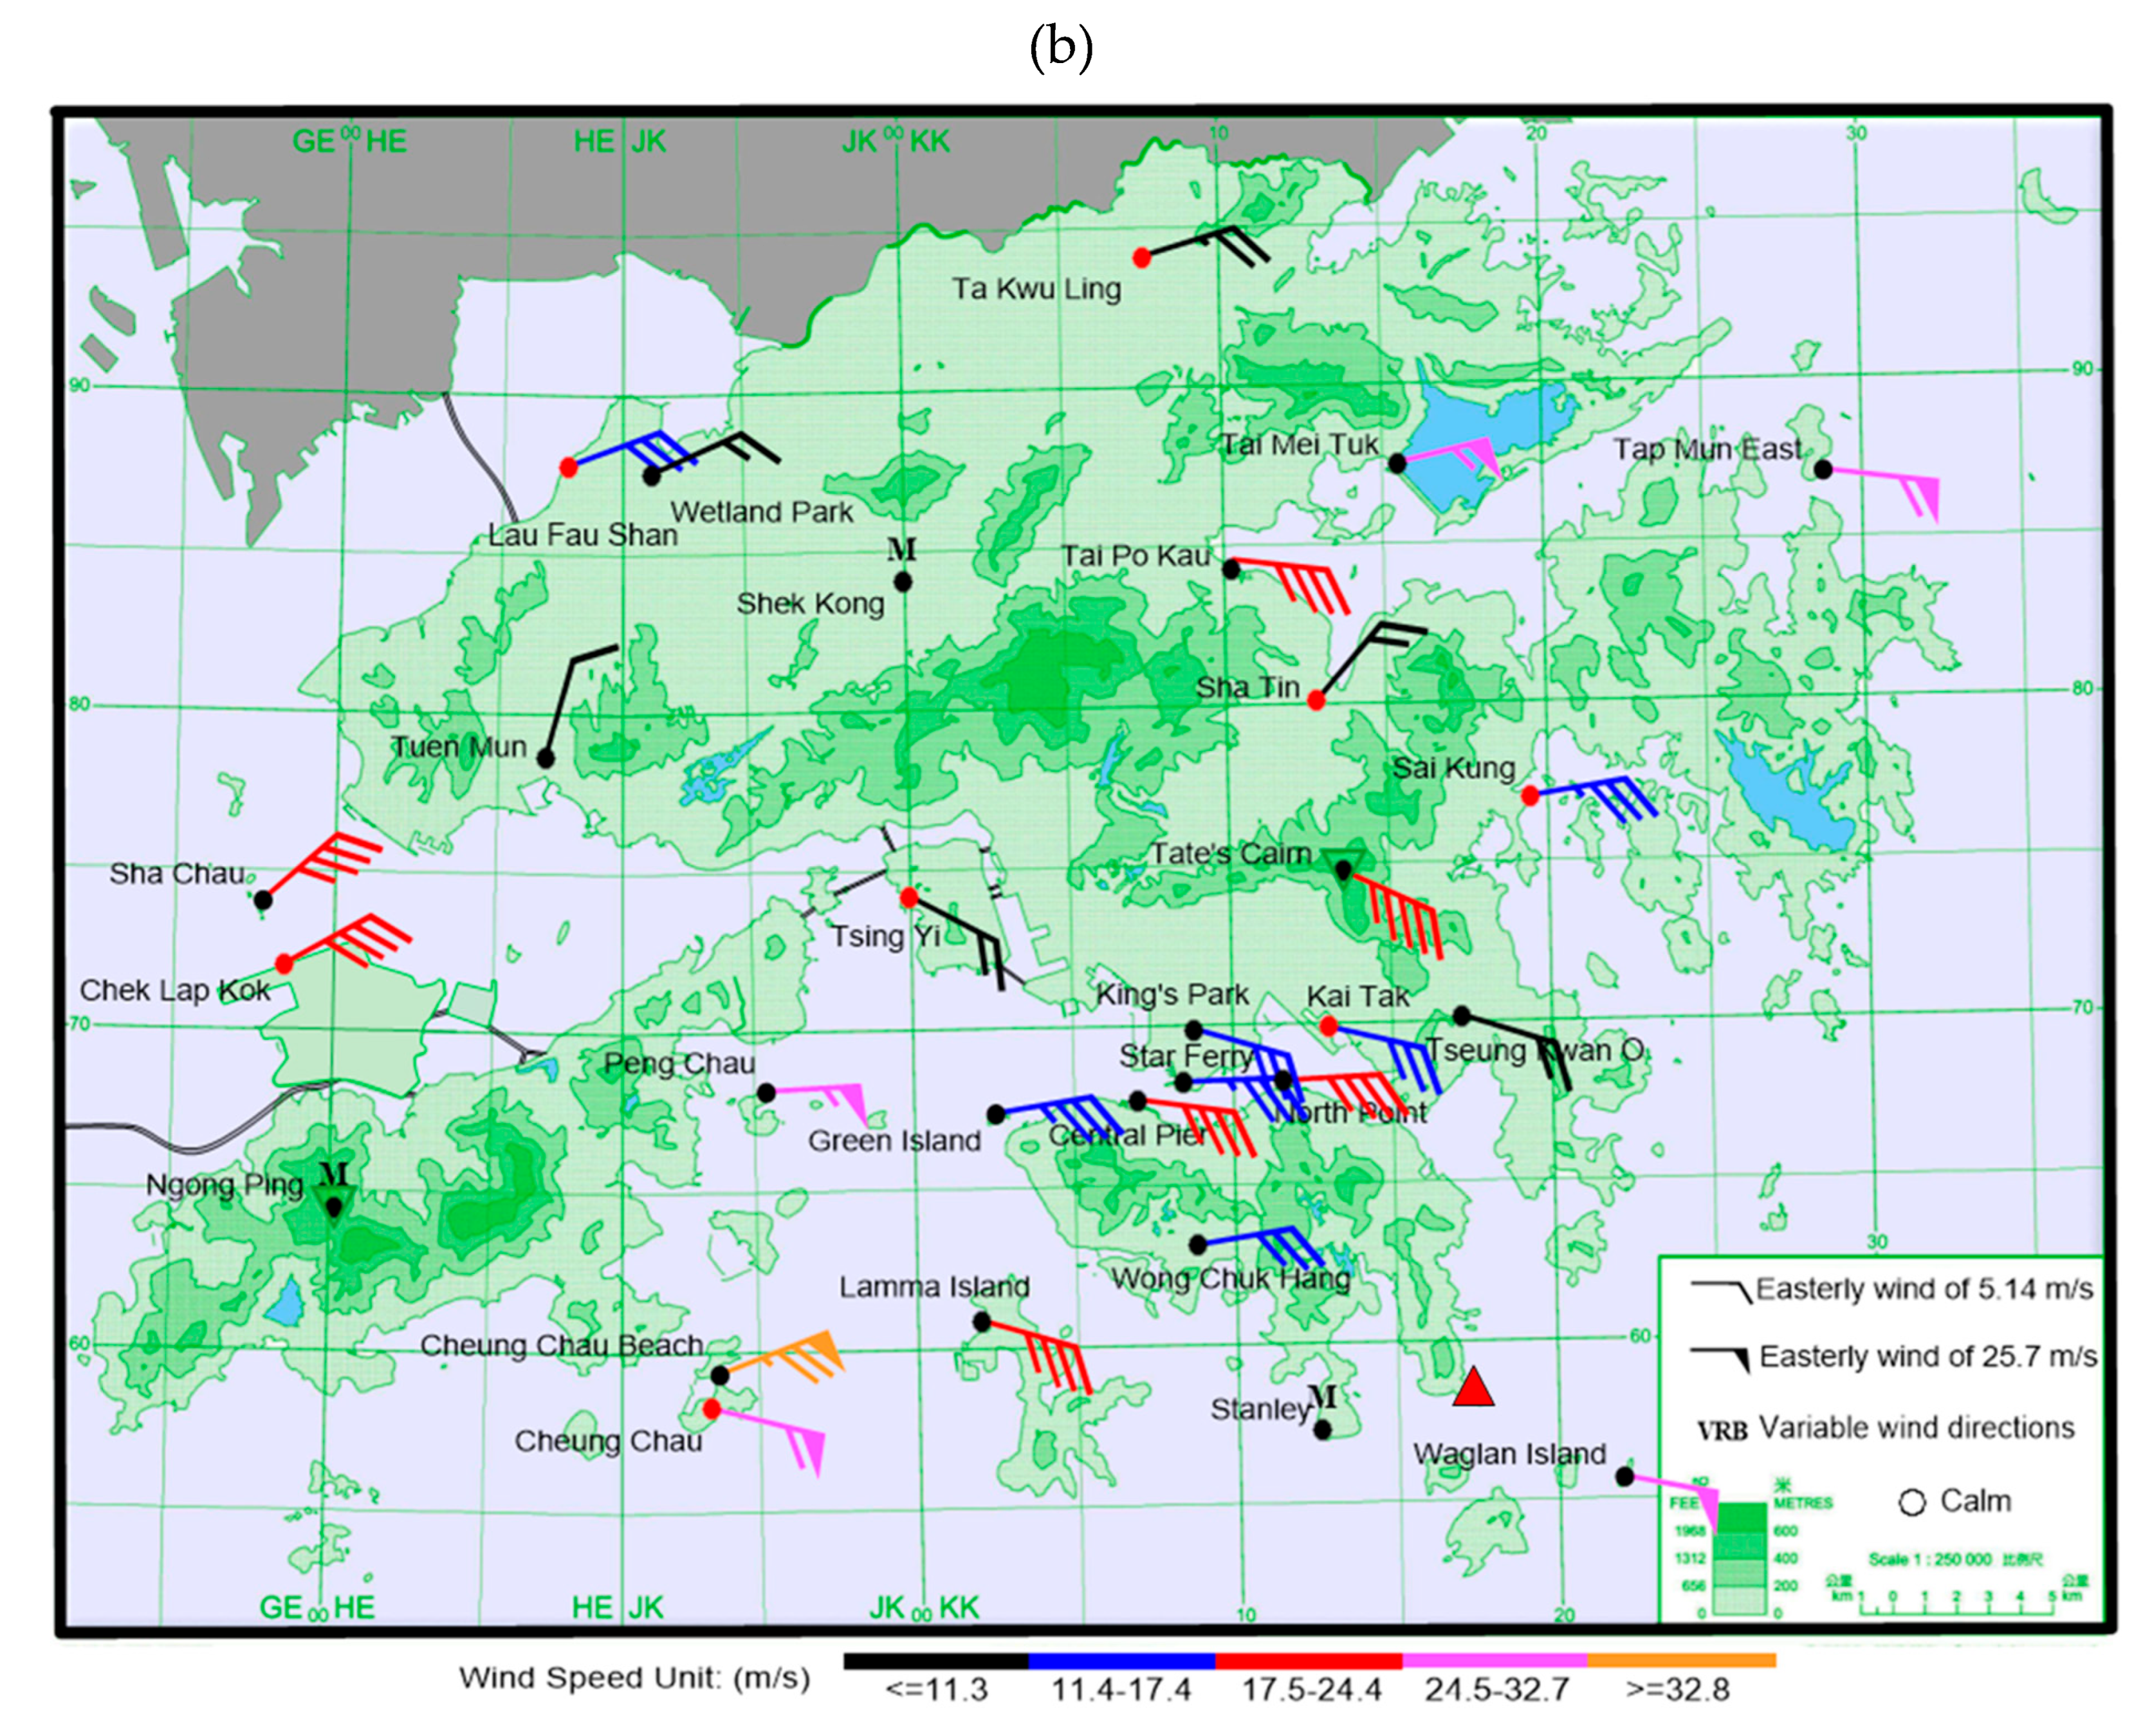
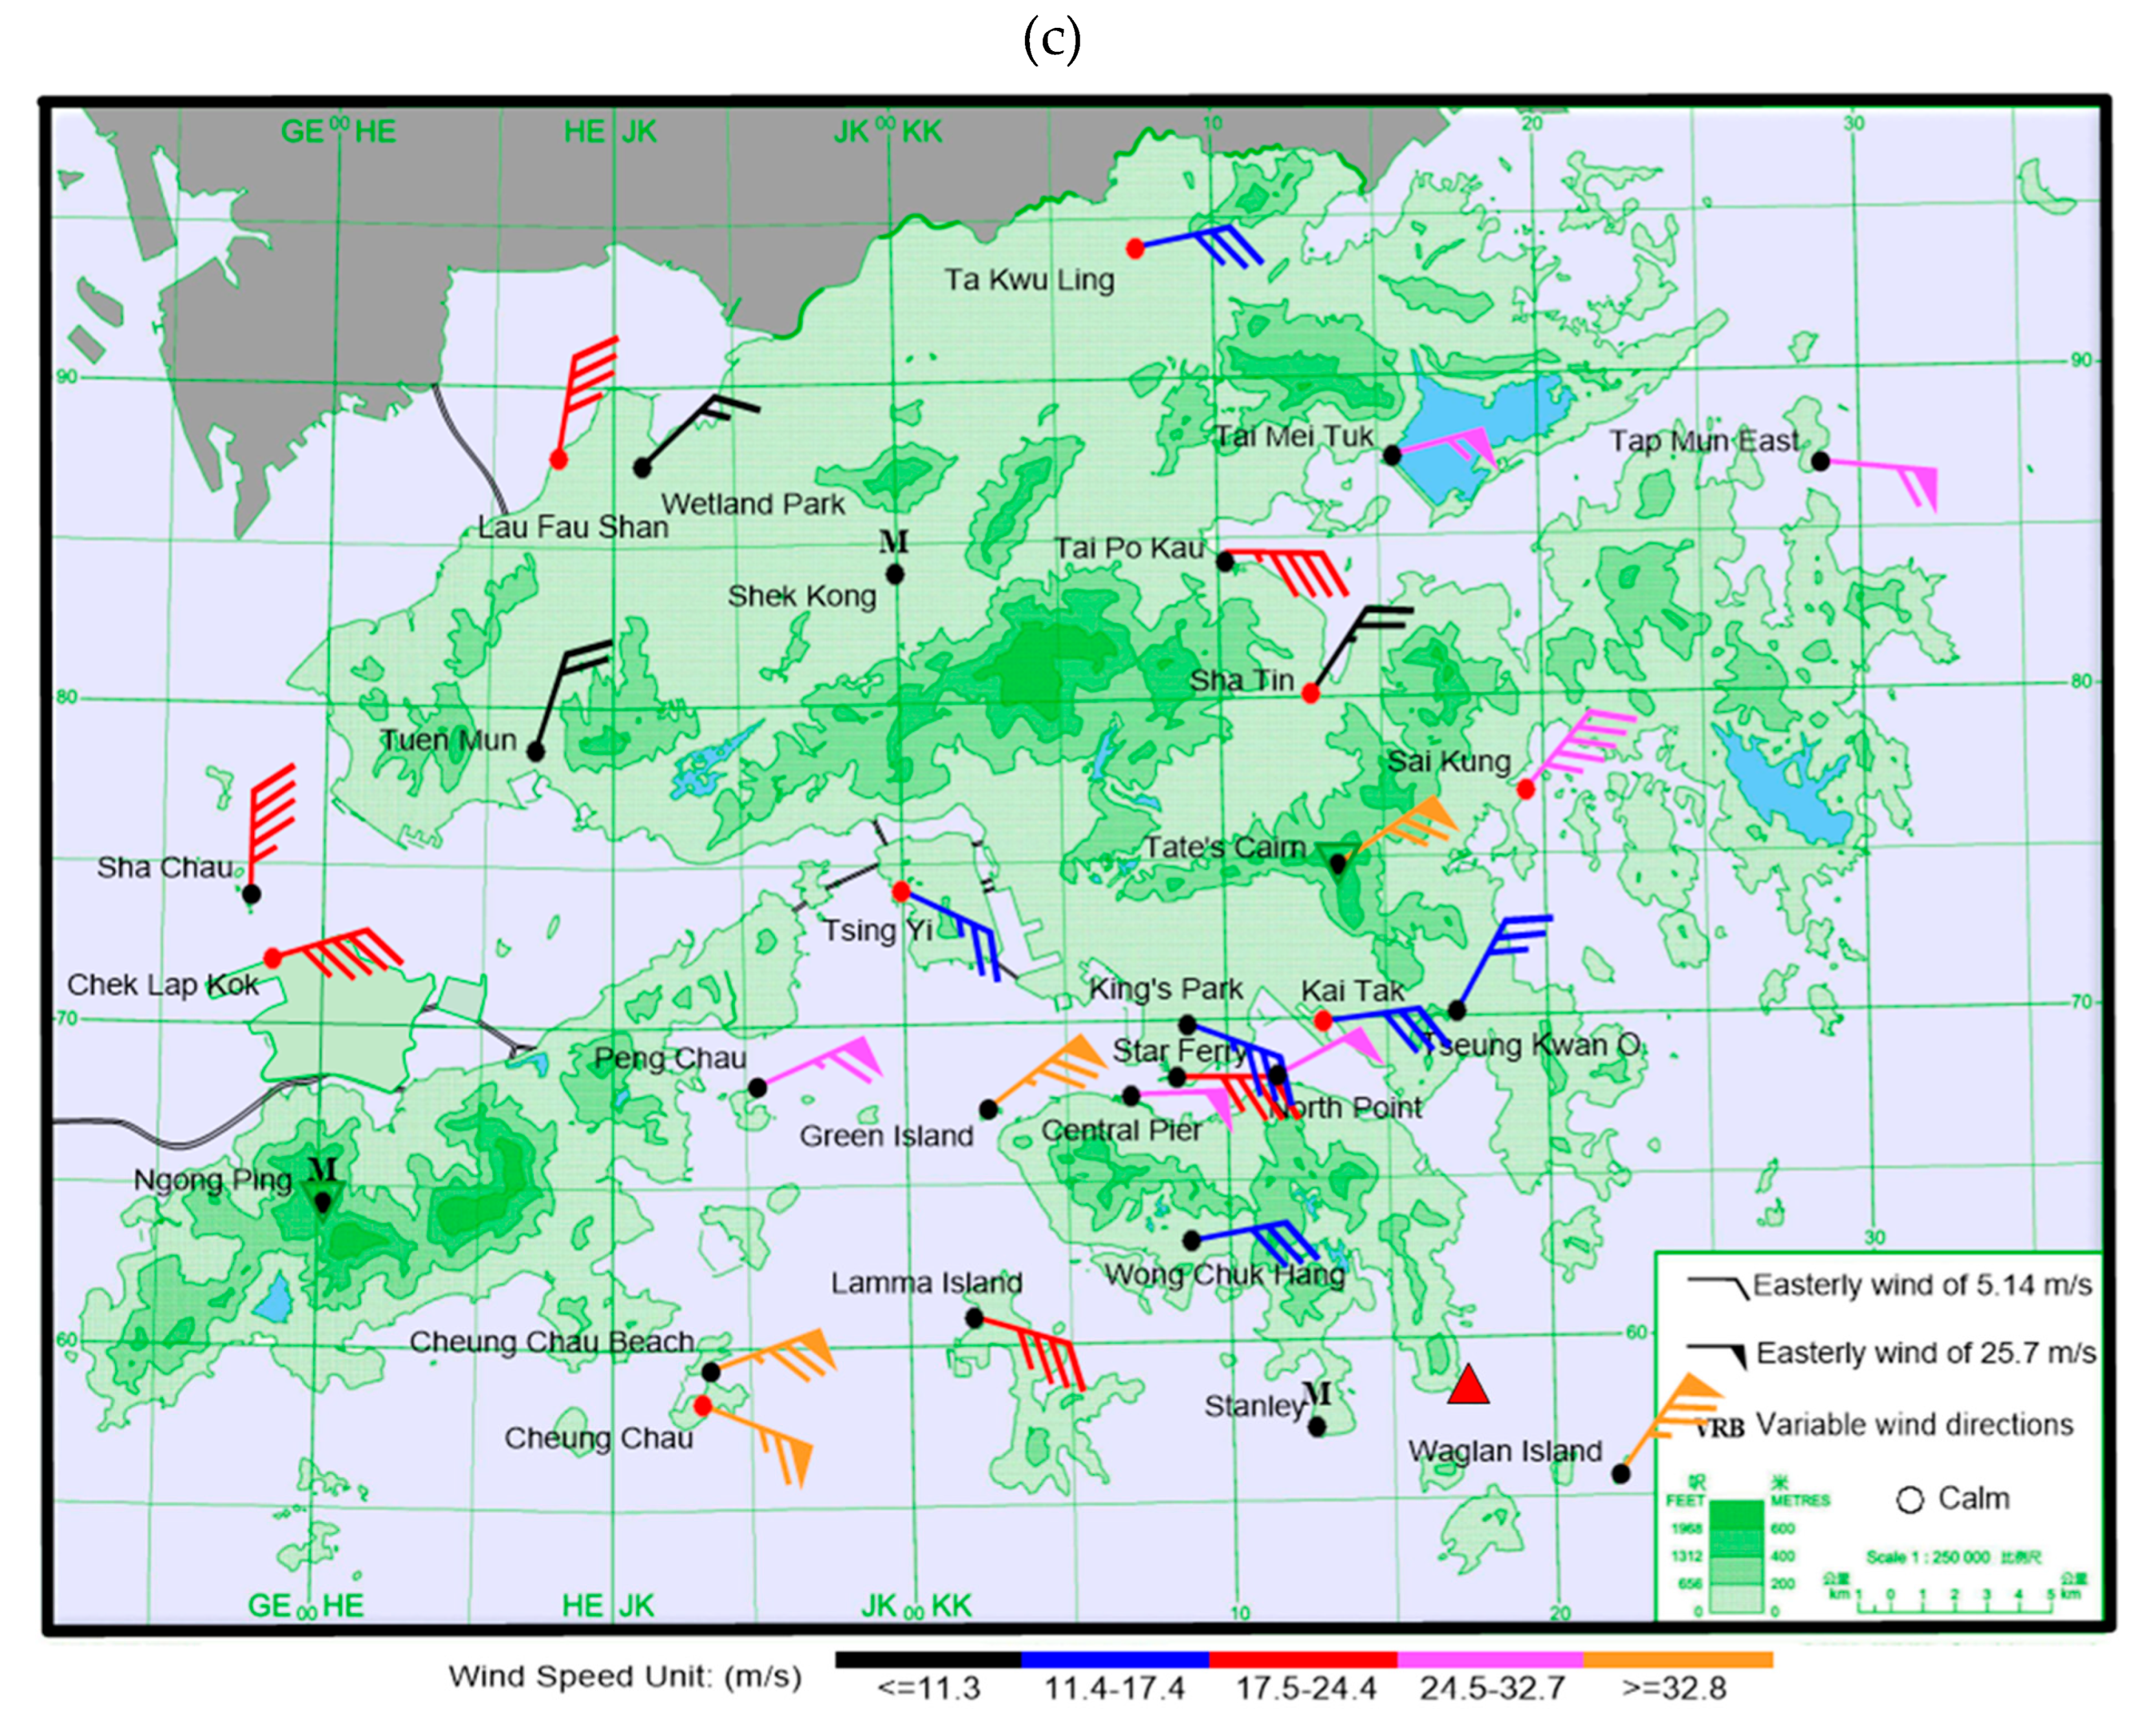
Figure 3.
Surface wind and pressure observations from automatic weather stations, buoys, and oil rigs, overlaid on radar reflectivity imagery (a) at 02:25 am and (b) 08:45 am local time on 20 July 2025. The approximate position of Wipha is marked with a TC symbol.
Figure 3.
Surface wind and pressure observations from automatic weather stations, buoys, and oil rigs, overlaid on radar reflectivity imagery (a) at 02:25 am and (b) 08:45 am local time on 20 July 2025. The approximate position of Wipha is marked with a TC symbol.
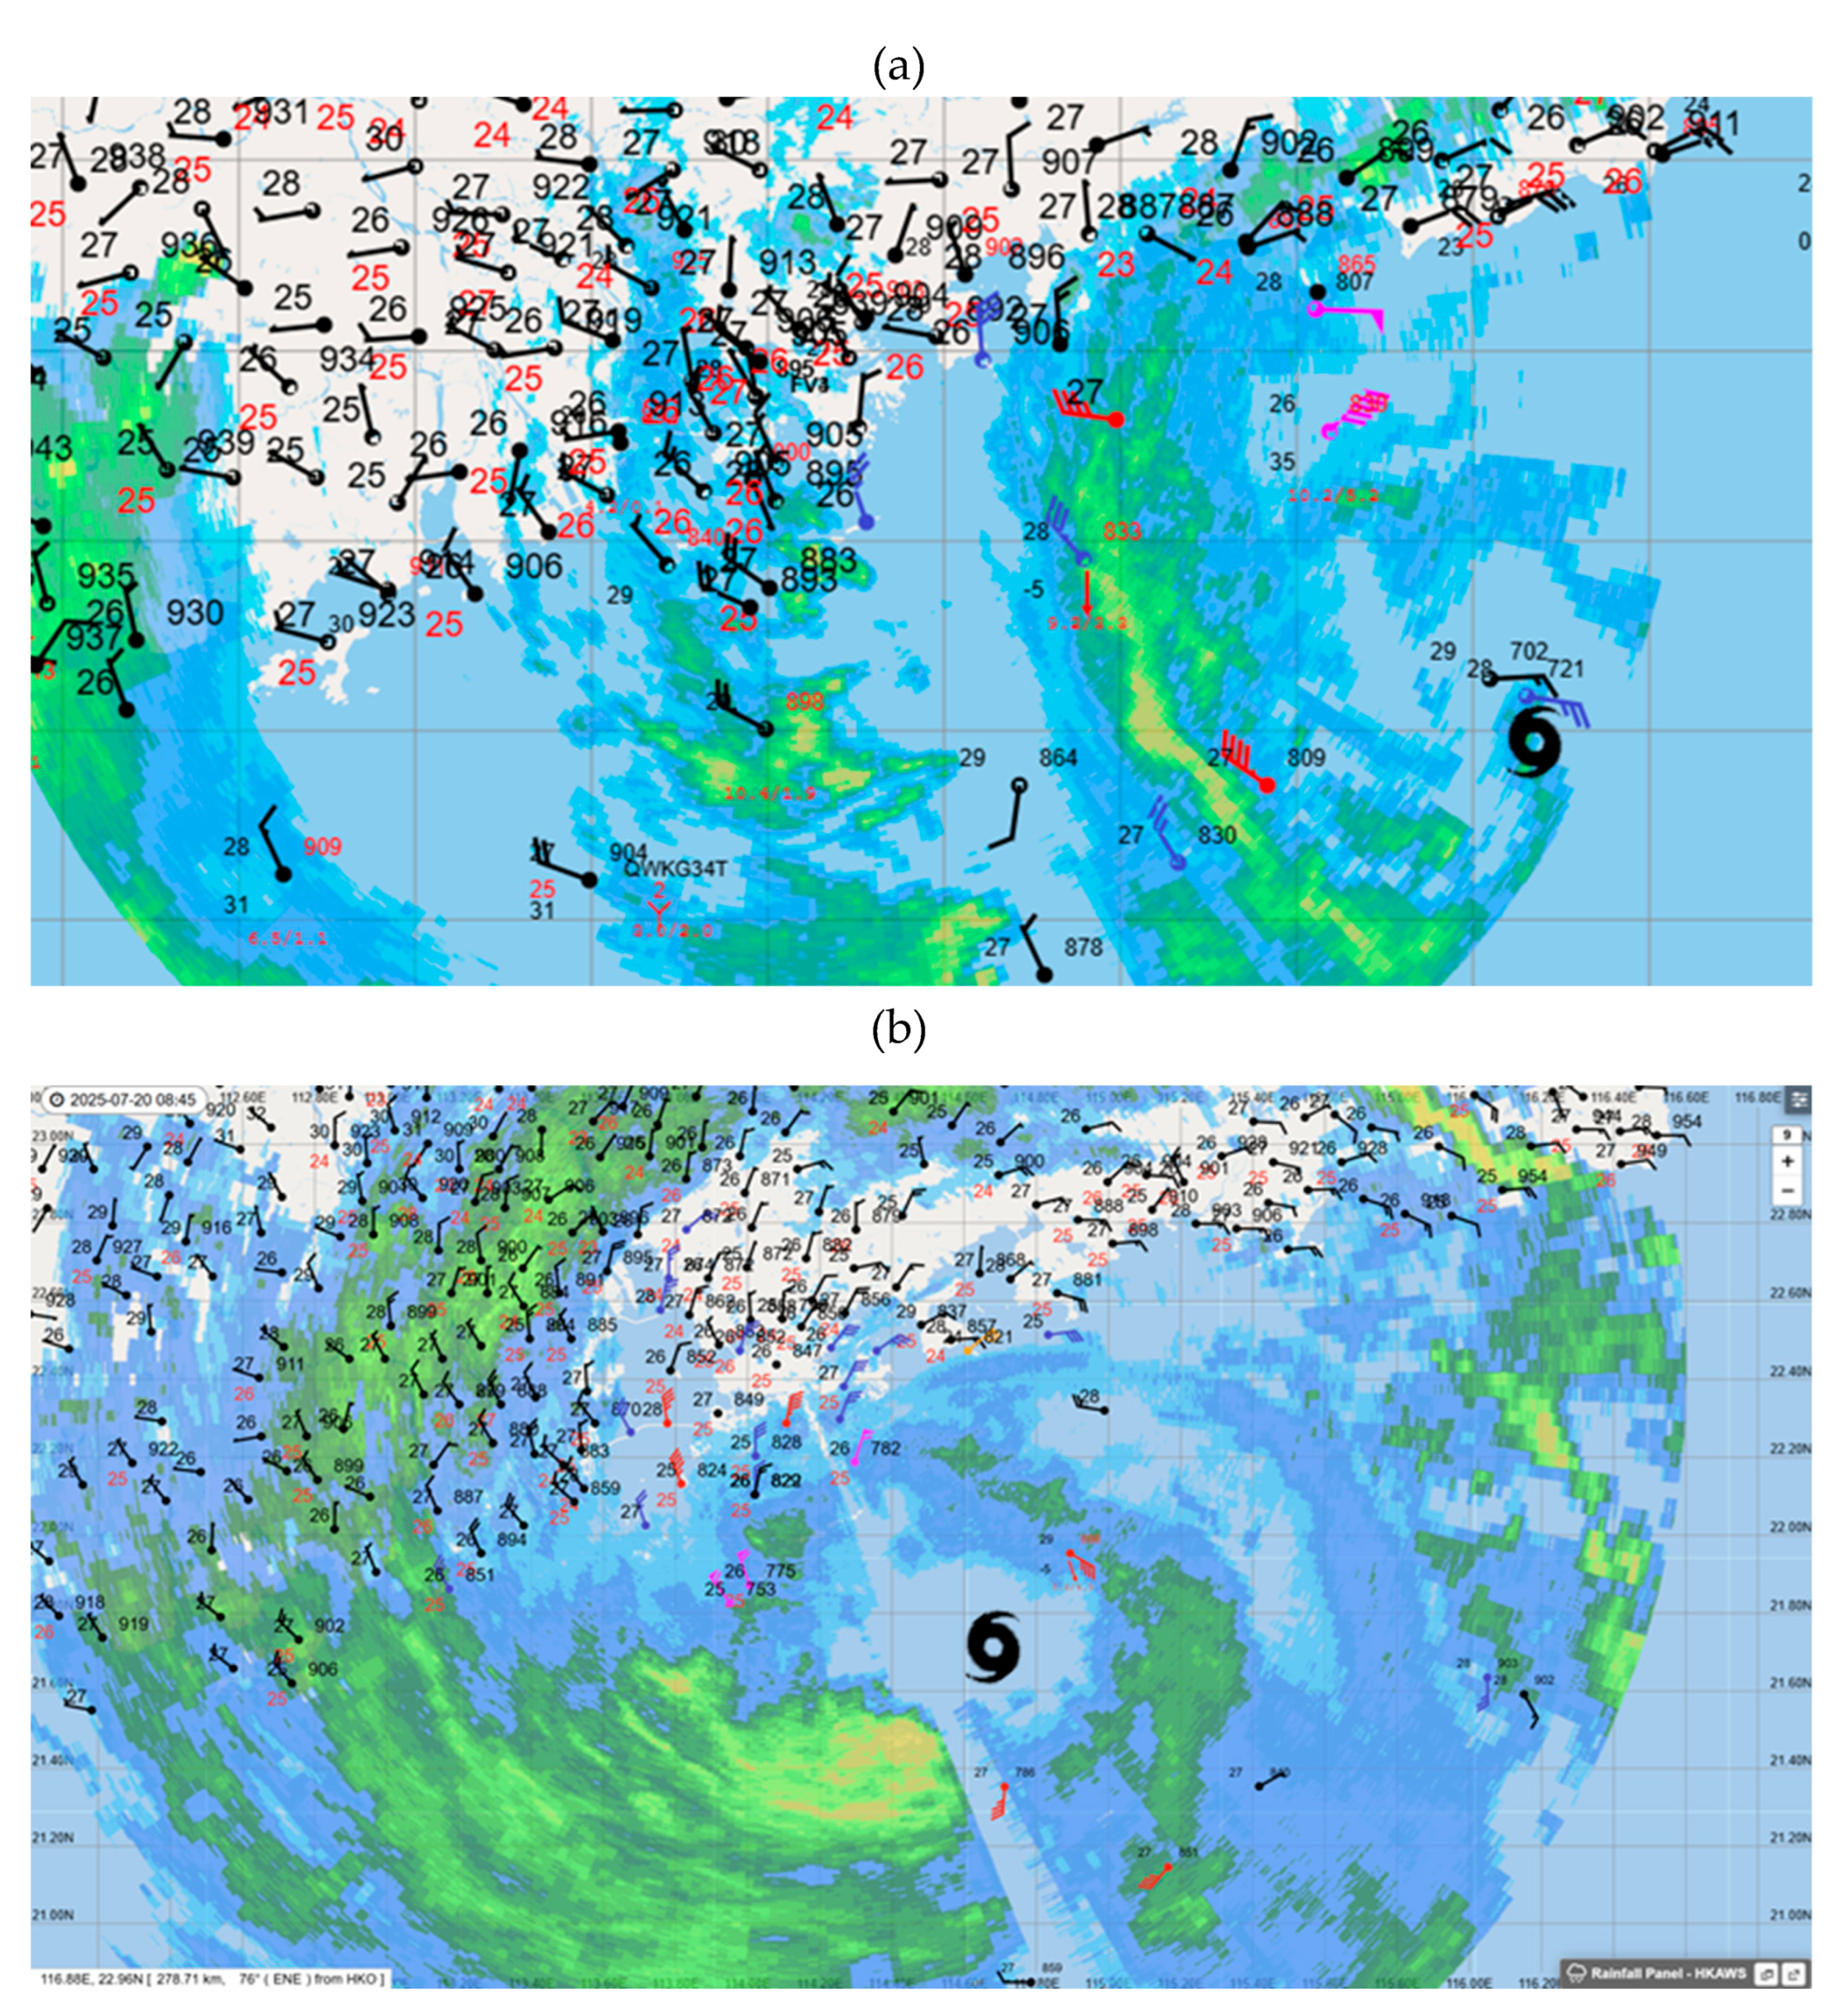
Figure 4.
Surface wind and pressure observations from automatic weather stations, buoys, and oil rigs, overlaid on radar reflectivity imagery (a) at 10:00 am and (b) 11:36 am local time on 20 July 2025. The approximate position of Wipha is marked with a TC symbol.
Figure 4.
Surface wind and pressure observations from automatic weather stations, buoys, and oil rigs, overlaid on radar reflectivity imagery (a) at 10:00 am and (b) 11:36 am local time on 20 July 2025. The approximate position of Wipha is marked with a TC symbol.
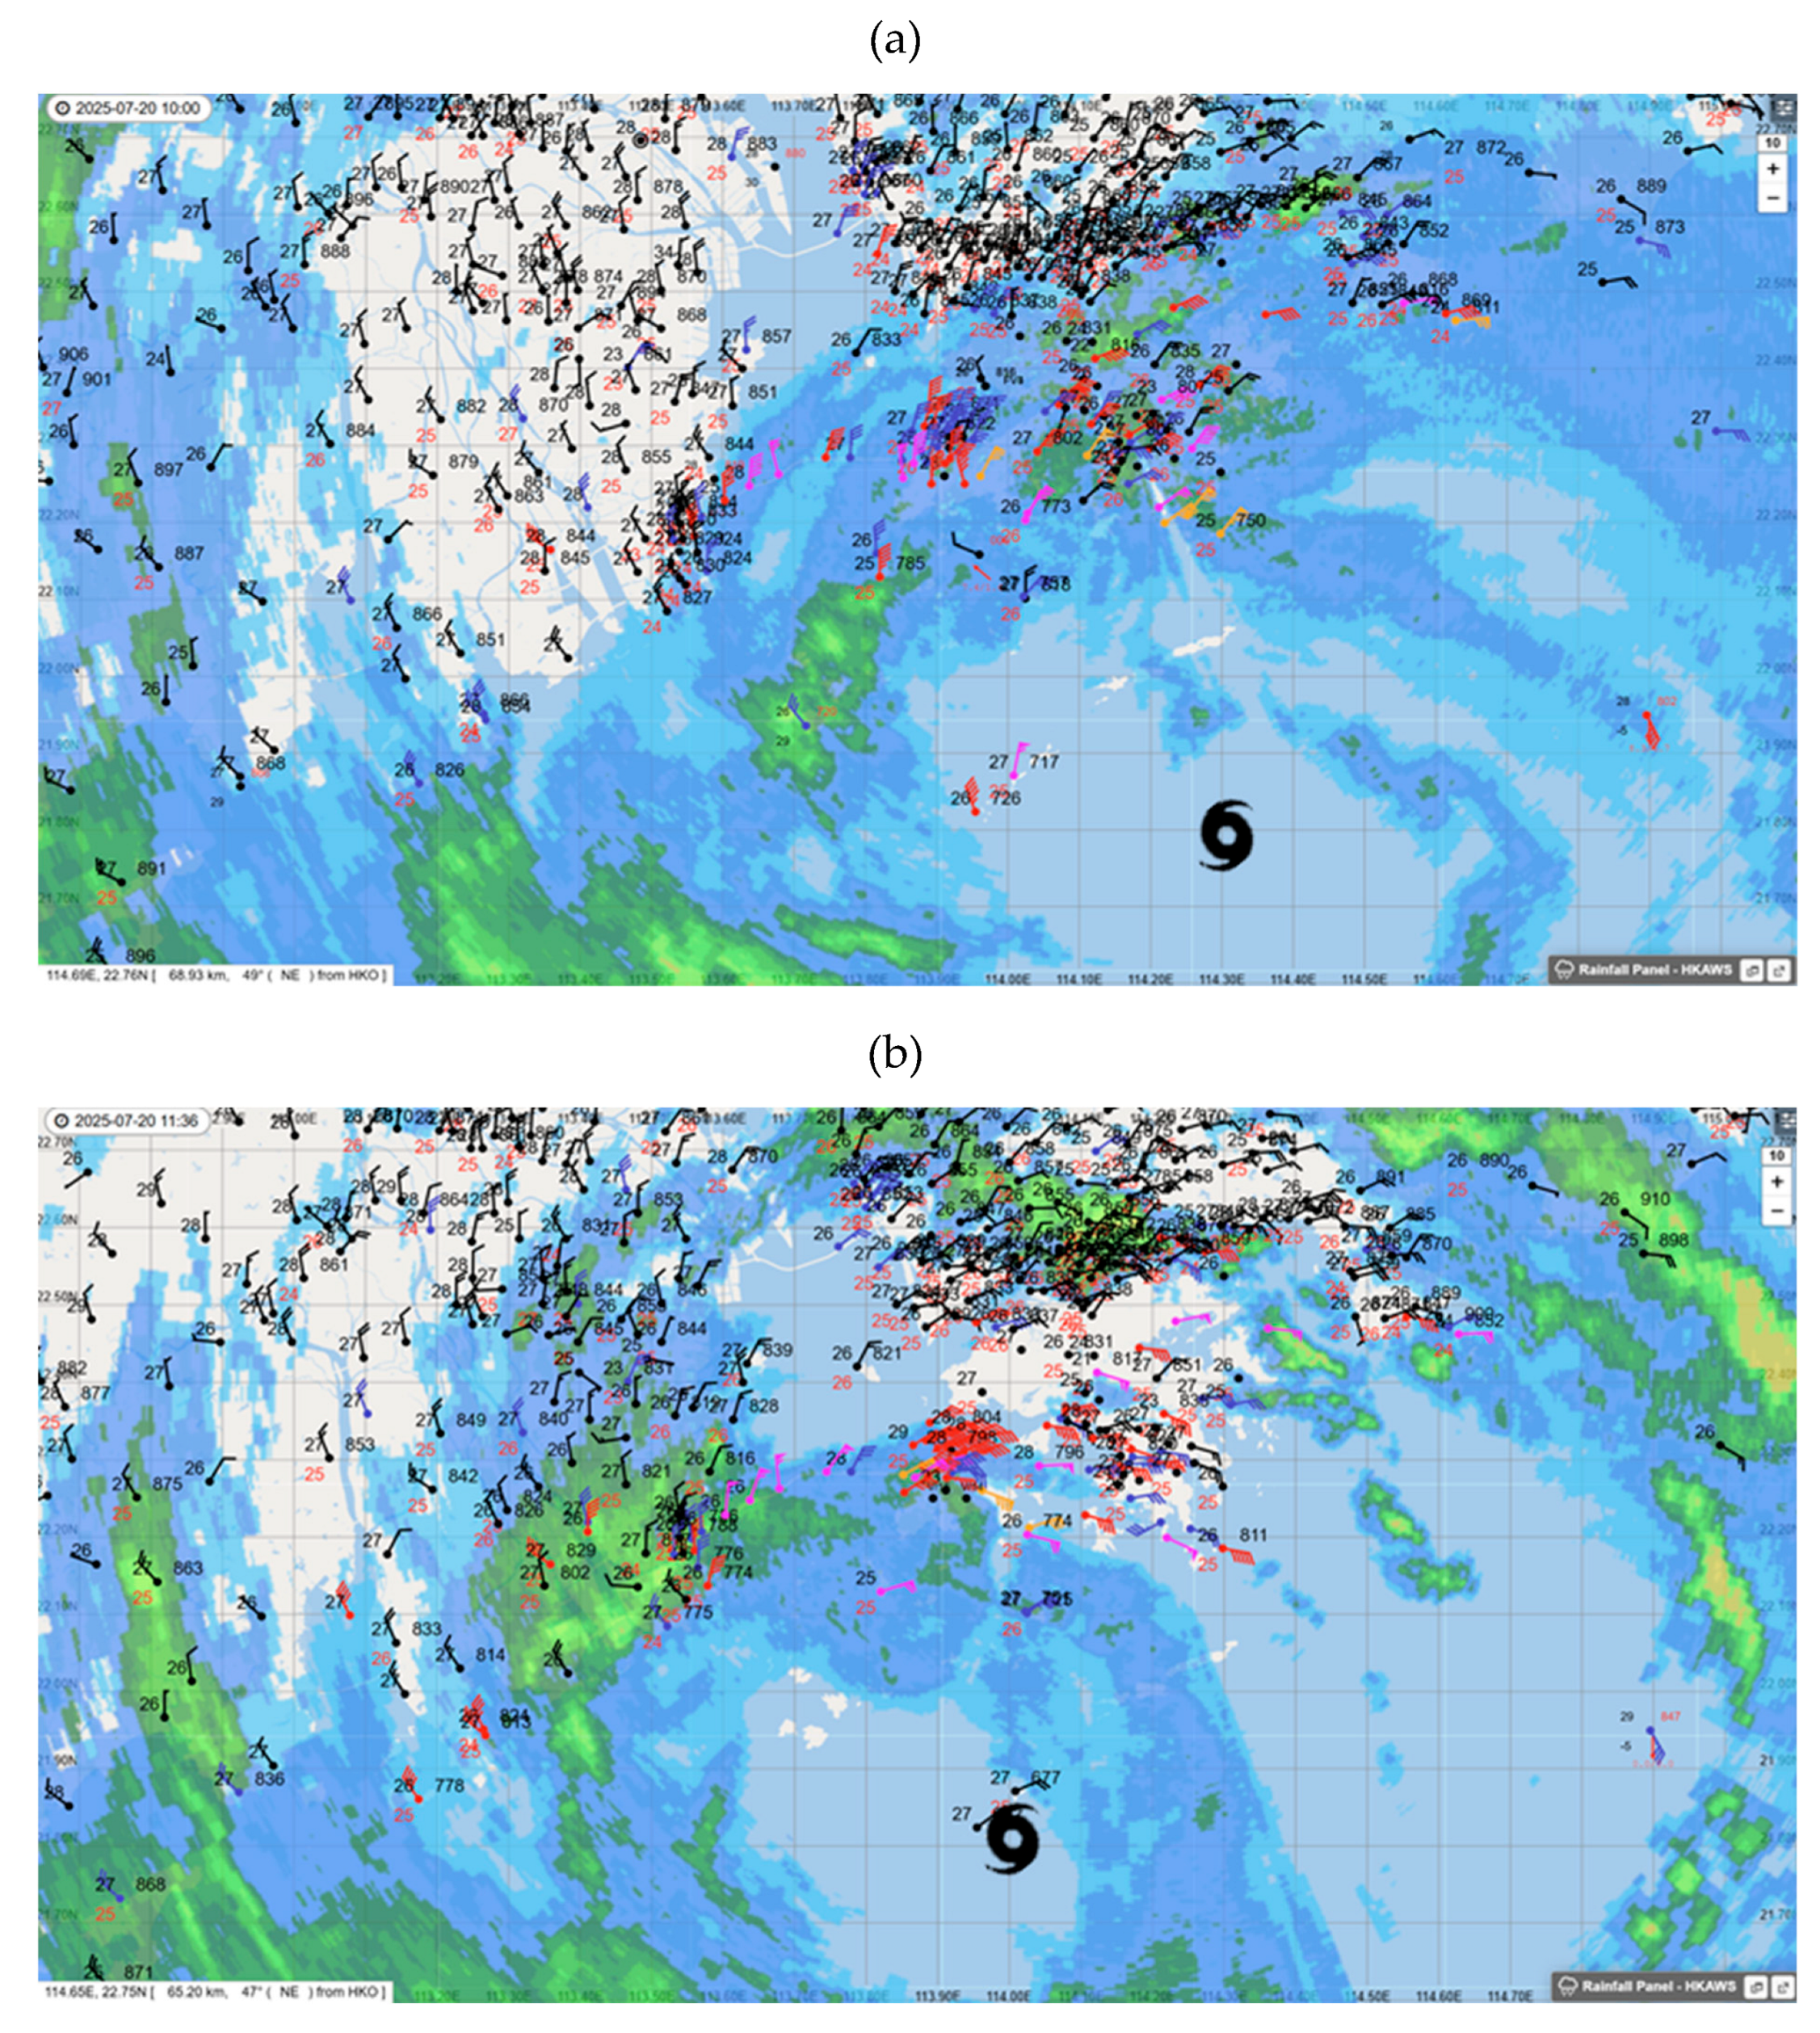
Figure 5.
Surface wind and pressure observations from automatic weather stations, buoys, and oil rigs, overlaid on radar reflectivity imagery (a) at noon and (b) 01:00 pm local time on 20 July 2025. The approximate position of Wipha is marked with a TC symbol.
Figure 5.
Surface wind and pressure observations from automatic weather stations, buoys, and oil rigs, overlaid on radar reflectivity imagery (a) at noon and (b) 01:00 pm local time on 20 July 2025. The approximate position of Wipha is marked with a TC symbol.
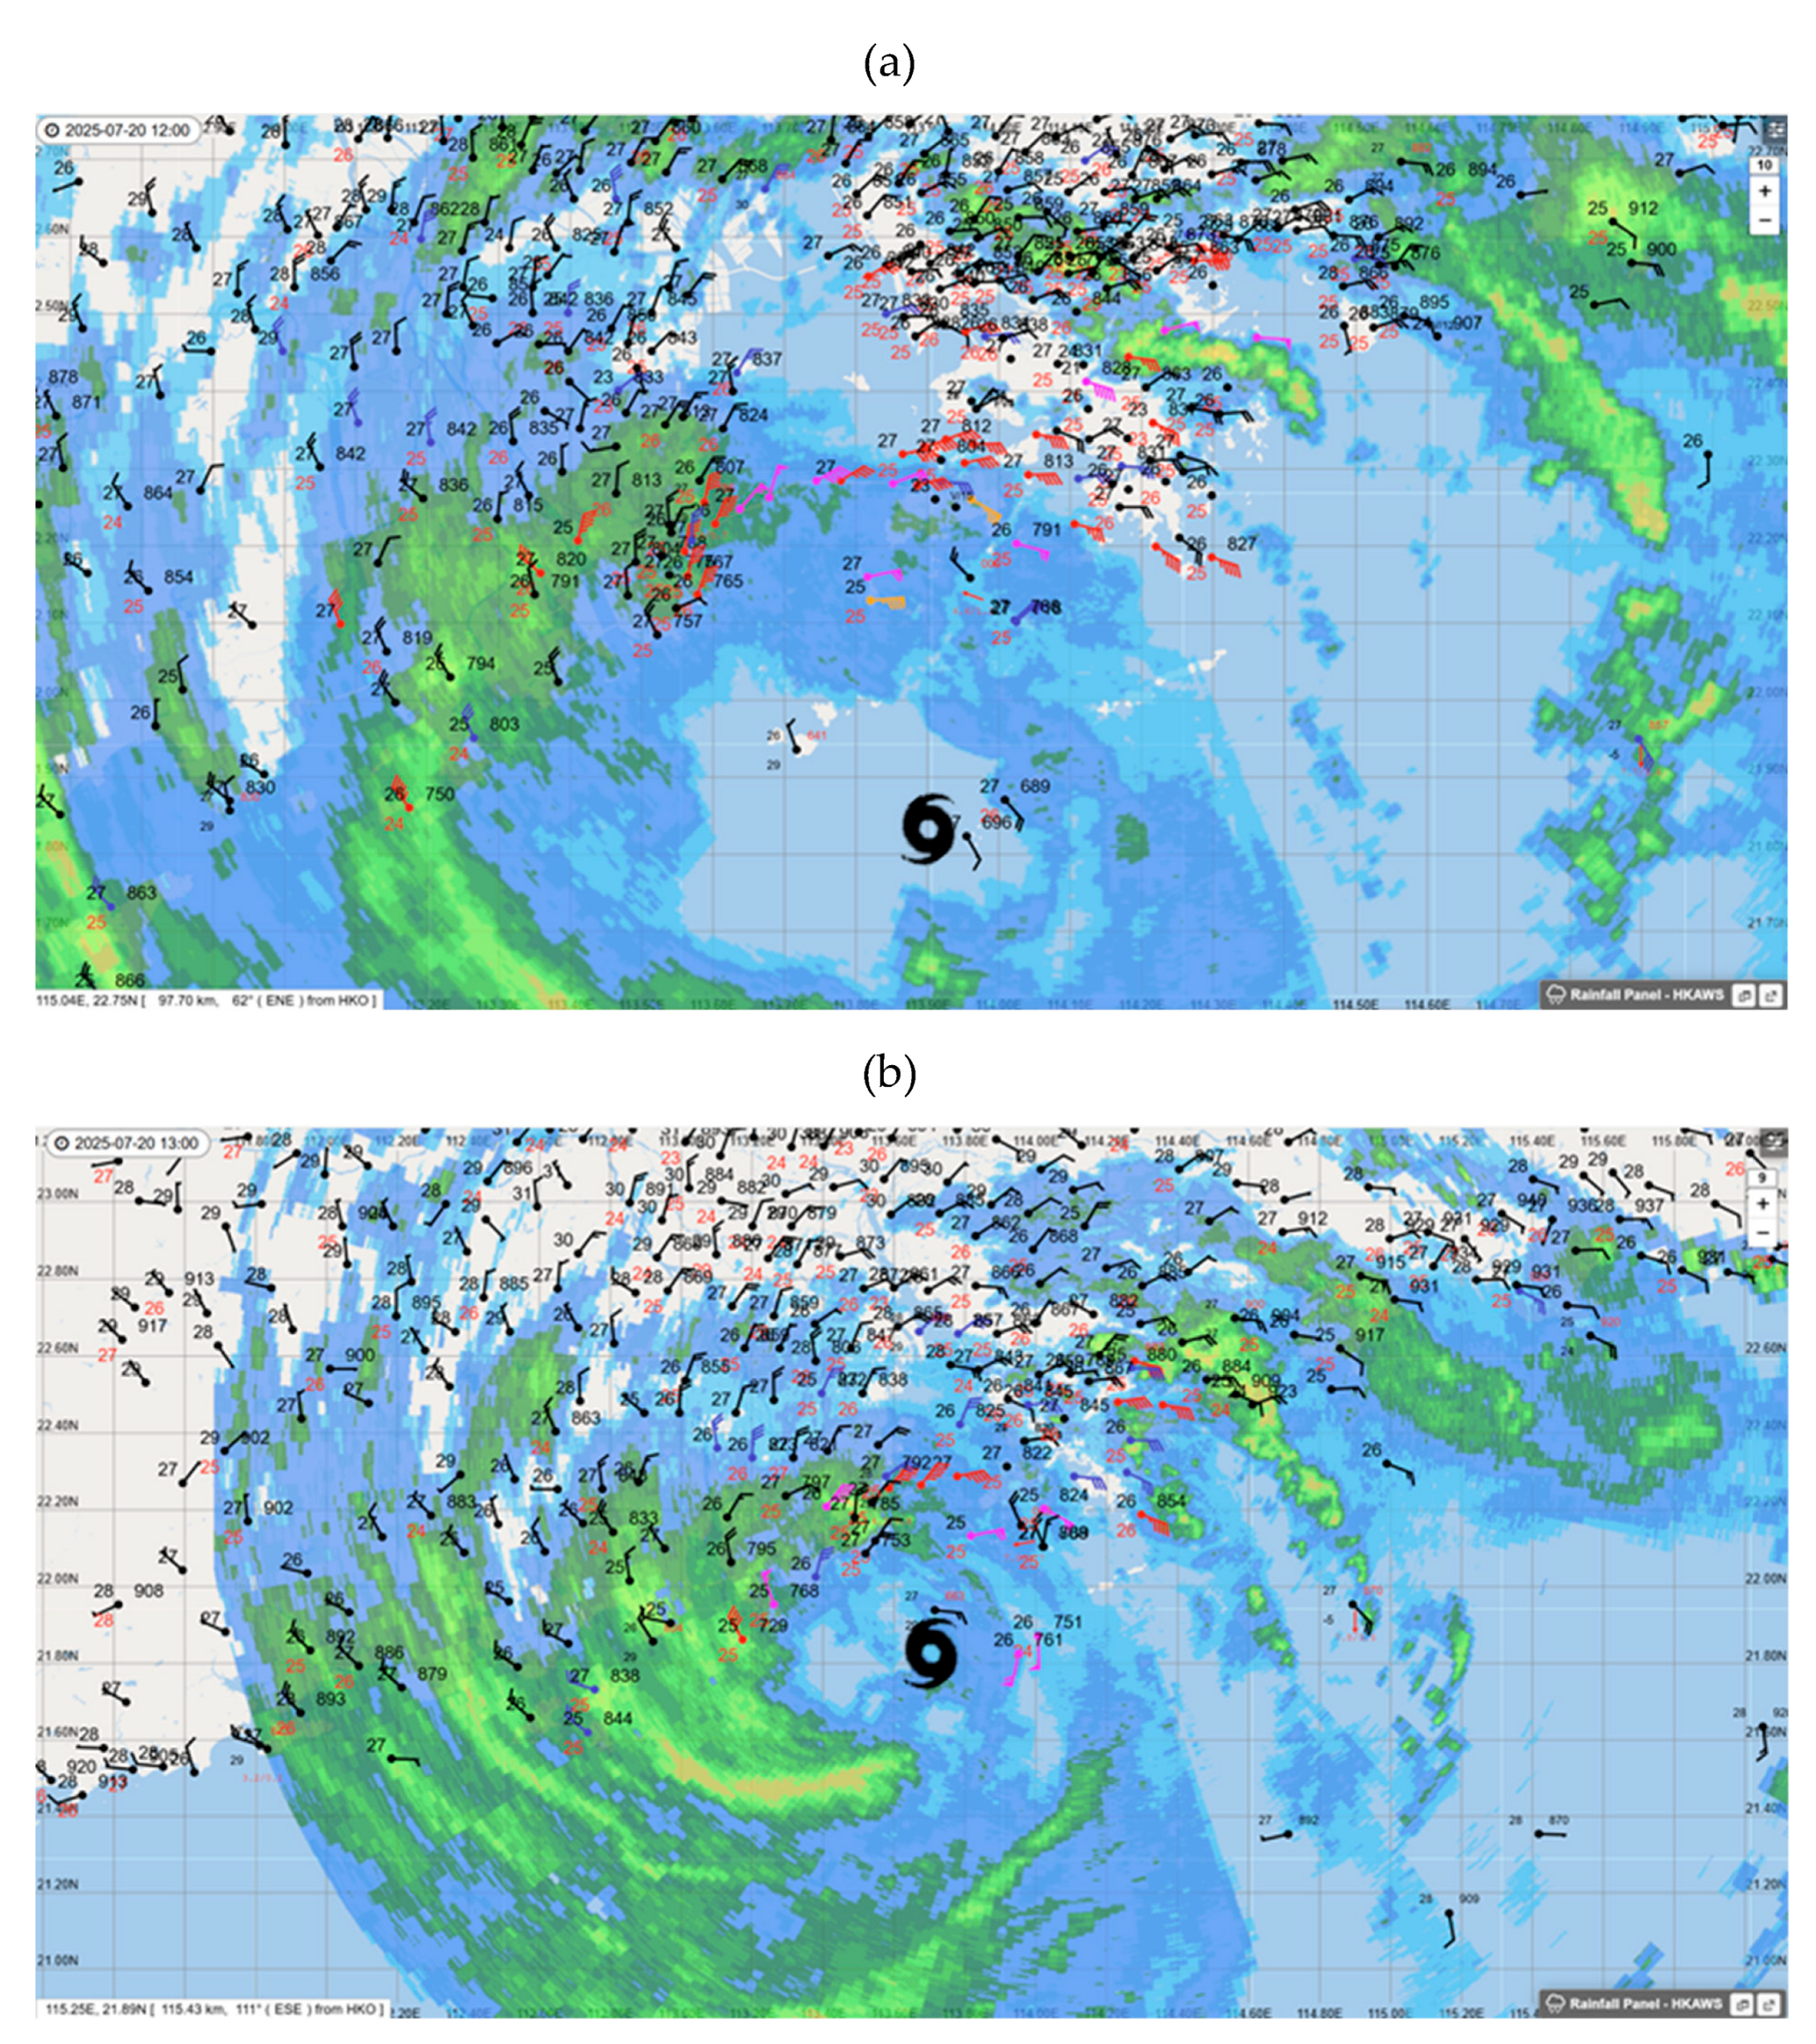
Figure 6.
Doppler wind velocity from PPI scanning at an elevation of 0.1 degrees from: (a) the Tate’s Cairn weather radar at 06:39 am local time on 20 July 2025 or 2239 UTC on 19 July 2025; and (b) the Zhu Ao weather radar at 11:00 am local time or 0300 UTC on 20 July 2025. The approximate position of Wipha is marked with a TC symbol. The signals in the area pointed to by a blue arrow are contaminated by high sea waves.
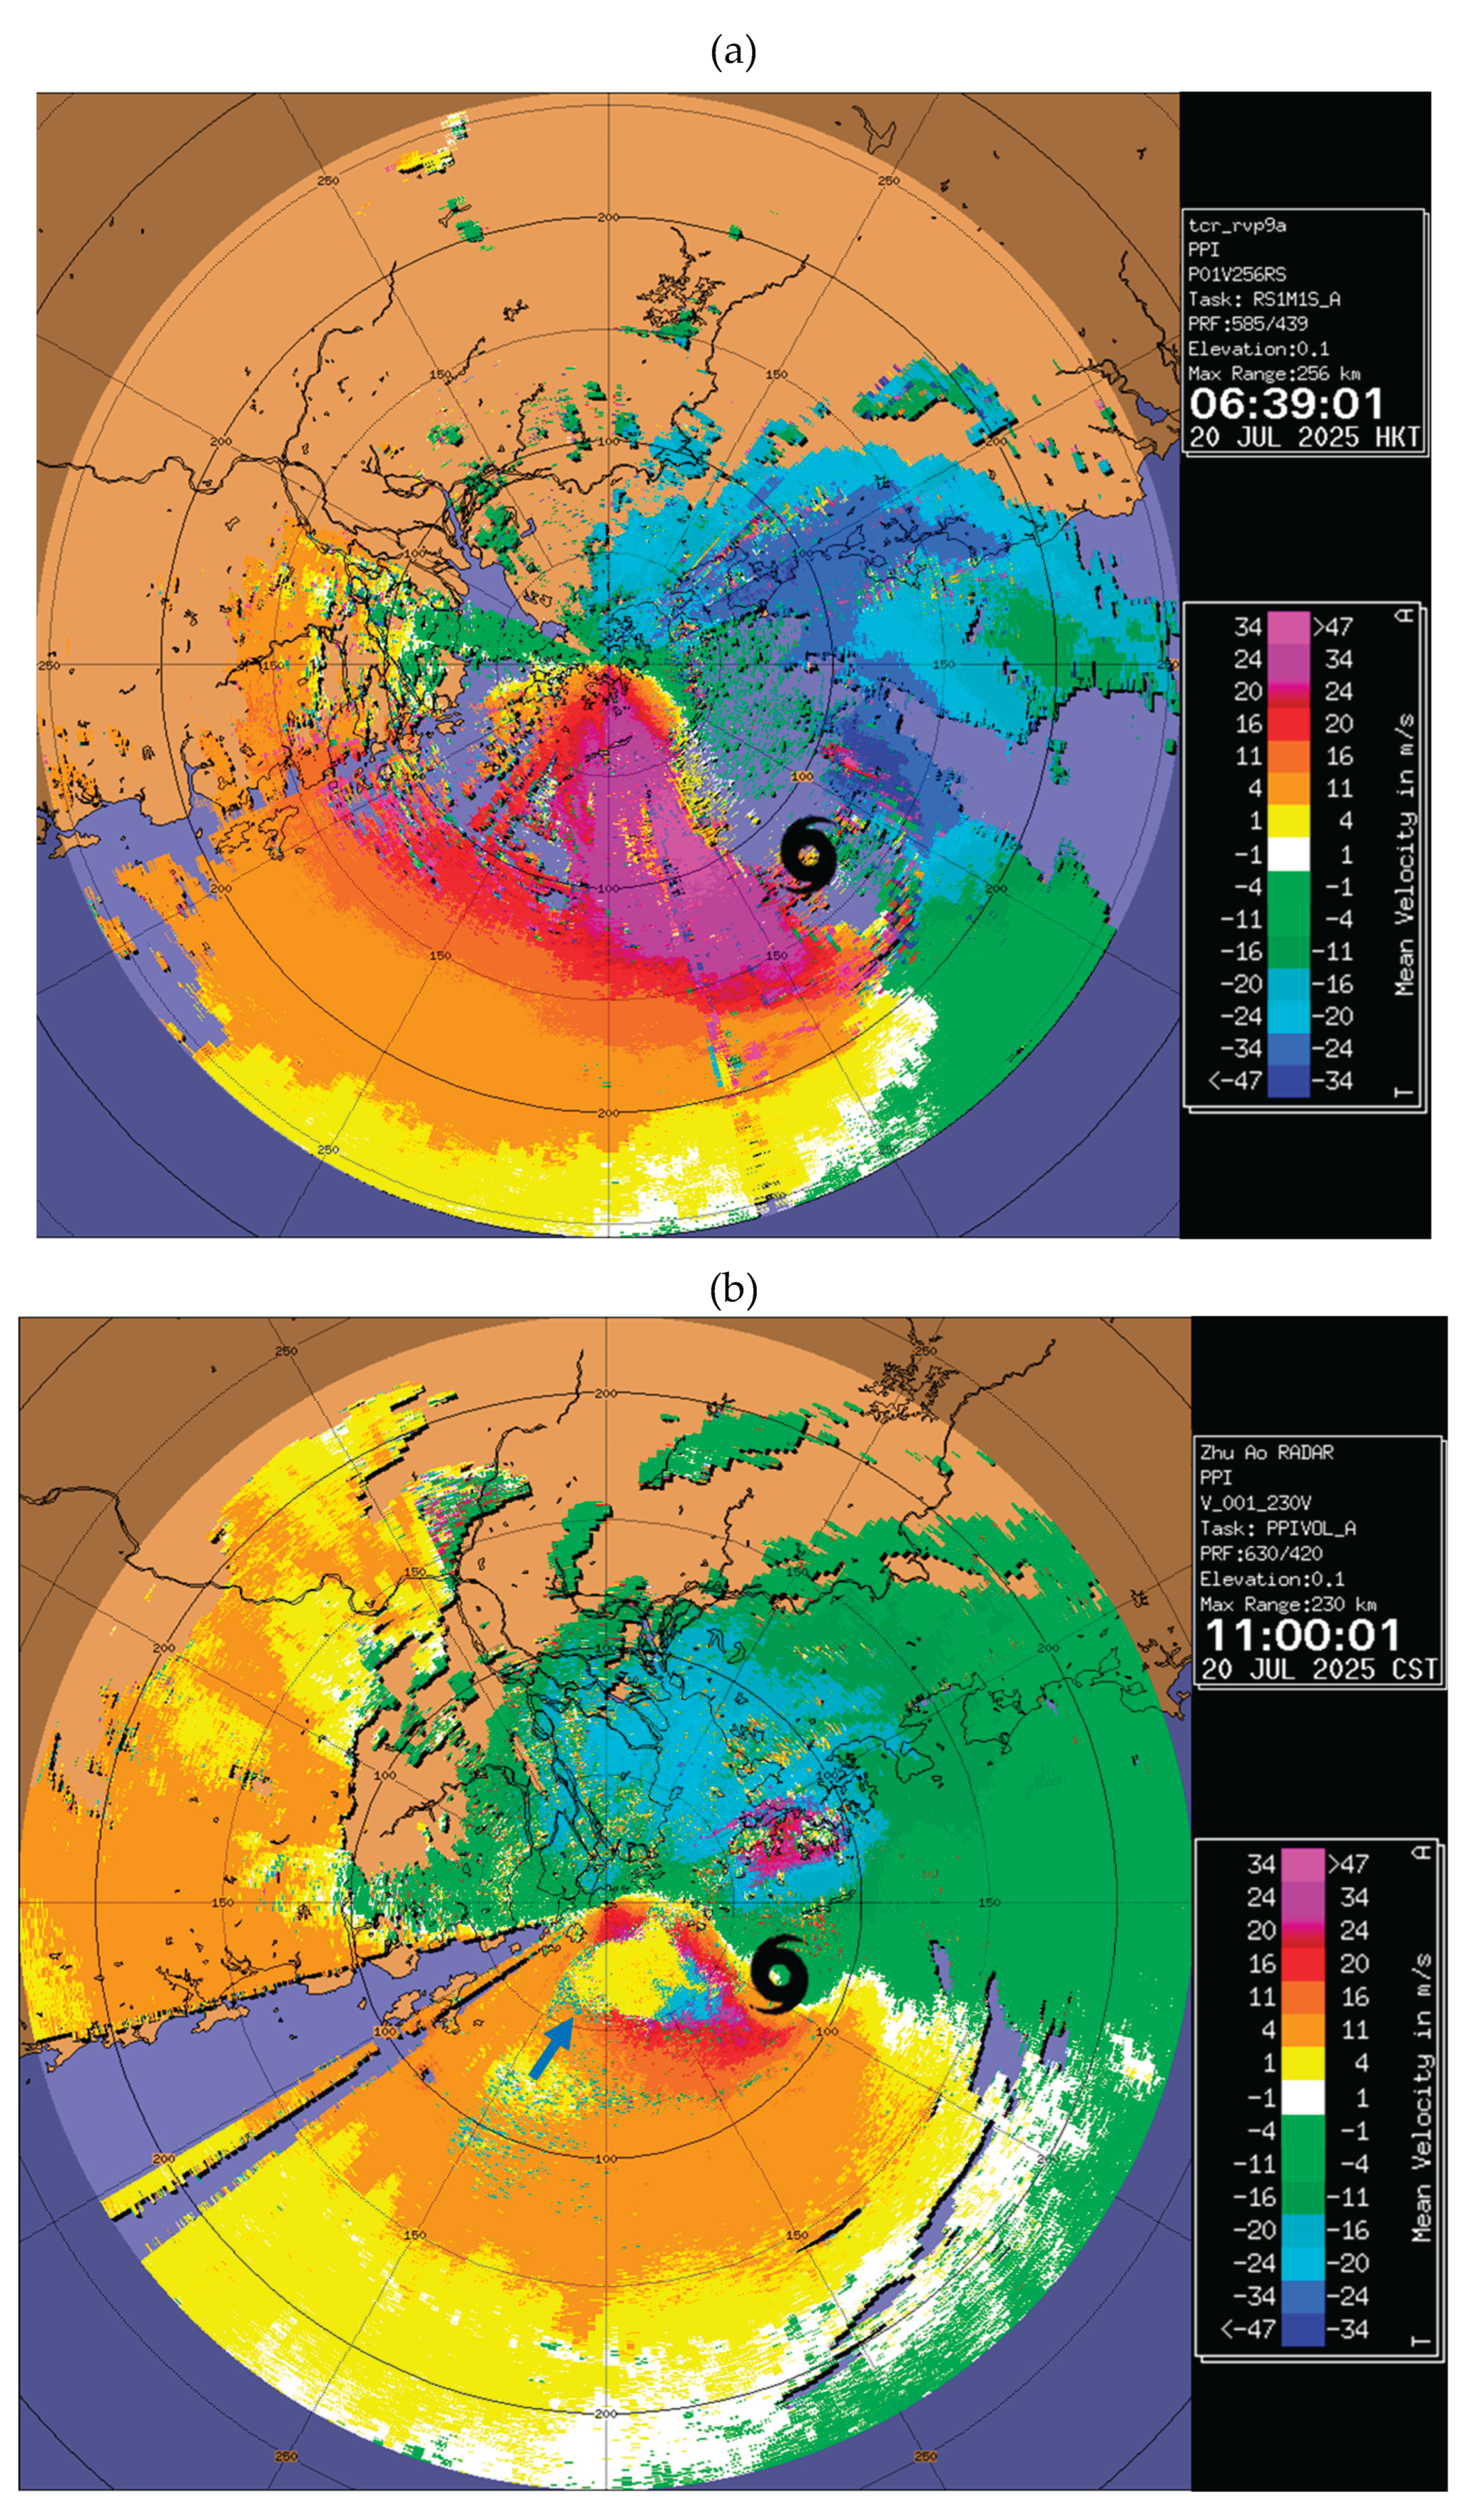
Figure 7.
a. Lightning recorded from 0030 UTC to 0100 UTC of 20 July 2025, overlaid on radar reflectivity image and surface wind observations at 0100 UTC. (b) Hot-tower coloured imagery from the Himawari-9 satellite at 0100 UTC of 20 July 2025. In this colour scale, infrared brightness temperatures at 192 K or below are coloured white to aid identification of the hot tower signature, that is, the white patch near the typhoon centre as pointed to by the red arrow. The approximate position of Wipha is marked with a TC symbol.
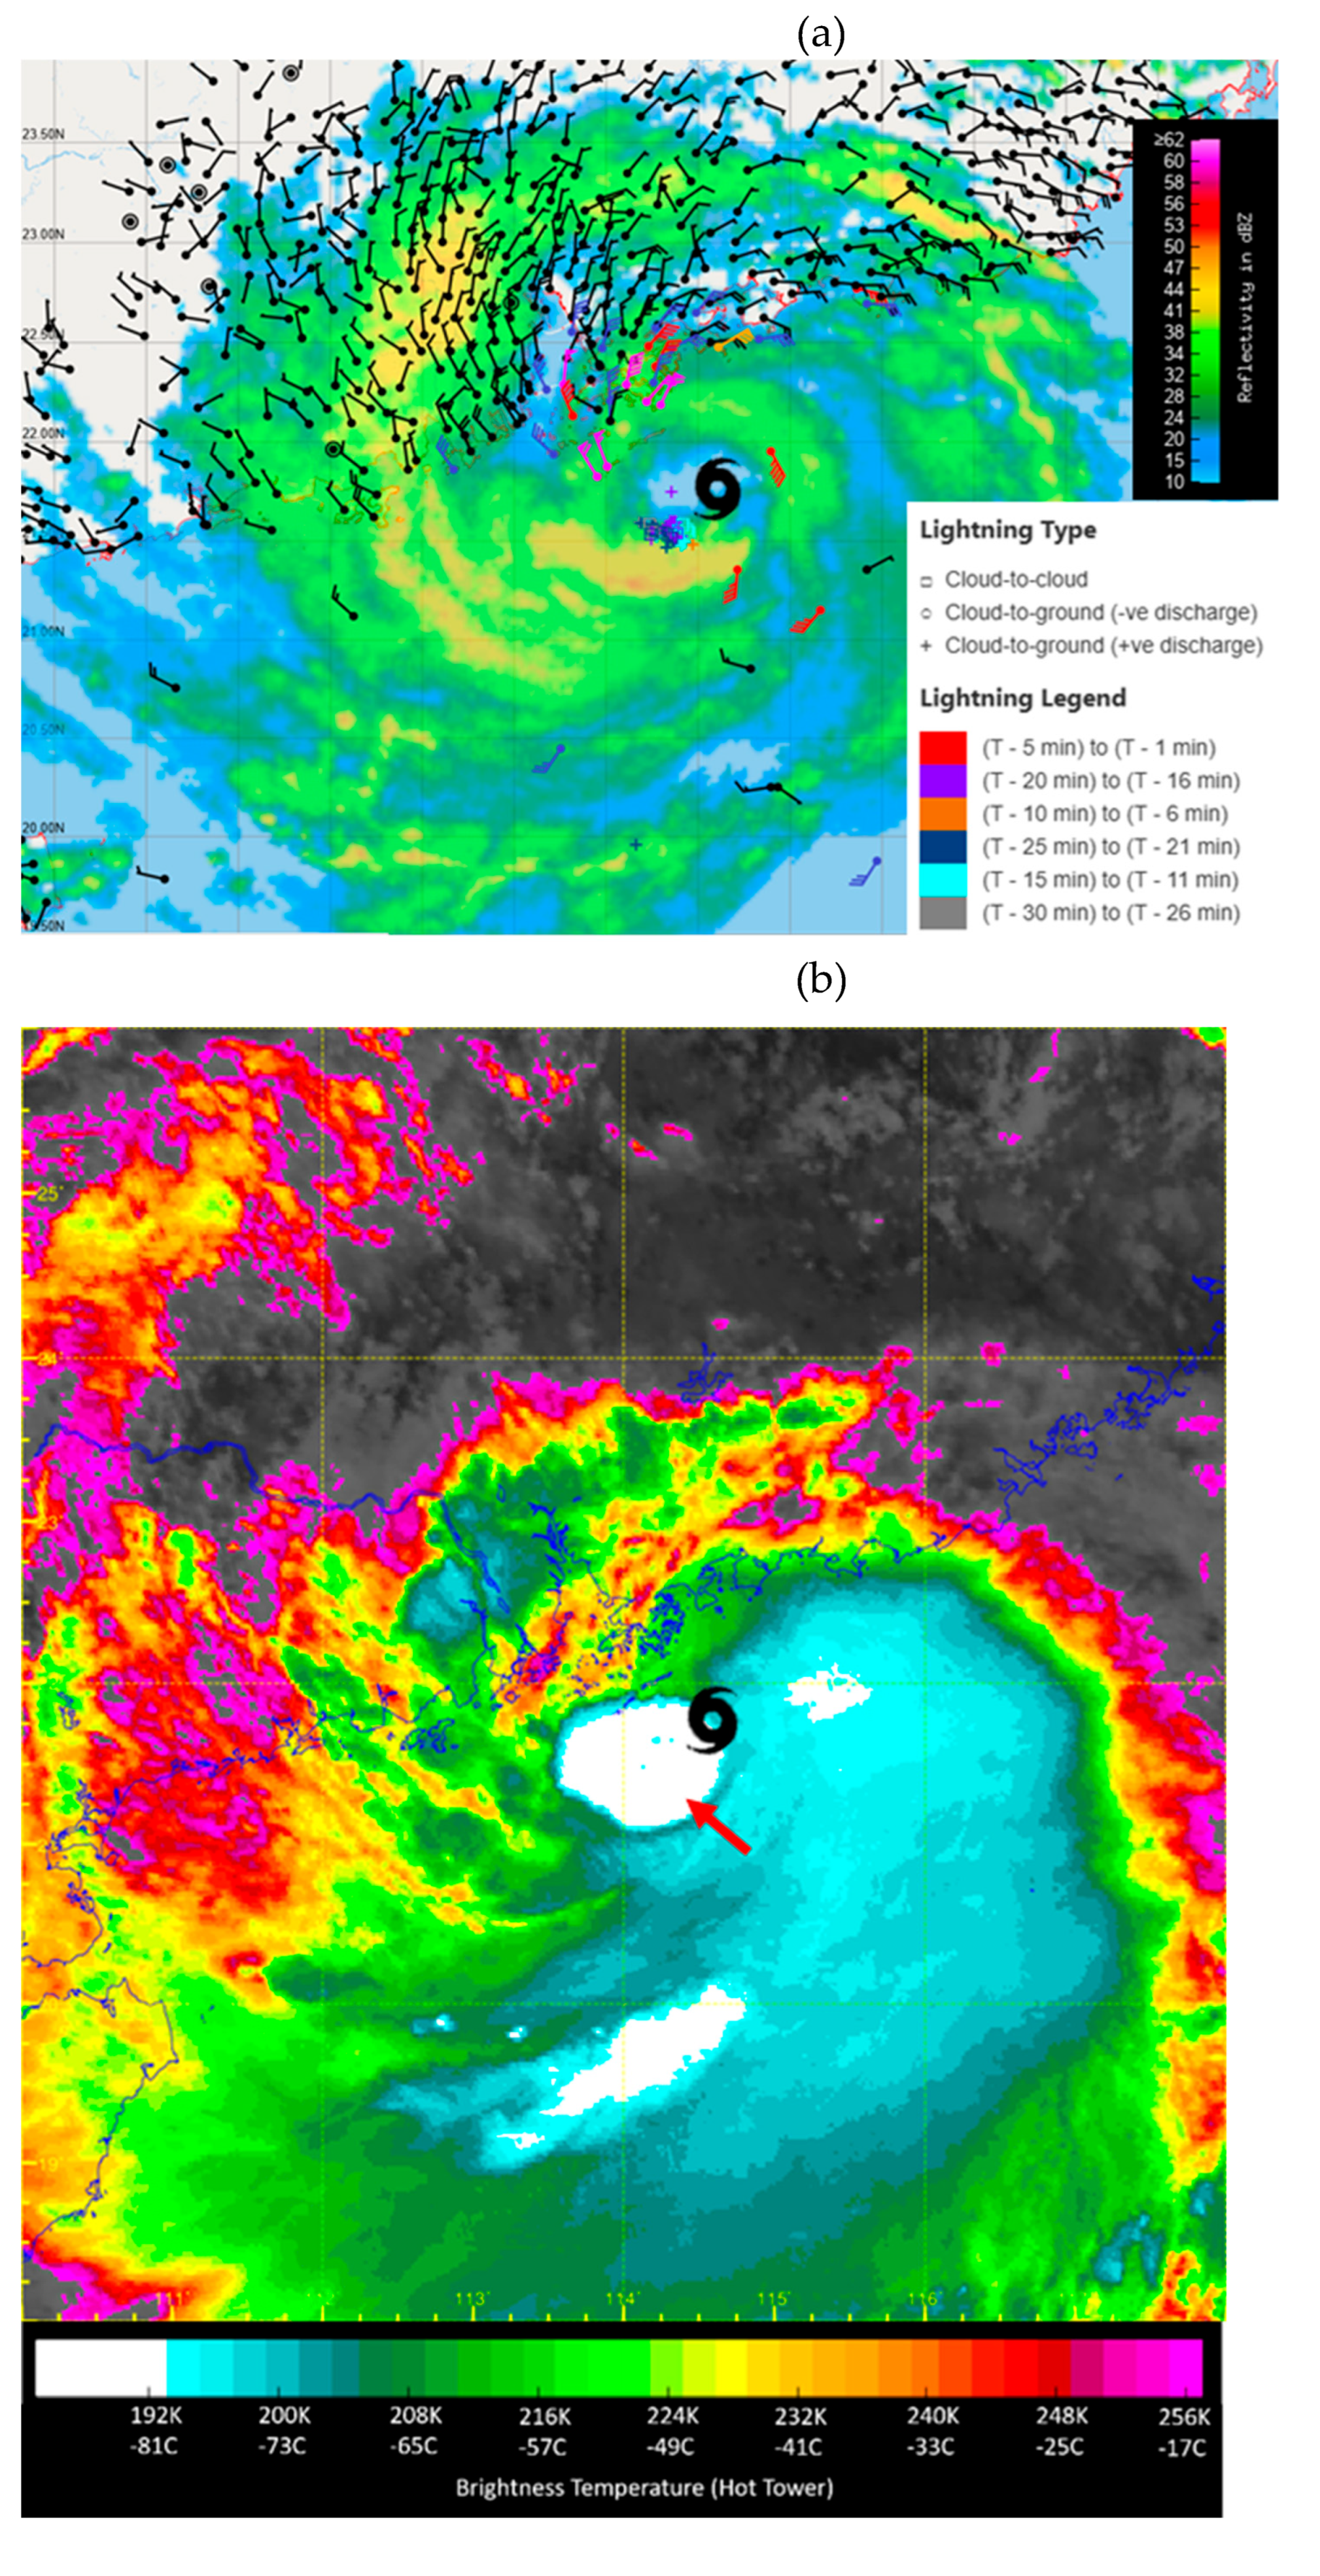
Figure 8.
(a) Vertical winds derived at 3 km height at 0100 UTC on 20 July 2025. (b) The vertical cross-sections of winds along two cuts to the eyewall (the A–B and A'–B' lines in (a)). The approximate position of Wipha is marked with a TC symbol. (c) The horizontal winds derived at 2 km height at 0030 UTC on 20 July 2025, overlaid with recorded lightning locations and 2-km CAPPI radar reflectivity. (d) The vertical cross-section of winds along the A–B line in (c). (e) A full-scale plot of radar reflectivity cross-section, in which a hot tower manifests itself as a tall column with an echo top (20-dBZ) protruding to approximately 15 km high.
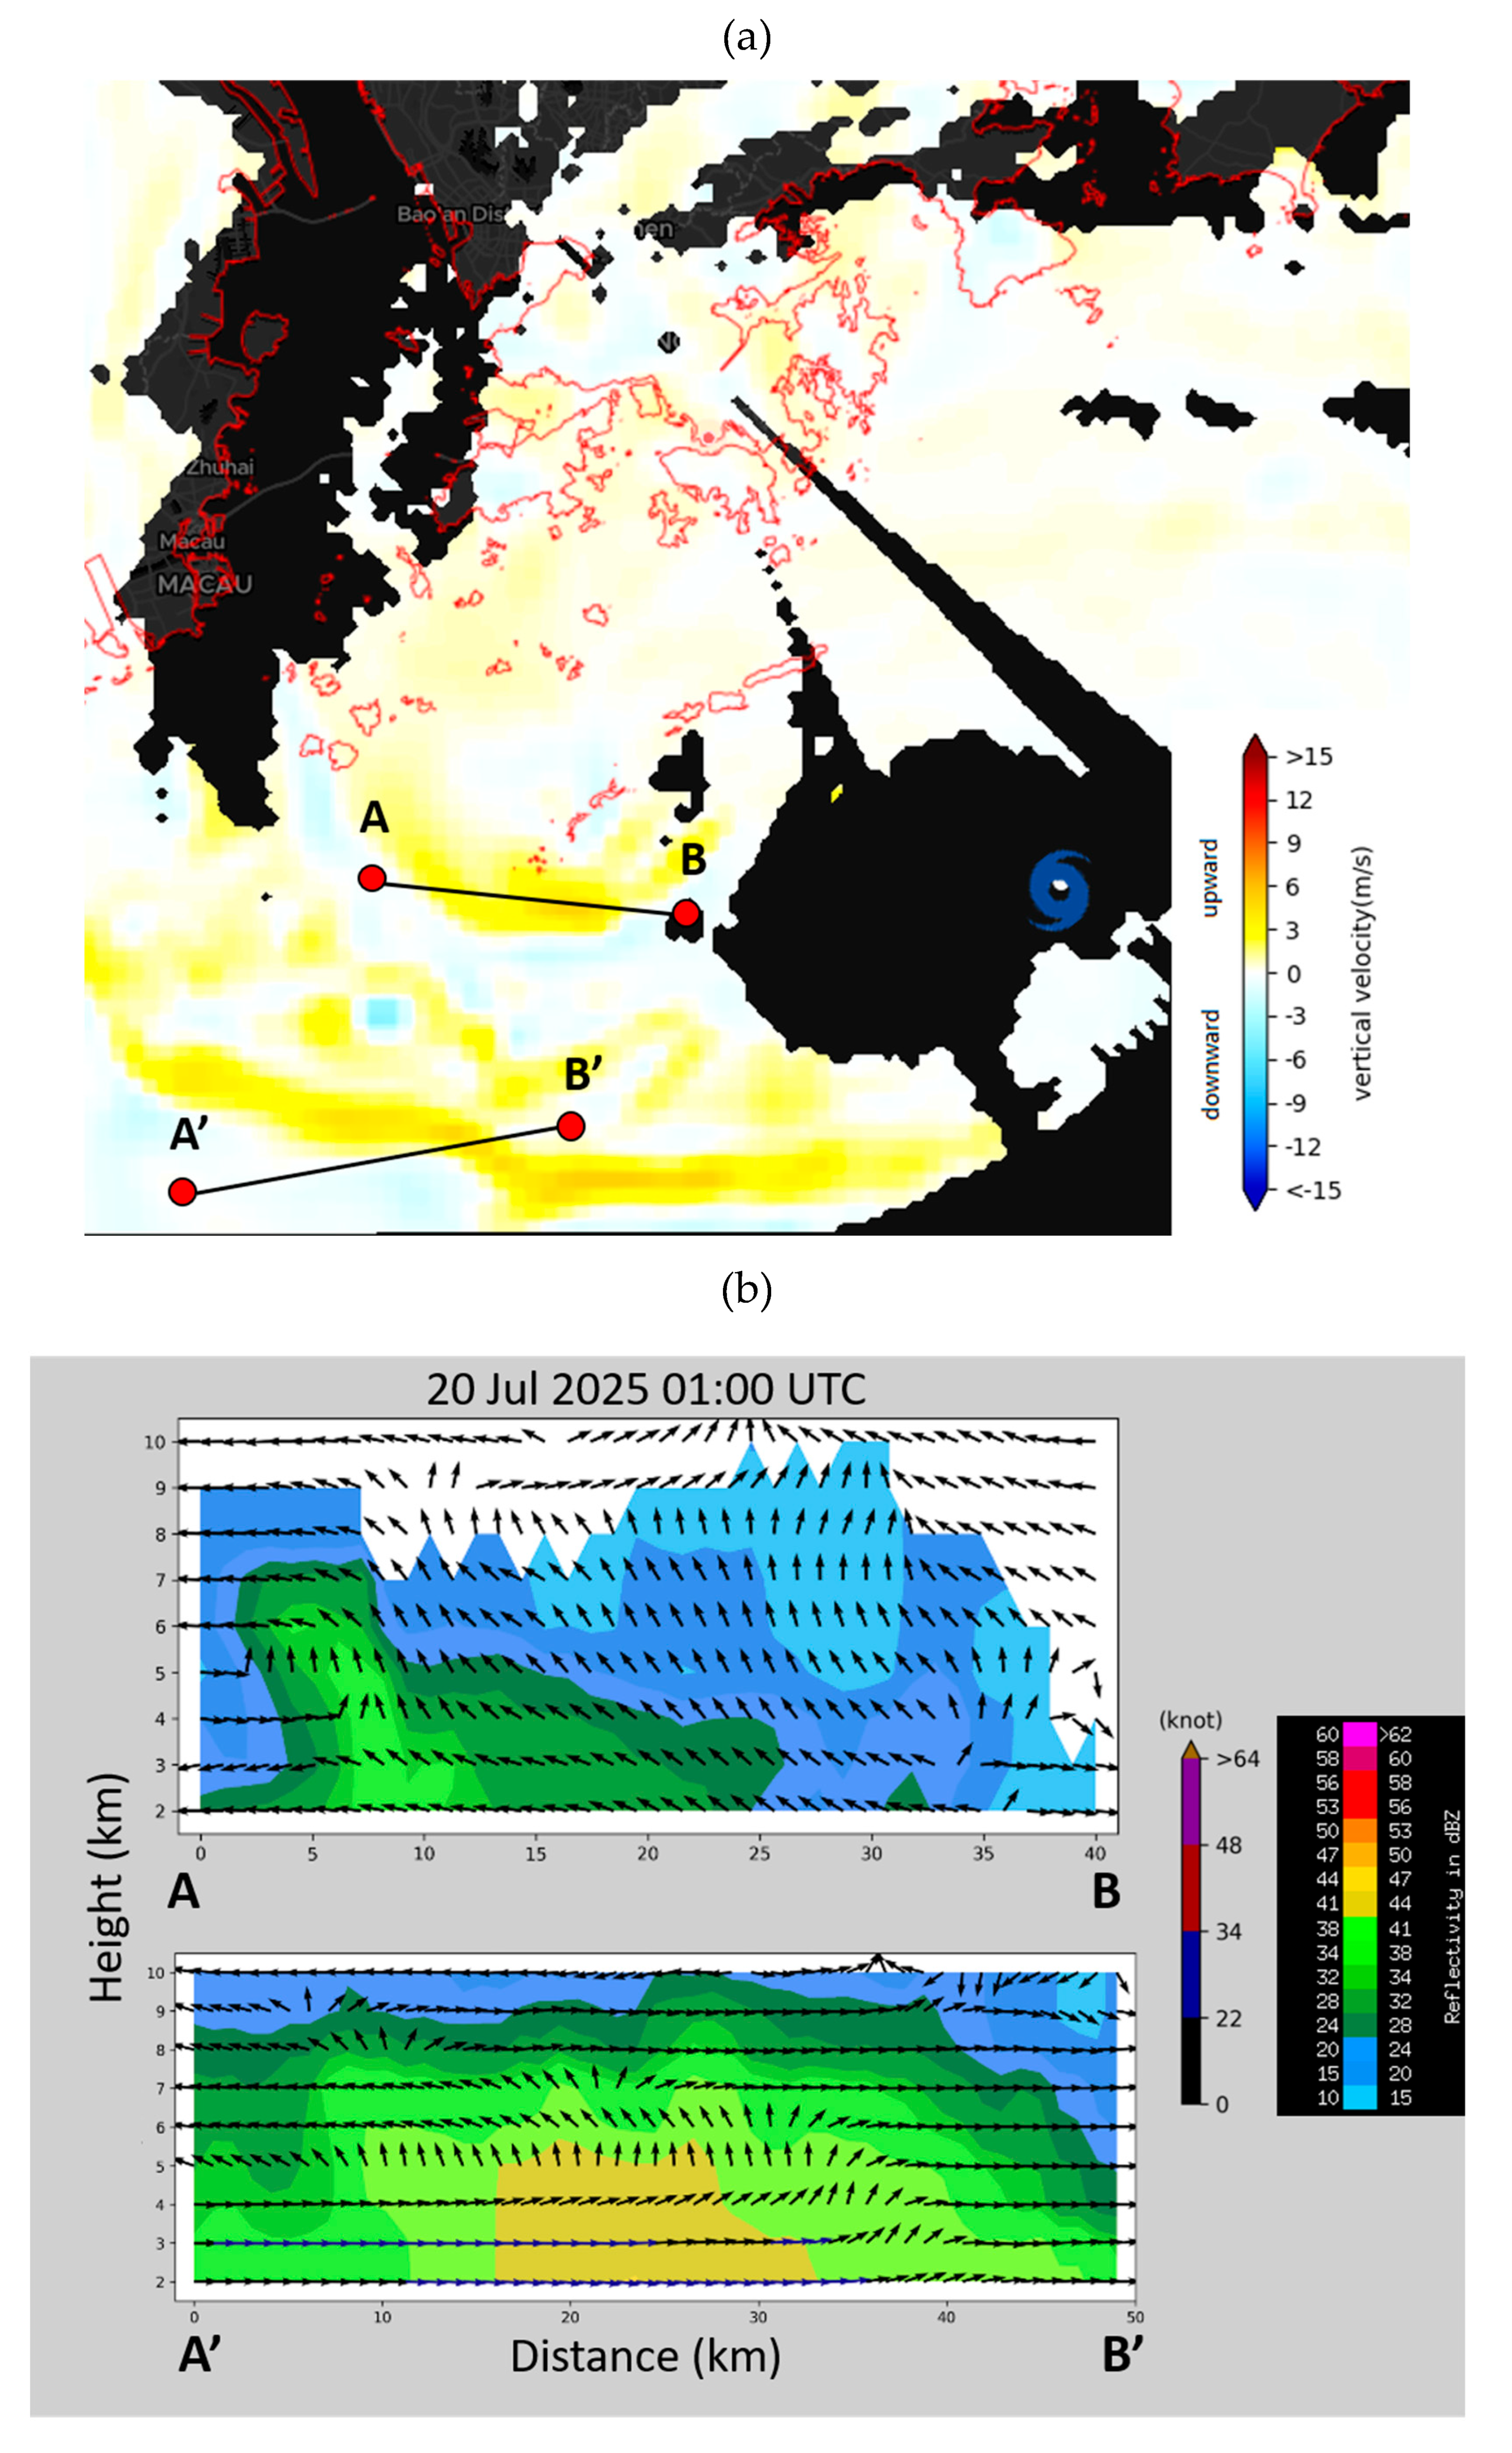
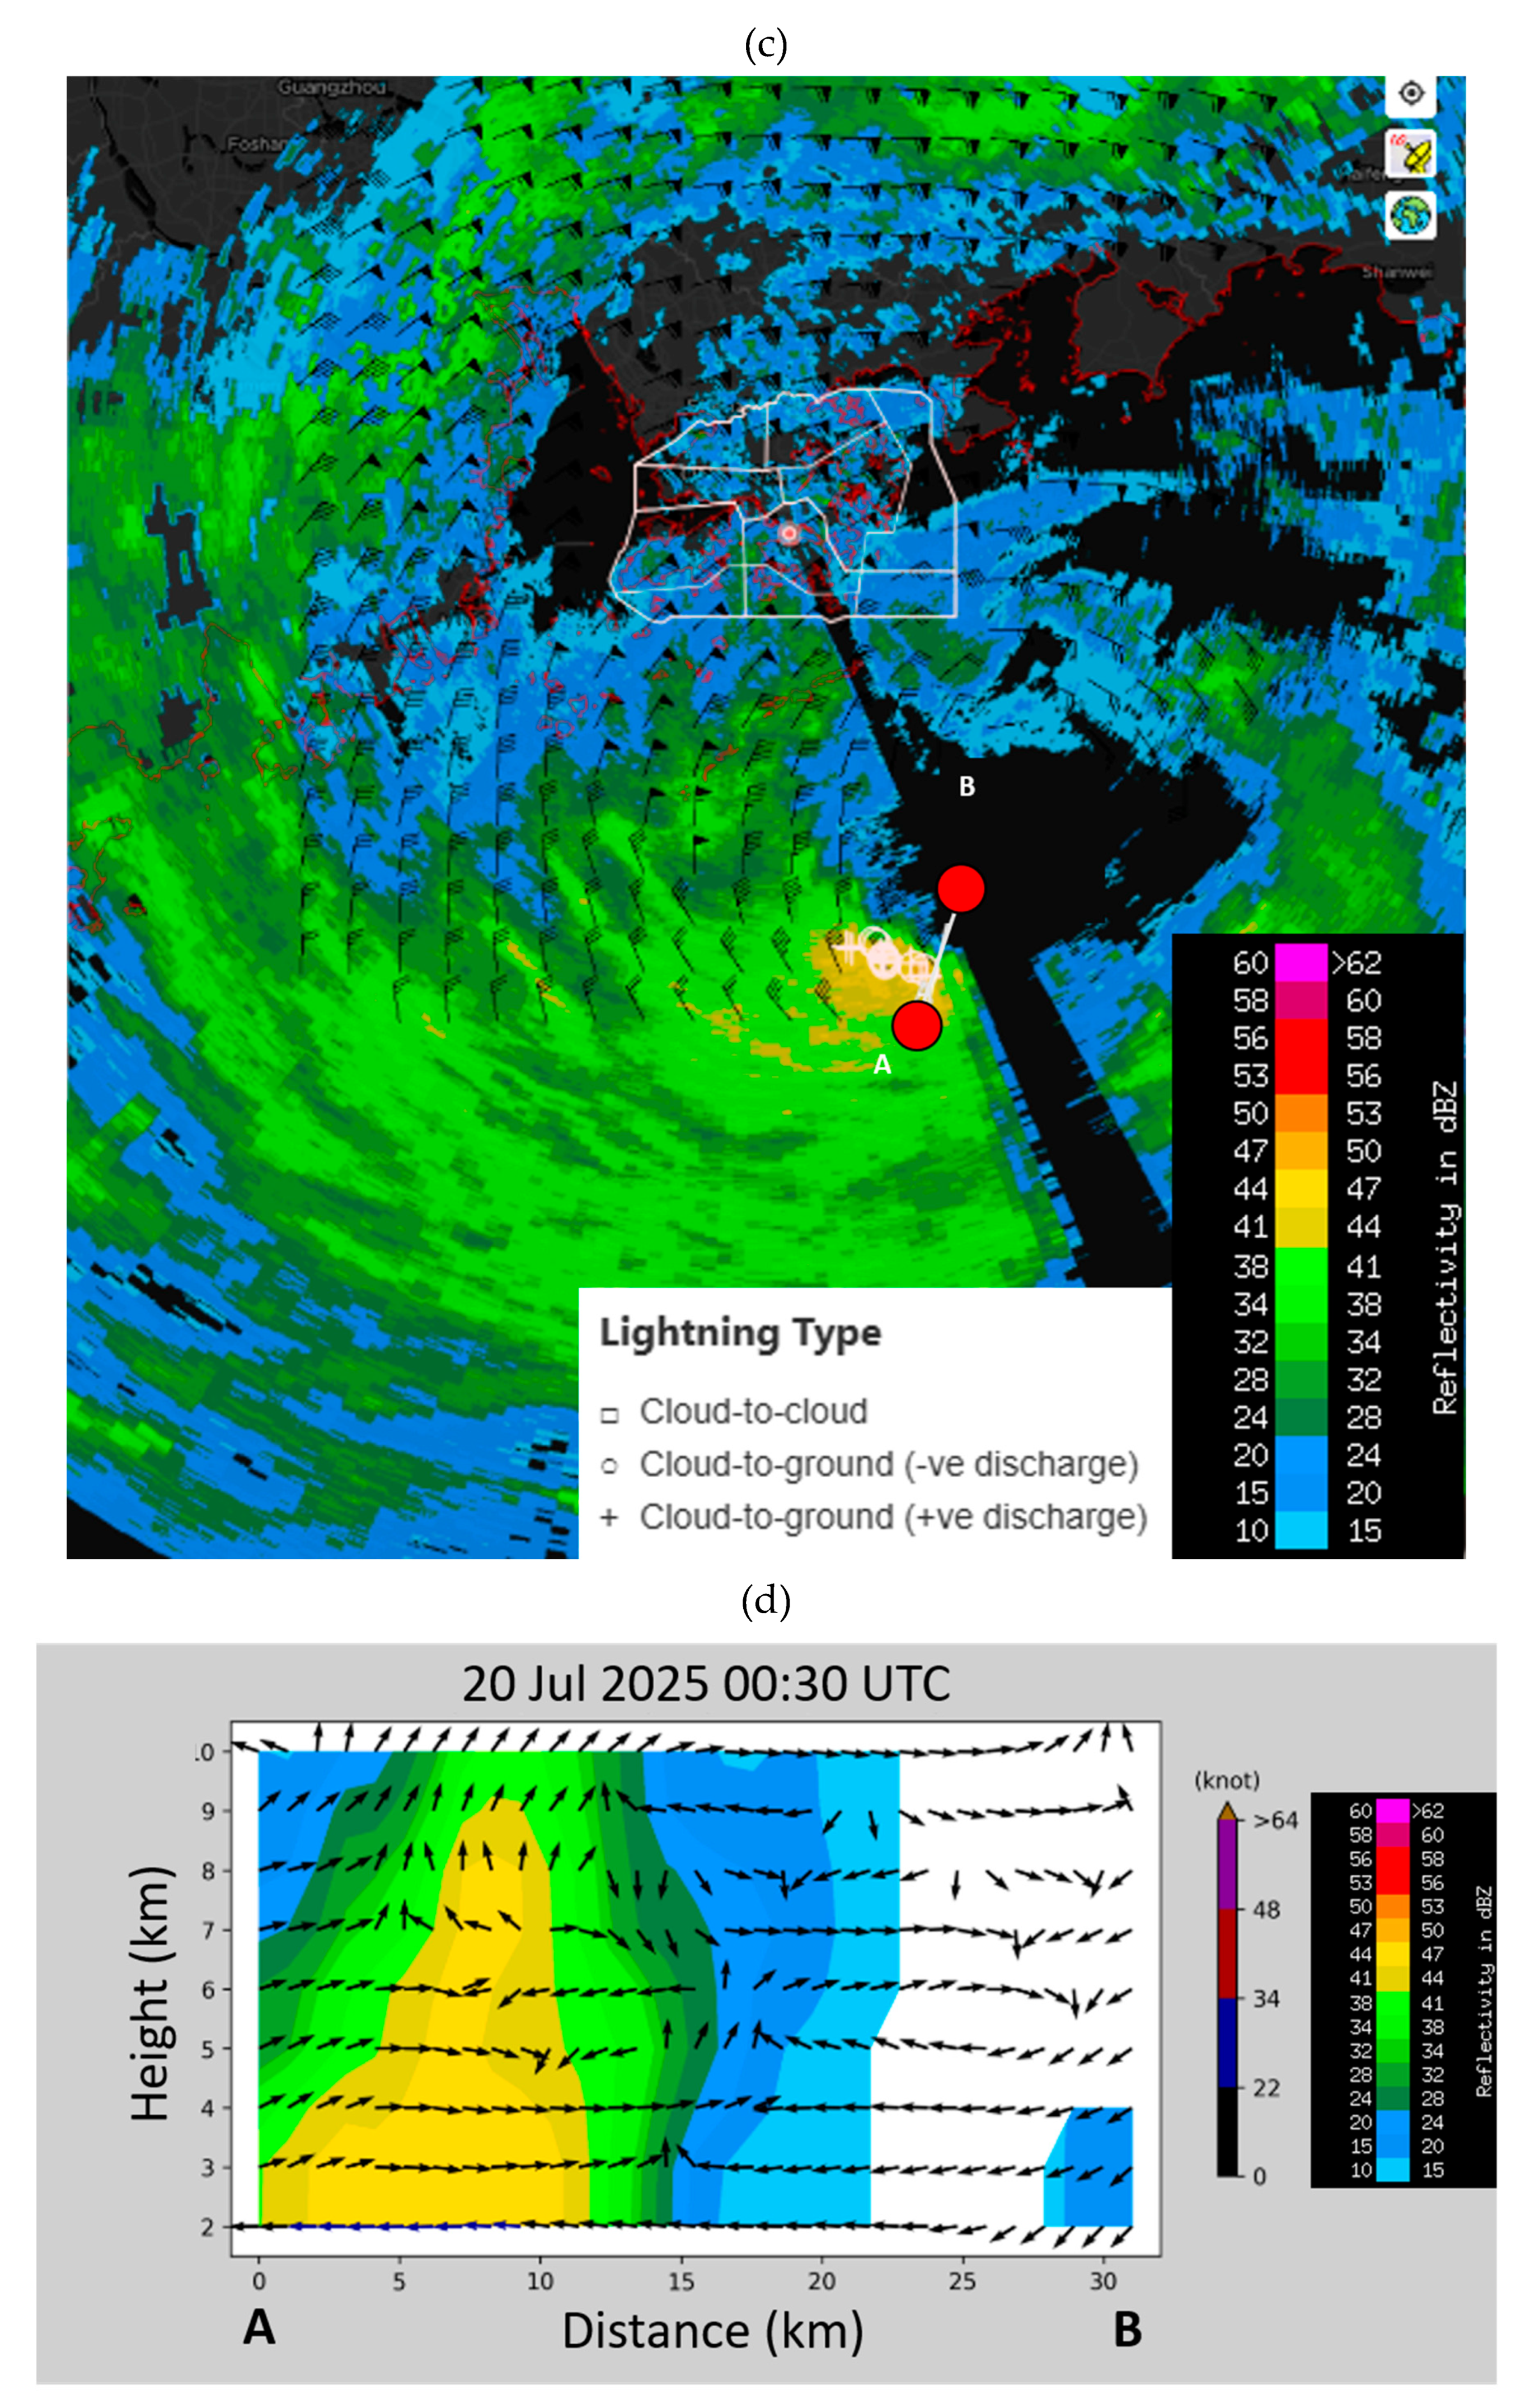
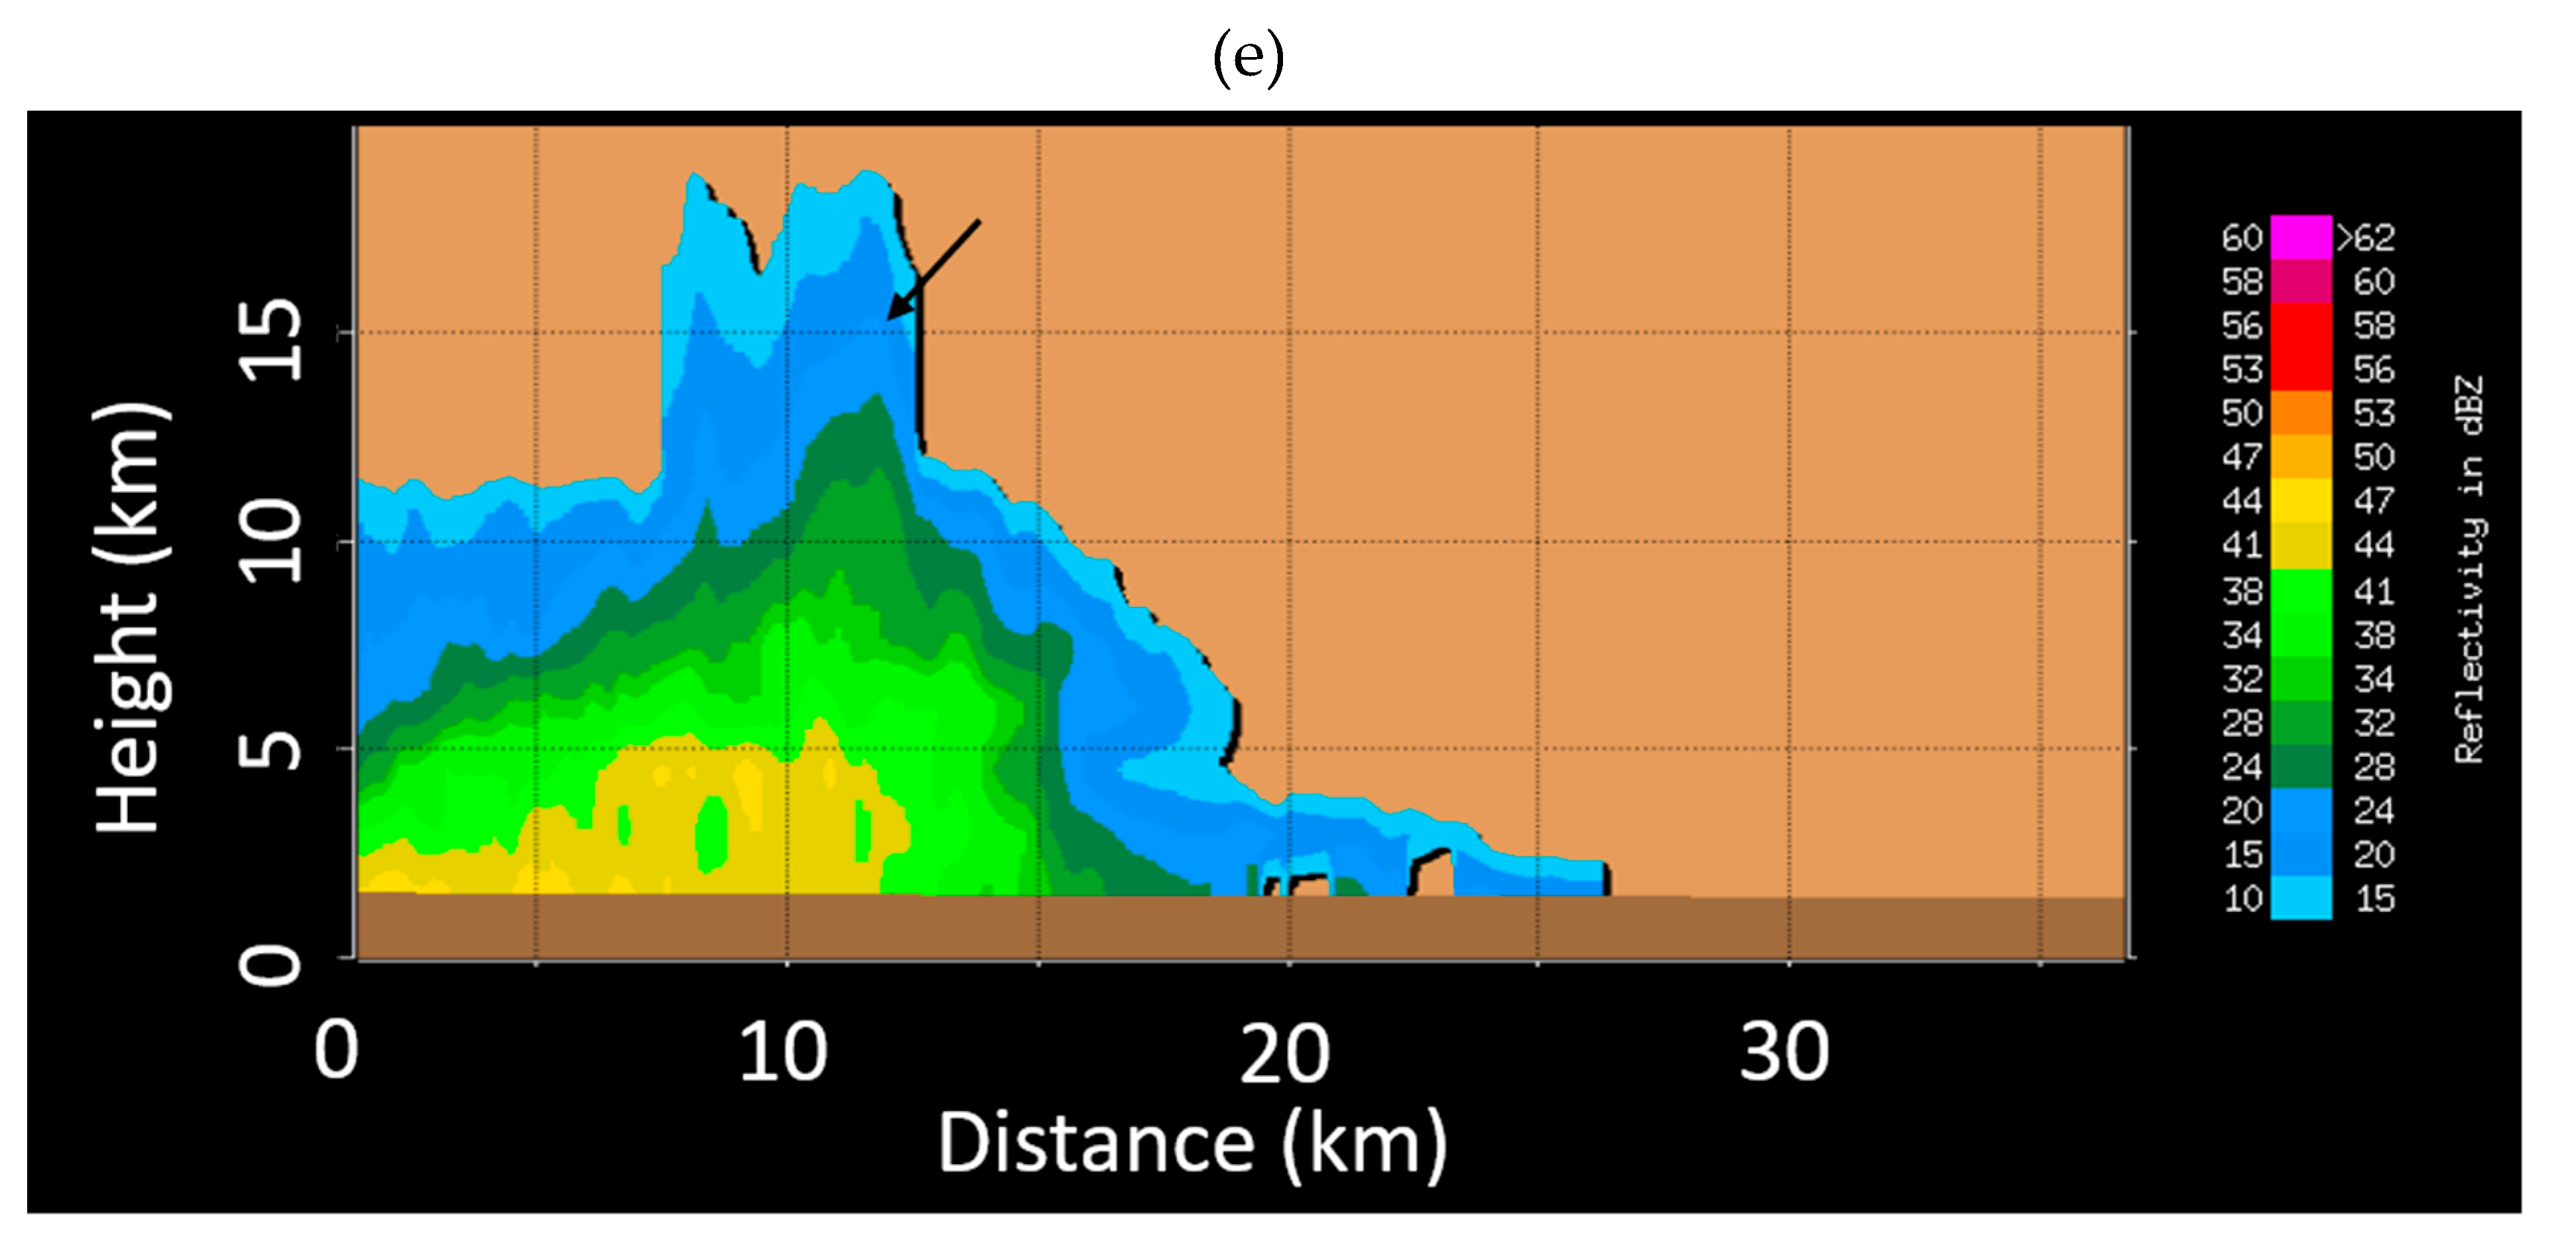
Figure 9.
(a) Profile of horizontal winds measured by a Doppler LiDAR at Cape D’Aguilar on 20 July 2025. (b) Same as (a) but for vertical velocity, where reddish and bluish colours indicate upward and downward motion, respectively. (c) Variation in signal-to-noise ratio at different heights.
Figure 9.
(a) Profile of horizontal winds measured by a Doppler LiDAR at Cape D’Aguilar on 20 July 2025. (b) Same as (a) but for vertical velocity, where reddish and bluish colours indicate upward and downward motion, respectively. (c) Variation in signal-to-noise ratio at different heights.
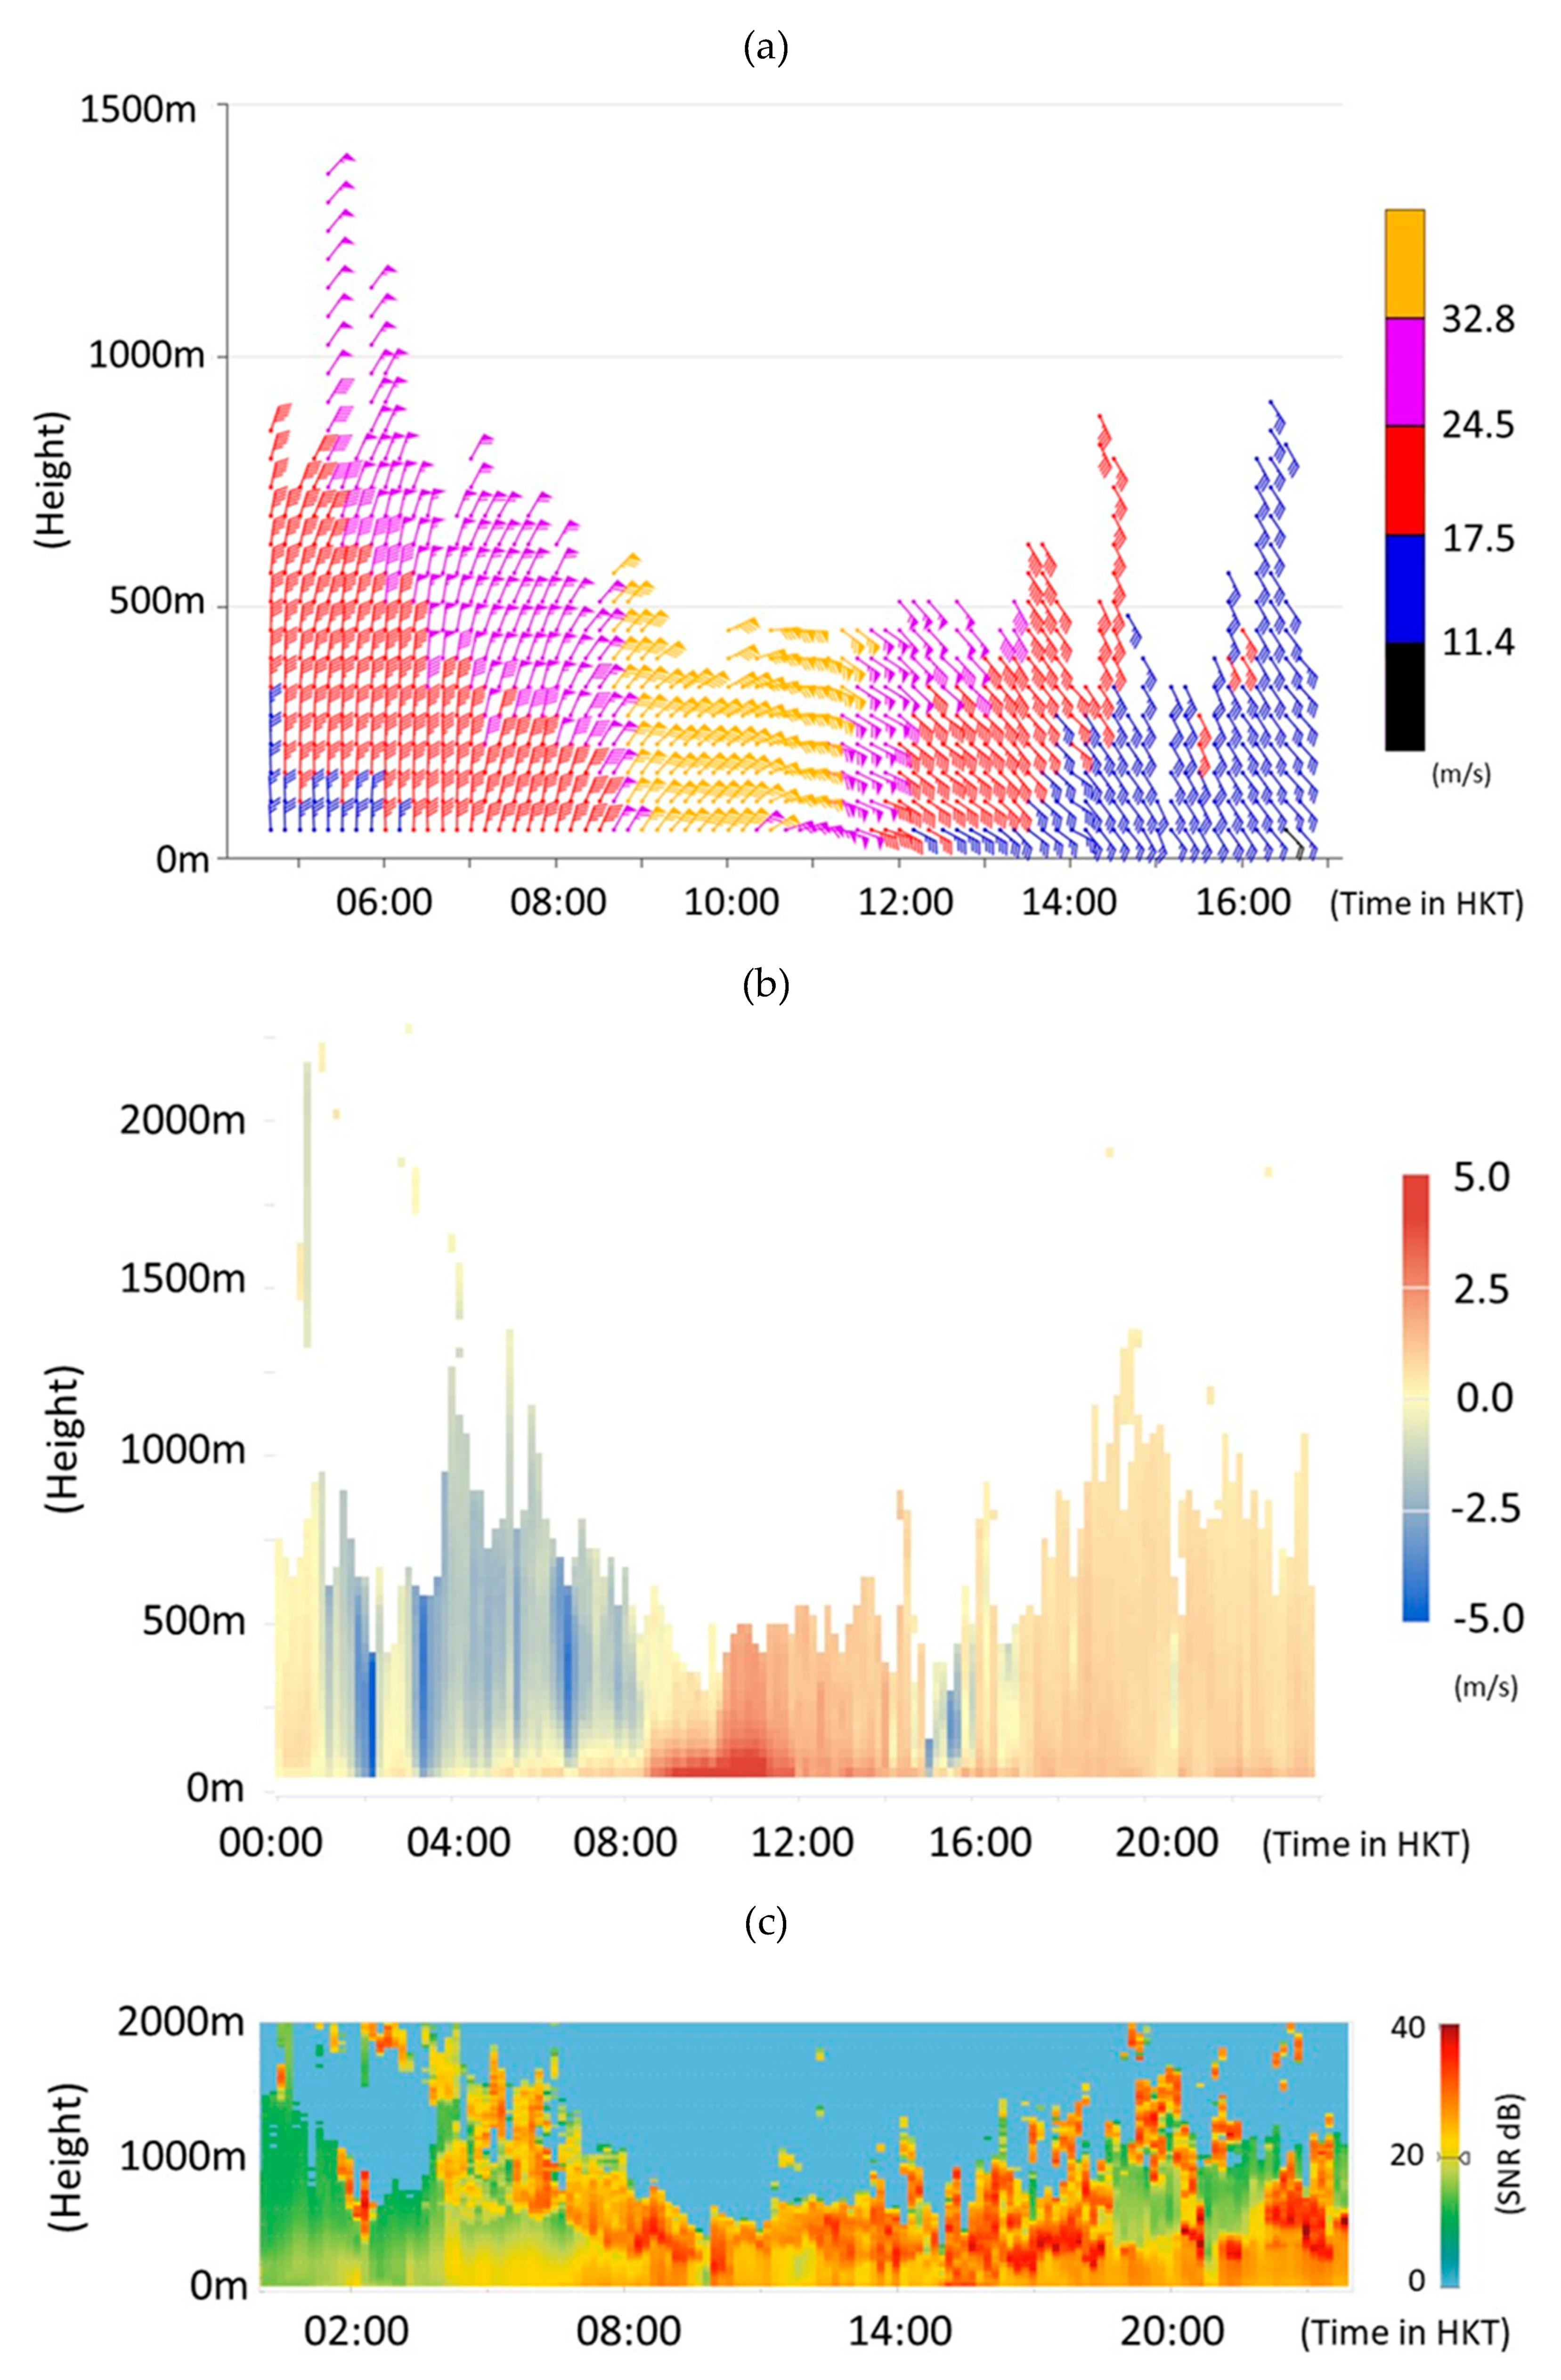
Figure 10.
(a) The HKO’s TC warning track of Wipha overlaid on the sea surface temperature distribution on the day of its formation on 19 July 2025. A snapshot of the vertical profile taken on the same day showing (b) sea temperatures and (c) salinity over a sea depth of approximately 150 m along the TC track at different times. (d) The TC track overlaid on the distribution of salinity gradient on the same day.
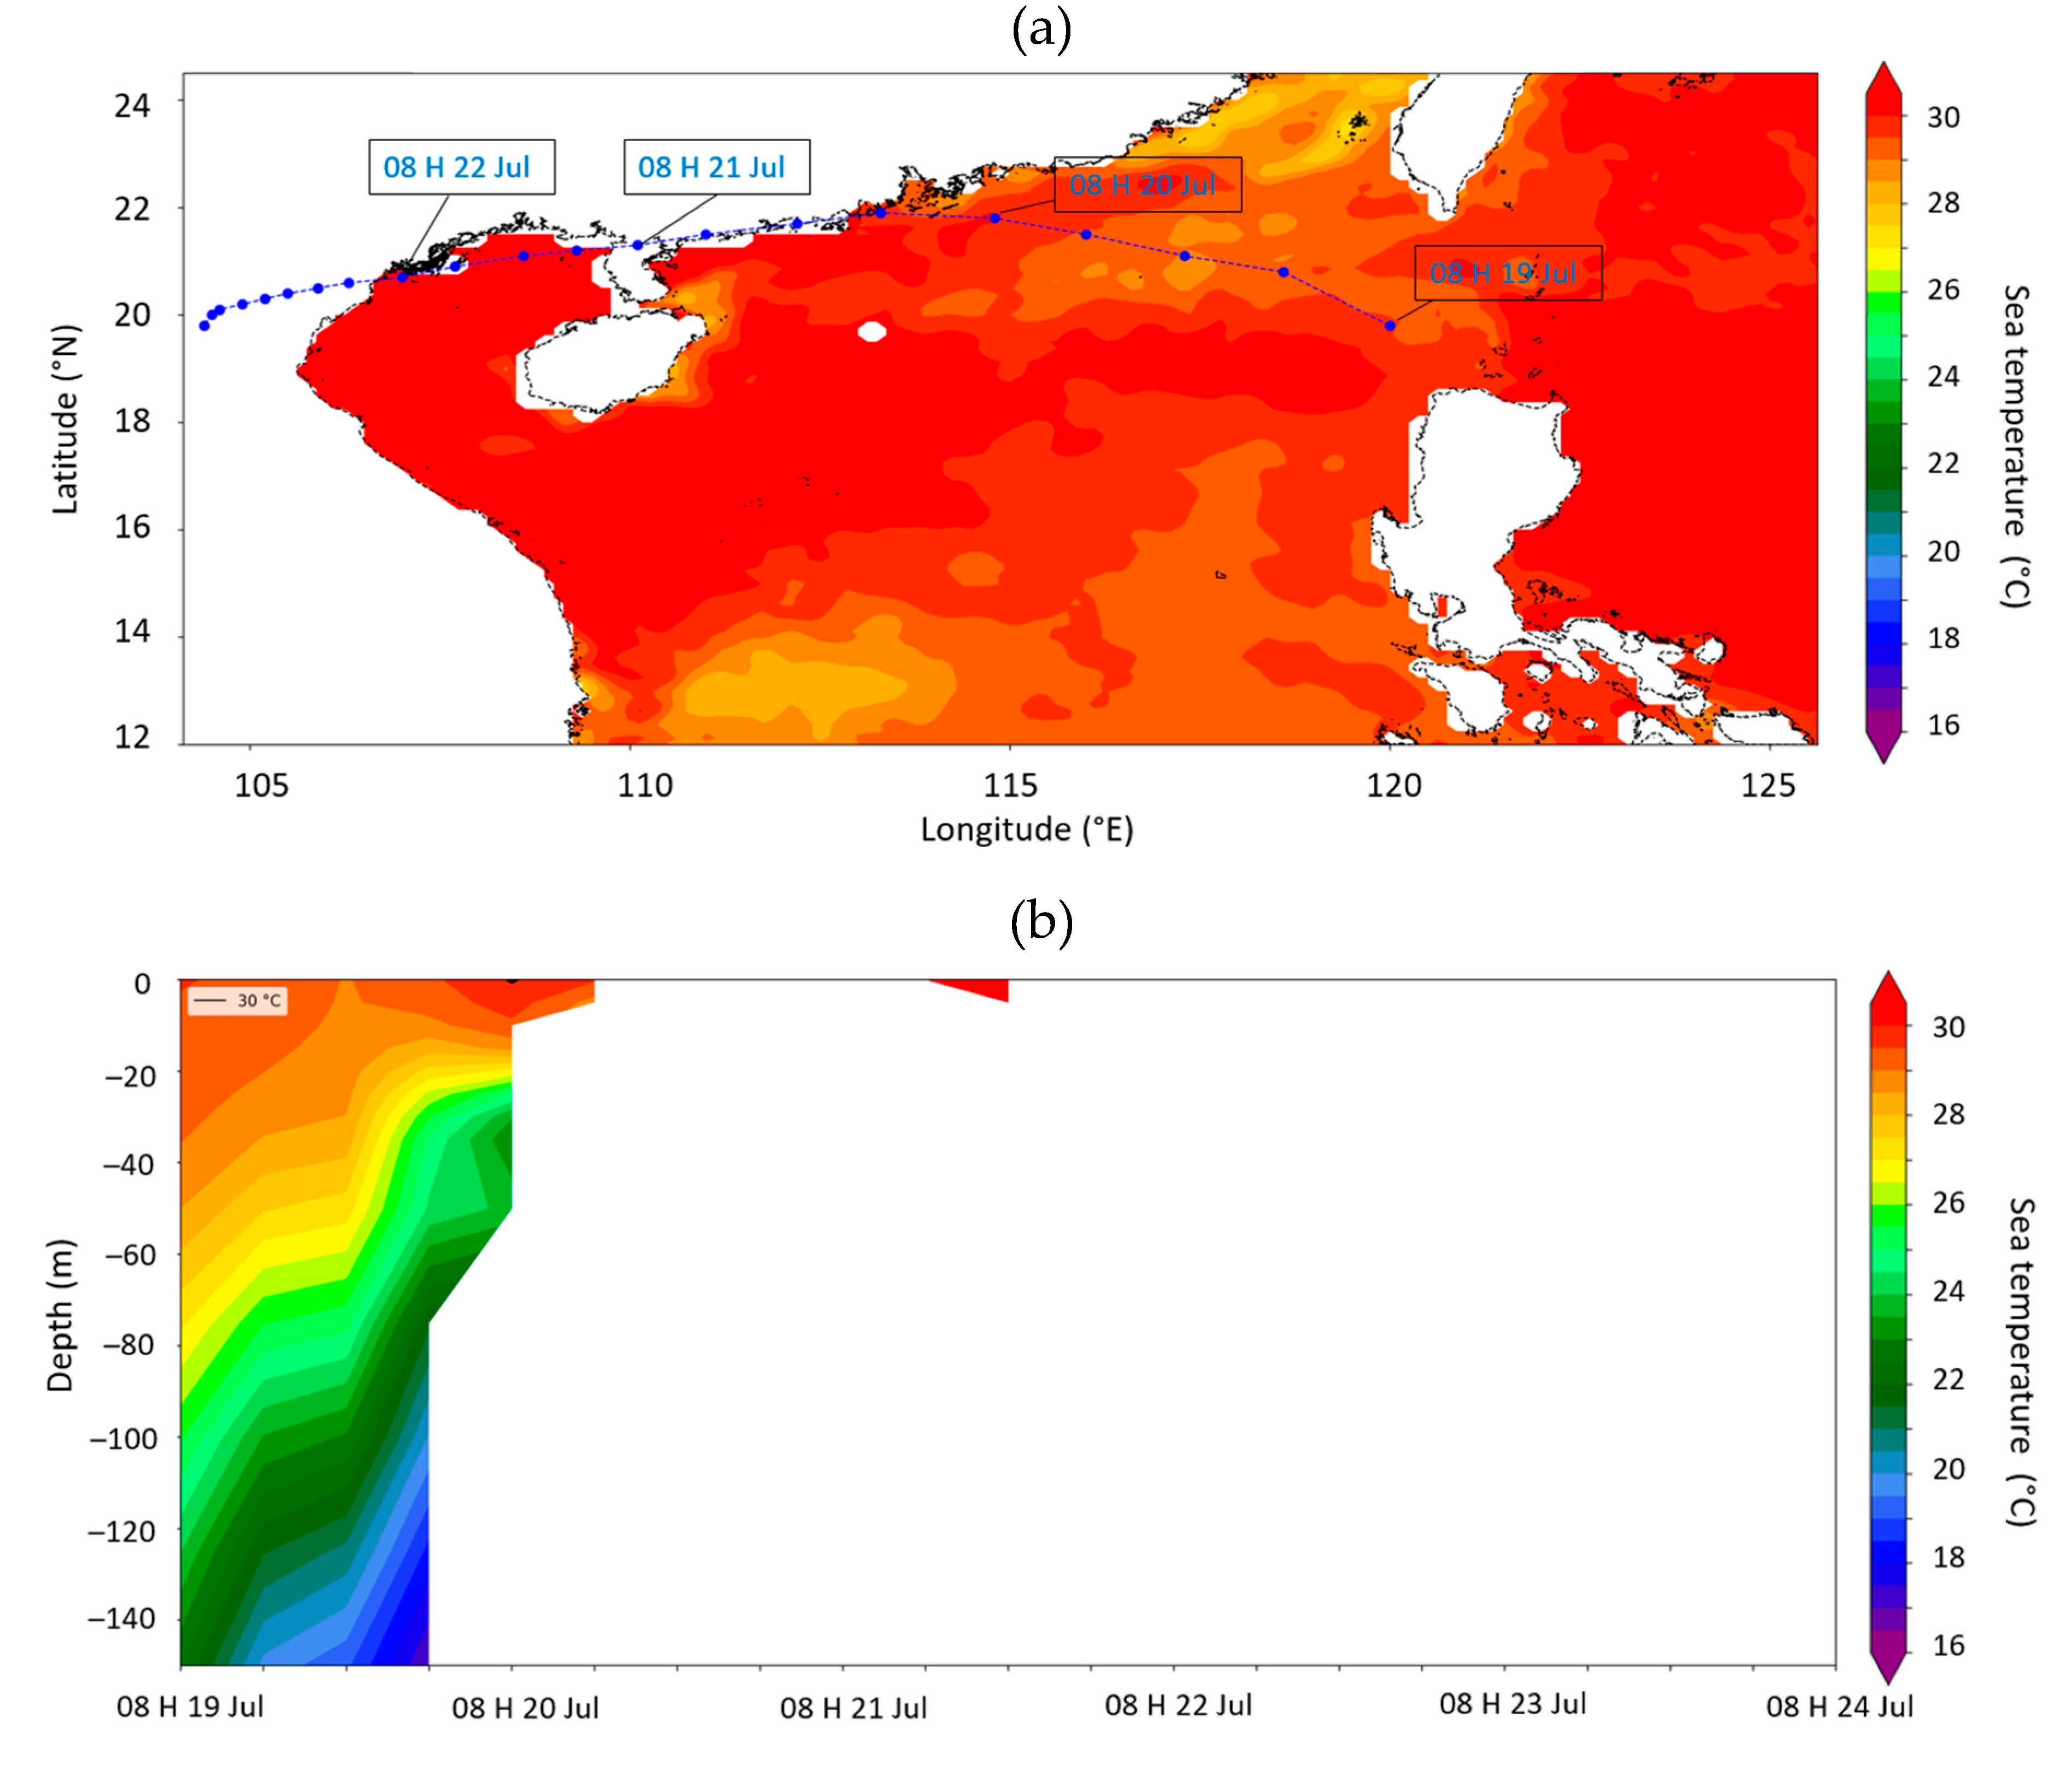
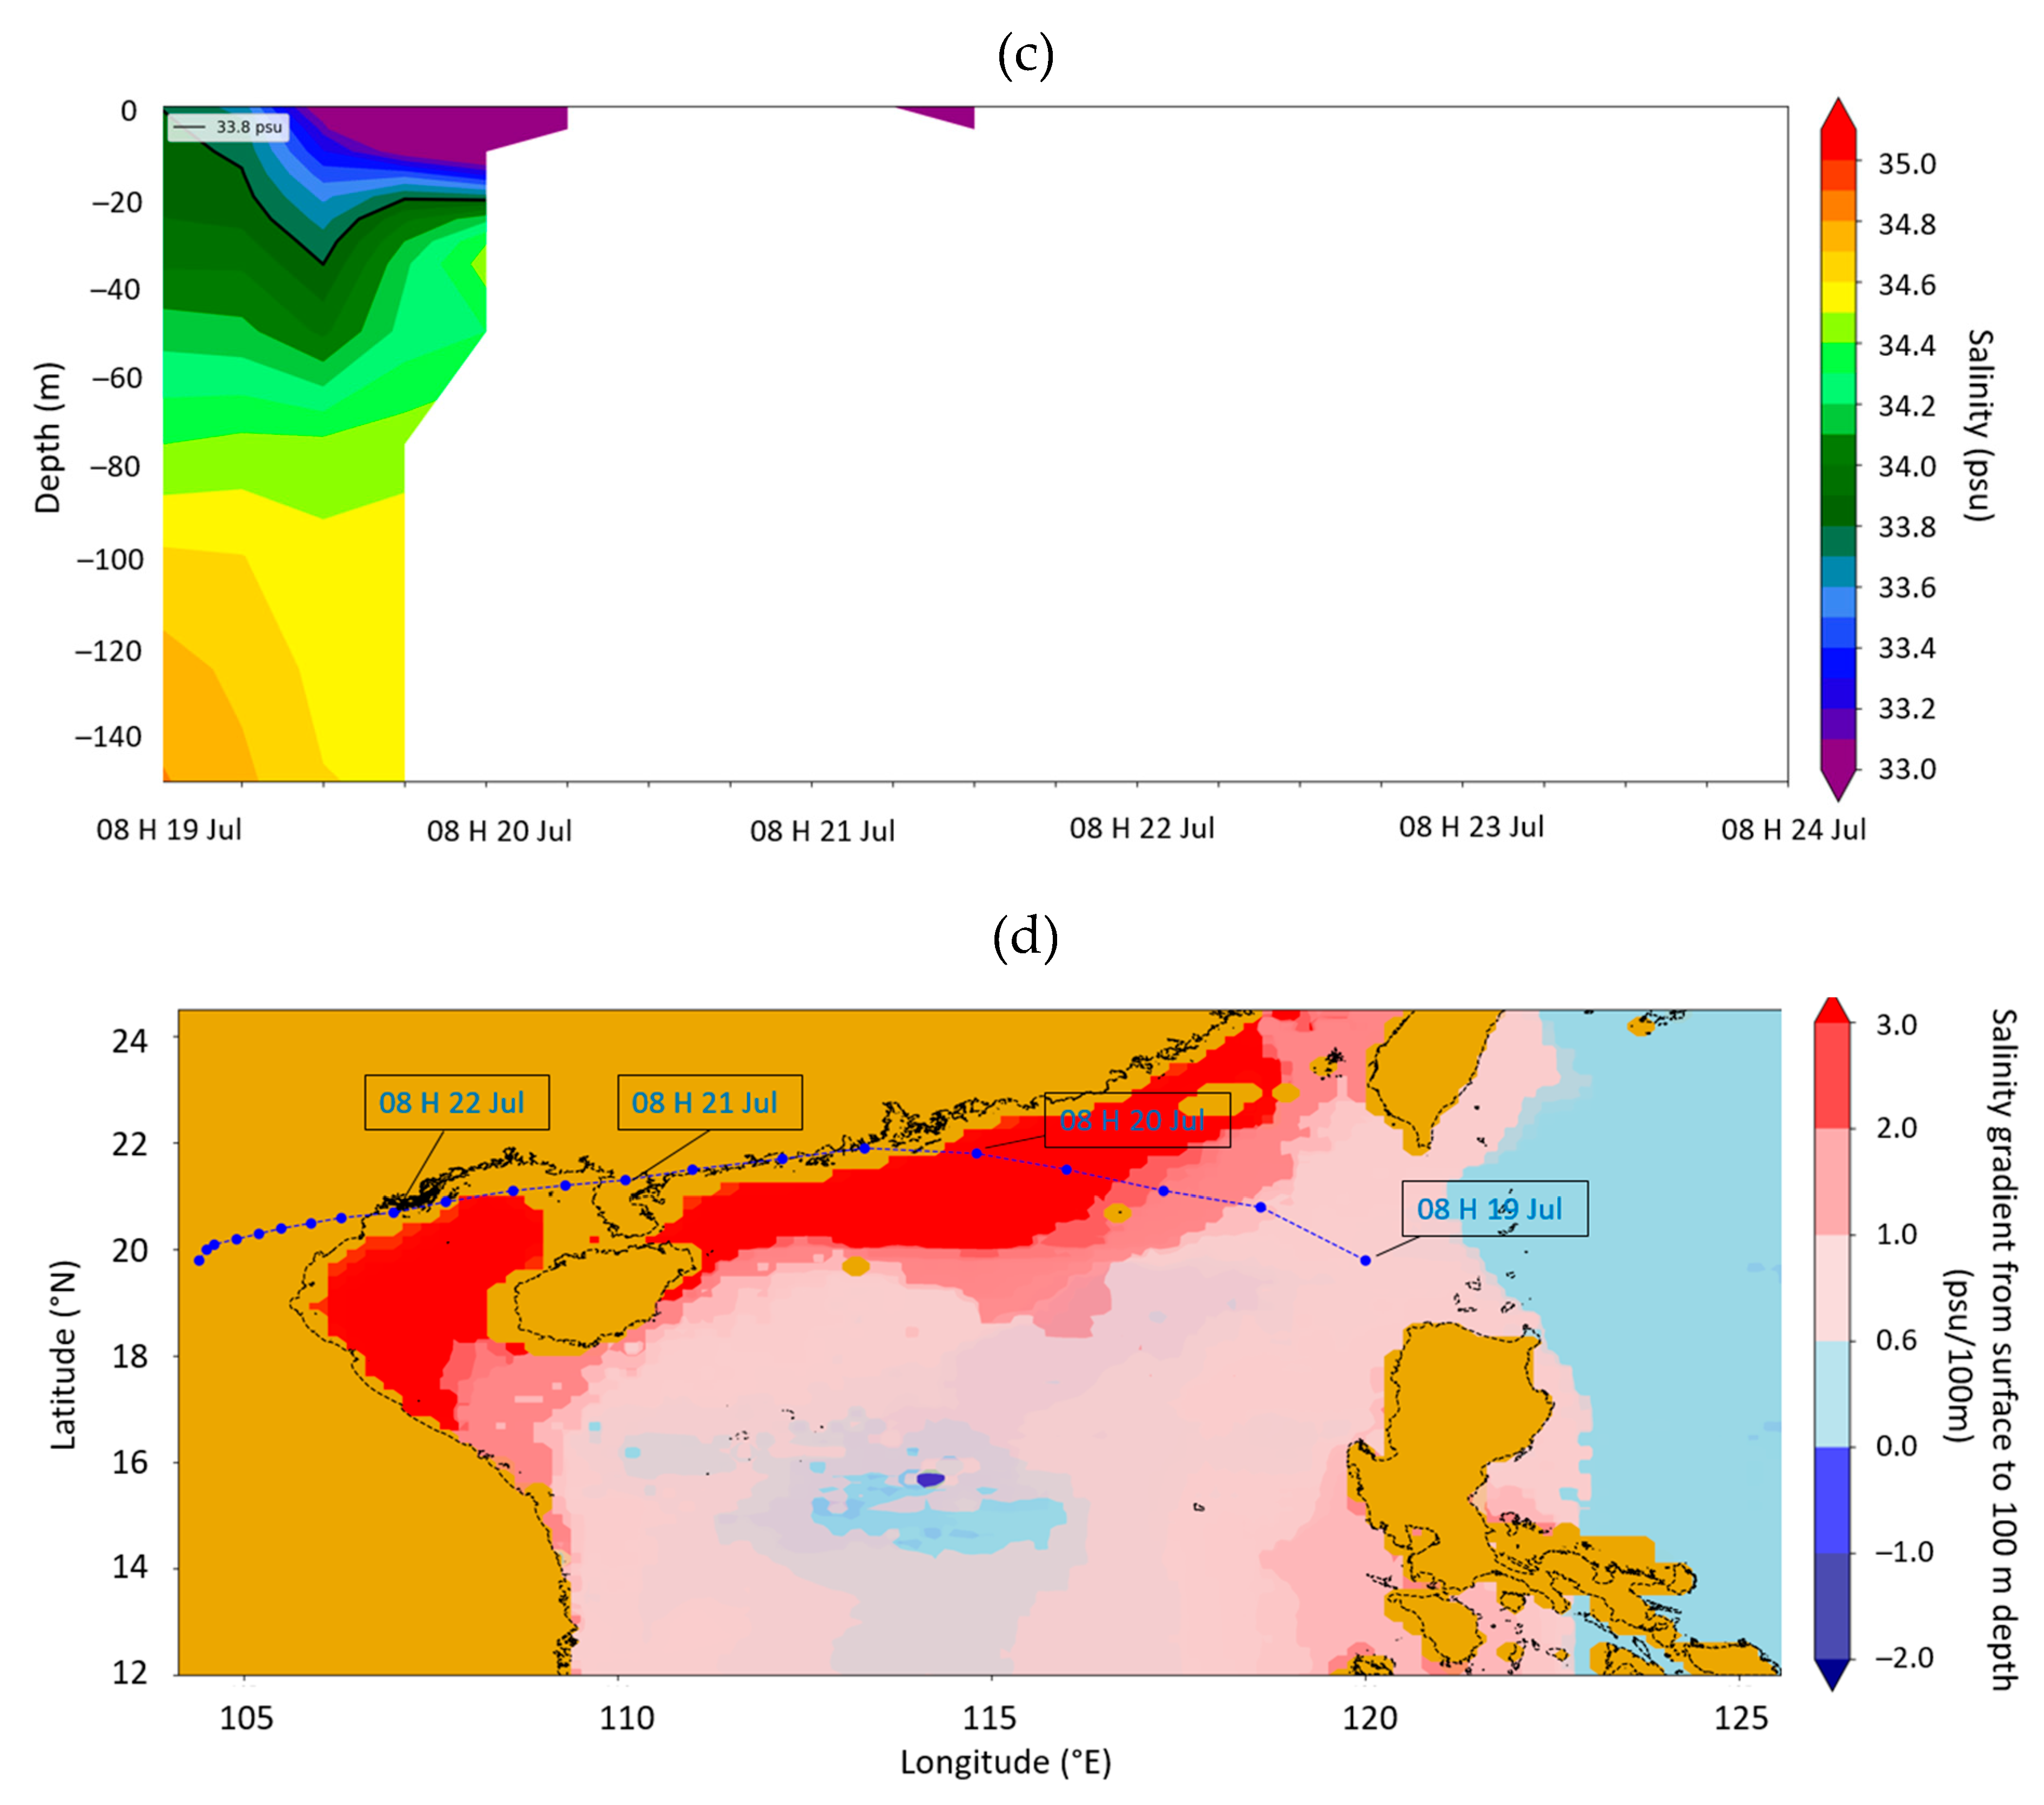
Figure 11.
Root-mean-square error of models’ forecast (a) positions and (b) maximum winds for Wipha as a function of lead time. Forecasts are verified against the operational analyses at HKO and homogenised to have a consistent number of cases across each lead time among models. (c) NWP models’ intensity forecast for Wipha, initialised at 00UTC of 19 July 2025. The black line indicates HKO’s operational analyses of Wipha’s intensity.
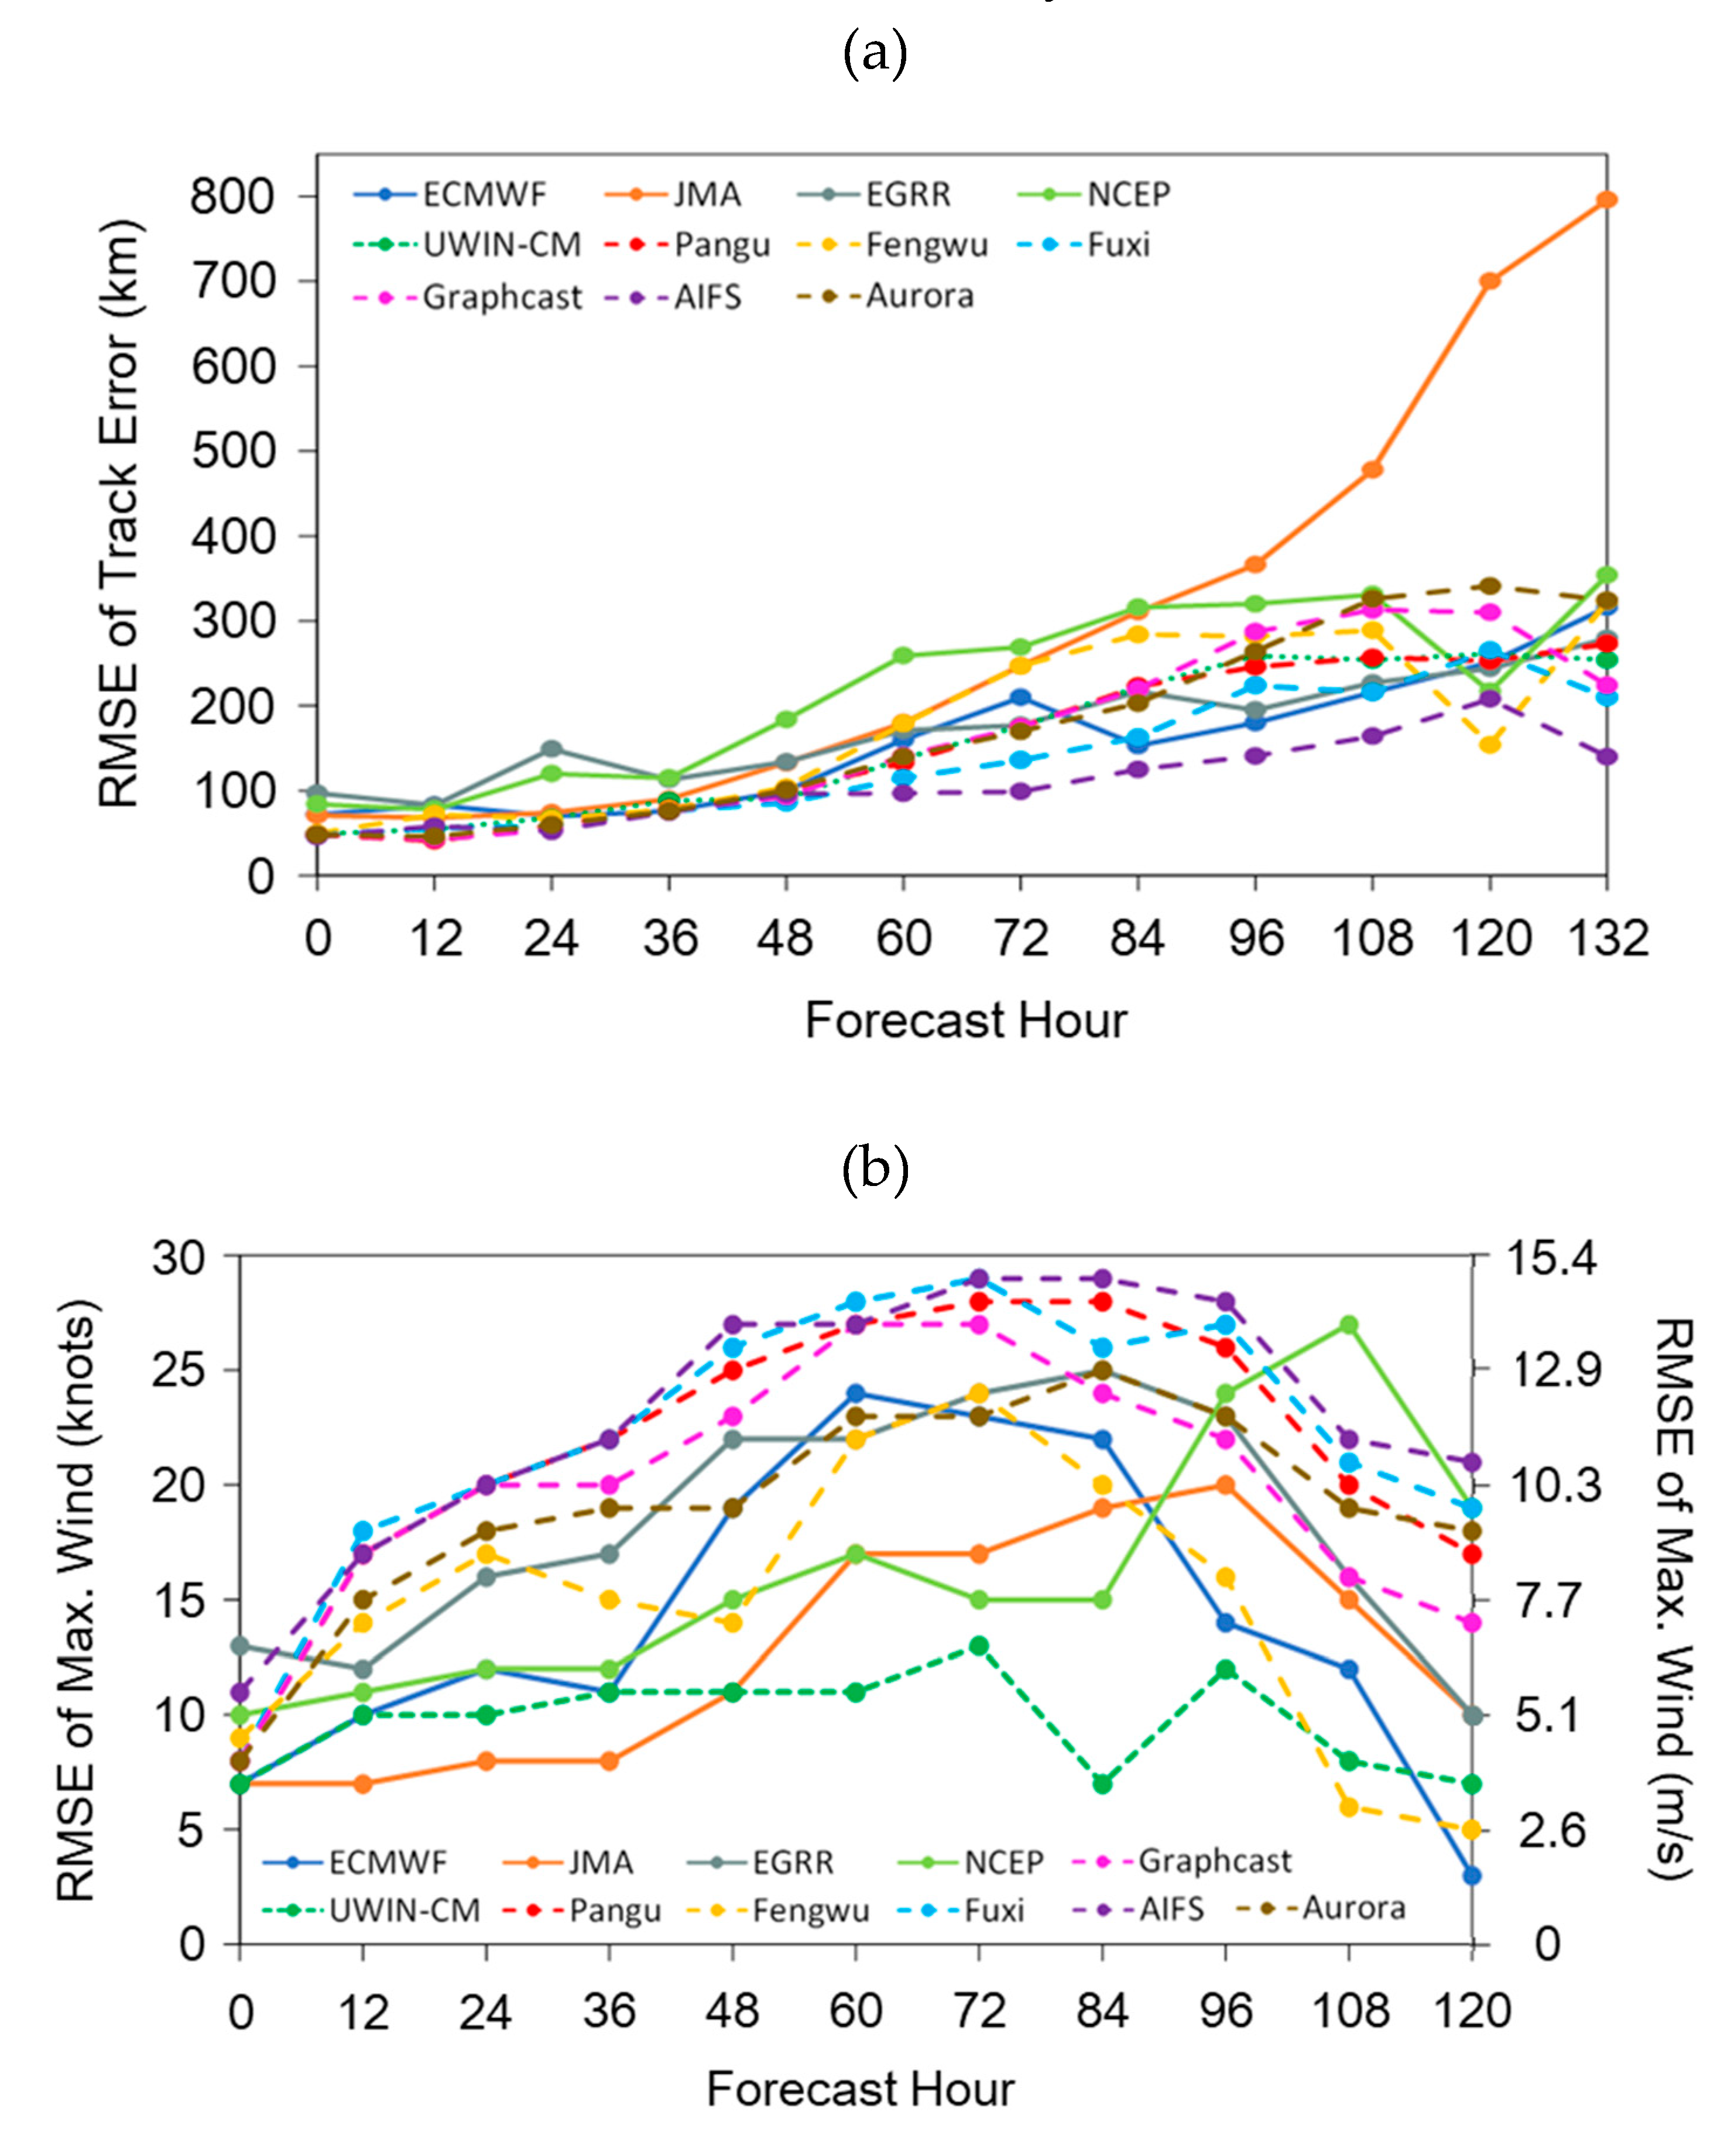
Figure 12.
Numerical experiments on tropical cyclone forecast track (a) and intensity (b) for Wipha by four different model configurations of UWIN-CM. See text for detailed description of the model configurations. The red triangles/stars indicate HKO’s operational analyses of Wipha’s position and intensity.
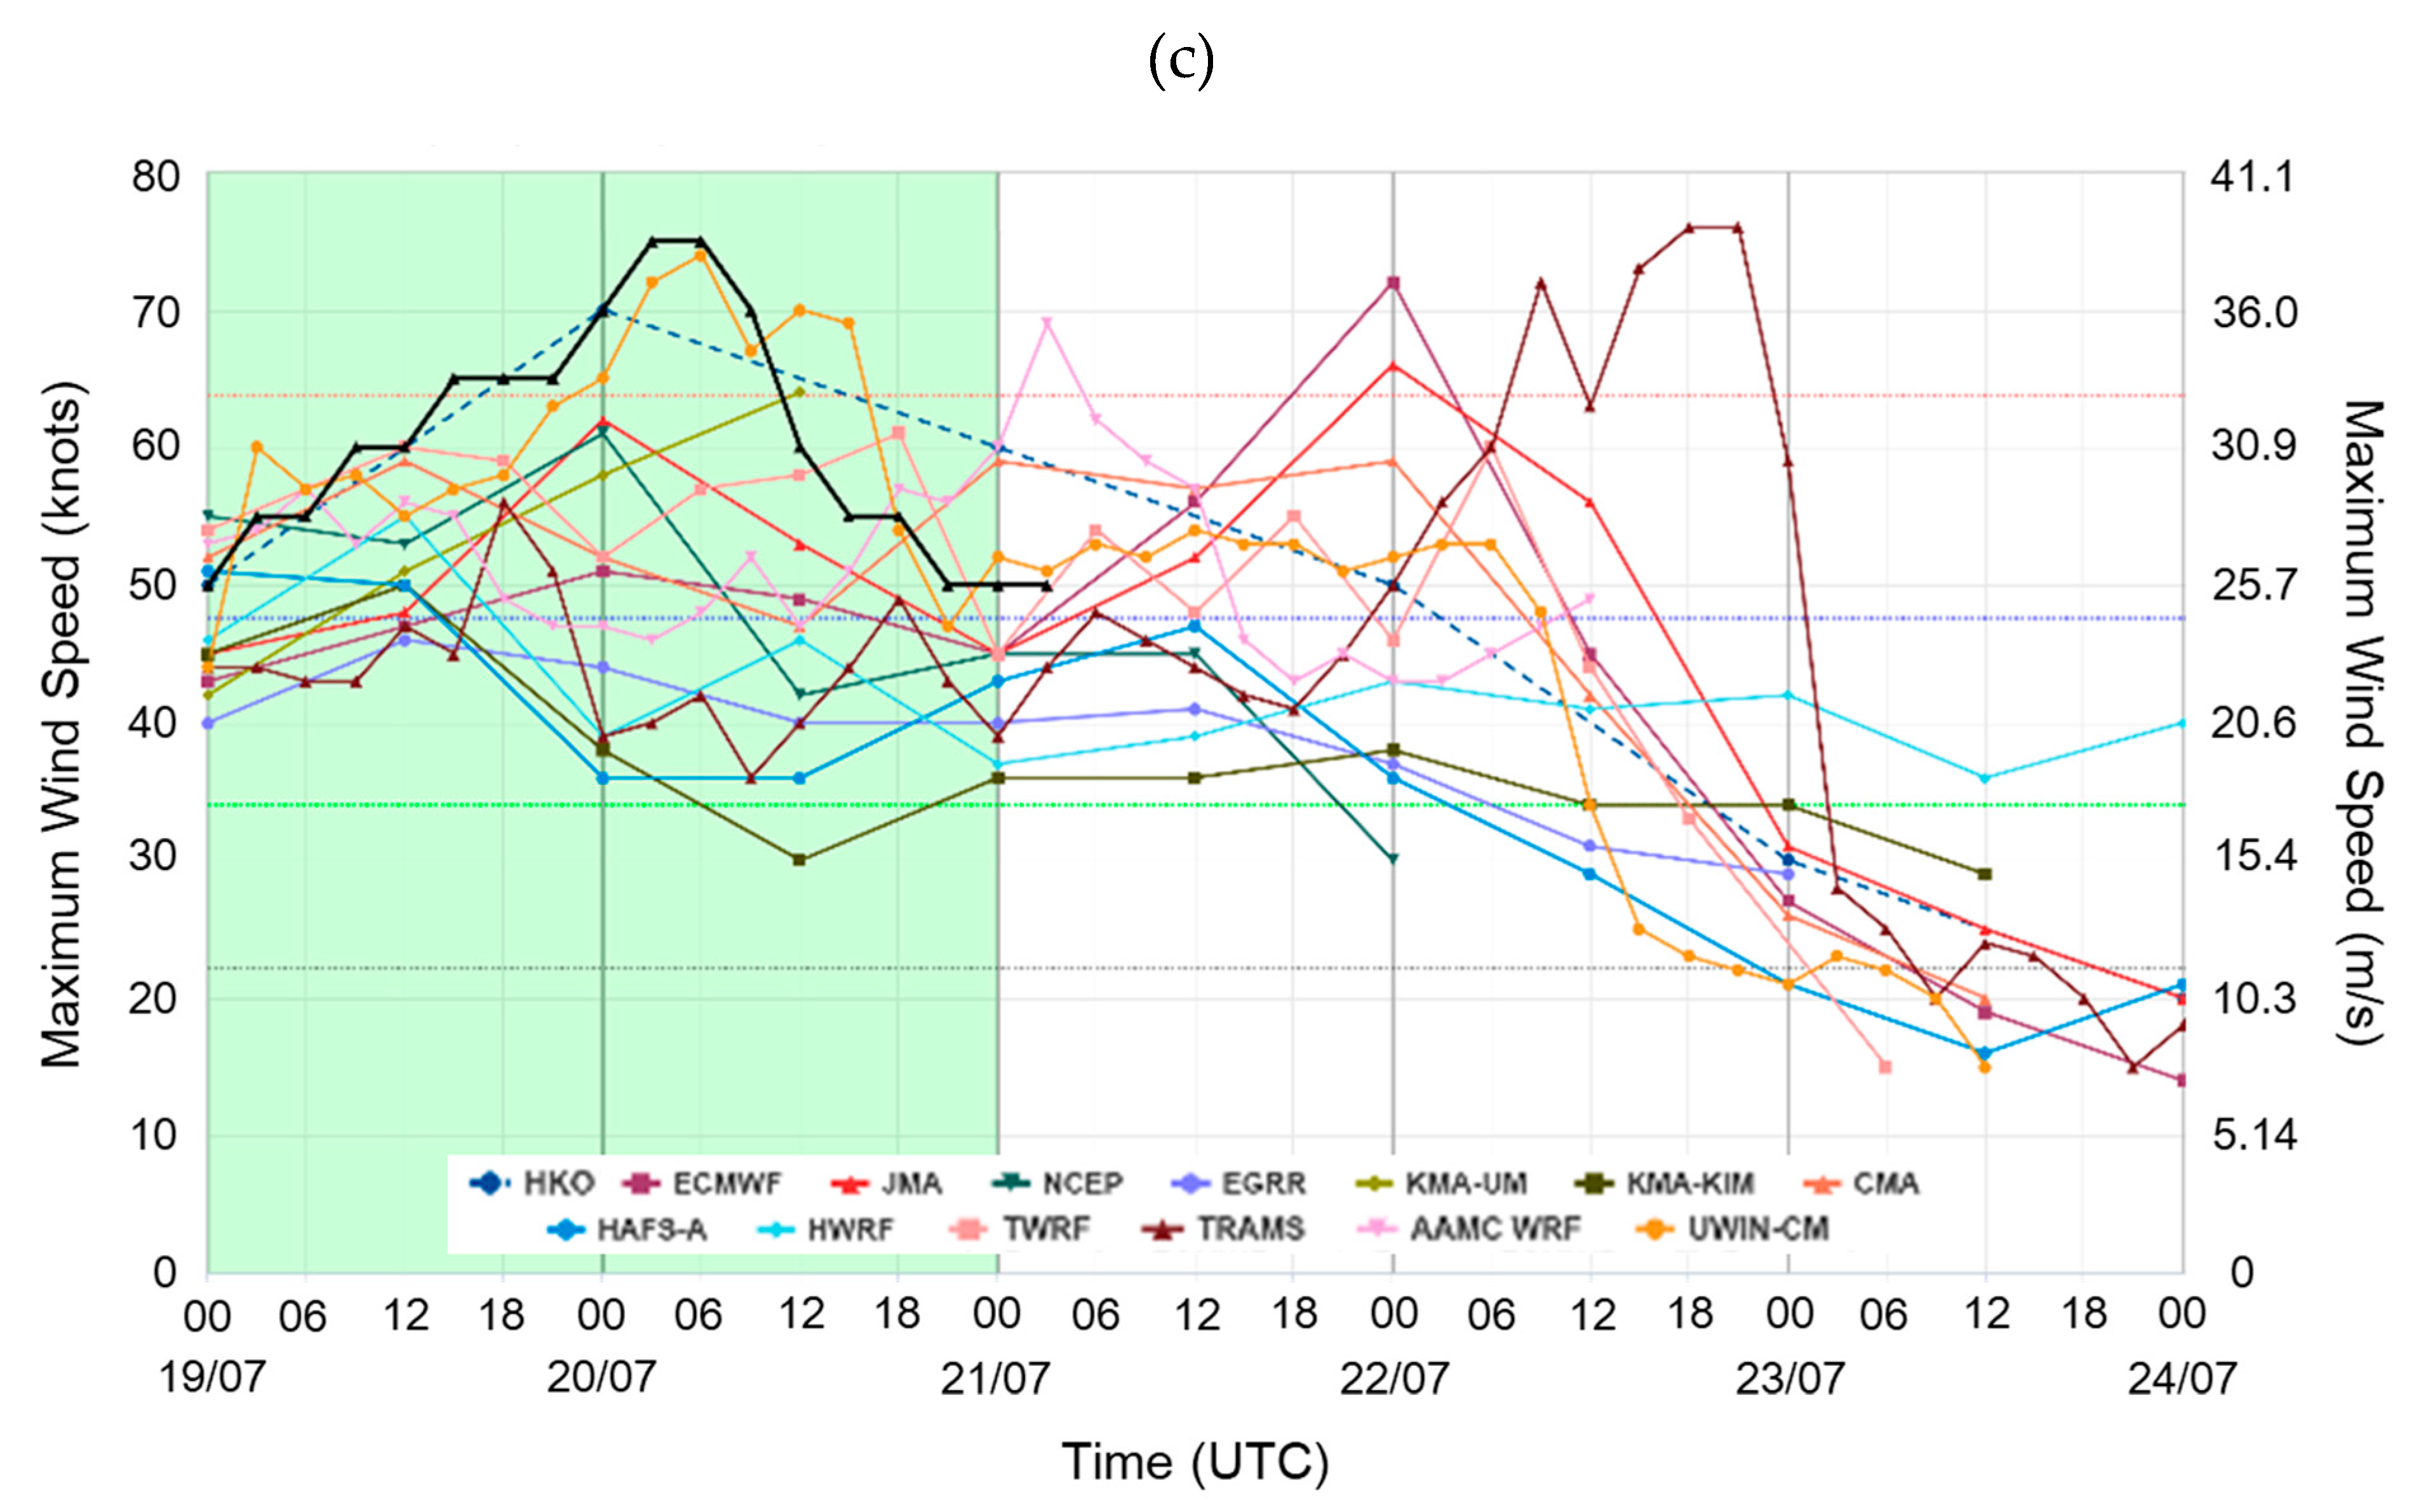
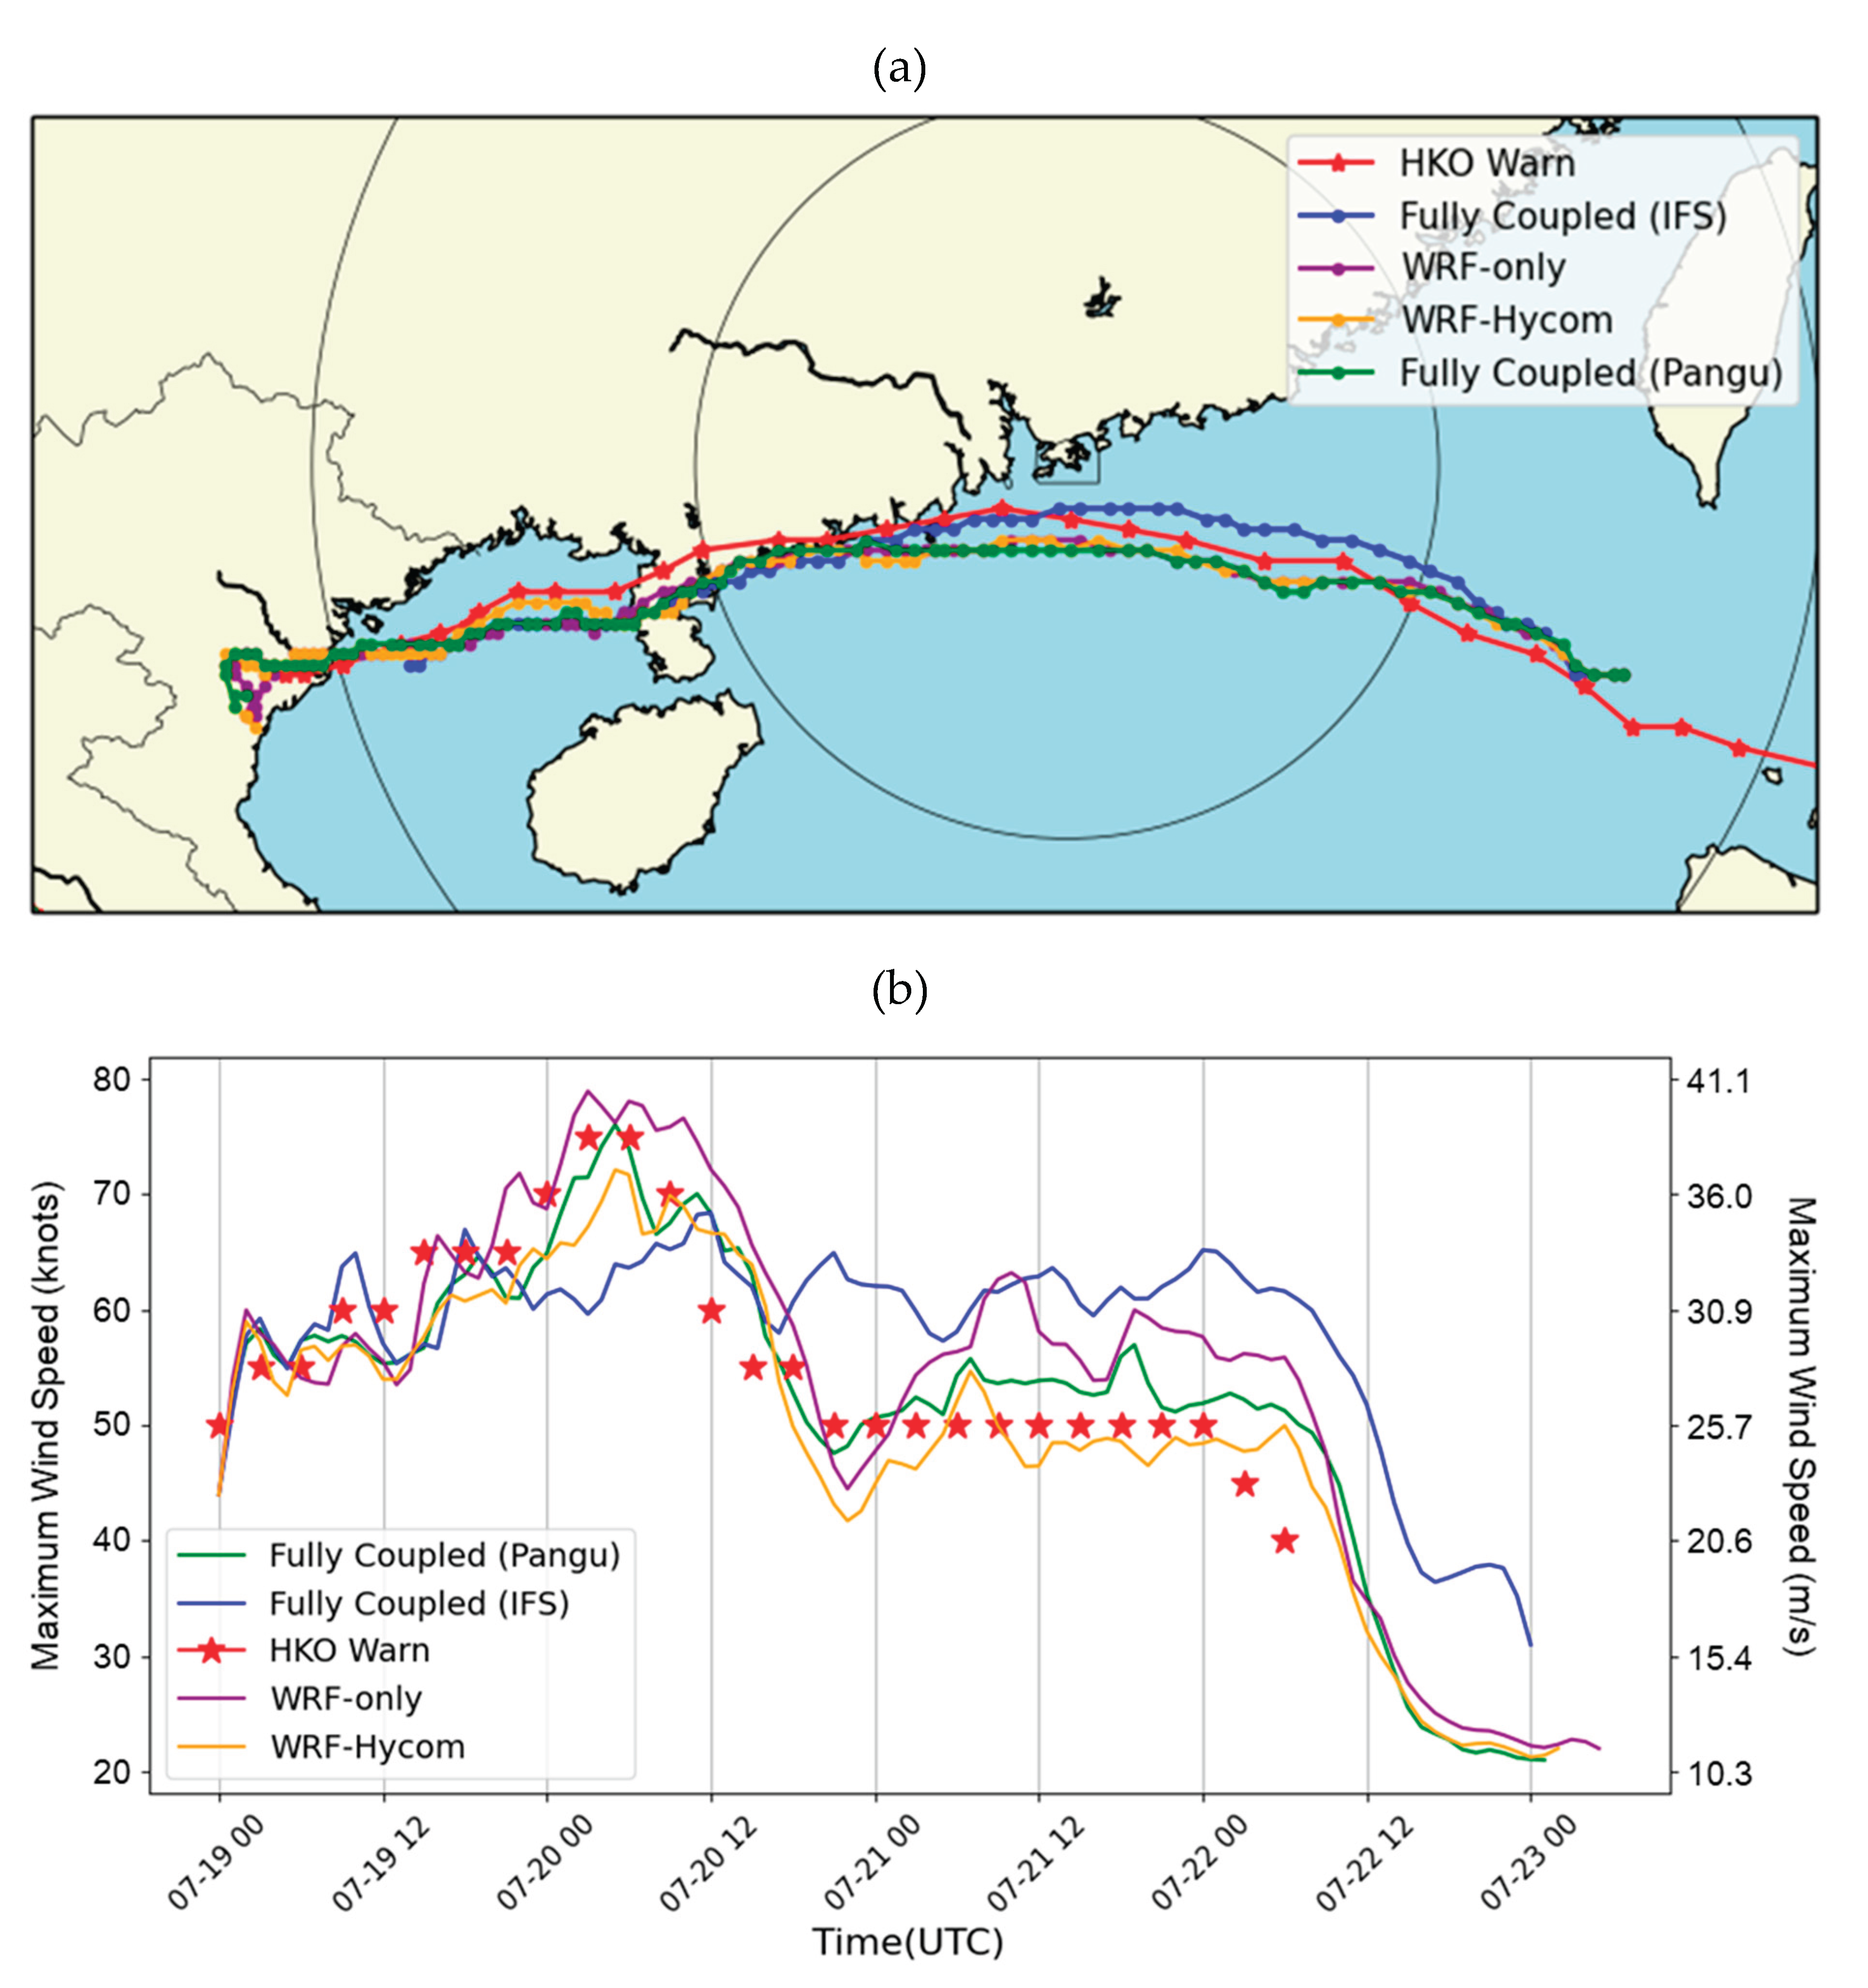

Table 1.
Summary of observations and reanalysis of Wipha’s intensity (in m/s or knots) near Hong Kong based on different sources and methods. The wind speed estimates based on SAR and SATON have been converted from 1-min to 10-min mean winds. The maximum winds detected by Doppler radars, LiDAR, and in-situ wind observations (in m/s) have been reduced to the 10-m level.
| Datetime | Dvorak analyses | SATCON | SAR | Doppler (radial velocity) |
LiDAR winds |
In-situ wind observations | Holland’s model | Estimated intensity of Wipha |
|---|---|---|---|---|---|---|---|---|
| 23H on 19 July | 37 | 26–28 | 29 |
31–33 m/s (60–65 knots) |
||||
| 02H on 20 July | 31–37 | 28–30 | 26 |
31–33 m/s (60–65 knots) |
||||
| 05H on 20 July | 31–37 | 29–31 | 32–34 (partial scan) |
25 |
31–36 m/s (60–70 knots) |
|||
| 08H on 20 July | 37 | 31–32 | 28–39 | 31 | 35–37 |
36–39 m/s (70–75 knots) |
||
| 11H on 20 July | 43 | 31–32 | 28–41 | 34–36 | 33 | 37–38 |
39 m/s (75 knots) |
|
| 14H on 20 July | 37–43 | 30–31 |
36–39 m/s (70–75 knots) |
Table 2.
Maximum gust peak speeds and maximum 10-min mean wind speeds (in m/s), with associated wind directions in parentheses, recorded at various stations in Hong Kong during the passage of Wipha. Station locations are shown in Figure 2. The wind direction was not available at Ngong Ping.
Table 2.
Maximum gust peak speeds and maximum 10-min mean wind speeds (in m/s), with associated wind directions in parentheses, recorded at various stations in Hong Kong during the passage of Wipha. Station locations are shown in Figure 2. The wind direction was not available at Ngong Ping.
| Station | Maximum Gust | Maximum 10-Minute Mean Wind |
|---|---|---|
| Central Pier | 36.2 (E) | 25.5 (E) |
| Cheung Chau | 48.1 (E) | 33.1 (ESE) |
| Cheung Chau Beach | 48.0 (ENE) | 36.6 (ENE) |
| Green Island | 48.9 (NE) | 36.6 (NE) |
| Hong Kong International Airport (Chek Lap Kok) | 33.5 (ENE) | 24.3 (ENE) |
| Kai Tak | 34.0 (N) | 15.5 (E) |
| King's Park | 39.2 (NNE) | 16.0 (ESE) |
| Lamma Island | 34.8 (E) | 20.3 (ESE) |
| Lau Fau Shan | 30.4 (NNE) | 20.2 (N) |
| Ngong Ping | 65.0 (-) | 47.4 (-) |
| North Point | 40.0 (NE) | 25.5 (ENE) |
| Peng Chau | 42.3 (ENE) | 31.9 (ENE) |
| Sai Kung | 37.2 (NE) | 24.8 (NE) |
| Sha Chau | 32.4 (N) | 23.0 (N) |
| Sha Tin | 24.4 (NE) | 11.2 (NE) |
| Star Ferry (Kowloon) | 28.2 (E) | 18.5 (E) |
| Ta Kwu Ling | 26.6 (ENE) | 13.4 (E) |
| Tai Mei Tuk | 37.4 (ENE) | 28.1 (ENE) |
| Tai Po Kau | 29.5 (E) | 21.2 (E) |
| Tap Mun East | 37.1 (E) | 29.1 (E) |
| Tate's Cairn | 46.5 (ENE) | 34.9 (ENE) |
| Tseung Kwan O | 32.8 (NNE) | 15.0 (NNE) |
| Tsing Yi Shell Oil Depot | 26.5 (ESE) | 12.3 (ESE) |
| Tuen Mun | 29.4 (NNE) | 10.4 (NNE) |
| Waglan Island | 43.3 (ENE) | 38.3 (NE) |
| Wetland Park | 18.7 (E) | 7.8 (NE) |
| Wong Chuk Hang | 40.3 (E) | 15.3 (E) |
Disclaimer/Publisher’s Note: The statements, opinions and data contained in all publications are solely those of the individual author(s) and contributor(s) and not of MDPI and/or the editor(s). MDPI and/or the editor(s) disclaim responsibility for any injury to people or property resulting from any ideas, methods, instructions or products referred to in the content. |
© 2025 by the authors. Licensee MDPI, Basel, Switzerland. This article is an open access article distributed under the terms and conditions of the Creative Commons Attribution (CC BY) license (http://creativecommons.org/licenses/by/4.0/).
Copyright: This open access article is published under a Creative Commons CC BY 4.0 license, which permit the free download, distribution, and reuse, provided that the author and preprint are cited in any reuse.


