
Submitted:
25 August 2025
Posted:
26 August 2025
You are already at the latest version
Abstract
Localized 1H magnetic resonance spectroscopy (MRS) is a powerful tool in pre-clinical and clinical neurological research, offering non-invasive insight into neurochemical composition in localized brain regions. Zebrafish (Danio rerio) have emerged as an in-creasingly utilized models in neurological disorder research, providing valuable insights into disease mechanisms. However, small size of the zebrafish brain and limited MRS sensitivity at low magnetic fields hinder comprehensive neurochemical analysis of local-ized brain regions. Here, we investigate the potential of ultra-high field (UHF) MR sys-tems, particularly 28.2 T, for this purpose. This work pioneers application of localized 1H spectroscopy in zebrafish brain at 28.2 T. Point resolved spectroscopy (PRESS) sequence parameters were optimized to reduce the impact of chemical shift displacement error and to enable molecular level information from distinct brain regions. Optimized parameters included gradient strength, excitation frequency, echo time and voxel volume specifically targeting the 0 – 4.5 ppm chemical shift regions. Exceptionally high-resolution cerebral metabolite spectra were successfully acquired from localized regions of the zebrafish brain in voxels as small as 125 nL, allowing for the identification and quantification of major brain metabolites with remarkable spectral clarity, including lactate, myo-inositol, crea-tine, alanine, glutamate, glutamine, phosphocholine, choline, taurine, aspartate, N-acetylaspartyl-glutamate (NAAG), N-acetylaspartate (NAA), and γ-aminobutyric acid (GABA). The unprecedented spatial resolution achieved in a small model organism ena-bled detailed comparisons of the neurochemical composition across distinct zebrafish brain regions, including the forebrain, midbrain, and hindbrain. This level of precision opens exciting new opportunities to investigate how specific diseases in zebrafish models influence the neurochemical composition of specific brain areas.
Keywords:
magnetic resonance spectroscopy
; point-resolved spectroscopy
; zebrafish
; cerebral metabolites
; 28.2 T ultra-high magnetic field strength
1. Introduction
Localized magnetic resonance spectroscopy (MRS) is a well-established, non-invasive, technique for monitoring metabolic changes in human clinical studies and pre-clinical studies using animal models [1]. Unlike various other metabolic methodologies, localized MRS bypasses the need for laborious extraction procedures. Moreover, it facilitates precise selection of tissue regions, enabling in vivo monitoring of metabolites within their native environments. While localized MRS is utilized for various tissue types [2,3,4,5], clinical applications predominantly focus on brain tissue across a wide range of neurological disorders [6,7,8,9,10,11,12]. In this respect, brain metabolites show a remarkable sensitivity to deviations from physiological homeostasis induced by pathological conditions. Specific metabolites offer insights into distinct cells and their corresponding cellular activities. For instance, localized MRS enables quantification of glutamate (Glu) and γ-aminobutyric acid (GABA), the principal excitatory and inhibitory neurotransmitters in the brain, respectively [13,14]. Additionally, N-acetylaspartate (NAA), predominantly localized in neuronal cell bodies and axons, serves as a potential marker for monitoring neuronal integrity [15] and myo-inositol (m-Ins), chiefly situated in glial cells, functions as a potential marker for astrogliosis and neuroinflammation [16].
Zebrafish (Danio rerio) is an important model organism for several human diseases including neurological disorders. For scientific inquiry, zebrafish offer distinct advantages, including cost-effectiveness and easy maintenance, coupled with a rapid developmental pace. Zebrafish embryos are particularly beneficial in developmental and toxicity studies at a cellular and molecular level [17,18,19,20,21,22]. The entire zebrafish genome is sequenced [23], revealing 84% of genes linked to human diseases possess a corresponding homologous gene in the zebrafish genome. These similarities with humans allow for genetically manipulation to create transgenic zebrafish models to study human diseases. For neurological disorders, an extensive number of zebrafish models are available, including transgenic models of Alzheimer’s disease, Parkinson’s disease, brain tumors and epilepsy [24,25,26,27,28]. Despite their considerable use in research, studies utilizing localized MRS involving zebrafish are rare. Previously, we presented the first study of localized MRS for in vivo analysis of cerebral metabolites in zebrafish at 9.4 T (400 MHz) [29]. High-resolution spectra were obtained, allowing for the identification and quantification of the most predominant metabolites, including creatine (Cr), Glu, NAA, m-Ins, glutamine (Gln), taurine (Tau), and GABA. However, the limited sensitivity of localized MRS, in combination with the small size of the zebrafish brain (few mm3), prevented the application from analyzing localized brain regions.
Recent developments in MR systems operating at high fields and ultra-high fields (UHF), offer remarkable potential in elucidating intricate details within the zebrafish brain using MRI [30]. Elevated signal-to-noise ratio (SNR) in combination with extremely high gradient strengths, unveiled previously unseen details in the zebrafish brain through non-invasive magnetic resonance imaging (MRI), including the identification of tiny white matter structures through diffusion-based MRI fiber tracking [30,31]. However, despite these recent breakthroughs, the application of localized MRS in the zebrafish brain at UHF remains untapped. Due to anticipated enhancements in SNR and improved baseline separation of metabolites, localized MRS at UHFs holds tremendous promise. However, it may also introduce specific challenges, notably increased chemical shift displacement effects (sδ). Chemical shift displacement effects, also known as chemical shift misregistration or chemical shift artifacts, were first elucidated in 1984 though the registration shift of lipid signals [32]. These effects arise from the interplay between the offset ΔvL, i.e. the difference between the applied excitation frequency v1 and the specific Larmor frequencies of specific compounds vx, and the applied magnetic field gradients (G). Chemical shift displacement effects escalate with the magnetic field strength B0 due to the increase in ΔvL and recede with stronger G for the frequency-encoding bandwidth per pixel becomes larger [33]. Despite UHF MRI systems utilizing Gmax far exceeding the typical strengths used in medical imaging systems [34,35], these gradients remain insufficient to fully compensate for the increase in ΔvL. Additionally, UHF systems are often used on small samples and at cellular resolution (~50µm), making chemical shift effect become relatively more pronounced. Consequently, chemical shift displacements will notably exacerbated in localized MRS utilizing UHF systems. Addressing this challenge requires sophisticated correction methods to accurately quantify metabolite concentrations and interpret spectroscopic data.
This study presents the first successful demonstration of localized MRS at 28.2 T, currently the highest commercially available magnetic field strength. In addition to optimizing key sequence parameters to mitigate chemical shift displacement artifacts, including the excitation frequency v1 and transmitter RF pulse bandwidth tBW, we explored the impact of echo times and voxel sizes on spectral quality and metabolite detectability. Utilizing optimized parameters, our approach enabled localized MRS in remarkably small brain regions, with total acquisition times ranging from just 15 to 30 minutes, bringing it in the range required for in vivo applications. Our protocol allowed for the quantification of major brain metabolites and the acquisition of high-quality spectra from voxel volumes as small as 125 nL. We show localized MRS at 28.2T provides unprecedented spatial resolution enabling clear identification and quantification of multiple metabolites with remarkable spectral clarity in tiny brain regions, thus paving the way for future studies involving comprehensive investigations of neurochemical profiles in zebrafish brain utilizing various zebrafish models of human diseases.
2. Results and Discussion
In this study, we present the first localized MRS results of the zebrafish brain at the state-of-the-art magnetic field strength of 28.2 T. While non-invasive MRI and MRS holds great promise for exploring brain pathology in zebrafish models, achieving the high resolution and signal-to-noise ratio (SNR) necessary to study neurometabolites in tiny brain regions remains a significant challenge. In this work, we optimized and successfully implemented localized MRS techniques at 28.2 T to gain insight into various brain regions in young adult zebrafish.
2.1. Mitigating the Chemical Shift Displacement at UHF
Chemical shift displacement effects become more pronounced at elevated magnetic field strengths [36]. As shown in Supplementary Figure S1, we simulated the extent of the chemical shift displacement effect at various magnetic fields including 28.2T. When utilizing standard PRESS parameters at 28.2 T, which were optimized for lower fields, we observed severe chemical shift displacement for specific metabolites, such as lactate. Consequently, the observed signals of these metabolites either partially or fully originate from outside the selected PRESS region (Figure S1).
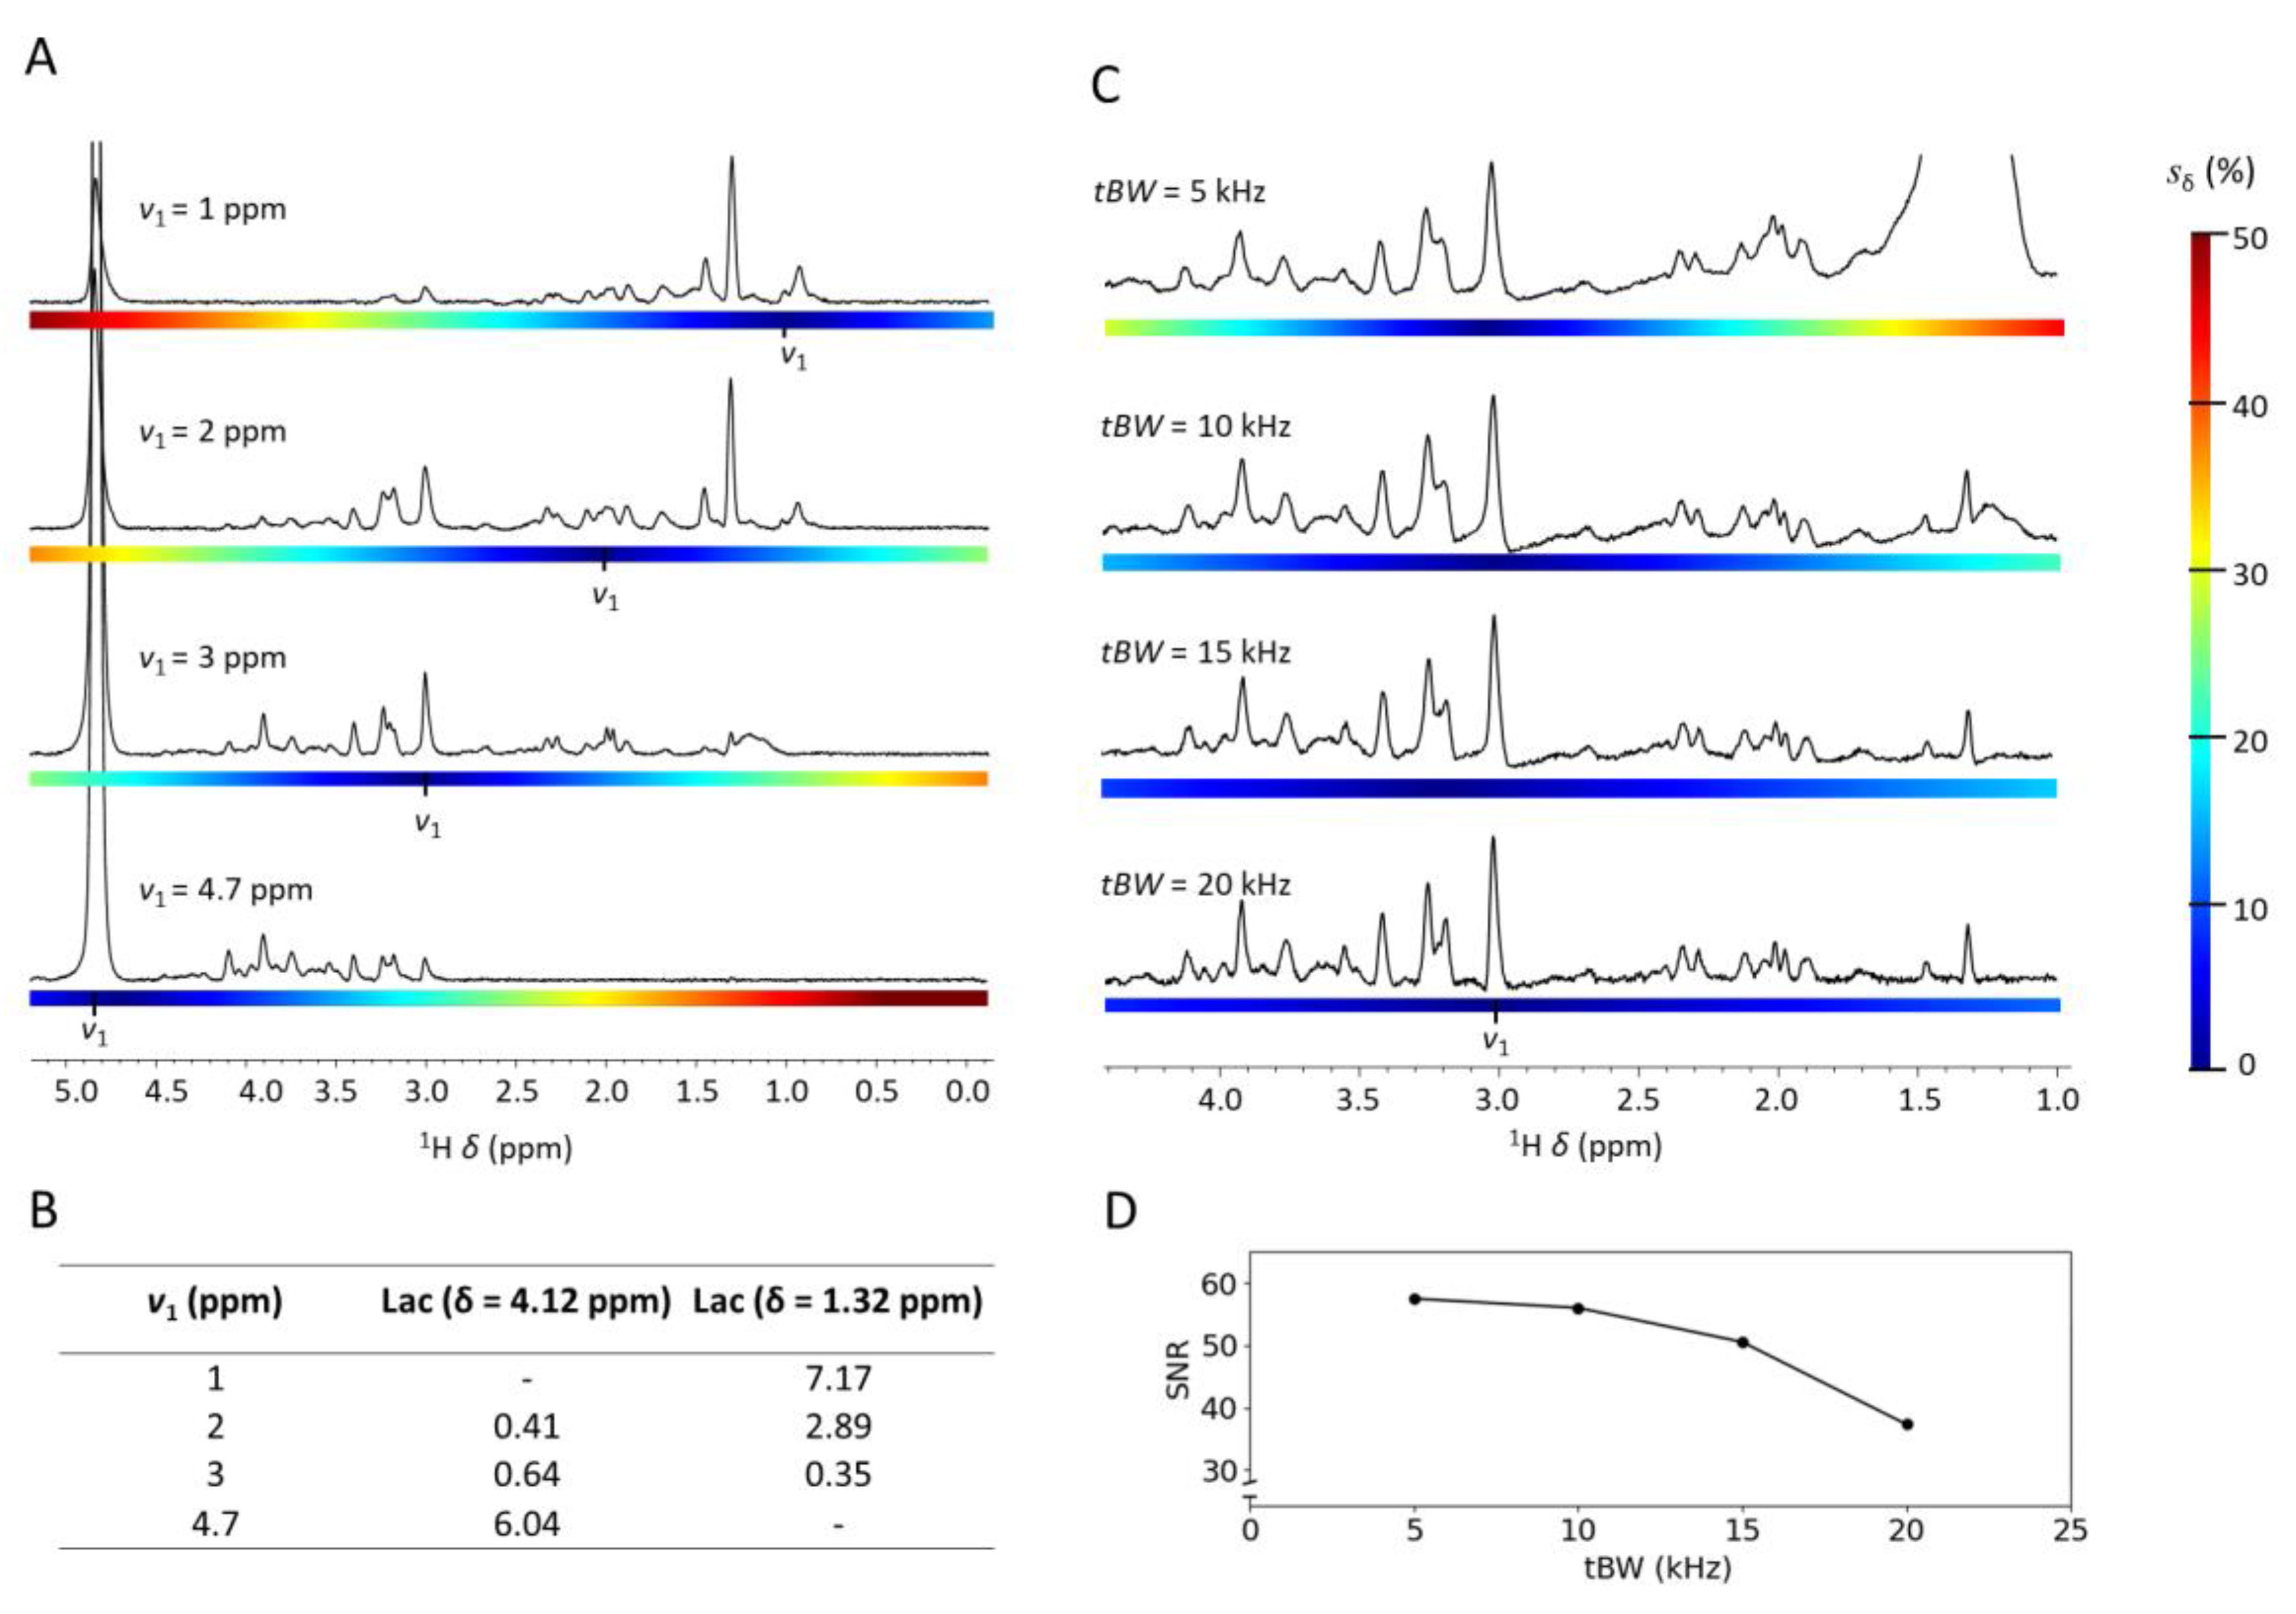
To mitigate the impact of chemical shift displacement, excitation frequency v1 can be adjusted to be in closer proximity to the chemical shift of the metabolites of interest. In Figure 1A, we explored the impact of v1 on extent of chemical shift displacement effects at 28.2 T. An adjustment of v1 by ±1 ppm, equivalent to ±1200 Hz at 28.2 T, led to notable changes in the obtained spectra. A near-total loss of metabolite signals occurred in spectral regions where sδ surpassed 30%, as demonstrated at excitation frequencies v1 = 1 ppm or v1 = 4.7 ppm. Moreover, the chemical shift displacement effect caused noticeable changes in metabolite signal intensities with chemical groups at different chemical shifts δ. For metabolites exhibiting pronounced internal chemical shift differences between their functional groups, including lactate, the displacement effect critically impacted quantification. This effect is clearly demonstrated in Figure 1B. A concentration of 0.41 relative to tCr was observed for the lactate methine signal at δ = 4.1 ppm, while a concentration of 2.89 relative to tCr was observed for the lactate methyl signal at δ = 1.3 ppm, utilizing v1 = 2 ppm. Therefore, to ensure accurate metabolite quantification during comparative analyses, it is essential to consistently select the same chemical group. For our specific aims, most brain metabolites of interest are found in the chemical shift range between the lactate methine signal at δ = 4.1 ppm and the lactate methyl signal at δ = 1.3 ppm. These include Glu, Gln, m-Ins, Tau, Cr, GABA, and NAA. Hence, unless stated otherwise, localized MRS acquisitions in this work were performed with v1 = 3 ppm to balance chemical shift displacement effects across the spectrum.
Besides v1, the transmitter RF pulse bandwidth tBW of the excitation and refocusing pulses impact the magnitude of sδ. In Figure 1C, we probed the impact of tBW on the localized MRS spectra, acquired with v1 = 3 ppm. At tBW = 5 kHz, significant lipid signals were observed around δ = 1.3 ppm. The zebrafish brain is encapsulated by lipids especially fat. To analyse the fat distribution around zebrafish brain we performed fat mapping by using chemical shift selective imaging. As shown in supplementary Figure S2, significant amount of fat was present around the zebrafish brain. In our localized spectra shown in Figure 1C, a huge signal from fat was observed at around δ = 1.3 ppm. This fat signal overlaps the other metabolite signals of such as the lactate methyl signal (δ = 1.32 ppm) and alanine methyl signal (δ = 1.47 ppm). Although the PRESS voxel was fully placed inside the brain, chemical shift displacement effects caused the detection of the lipid signals originating from outside the brain.
For tBW = 10 kHz, the interfering lipid signal was still observed, although significantly reduced compared to tBW = 5 kHz. For tBW = 15 kHz or 20 kHz, the lipid signals were no longer observed, allowing for the identification and quantification of the lactate and alanine (Ala) signals at δ = 1.32 ppm and δ = 1.47 ppm, respectively. However, increasing tBW leads to diminished SNR [37]. As illustrated in Figure 1D, a notable decrease in SNR of approximately 25% was observed between tBW = 15 kHz to 20 kHz. For further measurements, tBW = 15 kHz was selected, as it provided a significant reduction in sδ while maintaining sufficient SNR.
Figure 1.
Impact of the excitation frequency v1 and transmitter RF pulse bandwidth tBW on acquired single voxel localized 1H MRS spectra from adult zebrafish mid-brain at 28.2 T. [A] PRESS spectra acquired at various v1 and its impact on magnitude of chemical shift displacement, sδ , indicated by color bar. [B] Estimated lactate concentration (relative to the tCr) as a function of the excitation frequency v1. Insufficient signal for estimation is indicated by (-). [C] PRESS spectra at various tBW and its impact on magnitude of chemical shift displacement, sδ indicated by color bar. [D] SNR of the tCr signal at δ = 3.03 ppm as a function of tBW. To facilitate direct comparison, spectral intensities were normalized relative to the tCr signal at δ = 3.03 ppm. Acquisition details, unless stated otherwise: TR = 2000 ms, TE = 15 ms, ns = 1024, voxel size 0.8 × 0.8 × 0.8 mm3 with Vvoxel = 512 nL, 2048 acquisition points, acquisition bandwidth 11904 Hz / 9.91 ppm, 4 dummy scans, v1 = 3 ppm, tBW = 10 kHz. Water suppression and outer volume suppression were applied as specified in the method section.
2.2. Localized MRS at Variable Echo Times
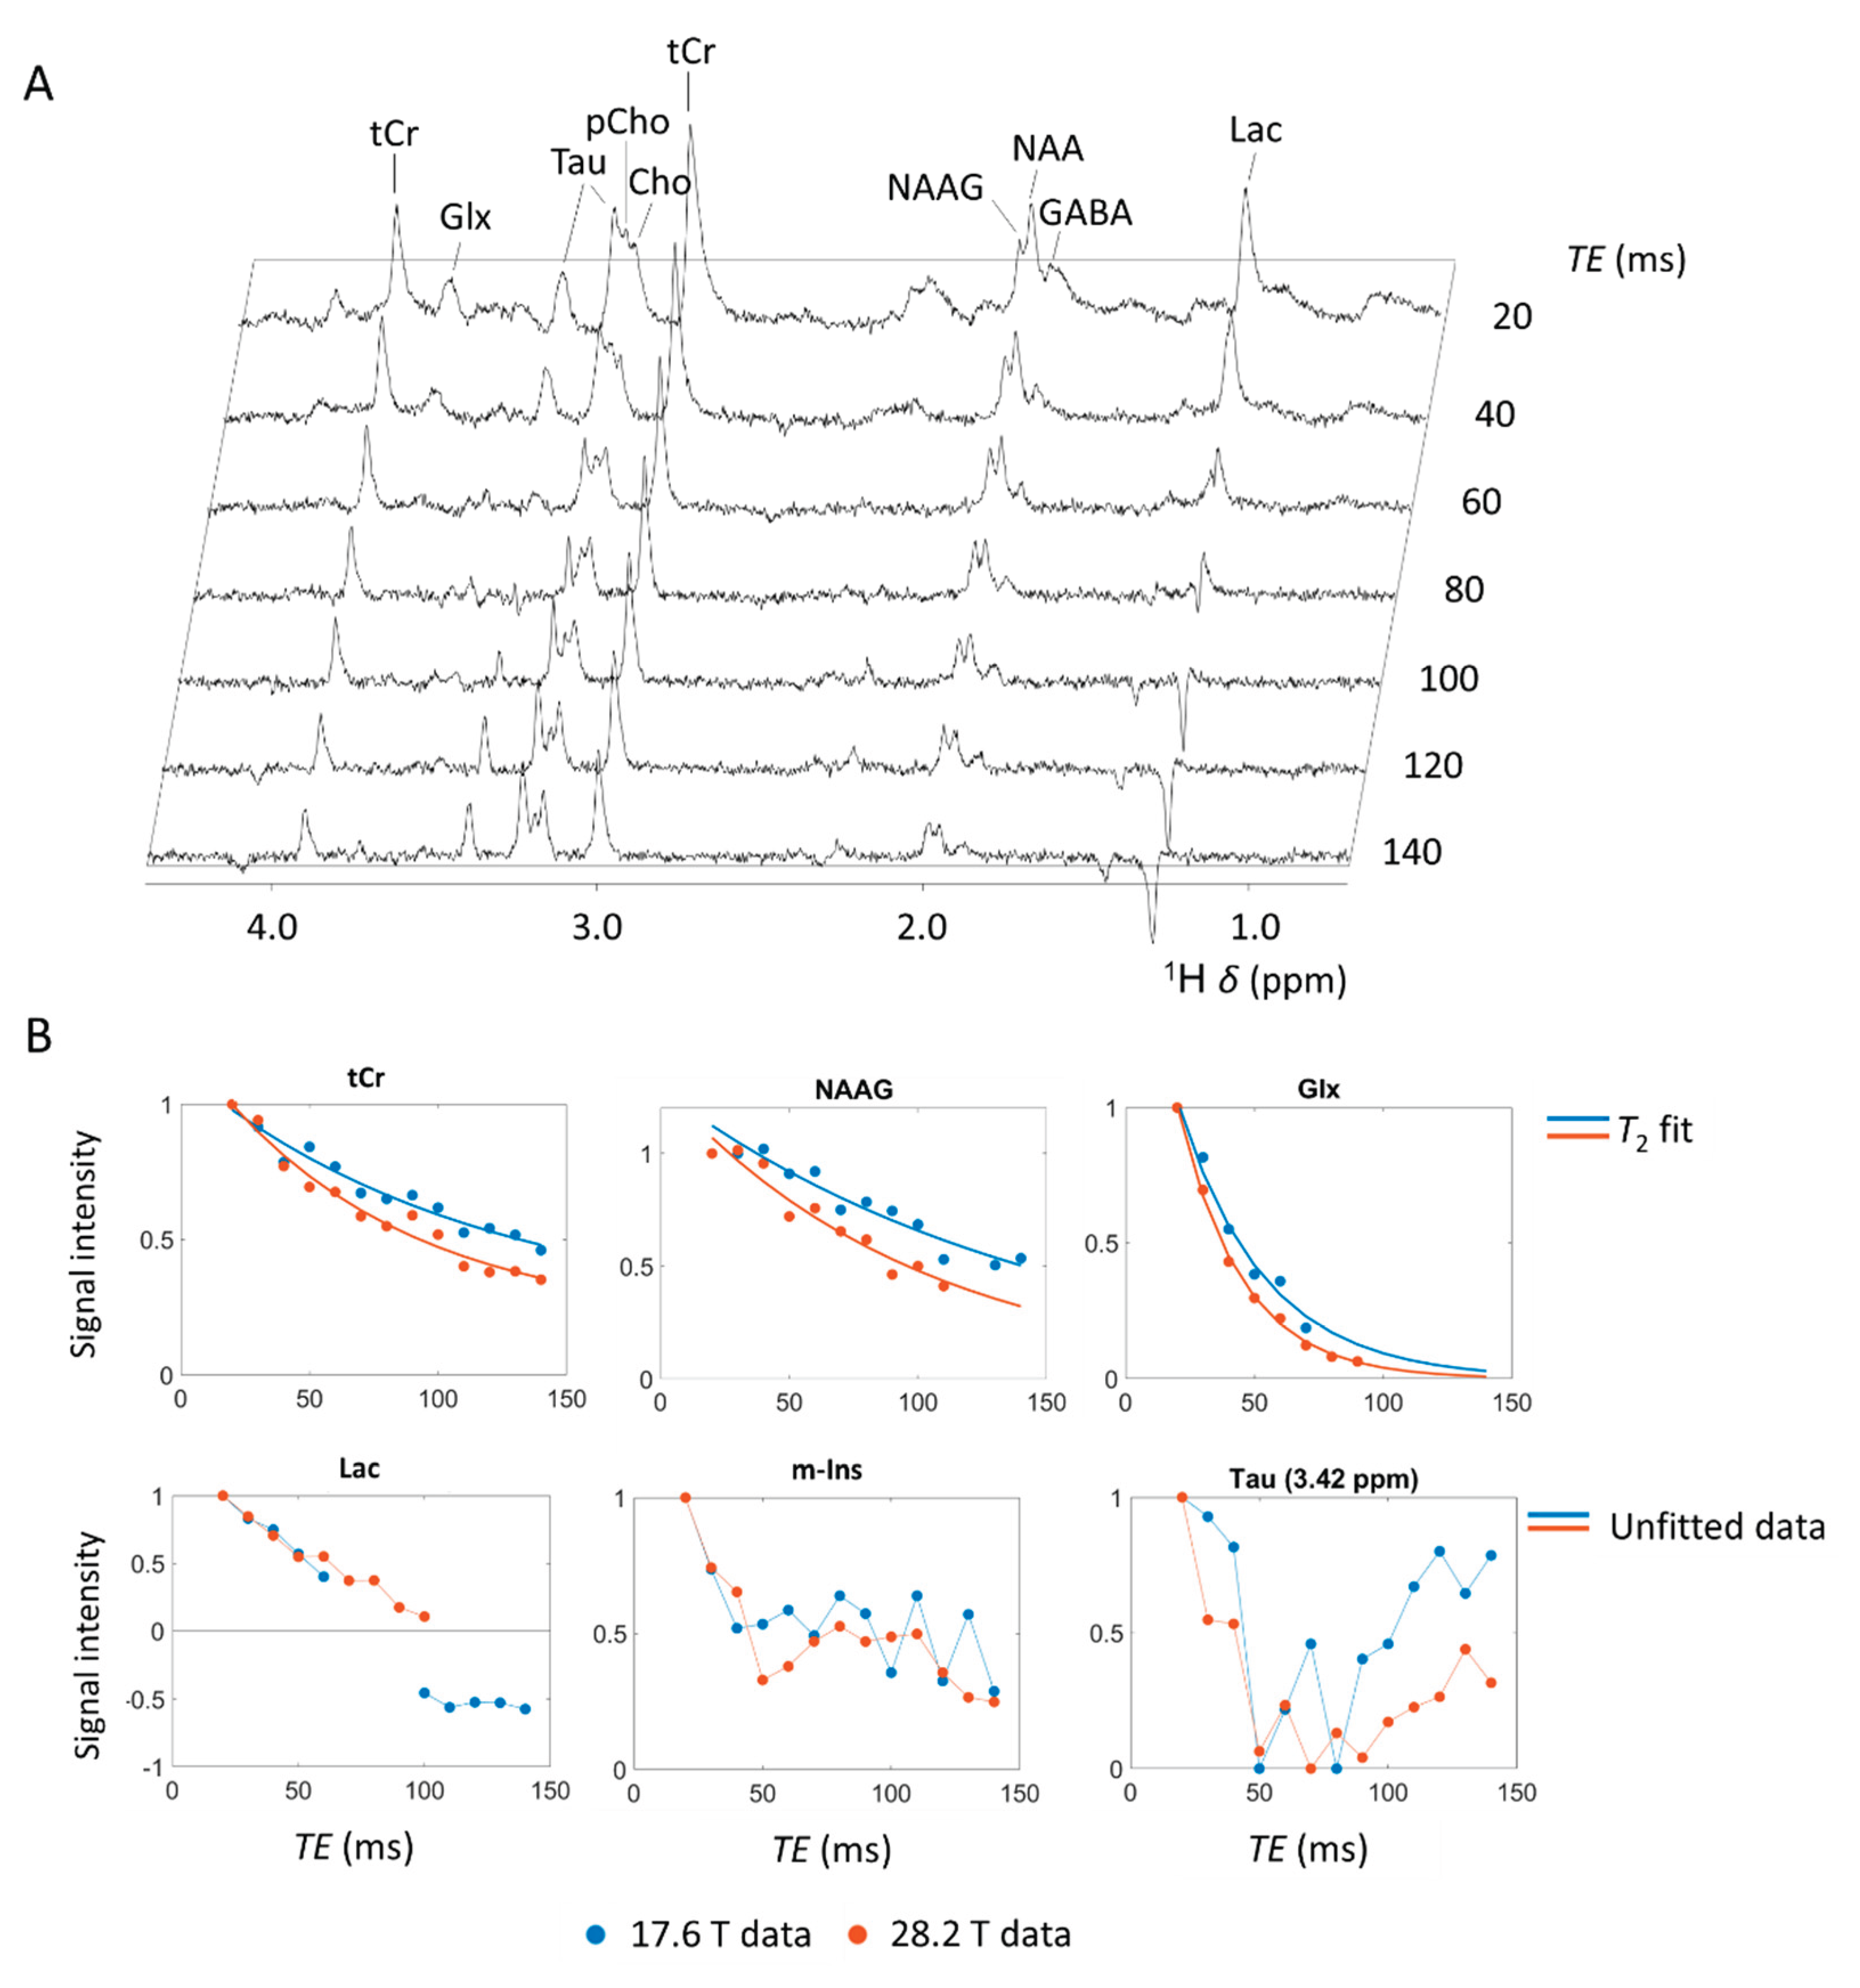
The echo time plays a pivotal role in the acquired metabolic profile and warrants careful consideration during experimental design. A well-established effect is the diminishing of signal intensities at elevated echo times as a consequence of transverse relaxation processes (T2). Hence, shorter echo times are frequently favored to enhance SNR. Nonetheless, deliberate selection of longer echo times can yield substantial enhancements in metabolite identification and quantification. Furthermore, applying a range of echo times allows for the estimation of T2 relaxation times of individual metabolites, providing insight in changes within their respective environments. For instance, in Alzheimer’s disease patients and models, a significant increase in the T2 of NAA was reported, while no significant change was observed in the T2 of water in the same tissue [38,39]. Unlike the T2 of water, which reflects properties of both intracellular and extracellular spaces, NAA is confined solely intracellular, thus furnishing more nuanced and compartment-specific details [38]. Figure 2A shows the cerebral metabolite profile at increasing echo times obtained at 17.6 T. A full comparison of the cerebral metabolite profile at both 17.6 T and 28.2 T is shown in Supplementary Figure S3. Beyond echo times of 60 ms, the lipid signals around δ = 0.9 ppm and δ = 2.0 ppm became indiscernible amidst the background noise, due to the relatively short T2 relaxation time of these macromolecules [40]. This facilitates improved identification and quantification of cerebral metabolites with chemical shifts overlapping with lipid signals, e.g. Lac, Ala, GABA, NAA, and N-acetyl aspartyl-glutamate (NAAG). Additionally, water exhibits a shorter T2 relaxation time compared to most presented cerebral metabolites [41]. Consequently, the suppression of the broad and predominant water signal was notably improved at higher echo times. The signal intensity of various metabolite signals, including the tCr signal at δ = 3.91 ppm (2CH2) and δ = 3.03 ppm (N(CH3)), the NAA signal at δ = 2.01 ppm (2CH3), the NAAG signal at δ = 2.04 ppm (2CH3), the GABA signal at δ = 1.89 ppm (3CH2), and the Glx (Glu + Gln) signal at δ = 3.75 ppm (Glu 2CH and Gln 2CH) appeared to decrease exponentially with increasing echo time (see Figure 2B) which allowed for direct T2 estimation through mono-exponential line fitting, as we demonstrate in Supplementary Figure S3. At 28.2 T, several metabolites exhibited shorter T2 relaxation times compared to 17.6 T, as evidenced by a more rapid signal decay. The decline in T2 relaxation times with increased magnetic field strengths appears to contradict the Bloembergen-Purcell-Pound (BPP) dipolar relaxation theory [42]. However, our findings are in line with previous observations, showing the T2 of (cerebral) metabolites decline at elevated magnetic field strengths in both humans [43,44,45] and animal models [39,46]. This apparent contradiction between theory and practical observations was previously attributed to diffusion-induced dephasing in microscopic susceptibility gradients, which becomes more pronounced at higher magnetic field strengths and leads to irreversible signal loss despite refocusing pulses [39,44].
Other cerebral metabolite signals showed a more complex intensity evolution with increasing echo times, i.e. not following a mono-exponential decay (see Figure 2B). Most noticeable, the Lac signal at δ = 1.31 ppm (3CH3) showed an anti-phase pattern between 60 ms – 100 ms and a 180° phase shift at echo times above 100 ms. This shift evolution was previously contributed to the J-coupling, estimated in the range of 6.9 – 7.3 Hz [47]. Consequently, the Lac signals are negative in-phase at TE = J-1 ~ 140 ms and anti-phase at TE = ½ J-1 ~ 70 ms. This characteristic facilitates distinct lactate identification by applying echo times around 140 ms, but also imposes limitations on echo times due to the complex anti-phase behavior observed within the 60 – 100 ms echo time range. Other metabolites showing a complex echo time evolution included Tau at δ = 3.42 ppm (1CH2) and δ = 3.25 ppm (2CH2), pCho at δ = 3.21 ppm (N(CH3)3), and Cho at δ = 3.19 ppm (N(CH3)3), contributed to J-coupling induced signal dephasing. For Tau and m-Ins, the presented signal evolution was consistent with previous observation [48], showing an initial steep signal decline with a local minimum around TE = 50 ms – 80 ms due to anti-phasing (TE ~ ½ J-1), after which the signal recovered between TE = 100 ms – 140 ms due to rephasing (TE ~ J-1). Estimation of T2 relaxation times for metabolites with a more complex signal intensity evolution, requires quantum mechanics simulations, as previously reported [48,49].
Figure 2.
Impact of the echo time on the acquired single voxel localized 1H MRS spectra from adult zebrafish mid-brain at 17.6 T and 28.2 T. [A] Single voxel localized MRS spectra acquired for echo times ranging from 20 to 140 ms at 17.6 T. [B upper] Signal decay observed for cerebral metabolites with an apparent consistent mono-exponential decrease with echo time, including tCr, NAAG, and Glx (Gln + Glu). Mono-exponential decay curve from T2 relaxation time estimation fitted through data. [B lower] Signal decay of metabolites with a more complex signal intensity evolution, contributed to J-coupling induced signal dephasing, including Lac, m-Ins, and Tau. Acquisition details: TR = 2000 ms, TE = [15, 20, 30, 40, 50, 60, 70, 80, 90, 100, 110, 120, 130, or 140] ms, ns = 1024, a voxel size of 0.8 × 0.8 × 0.8 mm3 with Vvoxel = 512 nL, 2048 acquisition points, acquisition bandwidth 11904 Hz / 9.91 ppm, tBW = 10 kHz for all RF pulses, 4 dummy scans, v1 = 3 ppm. Water suppression and outer volume suppression were applied as specified in the method section.
2.3. Voxel Volume and Averaging Strategies
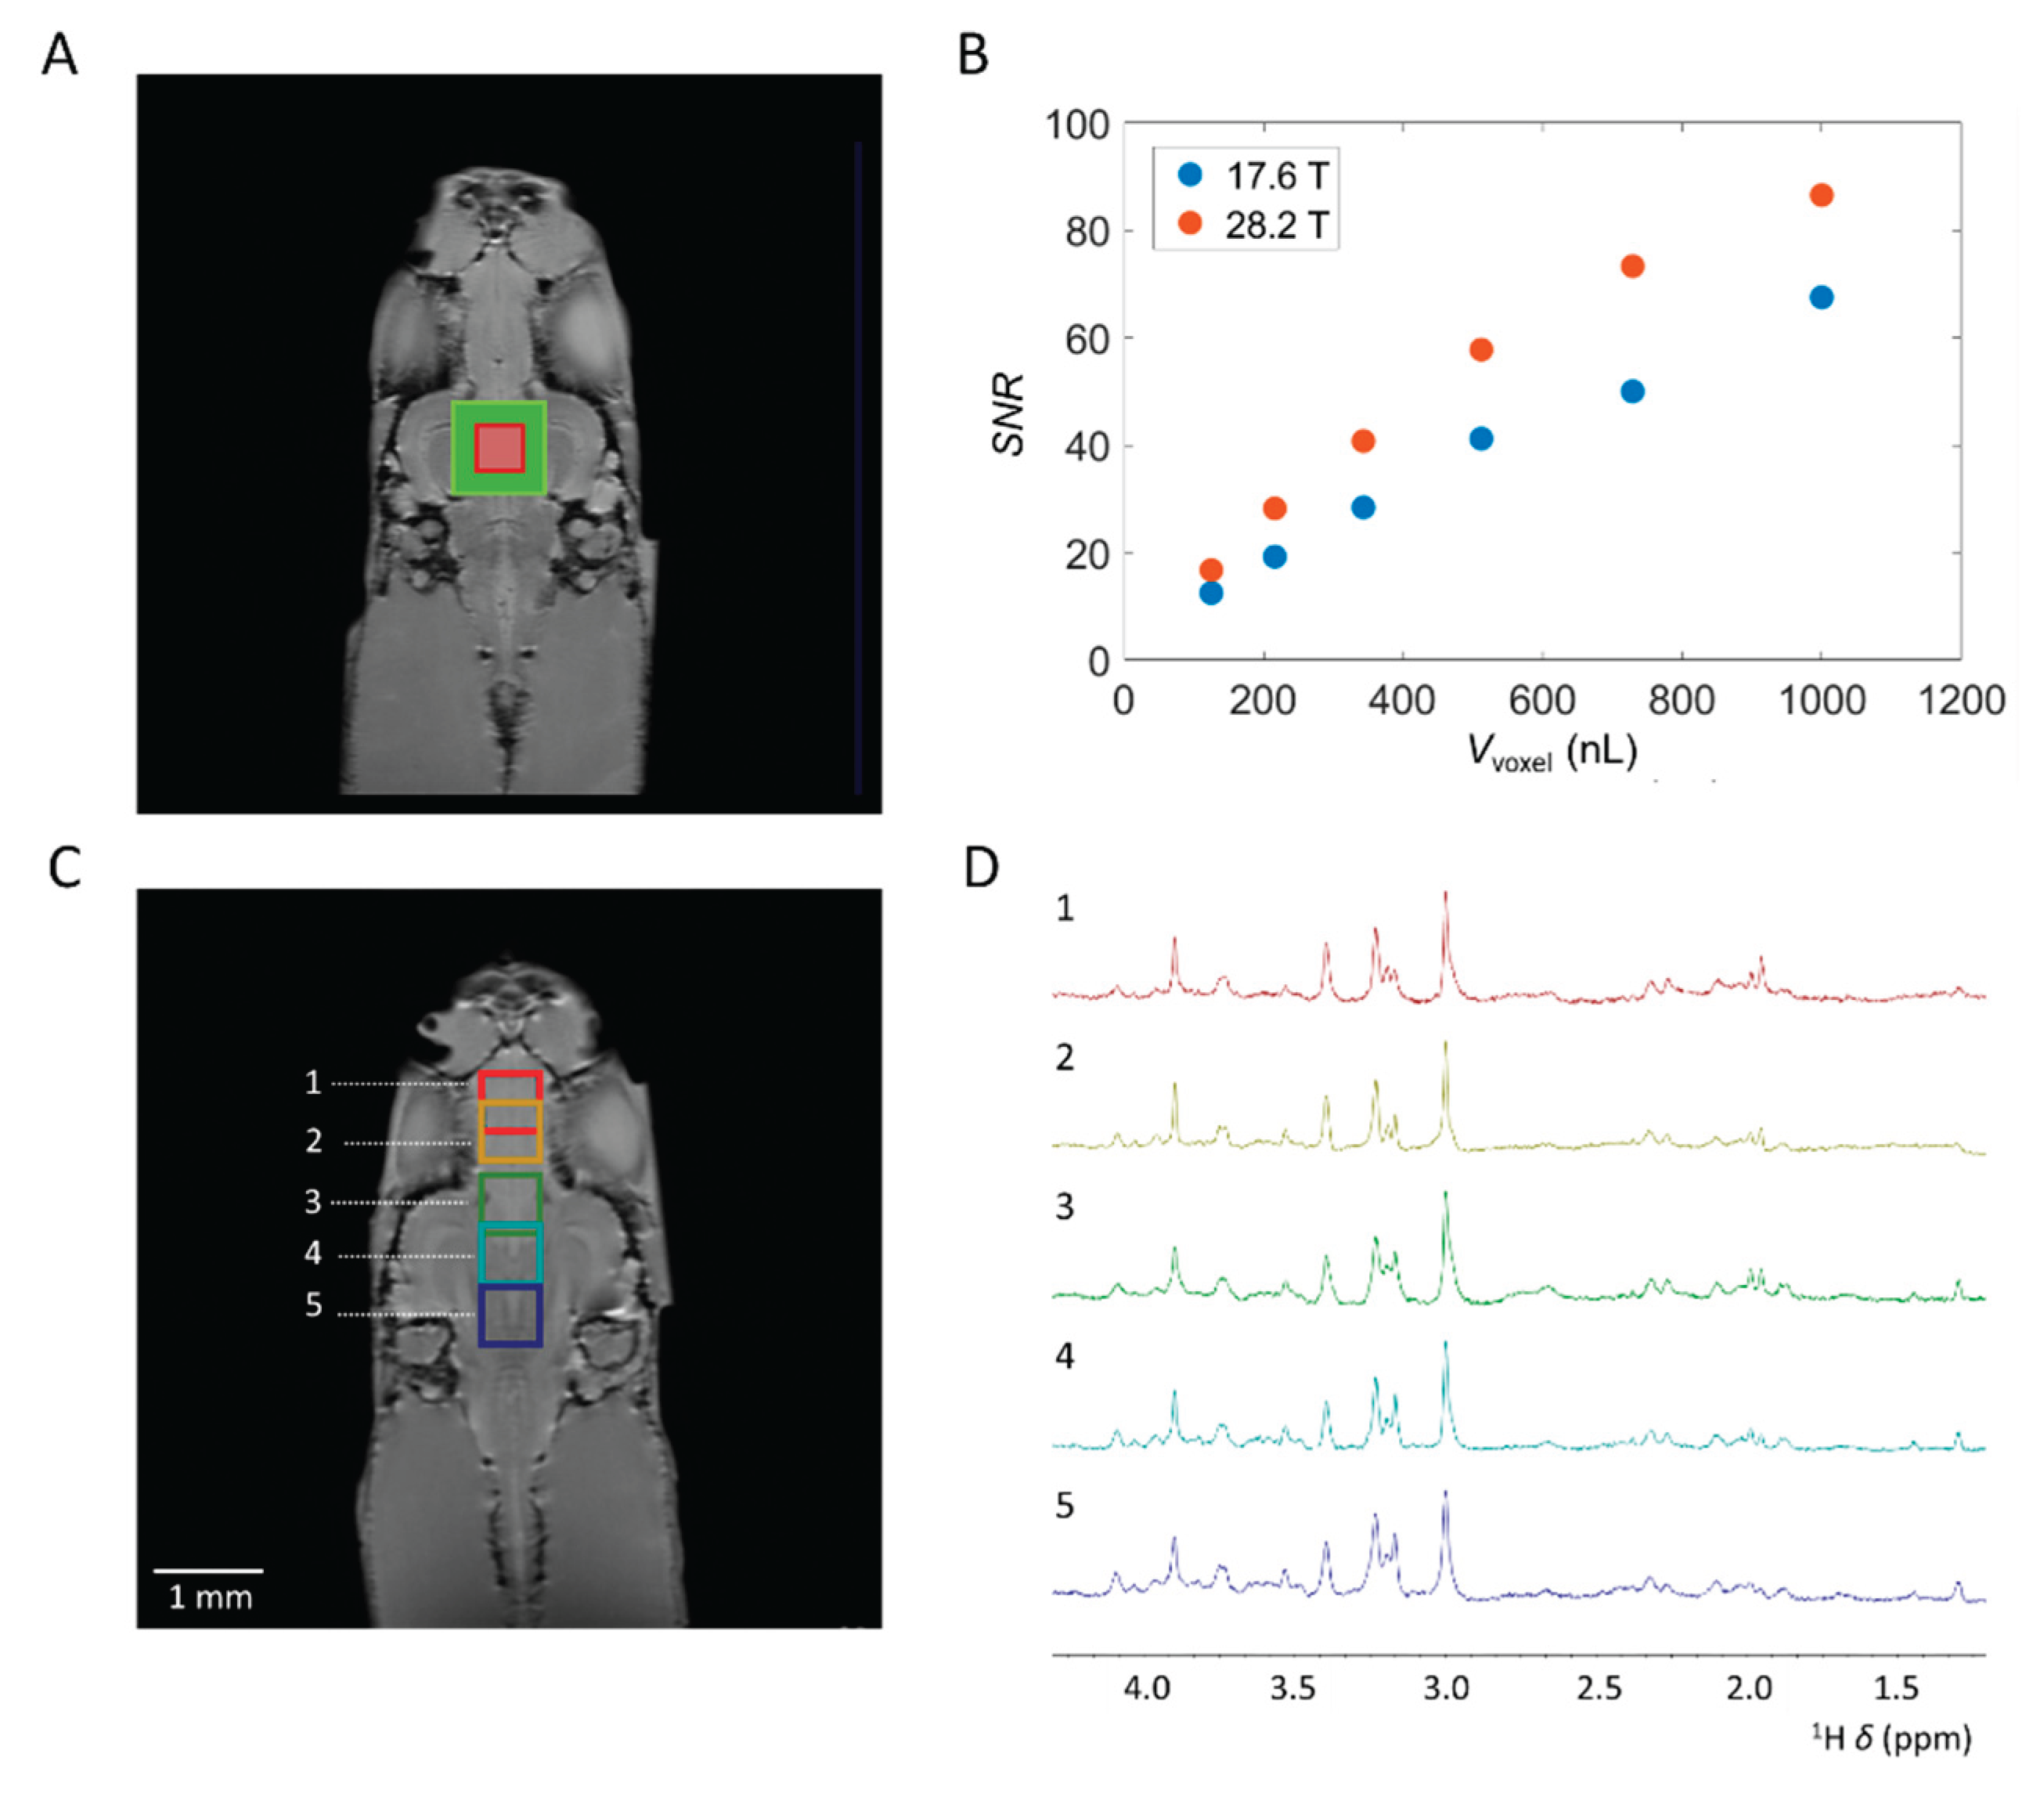
The tiny size of the zebrafish brain, in combination with its shape, limits the utilization of larger voxel sizes. Here, we explored the limits of acquisition of highly resolved single voxel localized MRS spectra in the zebrafish brain in terms of the voxel size and number of averages required for cerebral metabolite identification and quantification. We acquired spectra with ns = 1024 in approximately 34 minutes with Vvoxel ranging between 1000 μL to 125 nL, obtained from the zebrafish midbrain region (Figure 3A) at 17.6 T and 28.2 T. Overall, a noteworthy 40% increase in SNR was observed at 28.2 T compared to 17.6 T (Figure 3B). However, the impact of increased magnetic field strength on elevated T1 relaxation times was not accounted for [50,51,52]. Hence, it is plausible that a more significant enhancement of the SNR could be achieved by adjusting the repetition time to accommodate the increase in T1. Given the small size of the zebrafish brain and its predominantly lipid-rich surrounding, elucidated in Supplementary Figure S2, voxels with isotropic dimensions surpassing beyond the brain tissue showed broad and predominant lipid signals. These lipid signals were clearly visible around δ = 1.3 ppm and δ = 2.0 ppm and overlapped with various cerebral metabolites. In the midbrain, voxel volumes exceeding Vvoxel = 512 nL, corresponding to a voxel size of 0.8 × 0.8 × 0.8 mm3, interference from lipid signals became noticeable. In contrast, for the forebrain and hindbrain, smaller and more elongated than the midbrain, lipid signal interference became apparent at Vvoxel = 216 nL, corresponding to a voxel size of 0.6 × 0.6 × 0.6 mm3. Both at the UHF strength of 17.6 T and 28.2 T, spectra were acquired conducive to the identification and quantification of several cerebral metabolites, even at Vvoxel = 125 nL. To our knowledge, our results represents the use of smallest Vvoxel demonstrated to date for localized MRS on brain tissue while still allowing for reliable quantification of major brain metabolites. This is significantly smaller than the spatial resolutions typically reported in clinical and preclinical applications. In comparison, for human localized MRS at 3T, Vvoxel of approximately 4 mL are recommended for reliable quantification of NAA, tCr, and m-Ins [53]. For preclinical applications, Vvoxel in the range of tens of µL are typically utilized [54].
The ability to obtain high-resolution spectra from small PRESS voxels allows for the identification and quantification of cerebral metabolites in various regions in the zebrafish brain. This is elucidated in Figure 3 C&D, where at 28.2 T the cerebral metabolic profiles were obtained from five distinct regions with Vvoxel = 216 nL, corresponding to a voxel size of 0.6 × 0.6 × 0.6 mm3, utilizing ns = 4096, tBW = 15 kHz, and v1 = 3 ppm. By focusing on specific regions of the zebrafish brain, insight could be obtained on metabolic processes occurring in that particular area, providing valuable information about its function. Furthermore, it could allow for monitoring metabolic changes in specific brain regions during neurodegenerative processes by utilizing pathological models. Additionally, we explored the number of scans ns required for identification and quantification of cerebral metabolites in small voxels. At 28.2 T, a voxel volume of 512 nL (0.8 × 0.8 × 0.8 mm3) acquired in approximately 2 minutes enabled the identification and quantification of key cerebral metabolites, including tCr (δ = 3.02 and 3.91 ppm), Tau (δ = 3.42 and 3.25 ppm), Glx (δ = 3.75 ppm), and Lac (δ = 1.3 ppm) (see supplementary Figure S4). Increasing the number of scans significantly improves the spectral quality. This augmentation enables the identification and quantification of additional metabolites, while increasing the SNR in alignment with SNR ~ √ns.
Figure 3.
Effect of the voxel volume Vvoxel and voxel positions on localized 1H MRS spectra from adult zebrafish brain. [A] Anatomical RARE image, coronal slice, of zebrafish brain regions to indicate position of selected PRESS voxels. Vvoxel = 1000 nL (green) and Vvoxel = 125 nL (red) are highlighted. [B] Comparison of SNR at 17.6 T and 28.2 T obtained with ns = 1024 of the N(CH3) tCr signal at δ = 3.03 ppm as a function of Vvoxel. On average, an SNR increase of 40% was observed at 28.2 T compared to 17.6 T. [C] Optimized single voxel localized 1H MRS spectra obtained from various locations in the adult zebrafish brain at 28.2 T. Anatomical RARE image, coronal slice, of zebrafish brain regions to indicate position of selected PRESS voxels. [D] Highly resolved spectra were obtained from 5 distinct brain locations. Here, location 1 and 2 are situated in the forebrain, 3, 4, and 5 are situated in the zebrafish mid-brain. Acquisition details unless stated otherwise: TR = 2000 ms, TE = 15 ms, ns = 4096, a voxel size of 0.6 × 0.6 × 0.6 mm3 with Vvoxel = 216 nL, 2048 acquisition points, acquisition band-width 11904 Hz / 9.91 ppm, tBW = 15 kHz, 4 dummy scans, v1 = 3 ppm. Water suppression and outer volume suppression were applied as specified in the method section.
2.4. Metabolite Identification and Quantification at UHF
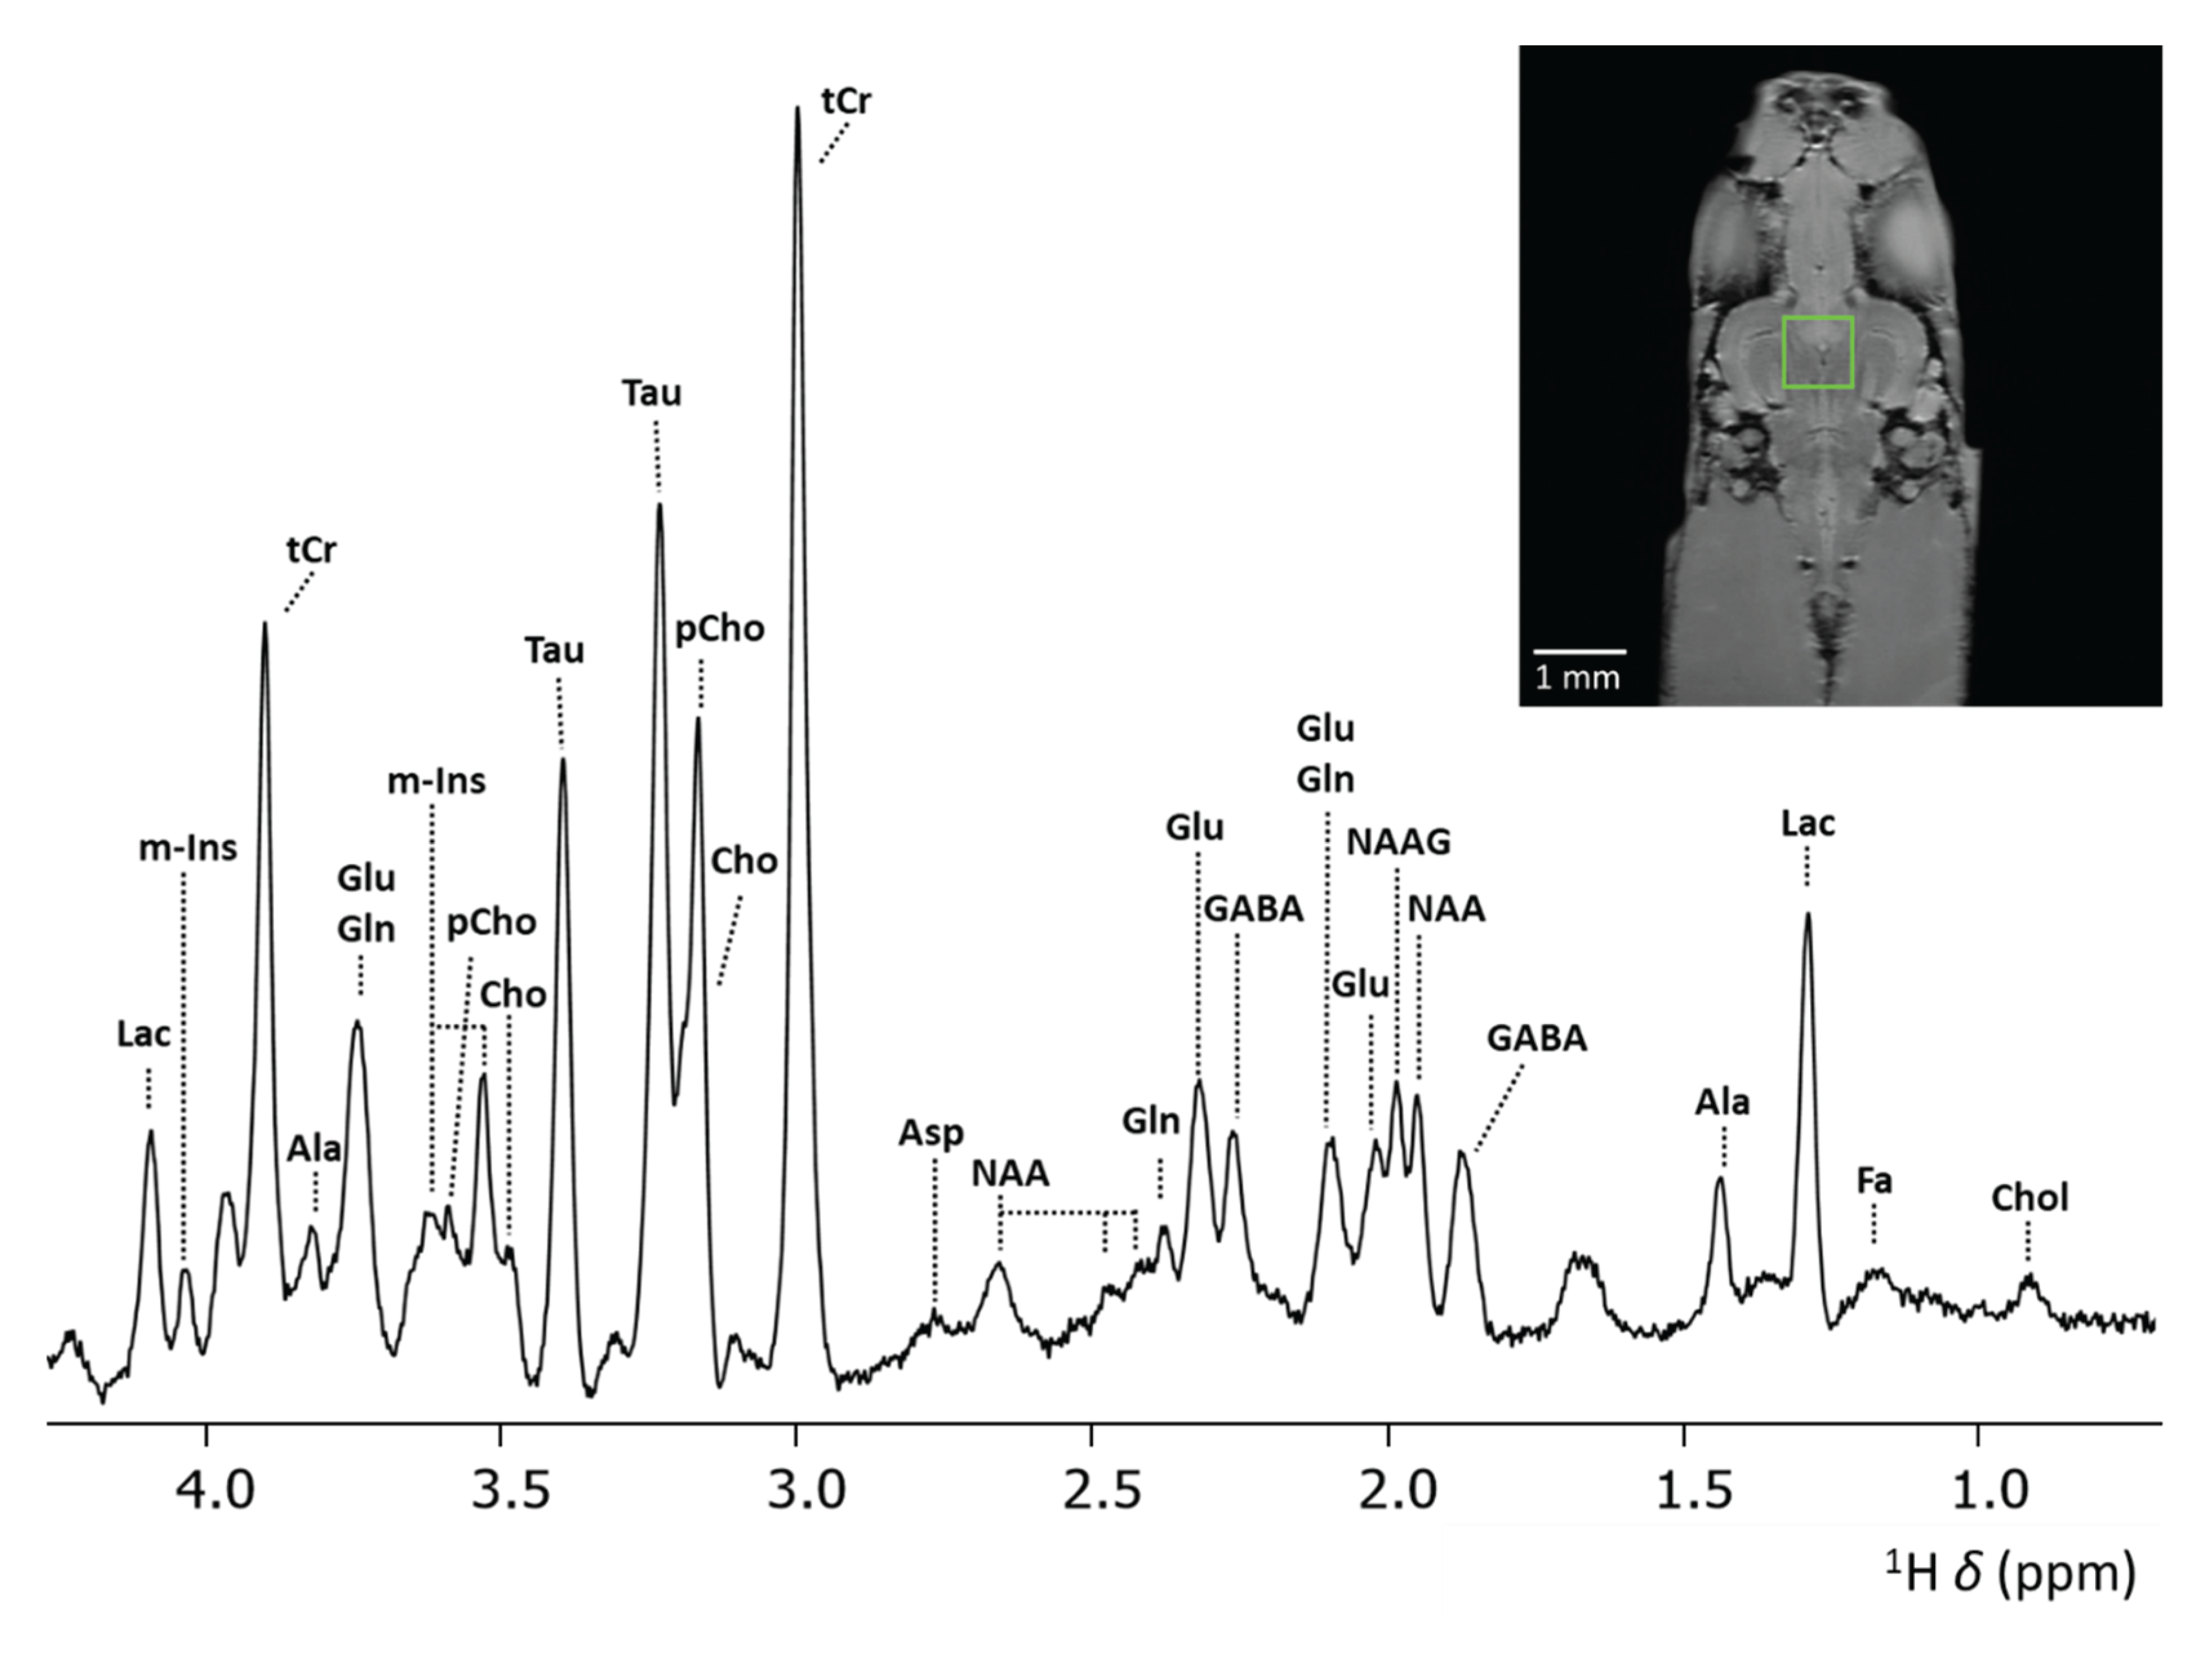
Figure 4 shows the highly resolved spectrum obtained at 28.2 T from a PRESS voxel with Vvoxel = 512 nL, tBW = 15 kHz and v1 = 3 ppm. Compared to previous results obtained from in vivo analysis at 400 MHz [29], significantly improved spectra were obtained. This is most evident in the region between δ = 1.5 – 3.0 ppm, where important cerebral metabolite signals are present, e.g. GABA, NAA, NAAG, Glu, and Gln. Previously, the use of lower field strength required a larger PRESS voxel, i.e. Vvoxel = 3375 nL, to acquire ample signal from cerebral metabolites for quantification in the zebrafish brain [29]. Furthermore, spectral resolution is significantly enhanced at 28.2 T compared to lower field strengths. This improvement is clearly demonstrated by the separation of the 2CH3 signals of NAA and NAAG, which exhibited a chemical shift difference of ∆δ = 0.04 ppm, as expected [55]. NAAG, the most abundant dipeptide neurotransmitter in the brain, is formed in neurons by the coupling of NAA and Glutamate by NAAG synthetases [56] and hydrolyzed by glutamatecarboxypeptidases into NAA and glutamate on the surface of astrocytes [57]. Due to their different function in the central nervous system and their different expression in disease in various brain regions [58,59], quantifying NAA and NAAG separately may provide valuable insights into localized disease mechanisms and improve diagnostic accuracy. However, due to spectral overlap, the 2CH3 signals of NAA and NAAG are frequently reported as the total NAA (tNAA) [60] signal or simply as NAA [6,7,9,10], given the predominant contribution of NAA in the human brain. Post-processing techniques enable to resolve these signals [61], or alternatively, quantification can be achieved through carefully designed sequences specifically for NAA and NAAG detection, such as the MEGA-PRESS sequence by Edden et al. [62]. Previously the separation of NAA and NAAG signals could be achieved using high-resolution localized two-dimensional COSY MRS in mouse brain [63]. As demonstrated here, direct separation of NAA and NAAG signals can be achieved through single voxel localized one-dimensional MRS at UHF strengths.
Besides NAAG, GABA is another important brain metabolite. GABA, the main inhibitory neurotransmitter, plays an important role in memory and learning, motor functions, and neural development [64] and its expression was found to be significantly altered in various neurological disorders [65]. However, due to its relative low concentration and substantial spectral overlap with more abundant metabolites, GABA has been difficult to quantify directly using MRS, often requiring specialized editing techniques to achieve sufficient specificity and accuracy [66]. Direct quantification of GABA has been achieved previously in pre-clinical systems, although some spectral overlap with other metabolites, specifically Glu, was still observed [67]. In our work at 28.2 T, we observe a very clear separation of the GABA, Glu and Gln signals around 2.3 ppm. We achieved almost complete baseline separation of the GABA signal from other metabolites, demonstrating how MRS at ultra-high fields can be utilized not only for its improved SNR, but also for its enhanced spectral resolution.
Figure 4.
Localized 1H MRS spectrum from a voxel (Vvoxel = 512 nL) placed in mid-brain of zebrafish obtained at 28.2 T. Anatomical RARE image, coronal slice, of zebrafish brain regions to indicate position of selected PRESS voxel. Acquisition details: TR = 2000 ms, TE = 15 ms, a voxel size of 0.8 × 0.8 × 0.8 mm3 with Vvoxel = 512 nL, ns = 8192, acquisition points=2048, acquisition bandwidth 11904 Hz / 9.91 ppm at 28.2 T, 4 dummy scans, v1 = 3 ppm, tBW = 15 kHz. Water suppression and outer volume suppression were applied as specified in the method section. Abbreviations; Lac – Lactate, m-Ins – myo-inositol, tCr – total creatine, Ala – alanine, Glu – glutamate, Gln – glutamine, pCho – phosphocholine, Cho – choline, Tau – taurine, Asp – aspartate, NAAG - N-acetylaspartyl-glutamate, NAA - N-acetylaspartate, GABA - γ-aminobutyric acid, FA – fatty acids, Chol – cholesterol.
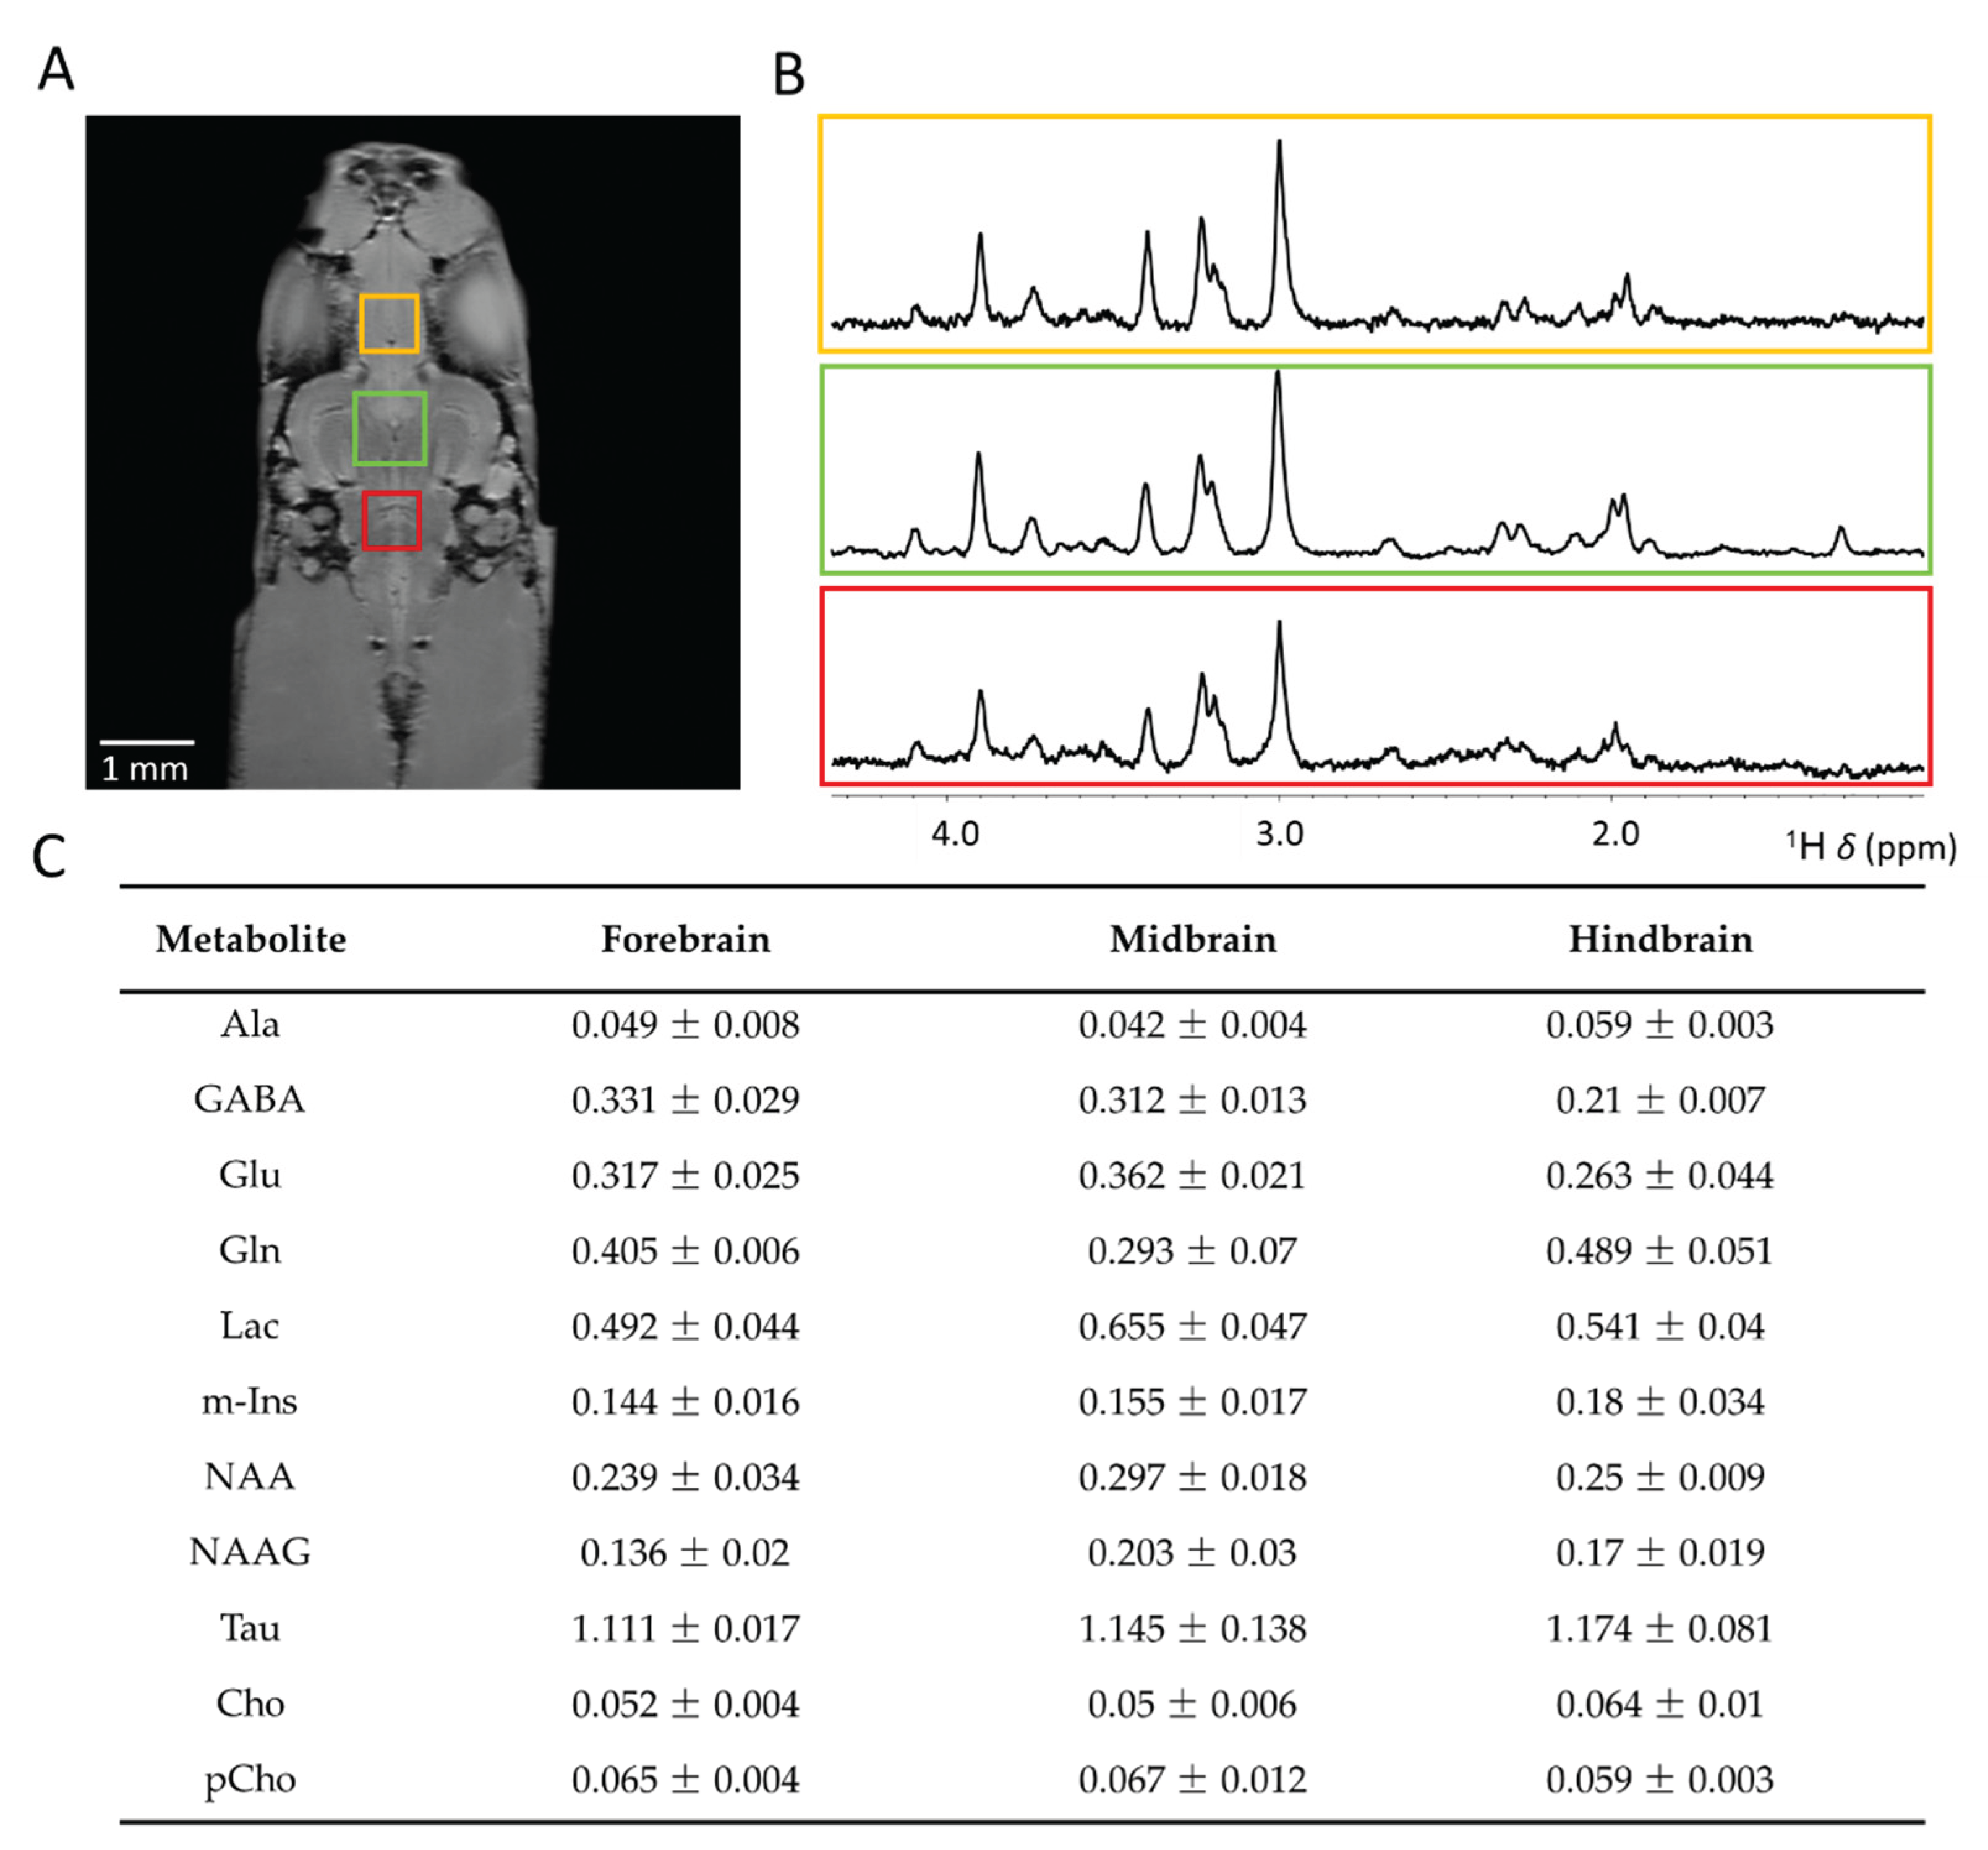
In Figure 5, we present quantification analysis of the cerebral metabolic profile obtained from different regions in the zebrafish brain (see Figure 5A), acquired at 28.2 T. For the midbrain, spectra were acquired in approximately 15 minutes using a voxel volume of 512 nL, while for the forebrain and hindbrain, acquisition took around 30 minutes with a voxel volume of 216 nL. These relatively short measurement times show the potential feasibility of applying our approach in vivo, while still allowing for the quantification of most major brain metabolites. Highly resolved spectra were obtained from each region (see Figure 5B). Quantification of metabolites is shown in Figure 5C. We observed minimal variation in metabolite levels across the studied brain regions. However, significantly lower levels of GABA were found in the hindbrain compared to the forebrain (p < 0.005) and midbrain (p < 0.05). Throughout the zebrafish brain, GABAergic neurons are not uniformly distributed. Regions including the optic tectum, the subpallium, and the corpus cerebelli exhibit higher densities of GABAergic neurons [68,69]. In our study the, PRESS voxels in the forebrain and midbrain predominantly overlapped with these GABAergic neuron rich regions. However, the hindbrain voxel, situated just posterior to the cerebellar corpus, appears to have been positioned within a region characterized by lower levels of GABAergic neurons, thereby elucidating the observe difference in GABA levels.
3. Materials and Methods
3.1. Zebrafish Husbandry
The husbandry of the zebrafish was performed according to the regulations set forth by the local animal welfare committee of the university of Leiden (Licence numbers AVD1060020171767 and AVD10600202216175), in accordance with the international standards outlined by the EU Animal Protection Directive 2010/63/EU. All procedures followed standard protocols as previously described (www.zfin.org) [70]. In this study, three-month-old male zebrafish were utilized. To minimize any metabolite degradation, zebrafish were euthanized just before the MRI examination, which was induced by immobilization through submersion in ice water at a temperature between 0 – 4 °C for 15 minutes until the halt of opercular movement. Following euthanization, specimens were shortly kept on ice until MRI and MRS measurements were conducted.
3.2. Magnetic Resonance Imaging and Spectroscopy
MRI and MRS experiments were conducted using Bruker (Bruker Biospin GmbH, Germany) vertical bore systems operating at 17.6 T (750 MHz) or 28.2 T (1200 MHz), configured with a Micro5 or Micro5 iProbe gradient system, respectively. Both systems were water-cooled, provided Gmax = 3 T/m, used 5 mm inner diameter birdcage resonators, and GREAT60 gradient power supplies. Measurements were conducted at room-temperature. Data acquisition and processing on both systems was performed with Linux workstations, running Bruker imaging software ParaVision 360 v3.3 (Bruker Biospin GmbH, Germany). During analysis, zebrafish were embedded in perfluoropolyether (Fomblin Y, Solvay Solexis S.P.A.).
T2-weighted spin echo images were acquired by a rapid acquisition with relaxation enhancement (RARE) pulse sequence to select the position for single voxel localized MRS. RARE measurements were performed with an echo time TE = 5.6 ms, a repetition time TR = 3000 ms, using 4 refocusing pulses per excitation, and ns = 16 averages. The field of view (FOV) was 8 × 8 mm, at a matrix size of 256 × 256 voxels, obtaining a resolution of 31 × 31 μm, with a slice thickness of 200 μm.
For single voxel localized 1H MRS, we utilized a point resolved spectroscopy (PRESS) pulse sequence [71]. The PRESS sequence incorporates three transmitter slice-selective RF pulses (90°-180°-180°), applied simultaneous with x, y, and z gradients to target the specified voxel. Prior to each localized MRS measurement, magnetic field homogeneity within each voxel was achieved by local second-order shimming prior to data acquisition. After parameter optimization, standard PRESS measurements were performed with TE = 15 ms, TR = 2000 ms, ns = 512. The PRESS sequence used 2048 complex points and an acquisition bandwidth of 10 ppm. At 17.6 T and 28.2 T, the transmitter RF pulse bandwidth was tBW = 10 kHz or 15 kHz, respectively. The excitation frequency was v1 = 3 ppm, coinciding with the N(CH3) total creatine (tCr) signal. For the estimation of regional cerebral metabolite levels, three voxels were selected in the zebrafish brain; (1) in the forebrain, covering part of the pallium, (2) in the midbrain, covering part of the mesencephalon, cerebellum, and diencephalon, and (3) in the hindbrain, covering part of the cerebellum and rhombencephalon. In the midbrain, a PRESS voxel of 0.8 × 0.8 × 0.8 mm3, with a voxel volume of Vvoxel = 512 nL was selected. In the forebrain and hindbrain, a PRESS voxel of 0.6 × 0.6 × 0.6 mm3, with Vvoxel = 216 nL was selected. For suppression of the water signal, a variable pulse power and optimized relaxation delays (VAPOR) sequence [72] was applied prior to the PRESS pulses. Outer volume suppression (OVS) was integrated in an interleaved manner with the VAPOR sequence. The OVS consists of six suppression slices, each repeated three times and aligned parallel to the PRESS voxel, reducing the PRESS gradient spoilers.
3.3. Data Processing
Identification of cerebral metabolites was performed by comparison of obtained 1H spectra to reference spectra of brain metabolites [55,73,74] and on our previously obtained NMR spectra of zebrafish brain extracts [29]. Quantification of metabolites was executed using Chenomx NMR suite 8.2 (Chenomx Inc., Edmonton, Alberta, Canada), using the following signals per metabolite. Alanine (Ala) 3CH3 at δ = 1.47 ppm; γ-aminobutyric acid (GABA) 3CH2 at δ = 1.89 ppm; Glutamate (Glu) 4CH2 at δ = 2.45 ppm; Glutamine (Gln) 2CH at δ = 3.75 ppm; Lactate (Lac) 2CH at δ = 4.09 ppm; myo-Inositol (m-Ins) at δ = 3.61 ppm; N-acetylaspartate (NAA) 2CH3 at δ = 2.01 ppm; N-acetylaspartate-glutamate (NAAG) 2CH3 at δ = 2.01 ppm; taurine (Tau) 2CH2 at δ = 3.25 ppm; choline (Cho) N(CH3)3 at δ = 3.19 ppm, and phosphor-choline (pCho) N(CH3)3 at δ = 3.21 ppm. Available reference libraries provided by Chenomx were utilized. Metabolite concentrations were estimated relative to tCr [75]. Statistical analysis for NMR quantification involved one-way analysis of variance (ANOVA) by OriginPro v.8 (Originlab, Northhampton, MA, USA). Multiple comparisons were conducted using the t-test, and significance was established with p < 0.05. Unless specified otherwise, SNR was estimated based on the tCr signal at a chemical shift δ = 3.03 ppm, utilizing build-in TopSpin functionalities with
Here, ItCr is the maximum signal intensity of the tCr signal at δ = 3.03 ppm, and N is the noise factor as fully described in the TopSpin manual (Processing commands and parameters user manual, version 007, Bruker Corporation). The estimation of sδ was based on
where vx is the Larmor frequency of the metabolite of interest (Hz).
SNR = ItCr / (2∙N).
sδ (%)= |v1 - vx|/ tBW,
5. Conclusions and Future Outlook
This study reported the first successful application of localized MRS at 28.2 T, the highest commercially available magnetic field strength to date. We achieved localized MRS in extremely small brain regions, with total scan times between 15 and 30 minutes, making the technique suitable for in vivo use. Our protocol enabled accurate quantification of key brain metabolites and produced high-quality spectra from voxel volumes as small as 125 nL. This advancement in spatial resolution of localized MRS at 28.2 T, opens up new opportunities for exploring regional neurochemical profiles in the zebrafish brain using various zebrafish models of human diseases.
In future, our optimized methods, with relatively short measurement times of up to 30 minutes, are well-suited for implementation in in vivo studies. In vivo measurements will enable the utilization of various zebrafish models of human pathological diseases for longitudinal studies by allowing continuous and non-invasive monitoring of metabolic changes over time. This approach will facilitate the study of disease progression and the long-term effects of therapeutic interventions within the same subjects, providing a more comprehensive understanding of the underlying mechanisms.
| B0 | Magnetic field strength |
| Cr | Creatine |
| G | magnetic field gradient strength |
| GABA | γ-aminobutyric acid |
| Gln | Glutamine |
| Glu | Glutamate |
| HR-MAS | high-resolution magic angle spinning |
| m-Ins | myo-inositol |
| MRI | magnetic resonance imaging |
| MRS | Magnetic resonance spectroscopy |
| NAA | N-acetylaspartate |
| NAAG | N-acetylaspartyl-glutamate |
| ns | number of scans |
| PRESS | Point resolved spectroscopy |
| RARE | rapid acquisition with relaxation enhancement |
| SNR | Signal-to-noise ratio |
| sδ | chemical shift displacement |
| T2 | transverse relaxation time |
| Tau | Taurine |
| tBW | transmitter RF pulse bandwidth |
| TE | Echo time |
| TR | repetition time |
| UHF | Ultra-high field |
| v1 | Excitation frequency |
| VAPOR | variable pulse power and optimized relaxation delays |
| Vvoxel | Voxel volume |
| vx | Larmor frequency compound x |
| δ | Chemical shift |
Author Contributions
R.S., A.A. and H.P.S. designed the experiments. R.S. conducted MRI experiments. W.H. and L.L. carried out zebrafish breading and sample preparations. R.S. and A.A. analyzed the results. H.J.M.d.G., H.P.S. and A.A. supervised the project. R.S. and A.A. wrote the manuscript. All authors have read and agreed to the published version of the manuscript.
Funding
Experiments at the 1.2 GHz and 750 MHz instruments were supported by uNMR-NL, an NWO-funded National Roadmap Large-Scale Facility of the Netherlands (project 184.032.207). Alia thanks the grant (SFB TRR-386 HYP*MOL) from Deutsche Forschungsgemeinschaft (DFG)
Institutional Review Board Statement
The animal study protocol was approved with the regulations established by the local animal welfare committee at Leiden University (Licence numbers AVD1060020171767 and AVD10600202216175), in accordance with the international standards outlined by the EU Animal Protection Directive 2010/63/EU.
Data Availability Statement
The data presented in this study are available on request from the author (A.A).
Acknowledgments
Experiments at the 28.2 T and 17.6 T instruments were supported by the uNMR-NL Grid: A distributed, state-of-the-art Magnetic Resonance facility for the Netherlands (NWO grant 184.032.207). The authors thank Andrei Gurinov, Karthick Sai Sankar Gupta and Maria Nardella for technical help provided at the 28.2 T and 17.6 T instrument and Julia R. Krug for her contribution.
Conflicts of Interest
The authors declare that the research was conducted in the absence of any commercial or financial relationships that could be construed as a potential conflict of interest.
Abbreviations and Symbols
The following abbreviations and symbols are used in this manuscript:
Abbreviations and Symbols
The following abbreviations and symbols are used in this manuscript:
| B0 | Magnetic field strength |
| Cr | Creatine |
| G | magnetic field gradient strength |
| GABA | γ-aminobutyric acid |
| Gln | Glutamine |
| Glu | Glutamate |
| HR-MAS | high-resolution magic angle spinning |
| m-Ins | myo-inositol |
| MRI | magnetic resonance imaging |
| MRS | Magnetic resonance spectroscopy |
| NAA | N-acetylaspartate |
| NAAG | N-acetylaspartyl-glutamate |
| ns | number of scans |
| PRESS | Point resolved spectroscopy |
| RARE | rapid acquisition with relaxation enhancement |
| SNR | Signal-to-noise ratio |
| sδ | chemical shift displacement |
| T2 | transverse relaxation time |
| Tau | Taurine |
| tBW | transmitter RF pulse bandwidth |
| TE | Echo time |
| TR | repetition time |
| UHF | Ultra-high field |
| v1 | Excitation frequency |
| VAPOR | variable pulse power and optimized relaxation delays |
| Vvoxel | Voxel volume |
| vx | Larmor frequency compound x |
| δ | Chemical shift |
References
- Alger, J.R. Magnetic Resonance Spectroscopy. In Encyclopedia of Neuroscience; Elsevier, 2009; pp. 601–607 ISBN 978-0-08-045046-9.
- Sharma, U.; Jagannathan, N.R. Metabolism of Prostate Cancer by Magnetic Resonance Spectroscopy (MRS). Biophys Rev 2020, 12, 1163–1173. [CrossRef]
- Cowin, G.J.; Jonsson, J.R.; Bauer, J.D.; Ash, S.; Ali, A.; Osland, E.J.; Purdie, D.M.; Clouston, A.D.; Powell, E.E.; Galloway, G.J. Magnetic Resonance Imaging and Spectroscopy for Monitoring Liver Steatosis. Magnetic Resonance Imaging 2008, 28, 937–945. [CrossRef]
- Ali, H.A.; Couch, M.J.; Menezes, R.; Evans, A.J.; Finelli, A.; Jewett, M.A.; Jhaveri, K.S. Predictive Value of In Vivo MR Spectroscopy With Semilocalization by Adiabatic Selective Refocusing in Differentiating Clear Cell Renal Cell Carcinoma From Other Subtypes. American Journal of Roentgenology 2020, 214, 817–824. [CrossRef]
- Brown, J.J.; Mirowitz, S.A.; Sandstrom, J.C.; Perman, W.H. MR Spectroscopy of the Heart. American Journal of Roentgenology 1990, 155, 1–11. [CrossRef]
- Kantarci, K.; Graff Radford Magnetic Resonance Spectroscopy in Alzheimer’s Disease. NDT 2013, 687. [CrossRef]
- Weinberg, B.D.; Kuruva, M.; Shim, H.; Mullins, M.E. Clinical Applications of Magnetic Resonance Spectroscopy in Brain Tumors. Radiologic Clinics of North America 2021, 59, 349–362. [CrossRef]
- Nakahara, T.; Tsugawa, S.; Noda, Y.; Ueno, F.; Honda, S.; Kinjo, M.; Segawa, H.; Hondo, N.; Mori, Y.; Watanabe, H.; et al. Glutamatergic and GABAergic Metabolite Levels in Schizophrenia-Spectrum Disorders: A Meta-Analysis of 1H-Magnetic Resonance Spectroscopy Studies. Mol Psychiatry 2022, 27, 744–757. [CrossRef]
- Kalra, S. Magnetic Resonance Spectroscopy in ALS. Front Neurol 2019, 10, 482. [CrossRef]
- Pan, J.W.; Kuzniecky, R.I. Utility of Magnetic Resonance Spectroscopic Imaging for Human Epilepsy. 2015 2015, 5, 313–322.
- Sajja, B.R.; Wolinsky, J.S.; Narayana, P.A. Proton Magnetic Resonance Spectroscopy in Multiple Sclerosis. Neuroimaging Clinics of North America 2009, 19, 45–58. [CrossRef]
- Shoeibi, A.; Verdipour, M.; Hoseini, A.; Moshfegh, M.; Olfati, N.; Layegh, P.; Dadgar-Moghadam, M.; Farzadfard, M.T.; Rezaeitalab, F.; Borji, N. Brain Proton Magnetic Resonance Spectroscopy in Patients with Parkinson’s Disease. CJN 2022. [CrossRef]
- Pal, M.M. Glutamate: The Master Neurotransmitter and Its Implications in Chronic Stress and Mood Disorders. Front. Hum. Neurosci. 2021, 15, 722323. [CrossRef]
- Ochoa-de La Paz, L.D.; Gulias-Cañizo, R.; D’Abril Ruíz-Leyja, E.; Sánchez-Castillo, H.; Parodí, J. The Role of GABA Neurotransmitter in the Human Central Nervous System, Physiology, and Pathophysiology. RMN 2021, 22, 5355. [CrossRef]
- Kalra, S.; Arnold, D.L. Magnetic Resonance Spectroscopy for Monitoring Neuronal Integrity in Amyotrophic Lateral Sclerosis. In Proceedings of the N-Acetylaspartate; Moffett, J.R., Tieman, S.B., Weinberger, D.R., Coyle, J.T., Namboodiri, A.M.A., Eds.; Springer US: Boston, MA, 2006; pp. 275–282.
- Bertran-Cobo, C.; Wedderburn, C.J.; Robertson, F.C.; Subramoney, S.; Narr, K.L.; Joshi, S.H.; Roos, A.; Rehman, A.M.; Hoffman, N.; Zar, H.J.; et al. A Neurometabolic Pattern of Elevated Myo-Inositol in Children Who Are HIV-Exposed and Uninfected: A South African Birth Cohort Study. Front. Immunol. 2022, 13, 800273. [CrossRef]
- Annunziato, M.; Eeza, M.N.H.; Bashirova, N.; Lawson, A.; Matysik, J.; Benetti, D.; Grosell, M.; Stieglitz, J.D.; Alia, A.; Berry, J.P. An Integrated Systems-Level Model of the Toxicity of Brevetoxin Based on High-Resolution Magic-Angle Spinning Nuclear Magnetic Resonance (HRMAS NMR) Metabolic Profiling of Zebrafish Embryos. Science of The Total Environment 2022, 803, 149858. [CrossRef]
- Annunziato, M.; Bashirova, N.; Eeza, M.N.H.; Lawson, A.; Benetti, D.; Stieglitz, J.D.; Matysik, J.; Alia, A.; Berry, J.P. High-Resolution Magic Angle Spinning (HRMAS) NMR Identifies Oxidative Stress and Impairment of Energy Metabolism by Zearalenone in Embryonic Stages of Zebrafish (Danio Rerio), Olive Flounder (Paralichthys Olivaceus) and Yellowtail Snapper (Ocyurus Chrysurus). Toxins 2023, 15, 397. [CrossRef]
- Annunziato, M.; Bashirova, N.; Eeza, M.N.H.; Lawson, A.; Fernandez-Lima, F.; Tose, L.V.; Matysik, J.; Alia, A.; Berry, J.P. An Integrated Metabolomics-Based Model, and Identification of Potential Biomarkers, of Perfluorooctane Sulfonic Acid Toxicity in Zebrafish Embryos. Environmental Toxicology and Chemistry 2024, 43, 896–914. [CrossRef]
- Hu, W.; Liu, L.; Forn-Cuní, G.; Ding, Y.; Alia, A.; Spaink, H. Transcriptomic and Metabolomic Studies Reveal That Toll-like Receptor 2 Has a Role in Glucose-Related Metabolism in Unchallenged Zebrafish Larvae (Danio Rerio). Biology 2023, 12, 323. [CrossRef]
- Eeza, M.N.H.; Bashirova, N.; Zuberi, Z.; Matysik, J.; Berry, J.P.; Alia, A. An Integrated Systems-Level Model of Ochratoxin A Toxicity in the Zebrafish (Danio Rerio) Embryo Based on NMR Metabolic Profiling. Sci Rep 2022, 12, 6341. [CrossRef]
- Berry, J.P.; Roy, U.; Jaja-Chimedza, A.; Sanchez, K.; Matysik, J.; Alia, A. High-Resolution Magic Angle Spinning Nuclear Magnetic Resonance of Intact Zebrafish Embryos Detects Metabolic Changes Following Exposure to Teratogenic Polymethoxyalkenes from Algae. Zebrafish 2016, 13, 456–465. [CrossRef]
- Howe, K.; Clark, M.D.; Torroja, C.F.; Torrance, J.; Berthelot, C.; Muffato, M.; Collins, J.E.; Humphray, S.; McLaren, K.; Matthews, L.; et al. The Zebrafish Reference Genome Sequence and Its Relationship to the Human Genome. Nature 2013, 496, 498–503. [CrossRef]
- Saleem, S.; Kannan, R.R. Zebrafish: An Emerging Real-Time Model System to Study Alzheimer’s Disease and Neurospecific Drug Discovery. Cell Death Discov. 2018, 4, 45. [CrossRef]
- Basheer, F.; Dhar, P.; Samarasinghe, R.M. Zebrafish Models of Paediatric Brain Tumours. IJMS 2022, 23, 9920. [CrossRef]
- Doyle, J.M.; Croll, R.P. A Critical Review of Zebrafish Models of Parkinson’s Disease. Front. Pharmacol. 2022, 13, 835827. [CrossRef]
- D’Amora, M.; Galgani, A.; Marchese, M.; Tantussi, F.; Faraguna, U.; De Angelis, F.; Giorgi, F.S. Zebrafish as an Innovative Tool for Epilepsy Modeling: State of the Art and Potential Future Directions. IJMS 2023, 24, 7702. [CrossRef]
- Fontana, B.D.; Mezzomo, N.J.; Kalueff, A.V.; Rosemberg, D.B. The Developing Utility of Zebrafish Models of Neurological and Neuropsychiatric Disorders: A Critical Review. Experimental Neurology 2018, 299, 157–171. [CrossRef]
- Kabli, S.; Spaink, H.P.; De Groot, H.J.M.; Alia, A. In Vivo Metabolite Profile of Adult Zebrafish Brain Obtained by High-resolution Localized Magnetic Resonance Spectroscopy. Magnetic Resonance Imaging 2009, 29, 275–281. [CrossRef]
- Singer, R.; Oganezova, I.; Hu, W.; Ding, Y.; Papaioannou, A.; De Groot, H.J.M.; Spaink, H.P.; Alia, A. Unveiling the Exquisite Microstructural Details in Zebrafish Brain Non-Invasively Using Magnetic Resonance Imaging at 28.2 T. Molecules 2024, 29, 4637. [CrossRef]
- Ullmann, J.F.P.; Calamante, F.; Collin, S.P.; Reutens, D.C.; Kurniawan, N.D. Enhanced Characterization of the Zebrafish Brain as Revealed by Super-Resolution Track-Density Imaging. Brain Struct Funct 2015, 220, 457–468. [CrossRef]
- Soila, K.P.; Viamonte, M.; Starewicz, P.M. Chemical Shift Misregistration Effect in Magnetic Resonance Imaging. Radiology 1984, 153, 819–820. [CrossRef]
- Lufkin, R.; Anselmo, M.; Crues, J.; Smoker, W.; Hanafee, W. Magnetic Field Strength Dependence of Chemical Shift Artifacts. Computerized Medical Imaging and Graphics 1988, 12, 89–96. [CrossRef]
- Hidalgo-Tobon, S.S. Theory of Gradient Coil Design Methods for Magnetic Resonance Imaging. Concepts Magnetic Resonance 2010, 36A, 223–242. [CrossRef]
- Krug, J.R.; Van Schadewijk, R.; Vergeldt, F.J.; Webb, A.G.; De Groot, H.J.M.; Alia, A.; Van As, H.; Velders, A.H. Assessing Spatial Resolution, Acquisition Time and Signal-to-Noise Ratio for Commercial Microimaging Systems at 14.1, 17.6 and 22.3 T. Journal of Magnetic Resonance 2020, 316, 106770. [CrossRef]
- Kreis, R. Issues of Spectral Quality in Clinical1 H-magnetic Resonance Spectroscopy and a Gallery of Artifacts. NMR in Biomedicine 2004, 17, 361–381. [CrossRef]
- Redpath, T.W.; Wiggins, C.J. Estimating Achievable Signal-to-Noise Ratios of MRI Transmit-Receive Coils from Radiofrequency Power Measurements: Applications in Quality Control. Phys. Med. Biol. 2000, 45, 217–227. [CrossRef]
- Dumoulin, M.; Zimmerman, E.; Hurd, R.; Hancu, I. Increased Brain Metabolite T2 Relaxation Times in Patients with Alzheimer’s Disease.
- De Graaf, R.A.; Brown, P.B.; McIntyre, S.; Nixon, T.W.; Behar, K.L.; Rothman, D.L. High Magnetic Field Water and Metabolite Proton T1 and T2 Relaxation in Rat Brain in Vivo. Magnetic Resonance in Med 2006, 56, 386–394. [CrossRef]
- Murali-Manohar, S.; Borbath, T.; Wright, A.M.; Soher, B.; Mekle, R.; Henning, A. T2 Relaxation Times of Macromolecules and Metabolites in the Human Brain at 9.4 T. Magnetic Resonance in Medicine 2020, 84, 542–558. [CrossRef]
- Deelchand, D.K.; Auerbach, E.J.; Kobayashi, N.; Marjańska, M. Transverse Relaxation Time Constants of the Five Major Metabolites in Human Brain Measured in Vivo Using LASER and PRESS at 3 T. Magn Reson Med 2018, 79, 1260–1265. [CrossRef]
- Bloembergen, N.; Purcell, E.M.; Pound, R.V. Relaxation Effects in Nuclear Magnetic Resonance Absorption. Phys. Rev. 1948, 73, 679–712. [CrossRef]
- Li, Y. T1 and T2 Metabolite Relaxation Times in Normal Brain at 3T and 7T. J Mol Imag Dynamic 2013, 02. [CrossRef]
- Michaeli, S.; Garwood, M.; Zhu, X.-H.; DelaBarre, L.; Andersen, P.; Adriany, G.; Merkle, H.; Ugurbil, K.; Chen, W. Proton T2 Relaxation Study of Water, N-Acetylaspartate, and Creatine in Human Brain Using Hahn and Carr-Purcell Spin Echoes at 4T and 7T. Magnetic Resonance in Medicine 2002, 47, 629–633. [CrossRef]
- Jiru, F.; Skoch, A.; Wagnerova, D.; Dezortova, M.; Viskova, J.; Profant, O.; Syka, J.; Hajek, M. The Age Dependence of T2 Relaxation Times of N-Acetyl Aspartate, Creatine and Choline in the Human Brain at 3 and 4T. NMR in Biomedicine 2016, 29, 284–292. [CrossRef]
- Xin, L.; Gambarota, G.; Cudalbu, C.; Mlynárik, V.; Gruetter, R. Single Spin-Echo T2 Relaxation Times of Cerebral Metabolites at 14.1 T in the in Vivo Rat Brain. Magn Reson Mater Phy 2013, 26, 549–554. [CrossRef]
- Isobe, T.; Matsumura, A.; Anno, I.; Kawamura, H.; Muraishi, H.; Umeda, T.; Nose, T. Effect of J Coupling and T2 Relaxation in Assessing of Methyl Lactate Signal Using PRESS Sequence MR Spectroscopy. Igaku Butsuri 2005, 25, 68–74.
- Xin, L.; Gambarota, G.; Mlynárik, V.; Gruetter, R. Proton T2 Relaxation Time of J -coupled Cerebral Metabolites in Rat Brain at 9.4 T. NMR in Biomedicine 2008, 21, 396–401. [CrossRef]
- Mulkern, R.; Bowers, J. Density Matrix Calculations of AB Spectra from Multipulse Sequences: Quantum Mechanics Meets In Vivo Spectroscopy. Concepts Magn. Reson. 1994, 6, 1–23. [CrossRef]
- Bottomley, P.A.; Foster, T.H.; Argersinger, R.E.; Pfeifer, L.M. A Review of Normal Tissue Hydrogen NMR Relaxation Times and Relaxation Mechanisms from 1–100 MHz: Dependence on Tissue Type, NMR Frequency, Temperature, Species, Excision, and Age. Medical Physics 1984, 11, 425–448. [CrossRef]
- De Graaf, R.A.; Brown, P.B.; McIntyre, S.; Nixon, T.W.; Behar, K.L.; Rothman, D.L. High Magnetic Field Water and Metabolite Proton T1 and T2 Relaxation in Rat Brain in Vivo. Magnetic Resonance in Med 2006, 56, 386–394. [CrossRef]
- Korb, J.; Bryant, R.G. Magnetic Field Dependence of Proton Spin-lattice Relaxation Times. Magnetic Resonance in Med 2002, 48, 21–26. [CrossRef]
- Öz, G.; Deelchand, D.K.; Wijnen, J.P.; Mlynárik, V.; Xin, L.; Mekle, R.; Noeske, R.; Scheenen, T.W.J.; Tkáč, I.; Mrs, the E.W.G. on A.S.V. 1H Advanced Single Voxel 1H Magnetic Resonance Spectroscopy Techniques in Humans: Experts’ Consensus Recommendations. NMR in Biomedicine 2021, 34, e4236. [CrossRef]
- Xin, L.; Tkáč, I. A Practical Guide to in Vivo Proton Magnetic Resonance Spectroscopy at High Magnetic Fields. Analytical Biochemistry 2017, 529, 30–39. [CrossRef]
- Govindaraju, V.; Young, K.; Maudsley, A.A. Proton NMR Chemical Shifts and Coupling Constants for Brain Metabolites. NMR Biomed 2000, 13, 129–153. [CrossRef]
- Lodder-Gadaczek, J.; Becker, I.; Gieselmann, V.; Wang-Eckhardt, L.; Eckhardt, M. N-Acetylaspartylglutamate Synthetase II Synthesizes N-Acetylaspartylglutamylglutamate. J Biol Chem 2011, 286, 16693–16706. [CrossRef]
- Berger, U.V.; Luthi-Carter, R.; Passani, L.A.; Elkabes, S.; Black, I.; Konradi, C.; Coyle, J.T. Glutamate carboxypeptidase II is expressed by astrocytes in the adult rat nervous system. Journal of Comparative Neurology 1999, 415, 52–64. [CrossRef]
- Tsai, G.; Stauch-Slusher, B.; Sim, L.; Hedreen, J.C.; Rothstein, J.D.; Kuncl, R.; Coyle, J.T. Reductions in Acidic Amino Acids andN-Acetylaspartylglutamate in Amyotrophic Lateral Sclerosis CNS. Brain Research 1991, 556, 151–156. [CrossRef]
- Tsai, G. Abnormal Excitatory Neurotransmitter Metabolism in Schizophrenic Brains. Arch Gen Psychiatry 1995, 52, 829. [CrossRef]
- Reischauer, C.; Gutzeit, A.; Neuwirth, C.; Fuchs, A.; Sartoretti-Schefer, S.; Weber, M.; Czell, D. In-Vivo Evaluation of Neuronal and Glial Changes in Amyotrophic Lateral Sclerosis with Diffusion Tensor Spectroscopy. NeuroImage: Clinical 2018, 20, 993–1000. [CrossRef]
- Provencher, S.W. Estimation of Metabolite Concentrations from Localized in Vivo Proton NMR Spectra. Magnetic Resonance in Med 1993, 30, 672–679. [CrossRef]
- Edden, R.A.E.; Pomper, M.G.; Barker, P.B. In Vivo Differentiation of N-acetyl Aspartyl Glutamate from N-acetyl Aspartate at 3 Tesla. Magnetic Resonance in Med 2007, 57, 977–982. [CrossRef]
- Braakman, N.; Oerther, T.; De Groot, H.J.M.; Alia, A. High Resolution Localized Two-dimensional MR Spectroscopy in Mouse Brain in Vivo. Magnetic Resonance in Med 2008, 60, 449–456. [CrossRef]
- Verma, R.; Raj Choudhary, P.; Kumar Nirmal, N.; Syed, F.; Verma, R. Neurotransmitter Systems in Zebrafish Model as a Target for Neurobehavioural Studies. Materials Today: Proceedings 2022, 69, 1565–1580. [CrossRef]
- Kim, Y.S.; Yoon, B.-E. Altered GABAergic Signaling in Brain Disease at Various Stages of Life. Exp Neurobiol 2017, 26, 122–131. [CrossRef]
- Puts, N.A.J.; Edden, R.A.E. In Vivo Magnetic Resonance Spectroscopy of GABA: A Methodological Review. Progress in Nuclear Magnetic Resonance Spectroscopy 2012, 60, 29–41. [CrossRef]
- Lanz, B.; Abaei, A.; Braissant, O.; Choi, I.-Y.; Cudalbu, C.; Henry, P.-G.; Gruetter, R.; Kara, F.; Kantarci, K.; Lee, P.; et al. Magnetic Resonance Spectroscopy in the Rodent Brain: Experts’ Consensus Recommendations. NMR Biomed 2020, e4325. [CrossRef]
- Satou, C.; Kimura, Y.; Hirata, H.; Suster, M.L.; Kawakami, K.; Higashijima, S. Transgenic Tools to Characterize Neuronal Properties of Discrete Populations of Zebrafish Neurons. Development 2013, 140, 3927–3931. [CrossRef]
- Tabor, K.M.; Marquart, G.D.; Hurt, C.; Smith, T.S.; Geoca, A.K.; Bhandiwad, A.A.; Subedi, A.; Sinclair, J.L.; Rose, H.M.; Polys, N.F.; et al. Brain-Wide Cellular Resolution Imaging of Cre Transgenic Zebrafish Lines for Functional Circuit-Mapping. eLife 2019, 8, e42687. [CrossRef]
- He, J.; Ding, Y.; Nowik, N.; Jager, C.; Eeza, M.N.H.; Alia, A.; Baelde, H.J.; Spaink, H.P. Leptin Deficiency Affects Glucose Homeostasis and Results in Adiposity in Zebrafish. Journal of Endocrinology 2021, 249, 125–134. [CrossRef]
- Bottomley, P.A. Selective Volume Method for Performing Localized NMR Spectroscopy 1984.
- Tkac, I.; Starcuk, Z.; Choi, I.-Y.; Gruetter, R. In Vivo 1H NMR Spectroscopy of Rat Brain at 1 Ms Echo Time. Magn. Reson. Med. 1999, 41, 649–656. [CrossRef]
- Akhtar, M.T.; Mushtaq, M.Y.; Verpoorte, R.; Richardson, M.K.; Choi, Y.H. Zebrafish as a Model for Systems Medicine R&D: Rethinking the Metabolic Effects of Carrier Solvents and Culture Buffers Determined by1 H NMR Metabolomics. OMICS: A Journal of Integrative Biology 2016, 20, 42–52. [CrossRef]
- Markley, J.L.; Anderson, M.E.; Cui, Q.; Eghbalnia, H.R.; Lewis, I.A.; Hegeman, A.D.; Li, J.; Schulte, C.F.; Sussman, M.R.; Westler, W.M.; et al. New Bioinformatics Resources for Metabolomics. Pac Symp Biocomput 2007, 157–168.
- De Graaf, R.A. In Vivo NMR Spectroscopy: Principles and Techniques; 1st ed.; Wiley, 2007; ISBN 978-0-470-02670-0.
Figure 5.
Comparison of cerebral metabolites levels in the forebrain, midbrain, and hindbrain of adult zebrafish at 28.2 T. [A] Anatomical RARE image, coronal slice, of zebrafish brain regions to indicate position of selected PRESS voxels in the forebrain, midbrain, and hindbrain [B] Single voxel localized 1H MRS spectra obtained from the forebrain, midbrain, and hindbrain. [C] Cerebral metabolite levels relative to tCr signal at δ = 3.03 ppm, n = 3. Yellow labels correspond to the forebrain, green to the midbrain, and red to the hindbrain.
Disclaimer/Publisher’s Note: The statements, opinions and data contained in all publications are solely those of the individual author(s) and contributor(s) and not of MDPI and/or the editor(s). MDPI and/or the editor(s) disclaim responsibility for any injury to people or property resulting from any ideas, methods, instructions or products referred to in the content. |
© 2025 by the authors. Licensee MDPI, Basel, Switzerland. This article is an open access article distributed under the terms and conditions of the Creative Commons Attribution (CC BY) license (http://creativecommons.org/licenses/by/4.0/).
Copyright: This open access article is published under a Creative Commons CC BY 4.0 license, which permit the free download, distribution, and reuse, provided that the author and preprint are cited in any reuse.


