Submitted:
23 August 2025
Posted:
25 August 2025
You are already at the latest version
Abstract
Background/Objectives: The Adaptive Control Hypothesis suggests different language contexts require varying control demands. While bilinguals navigate one dual-language context, trilinguals manage three distinct contexts (L1-L2, L2-L3, L1-L3). This study examined whether these contexts impose differential control demands in trilingual comprehension, investigating proactive and reactive control mechanisms. Methods:Thirty-six Uyghur-Chinese-English trilinguals completed an auditory word-picture matching task across three dual-language contexts during EEG recording. We employed behavioral analysis, drift-diffusion modeling, event-related potential (ERP) analysis, and multivariate pattern analysis (MVPA) to examine comprehension efficiency, evidence accumulation, and neural mechanisms. The design crossed context (L1-L2, L2-L3, L1-L3) with trial type (switch vs. repetition) and switching direction (to dominant vs. non-dominant language). Results: Despite comparable behavioral performance, drift-diffusion modeling revealed distinct processing profiles across contexts, with the L1-L2 context showing the lowest comprehension efficiency due to slower evidence accumulation compensated by response bias adjustments. ERP analysis demonstrated context-specific neural signatures: N400 amplitudes revealed the strongest semantic competition in the L1-L2 context. Proactive control varied significantly across contexts, with language dominance reversal occurring exclusively in the L1-L3 context. Notably, no reactive control (switch costs) was observed across any dual-language context. MVPA successfully classified contexts and switching directions, revealing distinct spatiotemporal neural patterns. Conclusions: Trilingual language comprehension efficiency varies systematically across dual-language contexts due to differential proactive control demands rather than reactive control mechanisms. L2-L3 and L1-L3 contexts demonstrated higher efficiency than L1-L2 context, supporting a nuanced, context-dependent model of multilingual language control with important implications for theories of cognitive control in multilingual populations.
Keywords:
trilingualism
; dual-language contexts
; event-related potentials
; drift-diffusion modeling
; language comprehension
1. Introduction
Approximately 43% of the world’s population is bilingual, while 17% are multilingual [1]. This linguistic diversity creates unique cognitive challenges, as bilinguals automatically activate non-target languages when processing target languages—for instance, L1 remains active during L2 processing even when tasks explicitly require L2-only use [2]. This parallel activation extends to trilinguals [3,4], creating cross-language interference that necessitates sophisticated control mechanisms.
The theoretical understanding of multilingual language control has predominantly focused on production processes, where substantial evidence supports robust control mechanisms [5]. However, comprehension control mechanisms remain poorly understood, with emerging evidence suggesting fundamental differences between production and comprehension modalities [6,7]. Recent trilingual studies indicate that production and comprehension involve distinct language control mechanisms [8], challenging the assumption that similar processes underlie both modalities.
Language control involves two primary mechanisms: reactive control, which responds to detected cross-linguistic conflict, and proactive control, which prepares cognitive resources to prevent conflict before it occurs [5]. The Bilingual Interactive Activation (BIA) model proposes that reactive control begins when word representations activate language nodes, subsequently suppressing non-target languages [9]. The BIA+ model extends this framework by suggesting post-lexical executive control processes manage cross-linguistic interference [10]. While these models effectively account for bilingual processing, their application to trilingual comprehension remains theoretically and empirically underexplored.
Empirical evidence for comprehension control mechanisms presents a complex pattern. Unlike production studies that consistently demonstrate language switch costs, comprehension studies show mixed results. Some investigations report no significant switch costs [11], while others find facilitation effects rather than costs [12]. This inconsistency extends to proactive control mechanisms: while production studies demonstrate robust language dominance reversal effects (where dominant languages show processing costs), comprehension studies typically fail to observe such effects [13,14]. However, these mixed findings may reflect methodological limitations rather than the absence of control mechanisms per se.
Trilingual research has employed n-2 language repetition costs as indicators of reactive control, providing more reliable evidence than asymmetrical switch costs observed in bilingual studies [15]. Yet comprehension studies continue to show inconsistent patterns. Declerck and Philipp [16] observed n-2 costs only for the weakest language, while Wu, Cai, et al. [8] found no significant n-2 or switch costs in Cantonese-Mandarin-English trilinguals. These discrepancies highlight the need for comprehensive investigations using multiple analytical approaches to clarify the nature of trilingual comprehension control.
The Adaptive Control Hypothesis provides a framework for understanding these complexities by categorizing language contexts based on cognitive control demands [17]. While bilinguals operate within a single dual-language context (L1-L2), trilinguals navigate three distinct dual-language contexts: L1-L2, L2-L3, and L1-L3. Each context may impose different control demands due to varying proficiency levels, acquisition patterns, and usage frequencies. Blanco-Elorrieta and Pylkkänen [18] demonstrated that different language contexts recruit distinct neural mechanisms during specific temporal windows, suggesting that the cognitive architecture of language control adapts dynamically to contextual demands.
Furthermore, medium-of-instruction relationships—where L2 serves as the instructional language for L3 learning—may fundamentally alter trilingual control mechanisms. When L2 serves as the bridge for L3 acquisition, cooperative rather than competitive connections may develop between these languages [3]. However, research by Chen and Liu [19] suggests that orthographic similarity between languages may exert stronger influences on trilingual control than instructional relationships. This indicates that multiple factors contribute to the complexity of trilingual language processing.
Present Study
This investigation addresses three critical gaps in trilingual comprehension research. First, we examine whether comprehension efficiency varies systematically across the three dual-language contexts (L1-L2, L2-L3, L1-L3) that trilinguals encounter. The Adaptive Control Hypothesis predicts differential control demands across these contexts, which should manifest in distinct behavioral, neural, and computational signatures. We employ reaction time analysis, drift-diffusion modeling, event-related potential (ERP) analysis, and multivariate pattern analysis (MVPA) to provide converging evidence for context-specific processing mechanisms.
Second, we investigate whether observed efficiency differences reflect varying proactive control demands. Unlike previous studies that found absent proactive control effects in comprehension, we hypothesize that context-specific demands may reveal previously undetected proactive mechanisms. Specifically, we examine language dominance reversal effects across different dual-language contexts, predicting that proficiency relationships and medium-of-instruction factors will modulate proactive control differentially in L1-L2, L2-L3, and L1-L3 contexts.
Third, we determine whether reactive control mechanisms operate uniformly across dual-language contexts or show context-specific patterns. While recent evidence suggests minimal reactive control in trilingual comprehension [8], the possibility remains that specific language combinations or proficiency configurations may engage reactive mechanisms. We examine switch costs across all three contexts using both behavioral and neurophysiological measures.
We test these questions among Uyghur-Chinese-English trilinguals using an auditory word-picture matching paradigm. This population provides an ideal model because participants show comparable L1-L2 proficiency but lower L3 proficiency, and L2 serves as the medium of instruction for L3. We predict that: (1) comprehension efficiency will vary across dual-language contexts due to differential control demands; (2) proactive control will manifest differently across contexts, with language dominance reversal occurring specifically in L1-L3 contexts where proficiency differences are greatest; and (3) reactive control effects will be minimal across all contexts, consistent with the emerging view that comprehension relies primarily on proactive rather than reactive control mechanisms.
This multi-method approach addresses previous methodological limitations by combining behavioral measures with computational modeling and high-temporal-resolution neurophysiological recordings. This approach provides unprecedented insight into the dynamic cognitive mechanisms underlying trilingual language comprehension across diverse linguistic contexts.
2. Materials and Methods
2.1. Participants
Thirty-six right-handed undergraduates (18–23 years; M = 20.10, SD = 1.46) took part for monetary compensation. Inclusion criteria were no acquisition of a fourth language, no immigration background, and normal or corrected-to-normal vision. The study was approved by the South China Normal University IRB (IORG NO.0011738; Approval Code: SCNU-PSY-2022-112; December 13, 2022). All participants provided written informed consent.
Power Analysis
Following Brysbaert [29], we set the minimum meaningful effect for the context main effect at Cohen’s f = 0.20 (α = .05, power = .80, assumed within-subject correlation = .50) for a design with 12 within-subject conditions. A priori power analysis in G*Power 3.1 [30] indicated a required sample of 24; we recruited 36 to ensure adequate power.
Language Background and Self-Reported Proficiency
Participants completed the Language and Social Background Questionnaire (LSBQ; [31]), rating proficiency in Uyghur (L1), Chinese (L2), and English (L3) across four domains on 10-point scales and usage frequency on 5-point scales (see Table 1).
Age of acquisition differed across languages, F(2, 70) = 74, p < .001, η2 = .766: Uyghur was acquired earliest (M = 0.68 years), followed by Chinese (M = 5.70) and English (M = 11.87). Post hoc tests showed all pairwise differences were significant (all ps < .001; Cohen’s ds > 1.85).
Languages also differed in exposure duration, F(2, 70) = 76, p < .001, η2 = .570, and in current usage, F(2, 70) = 112, p < .001, η2 = .681, confirming the proficiency/experience hierarchy L1 (Uyghur) > L2 (Chinese) > L3 (English).
The LSBQ separates Home Use (family/domestic) from Social Use (community). Home Use differed by language, F(2, 70) = 53.60, p < .001, η2 = .505, with Uyghur highest, then Chinese, then English. For Social Use, F(2, 70) = 98.10, p < .001, η2 = .651, Chinese exceeded Uyghur (p < .001, Cohen’s d = 3.062), while English did not differ significantly from Uyghur. This pattern reflects Chinese as the national common language and Uyghur as the heritage language.
Objective Proficiency Verification
Because self-ratings can vary across cultures [32], we administered the Multilingual Naming Test (MINT; [33]), a standardized 68-item picture-naming measure. MINT scores differed by language, F(2, 70) = 287, p < .001, η2 = .845: Uyghur and Chinese did not differ (p = .942, d = 0.077), whereas English scores were significantly lower than both (all ps < .001; ds > 4.85), corroborating the pattern L1 ≈ L2 > L3.
2.2. Materials and Procedure
Forty-eight pictures were drawn from the International Picture Naming Project [34] with corresponding words in Uyghur (L1), Chinese (L2), and English (L3). Morphologically complex and compound words were excluded. Twenty-five trilingual validators (non-participants) rated vocabulary familiarity and picture–word matching on 7-point scales. Ratings were high and did not differ by language for familiarity, F(2, 428) = 1.73, p = .181; matching accuracy, F(2, 428) = 0.39, p = .677; or syllable count, F(2, 428) = 3.04, p = .062.
The experiment comprised three dual-language contexts (L1–L2, L2–L3, L1–L3), each using the same auditory word–picture matching task. Crossing context (3) with trial type (4)—switch to non-dominant, switch to dominant, non-dominant repetition, dominant repetition—yielded 12 within-subject conditions, with 30 trials per condition.
Auditory stimuli were recorded by three trilingual speakers and assigned according to a Latin square to control for speaker effects. Recordings were amplitude-normalized to 70 dB in Praat (mean duration = 574 ± 164 ms).
Experimental Design
The task was presented in three counterbalanced blocks corresponding to the three contexts, using E-Prime 3.0. Each trial began with a fixation cross (500 ms), followed by an auditory word on a blank screen. After word offset, the blank screen continued for 600–900 ms, then a picture appeared for 2000 ms. Participants made match/mismatch judgments; response-key mapping was counterbalanced across participants (see Figure 1).
2.3. Data Acquisition and Preprocessing
EEG Recording
EEG was recorded from 32 Ag/AgCl electrodes (extended 10–20 system), sampled at 1 kHz, online-referenced to the left mastoid, and band-pass filtered 0.05–100 Hz. Electrode impedances were kept below 5 kΩ.
Preprocessing
Analyses were conducted in MATLAB R2020a with EEGLAB [35]. Incorrect responses and filler trials (5.75%) were removed; filler trials were the first trial of each block and were not counted as switch or repetition. Signals were low-pass filtered at 30 Hz and re-referenced to the bilateral mastoids. Continuous data were epoched from −200 to 1000 ms relative to auditory word onset with baseline correction (−200 to 0 ms). Epochs exceeding ±80 μV were rejected. Ocular artifacts were removed using Independent Component Analysis.
2.4. Data Analyses
2.4.1. Behavioral Analysis
Incorrect responses and trials with reaction times exceeding ±2.5 standard deviations were excluded. Switch costs were calculated as RTswitch - RTrepetition. Linear mixed-effects models were fitted using R [36] with the same 2 (trial type: switch, repetition) × 2 (switching direction: switch to dominant language, switch to non-dominant language) × 3 (context: L1-L2, L2-L3, L1-L3) within-subjects design as described above. The final model included fixed effects for trial type, switching direction, context, and their interactions, with participant and item random intercepts.
2.4.2. Event-Related Potential (ERP) Analysis
We analyzed event-related potentials (ERPs) from −200 to +1000 ms relative to auditory word onset. Statistical models tested the main effects of trial type, switch direction, and context, along with all two- and three-way interactions, using the same 2 × 2 × 3 within-subjects design as in the behavioral analyses.
Analyses focused on two regions of interest based on prior language-switching work: frontal electrodes (FCz, Fz) and central–parietal electrodes (Cz, CPz, Pz). We examined five components commonly implicated in language processing and switching: (i) P200 (150-200 ms), an early auditory response linked to attention and perceptual processing at the phonological—rather than lexical—level [20]; (ii) N200 (200–300 ms), associated with conflict monitoring and often linked to anterior cingulate and medial prefrontal activity [37]; (iii) P300 (300-400 ms), indexing allocation of attentional resources, typically maximal over parietal and temporoparietal regions [38]; (iv) N400 (400-500 ms), sensitive to semantic processing and commonly observed over temporal sites, particularly the left middle temporal gyrus [39]; and (v) the late positive complex (LPC; 500-800 ms), reflecting late reanalysis and control processes—specifically, reconfiguring stimulus–response mappings to regain access to previously inhibited lexical representations—with generators often reported in parietal and medial prefrontal regions [40].
For each condition, we evaluated raw waveforms and condition-difference waves against baseline using two-tailed t-tests at each time point. To control for multiple comparisons, we applied cluster-based permutation testing with 1,000 iterations.
2.4.3. Multivariate Pattern Analysis (MVPA)
MVPA used the Amsterdam Decoding and Modeling toolbox (ADAM; [41]) with linear discriminant analysis to decode condition information from −200 to 1000 ms. Performance was estimated using area under the receiver operating characteristic curve (AUC) with 10-fold cross-validation run separately for main effects of context, trial type, and switching direction. Significance was assessed via cluster-based permutation tests (p < .05). To interpret classifier weights, activation patterns were derived using the Haufe transform [42] and z-scored across electrodes per participant to compare spatial distributions across conditions. Temporal generalization [43] trained classifiers at each time point and tested them at all other time points to assess the stability of neural codes; cross-validation folds were kept independent of temporal generalization.
2.4.4. Drift-Diffusion Model (DDM) Analysis
Drift-diffusion models were fitted using the Dynamic Models of Choice (DMC) package [44] in R, estimating five parameters: drift rate for word-picture match responses (d.s1), drift rate for word-picture mismatch responses (d.s2), boundary separation (a), starting point (z), and non-decision time (Ter), where separate drift rates for match and mismatch responses were used to isolate response switching effects (changes in response keys across consecutive trials) from language switching effects (changes in stimulus language across consecutive trials). Factors were context (L1–L2 vs. L2–L3 vs. L1–L3), switching direction (to dominant vs. to non-dominant), and trial type (switch vs. repetition).
A hierarchical Bayesian model was estimated via differential-evolution MCMC [45] with weak, truncated-normal priors drawn from literature [46] and held equal across conditions. Initial sampling used 250 chains per participant; hierarchical sampling then proceeded with 5% crossover probability, applied after burn-in. Convergence required Gelman–Rubin statistics < 1.10 [47], after which 1000 additional samples per chain were retained. Posterior predictive checks (CDF comparisons) indicated good fit. Parameter-recovery simulations showed excellent accuracy for all parameters across participants and conditions (all r > .90, ps < .001), and visual inspection confirmed adequate chain mixing.
2.4.5. Multiple Regression Linking ERPs and DDM
To test whether ERP amplitudes predict DDM parameters, five linear regressions (using MATLAB’s fitlm function) were run—one per DDM parameter—as outcomes, with LPC, N200, N400 amplitudes and context as predictors. Interactions (Context × N200; Context × N400) tested context-specific relations. Assumptions were checked via residual diagnostics: Pearson residuals vs. fits/predictors (homoscedasticity, linearity), normal probability plots (normality), Durbin–Watson tests (~2.0; independence), and variance inflation factors (all VIF < 5). Influential points were screened using leverage > 3×(k+1)/n and Cook’s D > 1; no cases exceeded thresholds. p-values were adjusted with the Bonferroni–Holm procedure. Adjusted response and interaction plots visualized effects while holding other predictors at their fitted values.
3. Results
3.1. Results of Reaction Time Data
As shown in Table 2 and Figure 2, mixed-effects model analysis revealed the following patterns. For switching direction, a significant main effect emerged, t = 3.724, p < .001, Cohen’s d = 0.309, with faster reaction times when switching to dominant languages (M = 1558 ms) compared to non-dominant languages (M = 1573 ms). For context, no significant main effect was observed, with comparable reaction times across L1-L2 (M = 1563 ms), L1-L3 (M = 1569 ms), and L2-L3 (M = 1565 ms) contexts (all pairwise comparisons p > .149). While these differences may appear small, they align with recent findings in the field. Language control effects in comprehension are more subtle than in production. Therefore, sophisticated analytical approaches are required to detect these effects.
For trial type, no significant main effect emerged between switch (M = 1563 ms) and repetition (M = 1569 ms) trials, t = 1.89, p = .059, Cohen’s d = 0.051. Regarding the switching direction × context interaction, it was not significant overall, though context-specific patterns emerged. In the L2-L3 context, switching to non-dominant languages produced significantly slower responses (M = 1575 ms) than switching to dominant languages (M = 1555 ms), t = 3.027, p = .042, Cohen’s d = 0.337. No significant differences were observed in L1-L2 (p = .378) or L1-L3 (p = .097) contexts.
For the switching direction × trial type interaction, no significant interaction emerged. Switch costs were comparable between dominant language conditions (switch: M = 1562 ms; repetition: M = 1554 ms, p = .065) and non-dominant language conditions (switch: M = 1575 ms; repetition: M = 1571 ms, p = .396).
For the context × trial type interaction, no significant interaction was found, with comparable switch costs across L1-L2 (3 ms, p = .533), L1-L3 (1 ms, p = .874), and L2-L3 (14 ms, p = .182) contexts.
Finally, the switching direction × context × trial type interaction was not significant. Switch costs for dominant versus non-dominant language conditions showed no significant differences within any context: L1-L2 (2 ms vs. 5 ms, p = .730), L2-L3 (19 ms vs. 8 ms, p = .300), and L1-L3 (4 ms vs. -2 ms, p = .633).
Critically, the absence of large behavioral differences does not indicate absence of control mechanisms. Instead, it suggests that trilingual comprehension relies on efficient, automatized control processes that operate below the threshold of gross behavioral detection but can be revealed through computational decomposition of the decision process.
3.2. Results of Accuracy Data
As shown in Table 3 and Figure 3, logistic mixed-effects model analysis revealed no significant main effects or interactions for accuracy data. For trial type, no significant main effect emerged between switch (M = 0.974) and repetition (M = 0.974) trials, z = -0.014, p = .989, Cohen’s d = 0.011. For switching direction, no significant main effect was observed between switching to dominant (M = 0.976) versus non-dominant (M = 0.971) languages, z = 0.979, p = .327, Cohen’s d = 0.035. For context, no significant main effect was found across contexts, with comparable accuracy in L1-L2 (M = 0.970), L1-L3 (M = 0.976), and L2-L3 (M = 0.974) contexts (all pairwise comparisons p > .391). The trial type × switching direction interaction was not significant, with accuracy being comparable between switching directions in both switch trials (dominant: M = 0.976; non-dominant: M = 0.971, p = .808) and repetition trials (dominant: M = 0.976; non-dominant: M = 0.972, p = .875). Similarly, the trial type × switching direction × context interaction was not significant. Switch costs (calculated as accuracy differences) for dominant versus non-dominant language conditions showed no significant differences within any context: L1-L2 (-0.45% vs. -0.13%, p = .407), L2-L3 (0.003% vs. 0.19%, p = .648), and L1-L3 (0.50% vs. -0.10%, p = .153). Accuracy performance remained consistently high across all experimental conditions (range: 0.959-0.983).
3.3. Drift Diffusion Model Results
To examine the underlying cognitive processes in trilingual language switching, we analyzed five key diffusion model parameters using linear mixed-effects models with context type, switching direction, and trial type as fixed effects and participant intercepts as random effects.
3.3.1. Drift Rate Analysis for Match Responses (d.s1)
The drift rate analysis examined the speed of evidence accumulation for stimuli requiring match responses, providing a direct measure of comprehension efficiency uncontaminated by speed-accuracy trade-offs or response preparation processes.
Context effects on evidence accumulation revealed the core finding of this study. As illustrated in Figure 4, the mixed linear model revealed a significant effect on d.s1 Participants demonstrated significantly slower processing speed in the L1-L2 bilingual context (M = 3.17) compared to the L1-L3 bilingual context (M = 4.21, t = -2.48, p = .043, Cohen’s d = -0.541). This reduction in drift rate represents a substantial processing cost that was completely masked in the behavioral data by compensatory adjustments in other decision parameters. The theoretical significance of this finding cannot be overstated. In the L1-L2 context, despite both languages being highly proficient, the simultaneous high-level activation of two dominant language systems creates a “processing bottleneck” where evidence accumulation becomes sluggish due to intense cross-linguistic competition. This does not support the prediction from the Bilingual Interactive Activation model that balanced bilingual activation decreases processing demands. Instead, our findings suggest that balanced activation paradoxically increases processing costs.One possible explanation for this counterintuitive finding is that the L1-L2 context may lack proactive control mechanisms, thereby reducing language comprehension efficiency. When two languages are equally dominant and frequently co-activated, the cognitive system may fail to implement the selective attention and inhibitory control processes that are automatically engaged in more asymmetric language contexts. This absence of proactive control allows cross-linguistic interference to persist throughout the comprehension process [24], creating the observed processing bottleneck despite high proficiency in both languages.
However, no significant differences were observed between L1-L2 and L2-L3 contexts (M = 3.62, t = -1.09, p = .524, Cohen’s d = -0.238), nor between L2-L3 and L1-L3 contexts (t = 1.39, p = .355, Cohen’s d = 0.303). These findings indicate that participants exhibited the fastest processing speed for word-picture matching judgments in the L1-L3 bilingual context.
With respect to trial type, as shown in Figure 5, the mixed linear model revealed no significant main effect on d.s1 Switch trials (M = 3.55) did not differ significantly from repeat trials (M = 4.21, t = 1.42, p = .168, Cohen’s d = 0.308).
Concerning switch direction, Figure 6 demonstrates that the mixed linear model showed no significant main effect on d.s1 No significant difference was found between switching to the dominant language (M = 4.26) and switching to the non-dominant language (M = 4.13, t = -0.388, p = .701, Cohen’s d = -0.073).
3.3.2. Drift Rate Analysis for Mismatch Responses (d.s2)
The drift rate analysis for mismatch responses examined the speed of evidence accumulation for stimuli requiring rejection responses (i.e., when participants pressed the “no” key indicating word-picture mismatch).
Regarding the main effect of language context,The mixed linear model revealed a significant main effect of language context on d.s2. Participants showed significantly higher drift rates for rejection responses in the L1-L2 context (M = -3.37) compared to both L1-L3 (M = -4.22, t = 2.25, p = .040, Cohen’s d = 0.612) and L2-L3 contexts (M = -4.08, t = 2.21, p = .037, Cohen’s d = 0.540). This pattern reveals a critical asymmetry in trilingual processing. When both languages in a context are highly proficient (L1-L2), participants struggle not only to accumulate positive evidence for matches but also to efficiently reject mismatches. This “double deficit” suggests that balanced high-proficiency contexts create processing interference that affects both target detection and distractor rejection processes.The implications extend beyond language switching per se. This finding suggests that the cognitive advantage typically attributed to balanced bilingualism may come with hidden costs in specific dual-language contexts, where the absence of a clear dominance hierarchy prevents the system from efficiently biasing attention toward the target language.
No significant difference was observed between L2-L3 and L1-L3 contexts (t = -0.234, p = .970, Cohen’s d = -0.050).
With respect to trial type,The mixed linear model showed no significant main effect of trial type on d.s2. Switch trials (M = -3.76) did not differ significantly from repeat trials (M = -4.55, t = -1.76, p = .090, Cohen’s d = -0.373).
Concerning switch direction, No significant main effect of switch direction was found for d.s2. Switching to the non-dominant language (M = -4.52) did not differ significantly from switching to the dominant language (M = -4.75, t = 0.648, p = .522, Cohen’s d = 0.128).
3.3.3. Starting Point Analysis (Response Bias)
The starting point (z value) represents the bias toward one of the two response alternatives in the decision process.
Regarding the main effect of language context, the mixed linear model revealed a significant effect on the z value. Participants showed a significantly greater bias toward “yes” responses in the L1-L2 context (M = 0.857) compared to the L1-L3 context (M = 0.764, t = 3.04, p = .011, Cohen’s d = 0.756). No significant differences were observed between L1-L2 and L2-L3 contexts (M = 0.804, t = 1.49, p = .425, Cohen’s d = 0.411) or between L2-L3 and L1-L3 contexts (t = 1.49, p = .421, Cohen’s d = 0.345). These results indicate that participants were more inclined to make “yes” responses in the L1-L2 bilingual context.
With respect to trial type, no significant main effect was found for the z value. Switch trials (M = 0.035) did not differ significantly from repeat trials (M = 0.037, t = 0.648, p = .523, Cohen’s d = 0.130).
Concerning switch direction, the mixed linear model showed no significant main effect on the z value. No difference was observed between switching to the non-dominant language (M = 0.036) and switching to the dominant language (M = 0.037, t = -0.412, p = .683, Cohen’s d = 0.092).
3.3.4. Boundary Separation Analysis (Decision Threshold)
Boundary separation (a value) represents the amount of evidence required by participants to accept one of the two alternatives in the decision process.
Regarding the main effect of language context, the mixed linear model revealed a significant effect on boundary separation. Participants demonstrated significantly lower decision thresholds in the L1-L2 context (M = 0.666) compared to the L2-L3 context (M = 1.318, t = -2.194, p = .032, Cohen’s d = -0.647). No significant differences were found between L1-L2 and L1-L3 contexts (M = 1.733, t = -1.804, p = .179, Cohen’s d = -0.496) or between L2-L3 and L1-L3 contexts (t = 0.700, p = .487, Cohen’s d = 0.199).
With respect to trial type, no significant main effect was observed for the a value. Switch trials (M = 0.59) did not differ significantly from repeat trials (M = 1.37, t = 1.22, p = .232, Cohen’s d = 0.268).
Concerning switch direction, the mixed linear model showed no significant main effect on the a value. No difference was found between switching to the non-dominant language (M = 1.32) and switching to the dominant language (M = 1.39, t = -0.199, p = .843, Cohen’s d = 0.046).
3.3.5. Non-Decision Time Analysis (Motor and Encoding Processes)
Non-decision time (Ter) represents the duration of neurological processes involved in encoding sensory stimuli and executing motor responses.
Regarding the main effect of language context, the mixed linear model revealed a significant effect on Ter. Participants exhibited significantly longer non-decision times in the L1-L2 context (M = 0.361) compared to the L2-L3 context (M = 0.257, t = 3.12, p = .009, Cohen’s d = 0.677). No significant differences were observed between L1-L2 and L1-L3 contexts (M = 0.301, t = 1.79, p = .238, Cohen’s d = 0.418) or between L2-L3 and L1-L3 contexts (t = 1.30, p = .603, Cohen’s d = 0.259).
With respect to trial type, no significant main effect was found for Ter. Switch trials (M = 0.489) did not differ significantly from repeat trials (M = 0.407, t = -1.07, p = .295, Cohen’s d = 0.205).
Concerning switch direction, the mixed linear model showed no significant main effect on Ter. No difference was observed between switching to the non-dominant language (M = 0.502) and switching to the dominant language (M = 0.483, t = 0.323, p = .750, Cohen’s d = 0.060).
3.4. ERP Results
As shown in Figure 7, cluster-based permutation testing revealed significant main effects for context and switching direction, but not for trial type.
Context effects revealed the neural signature of differential control demands. L1-L2 compared to L2-L3 contexts showed significant differences from 344-552 ms after auditory word onset (p = .002), characterized by reduced P300 and enhanced N400 amplitudes in L1-L2 contexts.This pattern indicates that the L1-L2 context, despite being most practiced, paradoxically requires greater semantic conflict resolution (larger N400). Simultaneously, it allocates fewer attentional resources (smaller P300).The counterintuitive nature of this finding requires careful interpretation. The enlarged N400 in L1-L2 context does not reflect processing difficulty per se, but rather the intensity of cross-linguistic semantic competition when two highly activated language systems compete for lexical access. The reduced P300 suggests that this competition occurs automatically, requiring less conscious attentional control but creating more semantic-level interference.
L1-L2 compared to L1-L3 contexts revealed two significant time windows: 360-562 ms (p = .005) and 794-946 ms (p = .017) after auditory word onset. L1-L2 contexts elicited smaller P300, larger N400, and reduced late positive component (LPC) amplitudes relative to L1-L3 contexts. No significant differences were observed between L2-L3 and L1-L3 contexts.
In terms of switching direction, switch to non-dominant language conditions differed significantly from switch to dominant language conditions during 368-492 ms after auditory word onset (p = .024), with dominant language switches eliciting larger N400 amplitudes.
As for trial type, no significant differences were found between switch and repeat trials across any time windows tested.
As shown in Figure 8. The critical test of proactive control mechanisms emerged in the switching direction analysis. A significant interaction between language context and switching direction revealed that proactive control operates selectively across trilingual contexts.
Regarding the L1-L2 and L2-L3 contexts, no significant differences were observed between switch to dominant language and switch to non-dominant language conditions across any time windows tested.
In contrast, Within the L1-L3 context, a striking language dominance reversal occurred (298-504 ms, p = .006), where switches to the dominant language (L1) elicited enhanced P300 and N400 amplitudes compared to switches to the non-dominant language (L3). This reversal provides direct neural evidence for proactive inhibition of the dominant language to facilitate processing of the weaker language.The absence of this pattern in L1-L2 and L2-L3 contexts reveals the boundary conditions of proactive control in trilingual comprehension. In L1-L2 contexts, comparable proficiency levels eliminate the need for asymmetric inhibition. In L2-L3 contexts, the facilitative medium-of-instruction relationship between L2 and L3 creates cooperative rather than competitive dynamics.
As shown in Figure 9, the three-way interaction between language context, switching direction, and trial type was not significant.
The absence of significant switch costs across all contexts (Figure 9) provides compelling evidence against reactive control mechanisms in trilingual auditory comprehension. This null finding is theoretically significant because it demonstrates that comprehension control operates primarily through proactive preparation rather than reactive conflict resolution.
3.5. Multivariate Pattern Analysis Results
3.5.1. Diagonal Decoding Results
One core objective of this study was to determine whether neural signals associated with language comprehension under different dual-language contexts could be uncovered using multivariate pattern analysis. We trained linear discriminant classifiers to distinguish between different experimental conditions based on scalp-wide EEG responses (see Methods for details). The classification results revealed significant main effects for context manipulations, with the classifier successfully discriminating between L1-L2 and L2-L3 dual-language contexts (Figure 10A; two-tailed cluster p < .001 after 1000 iterations).
Classification accuracy increased rapidly from approximately 273 ms post-stimulus onset, remaining above chance for a 27 ms time window, with temporal dynamics closely matching the N2 component observed in the difference wave between L1-L2 and L2-L3 context-evoked ERPs. Similarly, significant classification was achieved between L2-L3 and L1-L3 contexts (Figure 10A; two-tailed cluster p < .001 after 1000 iterations), with above-chance performance emerging at 253 ms post-stimulus and sustaining for 46 ms, aligning with the N2 component in the corresponding ERP difference wave. The most robust discrimination was observed for L1-L2 versus L1-L3 contexts, which showed reliable classification across multiple time windows (Figure 10A; two-tailed cluster p < .001 after 1000 iterations), including the P200 component (187-226 ms, 39 ms duration), P300 component (325-422 ms, 97 ms duration), N400 component (454-585 ms, 131 ms duration), and LPC components (638-701 ms, 63 ms duration; 822-868 ms, 46 ms duration), with each period corresponding to the respective ERP components in the L1-L2 vs. L1-L3 difference wave. Regarding switching direction, the classifier successfully decoded switches to dominant versus non-dominant languages (Figure 10A; two-tailed cluster p < .001 after 1000 iterations), with above-chance classification occurring during an early window (225-271 ms, 46 ms duration) corresponding to the N2 component, and late windows (830-869 ms, 39 ms duration; 936-971 ms, 35 ms duration) corresponding to LPC components in the switching direction difference wave. In contrast, no significant classification was achieved for trial type (switch vs. repetition trials), as the classifier failed to discriminate between switch and repetition conditions throughout the analyzed time period, with classification accuracy falling significantly below chance level during brief periods (39-53 ms and 309-319 ms; two-tailed cluster p < .001 after 1000 iterations), suggesting systematic misclassification rather than random performance. These results demonstrate that context and switching direction information was clearly encoded in the EEG signals and detectable through multivariate pattern analysis, revealing neural distinctions that remained hidden to classical ERP methodology.
3.5.2. Weight Projection Analysis Results
To identify the neural sources underlying successful MVPA classifications, we computed weight projections by multiplying the obtained weight matrices with the covariance matrices (see Methods section), with the resulting topographical maps in Figure 10B representing the spatial distribution of neural signals contributing to classification accuracy across different experimental conditions.
Significant clusters emerged during 236-336 ms (p < .001, two-tailed cluster-based permutation test, 1000 iterations) when comparing L1-L2 versus L2-L3 contexts, where L2-L3 contexts showed increased activity in right frontal and right fronto-temporal regions (F4/FC4/FT8) but decreased activity in left temporal and left temporo-parietal junction areas (T7/TP7/CP3/P7; Figure 10B).
Similarly, significant topographical differences were observed during 238-338 ms (p < .001, two-tailed cluster-based permutation test, 1000 iterations) when comparing L2-L3 versus L1-L3 contexts, with L1-L3 contexts eliciting increased activity in left temporal, left inferior parietal, and left centro-parietal junction regions (T7/CP3/P7), alongside decreased activity in right temporal, right temporo-parietal junction, and right inferior parietal areas (T8/TP8/P8; Figure 10B), while a trend toward increased activity in left inferior parietal regions (P7) was observed for L1-L3 versus L1-L2 contexts, though this did not reach statistical significance (Figure 10B).
Weight projection analysis further revealed significant main effects of switching direction during 208-308 ms (p < .001, two-tailed cluster-based permutation test, 1000 iterations), where switches to dominant languages, compared to switches to non-dominant languages, elicited increased activity in left parietal and left occipital regions (P3/O1/Oz) but decreased activity in right frontal, right fronto-central, and right fronto-temporal areas (F4/FC4/FT8; Figure 10B). Additionally, significant main effects of trial type emerged during 262-362 ms (p < .001, two-tailed cluster-based permutation test, 1000 iterations), with repetition trials, compared to switch trials, showing decreased activity in bilateral frontopolar, left frontal, and fronto-central midline regions (FP1/FPz/FP2/F3/Fz/FCz; Figure 10B).
3.5.3. Temporal Generalization Using Classification Across Time result
To investigate the temporal dynamics of context representations, we employed multivariate pattern analysis (MVPA) with temporal generalization procedures (King et al., 2014) to determine whether dual-language context information persists throughout the trial or dissipates immediately after auditory word presentation. The analysis revealed distinct temporal patterns across different dual-language contexts, with L1-L2 versus L2-L3 classification showing only marginal above-chance accuracy from 250 to 321 ms post-stimulus (p > .05), indicating brief and unstable context representation during lexical access (Figure 10C). In contrast, L2-L3 versus L1-L3 contexts demonstrated robust classification performance from 227 to 387 ms post-stimulus (p < .005, two-tailed cluster-based permutation test, 1000 iterations), followed by a secondary peak from 410 to 643 ms (p < .005, two-tailed cluster-based permutation test, 1000 iterations), suggesting initial sustained context representation with subsequent reactivation during semantic processing stages. Similarly, L1-L2 versus L1-L3 contexts exhibited prolonged above-chance classification from 174 to 582 ms post-stimulus (p < .005, two-tailed cluster-based permutation test, 1000 iterations), with an additional late reactivation period from 622 to 713 ms (p < .005, two-tailed cluster-based permutation test, 1000 iterations), indicating extended context maintenance and semantic-stage retrieval. Complementing these context effects, analysis of switching direction revealed a biphasic temporal pattern, with classification of switching to dominant versus non-dominant languages exceeding chance from 421 to 498 ms post-stimulus (p < .005, two-tailed cluster-based permutation test, 1000 iterations) and again from 843 to 994 ms (p < .005, two-tailed cluster-based permutation test, 1000 iterations), suggesting initial switching direction encoding followed by semantic-stage reactivation. Notably, temporal generalization analysis failed to reliably decode trial type information (switch versus repetition) throughout the experimental timeline (p > .05), indicating that trial type representations are transient and do not persist during lexical access, reflecting brief, state-dependent processing rather than sustained representation. These findings collectively demonstrate that context and switching direction information exhibit sustained neural representations with distinct temporal profiles, while trial type effects reflect more ephemeral processing mechanisms, supporting the hypothesis that different aspects of multilingual language control operate through temporally distinct neural mechanisms.
3.5.4. Multiple Regression Analysis of ERP Data and Drift Diffusion Model Parameters
We examined relationships between mean ERP amplitudes (LPC, N200, N400) and diffusion model parameters using multiple linear regression analyses. Given non-significant main effects of switching direction and trial type on diffusion model parameters, analyses focused on language context effects. All analyses controlled for participant-level random effects, with multiple comparisons corrected using the Bonferroni-Holm procedure. Estimated regression parameters are provided in Table 4.
N200 Amplitudes and Drift Rate for “No” Responses
N200 amplitudes showed context-dependent associations with drift rates for negative responses (Figure 11A). Note that N200 is a negative-going component; larger numerical values indicate smaller negative amplitudes and reduced inhibitory control. Drift rates for “no” responses are negative values, with more negative values indicating faster accumulation toward the “no” boundary.
In the L2-L3 context, participants with greater N200 numerical values exhibited significantly higher (less negative) drift rates for “no” responses (b = 0.144, t = 2.21, p = .030, R2 = .15), indicating that reduced inhibitory control was associated with slower “no” responses. Conversely, in the L1-L3 context, a marginally significant opposite pattern emerged (b = -0.119, t = -1.86, p = .068, R2 = .04), where enhanced inhibitory control was associated with faster “no” response rates. No significant relationship was observed in the L1-L2 context (b = 0.023, t = 0.89, p = .376, R2 = .01).
These differential patterns explain the observed context effects on drift rates for negative responses, with the L2-L3 context demonstrating faster “no” response patterns compared to the L1-L2 context (t = -2.21, p = .037, Cohen’s d = -0.540) due to enhanced inhibitory demands.
N400 Amplitudes and Decision Boundary
N400 amplitudes demonstrated a significant positive relationship with decision boundary settings, exclusively in the L2-L3 context (b = -0.29, t = -3.45, p < .001, R2 = .15; Figure 11B). Note that N400 is a negative-going component; larger numerical values indicate smaller negative amplitudes. Neither the L1-L2 context (b = 0.035, t = 0.63, p = .531, R2 < .01) nor the L1-L3 context (b = -0.030, t = -0.38, p = .706, R2 < .01) showed significant N400-decision boundary relationships.
Context analysis indicated that the L2-L3 context was associated with larger decision boundaries compared to the L1-L2 context (t = -3.04, p = .011, Cohen’s d = -0.756), an effect mediated by increased semantic conflict monitoring in the L2-L3 context condition (i.e., enhanced N400 amplitudes).
LPC Amplitudes and Response Bias
Multiple regression analysis revealed a significant negative relationship between LPC amplitudes and response bias, with context-dependent effects (Figure 11C). In the L1-L3 context, participants with greater LPC amplitudes demonstrated significantly lower response bias (b = -0.013, t = -2.35, p = .022, R2 = .18). A similar trend emerged in the L1-L2 context at marginal significance (b = -0.011, t = -1.93, p = .057, R2 = .05), while no significant relationship was observed in the L2-L3 context (b = -0.009, t = -1.55, p = .127, R2 = .03).
Context comparison revealed that the L1-L3 context showed significantly lower response bias compared to the L1-L2 context (t = -3.04, p = .011, Cohen’s d = -0.756), an effect attributable to enhanced LPC amplitudes in the L1-L3 condition.
N400 Amplitudes and Non-Decision Time
N400 amplitudes showed significant negative associations with non-decision time, exclusively in the L2-L3 context (b = 0.021, t = 3.74, p < .001, R2 = .21; Figure 11D). No significant relationships emerged in either the L1-L2 context (b = 0.0003, t = -0.09, p = .932, R2 = .01) or the L1-L3 context (b = 0.007, t = 1.32, p = .190, R2 = .02).
Context comparison revealed that the L2-L3 context exhibited significantly shorter non-decision times compared to the L1-L2 context (t = -3.12, p = .009, Cohen’s d = -0.677). This effect is attributable to enhanced N400 amplitudes in the L2-L3 context, indicating increased semantic conflict processing.
4. Discussion
The adaptive control hypothesis proposes that bilinguals operate in three distinct language contexts (dense code-switching, single-language, and dual-language contexts), each requiring different language control mechanisms [28]. While bilinguals navigate one dual-language context, trilinguals encounter three (L1-L2, L1-L3, L2-L3), yet whether these contexts require varying control degrees remains unclear. This study examined language comprehension efficiency across these contexts using auditory word-picture matching to investigate distinct proactive or reactive control mechanisms.
4.1. Language Comprehension Efficiency Across Dual-Language Contexts
The central finding of this study is that trilingual comprehension efficiency varies systematically across dual-language contexts, but this variation operates through compensatory mechanisms that render it nearly invisible to standard behavioral measures.
Drift-diffusion modeling revealed the hidden architecture of context-dependent processing. While behavioral reaction times showed minimal differences, the underlying cognitive processes differed dramatically. The L1-L2 context demonstrated the lowest comprehension efficiency due to slower evidence accumulation for both match and mismatch responses, despite compensatory adjustments in response bias and decision thresholds, supporting the Adaptive Control Hypothesis [28].This pattern helps explain an apparent inconsistency in the trilingual literature.Previous studies reporting absent context effects may have relied too heavily on gross behavioral measures that are insensitive to the subtle but systematic processing differences revealed by computational modeling [8,27].
The ERP results provide the neural basis for these computational findings. The L1-L2 context elicited the largest N400 amplitudes, indicating the strongest cross-linguistic semantic competition despite being the most practiced language pair. This “expertise paradox” occurs because high proficiency in both languages leads to a lack of proactive control, creating semantic competition that cannot be efficiently resolved [49,50].
MVPA effectively distinguished dual-language contexts, with P200 emerging as the earliest neural marker differentiating L1-L2 and L1-L3 contexts, aligning with research showing P200 amplitude correlates with early phonological processing efficiency [51]. The P300 component exhibited highest classification accuracy between L1-L2 and L1-L3 contexts, reflecting differing attentional demands.
Weight projection analysis reveals distinct neural mechanisms across language contexts. L2-L3 context triggered enhanced right frontal and fronto-temporal activity compared to L1-L2 context, reflecting increased cognitive control demands when processing between non-native languages [52]. Conversely, L1-L2 context showed significant left temporal lobe activation, critical for speech decoding. Heightened left auditory cortex activation, particularly superior temporal gyrus, suggests L1-L2 context requires greater phoneme processing [53].The L2-L3 versus L1-L3 comparison revealed significant right temporal lobe reduction. Since both L1 (Uyghur) and L3 (English) are non-tonal languages, reduced activation likely reflects lower demands for processing non-linguistic features like intonation [54].
Temporal generalization analysis revealed distinct neural mechanisms across dual-language contexts, supporting the Adaptive Control Hypothesis [17] with representation duration varying across language contexts.
4.2. The Demands of Proactive Control in Different Dual-Language Contexts
Our findings revealed striking reversal of typical language dominance patterns. Contrary to expected frequency effects [55], we observed enhanced N400 amplitudes for switches to dominant versus non-dominant languages. This dominance reversal occurred exclusively within L1-L3 context, providing critical evidence for context-specific proactive control mechanisms.The selective nature of this effect is crucial for theoretical interpretation. Language dominance reversal occurred exclusively in the L1-L3 context, where proficiency differences are greatest and no facilitative medium-of-instruction relationship exists. This pattern supports a nuanced model of trilingual control where proactive inhibition is deployed strategically based on proficiency relationships and learning history [17].
The absence of dominance reversal in L1-L2 contexts challenges simplistic proficiency-based accounts of language control. Despite participants demonstrating comparable proficiency in both L1 and L2, this reversal effect was not observed.Declerck et al. [70] argued that balanced bilinguals are more susceptible to experiencing reversal of language dominance effects, leading us to hypothesize that the most pronounced reversal of language dominance effects should occur in L1-L2 contexts. Contrary to expectations, however, the cognitive system appears to treat L1-L2 configurations as a unified, integrated bilingual mode rather than as two competing linguistic systems requiring differential control mechanisms.The L2-L3 context revealed a third pattern: facilitative rather than competitive processing. The absence of dominance reversal here reflects the cooperative relationship between L2 (instructional language) and L3 (target language), supporting theories of parasitic vocabulary acquisition where L3 words become integrated with L2 representations rather than competing with them [62,63].Enhanced N400 for dominant language processing in L1-L3 contexts suggests active inhibition of highly proficient L1 when preparing to process less proficient L3, mirroring Palmer et al. [56], who demonstrated asymmetric translation effects where switches to dominant language elicited larger N400 amplitudes due to stronger lexical-level connections.
Weight projection analysis revealed that switches to non-dominant languages showed enhanced activity in right frontal, fronto-central midline, and fronto-temporal regions, consistent with Wu et al. [52], who interpret stronger right frontal activation as reflecting increased proactive inhibition of non-target languages. Based on Ludersdorfer et al. [57], reduced occipital cortex activation during auditory word processing likely represents adaptive inhibition preventing visual cortex “noise” from interfering with precise auditory processing.
Time generalization matrix analysis revealed switching direction effects during two distinct periods: N400 component window (421-498 ms) and LPC component window (843-994 ms), suggesting trilinguals extract switching direction information twice: first during semantic conflict monitoring and again during lemma-level inhibition of non-target words.
4.3. The Demands of Reactive Control in Different Dual-Language Contexts
The systematic absence of switch costs across all dual-language contexts provides strong evidence against reactive control models of trilingual comprehension, but this finding requires careful interpretation.
Traditional ERP analysis revealed no significant switch-repeat differences, consistent with previous bilingual comprehension studies [27]. However, multivariate pattern analysis detected subtle but systematic neural differences that traditional approaches missed, suggesting that reactive control may operate through distributed patterns rather than localized amplitude modulations.
This dissociation between univariate and multivariate results has important theoretical implications. It suggests that reactive control in comprehension operates through subtle reconfiguration of neural networks rather than the strong inhibitory processes observed in production tasks. The absence of gross switch costs may reflect the efficiency of these distributed control mechanisms rather than their absence.
The weight projection analysis revealed that switch trials elicited enhanced frontopolar and frontal activation (262-362 ms), consistent with domain-general cognitive control engagement [58]. However, this activation was not sufficiently strong or sustained to produce detectable behavioral costs, suggesting that comprehension benefits from rapid, efficient control processes that prevent conflict from escalating to levels requiring prolonged inhibitory intervention.
4.4. Neural Computations of Language Control Across Dual-Language Contexts
The multiple regression analysis linking ERP components to DDM parameters revealed the mechanistic basis for the compensatory control observed in behavioral data.Context-specific ERP-DDM relationships demonstrated that different dual-language contexts recruit distinct neural computational strategies. In L2-L3 contexts, enhanced conflict monitoring (N200) predicted more efficient evidence accumulation, while increased semantic processing demands (N400) predicted both more conservative decision boundaries and faster non-decision processes. This pattern suggests a “front-loaded investment” strategy where additional semantic processing reduces later decision uncertainty [68,69].The L1-L3 context showed a different pattern: late control processes (LPC) predicted reduced response bias toward the dominant language. This suggests active top-down regulation to counteract strong L1 dominance, consistent with the proactive inhibition revealed in the switching direction analysis [66,67].
The N200-drift-rate link in L2-L3 contexts fits conflict-monitoring accounts where N200 indexes conflict detection rather than inhibition [59,60]. We interpret larger N200s as heightened monitoring by anterior cingulate cortex, preparing the system to accumulate evidence more efficiently. The context specificity aligns with an inverted-U relation between conflict intensity and adaptation [61]: conflict is too low in L1-L2 to trigger strong adaptation and too high in L1-L3 to benefit performance, leaving L2-L3 at optimal, midrange level.This profile matches predictions from the BIA+ model [10] and language parasitism theory [62,63]. In L1-L2 contexts, similar proficiency fosters balanced lateral inhibition and automatized processing. In L1-L3 contexts, unequal proficiency yields asymmetric inhibition and excessive conflict. We observed an exclusive N400-decision-boundary relationship in L2-L3 contexts, where larger N400s—marking greater difficulty in semantic access—were associated with wider decision boundaries, indicating more conservative decision policy when meaning is uncertain [64,65].
These context-specific neural-computational relationships explain how trilingual comprehension maintains stable behavioral performance despite varying underlying demands. The system dynamically adjusts multiple decision parameters to maintain efficiency, creating a surface appearance of comparable performance across contexts while employing fundamentally different processing strategies.
This finding has broader implications for theories of cognitive control. It suggests that expertise in complex cognitive domains like multilingual language use involves not just faster or more accurate processing, but sophisticated compensatory mechanisms that maintain performance in the face of varying task demands through flexible parameter adjustment.
4.5. Limitations
Our experimental design included a 300ms delay between auditory and visual stimuli to prevent task-related neural contamination (e.g., decision-making, mismatch detection). However, this temporal separation limited the findings: reaction times measured substantially after stimulus onset were uninformative about real-time language switching, as effects may have dissipated during the gap. Future research should examine switching costs under simultaneous presentation to better capture online processing and real-time control mechanisms. Investigating drift-diffusion parameters under these conditions could reveal whether compensatory mechanisms persist when temporal constraints are reduced.
5. Conclusions
This study employed a word-picture matching task to examine three different dual-language contexts. Results revealed that compared to L1-L2 context, both L2-L3 and L1-L3 contexts demonstrated higher language comprehension efficiency. This enhanced efficiency resulted from greater proactive control demands in L2-L3 and L1-L3 contexts compared to L1-L2 context. The three dual-language contexts showed no significant differences in reactive control demands.
These findings indicate that trilingual language control is more nuanced and context-dependent than previously recognized, with important implications for models of multilingual language processing and cognitive control.
Author Contributions
Yuanbo Wang: conceptualization, original draft preparation, writing, data analysis, funding acquisition, review, software, validation, visualization, formal analysis, project administration and editing. Yingfang Meng: conceptualization, supervision, review, and editing. Ruiming Wang: conceptualization, supervision, review, and editing. Qiuyue Yang: review, and editing. All authors have read and agreed to the published version of the manuscript.
Funding
This research was supported by the Fujian Provincial Social Science Foundation Youth Project: “Mechanisms of Bidialectal Experience in Delaying Cognitive Aging from the Perspective of Healthy China, grant number FJ2025C104.
Institutional Review Board Statement
The IRB determined that the study is exempt. The study was conducted in accordance with the Declaration of Helsinki and was approved by the South China Normal University IRB (IORG NO.0011738; Approval Code: SCNU-PSY-2022-112; December 13, 2022).
Informed Consent Statement
Informed consent was obtained from all subjects involved in the study.
Data Availability Statement
The data presented in this study are available on request from the corresponding author, due to privacy restrictions.
Conflicts of Interest
There are no conflicts of interest to disclose.
References
- Bilingualism in the US, UK & Global Statistics. Available online: https://preply.com/en/blog/bilingualism-statistics/ (accessed on 12 June 2025).
- Thierry, G. and Y.J. Wu, Brain potentials reveal unconscious translation during foreign-language comprehension. Proceedings of the National Academy of Sciences, 2007. 104(30): p. 12530-12535. [CrossRef]
- Chen, J., How do L3 words find conceptual parasitic hosts in typologically distant L1 or L2? Evidence from a cross-linguistic priming effect. International Journal of Bilingual Education and Bilingualism, 2020. 23(10): p. 1238-1253. [CrossRef]
- Chen, J., et al., Examining sources of language production switch costs amongst Tibetan-Chinese-English trilinguals. International Journal of Bilingual Education and Bilingualism, 2024. 27(8): p. 1153-1167. [CrossRef]
- Declerck, M. and I. Koch, The concept of inhibition in bilingual control. Psychological Review, 2023. 130(4): p. 953. [CrossRef]
- Grainger, J., K. Midgley, and P. Holcomb, Re-thinking the bilingual interactive-activation model from a developmental perspective (BIA-d). In M. Kail & M. Hickmann (Eds.), Language Acquisition across Linguistic and Cognitive Systems. 2010, Philadelphia, PA: John Benjamins.
- Jiao, L., et al., The contributions of language control to executive functions: From the perspective of bilingual comprehension. Quarterly Journal of Experimental Psychology, 2019. 72(8): p. 1984-1997. [CrossRef]
- Wu, J., et al., Distinct language control mechanisms in speech production and comprehension: evidence from N-2 repetition, switching, and mixing costs. Journal of Multilingual and Multicultural Development, 2025: p. 1-17.
- Van Heuven, W.J., T. Dijkstra, and J. Grainger, Orthographic neighborhood effects in bilingual word recognition. Journal of memory and language, 1998. 39(3): p. 458-483. [CrossRef]
- Dijkstra, T. and W.J. Van Heuven, The architecture of the bilingual word recognition system: From identification to decision. Bilingualism: Language and cognition, 2002. 5(3): p. 175-197.
- Declerck, M. and J. Grainger, Inducing asymmetrical switch costs in bilingual language comprehension by language practice. Acta Psychologica, 2017. 178: p. 100-106. [CrossRef]
- Orfanidou, E. and P. Sumner, Language switching and the effects of orthographic specificity and response repetition. Memory & Cognition, 2005. 33(2): p. 355-369. [CrossRef]
- Aparicio, X. and J.-M. Lavaur, Recognising words in three languages: Effects of language dominance and language switching. International Journal of Multilingualism, 2014. 11(2): p. 164-181. [CrossRef]
- Hirsch, P., M. Declerck, and I. Koch, Exploring the functional locus of language switching: Evidence from a PRP paradigm. Acta psychologica, 2015. 161: p. 1-6. [CrossRef]
- Declerck, M., et al., Highly proficient bilinguals implement inhibition: Evidence from n-2 language repetition costs. Journal of Experimental Psychology: Learning, Memory, and Cognition, 2015. 41(6): p. 1911. [CrossRef]
- Declerck, M. and A.M. Philipp, Is inhibition implemented during bilingual production and comprehension? n-2 language repetition costs unchained. Language, Cognition and Neuroscience, 2018. 33(5): p. 608-617. [CrossRef]
- Green, D.W. and J. Abutalebi, Language control in bilinguals: The adaptive control hypothesis. Journal of cognitive psychology, 2013. 25(5): p. 515-530. [CrossRef]
- Blanco-Elorrieta, E. and L. Pylkkänen, Bilingual language switching in the laboratory versus in the wild: The spatiotemporal dynamics of adaptive language control. Journal of Neuroscience, 2017. 37(37): p. 9022-9036. [CrossRef]
- Chen, J. and H. Liu, The effect of the non-task language when trilingual people use two languages in a language switching experiment. Frontiers in Psychology, 2020. 11: p. 754. [CrossRef]
- Kwon, Y., Y. Lee, and K. Nam, The different P200 effects of phonological and orthographic syllable frequency in visual word recognition in Korean. Neuroscience letters, 2011. 501(2): p. 117-121. [CrossRef]
- Maurer, U., D. Brandeis, and B.D. McCandliss, Fast, visual specialization for reading in English revealed by the topography of the N170 ERP response. Behavioral and brain functions, 2005. 1(1): p. 13. [CrossRef]
- Declerck, M., et al., The other modality: Auditory stimuli in language switching. Journal of Cognitive Psychology, 2015. 27(6): p. 685-691. [CrossRef]
- Ong, G., et al., Diffusing the bilingual lexicon: Task-based and lexical components of language switch costs. Cognitive Psychology, 2019. 114: p. 101225. [CrossRef]
- Declerck, M. and A.M. Philipp, A review of control processes and their locus in language switching. Psychonomic bulletin & review, 2015. 22(6): p. 1630-1645. [CrossRef]
- Dijkstra, T. and W.J. Van Heuven, The BIA model and bilingual word recognition, in Localist connectionist approaches to human cognition. 2013, Psychology Press. p. 189-225.
- Hut, S.C., et al., Language control mechanisms differ for native languages: Neuromagnetic evidence from trilingual language switching. Neuropsychologia, 2017. 107: p. 108-120. [CrossRef]
- Declerck, M., et al., What absent switch costs and mixing costs during bilingual language comprehension can tell us about language control. Journal of Experimental Psychology: Human Perception and Performance, 2019. 45(6): p. 771. [CrossRef]
- Green, D.W., Mental control of the bilingual lexico-semantic system. Bilingualism: Language and cognition, 1998. 1(2): p. 67-81. [CrossRef]
- Brysbaert, M., How many participants do we have to include in properly powered experiments? A tutorial of power analysis with reference tables. Journal of cognition, 2019. 2(1): p. 16. [CrossRef]
- Faul, F., et al., Statistical power analyses using G* Power 3.1: Tests for correlation and regression analyses. Behavior research methods, 2009. 41(4): p. 1149-1160. [CrossRef]
- Anderson, J.A., et al., The language and social background questionnaire: Assessing degree of bilingualism in a diverse population. Behavior research methods, 2018. 50(1): p. 250-263. [CrossRef]
- Tomoschuk, B., V.S. Ferreira, and T.H. Gollan, When a seven is not a seven: Self-ratings of bilingual language proficiency differ between and within language populations. Bilingualism: Language and Cognition, 2019. 22(3): p. 516-536. [CrossRef]
- Gollan, T.H., et al., Self-ratings of spoken language dominance: A Multilingual Naming Test (MINT) and preliminary norms for young and aging Spanish–English bilinguals. Bilingualism: language and cognition, 2012. 15(3): p. 594-615. [CrossRef]
- Szekely, A., et al., A new on-line resource for psycholinguistic studies. Journal of memory and language, 2004. 51(2): p. 247-250. [CrossRef]
- Delorme, A. and S. Makeig, EEGLAB: an open source toolbox for analysis of single-trial EEG dynamics including independent component analysis. Journal of neuroscience methods, 2004. 134(1): p. 9-21. [CrossRef]
- Bates, D., et al., Package ‘lme4’. convergence, 2015. 12(1): p. 2.
- Kroll, J.F., et al., Language selection in bilingual speech: Evidence for inhibitory processes. Acta psychologica, 2008. 128(3): p. 416-430. , . [CrossRef]
- Evans, J.L., C. Selinger, and S.D. Pollak, P300 as a measure of processing capacity in auditory and visual domains in specific language impairment. Brain research, 2011. 1389: p. 93-102. [CrossRef]
- Holcomb, P.J. and H.J. Neville, Auditory and visual semantic priming in lexical decision: A comparison using event-related brain potentials. Language and cognitive processes, 1990. 5(4): p. 281-312. [CrossRef]
- Moreno, E.M., A. Rodríguez-Fornells, and M. Laine, Event-related potentials (ERPs) in the study of bilingual language processing. Journal of Neurolinguistics, 2008. 21(6): p. 477-508. [CrossRef]
- Fahrenfort, J.J., et al., From ERPs to MVPA using the Amsterdam decoding and modeling toolbox (ADAM). Frontiers in neuroscience, 2018. 12: p. 368. [CrossRef]
- Haufe, S., et al., On the interpretation of weight vectors of linear models in multivariate neuroimaging. Neuroimage, 2014. 87: p. 96-110. [CrossRef]
- King, J.-R. and S. Dehaene, Characterizing the dynamics of mental representations: the temporal generalization method. Trends in cognitive sciences, 2014. 18(4): p. 203-210.
- Heathcote, A., et al., Dynamic models of choice. Behavior research methods, 2019. 51(2): p. 961-985.
- Turner, B.M., et al., A method for efficiently sampling from distributions with correlated dimensions. Psychological methods, 2013. 18(3): p. 368. [CrossRef]
- Tran, N.-H., et al., Systematic parameter reviews in cognitive modeling: Towards a robust and cumulative characterization of psychological processes in the diffusion decision model. Frontiers in psychology, 2021. 11: p. 608287. [CrossRef]
- Brooks, S.P. and A. Gelman, General methods for monitoring convergence of iterative simulations. Journal of computational and graphical statistics, 1998. 7(4): p. 434-455.
- Holm, S., A simple sequentially rejective multiple test procedure. Scandinavian journal of statistics, 1979: p. 65-70.
- Wu, Y.J. and G. Thierry, Fast modulation of executive function by language context in bilinguals. Journal of Neuroscience, 2013. 33(33): p. 13533-13537. [CrossRef]
- Kałamała, P., et al., The use of a second language enhances the neural efficiency of inhibitory control: An ERP study. Bilingualism: Language and Cognition, 2022. 25(1): p. 163-180. [CrossRef]
- Cheng, X., G. Schafer, and P.M. Riddell, Immediate auditory repetition of words and nonwords: an ERP study of lexical and sublexical processing. PloS one, 2014. 9(3): p. e91988. [CrossRef]
- Wu, J., et al., Transcranial magnetic stimulation of the right inferior frontal gyrus impairs bilinguals’ performance in language-switching tasks. Cognition, 2025. 254: p. 105963. [CrossRef]
- DeWitt, I. and J.P. Rauschecker, Phoneme and word recognition in the auditory ventral stream. Proceedings of the National Academy of Sciences, 2012. 109(8): p. E505-E514. [CrossRef]
- Meyer, M., et al., FMRI reveals brain regions mediating slow prosodic modulations in spoken sentences. Human brain mapping, 2002. 17(2): p. 73-88. [CrossRef]
- Van Petten, C. and M. Kutas, Interactions between sentence context and word frequencyinevent-related brainpotentials. Memory & cognition, 1990. 18(4): p. 380-393.
- Palmer, S.D., J.C. van Hooff, and J. Havelka, Language representation and processing in fluent bilinguals: Electrophysiological evidence for asymmetric mapping in bilingual memory. Neuropsychologia, 2010. 48(5): p. 1426-1437. [CrossRef]
- Ludersdorfer, P., et al., Left ventral occipitotemporal activation during orthographic and semantic processing of auditory words. Neuroimage, 2016. 124: p. 834-842. [CrossRef]
- Abutalebi, J. and D.W. Green, Neuroimaging of language control in bilinguals: neural adaptation and reserve. Bilingualism: Language and cognition, 2016. 19(4): p. 689-698. [CrossRef]
- Botvinick, M.M., J.D. Cohen, and C.S. Carter, Conflict monitoring and anterior cingulate cortex: an update. Trends in cognitive sciences, 2004. 8(12): p. 539-546. [CrossRef]
- Donkers, F.C. and G.J. Van Boxtel, The N2 in go/no-go tasks reflects conflict monitoring not response inhibition. Brain and cognition, 2004. 56(2): p. 165-176.
- van Steenbergen, H., G.P. Band, and B. Hommel, Does conflict help or hurt cognitive control? Initial evidence for an inverted U-shape relationship between perceived task difficulty and conflict adaptation. Frontiers in Psychology, 2015. 6: p. 974. [CrossRef]
- Ecke, P., Parasitic vocabulary acquisition, cross-linguistic influence, and lexical retrieval in multilinguals. Bilingualism: language and cognition, 2015. 18(2): p. 145-162. [CrossRef]
- Ecke, P. and C.J. Hall, The Parasitic Model of L2 and L3 vocabulary acquisition: evidence from naturalistic and experimental studies. Fórum Linguístico, 2014. 11(3): p. 360-372.
- Ortu, D., K. Allan, and D.I. Donaldson, Is the N400 effect a neurophysiological index of associative relationships? Neuropsychologia, 2013. 51(9): p. 1742-1748.
- Todorova, L., D.A. Neville, and V. Piai, Lexical-semantic and executive deficits revealed by computational modelling: a drift diffusion model perspective. Neuropsychologia, 2020. 146: p. 107560. [CrossRef]
- Liu, H., et al., Electrophysiological evidence for domain-general inhibitory control during bilingual language switching. PloS one, 2014. 9(10): p. e110887. [CrossRef]
- Yang, H., et al., Late positive complex in event-related potentials tracks memory signals when they are decision relevant. Scientific reports, 2019. 9(1): p. 9469. [CrossRef]
- Todorova, L. and D.A. Neville, Associative and identity words promote the speed of visual categorization: A hierarchical drift diffusion account. Frontiers in Psychology, 2020. 11: p. 955. [CrossRef]
- Tiedt, H.O., F. Ehlen, and F. Klostermann, Age-related dissociation of N400 effect and lexical priming. Scientific reports, 2020. 10(1): p. 20291. [CrossRef]
- Declerck, M., D. Kleinman, and T.H. Gollan, Which bilinguals reverse language dominance and why? Cognition, 2020. 204: p. 104384. [CrossRef]
Figure 1.
Schematic illustration of the experimental procedure. Participants made word-picture matching judgments by pressing designated response keys. The checkmark (✓) indicates that the auditory word matches the visual picture (match response), while the cross (×) indicates that the auditory word does not match the visual picture (mismatch response). Response key assignment was counterbalanced across participants: half of the participants had the match key (✓) positioned in the lower left and the mismatch key (×) in the lower right, while the other half had the reverse assignment.
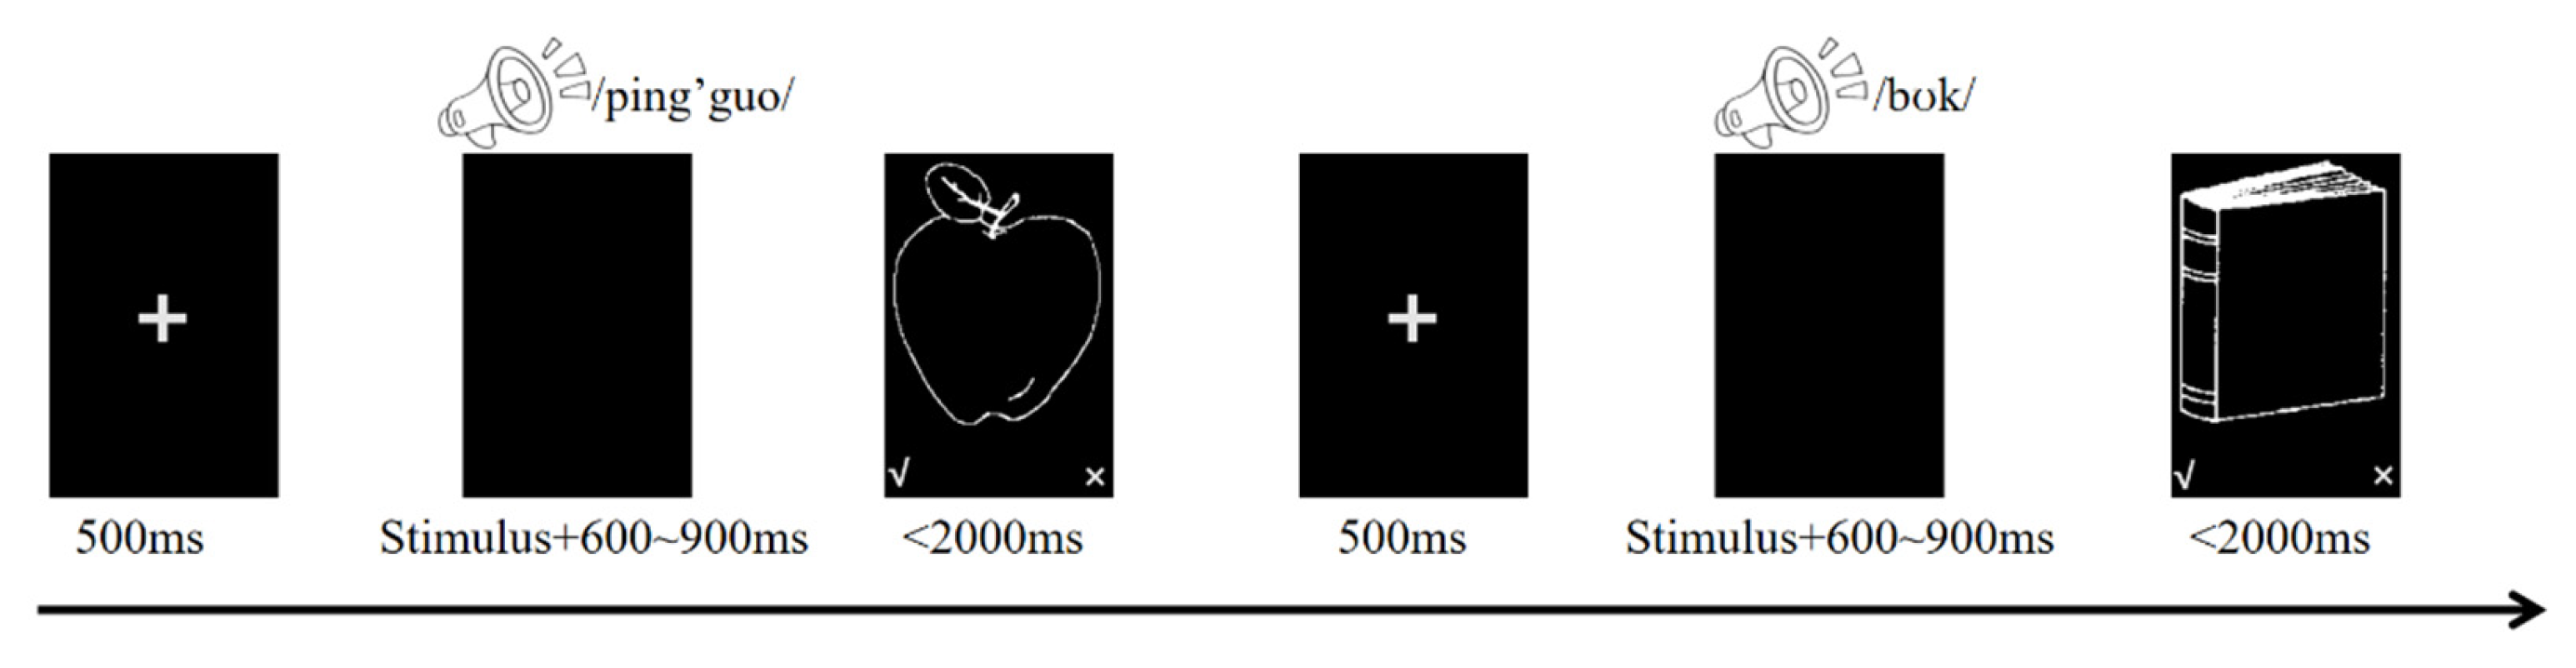
Figure 2.
Reaction times (ms) by dual-language contexts, switching direction, and trial type. Error bars represent 95% confidence intervals.
Figure 2.
Reaction times (ms) by dual-language contexts, switching direction, and trial type. Error bars represent 95% confidence intervals.
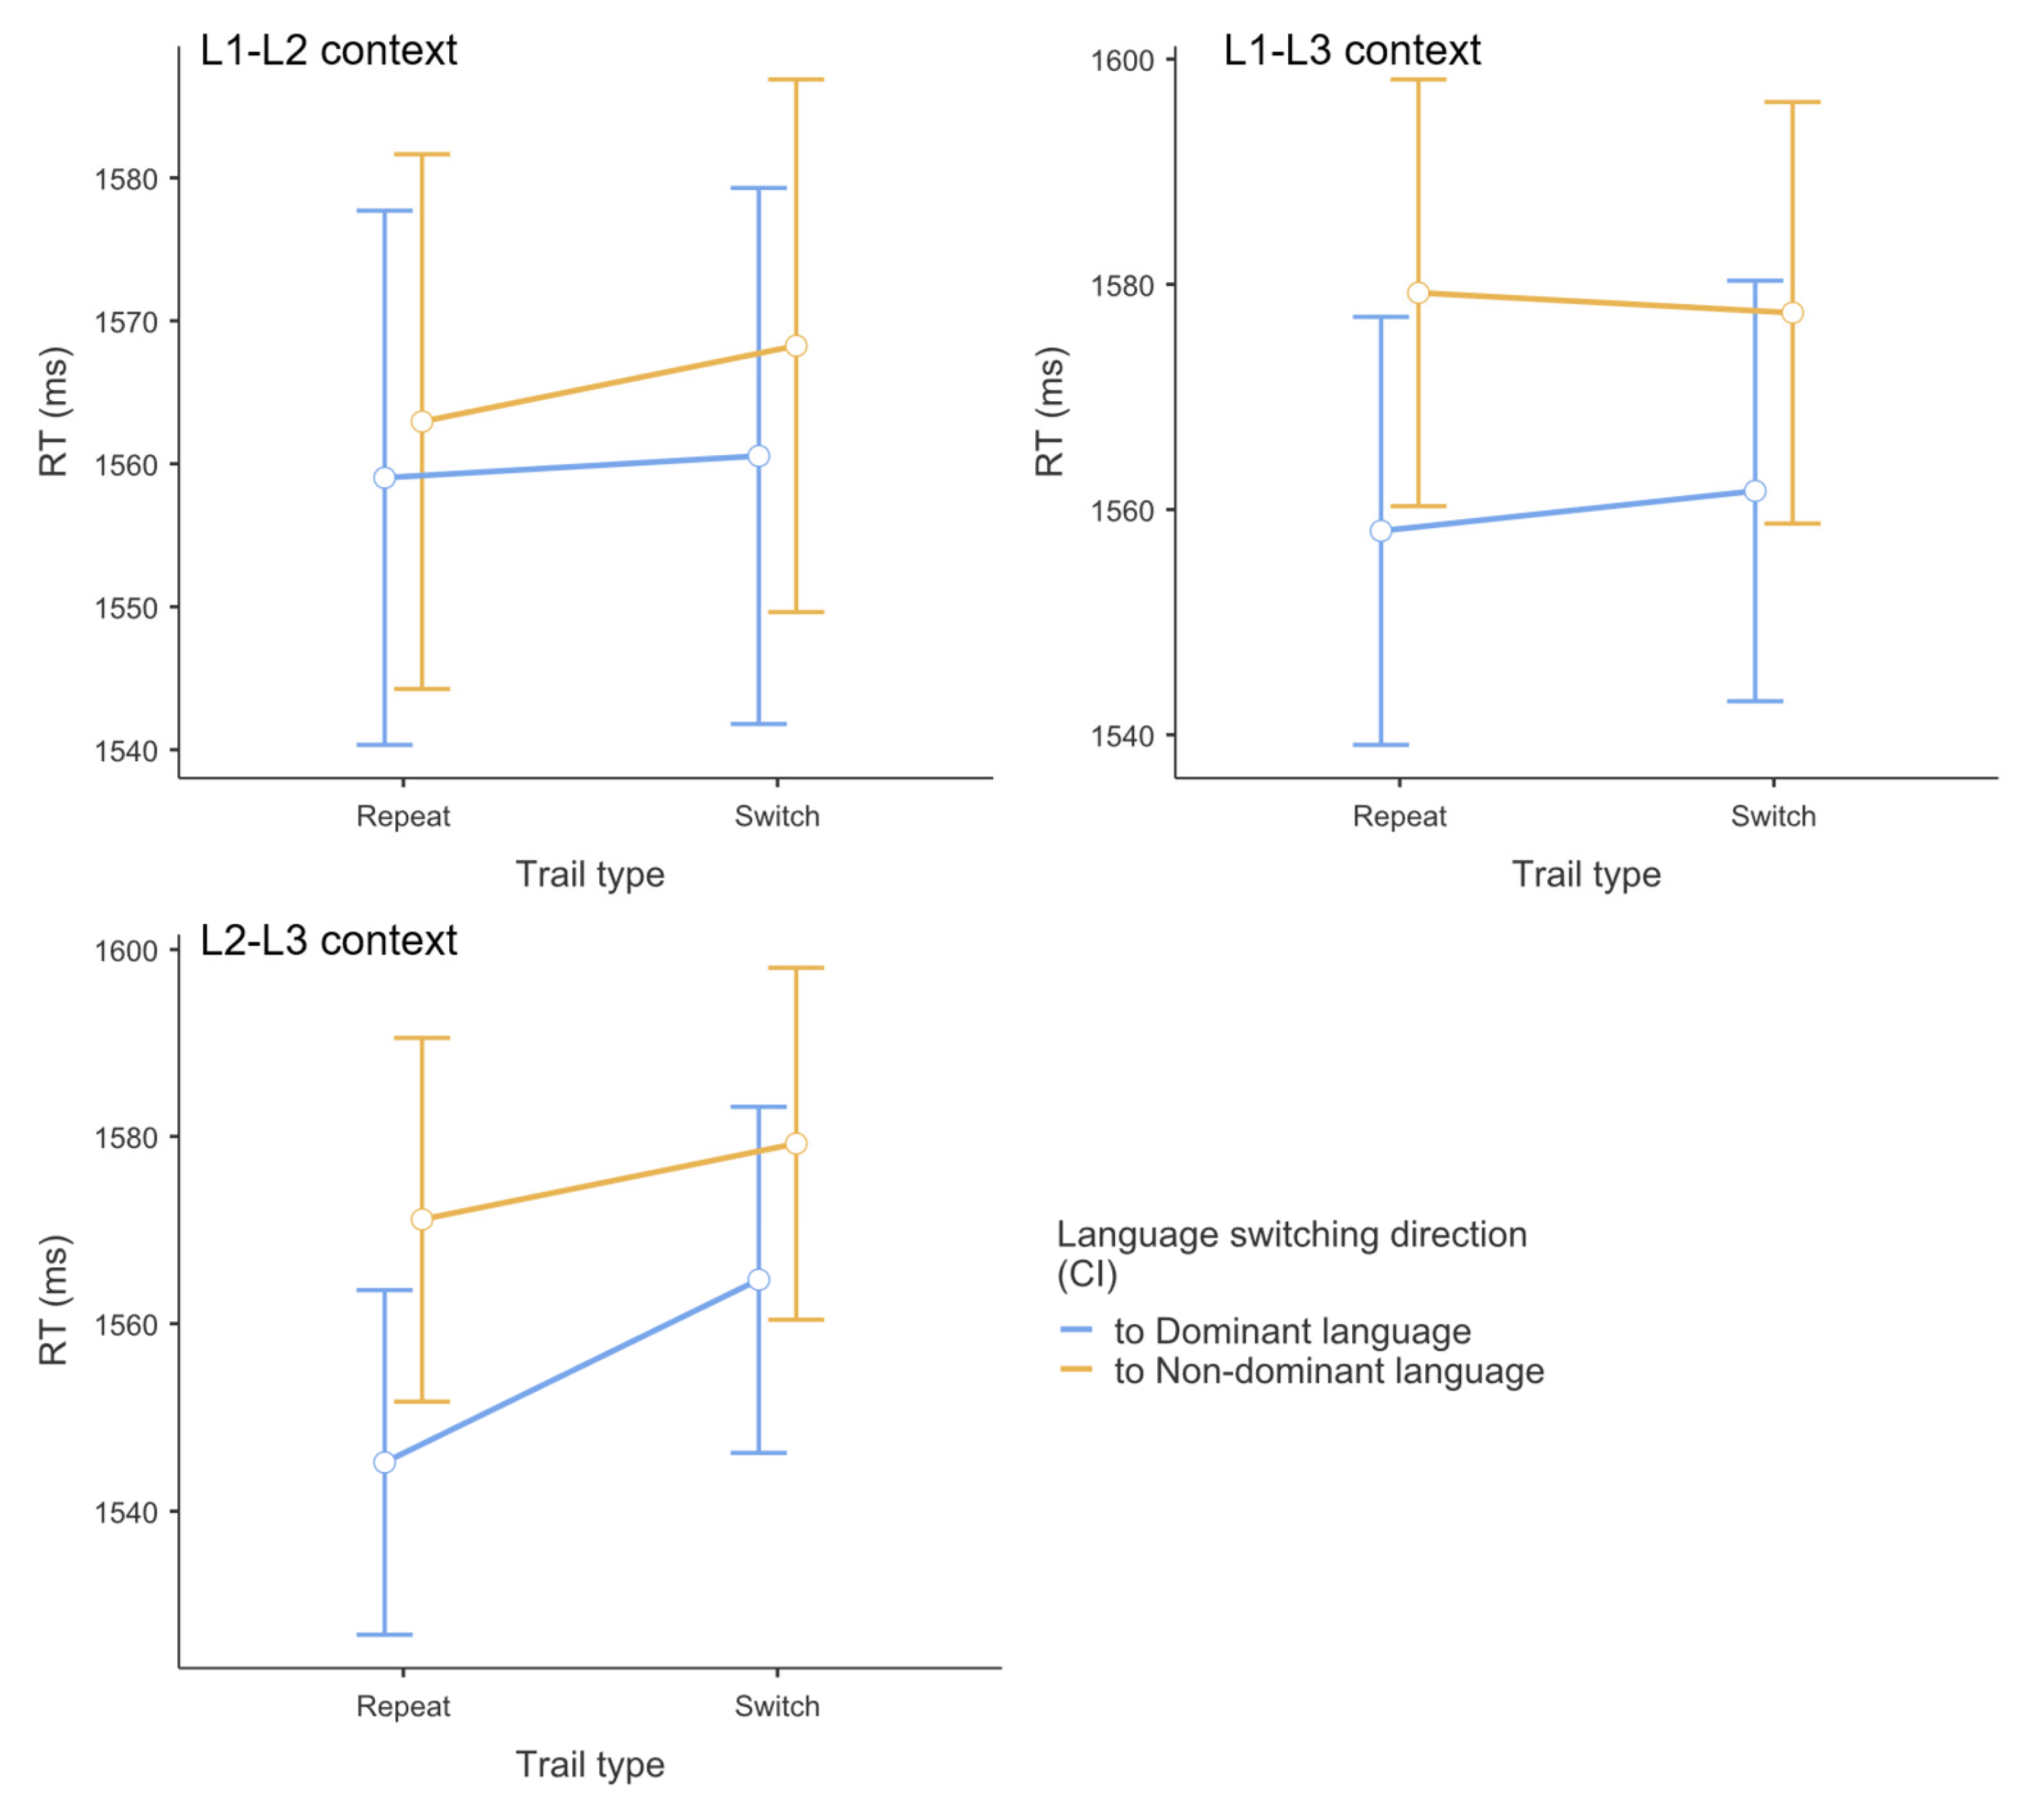
Figure 3.
Mean accuracy across dual-language contexts (L1-L2, L1-L3, L2-L3) by switching direction and trial type. Error bars represent 95% confidence intervals.
Figure 3.
Mean accuracy across dual-language contexts (L1-L2, L1-L3, L2-L3) by switching direction and trial type. Error bars represent 95% confidence intervals.
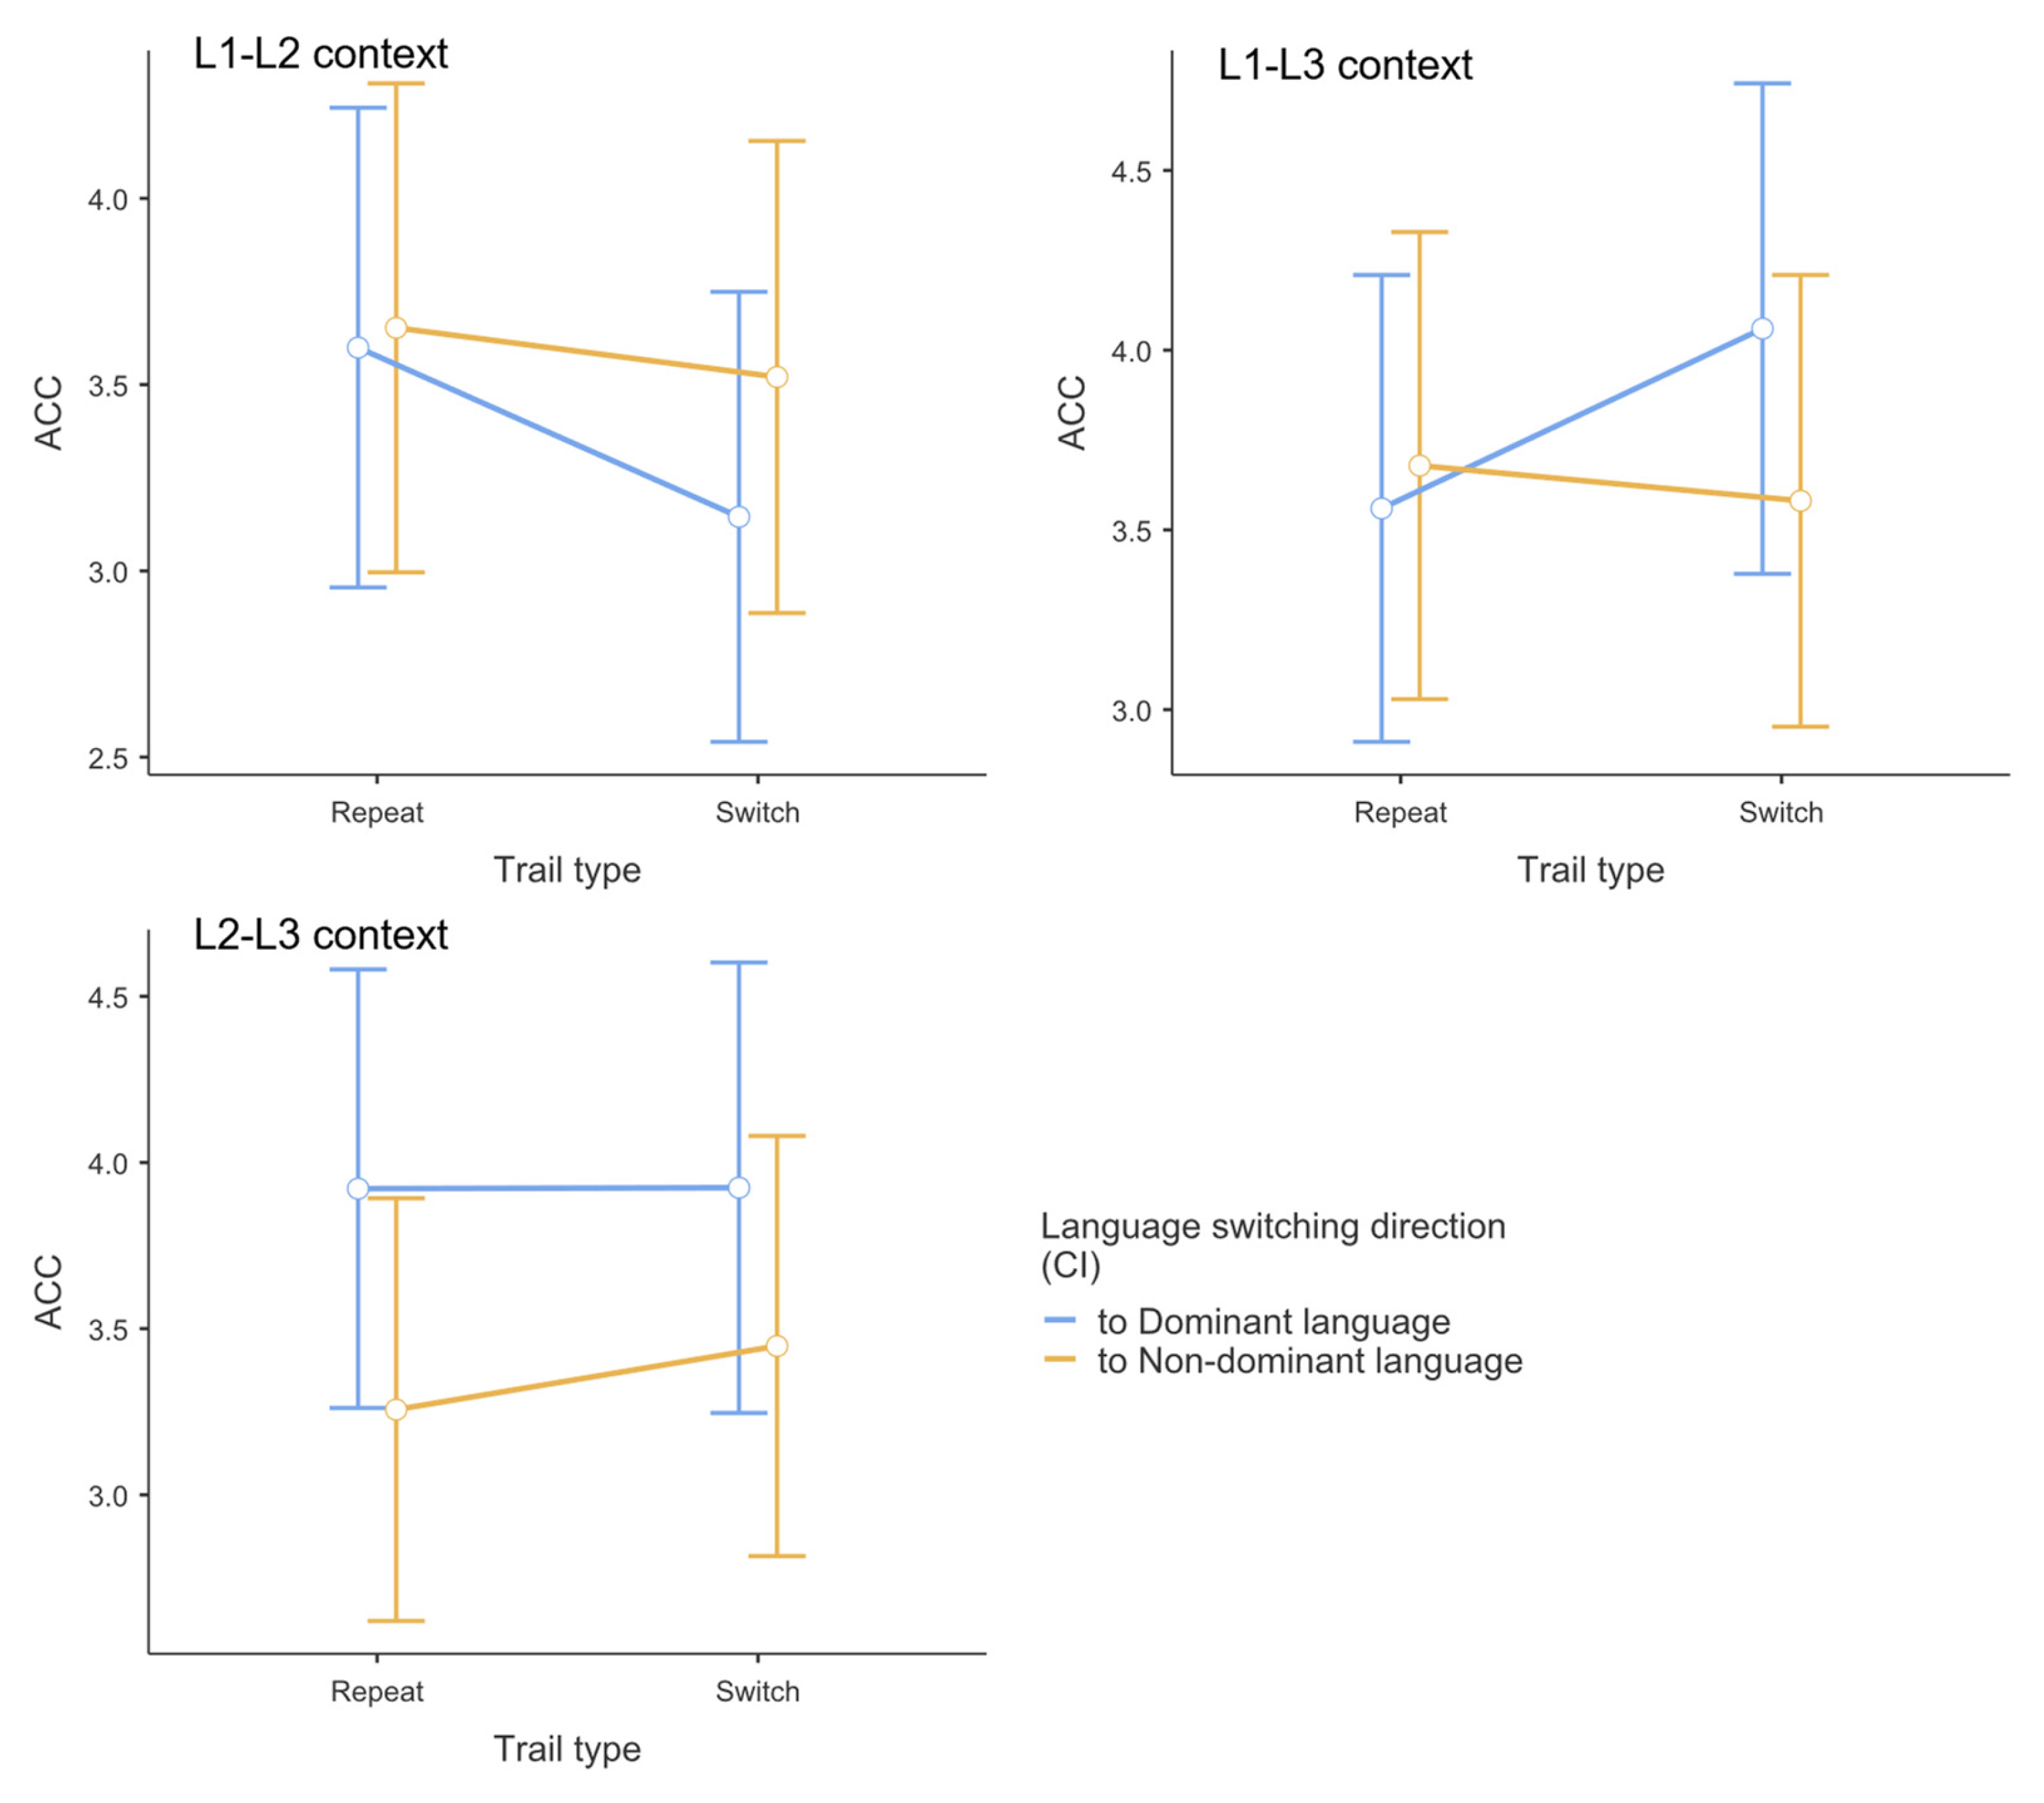
Figure 4.
Drift-diffusion model (DDM) parameter estimates for word-picture matching tasks by context. Mean parameter estimates and 95% confidence intervals are shown for drift rate for word-picture matches (top left), drift rate for word-picture mismatches (top right), starting point (middle left), boundary separation (middle right), and non-decision time (bottom). Data are presented separately for each dual context condition (L1-L2, L1-L3, L2-L3). Error bars represent 95% confidence intervals of the mean (n = 36).
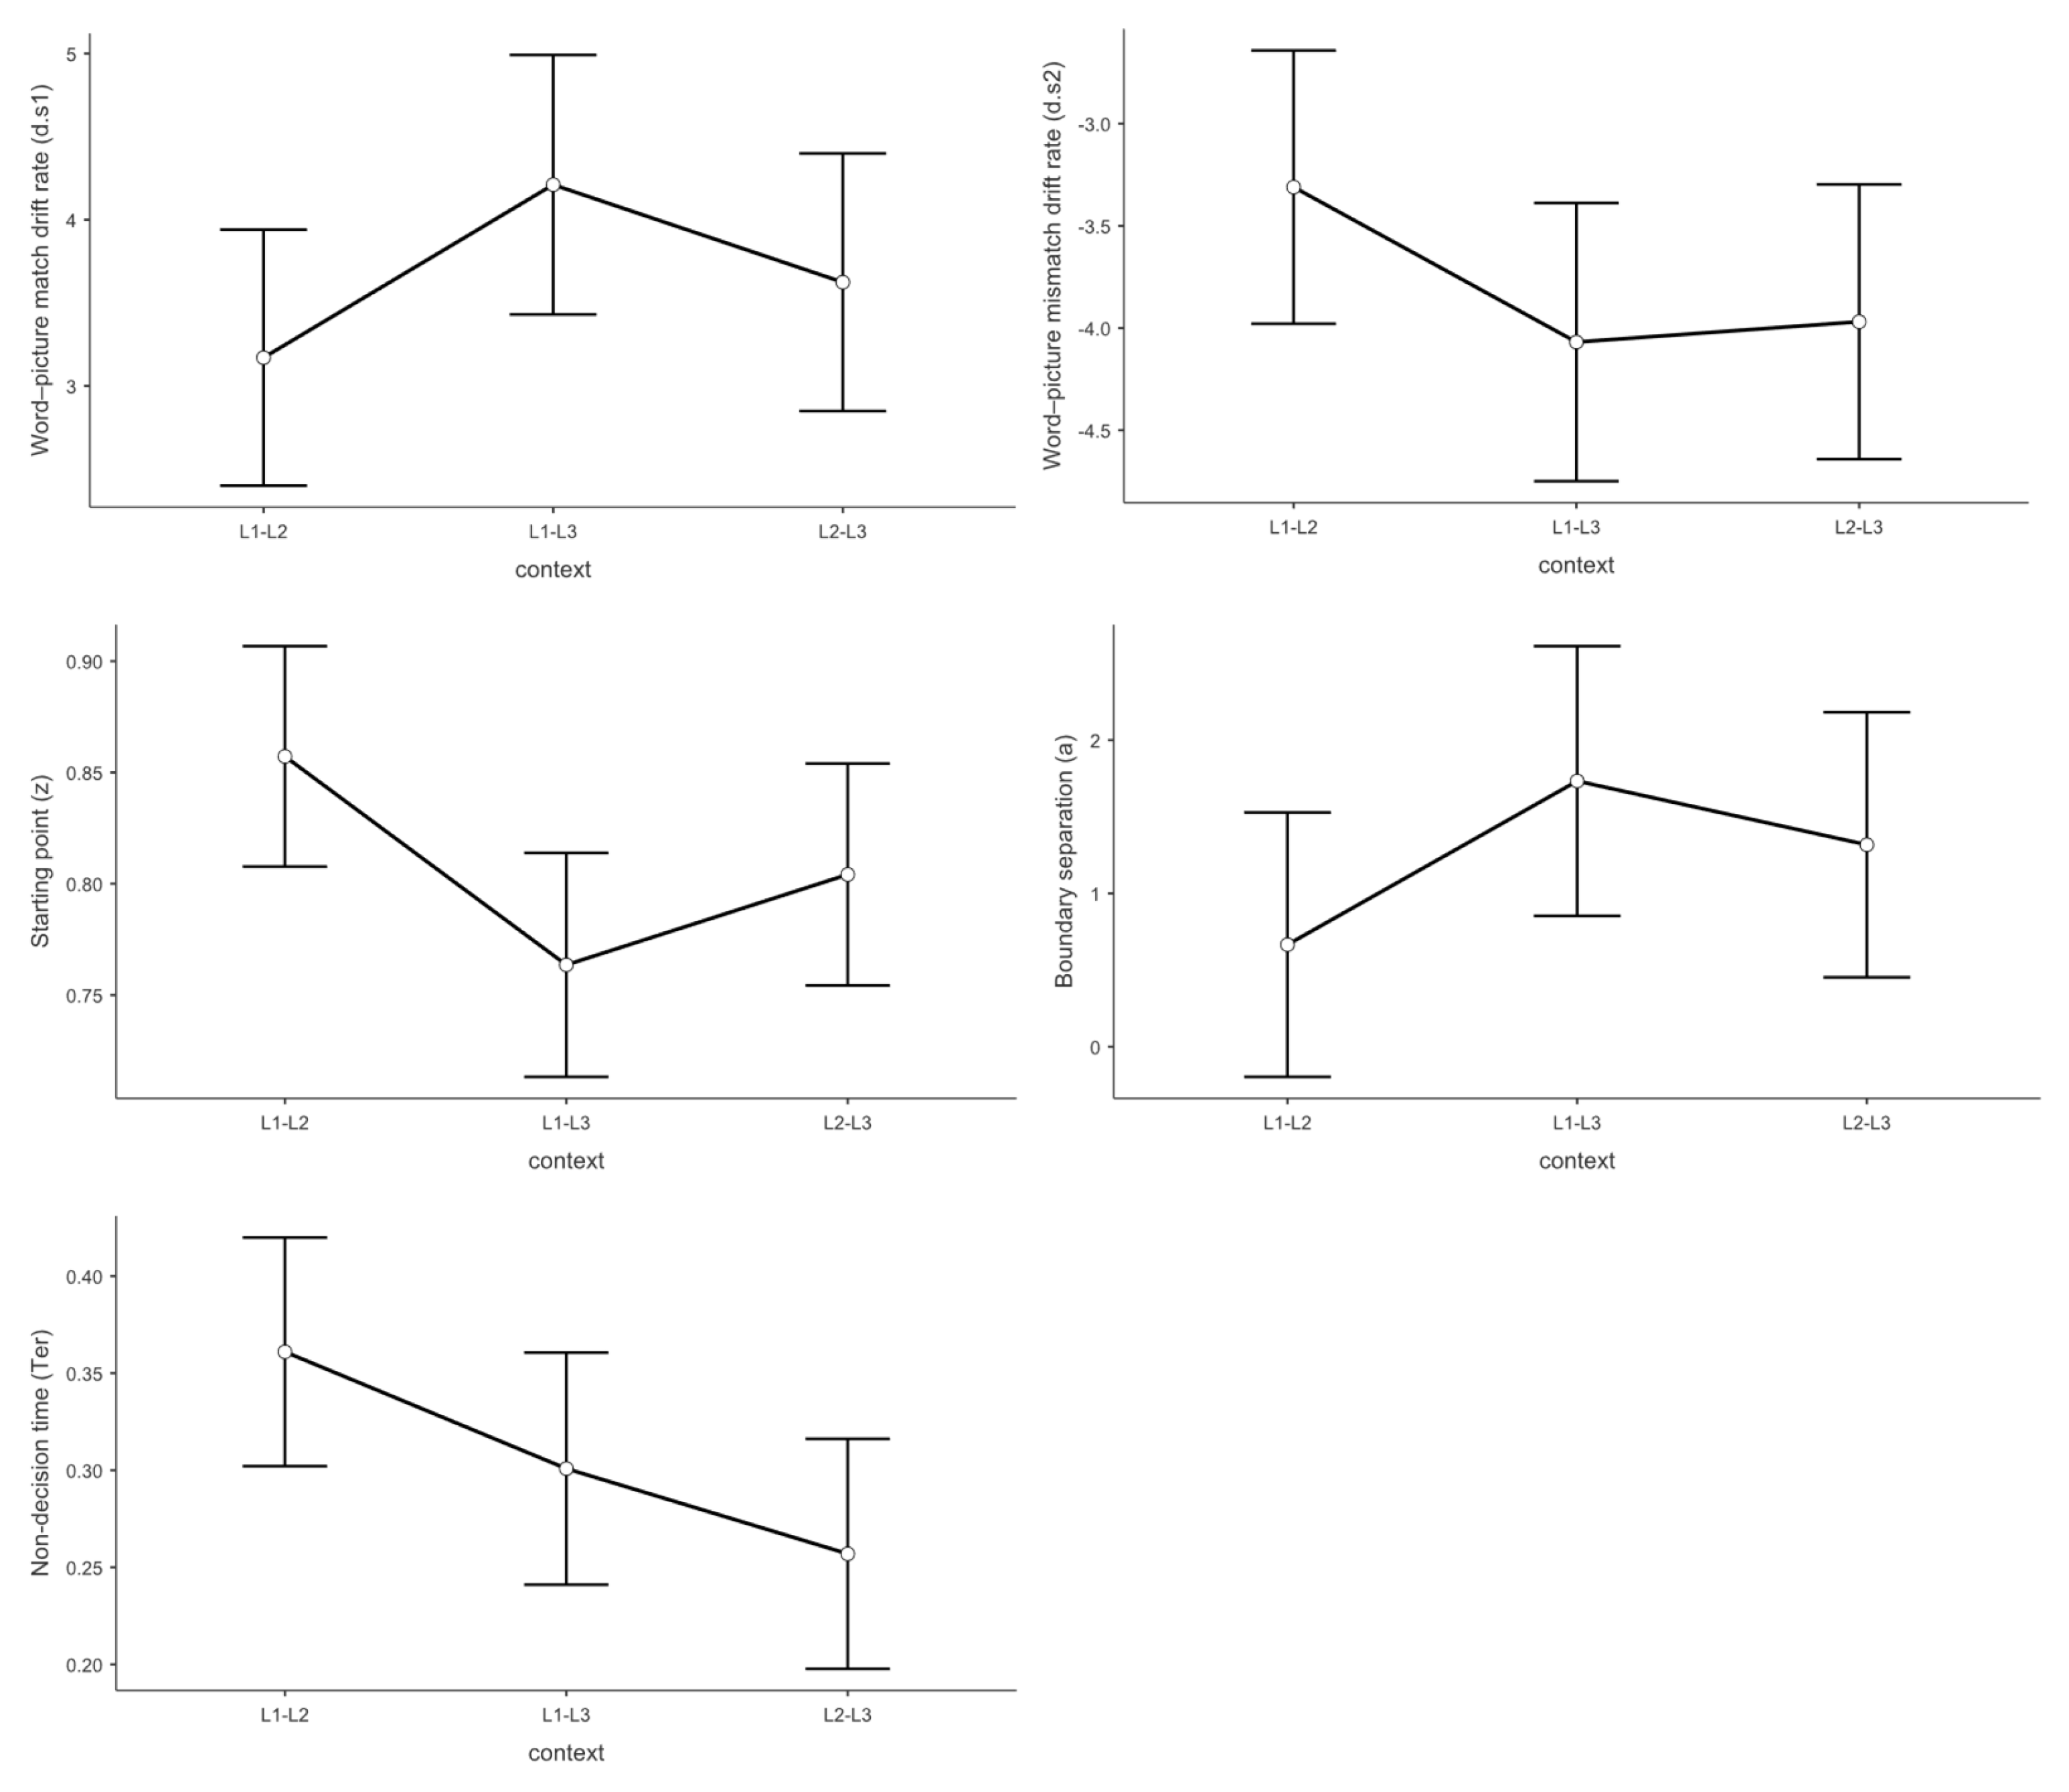
Figure 5.
Drift-diffusion model (DDM) parameter estimates for word-picture matching tasks by trial type.
Figure 5.
Drift-diffusion model (DDM) parameter estimates for word-picture matching tasks by trial type.
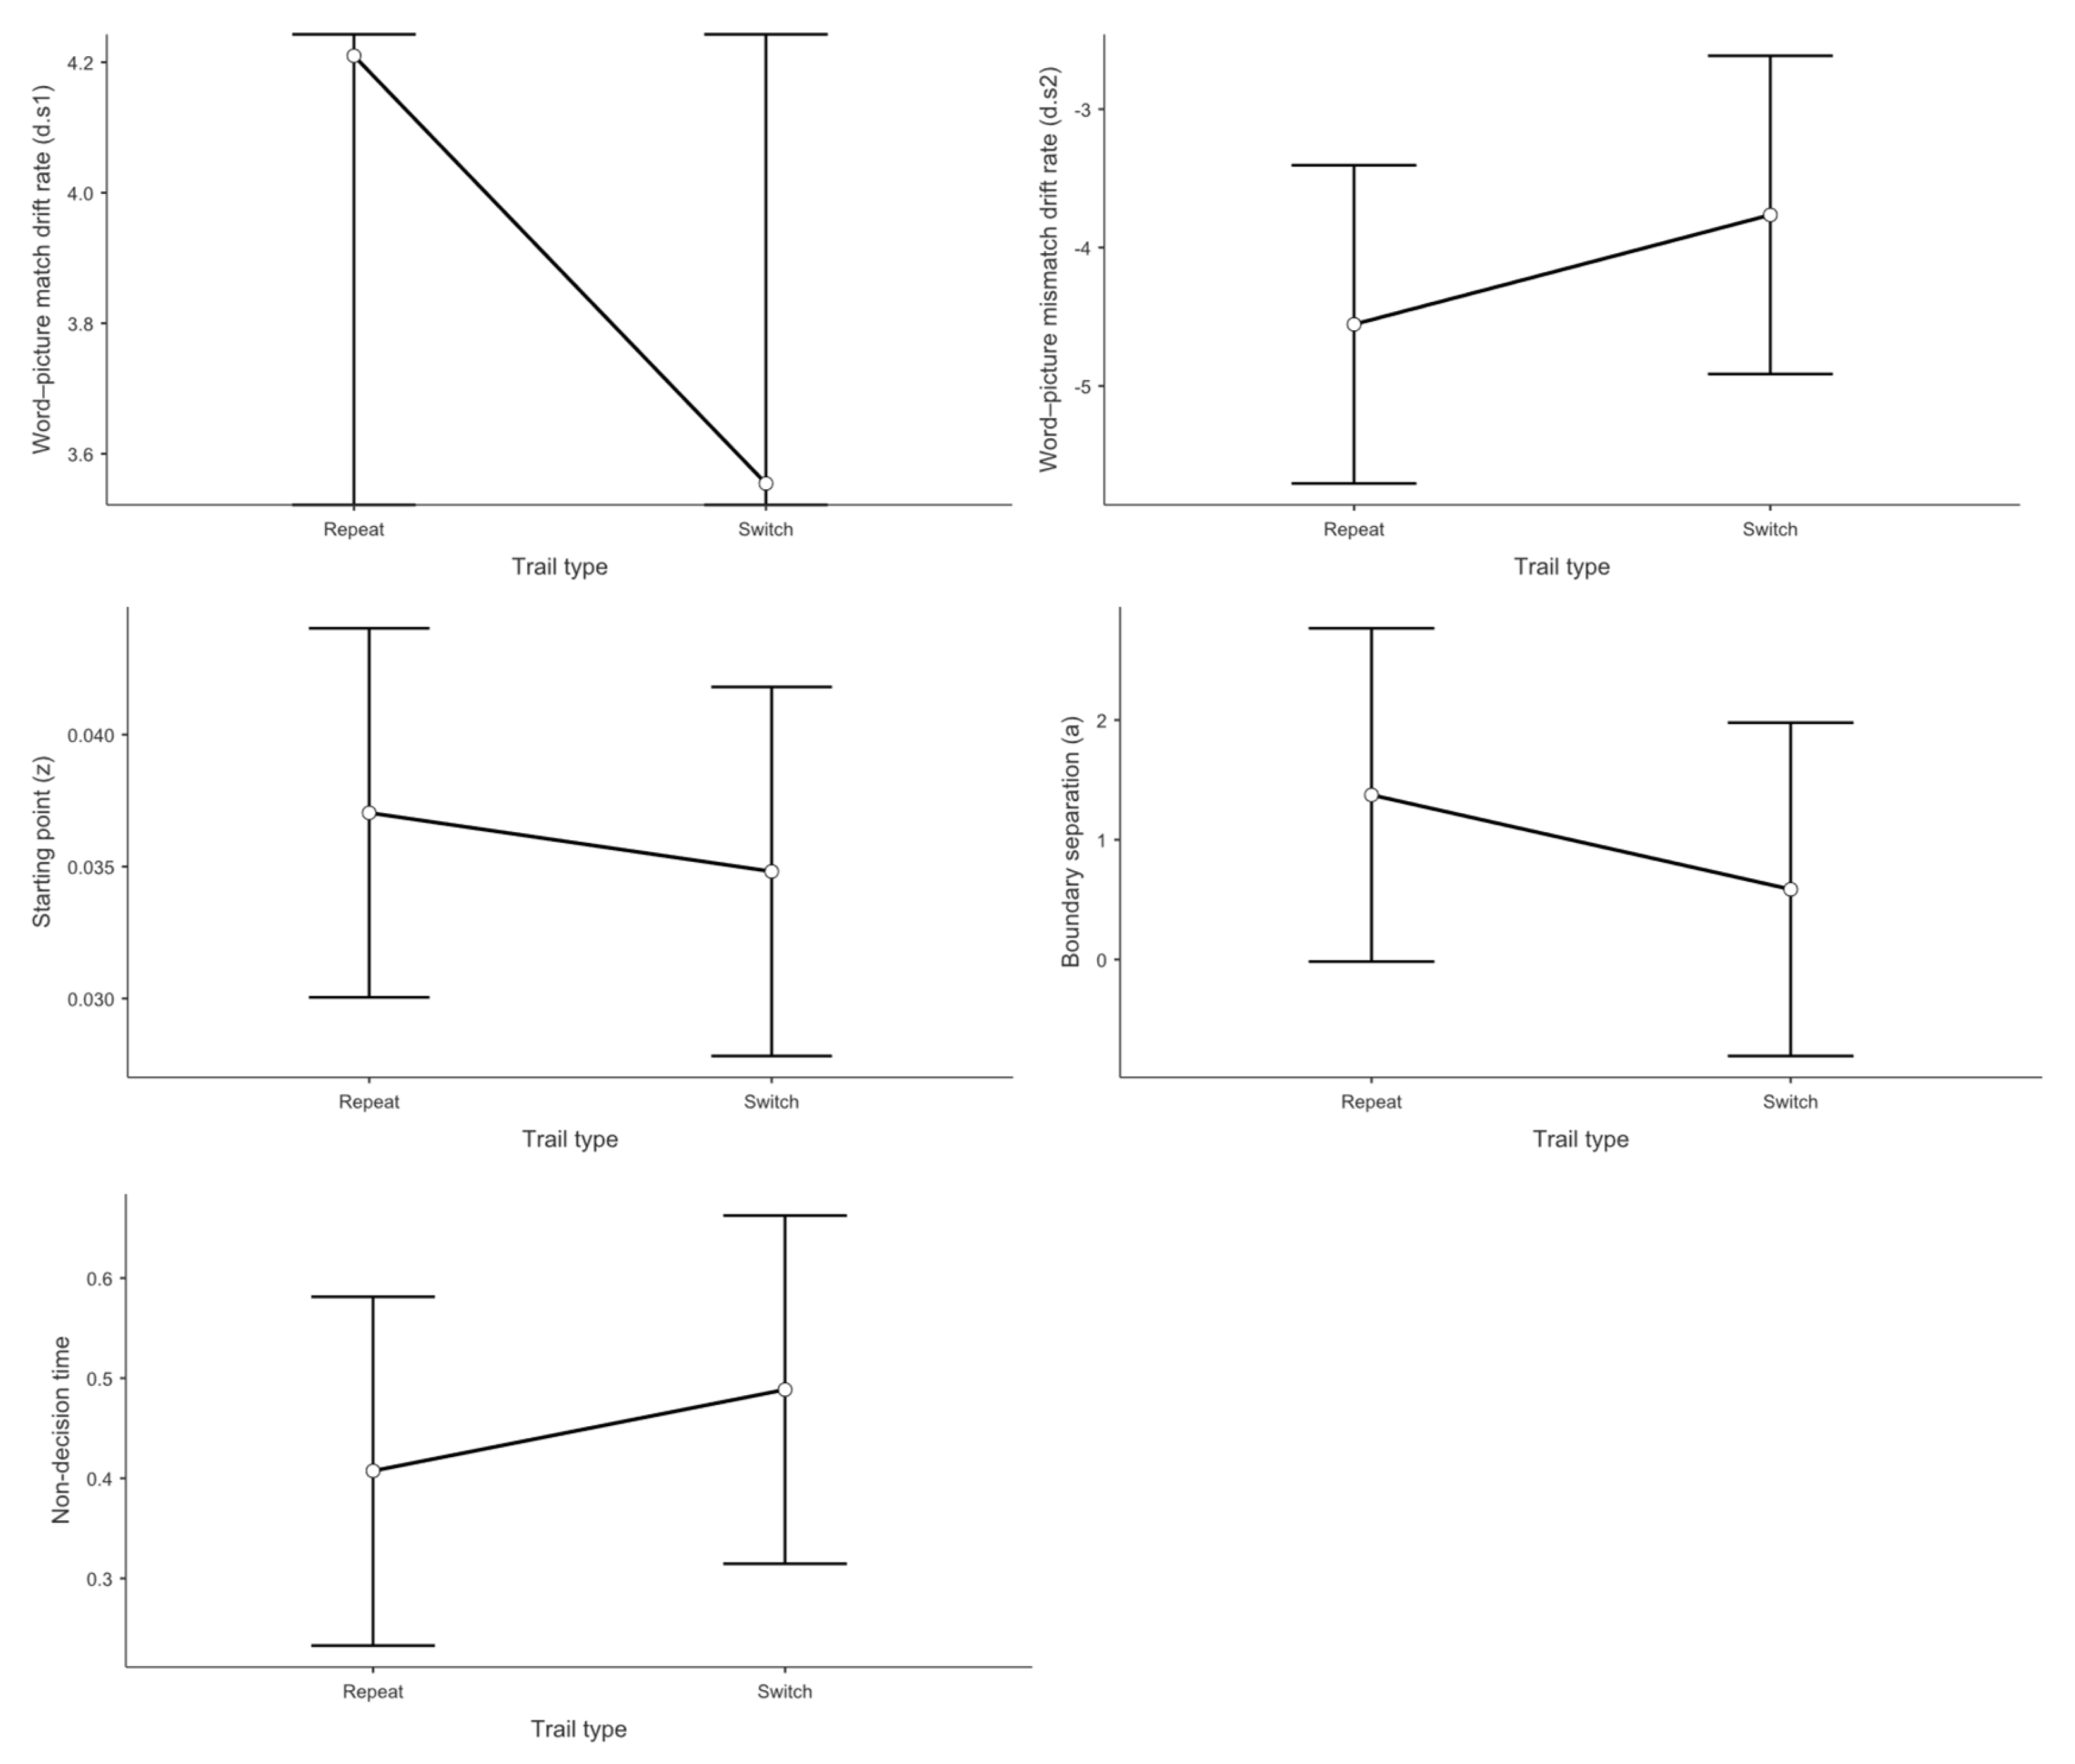
Figure 6.
Drift-diffusion model (DDM) parameter estimates for word-picture matching tasks by language switching direction.
Figure 6.
Drift-diffusion model (DDM) parameter estimates for word-picture matching tasks by language switching direction.
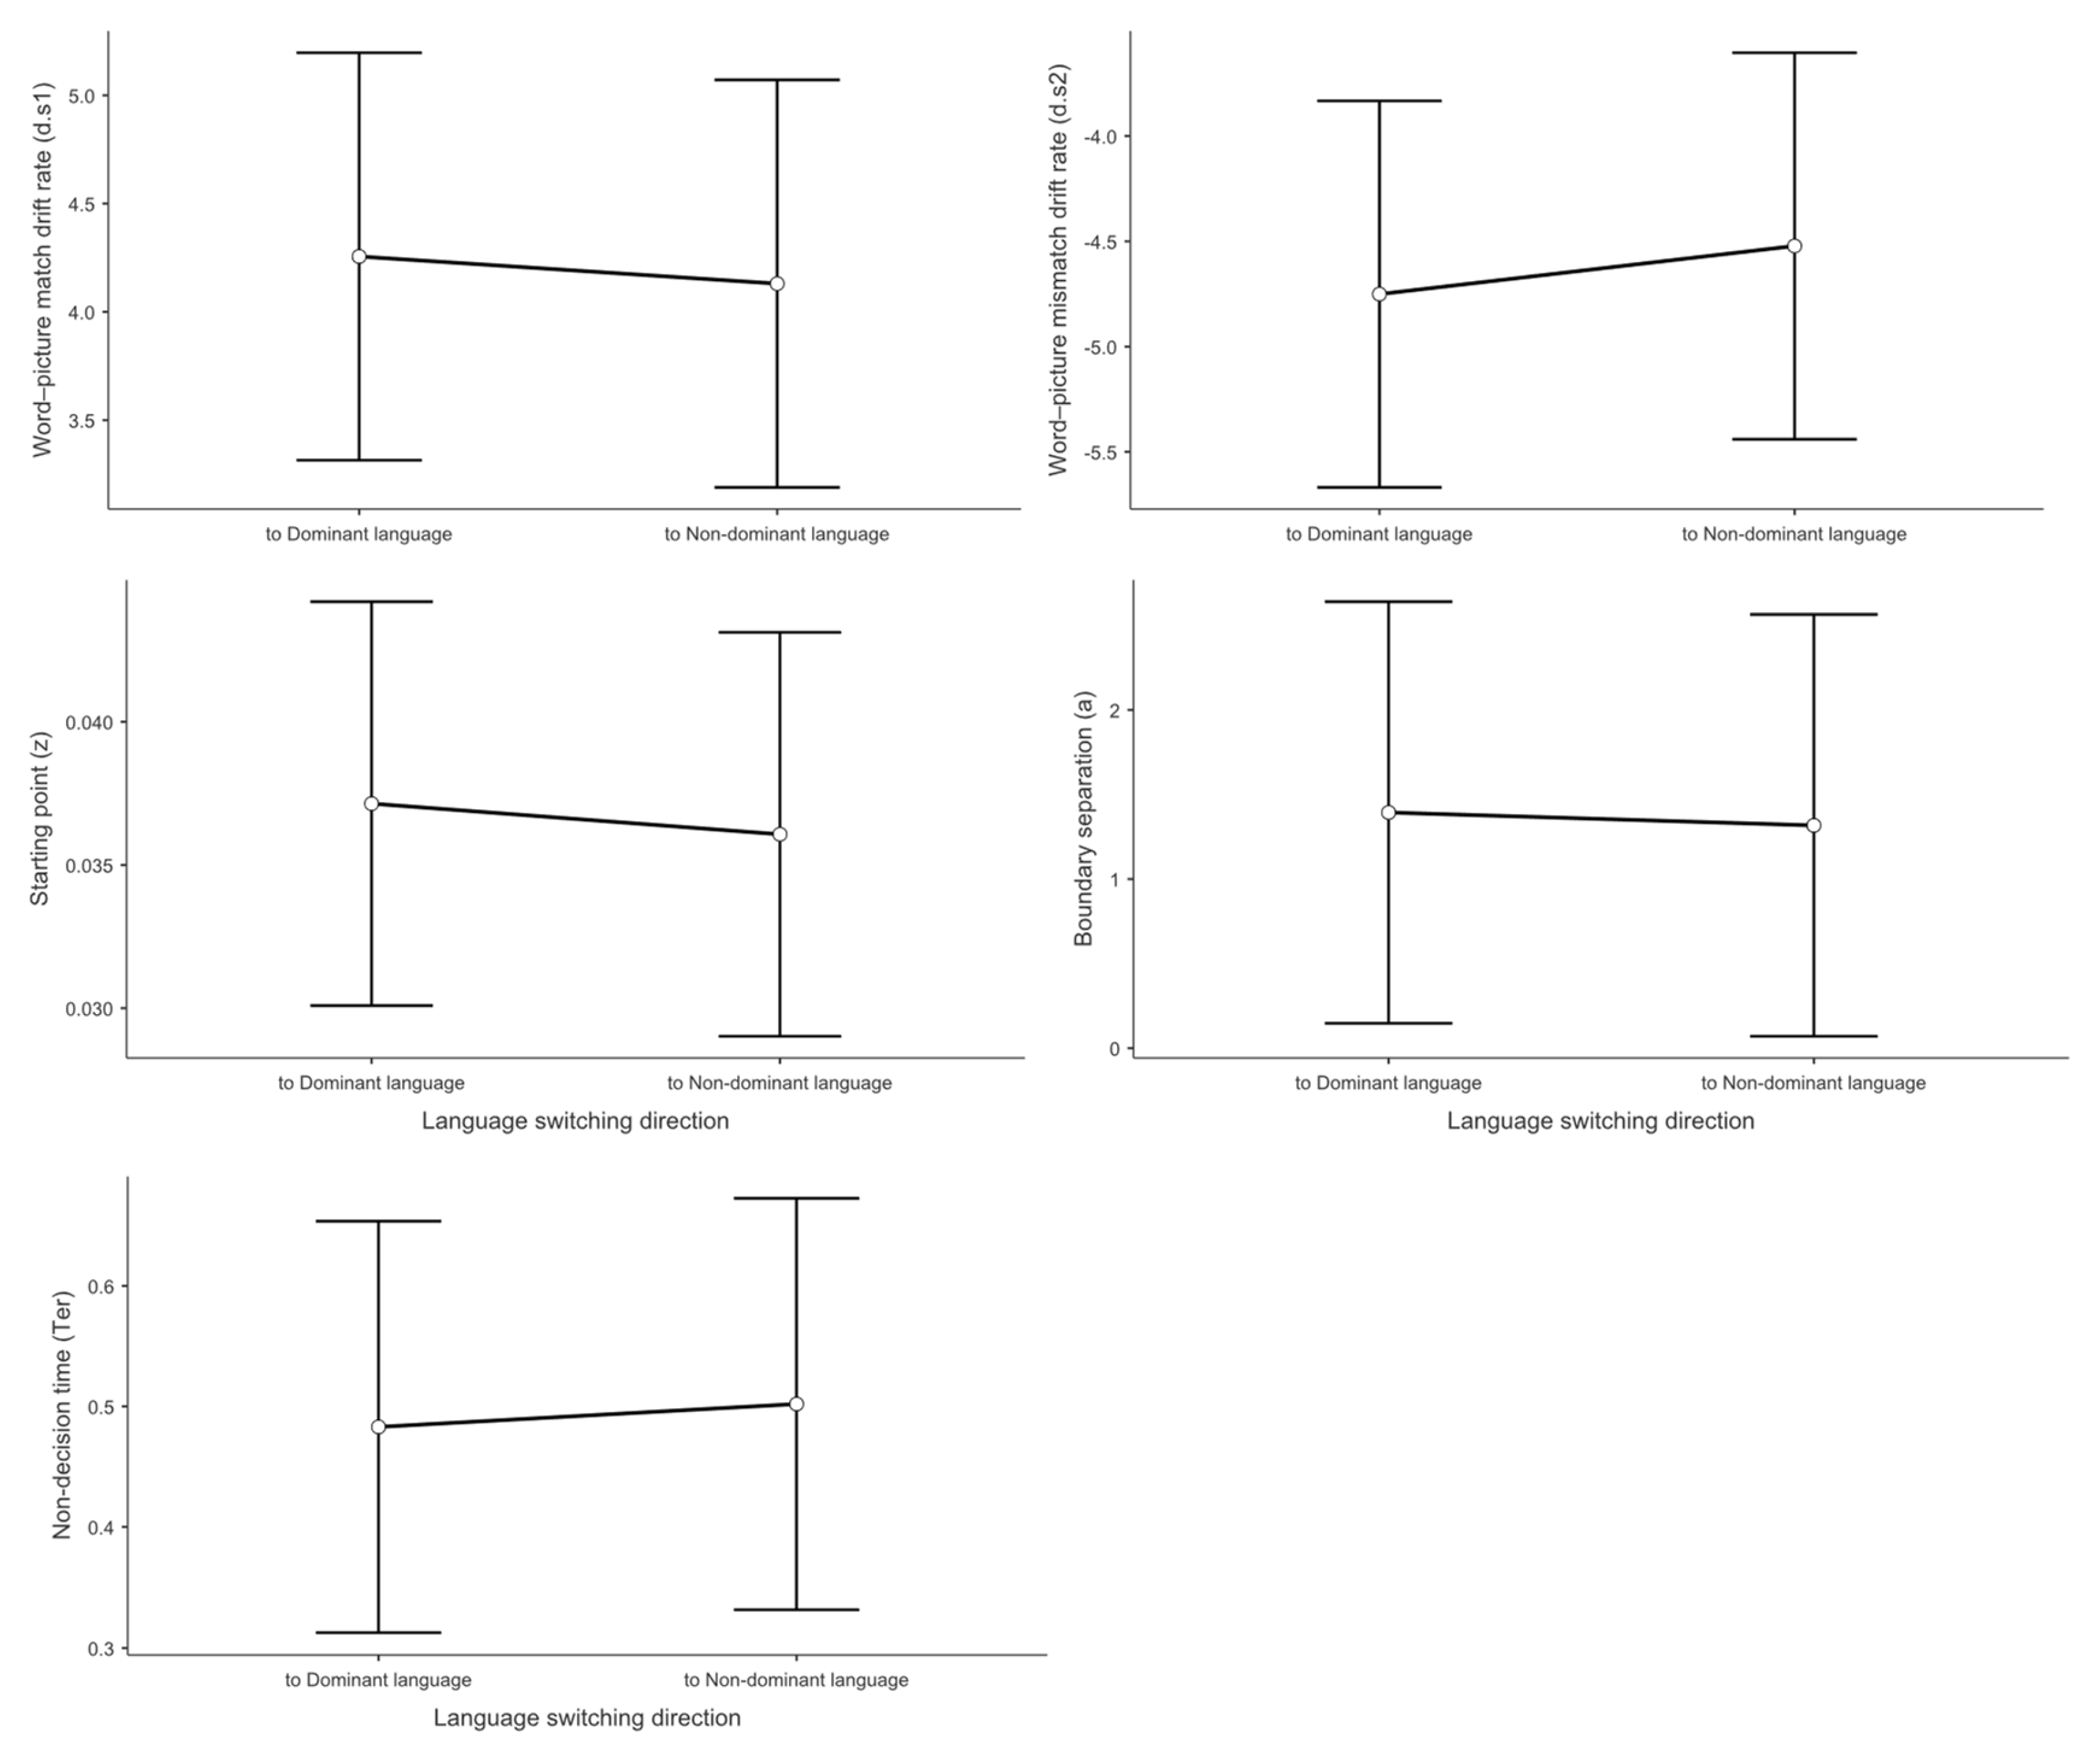
Figure 7.
Event-related potentials and scalp topography showing main effects of context, switching direction, and trial type. (A) Grand-averaged event-related potentials (ERPs) across experimental conditions. Waveforms represent averaged signals from centro-parietal electrodes (PZ, CPZ, CZ) and frontal electrodes (FCZ, FZ) as specified in Methods. Thick portions of ERP traces indicate time windows with significant differences (p < 0.01, cluster-based permutation test; exact p-values reported in main text). Colored horizontal bars along the x-axis denote components significantly different from baseline (0 μV). Shaded areas represent ± standard error of the mean (SEM). Red and green traces show original waveforms for experimental conditions; indigo traces show difference waves. Rows display (top to bottom): main effect of context, main effect of switching direction, and main effect of trial type. (B) Scalp topography maps showing voltage distributions during statistically significant time windows for each experimental condition. Maps represent the spatial distribution of electrical activity averaged across the identified time windows from Panel A. Abbreviations: Non-dom, switch to non-dominant language; Dom, switch to dominant language.
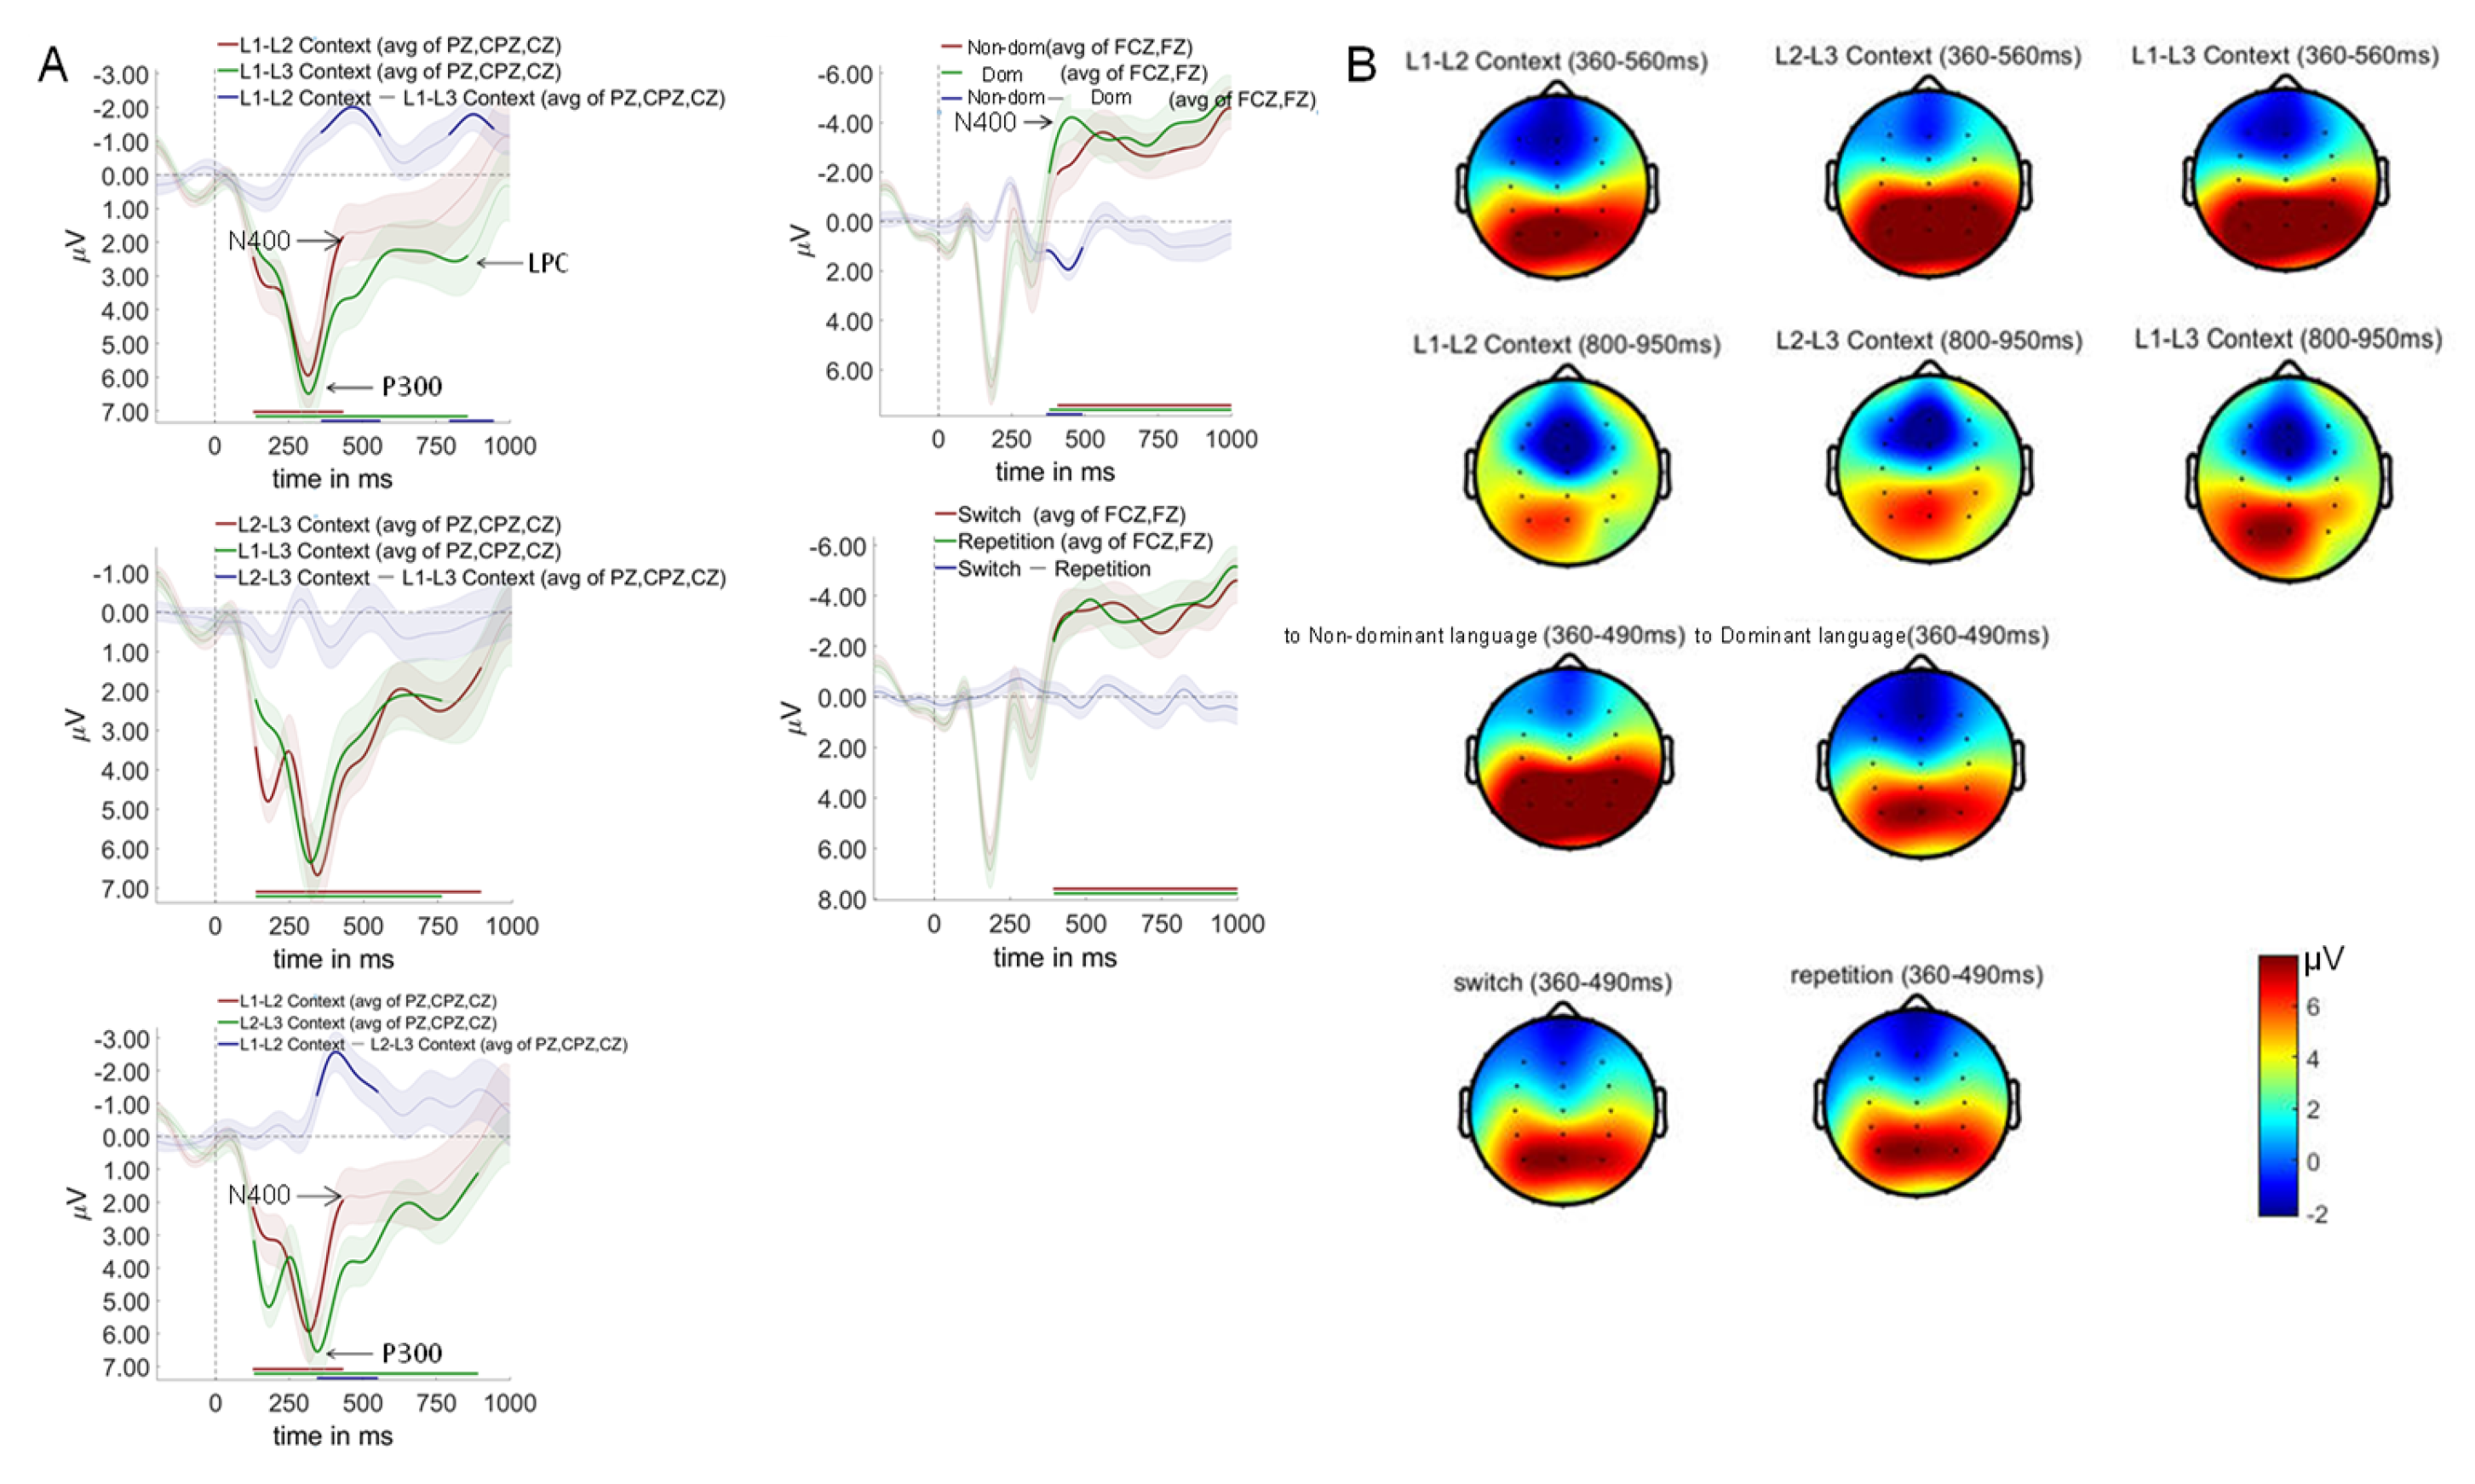
Figure 8.
Event-related potentials for language switching directions across dual-language contexts. Red and green traces show original waveforms for switch to non-dominant language and switch to dominant language conditions, respectively; indigo traces show difference waves (switch to non-dominant language minus switch to dominant language). (A) L1-L2 context. Upper: ERP waveforms and difference waves. Lower: Scalp topography maps for the 300-500 ms time window. (B) L2-L3 context. Upper: ERP waveforms and difference waves. Lower: Scalp topography maps for the 300-500 ms time window. (C) L1-L3 context. Upper: ERP waveforms and difference waves. Lower: Scalp topography maps for the statistically significant time window (300-500 ms).
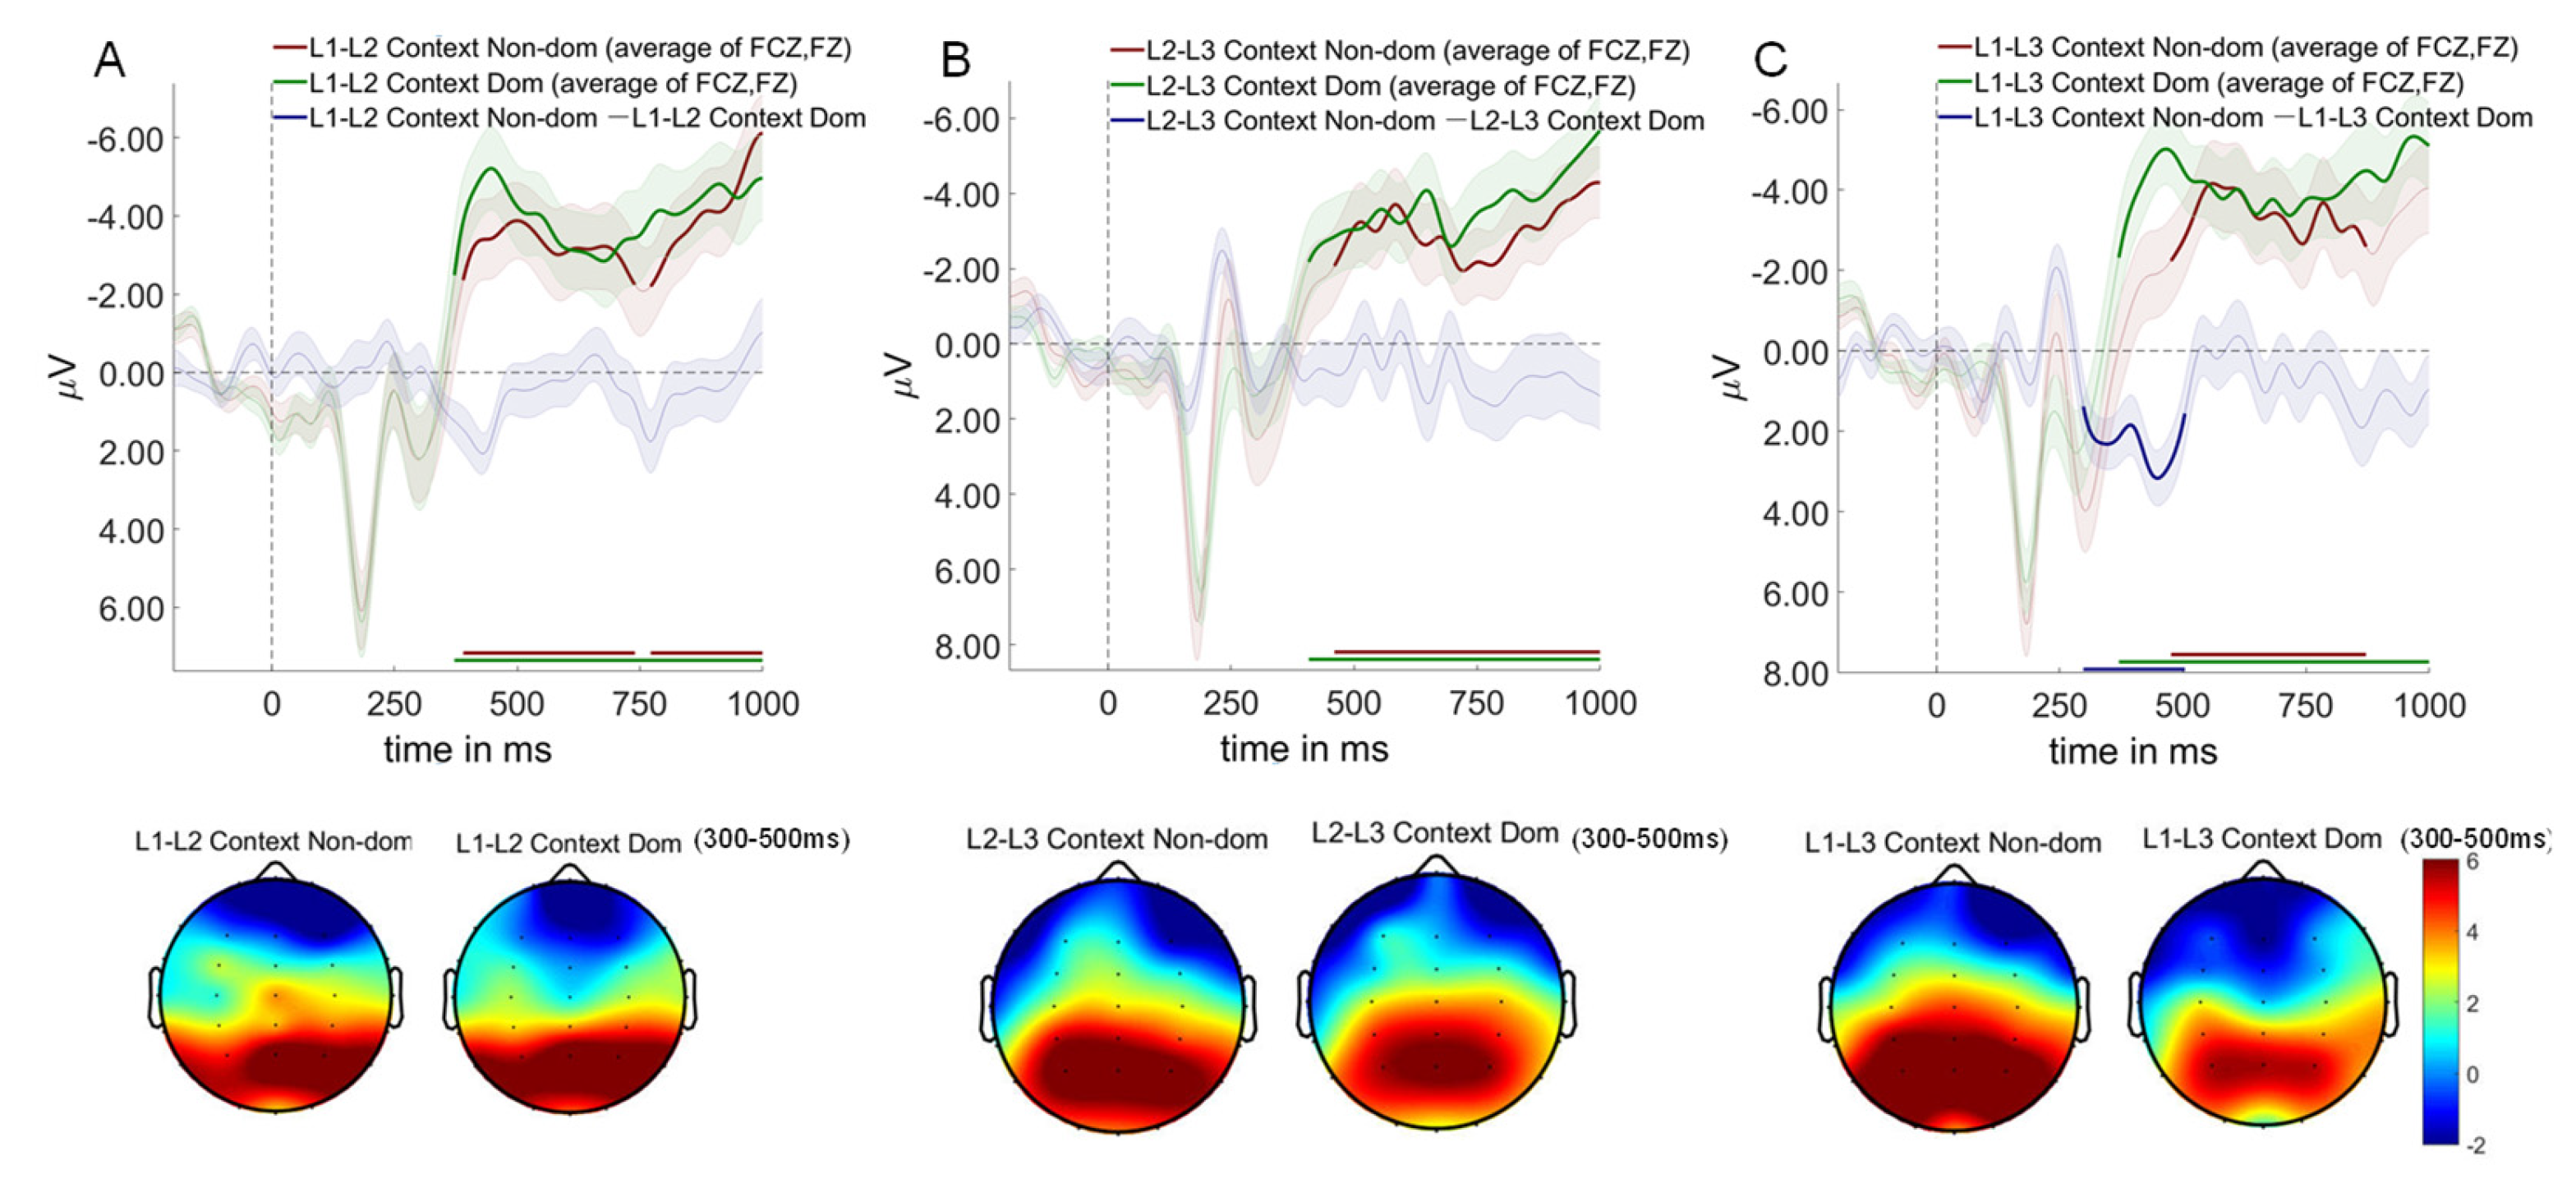
Figure 9.
Event-related potentials comparing switch and repeat trials across dual-language contexts and switching directions. Red and yellow traces show switch trial waveforms; green and blue traces show repeat trial waveforms; indigo and purple traces show difference waves (switch minus repeat trials). (A) L1-L2 context. ERP waveforms and difference waves for four conditions: switch to dominant language (L2-L1 switch and L1-L1 repeat) and switch to non-dominant language (L1-L2 switch and L2-L2 repeat). (B) L2-L3 context. ERP waveforms and difference waves for four conditions: switch to dominant language (L3-L2 switch and L2-L2 repeat) and switch to non-dominant language (L2-L3 switch and L3-L3 repeat). (C) L1-L3 context. ERP waveforms and difference waves for four conditions: switch to dominant language (L3-L1 switch and L1-L1 repeat) and switch to non-dominant language (L1-L3 switch and L3-L3 repeat).
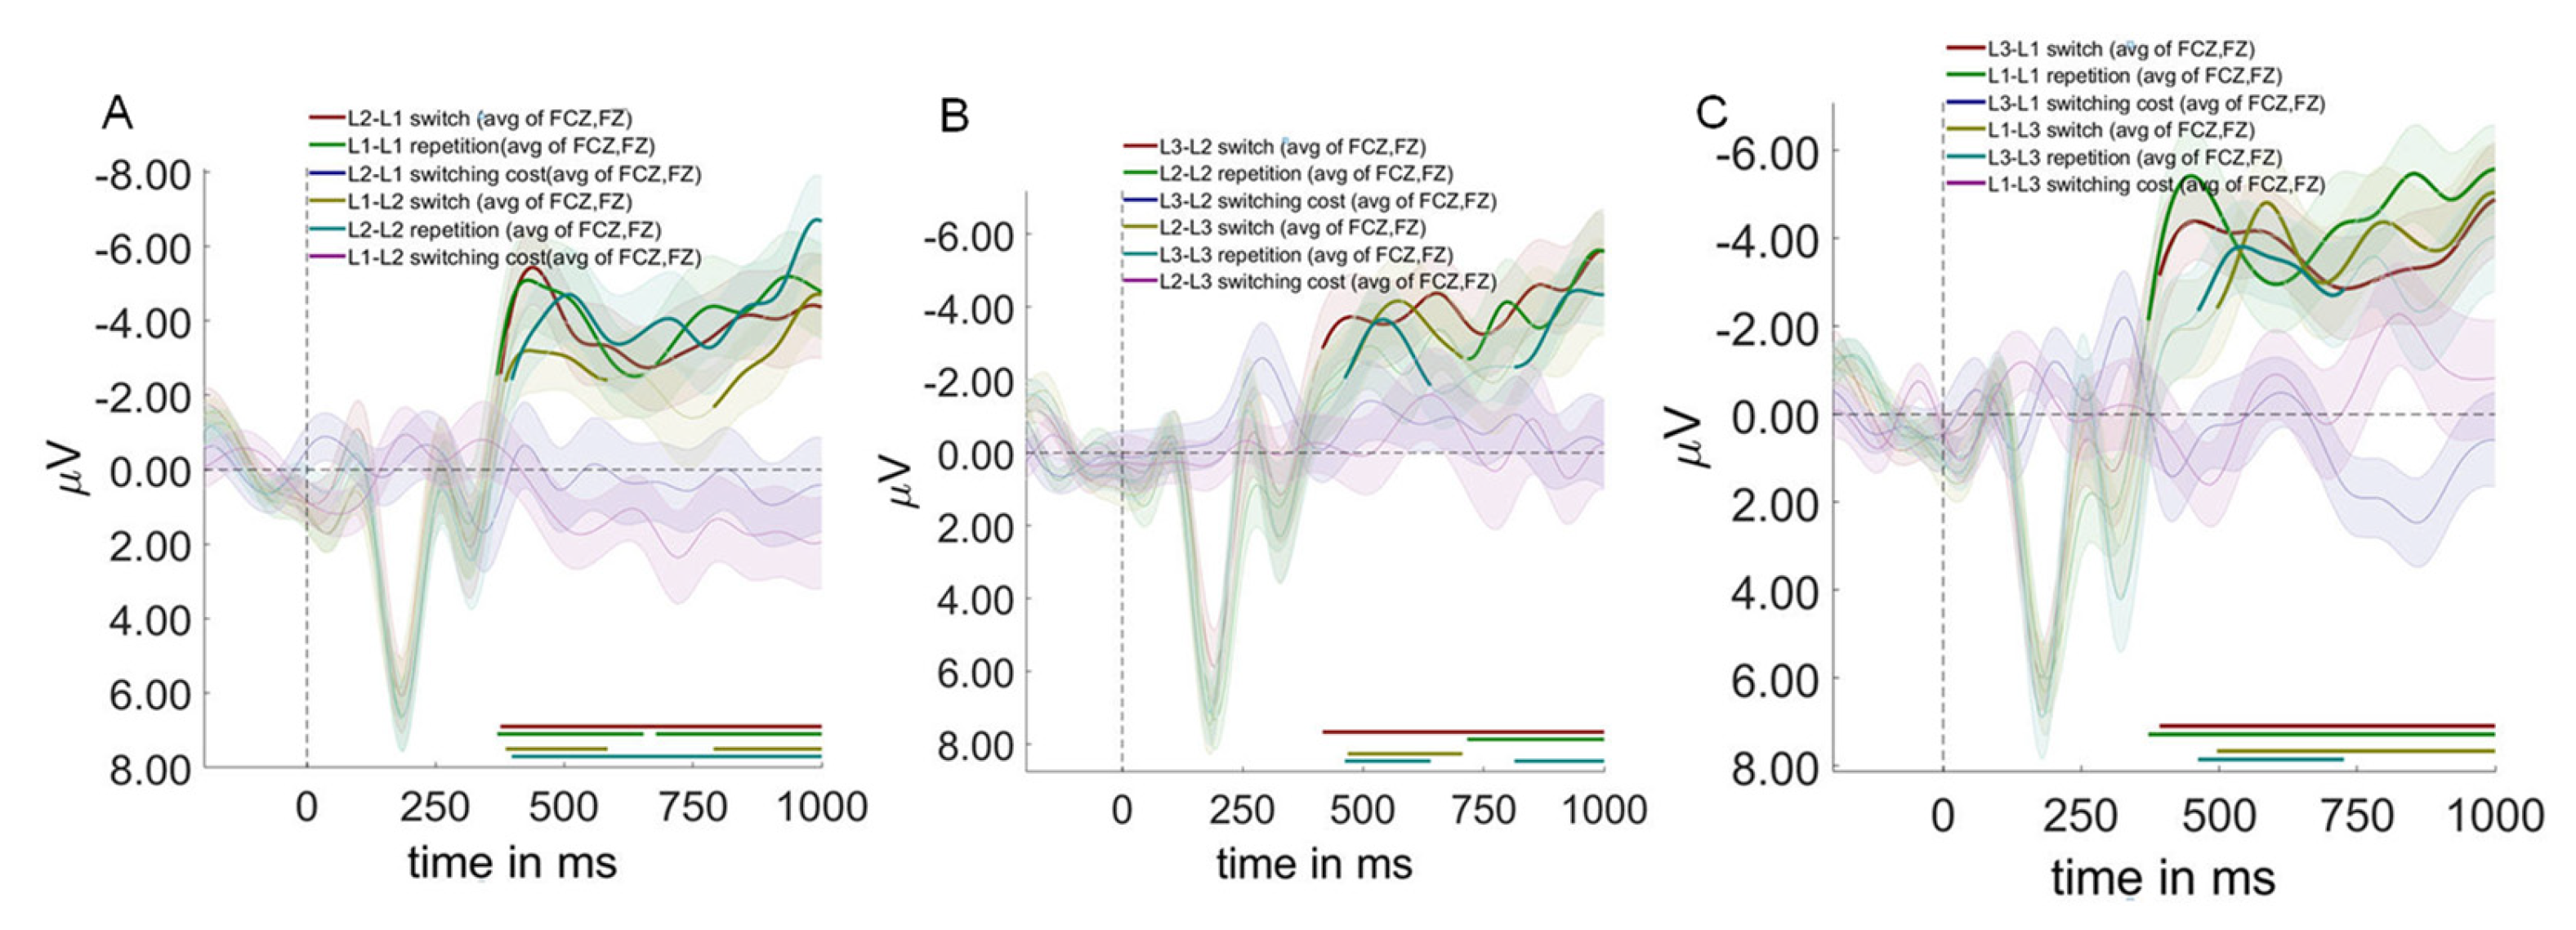
Figure 10.
Multivariate pattern analysis results for experimental conditions. (A) Diagonal decoding accuracy. Time courses of classification performance (AUC) for main effects of context (top row), switching direction (bottom left), and trial type (bottom right). Diagonal decoding reflects classification ability when training and testing times are identical. Bold lines indicate significant clusters (p < 0.05, cluster-based permutation test, two-tailed, multiple comparisons corrected). Shaded areas represent ±SEM. Colored horizontal bars denote time windows with above-chance classification performance (>50%). (B) Activation patterns at peak decoding accuracy. Spatial distributions of discriminative neural activity derived from weight projections (weight vectors × covariance matrices; [42]) and spatially standardized. Top row: context main effects (L1-L2 vs. L2-L3, L2-L3 vs. L1-L3, L1-L2 vs. L1-L3). Bottom row: switching direction main effect (switch to non-dominant vs. dominant language) and trial type main effect (switch vs. repetition). Bold electrode markers indicate significant clusters (p < 0.05, cluster-based permutation test). (C) Cross-temporal generalization matrices. Classification performance when training at one time point (y-axis) and testing at another (x-axis). Off-diagonal elements reflect temporal stability of discriminative information. Warm colors (red) indicate above-chance performance (AUC > 0.5); cool colors (blue) indicate below-chance performance (AUC < 0.5). Diagonal elements correspond to within-time classification. Arrangement matches Panel A: context main effects (top row), switching direction and trial type (bottom row).
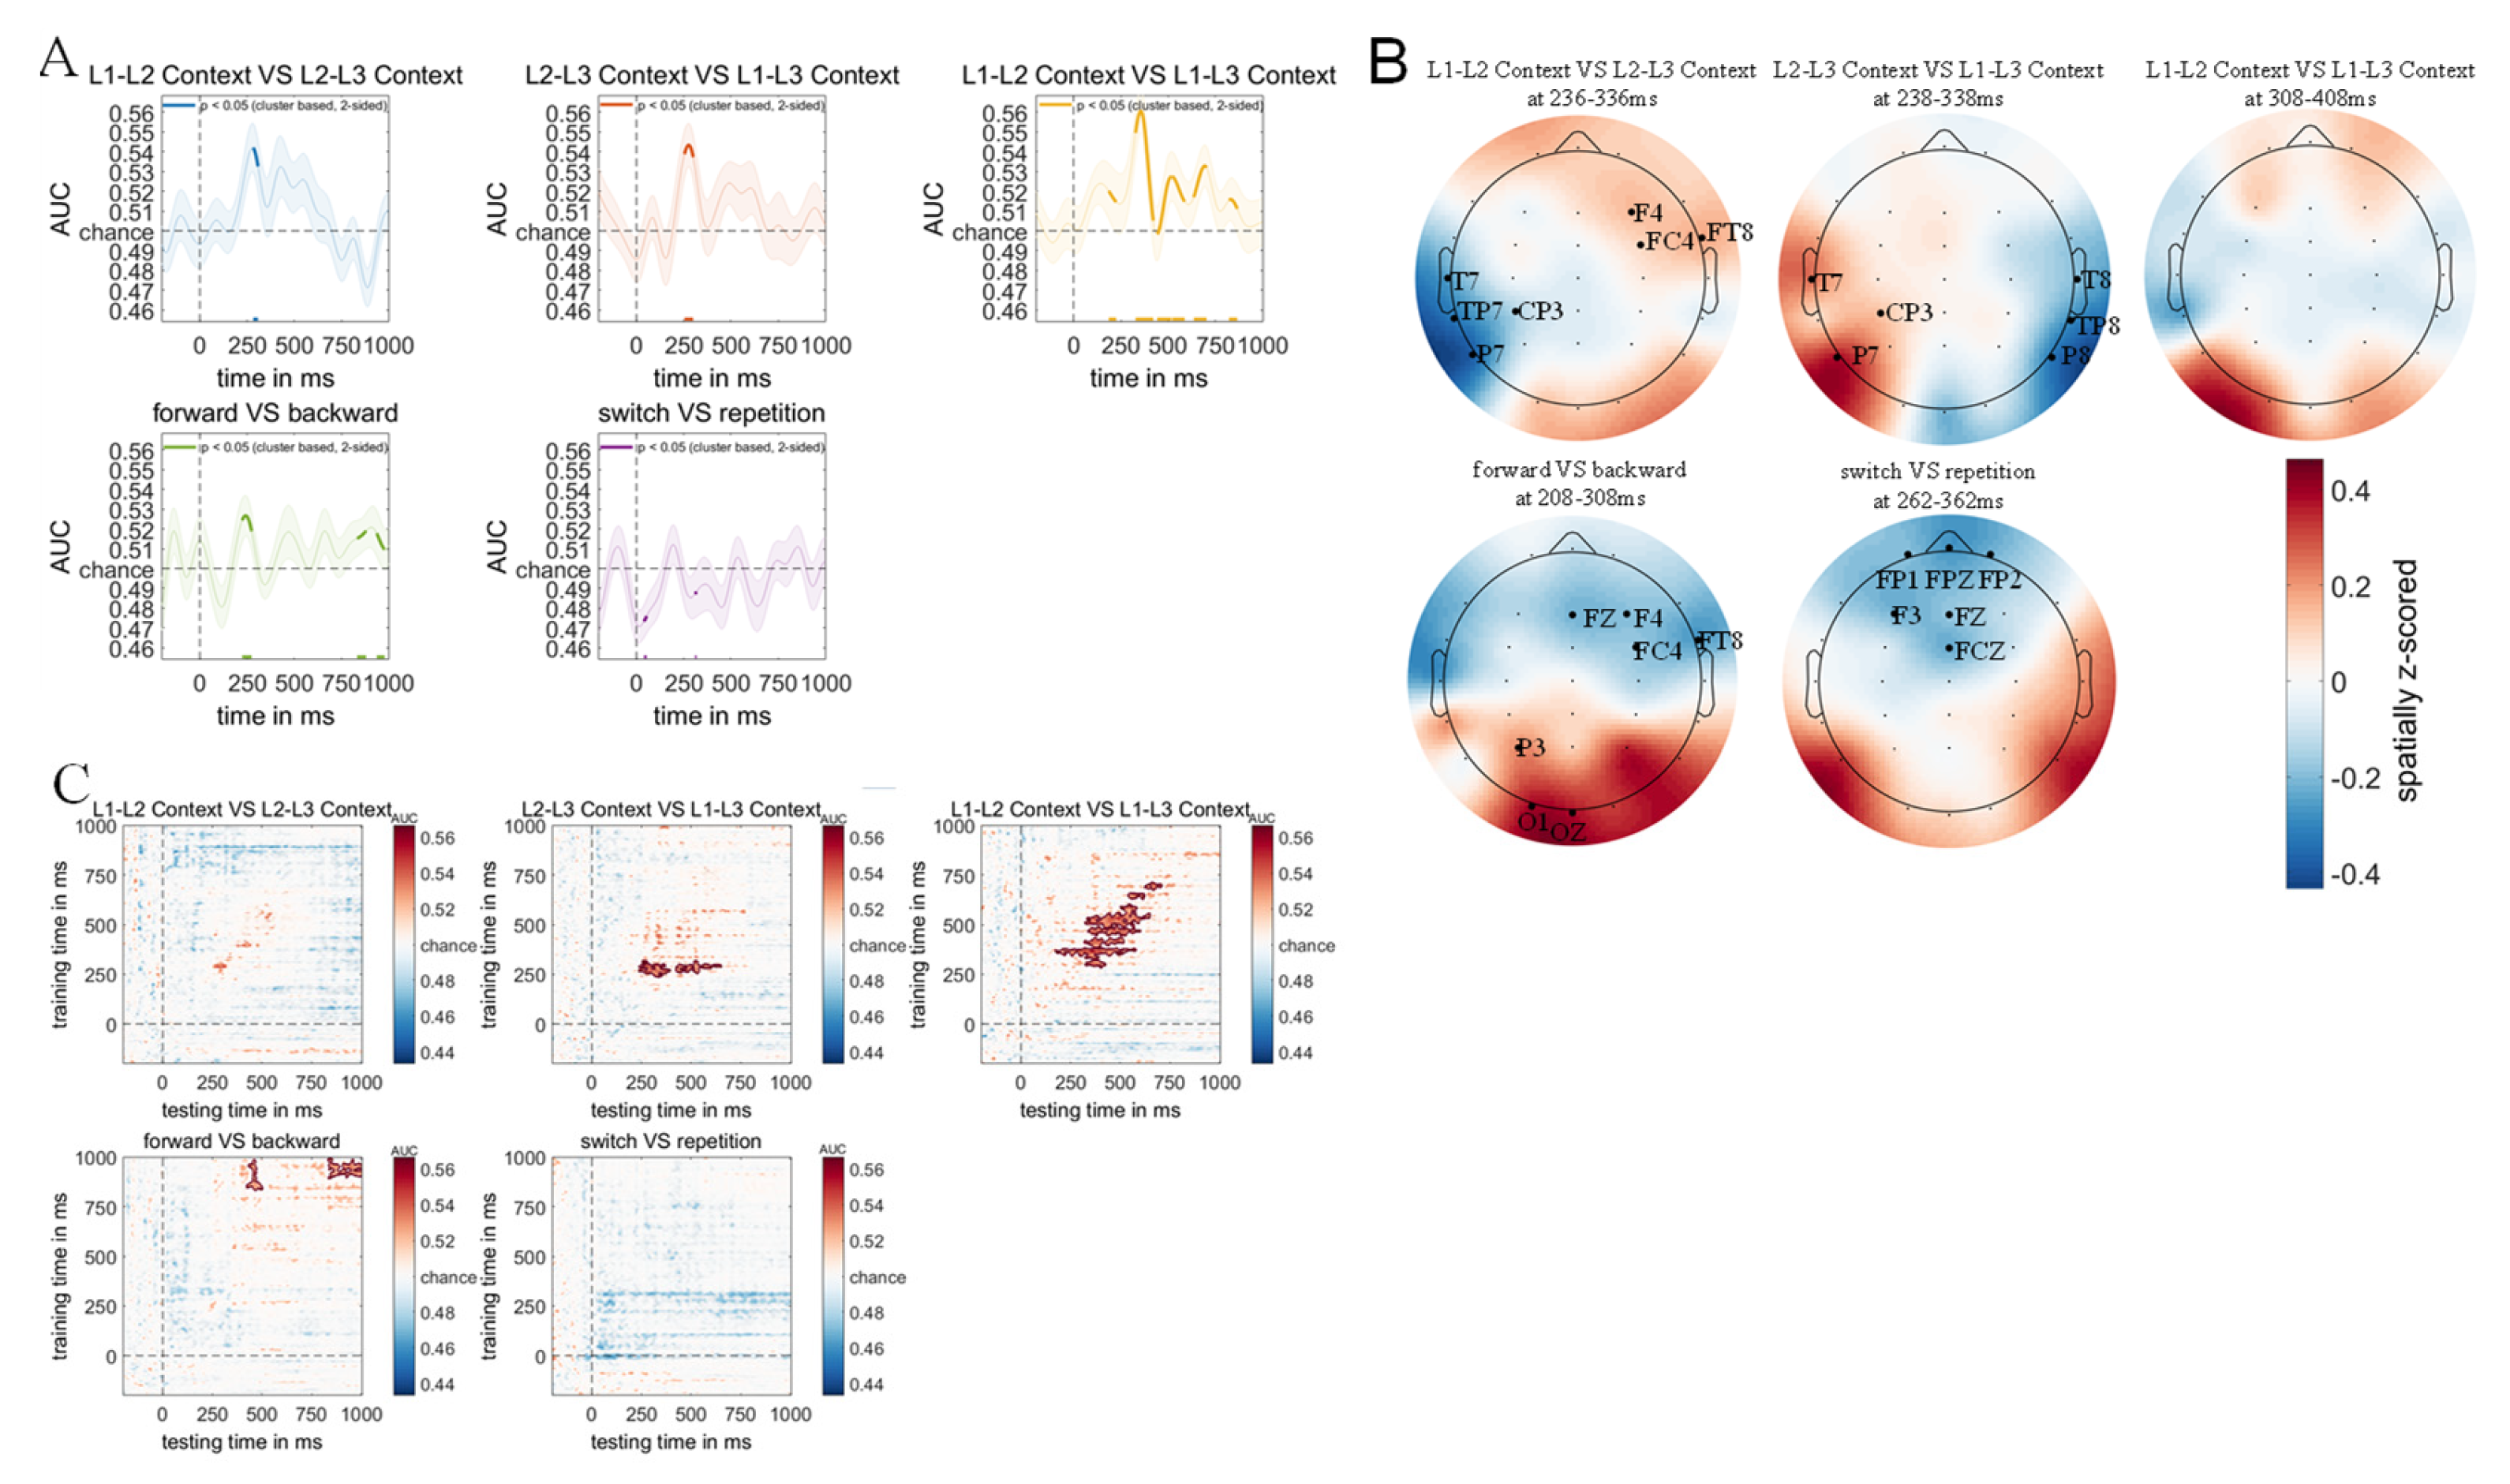
Figure 11.
Predictive relationships between ERP components and drift diffusion model parameters across different dual-language contexts. (A) Participants’ drift rate for “NO” responses as a function of mean N200 amplitude. Blue lines represent L1-L2 context, gray lines represent L1-L3 context, and orange lines represent L2-L3 context. For the linear regression model, the adjusted response function describes the relationship between the fitted response and N200 amplitudes, with other predictors averaged out by averaging the fitted values over the data used in the fit. Adjusted response data points are computed by adding the residual to the adjusted fitted value for each observation. (B) Participants’ boundary separation as a function of mean N400 amplitude. Line colors follow the same convention as Panel A. The adjusted response function describes the relationship between the fitted response and N400 amplitudes, with other predictors averaged out. (C) Participants’ starting point bias as a function of mean LPC amplitude. Line colors follow the same convention as Panel A. The adjusted response function describes the relationship between the fitted response and LPC amplitudes, with other predictors averaged out. (D) Participants’ non-decision time as a function of mean N400 amplitude. Line colors follow the same convention as Panel A. The adjusted response function describes the relationship between the fitted response and N400 amplitudes, with other predictors averaged out.
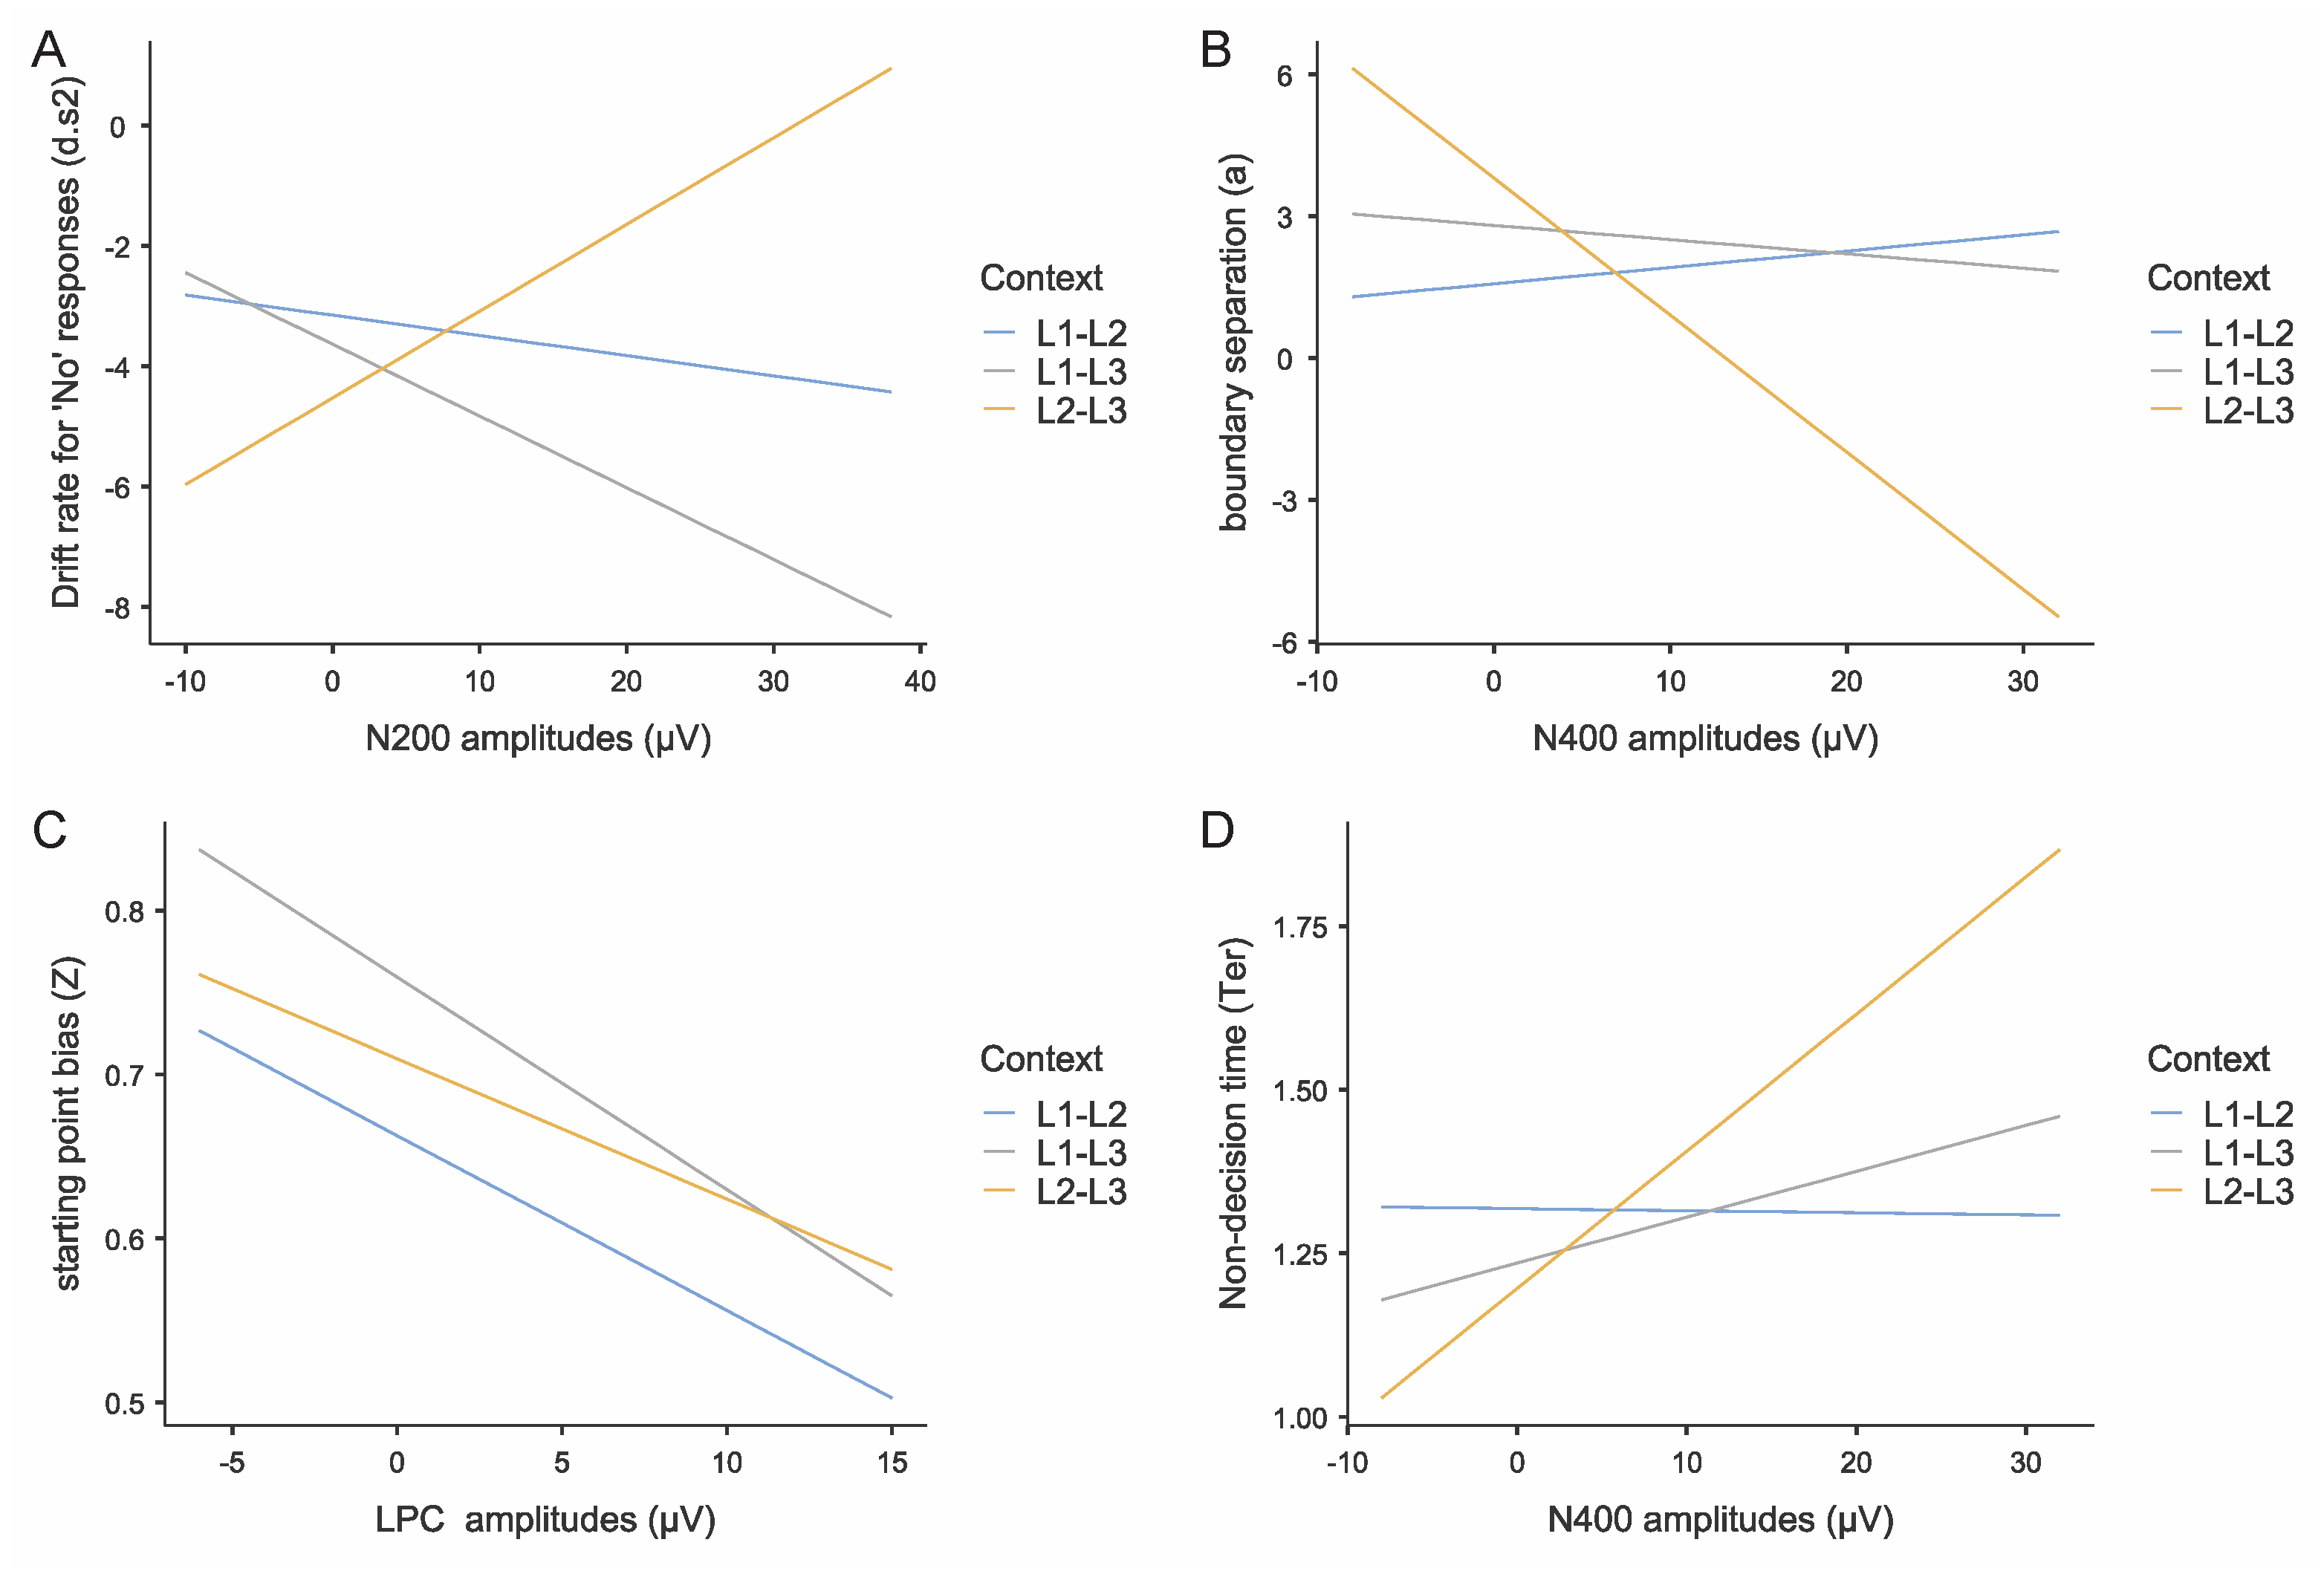

Table 1.
Participant Demographics.
| Characteristic | L1 Uyghur | L2 Chinese | L3 English |
| Age of acquisition (years) M (SD) | 0.68 (1.80) | 5.7 (3.26) | 11.87 (3.40) |
| Exposure (years) M (SD) | 13.46 (5.70) | 6.61 (5.41) | 0 (0) |
| Usage (years) M (SD) | 19.02 (2.60) | 13.94 (3.27) | 8.00 (3.75) |
| Home Use M (SD) | 2.63 (0.76) | 1.45 (0.83) | 0.92 (0.68) |
| Social Use M (SD) | 0.84 (0.79) | 3.12 (0.78) | 1.04 (0.80) |
| Self-ratings of proficiency | |||
| Speaking M (SD) | 9.03 (1.24) | 8.86 (1.20) | 5.48 (1.62) |
| Listening M (SD) | 9.00 (1.22) | 9.10 (1.07) | 5.86 (1.20) |
| Reading M (SD) | 7.65 (2.61) | 9.02 (1.11) | 6.59 (1.69) |
| Writing M (SD) | 6.95 (3.21) | 9.05 (1.12) | 5.97 (1.99) |
| MINT score M (SD) | 63.0 (1.92) | 62.8 (2.10) | 49.8 (3.80) |
| Learning contexts | |||
| Home-only Learning N (%) | 22 (61.11%) | 0 (0%) | 0 (0%) |
| School-only Learning N (%) | 0 (0%) | 30 (83.33 %) | 36 (100%) |
| both N (%) | 14 (38.89%) | 6 (16.67%) | 0 (0%) |
| Medium-of-instruction | |||
| Uyghur N (%) | n/a | 0 (0%) | 0 (0%) |
| Chinese N (%) | n/a | 36 (100%) | 36 (100%) |
1Note. “Age of acquisition” refers to the specific age at which an individual began systematic exposure to and learning of a particular language. “Exposure” refers to the time spent living in a region where the language is predominantly spoken as the primary community language. For participants in this study, L3 English exposure = 0 indicates that none had lived in English-speaking countries (e.g., UK, USA, Australia), despite having received formal English education in school settings. “Usage” was calculated by subtracting the age of acquisition from the current age, excluding periods of non-use. “Home” and “Social” usage were rated on a 0–4 scale, with 0 indicating no usage and 4 indicating exclusive usage. “Self-ratings of proficiency” were evaluated on a 1–10 scale, from no proficiency (1) to full proficiency (10). “Self-ratings of frequency” were assessed on a 1–5 scale, from no usage (1) to constant usage (5). “M” and “SD” represent the mean and standard deviation, respectively. “Learning contexts” denote the primary environments where individuals are exposed to and learn the target language. Specifically: “Home-only Learning” indicates learning that occurs exclusively in the home environment. Home-based learning is characterized by informal, naturalistic language input and parent-child interactions. “School-only Learning” refers to learning the target language in school settings, which typically involves structured curricula, teacher guidance, and peer interactions. “Both” indicates that learning occurs in both home and school environments. “N” represents the total number of participants in each learning context, while “%” indicates the proportion of participants in that context relative to the total sample. “Medium-of-instruction” refers to the language used as an instructional bridging language (i.e., the language used for explanation, clarification, or transition) when learning the target language in school settings. “n/a” (not applicable) is used for cases where the concept does not apply. For example, in the context of first language (L1) acquisition, which primarily occurs at home, a medium-of-instruction is typically not required.The Multilingual Naming Test (MINT) is a standardized picture-naming assessment designed to evaluate lexical retrieval abilities across different languages in multilingual individuals. The 68-item version includes a set of culturally neutral, high-frequency images that minimize linguistic and cultural biases, making it suitable for cross-linguistic comparisons. During the test, participants are presented with pictures and asked to name each item as quickly and accurately as possible in the target language. The MINT provides a quantitative measure of expressive vocabulary and has been widely used to assess language proficiency and naming performance among bilinguals and multilinguals in both clinical and research contexts.Scoring of the Multilingual Naming Test (MINT) For the 68-item version of the MINT, scoring is based on the number of correctly named items. Each picture presented is scored as either correct (1 point) or incorrect (0 points). Self-corrections within a brief response window are generally accepted as correct. The total score is the sum of correct responses, with a maximum possible score of 68. No partial credit is given, and typically, responses are only accepted if they are the conventional names for the depicted objects in the target language. The scoring does not consider response time, only accuracy.
Table 2.
Mean Reaction Times (SE) by Trial Type and Switching Direction Across Dual-Language Contexts.
Table 2.
Mean Reaction Times (SE) by Trial Type and Switching Direction Across Dual-Language Contexts.
| L1-L2 Context | L1-L3 Context | L2-L3 Context | |
|---|---|---|---|
| to Dominant language | |||
| Repeat M (SE) | 1559 (9.39) | 1558 (9.56) | 1545 (9.23) |
| Switch M (SE) | 1561 (9.43) | 1562 (9.39) | 1565 (9.28) |
| Switching cost M (SE) | 2 (9.41) | 4 (9.47) | 20 (9.25) |
| to Non-dominant language | |||
| Repeat M (SE) | 1563 (9.40) | 1579 (9.53) | 1571 (9.79) |
| Switch M (SE) | 1568 (9.36) | 1577 (9.41) | 1579 (9.46) |
| Switching cost M (SE) | 5 (9.38) | -2 (9.47) | 8 (9.62) |
| Language dominance effect M (SE) | 11 (9.40) | 36 (9.47) | 40 (9.44) |
2Note. Switching cost = Switch RT - Repetition RT. Language dominance defined by age of acquisition: L1 (Uyghur, earliest acquired) is dominant in L1-L2 and L1-L3 contexts; L2 (Chinese) is dominant in L2-L3 context. “To dominant language” represents the mean RT of switching toward the earlier-acquired language plus repetition trials in that language, divided by 2. “To non-dominant language” represents the mean RT of switching toward the later-acquired language plus repetition trials in that language, divided by 2. Language dominance effect = to non-dominant language RT - to dominant language RT . SE = standard error.
Table 3.
Mean Accuracy (SE) by Trial Type and Switching Direction Across Dual-Language Contexts.
| L1-L2 Context | L1-L3 Context | L2-L3 Context | |
|---|---|---|---|
| to Dominant language | |||
| Repeat M (SE) | 0.973 (0.0085) | 0.972 (0.008) | 0.981 (0.006) |
| Switch M (SE) | 0.959 (0.012) | 0.983 (0.005) | 0.981 (0.006) |
| Switching cost M (SE) | -0.014 (0.010) | -0.011 (0.007) | 0 (0.006) |
| to Non-dominant language | |||
| Repeat M (SE) | 0.975 (0.008) | 0.975 (0.007) | 0.963 (0.011) |
| Switch M (SE) | 0.971 (0.009) | 0.973 (0.008) | 0.969 (0.009) |
| Switching cost M (SE) | -0.004 (0.008) | -0.002 (0.008) | 0.006 (0.010) |
| Language dominance effect M (SE) | 0.014 (0.009) | -0.007 (0.007) | -0.03 (0.008) |
Table 4.
Estimated Parameters and t-Test Statistics for Each Predictor in the Linear Regression Model.
Table 4.
Estimated Parameters and t-Test Statistics for Each Predictor in the Linear Regression Model.
| outcome | d.s1 | d.s2 | a | ter | z | |||||
| predictors | b | t | b | t | b | t | b | t | b | t |
| LPC | -0.023 | -0.433,p=.667 | 0.0457 | 1.0543,p=.295 | -0.0606 | -1.02,p=.1 | 0.01102 | 1.649,p=.104 | -0.0107 | -3.41,p=.001 |
| Context(L1-L3 VS. L1-L2) | 0.958 | 1.745,p=.352 | -0.9875 | -2.05,p=.047 | 0.993 | 1.607, p=.112 | -0.08316 | -1.855,p=.068 | 0.0923 | 2.6107,p=.011 |
| Context(L2-L3 VS. L1-L2) | 0.5197 | 0.937,p=.085 | -1.374 | -2.52,p=.014 | 1.5658 | 2.194, p=.032 | -0.12167 | -2.4862,p=.015 | 0.05 | 1.4019,p=.165 |
| Context(L1-L3 VS. L2-L3) | 0.4383 | 0.79,p=.432 | 0.891 | 1.59,p=.116 | 0.891 | 1.59, p=.116 | -0.01189 | -0.235,p=.815 | 0.01766 | -1.964,p=.685 |
| N200 | 0.0365 | 1.03,p=.304 | -0.0154 | -0.5,p=.619 | -0.0199 | -0.502, p=.617 | 0.00376 | 1.409,p=.163 | -0.0789 | -0.0347,p=.972 |
| N200 × Context(L1-L3 VS. L1-L2) | 0.00941 | 0.1043,p=.917 | -0.0857 | -1.147,p=.256 | 0.0425 | 0.435, p=.665 | 0.00364 | 0.539,p=.592 | -0.00163 | -0.282,p=.778 |
| N200 × Context(L2-L3 VS. L1-L2) | -0.10026 | -1.101,p=.275 | 0.178 | 2.35,p=.021 | -0.2414 | -2.446, p=.017 | 0.01108 | 1.622,p=.109 | -0.00854 | -1.461,p=.149 |
| N200 × Context(L1-L3 VS. L2-L3) | 0.10966 | 0.9944,p=.324 | -0.263 | -2.88,p=.005 | 0.284 | 2.376, p=.02 | -0.00744 | -0.899,p=.372 | 0.0069 | 0.975,p=.333 |
| N400 | 0.0534 | 1.018,p=.312 | 0.0185 | 0.564,p=.575 | -0.0541 | -1.284, p=.203 | 0.00627 | 2.24,p=.028 | 0.00419 | 1.295,p=.2 |
| N400 × Context(L1-L3 VS. L1-L2) | -0.0389 | -0.42,p=.676 | 0.00778 | 0.101,p=.92 | -0.0647 | -0.669, p=.505 | 0.00732 | 1.1387,p=.259 | -0.00395 | -0.693,p=.491 |
| N400 × Context(L2-L3 VS. L1-L2) | -0.1157 | -1.203,p=.233 | 0.2089 | 2.609,p=.011 | -0.3246 | -3.231, p=.002 | 0.02127 | 3.1808,p=.002 | -0.01599 | -2.697,p=.009 |
| N400 × Context(L1-L3 VS. L2-L3) | 0.0769 | 0.6927,p=.491 | -0.201 | -2.18,p=.033 | 0.26 | 2.24, p=.028 | -0.0139 | -1.809,p=.075 | 0.012 | 1.761,p=.083 |
3Note. d.s1, d.s2, a, ter, and z denote drift rate for ‘yes’ responses, drift rate for ‘no’ responses, boundary separation, non-decision time, and starting point bias, respectively. p values were corrected for multiple comparisons using the Bonferroni-Holm correction procedure [48]. Bold t values indicate corresponding p values < .05.
Disclaimer/Publisher’s Note: The statements, opinions and data contained in all publications are solely those of the individual author(s) and contributor(s) and not of MDPI and/or the editor(s). MDPI and/or the editor(s) disclaim responsibility for any injury to people or property resulting from any ideas, methods, instructions or products referred to in the content. |
© 2025 by the authors. Licensee MDPI, Basel, Switzerland. This article is an open access article distributed under the terms and conditions of the Creative Commons Attribution (CC BY) license (http://creativecommons.org/licenses/by/4.0/).
Copyright: This open access article is published under a Creative Commons CC BY 4.0 license, which permit the free download, distribution, and reuse, provided that the author and preprint are cited in any reuse.


