
Submitted:
13 August 2025
Posted:
14 August 2025
You are already at the latest version
Abstract
Sugarcane vinasse, a byproduct of ethanol production, presents environmental challenges due to its high organic content and occasional contamination with antibiotics such as monensin. This study successfully evaluated thermophilic two-phase anaerobic digestion for simultaneous monensin degradation and biogas production. The system, consisting of an acidogenic anaerobic structured-bed bioreactor (ASTBR) operating at with a hydraulic retention time (HRT) of 7.5 h followed by a methanogenic reactor at HRT = 24 h, with two options of the methanogenic phase, an upflow anaerobic sludge blanket (UASB) and an ASTBR, operated continuously for 254 days with incremental monensin concentrations (0-2000 ng/mL). The acidogenic reactor consistently removed over 70% of monensin across all phases, demonstrating its effectiveness as a pretreatment step. At realistic residual concentrations (20–100 ng/mL), monensin not only failed to inhibit biogas production but enhanced methane yield by up to 100% through selective pressure on the microbial community. This study demonstrated that anaerobic digestion can effectively degrade monensin while increasing the value of vinasse, providing a scalable solution for mitigating antibiotic contamination and enhancing bioenergy recovery in the sugarcane-ethanol industry.
Keywords:
sugarcane vinasse
; anaerobic digestion
; thermophilic bioreactors
; two-phase reactor
; monensin degradation
; methane production
; acidogenic reactor
; methanogenic reactor
; bioenergy recovery
1. Introduction
Vinasse, as a liquid residue-turned-byproduct of the sugarcane-ethanol economy, represents both a challenge and an opportunity, as it is nutrient-rich, carbon-dense, and plentiful. Accordingly, it has been historically seen as a waste product destined for use as a fertilizer in a tight radius around ethanol distilleries, where its nutrients are a source of modest economy, and much of its content is leached into the soil and ground-water or left to decompose back into the atmosphere [1,2,3,4]. Considering that Brazil is expected to produce about 29 billion liters of ethanol in the 2024-2025 season [5], and considering that every liter of ethanol results in about 15 liters of vinasse [6], better solutions than disposal on cropland must be established. As such, biogas production is the main candidate for extracting useful energy from sugarcane vinasse, while other methods for upgrading vinasse are under development [7,8,9].
Biogas production from vinasse has been extensively studied and there have been some attempts to implement it on large scale with varying results. One of the main issues is the methanogenic process sensitivity to high organic loading rates and toxic compounds, which is the reason the trend in vinasse biodigestion has been isolating methanogenesis from the rest of the metabolic process, specifically between acid production and conversion to biogas [1,10], but also sulfate removal [11,12,13]. Besides the natural fermentation products and thermal degradation products resulting from the distillation process, and inorganic additives, vinasse occasionally contains antibiotics dosed during fermentation to control bacterial populations, which compete with the yeast for substrate and produce organic acids, which inhibits yeast and diminishes the yield of batch fermentation. The most common antibiotics used in sugarcane-ethanol plants are various penicillins and tetracycline [14,15], whose properties are extensively documented and studied, and monensin, which is commercialized as effective fermentation contamination control, based on a patent [16], and sold to ethanol plants much concern for environmental impacts. Monensin is known to be a very wide spectrum antibiotic, to the extent that it presents toxicity to all living cells, to varying degrees, including vertebrates and invertebrates [17,18,19,20,21]. Monensin is also known to persist in the environment, resisting degradation in environmental water and soil [20]. Accordingly, its presence in vinasse presents a current environmental concern, and could have implications for vinasse biodigestion, as producers have concerns about the viability of a biorefinery, when a known toxin is present. Silva [22,23] has recently developed an analytical method to quantify antibiotics in vinasse, and established that monensin was found at 14 ng/mL in sugarcane vinasse, while carrying out batch biodigestion experiments with 500 ng/mL monensin added to conclude that monensin does in fact have an inhibitory effect on vinasse biodigestion. Chapter 2 of the present study establishes that real vinasse shows concentrations of 2-250 ng/mL of vinasse. Accordingly, vinasse biodigestion under real concentrations of monensin in vinasse in a continuous reactor must be studied and this study accomplishes this objective. This study aims at evaluating the effect of monensin on vinasse anaerobic digestion and evaluating the degradation of monensin in a continuous anaerobic reactor, which has not yet been reported in literature.
2. Materials and Methods
Vinasse
Sugarcane-ethanol vinasse was collected from a sugarcane-ethanol plant, located in Pradópolis, São Paulo, Brazil. This crude vinasse in three utilized collection lots was determined to have following characteristics presented in Table 1. The vinasse was stored at -18°C and thawed for feeding the reactors. The vinasse was filtered with a viscose cloth filter before feeding the reactor to prevent clogging the pumps, tubes, and valves within the bench-scale reactors.
Thermophilic Bioreactors
While this study takes a two-phase bioreactor approach involves separating the anaerobic digestion process into an acidogenic system and a methanogenic system, this study also evaluates two different configurations for the methanogenic bioreactor, specifically an Upflow Anaerobic Sludge Blanket (UASB), and an Anaerobic Structured-Bed Bioreactor (ASTBR). Accordingly, three reactors were operated, where one ASTBR acidogenic reactor fermented vinasse, converting organic material into organic acids, and the effluent of this reactor was used to feed the two following methanogenic reactors. The configuration of the reactors was based on the reactor development done by Fuess 1 and was as follows, in Table 2, and is shown in Figure 1 and Figure 2.
Two-Phase Reactor Operating Conditions
The two-phase reactor system was operated for 254 days in a temperature-controlled chamber set at 55°C. Vinasse was kept at 4°C while being pumped into the reactors using one Grundfos DDA dosing pump for each reactor. The reactor headspace was sealed from the atmosphere using a bottle trap containing a 3 M HCl solution, preventing CO₂ dissolution from the produced biogas and ensuring reliable volumetric flow measurements. The reactor operation was divided into 5 phases with constant vinasse feeding characteristics with the incremental addition of monensin, as per Table 8. Phase 0 represented the establishment of a baseline of two-phase reactor performance without the presence of monensin. Each phase ended when a steady state of COD removal and biogas production was achieved, and the monensin concentration was increased, marking the beginning of the next phase. This was defined as when variation of COD removal and biogas volumetric production was observed to have stabilized following sharp drops at each monensin concentration range.

Table 3.
Phases of operation, their duration, and their respective continuously added monensin concentrations.
Table 3.
Phases of operation, their duration, and their respective continuously added monensin concentrations.
| Phase | Duration (days) | Nominal monensin concentration (ng/mL) |
| 0 | 88 | 0 |
| 1 | 42 | 20 |
| 2 | 52 | 50 |
| 3 | 47 | 100 |
| 4 | 25 | 2000 |
Acidogenic Phase Reactor
The acidogenic ASTBR reactor (2.1 L liquid volume) was inoculated by auto-fermentation of vinasse [28], and posteriorly operated at a continuous hydraulic retention time (HRT) of 7.5 hours (organic loading rate (OLR) of 70.0 COD/m3d) with vinasse pH-adjusted to pH=5.5 using 50% m/v NaOH 10. This HRT was chosen based on the work done by Fuess (2017) [29], albeit with a slightly lower OLR than optimal for hydrogen production, to ensure the stability of the acidogenic process, and since hydrogen production was not a priority and would not be optimized. Acid production and simplicity of operation as a pretreatment reactor was the priority, so an OLR of 70.0 kg COD/m3d would ensure the requirements of this study were met while remaining within the scope of evaluating the performance of two-phase anaerobic digestion reactors for sugarcane vinasse. All effluent of this reactor was collected and stored for up to 3 days at 4°C, to be used to feed the methanogenic phase.
Methanogenic-Phase Reactors
The methanogenic UASB (1.6 L liquid volume) and ASTBR reactor (2.1 L liquid volume) were inoculated with thermophilic sludge acquired from a full-scale methanogenic UASB reactor digesting vinasse from the same plant that supplied the vinasse used in this study. The UASB was filled to 40% of its volume with sludge. The ASTBR polyurethane support material was soaked in diluted and lightly-ground sludge for 2 hours prior to reactor final assembly [10]. Both reactors were then fed with fermented vinasse produced by the acidogenic phase alkalinized with 0.28 g NaHCO3 / g COD at a continuous OLR of 25 kg COD/m3d (HRT=24 h). As the operation of the methanogenic reactors was aimed at the production of biomethane, the optimal OLR of 25 kg COD/m3d reported by Fuess [10] was maintained, and the HRT of 24 hours was in line with previous research and fixed at an upper limit of the optimistic 20-24 hour range for methanogenic metabolism to ensure that both reactors would enjoy stable long-term methanogenesis even as the bench-scale reactors accumulated biomass and HRT would effectively and gradually drop.
Experimental Monitoring
Throughout the operation, the two-phase reactor was monitored at five points shown in Figure 2: acidogenic affluent, acidogenic effluent, methanogenic affluent, methanogenic UASB effluent (including biogas output), and methanogenic ASTBR effluent (including biogas output).
All analyses were done immediately except for VOC and MON analysis, which were stored at -18°C and analyzed in lots. Sampling of both affluents was done by shaking the feedstock to homogeneity, and a primary sample of 50 mL was collected, of which 6 mL, of which 2 mL was used for immediate analysis, and 2 samples of 2 mL were stored at -18°C for batch analysis of VOC, and MON, respectively. Headspace sampling for biogas composition in the methanogenic reactors was taken through a septum-sealed sampler installed in-line on the gas outlet, while ensuring stable positive pressure in the headspace prior to sampling.
The parameters monitored for all reactors and their frequency are shown in Table 4.
Methane production in each phase of operation was evaluated by combining volumetric and composition data and was converted to volumetric methane production (VMP) (L CH4/d L) by dividing the average volume of methane produced daily in each phase of operation by the liquid volume of each reactor. Methane yield (MY) (L CH4/g COD removed) was calculated by dividing VMP by average COD removal per each phase of operation.
3. Results and Discussion
In 254 days of operation and monitoring, the bench-scale two-phase anaerobic bioreactor had gone through several landmark events, starting with Phase 0, which can be further divided into a start-up phase and a steady-state phase, and Phases 1, 2, and 3, which represented the addition of incremental realistic concentrations of monensin to the vinasse feedstock, and ending with Phase 4, which represented an unrealistic or accidental concentration of monensin in the vinasse and quickly led to the collapse of the system, and which demonstrated that despite its resilience, the bioreactor’s capacity to absorb and degrade toxins has its limits.
Monensin removal was observed in both the acidogenic and methanogenic phases of the system, and to note that at very low affluent concentration of monensin in Phase 1 of this study (MON = 20 ng/mL), the acidogenic phase was able to eliminate monensin and its effluent contained no detectable amounts. Accordingly, as far as the methanogenic reactors were concerned, no monensin arrived in the methanogenic affluent until Phases 2, 3, and 4 of this study, yet methanogenic performance in Phase 1 is still attributed to the presence of monensin in the two-phase reactor, since the presence of monensin in the acidogenic reactor changes the character of the acidogenic effluent, and consequently, the performance of the methanogenic reactors, as seen in Figure 3, and will be discussed later.
Reactor Performance
The start-up phase is considered from the day the reactors were assembled and inoculated, up to the day when day-to-day variations in performance became less significant; during operation, reactor performance was evaluated based on COD removal and biogas production in the methanogenic reactors, since the target value-adding activity of the system, i.e. biogas production and organic material removal, is exclusive to the methanogenic reactors in such a two-phase reactor. Accordingly, for the methanogenic UASB, steady-state performance was considered from day 51, when the 7-day moving average for COD removal permanently surpassed 40%, and for the methanogenic ASTBR, steady-state performance was taken from day 31, which is when COD removal 7-day moving average permanently surpassed 60%. This confirms previous results of superior performance of fixed bed reactors over UASB reactors for methanogenesis, both in terms of efficiency, and speed of start-up, especially in two-phase anaerobic digestion reactors.
3.1. Acidogenic ASTBR
Accordingly, the acidogenic reactor is initially viewed as a pretreatment component, which ferments vinasse and primes it for digestion in the methanogenic reactors by converting sugars and carbohydrates into organic acids and solvents (OAS), which includes VOCs and lactic acid. Therefore, COD removal in the acidogenic reactor was not expected or observed, and no biohydrogen production was incentivized or observed, since this reactor was accumulating organic acids, both maintaining a high COD and a pH under 4.5 throughout operation. This inhibits biohydrogen production as reported in other studies [29]. Additionally, while COD was measured in the affluent and effluent, values frequently implied the accumulation and release of organic material. Over the entire period of this study, the acidogenic reactor consumed just 3.5% of the COD fed into it, due to cell maintenance, and baseline metabolic activity. The success of acidogenesis is OAS production, shown in Figure 4 across each phase, and was regularly monitored via glycerol removal from the vinasse. As a favored substrate in acidogenic systems [32,33,34,35], glycerol was completely consumed, without interruption, from the second week of operation until reactor collapse on the 254th day of operation. The acidogenic reactor was relatively consistent at OAS production across phases, albeit with less stability in the presence of monensin. At Phase 4, acid production seemingly increases, with much expanded instability, which implies widespread ecosystem collapse in the wake of monensin’s bactericidal activity. Table 5 and Figure 5 demonstrate that the acidogenic ASTBR effectively removed MON across all phases, though removal efficiency declined as MON concentrations increased. A sharp drop was observed at the spike concentration in Phase 4; however, the system consistently achieved over 70% toxin removal. This performance highlights its ability to prime and pretreat vinasse for subsequent biodigestion in methanogenic reactors. Table 5 also shows that even though monensin addition to effluent was carefully micropipetted with the target concentrations shown in Table 3, real affluent concentrations of monensin are effectively lower, showing that even while at 4°C, the feedstock itself was an environment that degraded or adsorbed some of the added monensin. This is unsurprising and expected, since the vinasse itself contains an active microbiome, which was used for inoculating the acidogenic reactor; this is why affluent concentrations were monitored and not taken for granted.
A breakdown of OAS production in COD equivalent per phase is shown in Figure 6. OAS production is affected by the presence of monensin, which can be inhibitory, as in the case of n-butanol, or potentiating, as in all other cases shown in this research project. Notably, n-butanol production increases in Phase 1, in comparison to Phase 0, and rapidly decreases in Phase 2. Similarly, propionic acid production peaks in Phase 3 and drops in Phase 4. This indicates that tolerance to monensin in the reactor ecosystem exists, and that monensin imposes a selective pressure on bacteria in the reactor, even at residual concentrations. This has wide implications for monensin’s (and possibly other bacterial control agents) use in the sugarcane-ethanol industry, if residues are to be biologically upgraded into useful materials, such as biogas, VOCs, bioplastics, etc. Additionally, this result shows that monensin can be explored as a potential driver for biochemical pathways that produce specific compounds, in this case VOCs, boosting the production of a solvent or acid and focusing the conversion of organic material into specific compounds, increasing yields, by controlling pathways that compete for the substrate. Overall VFA production in this system was much lower than other studies, likely due to pH 4.5, while a pH above 5.5 is usually required for optimal VFA production [36].
3.2. Methanogenic UASB and ASTBR
As the nominally productive component of the two-phase anaerobic reactor, the methanogenic reactors were monitored for COD removal and biomethane production; a summary of reactor performance is presented in Table 6.
Both reactors received the same affluent, and in Phases 1-4 containing the same concentration of monensin, throughout the operation at the same HRT of 24 hours. Across all phases, and as predicted, the ASTBR significantly outperformed the UASB in terms of COD removal (41% higher removal from the same affluent) as shown in Figure 7, and in terms of volumetric methane production (6% higher production from the same affluent). This corroborates the results of previous studies on the performance of fixed-bed versus suspended biomass reactors, [10,32] albeit here considering the confirmed presence of the antibiotic monensin. As previous studies did not check for the presence of monensin in vinasse samples used as feedstock, its influence on previous reactor performance evaluation cannot be verified. For a nearly identical reactor setup, Fuess [10] reported that at OLR=25 kg COD/m3 d, average VMP was 2.280 ± 0.357 L CH4/d L and 4.505 ± 0.455 L CH4/d L for UASB and ASTBR methanogenic reactors, respectively, in a nearly identical configuration to the one presented in this study. MY was reported at 0.283 ± 0.024 L CH4/ g COD removed and 0.301 ± 0.012 L CH4/ g COD removed for UASB and ASTBR reactors, respectively. These values show that the present study in all phases (Table 11) had very similar performance in the UASB, to an optimized system, whereas the ASTBR had the potential for higher performance. This could be attributed to many factors, including fixed bed support material, sludge inoculum quality, real OLR/HRT discrepancy, solids accumulation resulting in useful volume loss, among others. Nevertheless, the present study still shows that the ASTBR, even when operationally less than optimal, still managed to remove COD at a much higher efficiency, a testament to the functional superiority of fixed-bed reactors in treating high-strength liquid residues.
Figure 8 shows the removal of monensin in the methanogenic reactors. Removal efficiency is low, rarely surpassing 50%, whether at trace concentrations (Phases 1,2, and 3) or at high concentrations (Phase 4), which implies that the methanogenic ecosystem is not well-suited for degrading this antibiotic, while being susceptible to its effects. This highlights the importance of the acidogenic reactor as a pretreatment reactor for the removal of toxins, and the suitability of the two-phase anaerobic reactor concept for biodigestion of complex residues containing toxic organic compounds.
While across study phases the introduction of monensin at varying trace levels has a small effect on COD removal (Figure 9), VMP, can be seen to increase when trace concentrations of monensin are introduced into the two-phase system, since even in Phase 1, when monensin is undergoing degradation by the acidogenic reactor, VMP increases significantly as shown in Figure 10. This implies that the gains in VMP are most likely due to increased OAS production, yielding a more accessible substrate to methanogenic species. This gain is lost at higher concentrations, as monensin arrives in high concentrations at the methanogenic reactors, directly affecting the stability of the reactor with detrimental outcome to COD consumption. This is in line another study on batch reactors that demonstrate monensin’s inhibitory effects at concentrations above 500 ng/mL [22] and 1500 ng/mL [37]. MY also increases at trace concentrations of monensin, doubling MY in the ASTBR at 20 ng/mL of monensin (Table 3 & Figure 11). MY seems to remain high even at an inhibitory concentration (Phase 4), however, this is misleading, since COD removal drops, inflating apparent yield. This is highly reminiscent of monensin use for modifying ruminant livestock gut microbiomes to increase acid production and consequently, improve the efficiency of conversion of animal feed into animal protein, just as monensin is justified to be used in cattle feed at low concentrations, while exhibiting extreme toxicity at higher dosages [21,38].
These results demonstrate that trace levels of toxins in continuous anaerobic systems have extremely outsized effects, and the consequences of their residual presence should never be underestimated when considering their use in an industrial process. Amounts of monensin as low as 20 ng/mL have the capacity to double MY in a fixed bed thermophilic anaerobic reactor, for example, demonstrating the complex kinetics behind this interaction.
3.3. Two-Phase Reactor Global Monensin Removal
The two-phase reactor as a unit, in both ASTBR-UASB (A-U) and ASTBR-ASTBR (A-A) configurations, was shown to be capable of removing trace amounts of monensin to a similar degree (Figure 12). Overall, the A-U demonstrated less consistency than the A-A configuration even if when looking at averages, they might seem equally efficient. This highlights the stability of the fixed biomass system and its superiority in dealing with toxic substances. While the effluents would average out over a season to result in about the same amount of monensin being applied to soil in fertirrigation, the A-A system would result in lower variation and lower peak concentrations in the soil, and with optimization, perhaps higher removal rates of monensin and other toxic compounds.
While looking at the different phases of this study in Figure 13, the A-A configuration shines at the lowest concentrations, highlighting the importance of its role in removing the smallest trace amounts of micropollutants, and highlighting the low reliability of the A-U configuration for this aim. At higher concentrations, the performance of both configurations tends to converge, showing that anaerobic digestion in general can improve the quality of vinasse heavily contaminated with monensin.
4. Conclusions
Monensin use in sugarcane-ethanol production, results in trace concentrations of the antibiotic in vinasse used for fertirrigation. This presents an environmental concern whose effects can range from the development of bacterial resistance in soil, returning to the sugarcane-ethanol production process and hindering the effectiveness of this antibiotic, to the persistence of toxicity in the environment and affecting wildlife, livestock, and public health. This creates a need for solutions to treat this issue, along with the general toxicity of vinasse fertirrigation. This study evaluated the effectiveness of simultaneous biogas production and removal of monensin using anaerobic digestion in a two-phase anaerobic reactor and showed that such a configuration provides a reliable way to both increase the value of vinasse as a by-product, while reducing its toxicity due to antibiotic persistence. This study also shows that the use of an antimicrobial agent does not necessarily imply the loss of viability of biodigestion as a form of upgrading vinasse. On the contrary, the presence of antimicrobial agents can potentially increase biogas production by disrupting the consumption of metabolites in the pretreatment phase and potentializing their conversion into biogas. Further studies can optimize this removal of monensin along with other toxins potentially present in vinasse and perhaps even proceed to use antimicrobial agents to increase the yield of anaerobic biodigestion systems. This can be done by, for example, using monensin-contaminated vinasse as an additive in a two-phase reactor treating normally monensin-free vinasse, simultaneously degrading low-concentration monensin completely and increasing acid production in the acidogenic phase, for improving methane production in the methanogenic phase. A result would be both more value-extraction from vinasse, and a less harmful fertilizer byproduct discharged onto cropland. This study recommends modeling the kinetics of monensin intervention in continuous anaerobic reactors, and an evaluation of the potential use of monensin or monensin-contaminated vinasse as an additive for enhanced methane production.
CRediT authorship contribution statement
Sami Chatila: Writing – original draft, Methodology, Investigation, Formal analysis, Conceptualization. Marcelo Zaiat: Writing – review & editing, Supervision, Funding acquisition, Conceptualization.
Funding
This study was financed, in part, by the São Paulo Research Foundation (FAPESP), Brasil. Process Numbers 2015/06246-7 and 17/02147-0. This study was financed, in part, by CNPq – Process: 314731/2021-0. This study was financed in part by the Coordenação de Aperfeiçoamento de Pessoal de Nível Superior – Brasil (CAPES) – Finance Code 001. The main author of this paper was a beneficiary of financial assistance from CAPES – Brasil.
Data Availability Statement
We encourage all authors of articles published in MDPI journals to share their research data. In this section, please provide details regarding where data supporting reported results can be found, including links to publicly archived datasets analyzed or generated during the study. Where no new data were created, or where data is unavailable due to privacy or ethical restrictions, a statement is still required. Suggested Data Availability Statements are available in section “MDPI Research Data Policies” at https://www.mdpi.com/ethics.
Acknowledgments
This study was made possible with the support and infrastructure of the Biological Processes Laboratory at the São Carlos School of Engineering of the University of São Paulo (LPB-EESC-USP) and the Chromatography Group at the São Carlos Institute of Chemistry of the University of São Paulo (CROMA-IQSC-USP).
Conflicts of Interest
The authors declare no conflicts of interest.
References
- Fuess, L.T. Biodigestão anaeróbia termofílica de vinhaça em sistemas combinados do tipo acidogênico-metanogênico para potencialização da recuperação de bioenergia em biorrefinarias de cana-de-açúcar de primeira geração. text, Universidade de São Paulo, 2017. [CrossRef]
- Poveda, M.M.R. Análise econômica e ambiental do processamento da vinhaça com aproveitamento energético. text, Universidade de São Paulo, 2015. [CrossRef]
- Silva, G.A. da Avaliação das tecnologias de disposição de vinhaça de cana de açúcar quanto ao aspecto de desenvolvimento ambiental e econômico. text, Universidade de São Paulo, 2011. [CrossRef]
- Carpanez, T.G.; Moreira, V.R.; Assis, I.R.; Amaral, M.C.S. Sugarcane vinasse as organo-mineral fertilizers feedstock: Opportunities and environmental risks. Science of The Total Environment 2022, 832, 154998. [Google Scholar] [CrossRef]
- Conab - Produção de cana-de-açúcar na Safra 2024/25 sofre redução devido a condições climáticas adversas Available online:. Available online: https://www.conab.gov.br/ultimas-noticias/5841-producao-de-cana-de-acucar-na-safra-2024-25-sofre-reducao-devido-a-condicoes-climaticas-adversas (accessed on 2 March 2025).
- dos Santos e Silva, D.F.; Bomtempo, J.V.; Alves, F.C. Innovation opportunities in the Brazilian sugar-energy sector. Journal of Cleaner Production 2019, 218, 871–879. [Google Scholar] [CrossRef]
- Nunes Ferraz Junior, A.D.; Etchebehere, C.; Perecin, D.; Teixeira, S.; Woods, J. Advancing anaerobic digestion of sugarcane vinasse: Current development, struggles and future trends on production and end-uses of biogas in Brazil. Renewable and Sustainable Energy Reviews 2022, 157, 112045. [Google Scholar] [CrossRef]
- Ramos-Reyes, M.F.; González-López, M.E.; Barajas-Álvarez, P.; Garcia-Garcia, C.E.; Tuesta-Popolizio, D.A.; Mussatto, S.I.; Gradilla-Hernández, M.S. Exploring the potential of distillery vinasses through upcycling: Pathways to a circular economy. Environmental Technology & Innovation 2025, 38, 104072. [Google Scholar] [CrossRef]
- Eng Sánchez, F.; Tadeu Fuess, L.; Soares Cavalcante, G.; Ângela Talarico Adorno, M.; Zaiat, M. Value-added soluble metabolite production from sugarcane vinasse within the carboxylate platform: An application of the anaerobic biorefinery beyond biogas production. Fuel 2021, 286, 119378. [Google Scholar] [CrossRef]
- Fuess, L.T.; Kiyuna, L.S.M.; Ferraz, A.D.N.; Persinoti, G.F.; Squina, F.M.; Garcia, M.L.; Zaiat, M. Thermophilic two-phase anaerobic digestion using an innovative fixed-bed reactor for enhanced organic matter removal and bioenergy recovery from sugarcane vinasse. Applied Energy 2017, 189, 480–491. [Google Scholar] [CrossRef]
- do Vale Borges, A.; Fuess, L.T.; Takeda, P.Y.; Rogeri, R.C.; Saia, F.T.; Gregoracci, G.B.; Rissato Zamariolli Damianovic, M.H. Unleashing the full potential of vinasse fermentation in sugarcane biorefineries. Renewable and Sustainable Energy Reviews 2025, 208, 115096. [Google Scholar] [CrossRef]
- Fuess, L.T.; Rogeri, R.C.; Eng, F.; Borges, A. do V.; Bovio-Winkler, P.; Etchebehere, C.; Zaiat, M. Thermophilic fermentation of sugarcane vinasse: Process flexibility explained through characterizing microbial community and predicting metabolic functions. International Journal of Hydrogen Energy 2024, 77, 1339–1351. [Google Scholar] [CrossRef]
- Rogeri, R.C.; Fuess, L.T.; Araujo, M.N. de; Eng, F.; Borges, A. do V.; Damianovic, M.H.R.Z.; Silva, A.J. da Methane production from sugarcane vinasse: The alkalinizing potential of fermentative-sulfidogenic processes in two-stage anaerobic digestion. Energy Nexus 2024, 14, 100303. [Google Scholar] [CrossRef]
- Oliva-Neto, P. de; Yokoya, F. Susceptibility of Saccharomyces cerevisiae and lactic acid bacteria from the alcohol industry to several antimicrobial compounds. Brazilian Journal of Microbiology 2001, 32, 10–14. [Google Scholar] [CrossRef]
- Hynes, S.H.; Kjarsgaard, D.M.; Thomas, K.C.; Ingledew, W.M. Use of virginiamycin to control the growth of lactic acid bacteria during alcohol fermentation. J Ind Microbiol Biotech 1997, 18, 284–291. [Google Scholar] [CrossRef]
- De Miniac, M. US Patent for Use of ionophoretic polyether antibiotics for controlling bacterial growth in alcoholic. fermentation Patent 5,888,788, 30 Mar. 1999. Available online: https://patents.justia.com/patent/5888788 (accessed on 18 August 2021).
- Mollenhauer, H.H.; James Morré, D.; Rowe, L.D. Alteration of intracellular traffic by monensin; mechanism, specificity and relationship to toxicity. Biochimica et Biophysica Acta (BBA) - Reviews on Biomembranes 1990, 1031, 225–246. [Google Scholar] [CrossRef]
- Matsuoka, T.; Novilla, M.N.; Thomson, T.D.; Donoho, A.L. Review of monensin toxicosis in horses. Journal of Equine Veterinary Science 1996, 16, 8–15. [Google Scholar] [CrossRef]
- Zidar, P.; Kos, M.; Vogel-Mikuš, K.; van Elteren, J.T.; Debeljak, M.; Žižek, S. Impact of ionophore monensin on performance and Cu uptake in earthworm Eisenia andrei exposed to copper-contaminated soil. Chemosphere 2016, 161, 119–126. [Google Scholar] [CrossRef]
- Watanabe, N.; Harter, T.H.; Bergamaschi, B.A. Environmental Occurrence and Shallow Ground Water Detection of the Antibiotic Monensin from Dairy Farms. Journal of Environmental Quality 2008, 37, S–78. [Google Scholar] [CrossRef] [PubMed]
- Melchior, E.A.; Hales, K.E.; Lindholm-Perry, A.K.; Freetly, H.C.; Wells, J.E.; Hemphill, C.N.; Wickersham, T.A.; Sawyer, J.E.; Myer, P.R. The effects of feeding monensin on rumen microbial communities and methanogenesis in bred heifers fed in a drylot. Livestock Science 2018, 212, 131–136. [Google Scholar] [CrossRef]
- Silva, J.J. da [UNESP Antibióticos na produção de etanol combustível: análise, dispersão no meio ambiente e efeitos na biodigestão da vinhaça. 2021. May 2021, Accessed: Mar. 01, 2025. Available online: http://hdl.handle.net/11449/204933.
- da Silva, J.J.; da Silva, B.F.; Zanoni, M.V.B.; Stradiotto, N.R. Sample preparation and antibiotic quantification in vinasse generated from sugarcane ethanol fuel production. Journal of Chromatography A 2022, 1666, 462833. [Google Scholar] [CrossRef] [PubMed]
- Baird, R.B.; Eaton, A.D.; Rice, E.W. Standard Methods for the Examination of Water and Wastewater, 23rd Edition; American Water Works Association: Washington, DC, 2017; ISBN 978-0-87553-287-5. [Google Scholar]
- Taylor, K.A.C.C. A simple colorimetric assay for muramic acid and lactic acid. Appl Biochem Biotechnol 1996, 56, 49–58. [Google Scholar] [CrossRef]
- Valdez, H. da C.; Amado, R.S.; Souza, F.C. de; D’Elia, E.; Vieira, E. de C. Free and total glycerol determination in biodiesel samples by enzymatic method with colorimetric detection. Química Nova 2012, 35, 601–607. [Google Scholar] [CrossRef]
- DuBois, Michel. ; Gilles, K.A.; Hamilton, J.K.; Rebers, P.A.; Smith, Fred. Colorimetric Method for Determination of Sugars and Related Substances. Anal. Chem. 1956, 28, 350–356. [Google Scholar] [CrossRef]
- Leite, J.A.C.; Fernandes, B.S.; Pozzi, E.; Barboza, M.; Zaiat, M. Application of an anaerobic packed-bed bioreactor for the production of hydrogen and organic acids. International Journal of Hydrogen Energy 2008, 33, 579–586. [Google Scholar] [CrossRef]
- Fuess, L.T.; Mazine Kiyuna, L.S.; Garcia, M.L.; Zaiat, M. Operational strategies for long-term biohydrogen production from sugarcane stillage in a continuous acidogenic packed-bed reactor. International Journal of Hydrogen Energy 2016, 41, 8132–8145. [Google Scholar] [CrossRef]
- Perna, V.; Castelló, E.; Wenzel, J.; Zampol, C.; Fontes Lima, D.M.; Borzacconi, L.; Varesche, M.B.; Zaiat, M.; Etchebehere, C. Hydrogen production in an upflow anaerobic packed bed reactor used to treat cheese whey. International Journal of Hydrogen Energy 2013, 38, 54–62. [Google Scholar] [CrossRef]
- Adorno, M.A.T.; Hirasawa, J.S.; Varesche, M.B.A. Development and Validation of Two Methods to Quantify Volatile Acids (C2-C6) by GC/FID: Headspace (Automatic and Manual) and Liquid-Liquid Extraction (LLE). AJAC 2014, 05, 406–414. [Google Scholar] [CrossRef]
- Carneiro, R.B.; Gomes, G.M.; Camargo, F.P.; Zaiat, M.; Santos-Neto, Á.J. Anaerobic co-metabolic biodegradation of pharmaceuticals and personal care products driven by glycerol fermentation. Chemosphere 2024, 357, 142006. [Google Scholar] [CrossRef]
- Dias, M.E.S.; Lopes, J.C.; Carneiro, R.B.; Damianovic, M.H.R.Z.; Foresti, E. Using Compounds Derived from the Glycerol Fermentation as a Carbon Source for Denitrification and Biological Phosphorus Removal. Water Air Soil Pollut 2021, 232, 339. [Google Scholar] [CrossRef]
- Lopes, J.C.; Silva, B.G.; Dias, M.E.S.; Carneiro, R.B.; Damianovic, M.H.R.Z.; Foresti, E. Enhanced biological nitrogen and phosphorus removal from sewage driven by fermented glycerol: comparative assessment between sequencing batch- and continuously fed-structured fixed bed reactor. Environ Sci Pollut Res 2023, 30, 11755–11768. [Google Scholar] [CrossRef]
- Clomburg, J.M.; Gonzalez, R. Anaerobic fermentation of glycerol: a platform for renewable fuels and chemicals. Trends in Biotechnology 2013, 31, 20–28. [Google Scholar] [CrossRef]
- Wang, K.; Yin, J.; Shen, D.; Li, N. Anaerobic digestion of food waste for volatile fatty acids (VFAs) production with different types of inoculum: Effect of pH. Bioresource Technology 2014, 161, 395–401. [Google Scholar] [CrossRef]
- García, O.D.V. Toxicidade metanogênica da monensina sódica e beta-ácidos de lúpulo e seus efeitos na biodigestão anaeróbia da vinhaça no contexto da indústria sucroalcooleira brasileira. text, Universidade Federal do ABC: Santo André, 2021. Available online: http://biblioteca.ufabc.edu.br/index.php?codigo_sophia=122172.
- Arikan, O.A.; Mulbry, W.; Rice, C.; Lansing, S. The fate and effect of monensin during anaerobic digestion of dairy manure under mesophilic conditions. PLOS ONE 2018, 13, e0192080. [Google Scholar] [CrossRef]
Figure 1.
Experimental bench-scale thermophilic reactor setup in a 55°C temperature-controlled chamber showing (1) the acidogenic ASTBR reactor, (2) the methanogenic UASB reactor, (3) the methanogenic ASTBR reactor, (4) stored crude vinasse, (5) vinasse alkalinized with NaOH and acidogenic feedstock at 4°C, (6) acidogenic reactor effluent at 4°C, (7) acidogenic effluent alkalinized with NaHCO3 and methanogenic feedstock at 4°C, (8) Grundfos diaphragm dosing pumps for reactor feeding, and (9) 3M HCl bottle traps for atmospheric isolation.
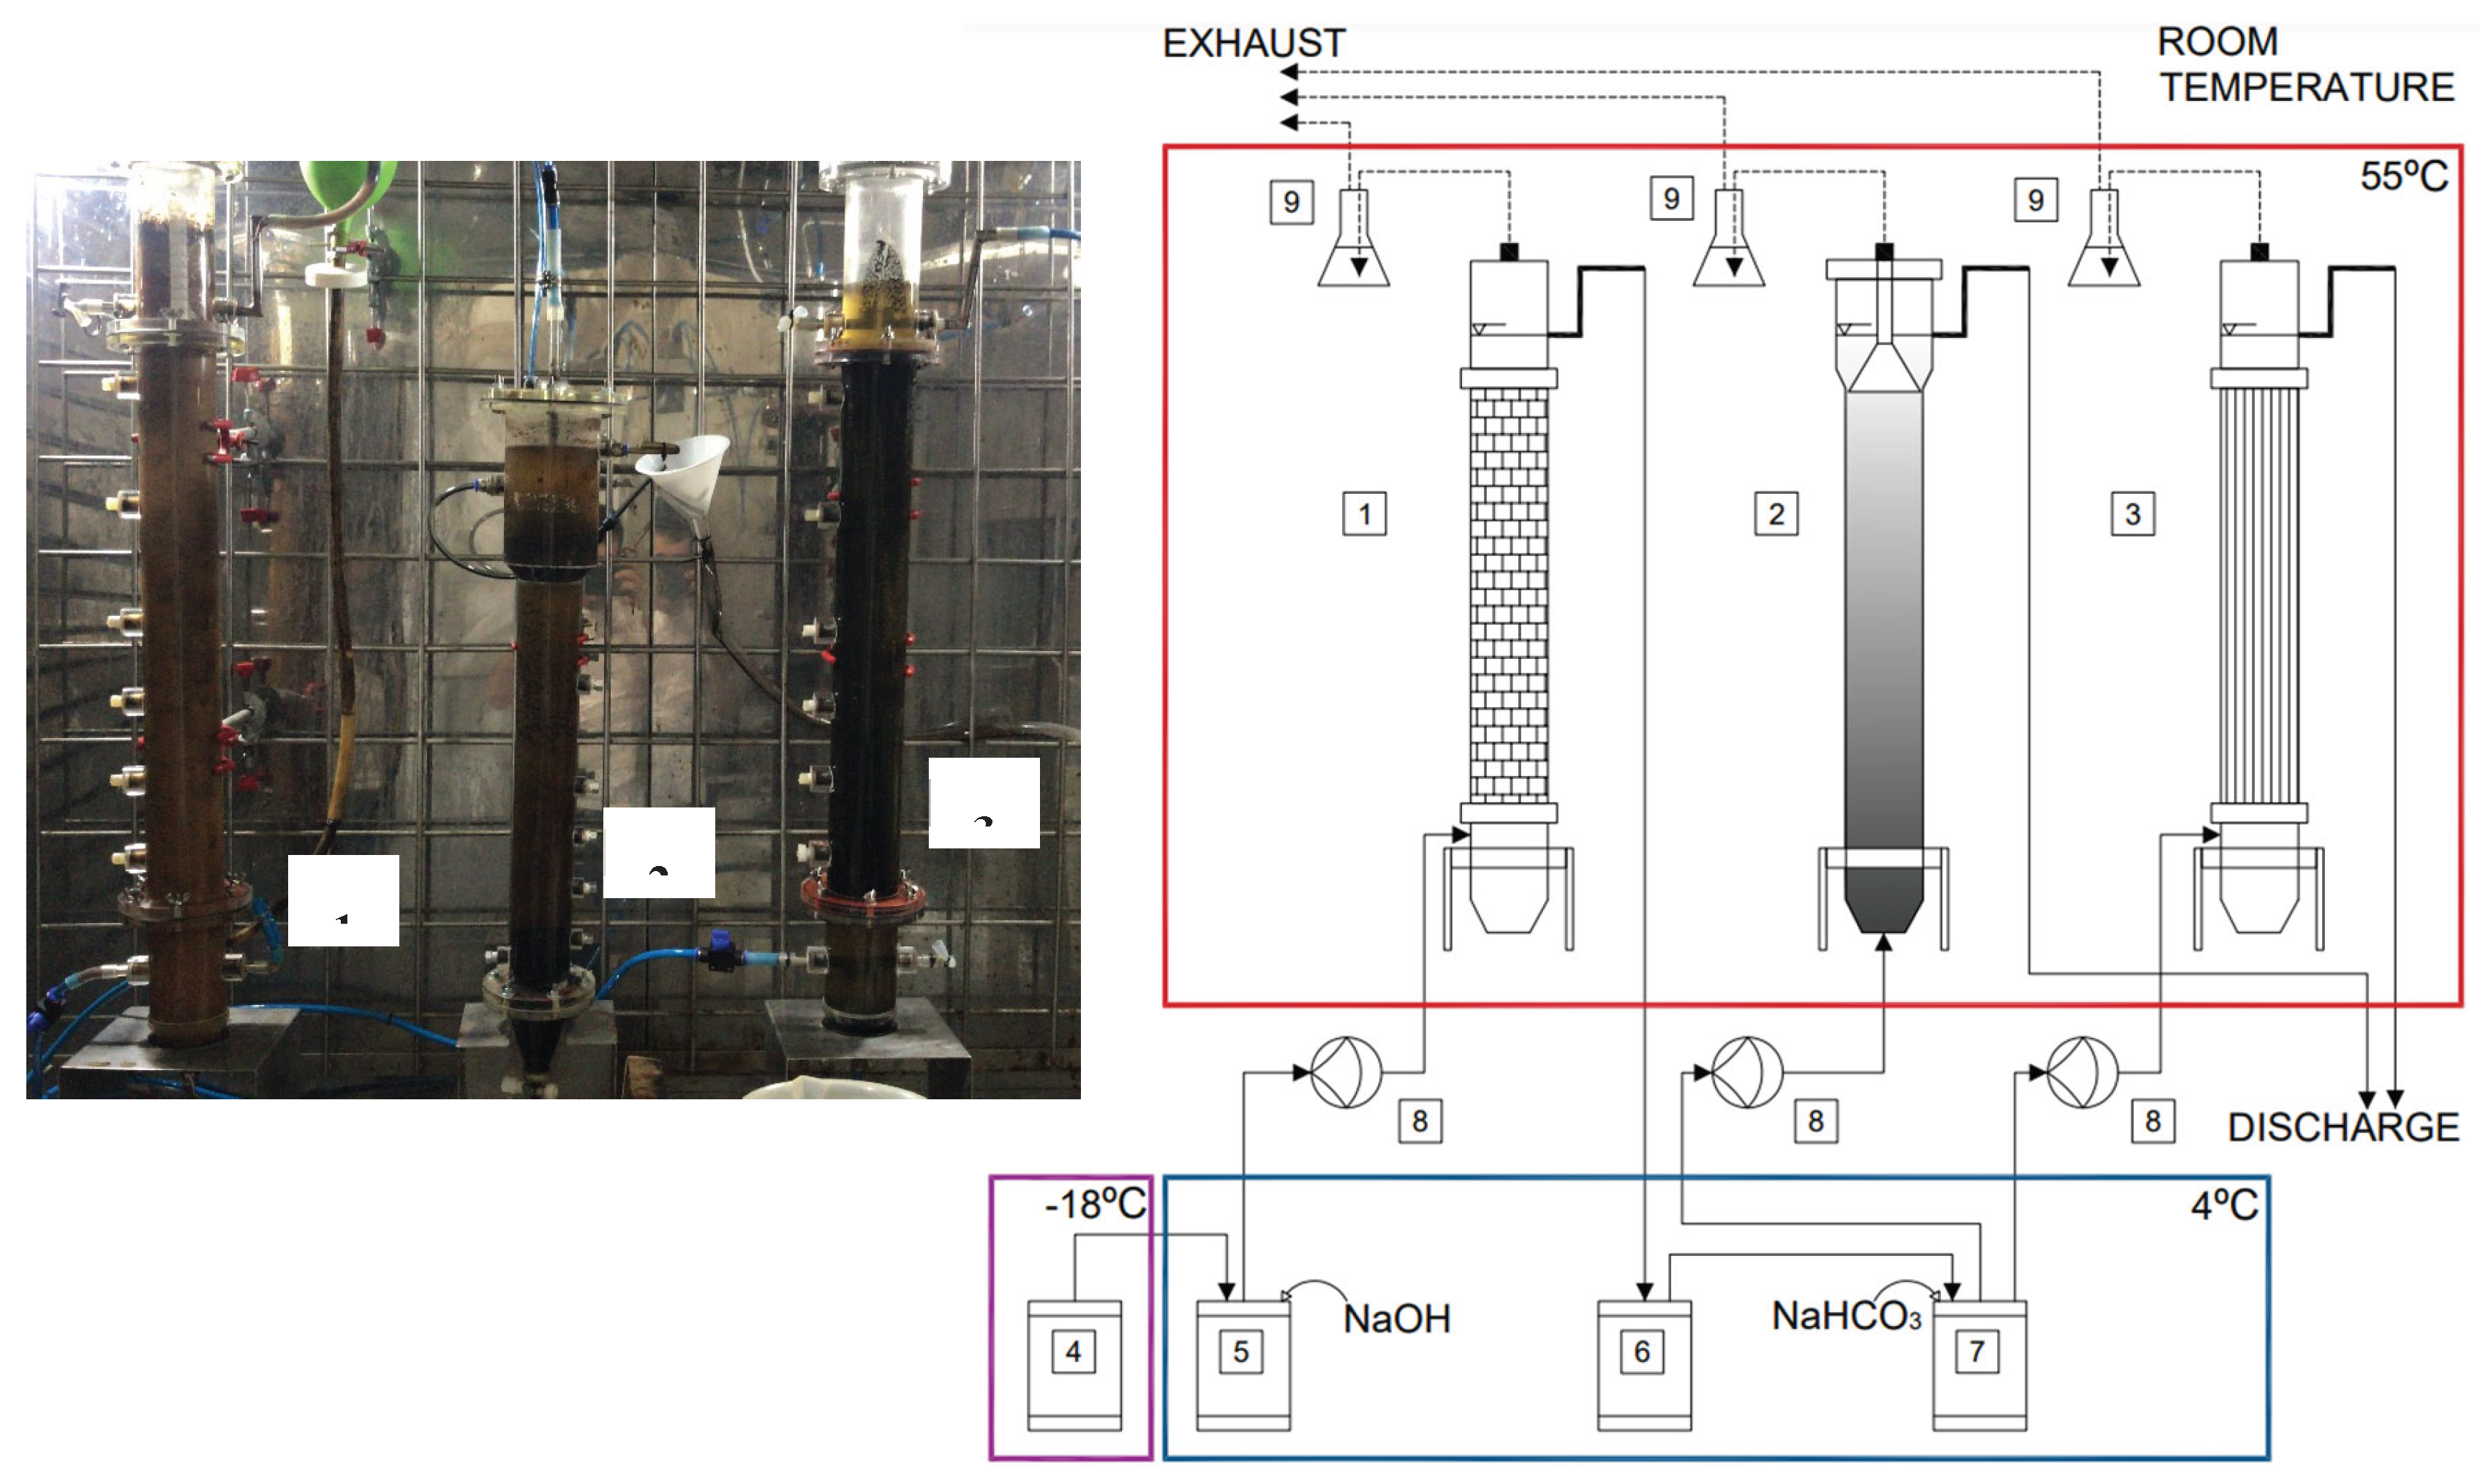
Figure 2.
Experimental setup flowchart showing the flow of liquids (solid arrows) and gases (dashed arrows), and sampling ports used for regular monitoring.
Figure 2.
Experimental setup flowchart showing the flow of liquids (solid arrows) and gases (dashed arrows), and sampling ports used for regular monitoring.
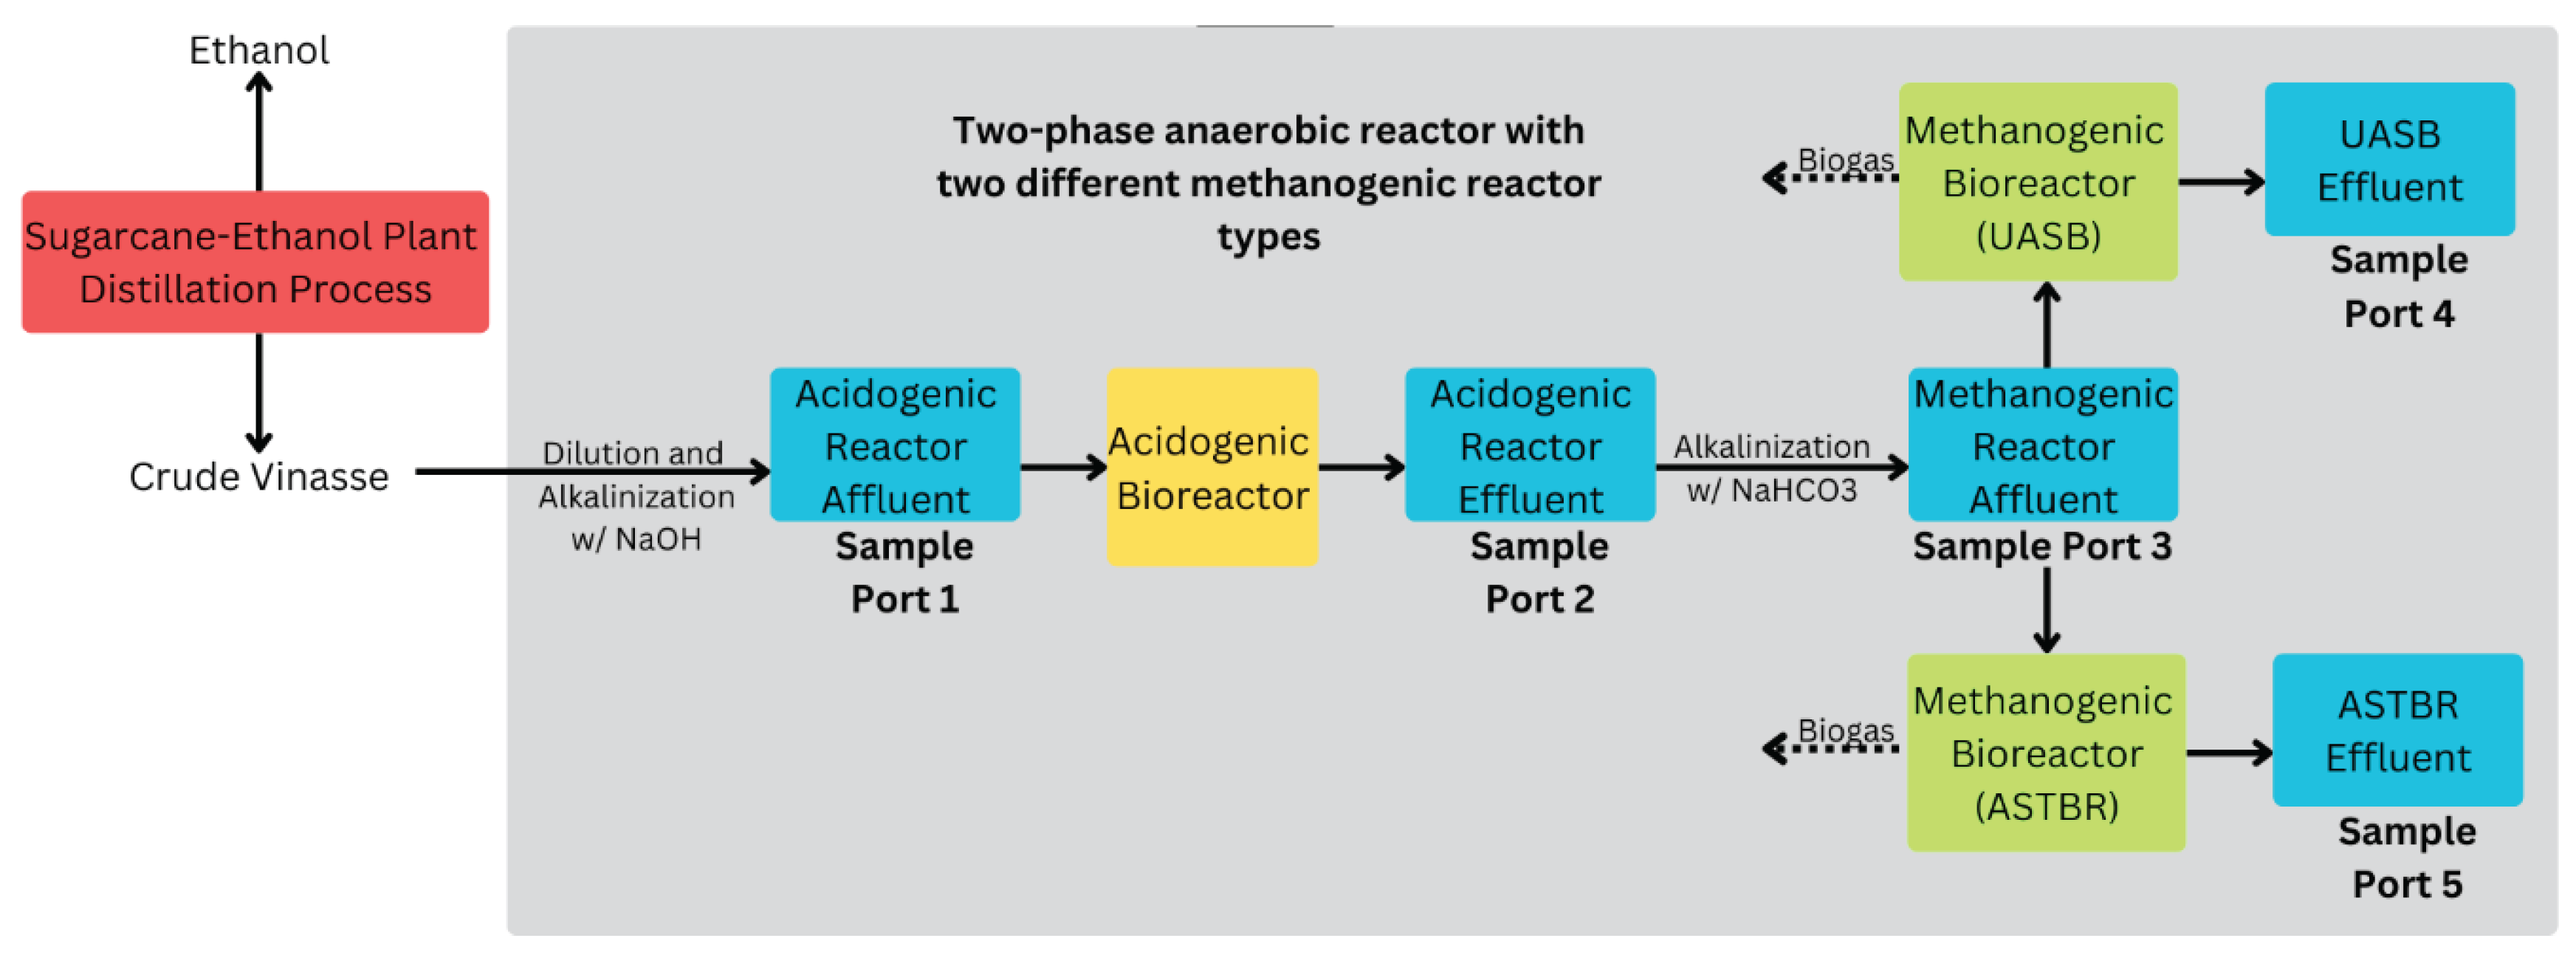
Figure 3.
COD removal (%) 7-day moving average in all stages of this study across both methanogenic reactors divided into phases: Phase 0 - feedstock not containing any monensin; Phase 1 – addition of 20 ng monensin/mL feedstock; Phase 2 – addition of 50 ng monensin/mL feedstock; Phase 3 – addition of 100 ng monensin/mL feedstock; Phase 4 – addition of 2000 ng monensin/mL feedstock.

Figure 4.
Average AOS released by the acidogenic ASTBR per phase of operation.
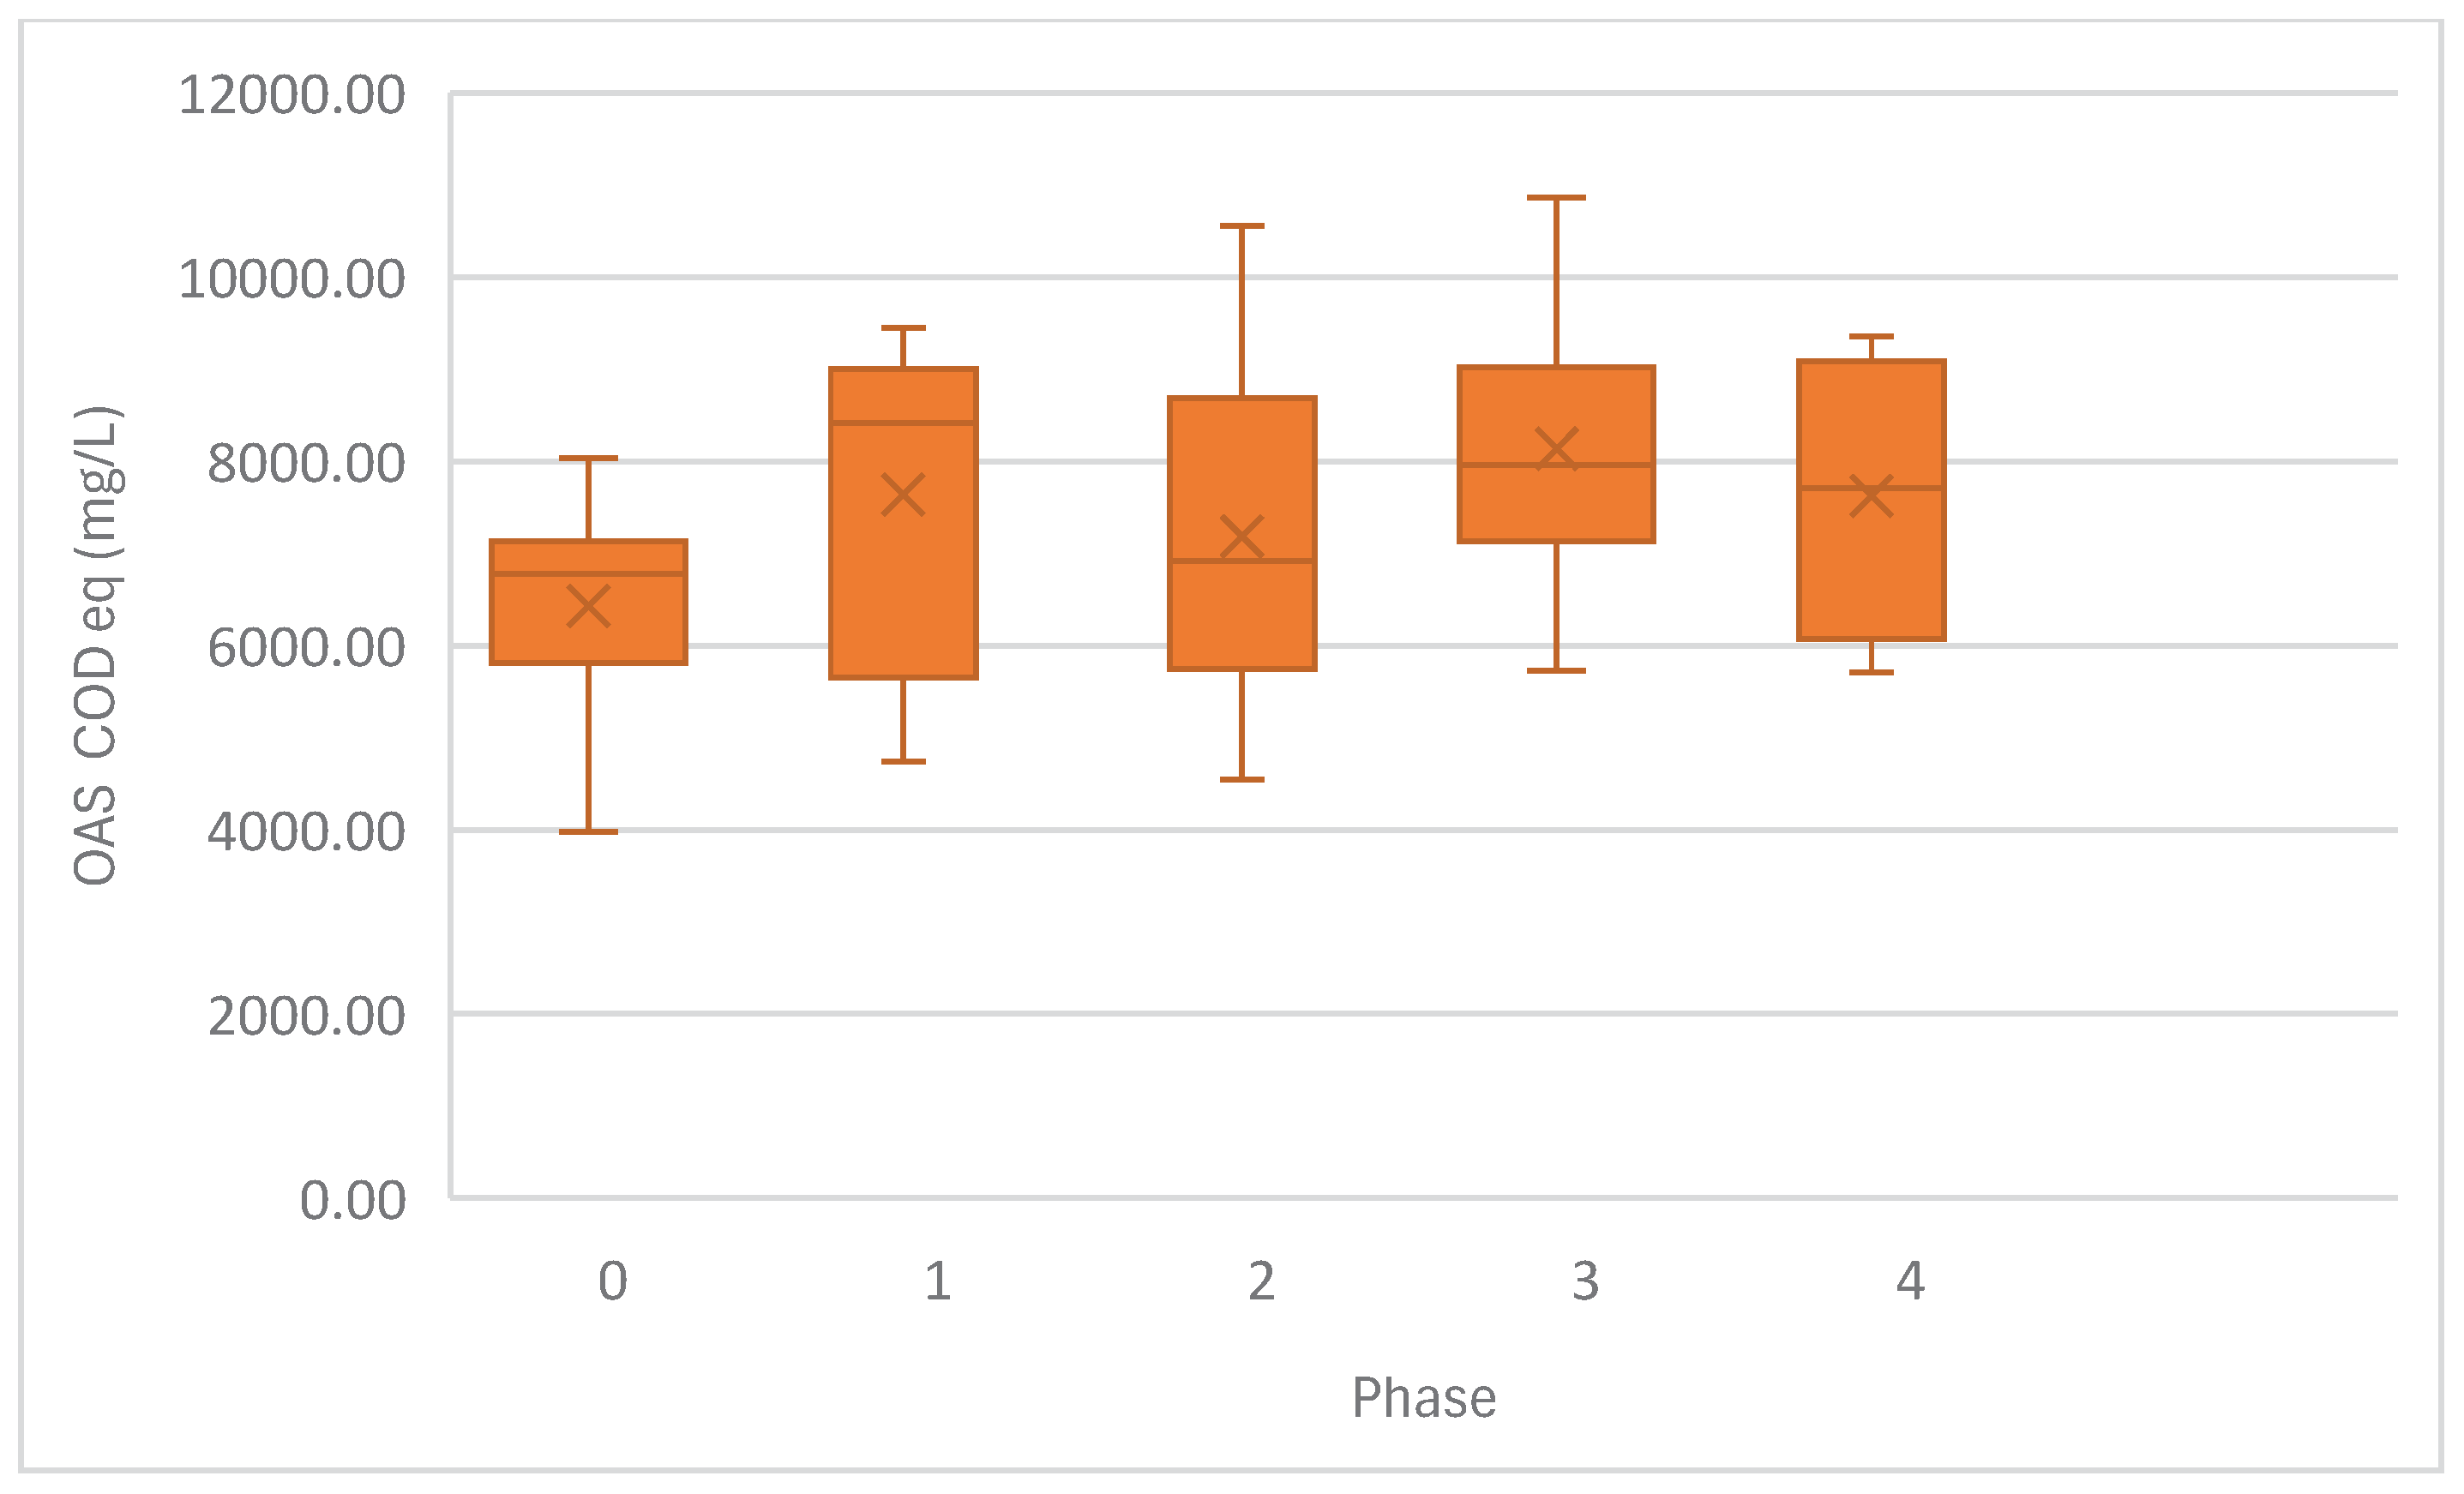
Figure 5.
MON removal in the acidogenic phase showing high capacity to reduce monensin presence in vinasse whether in trace amounts, as in Phases 1--3, or in accidental high dose discharge, as in Phase 4.
Figure 5.
MON removal in the acidogenic phase showing high capacity to reduce monensin presence in vinasse whether in trace amounts, as in Phases 1--3, or in accidental high dose discharge, as in Phase 4.
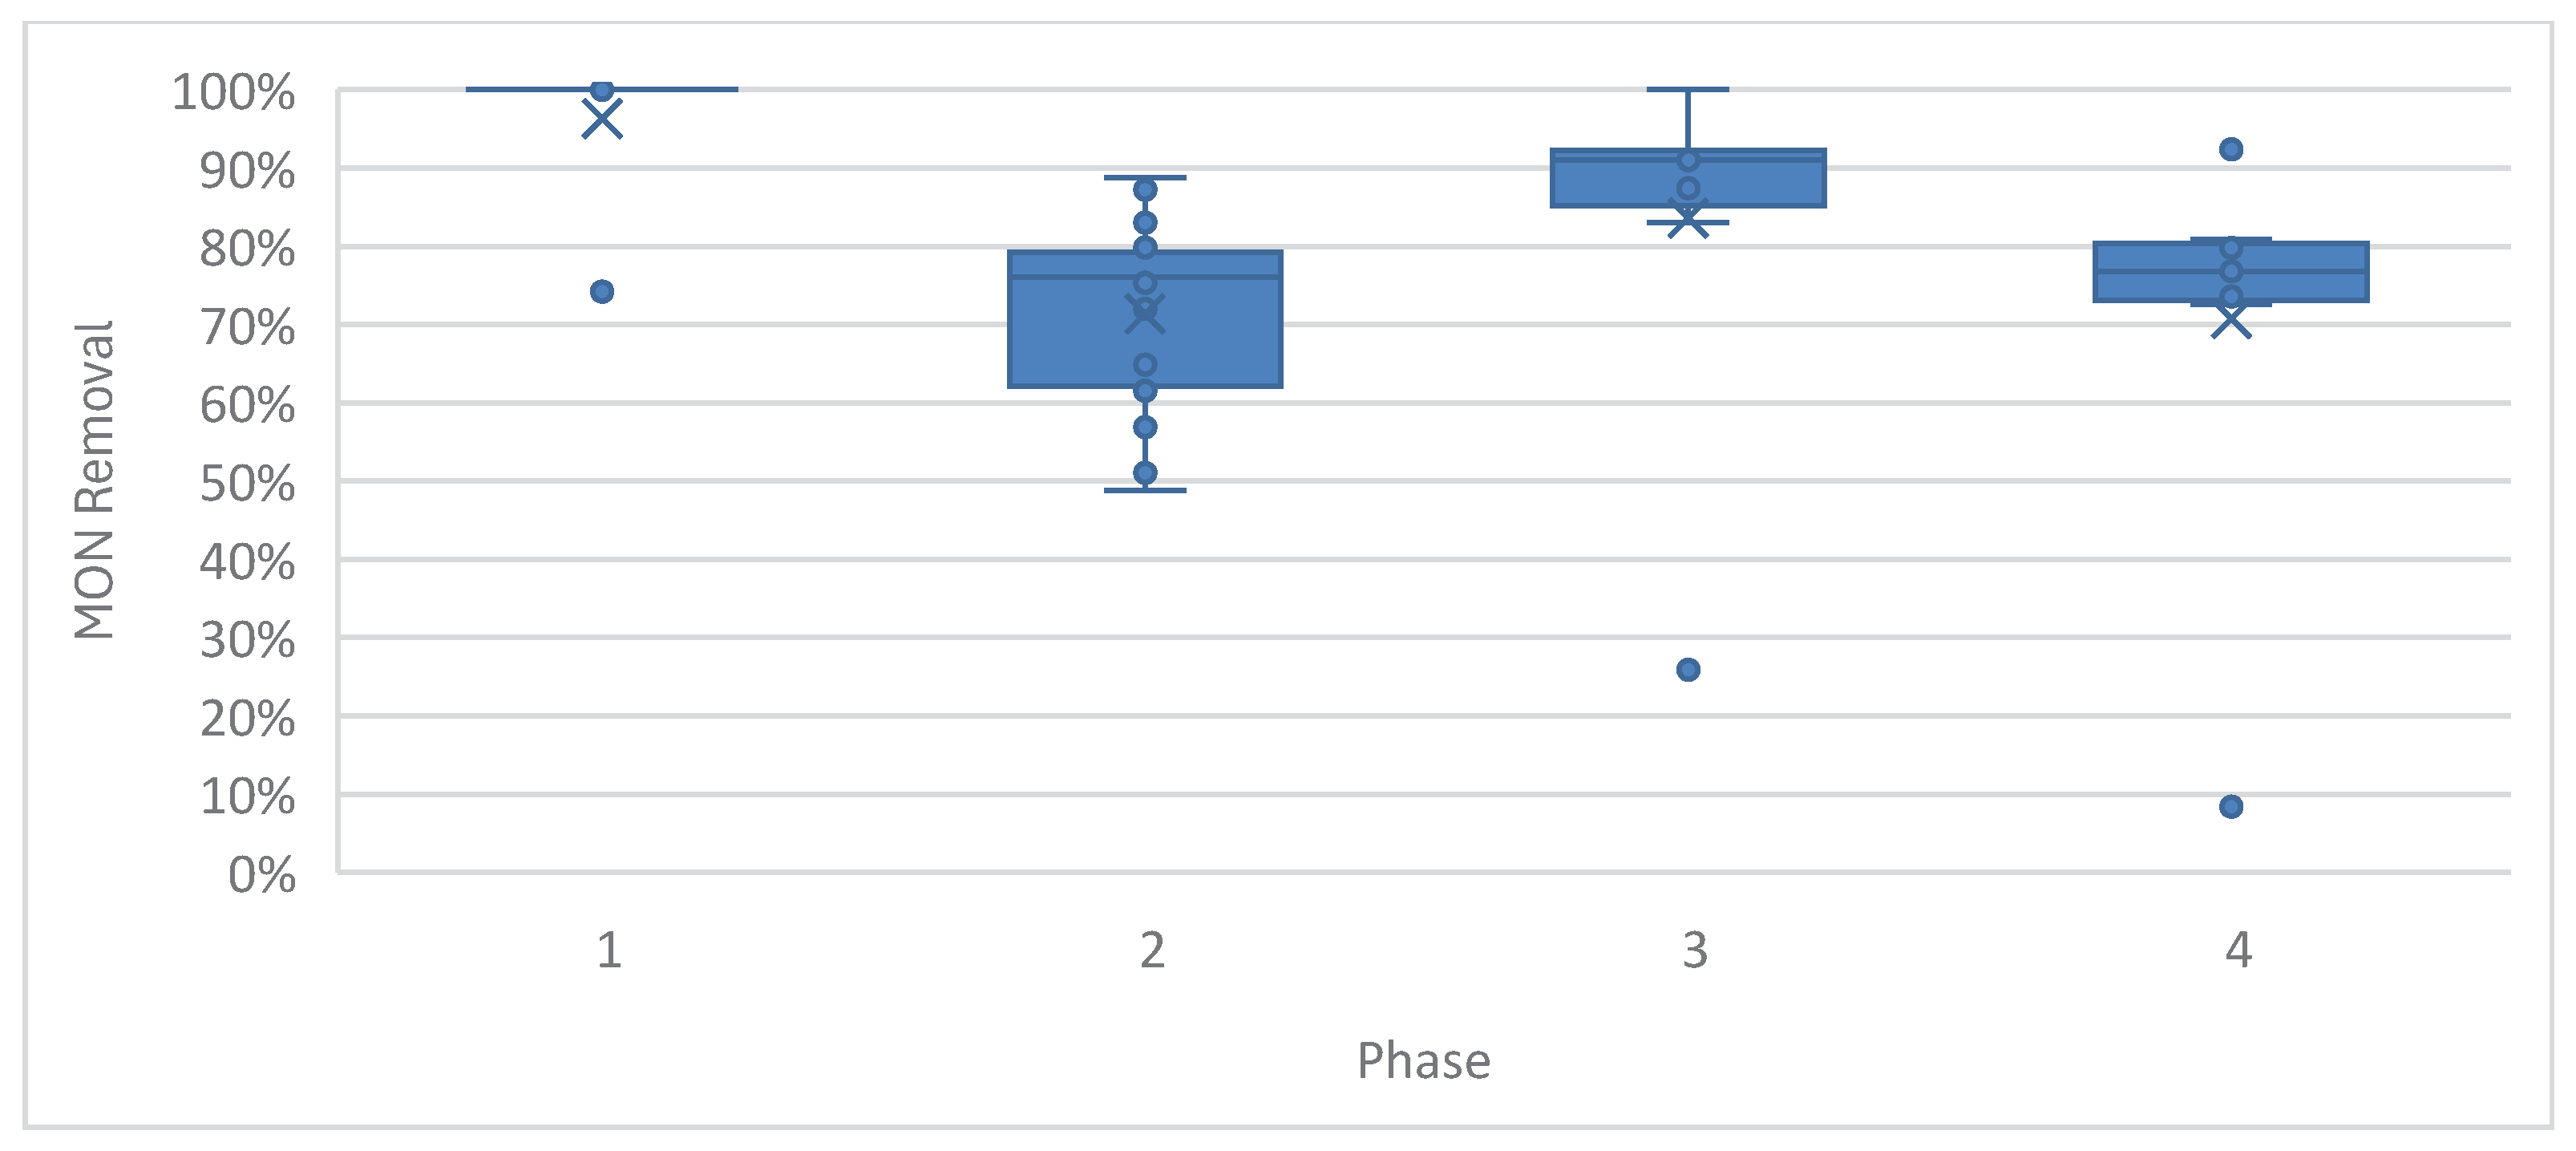
Figure 6.
The average production of acetone, n-butanol, propionic acid, isobutyric acid, butyric acid, isovaleric acid, valeric acid, and caproic acid in the acidogenic ASTBR reactor normalized as COD equivalent (mg/L).
Figure 6.
The average production of acetone, n-butanol, propionic acid, isobutyric acid, butyric acid, isovaleric acid, valeric acid, and caproic acid in the acidogenic ASTBR reactor normalized as COD equivalent (mg/L).
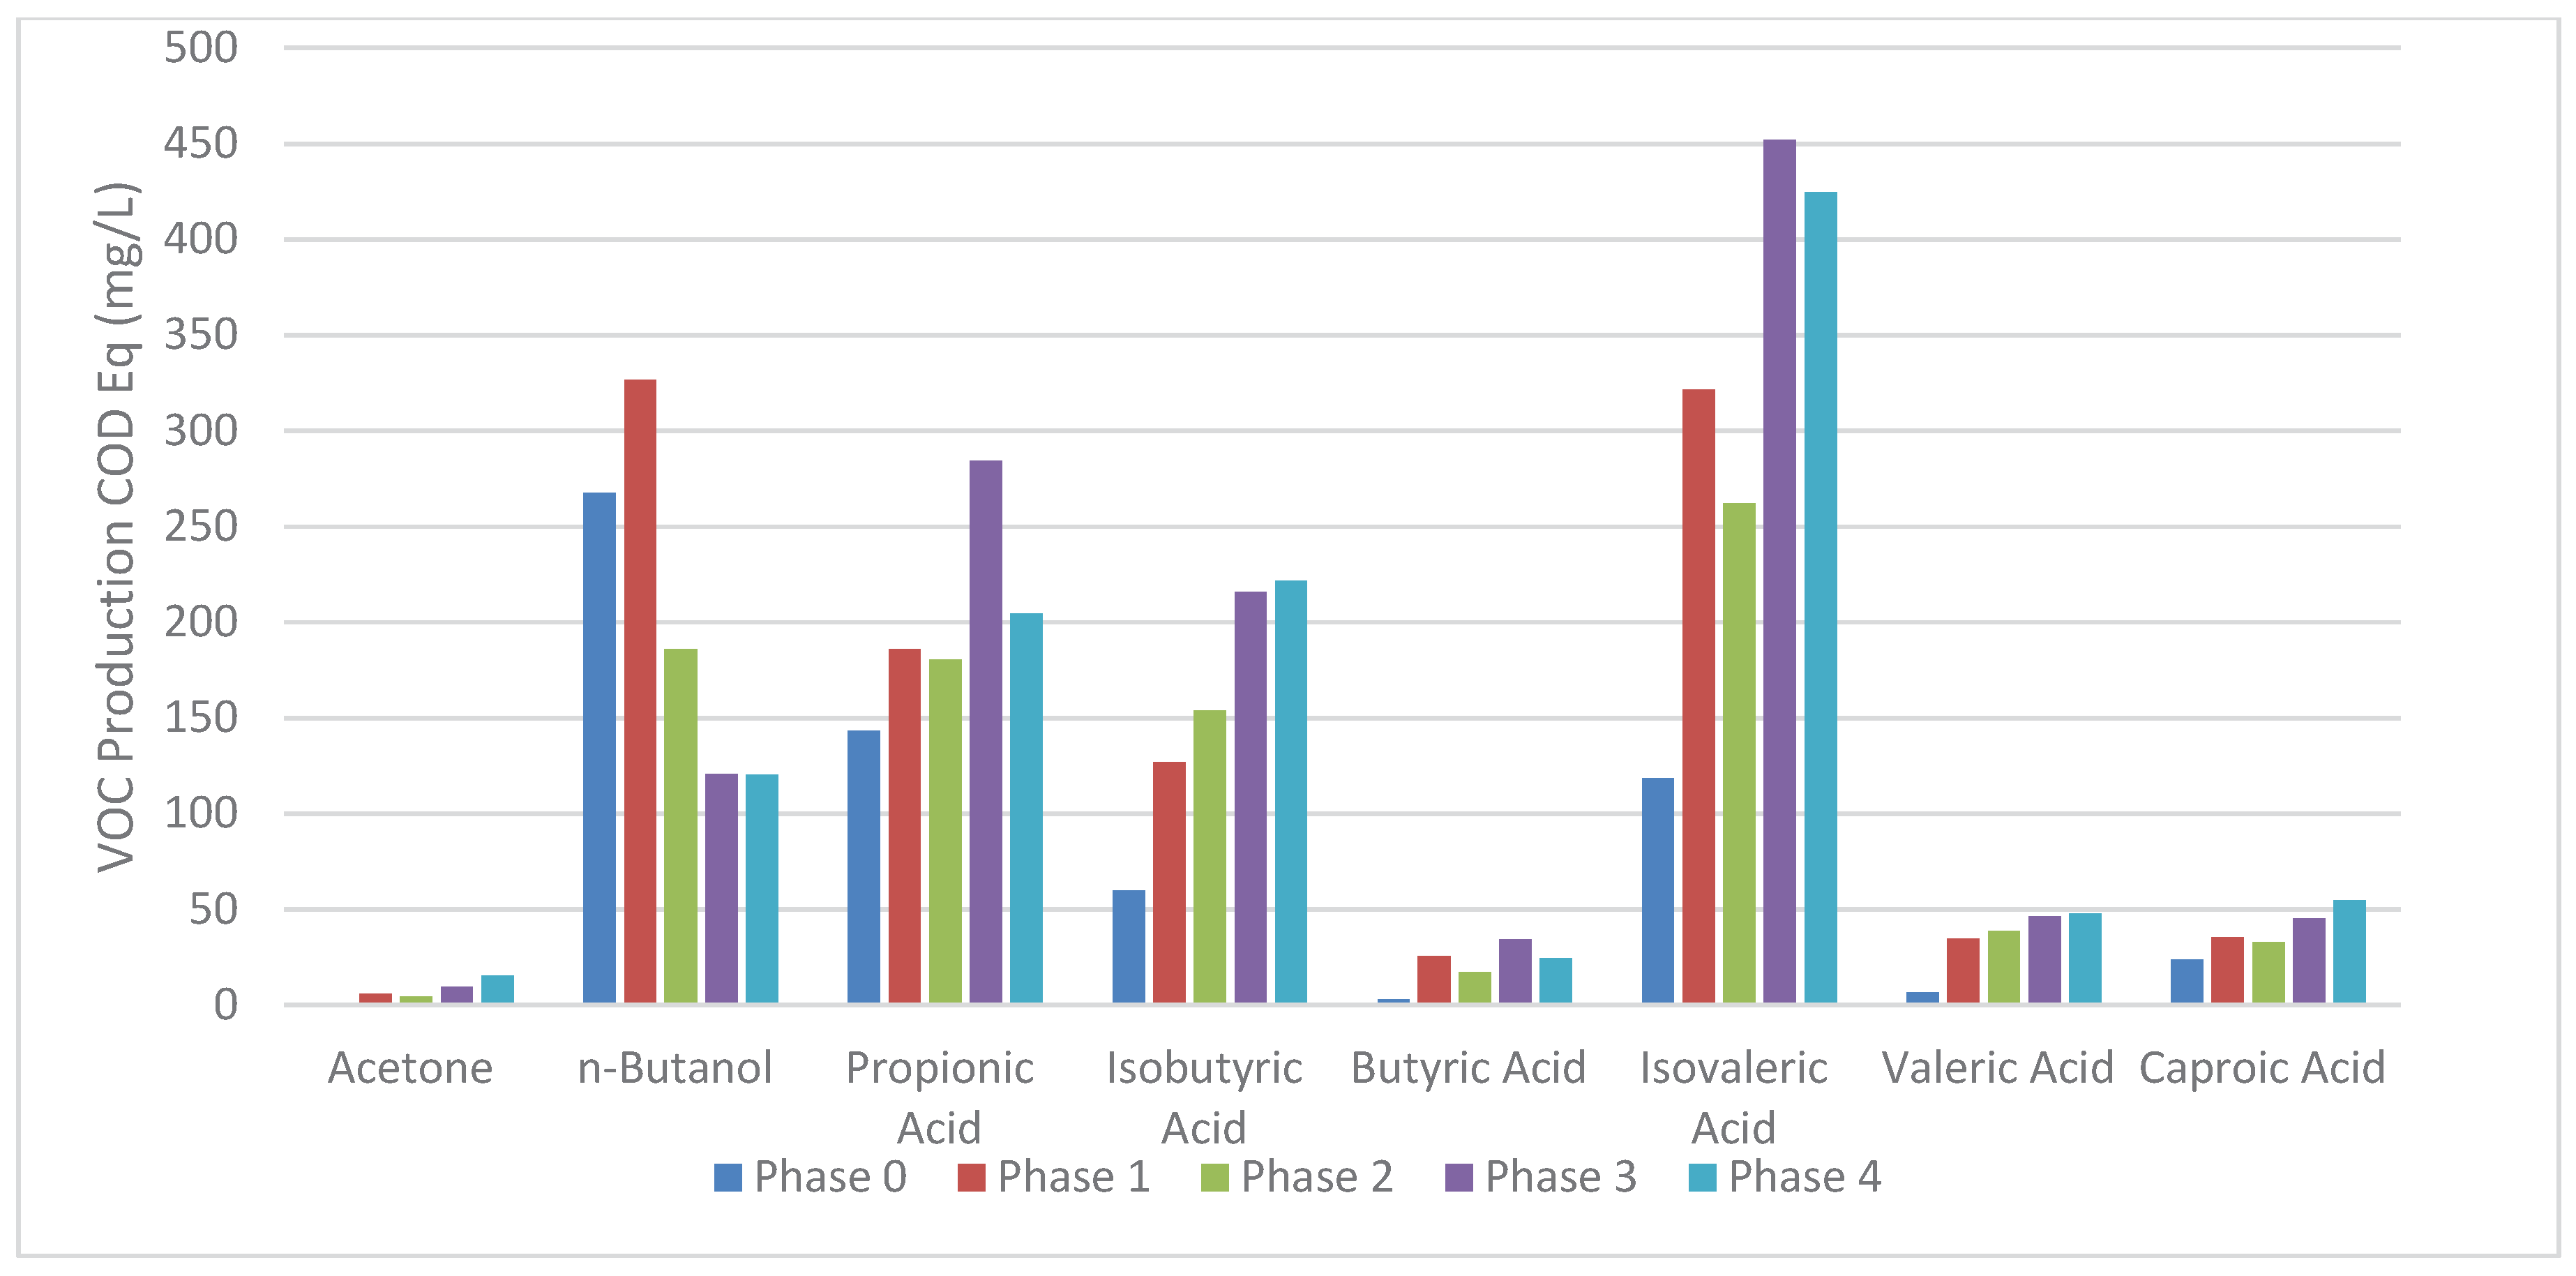
Figure 7.
COD removal from fermented sugarcane vinasse in the methanogenic UASB (average = 44%) versus the methanogenic ASTBR (average = 62%) across 254 days of this study.
Figure 7.
COD removal from fermented sugarcane vinasse in the methanogenic UASB (average = 44%) versus the methanogenic ASTBR (average = 62%) across 254 days of this study.
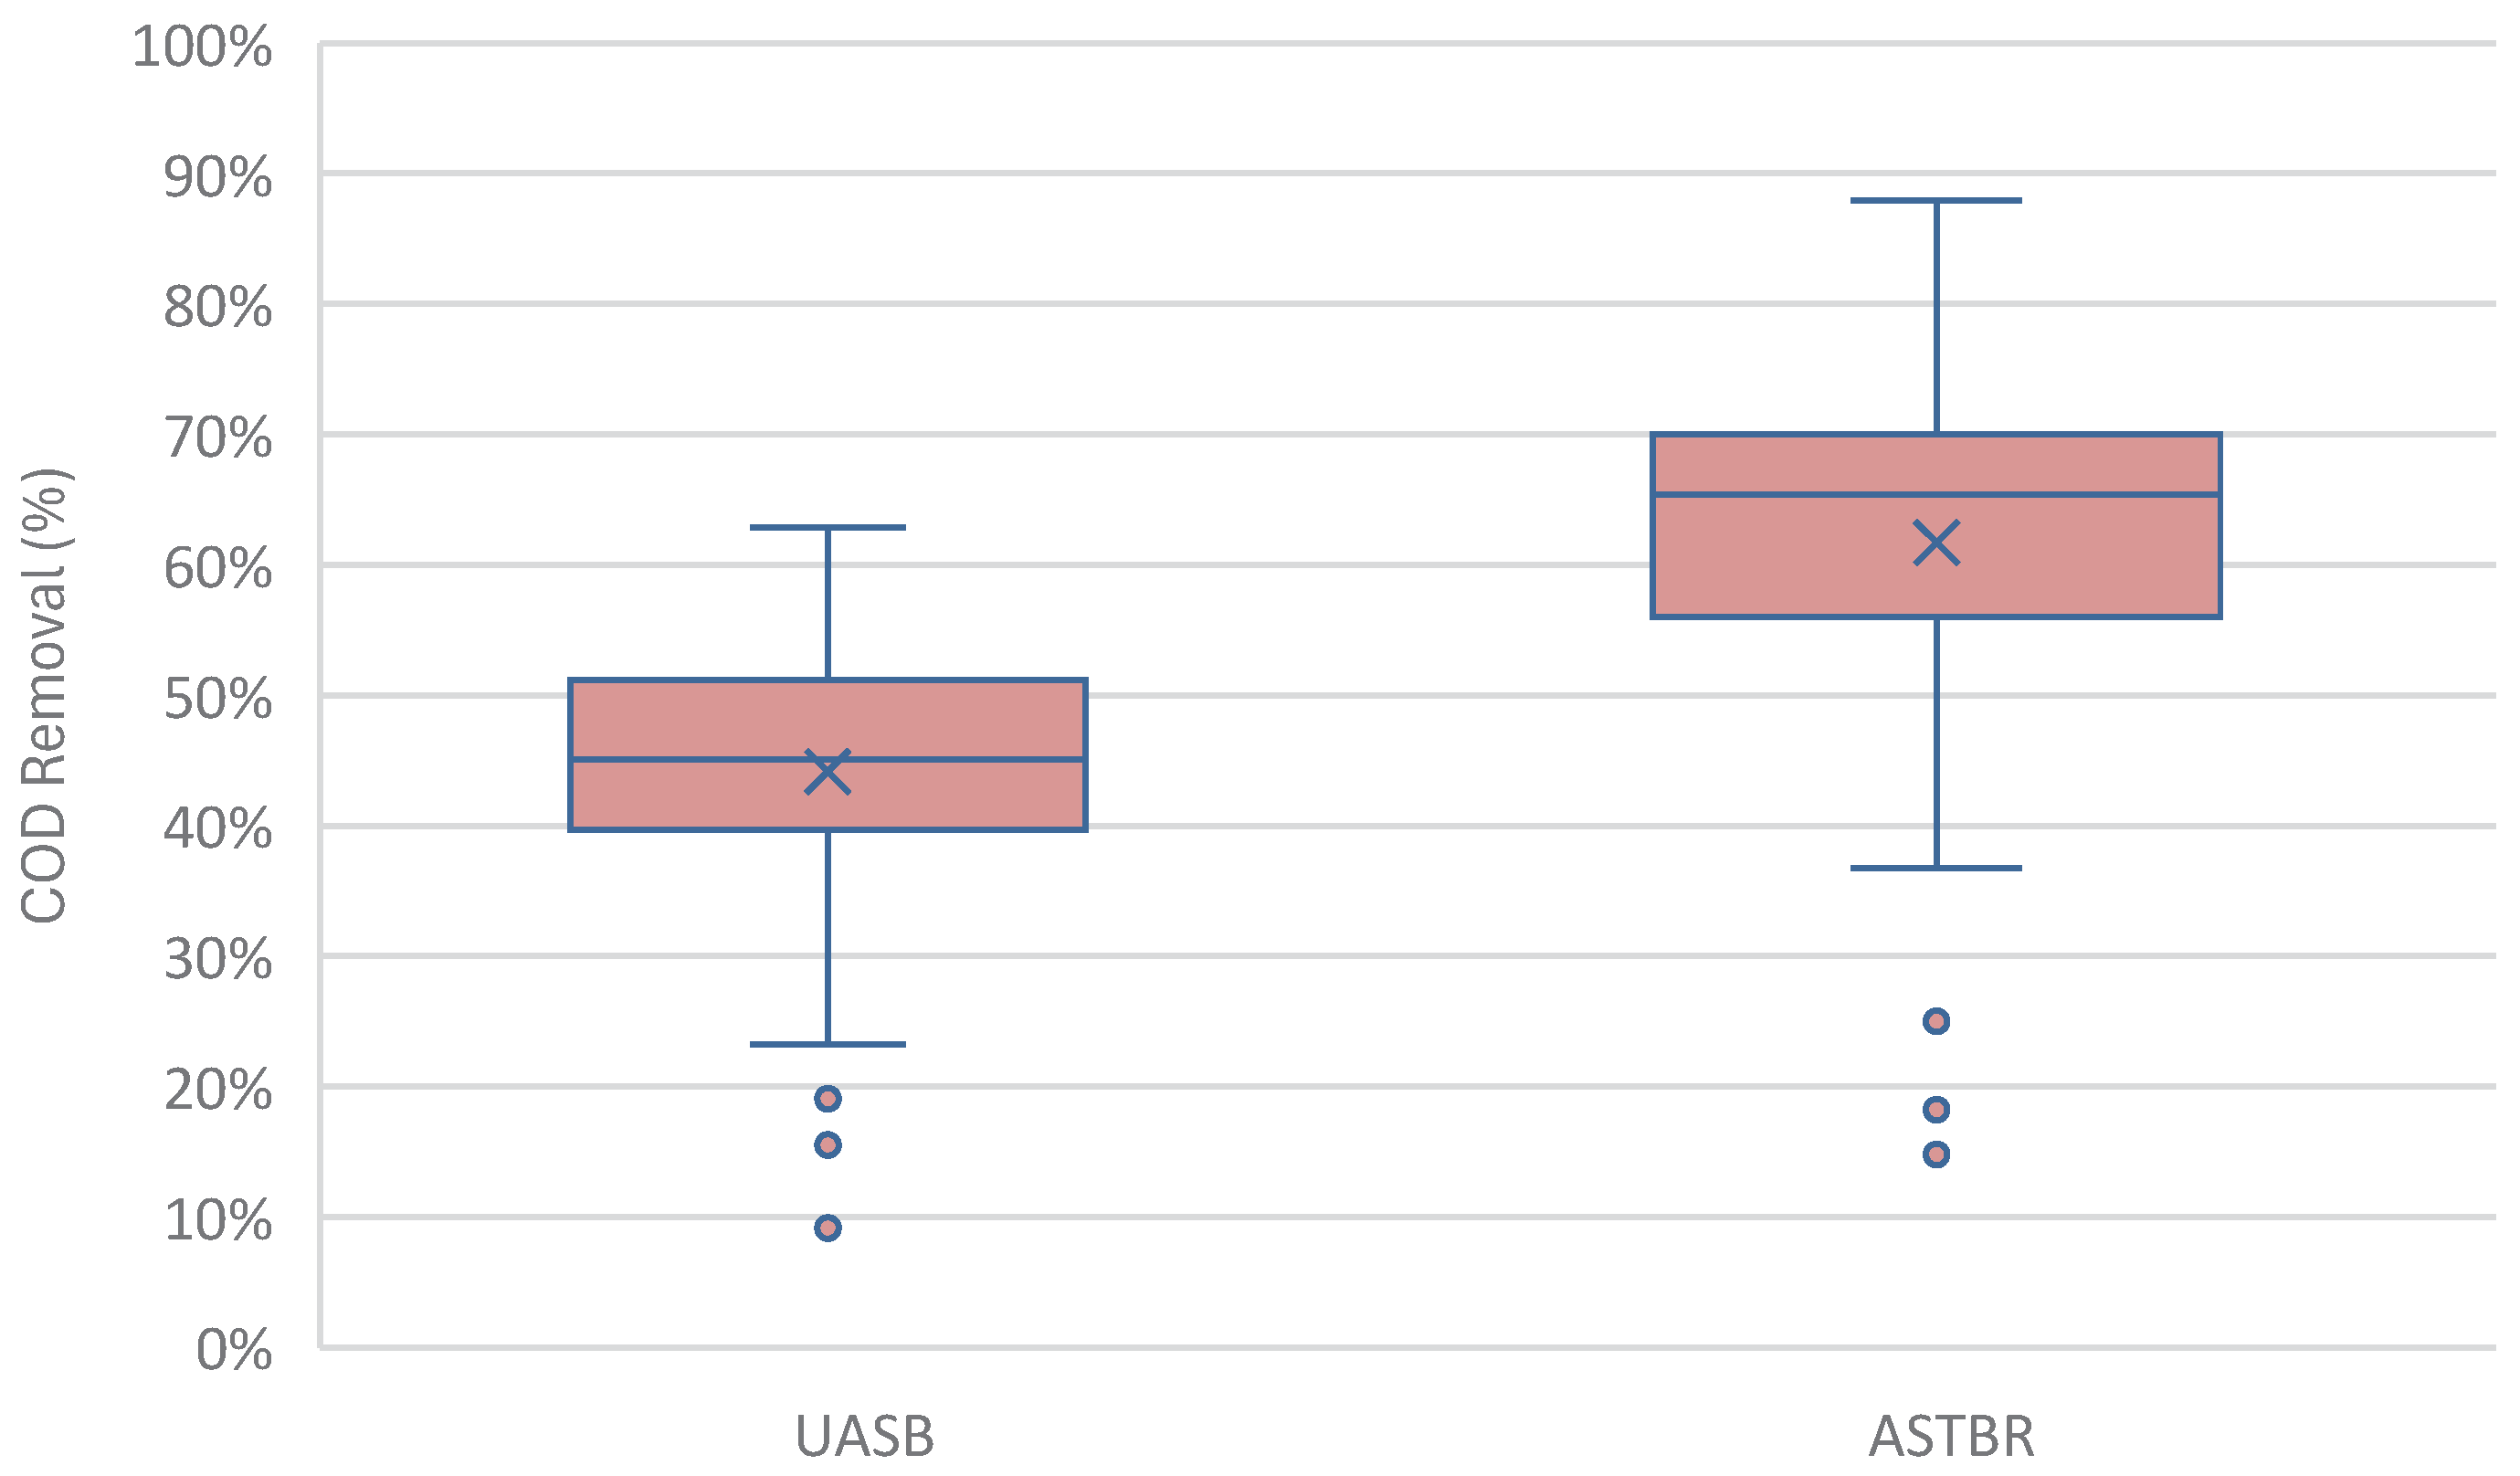
Figure 8.
Monensin removal (%) in each phase of operation, per methanogenic reactor.
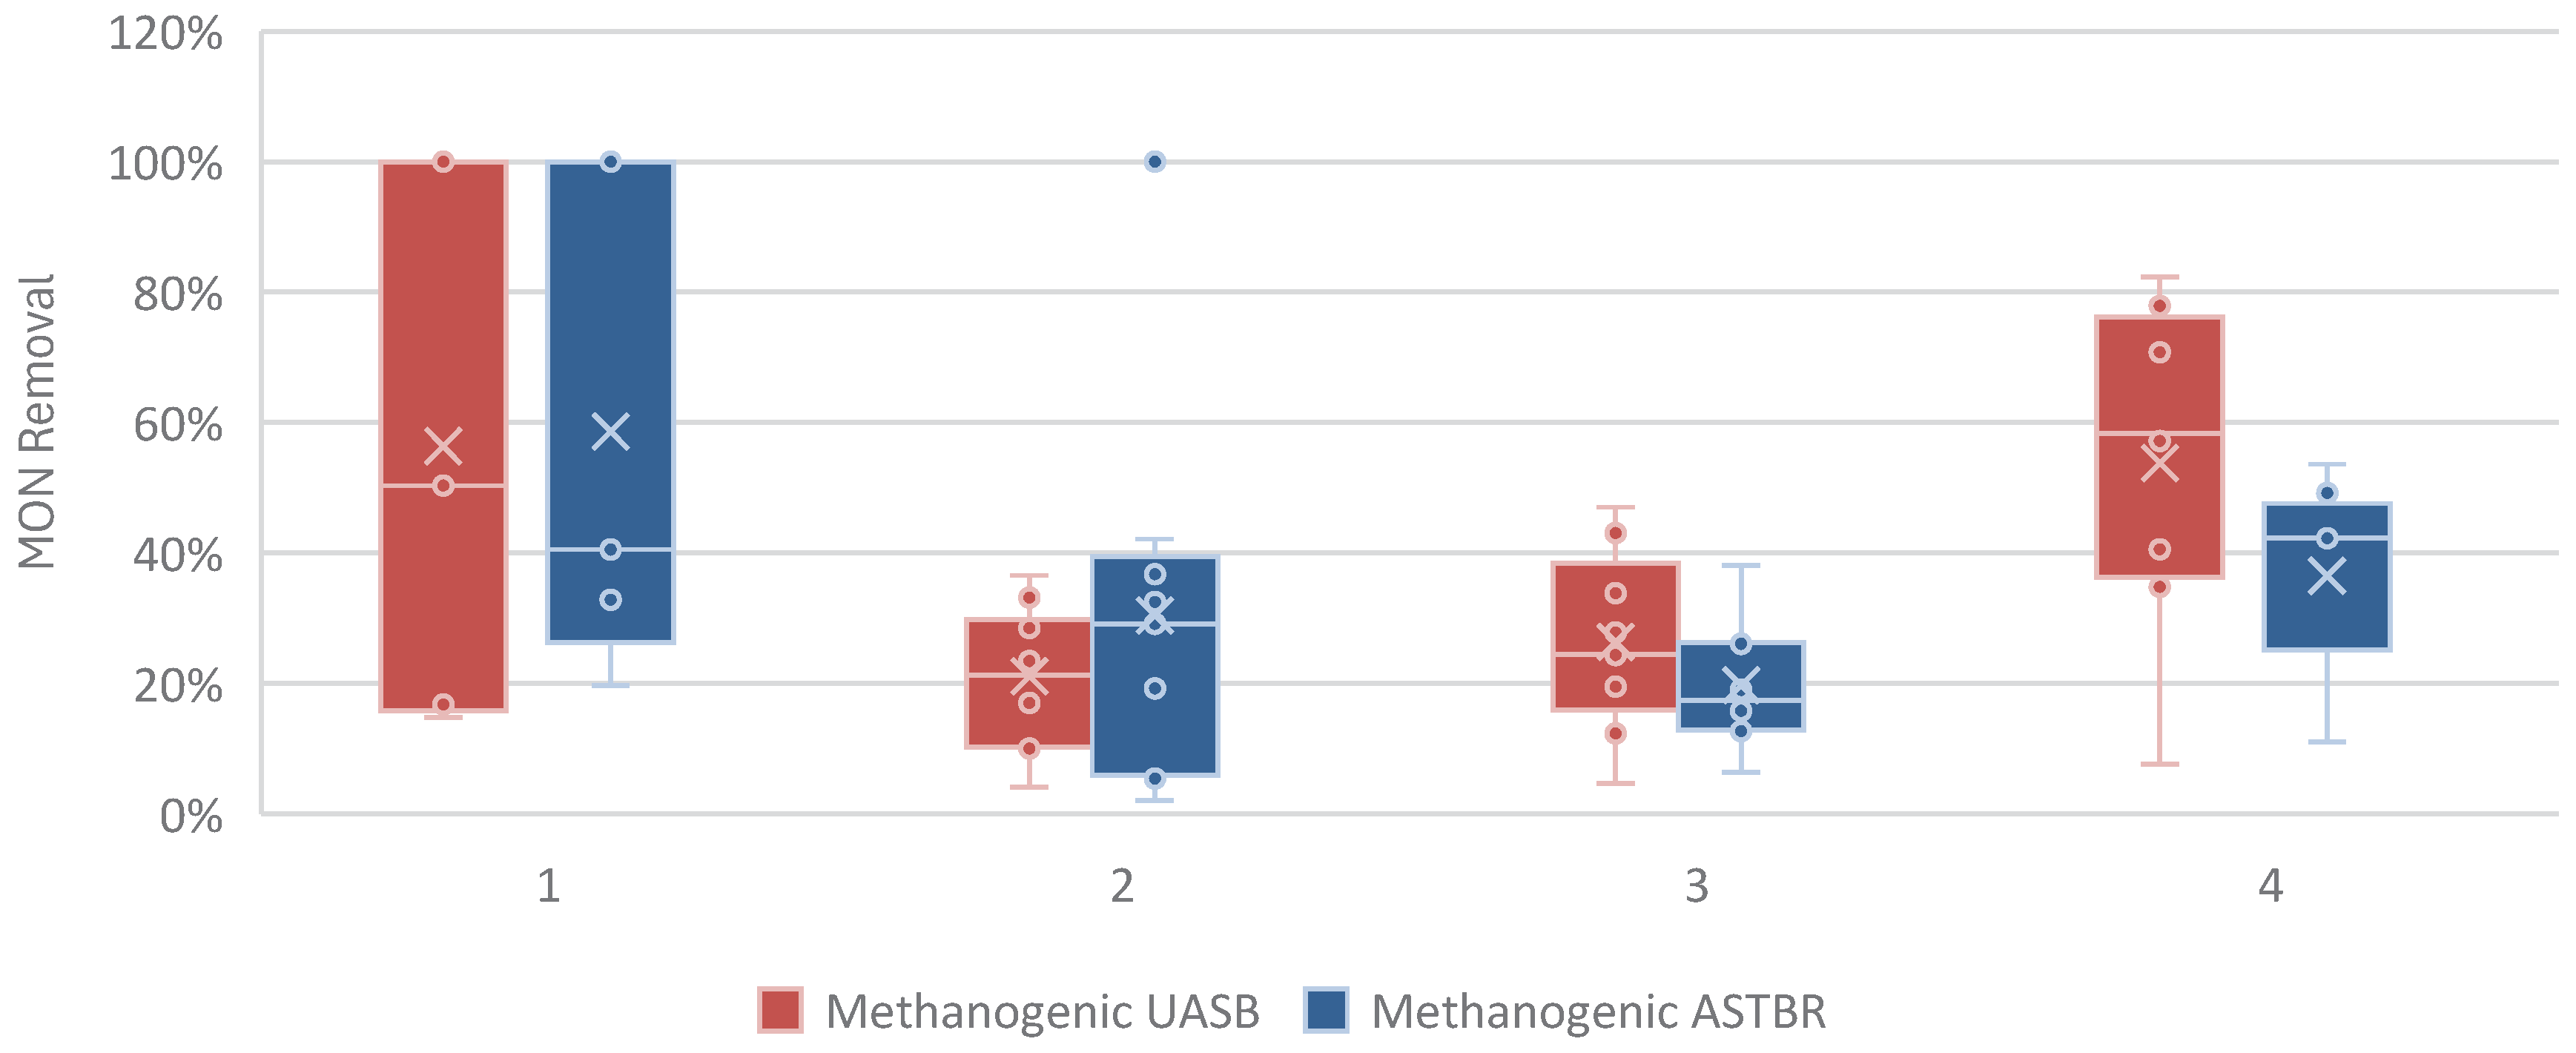
Figure 9.
COD Removal (%) in methanogenic reactors per Phase showing consistent performance at varying trace concentrations of MON, while suffering significant drop at high concentrations.
Figure 9.
COD Removal (%) in methanogenic reactors per Phase showing consistent performance at varying trace concentrations of MON, while suffering significant drop at high concentrations.
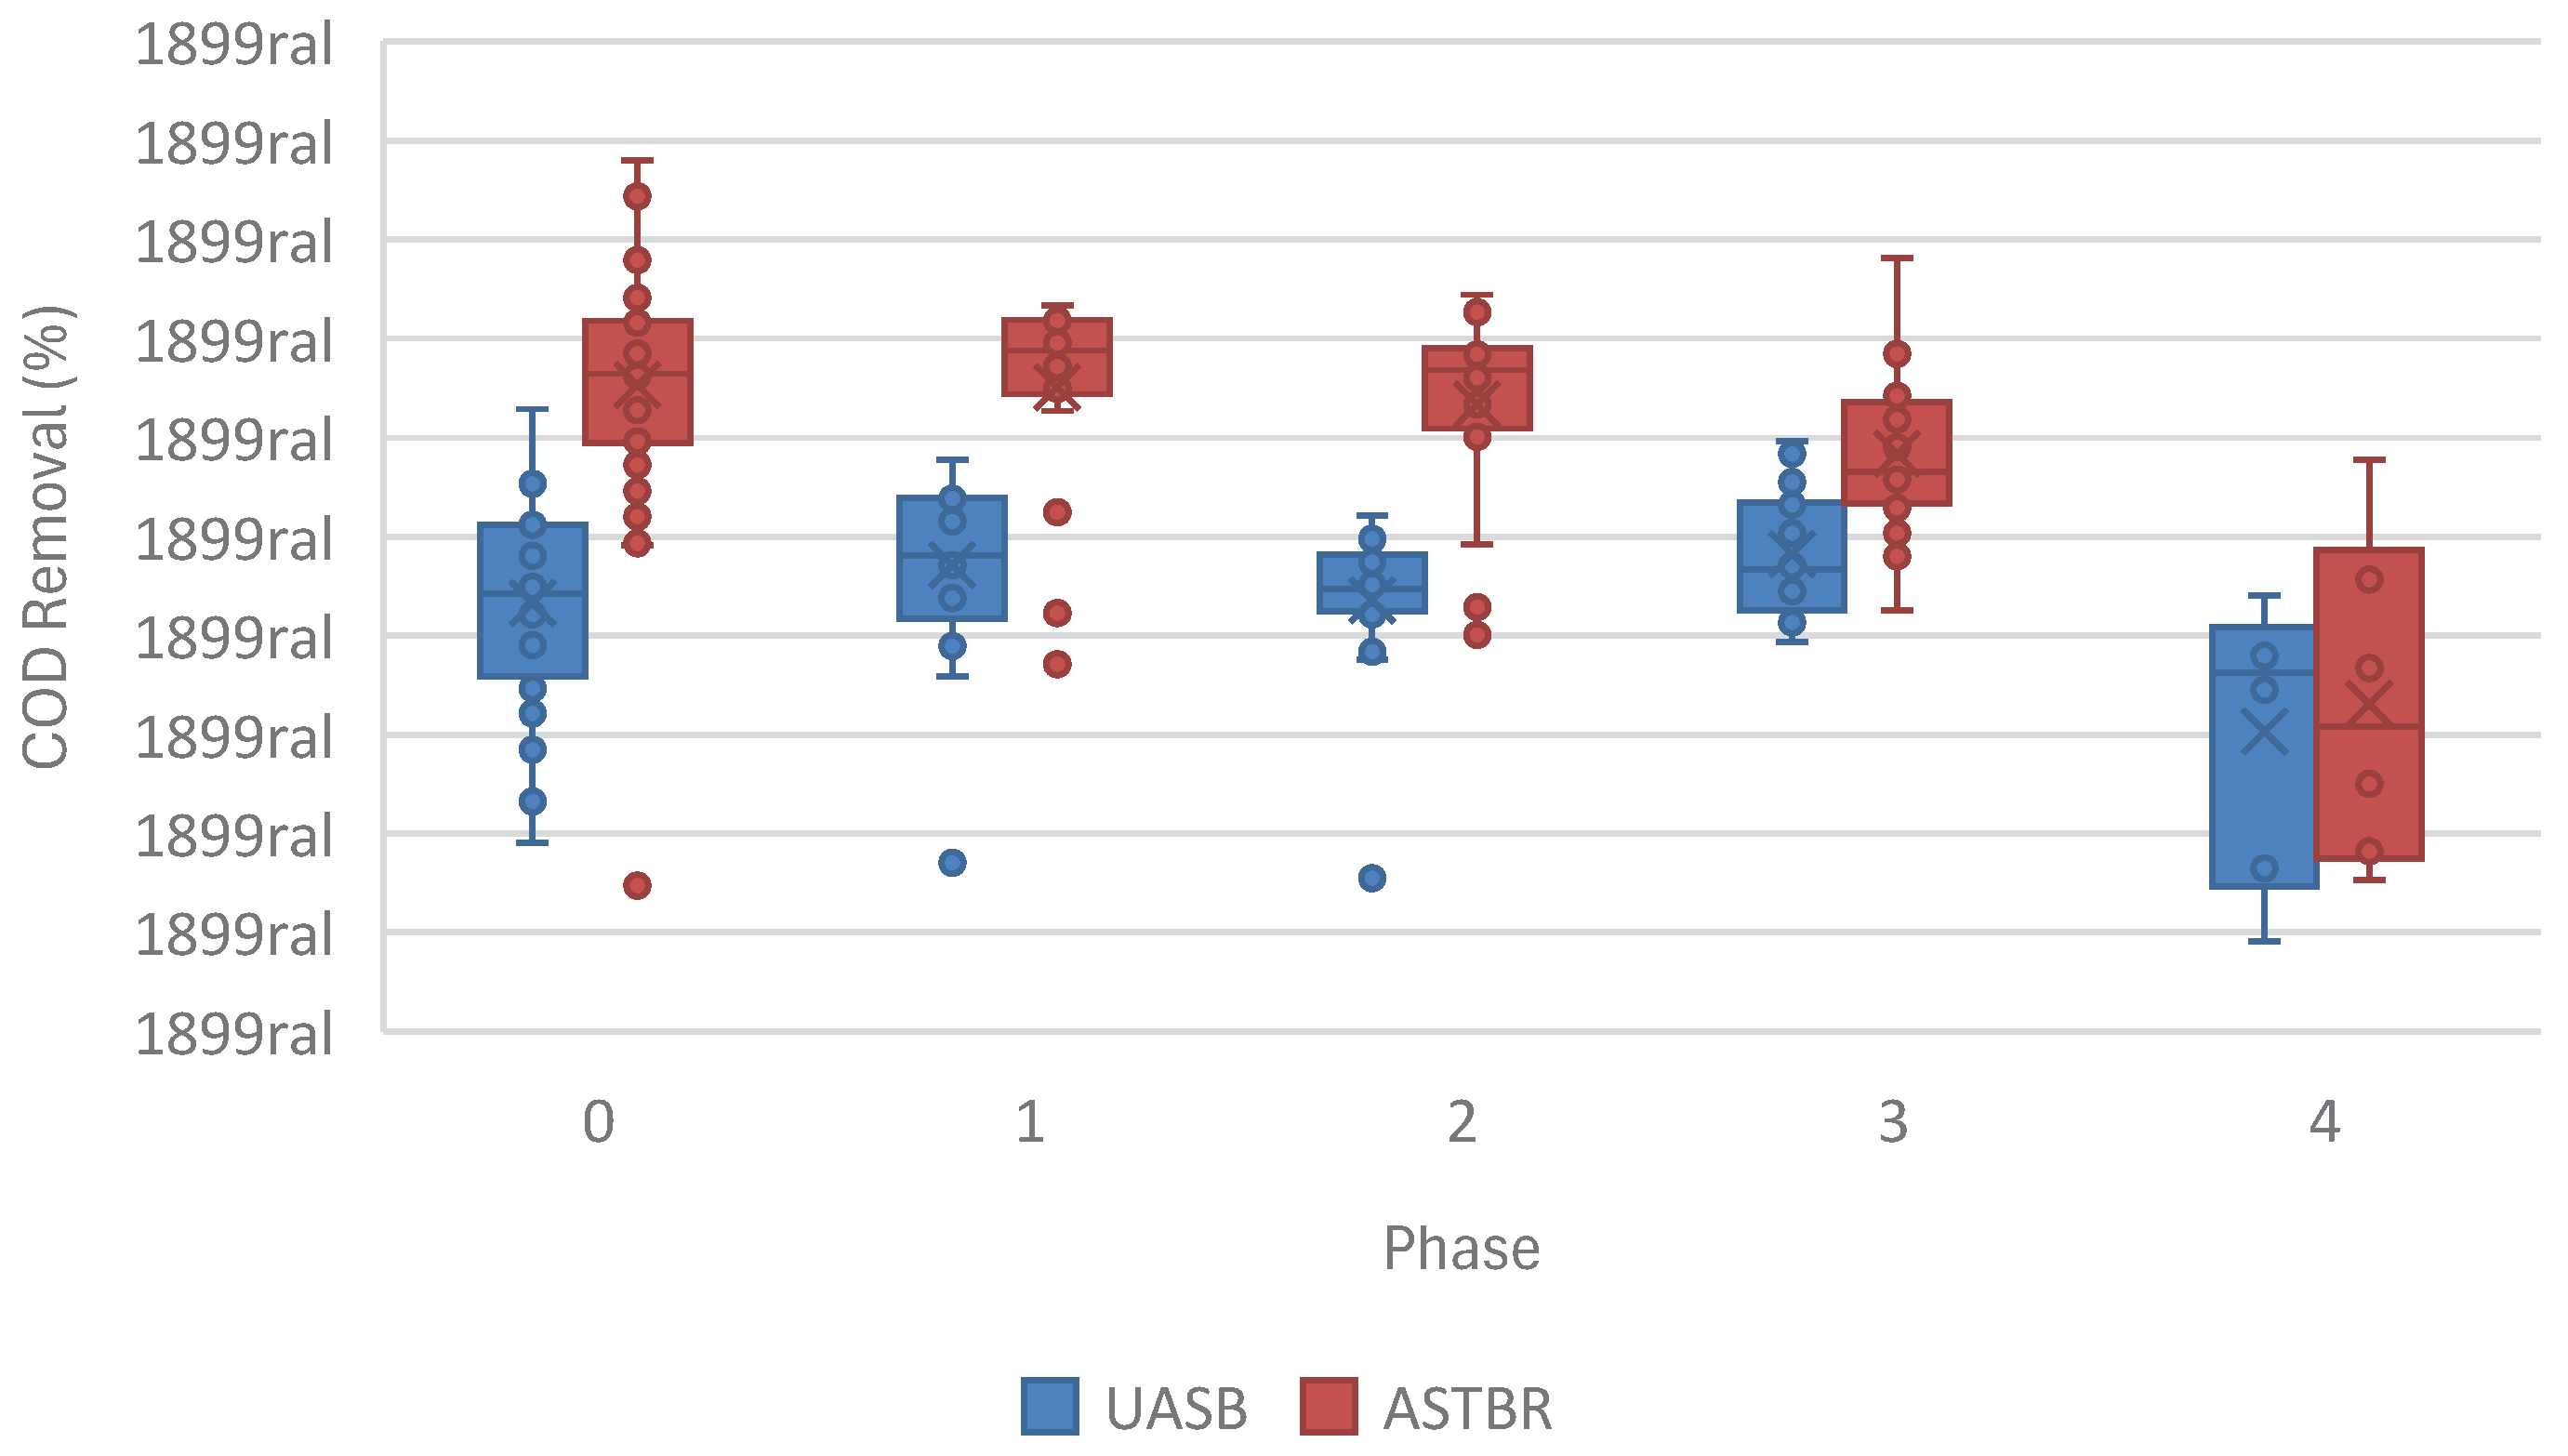
Figure 10.
Showing increased VMP (L CH4/d L) in the methanogenic reactors in the presence of trace concentrations of monensin in the two-phase system, while dropping suddenly at higher concentrations.
Figure 10.
Showing increased VMP (L CH4/d L) in the methanogenic reactors in the presence of trace concentrations of monensin in the two-phase system, while dropping suddenly at higher concentrations.
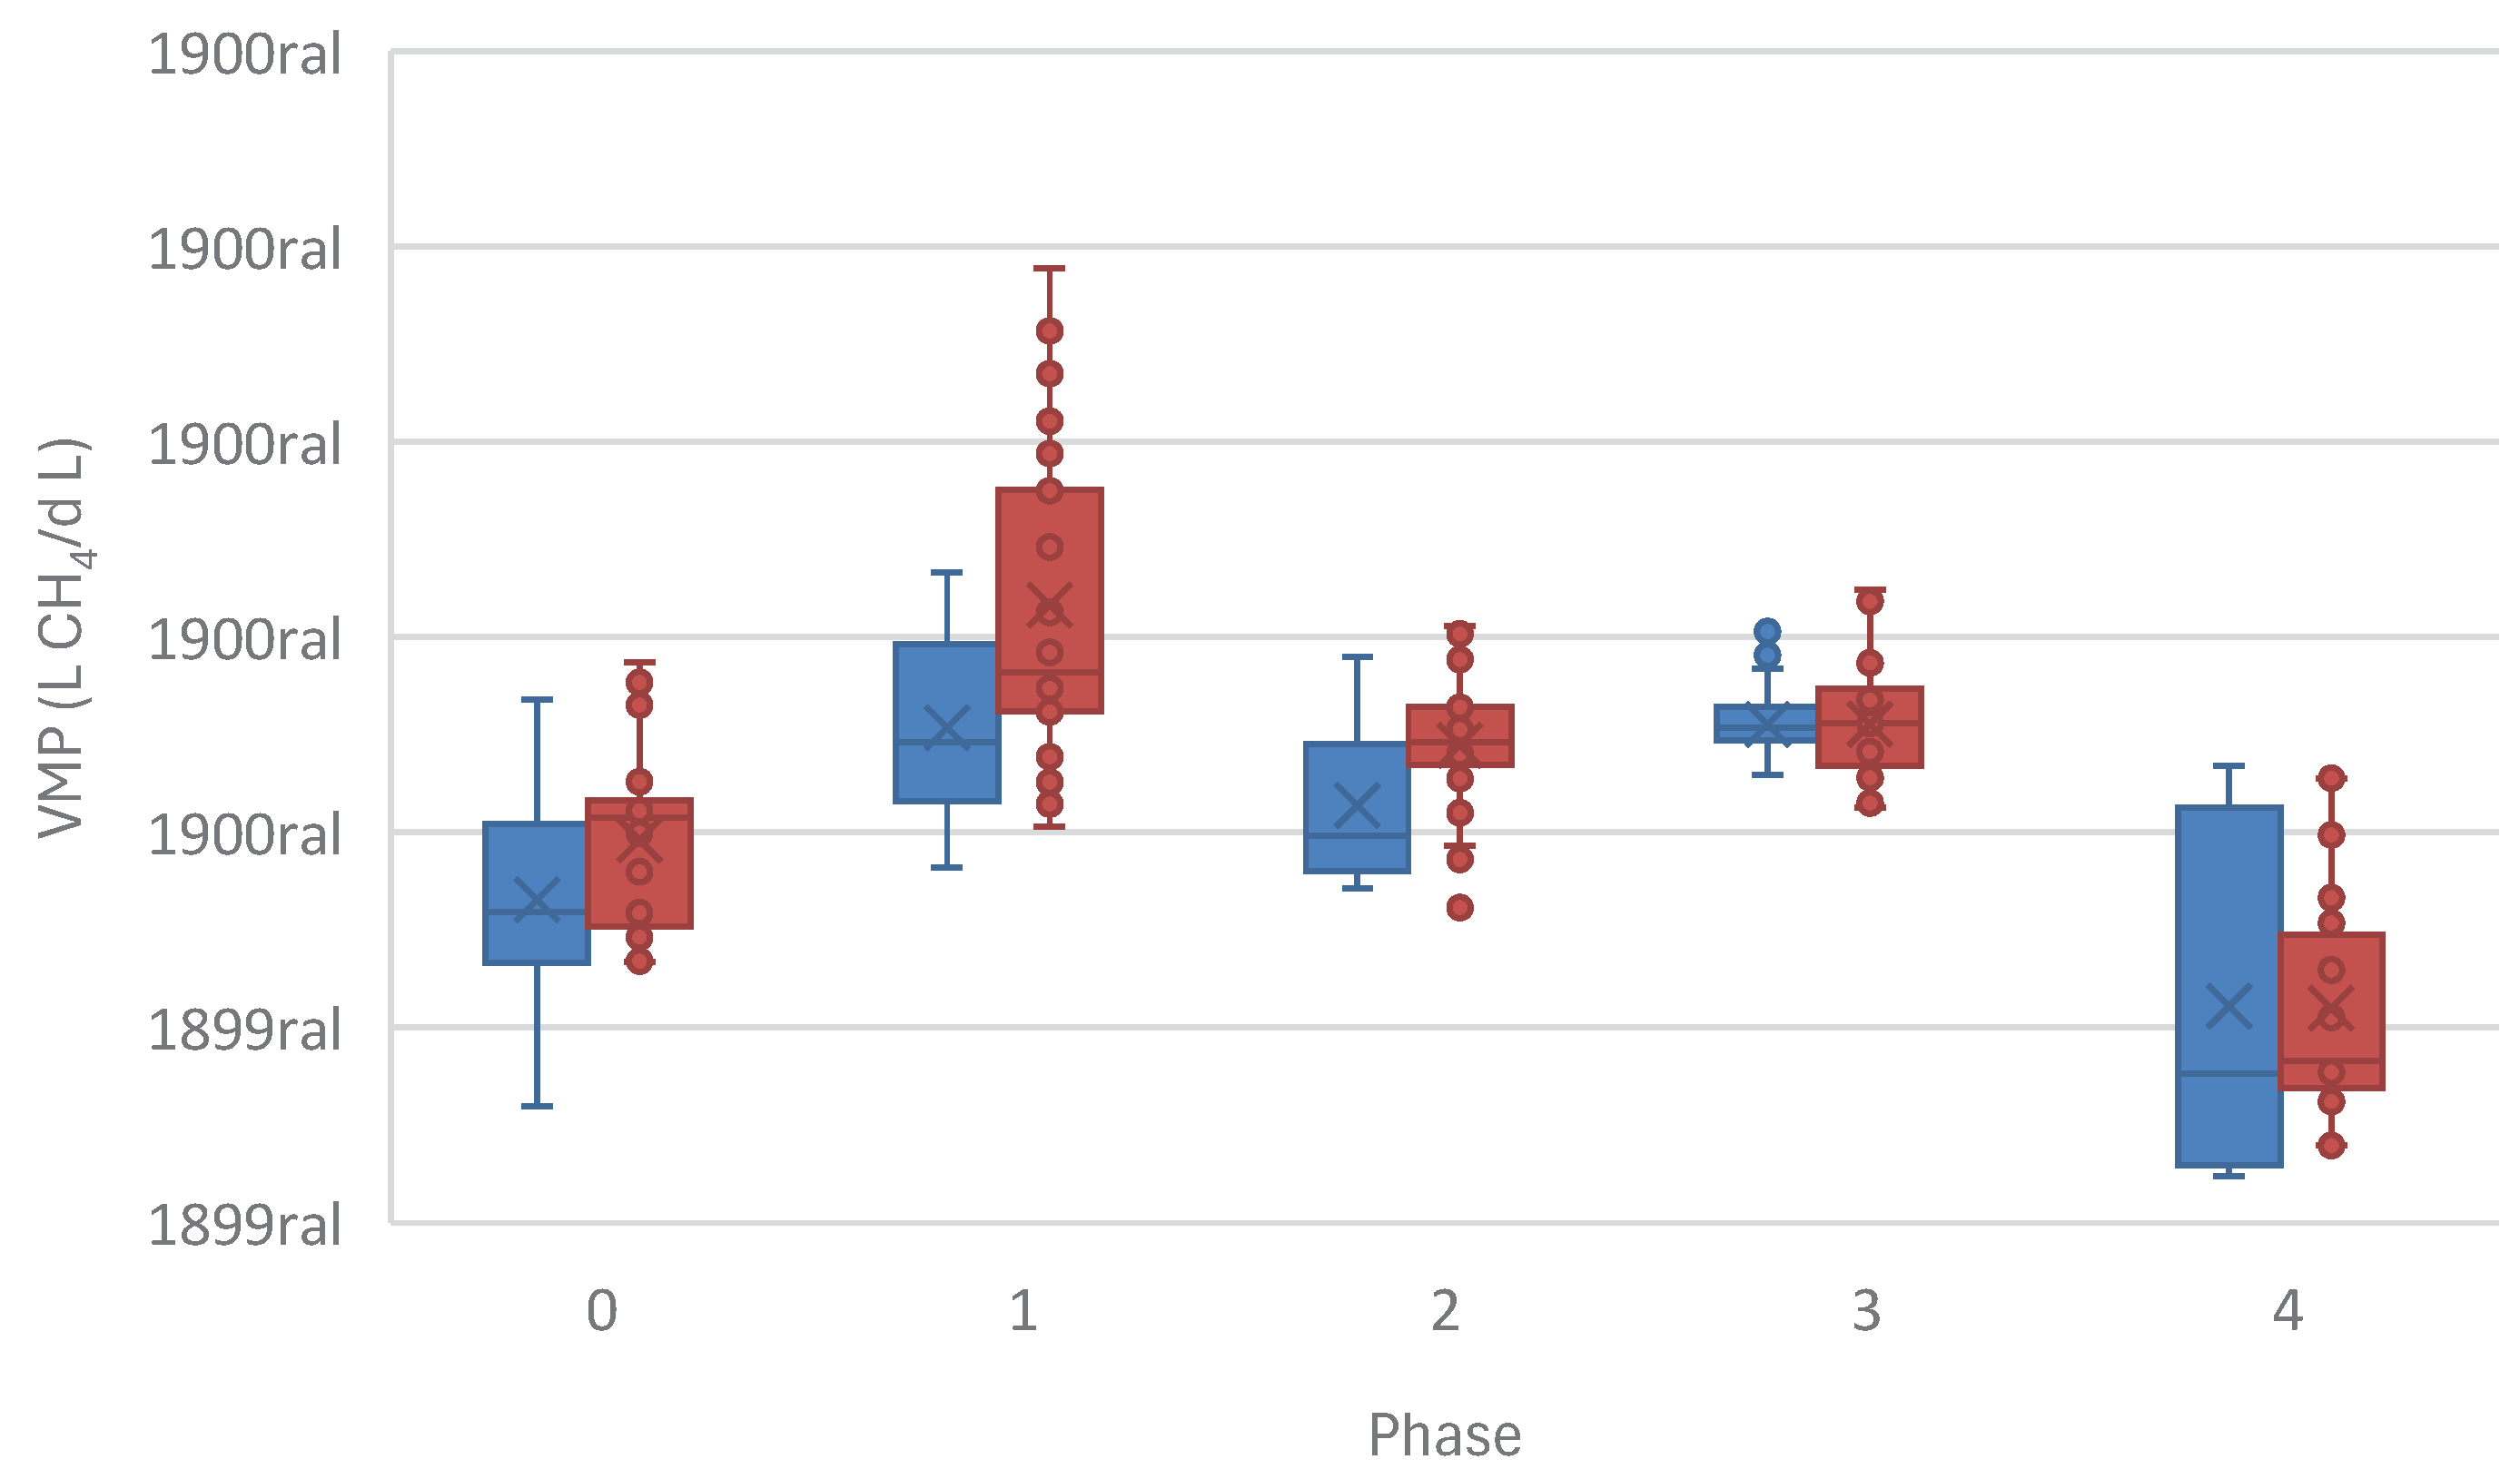
Figure 11.
Methane Yield (MY) (L CH4/ g COD) increase in the methanogenic reactors in the presence of monensin in the two-phase system.
Figure 11.
Methane Yield (MY) (L CH4/ g COD) increase in the methanogenic reactors in the presence of monensin in the two-phase system.
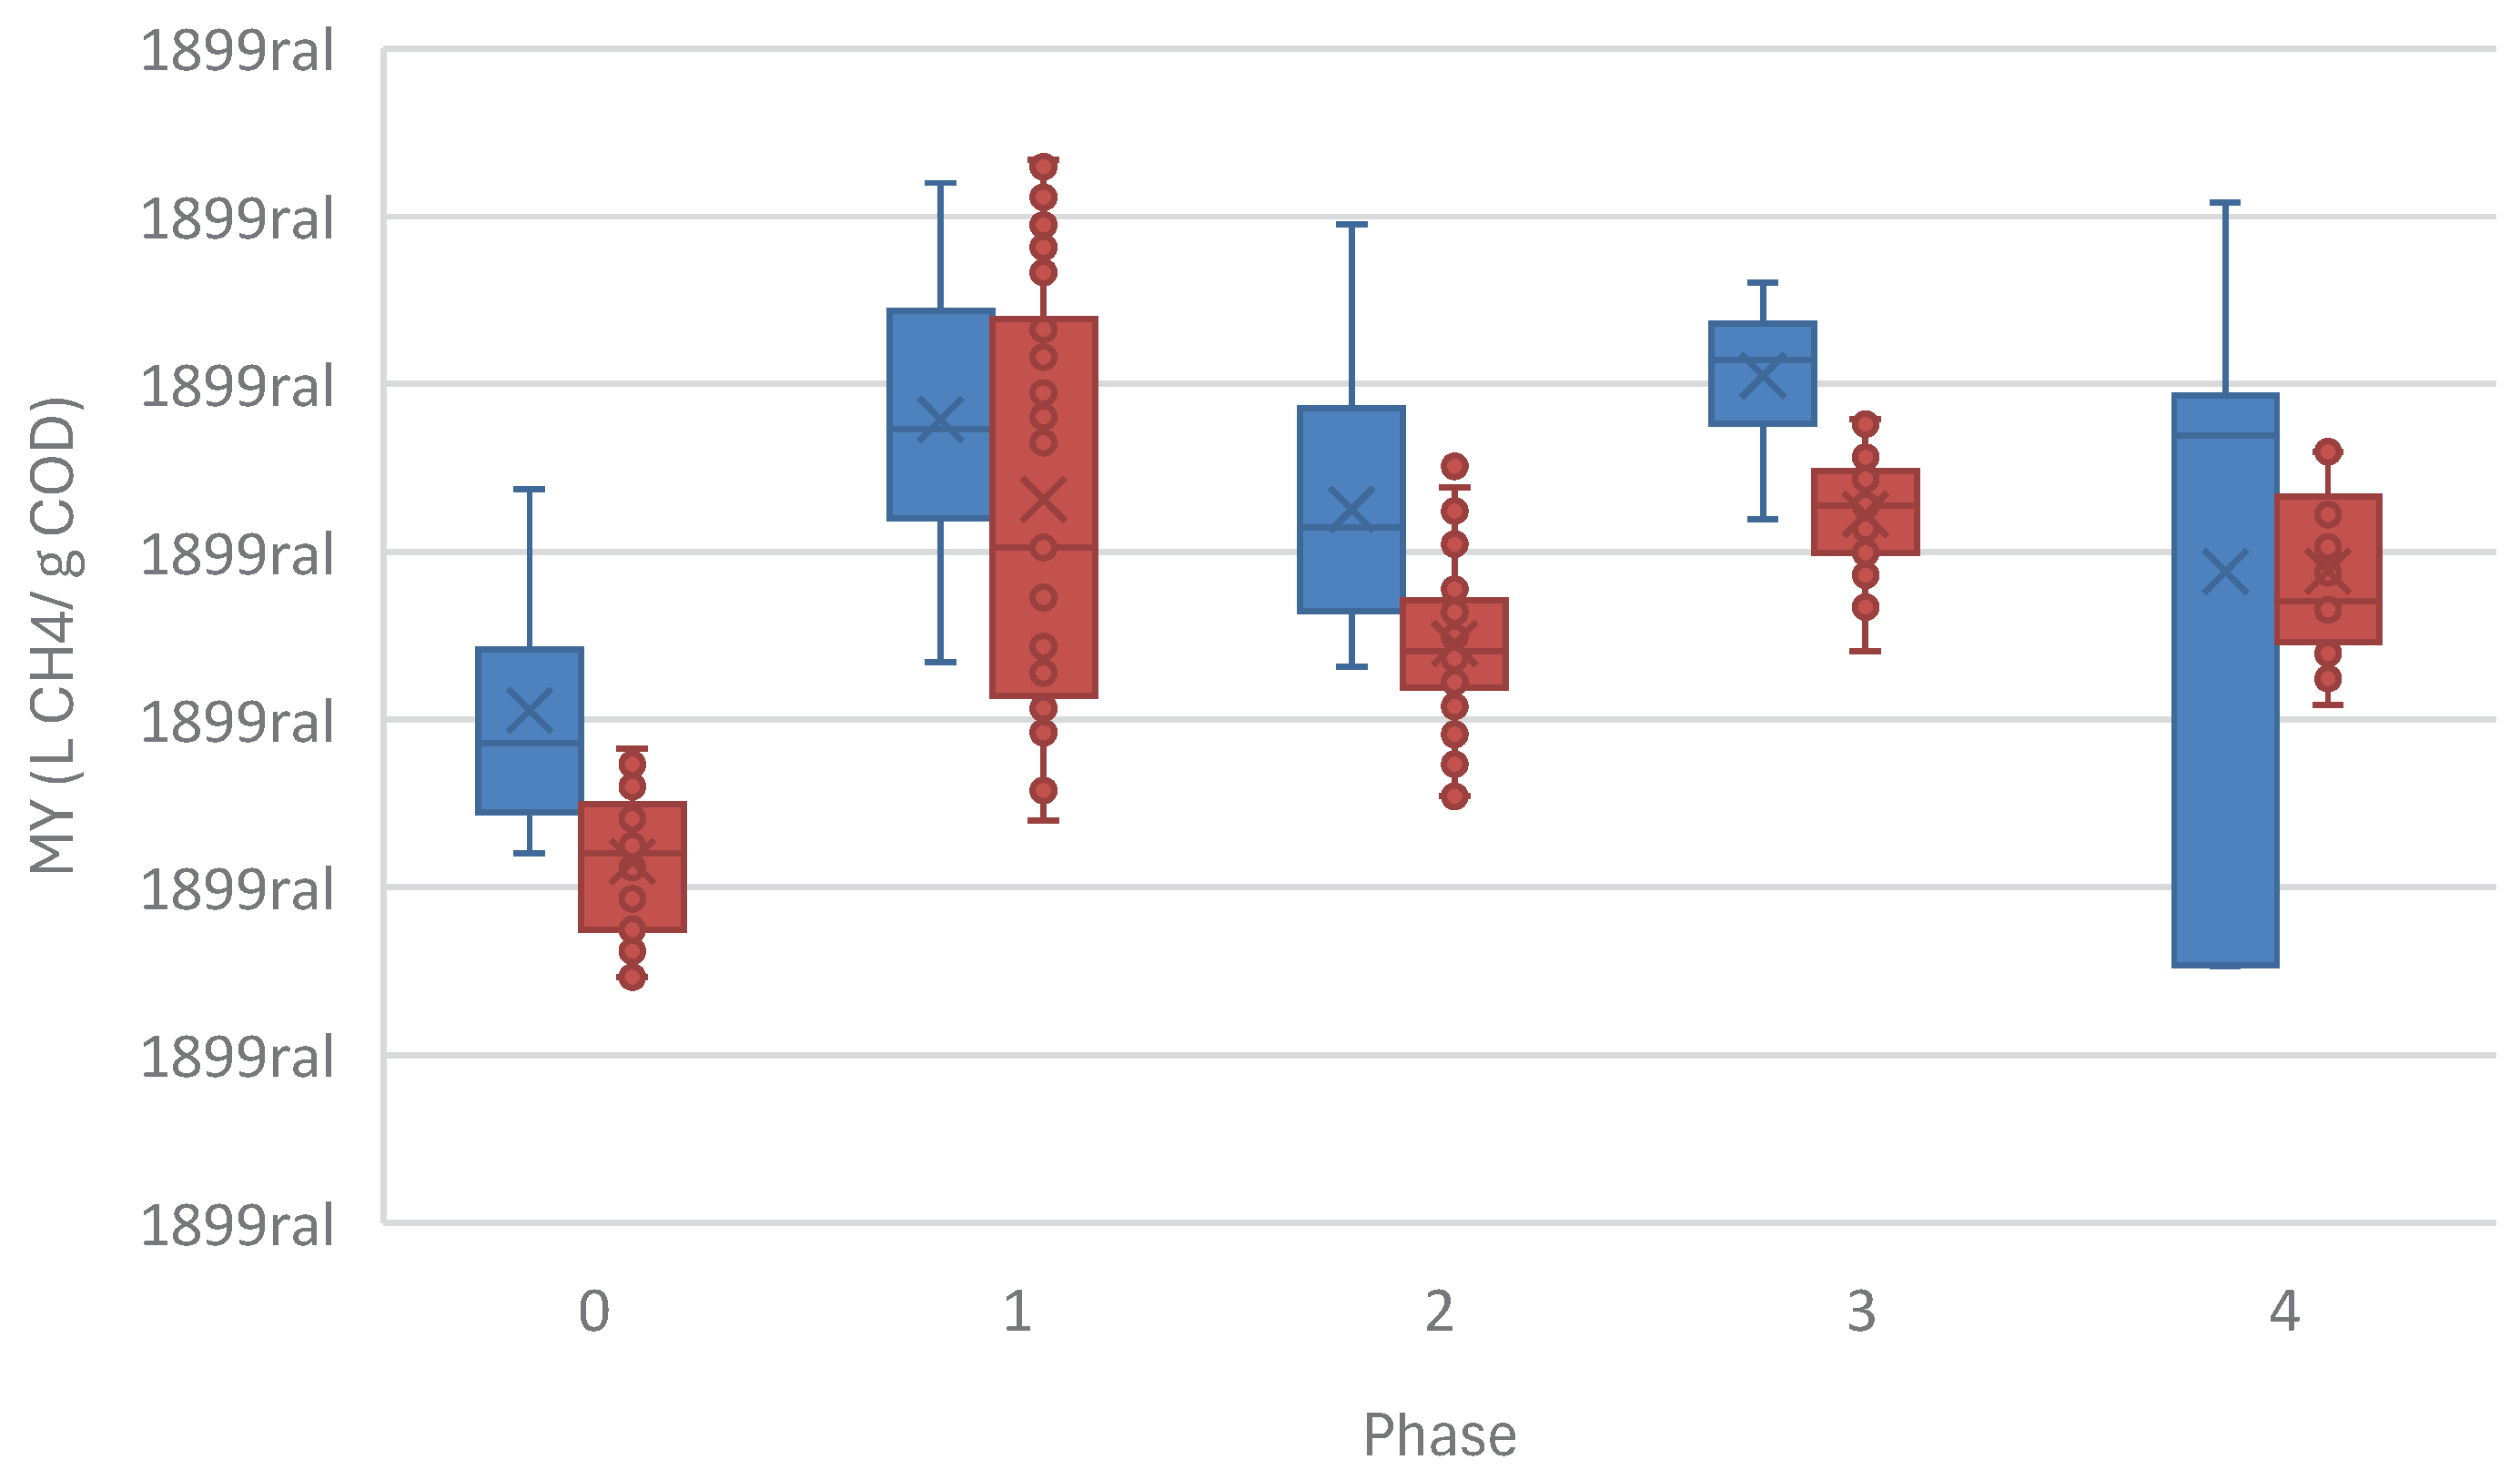
Figure 12.
MON removal between A-U and A-A configurations, overall.
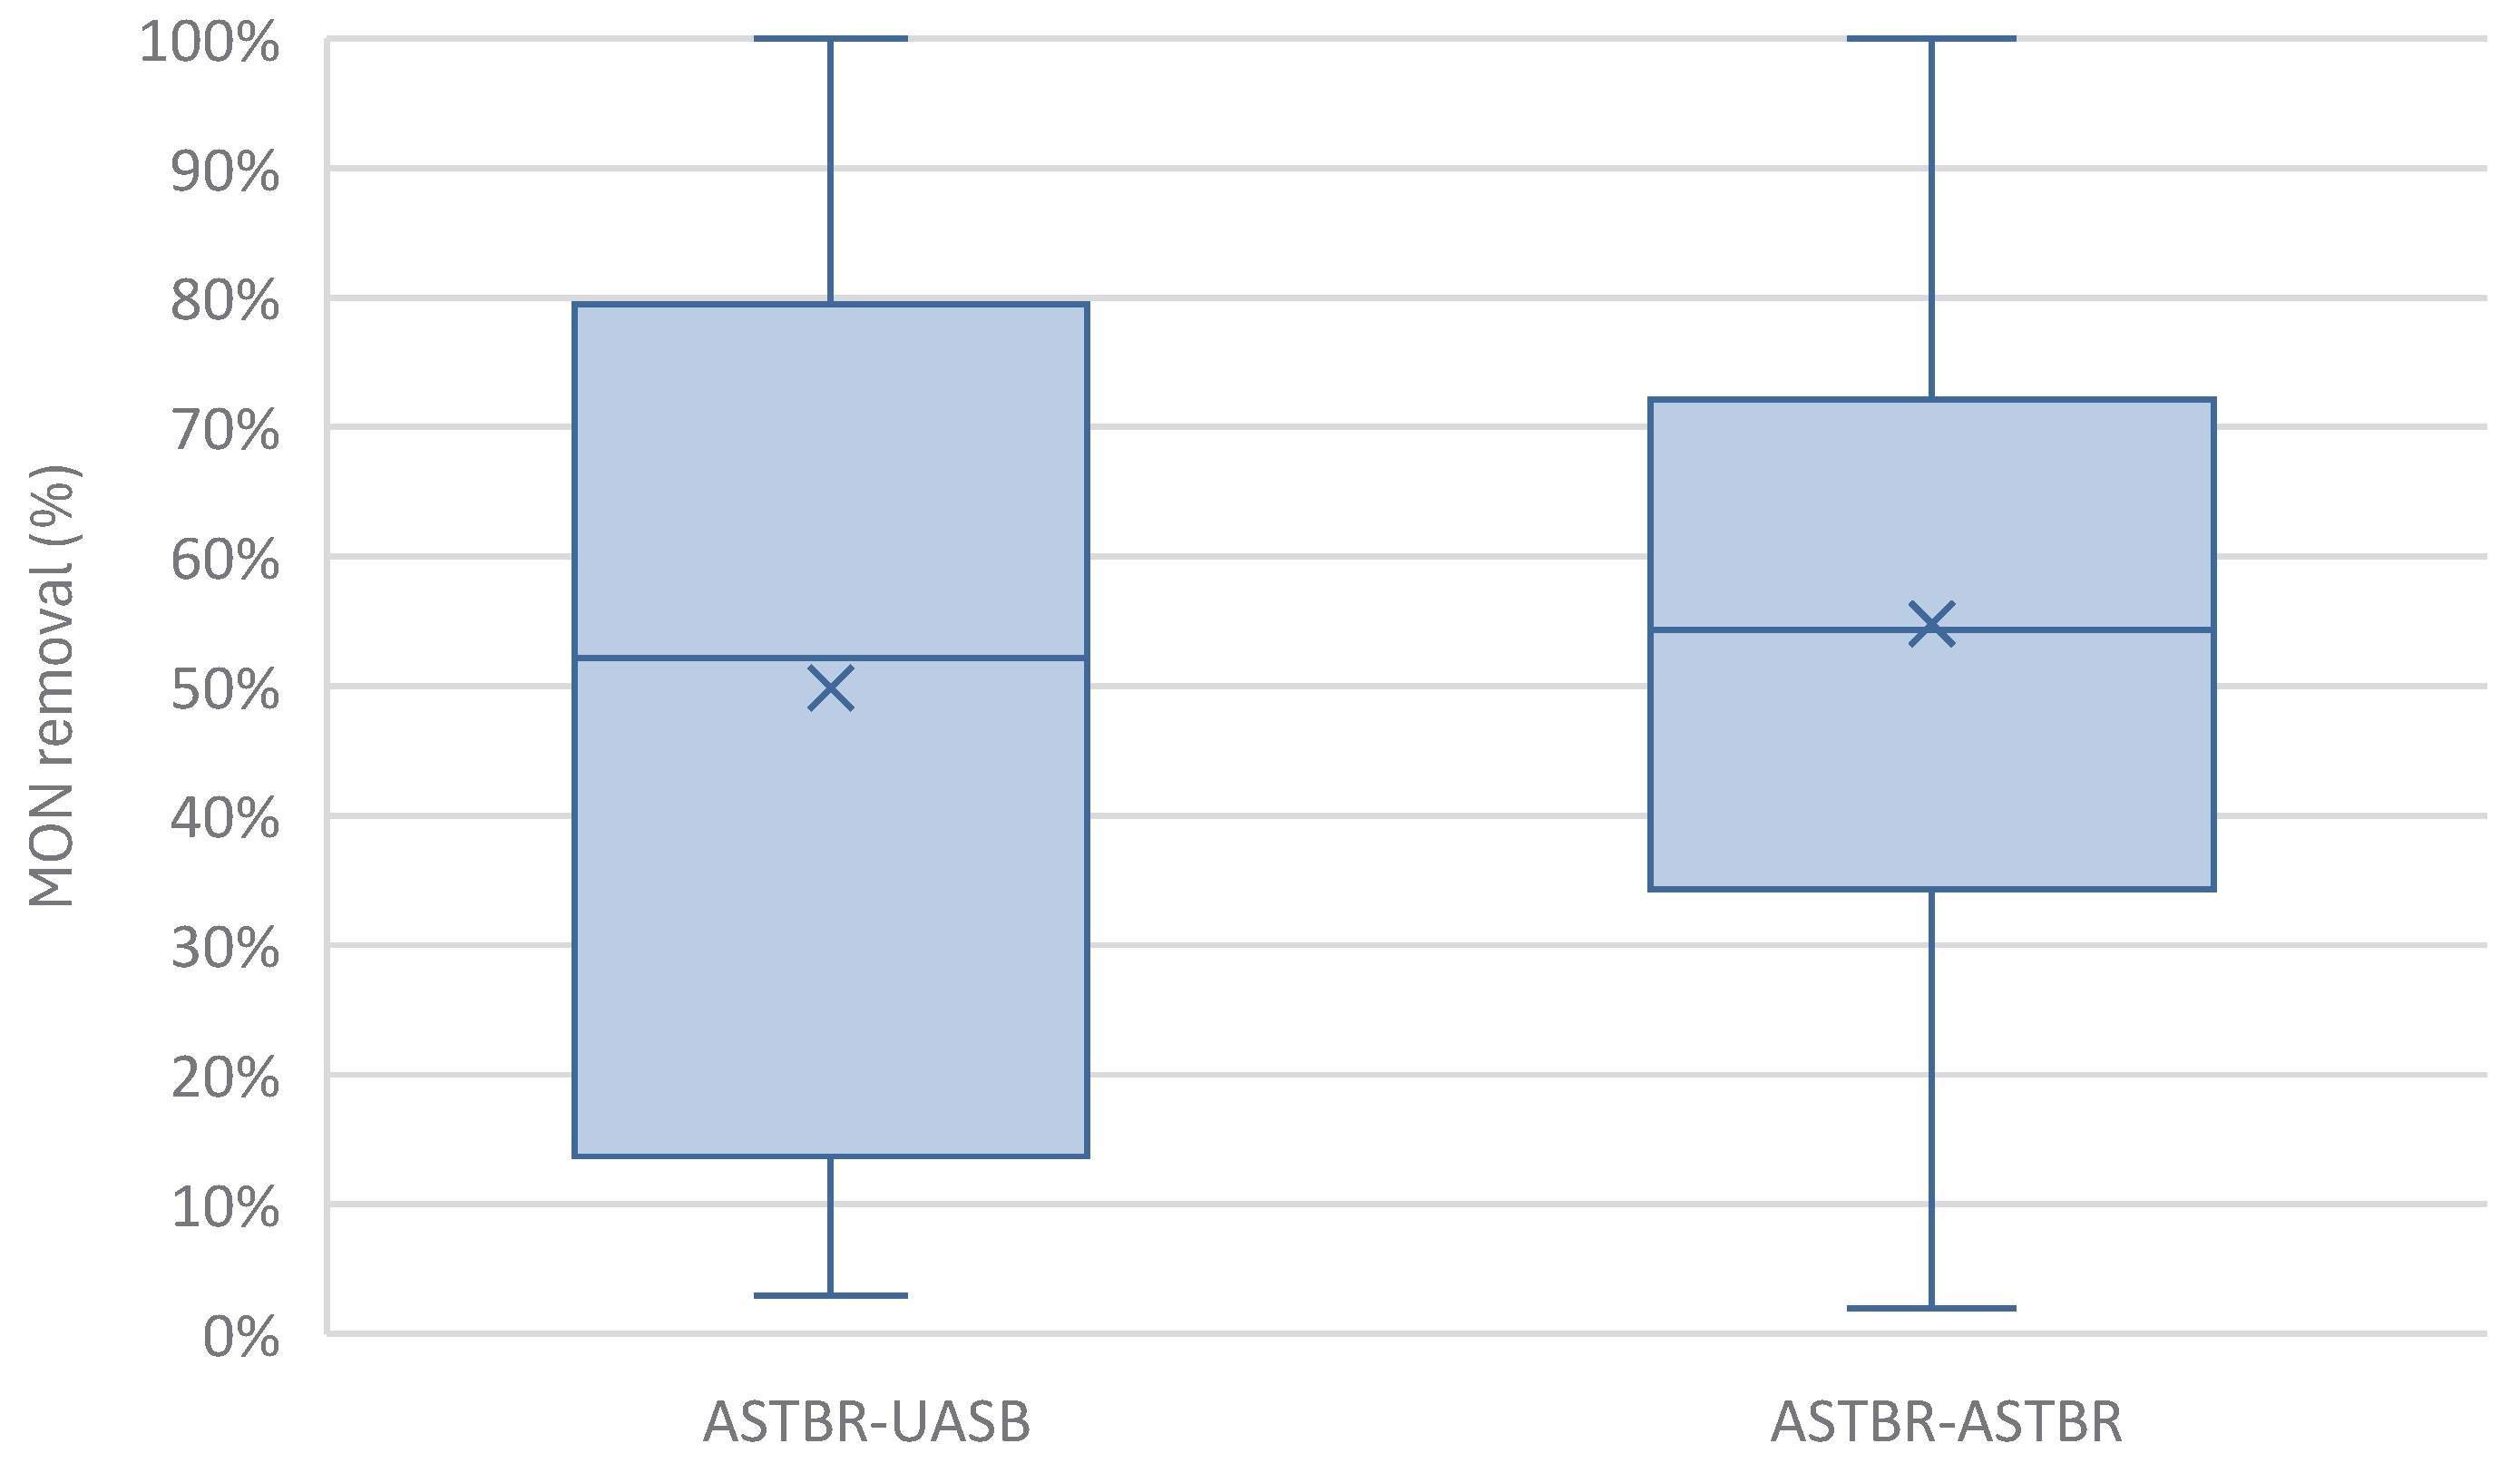
Figure 13.
MON removal from sugarcane vinasse across different phases of this study in the two-phase anaerobic digestion reactor in both A-U and A-A configurations.
Figure 13.
MON removal from sugarcane vinasse across different phases of this study in the two-phase anaerobic digestion reactor in both A-U and A-A configurations.
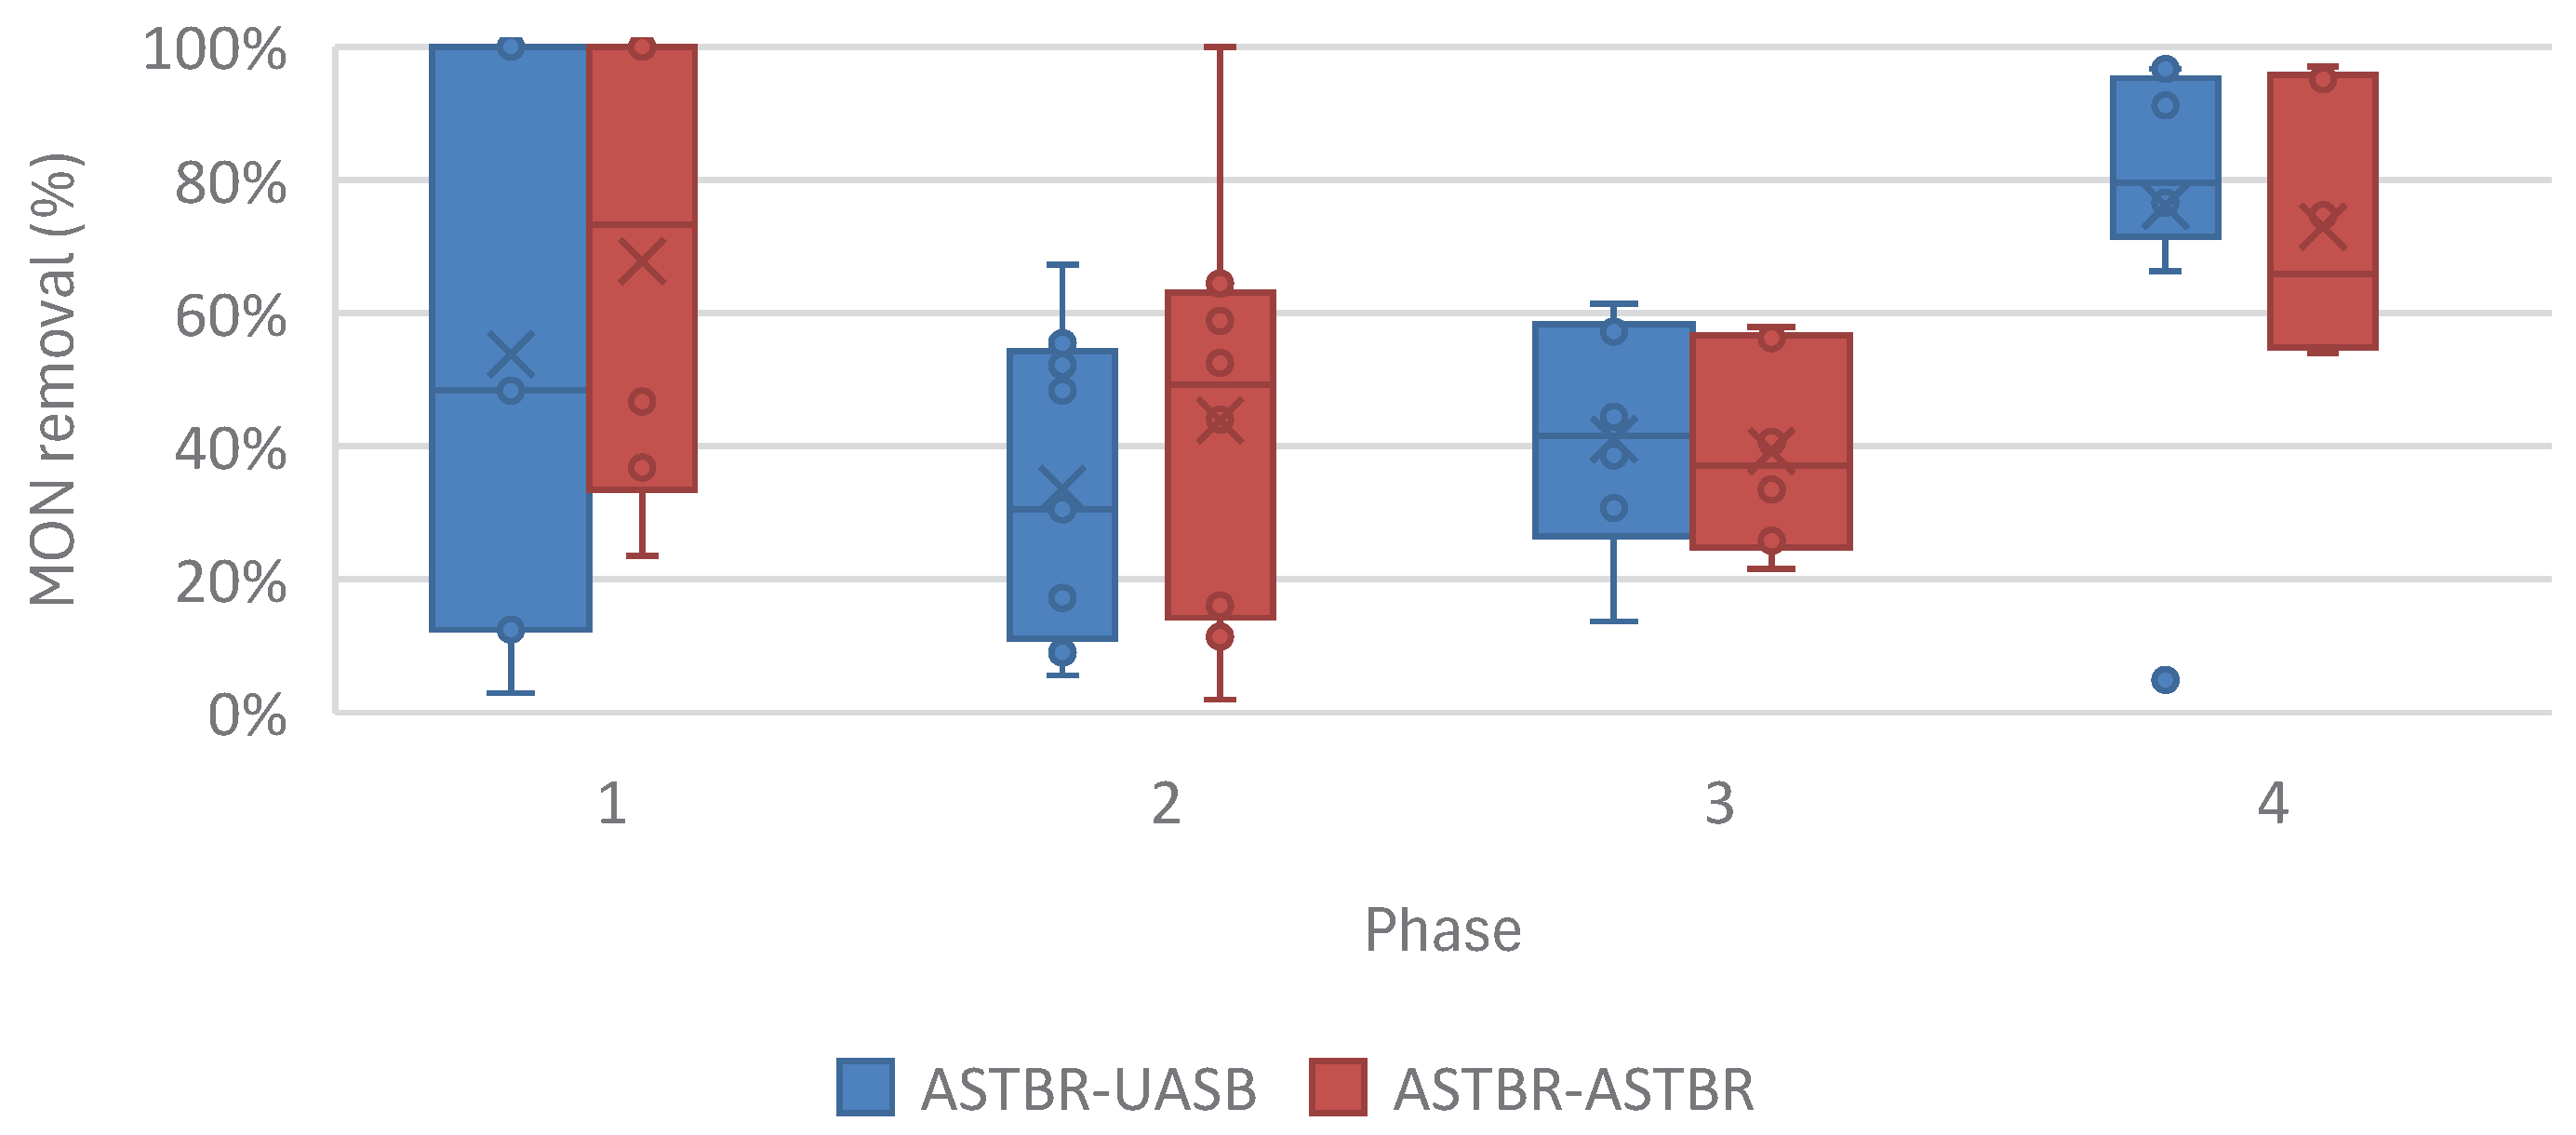
Table 1.
Vinasse characteristics.
| Collection Lot | 21/07/2021 | 07/10/2021 | 24/06/2022 | Method |
| COD - Total (mg/L) | 35367 | 36380 | 33700 | APHA [24] |
| COD - Soluble (mg/L) | 28467 | 31650 | 20680 | APHA [24] |
| Lactic Acid (mg/L) | 2100 | 2120 | 720 | Taylor [25] |
| Glycerol (mg/L) | 3973 | 3956 | 2214 | Valdez [26] |
| Carbohydrates (mg/L) | 7760 | 7850 | 3750 | Dubois [27] |
| pH | 4.56 | 4.1 | 4.5 | APHA [24] |
| Sulfate (mg/L) | 2860 | 2000 | 1950 | APHA [24] |
| NTK (mg/L) | 1051.27 | 1205 | 1030 | APHA [24] |
| NH4+ (mg/L) | 154.09 | 147 | 92 | APHA [24] |
| Phenol (mg/L) | 1.29 | 3.49 | 2 | APHA [24] |
| Phosphorous (mg/L) | 47 | 53 | 60 | APHA [24] |
Table 2.
Reactor configuration for all 3 reactors in this study.
| Phase | Reactor | Configuration | Support Material | Total Height (mm) | Internal Diameter (mm) | Total Liquid Volume (L) |
| 1 - Acidogenic | 1 | ASTBR | Structured Hollow Polyethylene Cylinders |
745 | 60 | 2.1 |
| 2 - Methanogenic | 2 | UASB | None | 400 | 50 (main body) 80 (3-phase separator & headspace) |
1.6 |
| 3 | ASTBR | Vertically arranged Polyurethane Foam Strips | 745 | 60 | 2.1 |
Table 4.
Reactor performance monitoring protocols.
| Monitored Parameter | Frequency | Method |
| pH | Daily | Electrometry [24] |
| Total Chemical Oxygen Demand (TCOD) (mg/L) | 3x weekly | Closed Reflux Colorimetry [24] |
| Lactic Acid (HLa) (mg/L) | 3x weekly | Calorimetry[25] |
| Glycerol (mg/L) | 3x weekly | Enzymatic-Colorimetric[26] |
| Carbohydrates (mg/L) | 3x weekly | Colorimetry[27] |
| Total Suspended Solids (TSS) (mg/mL) | Weekly | Gravimetry[24] |
| Volatile Suspended Solids (VSS) (mg/mL) | Weekly | Gravimetry[24] |
| Biogas Volumetric Production (L/d) | 5x weekly | Mariotte’s Bottle |
| Biogas Composition | 5x weekly | Gas Chromatography[30] |
| Volatile Organic Compounds (VOC) (mg/L) | 3x weekly | Gas Chromatography[31] |
| Monensin (MON) (ng/mL) | 3x weekly | HPLC-MS/MS |
Table 5.
Acidogenic ASTBR average MON affluent concentration per phase of operation and COD removal (%) and MON removal (%).
Table 5.
Acidogenic ASTBR average MON affluent concentration per phase of operation and COD removal (%) and MON removal (%).
| Phase 0 | Phase 1 | Phase 2 | Phase 3 | Phase 4 | |
| Average MON Affluent Concentration (ng/mL) | - | 18.24 (5.79) | 49.76 (16.25) | 98.67 (29.68) | 1763.04 (472.05) |
| MON Removal (%) | - | 96% (9%) | 88% (1%) | 84% (19%) | 71% (23%) |
| COD Removal (%) | 2% (9%) | 2% (8%) | 3% (14%) | 3% (7%) | 7% (7%) |
Table 6.
Performance of methanogenic UASB and ASTBR across all phases with average real monensin input (ng/mL) (as quantified), showing COD removal (%), monensin removal (%), volumetric methane production (L CH4/d L), and Methane Yield (L CH4/g COD removed).
Table 6.
Performance of methanogenic UASB and ASTBR across all phases with average real monensin input (ng/mL) (as quantified), showing COD removal (%), monensin removal (%), volumetric methane production (L CH4/d L), and Methane Yield (L CH4/g COD removed).
| Phase 0 | Phase 1 | Phase 2 | Phase 3 | Phase 4 | |
| Average MON Load (ng/mL) | - | 7.25 (8.6) | 43.83 (13.54) | 56.14 (36.7) | 839.83 (583.31) |
| UASB | |||||
| COD Removal (%) | 47 (7) | 44 (15) | 44 (7) | 48 (6) | 30 (13) |
| Average COD Removed (g/L) | 13.11 (1.49) | 10.88 (2.45) | 9.93 (2) | 10.37 (1.92) | 7.05 (2.92) |
| Monensin Removal (%) | - | 56 (38) | 21 (10) | 26 (13) | 54 (23) |
| VMP (L CH4/d L) | 1.94 (0.58) | 2.54 (0.71) | 2.17 (0.78) | 2.6 (0.47) | 1.51 (1.01) |
| MY (L CH4/ g COD removed) | 0.148 | 0.233 | 0.219 | 0.25 | 0.214 |
| ASTBR | |||||
| COD Removal (%) | 68 (9) | 65 (10) | 63 (10) | 58 (8) | 33 (15) |
| Average COD Removed (g/L) | 18.92 (2.65) | 15.04 (2.85) | 14.32 (2.79) | 12.52 (2.23) | 7.63 (3.17) |
| Monensin Removal (%) | - | 59 (34) | 30 (28) | 20 (9) | 37 (13) |
| VMP (L CH4/d L) | 1.98 (0.63) | 3.18 (1.1) | 2.44 (0.73) | 2.56 (0.56) | 1.42 (0.83) |
| MY (L CH4/ g COD removed) | 0.105 | 0.211 | 0.17 | 0.205 | 0.186 |
Disclaimer/Publisher’s Note: The statements, opinions and data contained in all publications are solely those of the individual author(s) and contributor(s) and not of MDPI and/or the editor(s). MDPI and/or the editor(s) disclaim responsibility for any injury to people or property resulting from any ideas, methods, instructions or products referred to in the content. |
© 2025 by the authors. Licensee MDPI, Basel, Switzerland. This article is an open access article distributed under the terms and conditions of the Creative Commons Attribution (CC BY) license (http://creativecommons.org/licenses/by/4.0/).
Copyright: This open access article is published under a Creative Commons CC BY 4.0 license, which permit the free download, distribution, and reuse, provided that the author and preprint are cited in any reuse.


