
Submitted:
13 August 2025
Posted:
14 August 2025
You are already at the latest version
Abstract
Understanding the mechanisms that drive ecosystem services (ESs) is critical to reversing the trend of ESs deterioration and allocating targeted restoration measures. However, previous studies have not utilized machine learning methods to explore the impacts and thresholds of social-ecological drivers on ESs from a global perspective. Therefore, in this study, we employed a random forest model to identify the dominant drivers of ESs. We then utilized partial dependence analysis to investigate the non-linear impacts and thresholds of these dominant drivers on ESs. The results revealed that elevator, distance from rivers, soil organic carbon content, aggregation index, and Shannon diversity index were the dominant drivers of most ESs. Moreover, three types of non-linear impacts existed in the relationship between ESs and their social and ecological drivers: the majority of drivers exhibited “single threshold” effects on ESs, the minority showed “monotonic change” effects, and the rest had “complex curve” effects in the forms of “S-shape”, “inverted U-shape” and “inverted S-shape” effects, etc. Based on these findings, we proposed policy guidance to inform ecological protection and restoration aimed at enhancing ESs provision and promoting sustainable development.
Keywords:
ecosystem services
; social and ecological drivers
; random forest
; partial dependency analysis
; threshold
1. Introduction
Ecosystem services (ESs) represent the goods and services that human obtain from ecosystems for their survival and development (Costanza et al., 1997). These services can be broadly categorized into four types: provision, regulation, support, and cultural services. A global assessment report reveals that ESs are facing a general downward trend worldwide, manifested by a severe decline in wetlands, habitat degradation, and biodiversity loss, etc. (Bridgewater et al., 2023). China is also confronting ESs degradation due to over-exploitation, inappropriate use of natural resources, and the reduction of critical ecological areas, as revealed by the National Survey and Assessment of Changes in Ecological Conditions (2015-2020) reports. In this context, rationally and scientifically planning, organizing, and managing ESs is crucial.
Understanding the intrinsic mechanisms driving ESs formation and spatial patterning is a fundamental prerequisite for developing targeted management strategies. Existing research broadly classifies the drivers of ESs into two principal domains: natural conditions and socio-economic factors. Natural conditions, encompassing climatic conditions, Topographic features, and soil properties, form the foundational basis for ESs provision through direct biophysical constraints. Climate conditions shape ecosystem services by regulating temperature, precipitation, and seasonal patterns, which directly affect primary productivity, species distribution, and carbon sequestration (Pandey et al., 2023; Zhang et al, 2020). Topographic features modulate ecosystem services through elevation, slope, and aspect, influencing water drainage, microclimates, and habitat connectivity (Ma et al., 2021). Soil properties govern ecosystem services by controlling nutrient availability, water retention, and root dynamics, thereby sustaining biodiversity, crop yields, and climate resilience. Among these factors, climate change is expected to be the main cause of changes in ESs by the end of the 21st century (Gissi et al., 2021).
Primary socio-economic factors include land use and land cover (LULC) change, urbanization, construction, and other aspects of human activities. As LULC connects socio-economic activities with ecosystem structure and function, it is considered a crucial driver of ESs (Asante-Yeboah, et al. 2024; Zhang et al. 2023; Guo et al., 2021; Song et al., 2017). Landscape pattern, shaped by a mosaic of LULC types, is also an important factor that affects the provision of ESs. Urbanization, accompanied by population growth and increased urban land use, transforms natural ecosystems into human-dominated or human-natural coupled ecosystems, which in turn influences a range of ESs (Zhang, et al. 2021; Zhang, et al. 2018). Additionally, engineering projects such as infrastructural development, forestry plantation and reforestation can also lead to changes in ESs directly or indirectly (Helseth et al., 2022). Existing studies are concentrated on studying the impacts of certain factors on individual ESs, but lack comparative study on the effects of various drivers selected from a social-ecological system perspective on the multiple ESs that an ecosystem can provide.
Previous research has utilized various mathematical and statistical techniques to quantitatively measure the impact of social and ecological drivers on ESs. Linear regression methods, such as ordinary least squares and correlation analysis, are commonly employed in these studies (Hu et al., 2023; Ngabire et al., 2022; Xia et al., 2023). The methods focus on the impacts of various social and ecological factors on a particular ES, while disregarding the multiple ESs that ecosystems provide. To overcome the drawbacks of linear regression, Mouchet et al. (2017) utilized redundancy analysis (RDA) to simultaneously analyze the correlations between various ESs and their multiple explanatory drivers, but RDA has the drawback in dealing local multicollinearity among the multiple explanatory drivers. Hu et al. (2021) utilized the Geodetector model in this endeavor, which exhibits better performance by eliminating the multicollinearity among the drivers (Osawa et al., 2016). However, this model can only assess the magnitude but faces difficulties in identifying the direction of the impact. In general, the above mentioned methods have limitations in uncovering the intricate non-linear relationships between the multiple ESs and their socio-ecological drivers.
Recently, machine learning methods are being increasingly applied in the study on the impact factors of ESs. For instance, Kang et al. (2023) and Geng et al. (2022) utilized random forests (RF) to assess the relative contributions of anthropogenic and natural factors to ESs. RF can capture complexly non-linear relationships but it has a disadvantage in depicting the curve characteristics of the non-linear relationships. Additionally, it has difficulty in identifying the threshold effect in the non-linear relationship, which reflects a phenomenon where a driver's impact on ESs changes significantly after reaching a certain value. Scholars indeed adopted models like the piecewise regression method (Peng, et al. 2017), quantile regression model (Sun et al., 2020) to identify the impact threshold. However, these models are mainly constructed based on the linear regression assumption, which can only identify the impact threshold from a local perspective. In contrast, partial dependence analysis (PDA) could provide a global perspective in discriminating the impact thresholds and visualizing the curvilinear characteristics of the relationships between ESs and their drivers (Olaniyi and Omowale 2022). Therefore, attempts could be made to apply PDA in the study of the non-linear relationship between ESs and their drivers.
In this context, we utilized machine learning techniques to systematically investigate the non-linear impacts and thresholds of social and ecological drivers on ESs. Firstly, six typical ESs indicators were carefully selected and evaluated. Then, driving factors were identified from the perspective of a coupled socio-ecological system. Next, the random forest method was employed to analyze the impacts of drivers on the ESs, and to identify the dominant drivers. Finally, the partial dependency analysis was utilized to examine the non-linear impacts of the dominant drivers on ESs, and their respective thresholds were identified. This study aims to provide a sound basis for the scientific and rational arrangement of ecological restoration measures to enhance ESs in the study region.
2. Study Area and Data Description
2.1. Study Area
Wuhan City is located in Wuhan province of central China, covering a total area of 8569.15km2 and administering 13 districts. The city is blessed with abundant water and wetland resources that offer a range of ESs. Nevertheless, urban expansion and infrastructure construction have resulted in the destruction of ecosystems, the loss of a substantial quantity of ecological land, and a major reduction in the area's ability to supply numerous ESs. According to Zhu et al. (2023), the lake area in Wuhan has reduced by almost 60% compared to the 1980s. As a result, frequent urban floods, severe soil erosion, and declining biodiversity of aquatic organisms in the Yangtze River are becoming increasingly prevalent issues in the city. Therefore, protecting the ecosystem and enhancing its capability to provide various ESs are crucial for maintaining ecological security for Wuhan and the Yangtze River. Figure 1 shows the geographical location and elevation of Wuhan City.
2.2. Data Description
The data used in this study comprises two main categories: natural geographic data and socio-economic data. The natural geographic data includes information on topography, soil, meteorology, and vegetation cover. The socio-economic data, on the other hand, includes data on administrative division, population density (POP), gross domestic product (GDP), land use and land cover (LULC), nighttime light index, and grain production. The benchmark year for the data was 2020, and all data was unified to the CGCS2000 Transverse Mercator projection coordinate system. The specific data sources are shown in Table 1.
3. Methodology
3.1. Method Framework
This study employed a four-step approach to investigate the non-linear impacts and thresholds of social and ecological drivers on ESs (as shown in Figure 2). Firstly, six indicators of ESs were selected from the four main categories of ESs (supply services, regulating services, supporting services and cultural services) and were then evaluated using appropriate ecological models. Secondly, social and ecological drivers of ESs were selected from five aspects, namely terrain, soil, location, socio-economic factors, and land use. Thirdly, dominant drivers of ESs as well as their relative importance on ESs were identified using a random forest model. Finally, the non-linear impacts of dominant drivers on ESs and their impact thresholds were investigated by adopting the partial dependence analysis method. The study aims to provide relevant policy recommendations for enhancing and regulating ESs.
To analyze the impacts of social and ecological drivers on ESs, it is necessary to unify the data into a single spatial unit, as the analysis results vary with mapping resolutions. In this study, the 1 km grid was selected as the optimal spatial unit for two reasons. Firstly, it is the most accessible scale at which certain data, such as GDP and POP, can be obtained. Secondly, analyzing the data at this scale allows for the reflection of the relationships between ESs and their drivers at a local level, while minimizing the computing burden at finer scales.
3.2. Selecting and Evaluating Ecosystem Services
The six ESs indicators were chosen because: (1) they cover the supply services, regulating services, supporting services and cultural services categories listed by MA (2005); (2) they are easily affected by various human activities; (3) they can be conveniently assessed using existing models and methods, and the necessary data is readily available in the study area. The six ESs indicators were evaluated as follows: (1) Grain production was evaluated based on the relationship between grain production and NDVI index (Cao et al., 2020). (2) Water yield service was assessed using water balance equation, which considers that the amount of water produced by an ecosystem is influenced by precipitation and evapotranspiration (Dabral, et al. 2008). (3) Carbon storage was calculated using NPP as a proxy variable based on the Carnegie-Ames-Stanford Approach (CASA) model, which calculates NPP as the product of photosynthesis active radiation absorbed by vegetation and an energy utilization efficiency (Zhu et al., 2007). (4) Erosion prevention was evaluated using the revised universal soil loss equation (RUSLE) model (Rejani, et al. 2016). (5) Biodiversity conservation was assessed through the habitat quality module of the InVEST model (Tallis and Ricketts 2010). (6) Outdoor recreation was evaluated using the ESTIMAP-recreation method, which considers the degree of naturalness, natural protection, and presence of water as the major components contributing to the ability of a natural ecosystem to provide outdoor entertainment service (Baró et al., 2016). For more information on the evaluation methods, please refer to Zhang, et al. (2018).
3.3. Selecting Social and Ecological Drivers on Ecosystem Services
ESs are influenced by various factors from natural and socio-economic aspects. Natural environment changes, such as topography and landforms, have an impact on the elements and structure of ecosystems, which in turn affects their capacity to provide various ESs (Zhang et al., 2022). Land is the most important carrying basis of ecological process, thus land use composition and landscape pattern also impact ESs (Clerici et al., 2019; Liu et al., 2019). Additionally, the physical and chemical properties of soil can regulate ESs by affecting biological growth (Krawczynski et al., 2015). Furthermore, socio-economic development is often regarded as an indirect driver of ESs, which works by influencing human activities and environmental pollution (Reid et al., 2005). Based on the above considerations, this study selected 21 factors from five aspects: terrain, soil, location, socio-economic, and land use to analyze the driven mechanism of ESs in Wuhan City, starting from the actual geographical conditions, the representativeness of major domain of a socio-ecological system and the availability of data in the study area. The selected social and ecological drivers are presented in Table 2.
3.4. Identifying Dominant Social and Ecological Drivers on Ecosystem Services
This study utilized a random forest model to quantify the degree of relative importance of various social and ecological drivers on ESs, and further identify the dominant drivers of ESs. Random forest is a non-parametric machine learning method that uses decision trees as base classifiers. Combining multiple independent decision trees and using the Bagging ensemble method, it obtains the final result (Breiman, 2001).
There were mainly two important indicators to measure the importance of independent variables in random forest models: the increase in node purity (IncNodePurity) based on the Gimi index and the increase in mean squared error (%IncMSE) based on Out of Bag (OOB). The latter is a more commonly used indicator, which utilizes the change in the mean squared error of OOB before and after the permutation of an independent variable to measure its degree of importance of it. The larger the %IncMSE, the higher importance of the independent variable. The specific formula is:
In the formula, is the increase in mean squared error of feature variable . is the number of occurrences of feature variable in the forest. is the error of OOB before randomly permuting the value of feature variable . is the error of OOB after randomly permuting the value of feature variable . If the prediction error of OOB increases significantly after randomly permuting the value of feature variable, it indicates that the feature variable has a great impact on the prediction results, i.e., the feature value has a high degree of importance. This study utilized the Random Forest package and the rfPermute package in R software to perform random forest modeling.
3.5. Quantifying Non-Linear Impacts and Thresholds of Dominant Social and Ecological Drivers on Ecosystem Services
This study utilized partial dependency analysis to quantitatively describe the specific mechanism that underlies the impact of dominant drivers on ESs. Partial dependency analysis is an explainable machine learning algorithm that can reveal the marginal effect of one or two features on the modeling outcome by marginalizing the influence of other features (Parr et al., 2021). Compared to traditional regression models and mathematical statistical methods, partial dependency analysis can better explain the complexly non-linear impacts of feature variables on dependent variables, visualize these relationships, and identify the impact thresholds, thus having the advantages of wide applicability and clear results. The specific calculation formula is as follows:
In the formula, is the average impact of the targeted feature variable on the modeling outcome, is the other variables except for in the function, is the number of samples in the dataset.
4. Results
4.1. Spatial Distributions of Ecosystem Services
Spatial patterns of ESs in Wuhan are shown in Figure 3. Overall, except for soil conservation service, all the other ESs exhibited significant spatial differentiation with high values gathered in the center and low values in the surroundings.
Specifically, the range of values for grain production service was 0-3.74×10⁷ kg. The high values were mostly found in the surrounding areas of cities, where there was more clustered and contiguous basic arable land with good farming conditions. On the contrary, due to the scarcity of arable land resources, grain production service in urban central areas was correspondingly lower. The range of water yield service values was 1.96×10⁶-2.79×108 mm, showing the characteristic of “higher in the south than in the north, higher in the east than in the west, and higher in the surroundings than in the center”. The high-value areas for carbon storage service were mainly concentrated in the northwest Mulan Mountain area, the northeast Jiangjun Mountain area, and the southeast, while the low value areas were mainly located in the inner city. The value range of soil conservation service was 0-333.02 t/ha. The high value areas were mainly concentrated in the northern mountainous areas of Huangpi District, the Dabie Mountains in the northeast of Xinzhou District, and the southern and southwestern parts, while the service level in other areas was relatively low. High value areas for biodiversity conservation service were mainly located around cities, accounting for more than 50% of the regional area, while low-level areas were mainly distributed in the central part of cities. The high-value areas for outdoor recreation service were mainly concentrated in the northwest, northeast, and south of the region, where natural ecosystems have a high cultural supply capacity due to their rich natural landscape resources and cultural relics. Owing to the presence of numerous parks and scenic spots within the urban area of Wuhan, there were also high value areas for outdoor recreation service within and around the city. On the contrary, regions with the lowest outdoor recreation value were mainly concentrated in Jianghan District and Jiang’an District, which may be related to the high level of urbanization and industrialization in these areas, leading to a relative scarcity of natural resources.
4.2. Dominant Social and Ecological Drivers on Ecosystem Services
The modeling results on the relative importance of various social and ecological drivers on ESs are shown in Figure 4. We can see that except for the modeling accuracy for soil conservation service, which obtains a fitting degree of 64%, those for other services have a fitting degree exceeding 80%, indicating that the model can well fit the relationship between ESs and their drivers. The dominant drivers of grain production services were DEM (elevation), Ara_P (proportion of arable land), Dis_city (distance from cities), POP (population density), and AI (aggregation index). The dominant drivers of water yield service were DEM (elevation), GDP (gross domestic product), Cons_P (proportion of construction land), SHDI (shannon diversity index), and POP (population density). The dominant drivers of carbon storage service were AI (aggregation index), Dis_river (distance from rivers), Ara_P (proportion of arable land), Cons_P (proportion of construction land), and SHAPE (average shape index). The dominant drivers of soil conservation services are slope, DEM (elevation), Fore_P (proportion of forest land), Dis_city (distance from cities), and Dis_villa (distance from villages). The dominant drivers of biodiversity conservation services were AI (aggregation index), Ara_P (proportion of arable land), Fore_P (proportion of forest land), Cons_P (proportion of construction land), and SHAPE (average shape index). The dominant drivers of outdoor recreation service were Fore_P (proportion of forest land), Dis_river (distance from rivers), Dis_city (distance from cities), SHAPE (average shape index), and Ara_P (proportion of arable land).
Word cloud of social and ecological drivers regarding their relative importance for ecosystem services is shown in Figure 5. The size of the font indicates the overall importance of the driver in influencing ESs. We can see that, overall, Dis_river (distance from rivers), SoilOC (soil organic carbon content), SHDI (shannon diversity index), and AI (aggregation index) played the most significant impact on most ESs, followed by DEM (elevation), Fore_P (proportion of forest land), Cons_P (proportion of construction land) and Ara_P (proportion of arable land), while the Gras_P (proportion of grassland), Clay (clay content) and Silt (silt content) appeared to have the least impact on the selected ESs.
4.3. No-Linear Impacts and Thresholds of Dominant Social and Ecological Drivers on Ecosystem Services
Figure 6, Figure 7 and Figure 8 present partial dependency plots that illustrate the impacts of dominant drivers on ESs. We can see that, in general, most of the dominant drivers had a “single threshold” effect on ES; in other words, the impact of these drivers on ESs changes significantly once their values exceed a certain threshold. A few dominant drivers, on the other hand, demonstrated a "monotonically increasing" or "monotonically decreasing" effect on ESs, meaning that the ESs consistently rise or fall with increasing values of these drivers without showing any threshold effect. Finally, the rest dominant drivers showed “complex curve” effects on ESs (e.g., "S-shape", "inverted S-shape", and "inverted U-shape"), where ESs response to driver values follow non-uniform trend variations: S-shaped curves show ES initially changing gradually then accelerating shifts, inverted S-shapes display rapid early changes followed by stabilization, and inverted U-shapes indicate ES first rising to a peak with increasing driver values before progressively declining.
The partial dependency plots indicate that the grain production service was positively impacted by an increase in DEM (elevation), Ara_P (proportion of arable land), and Dis_city (distance from cities), but tended to stabilize once these drivers reached certain thresholds: 50m, 10%, and 2400m, respectively. Conversely, the service exhibited a "decreasing and then stabilizing" relationship with POP (population density), where it decreased as population density increased but remained at a low level once the density surpassed 50 people/km2. AI (aggregation index) had complex non-linear effects on grain production service, with the service abruptly rising when the AI hits 80 and dropping quickly when it hits 90.
Water yield services had significant negative correlations with DEM (elevation), GDP (gross domestic product), Cons_P (proportion of construction land), and POP (population density), with thresholds of 80 m, 0.5, 2×10⁴ million yuan, and 25 people/km2, respectively. Beyond these thresholds, the decreasing trend of water yield services stabilized. In contrast, a positive correlation existed between water yield and SHDI (shannon diversity index), with a threshold of 0.5.
The effects of AI (aggregation index) and Ara_P (proportion of arable land) on carbon storage were similar, with the services staying relatively low before AI and Ara_P reached 85 and 44%, respectively, and then being promoted sharply. Carbon storage service increased with the increase of Dis_river (distance from rivers), but after Dis_river surpassed 1200 m, the service tended to stabilize. Conversely, carbon storage service initially decreased with the increase of Cons_P (proportion of construction land) ,and when the Cons_P hits 40%, the service stayed relatively low. There was an "inverted S-shape" effect of SHAPE (average shape index) on carbon storage service, where a decline in carbon storage service occurred when SHAPE was greater than 1, and this declining trend stabilized when SHAPE approached 3.
Erosion prevention service exhibited positive correlations with most dominant drivers, with thresholds of 20° and 400 m for Slope and DEM (elevation), respectively, and no significant thresholds for the remaining drivers. Biodiversity conservation service showed positive correlations with Ara_P (proportion of arable land) and Fore_P (proportion of forest land) but negative correlations with Cons_P (proportion of construction land) and SHAPE(average shape index).
Biodiversity conservation service displayed "monotonically increasing" correlations with Ara_P (proportion of arable land) and Fore_P (proportion of forest land). However, the service demonstrated a complex non-linear relationship with AI (aggregation index), where it first decreased stepwise until AI reached about 90, then increased rapidly until AI hits 95, and finally dropped sharply once more.
Outdoor recreation service had a positive correlation with Fore_P (proportion of forest land) (with a threshold of 5%) and a negative connection with Dis_river (distance from rivers) (with a threshold of 500m). Furthermore, the service exhibited an "inverted S-shape" relationship with SHAPE (average shape index), staying relatively low when SHAPE is less than 1.5, then increasing rapidly until SHAPE reaches 3.5, and finally stabilising at a relatively high level. The service displayed an "inverted U-shape" relationship with Ara_P (proportion of arable land), remaining at a high level when Ara_P is between 40% and 85% and at a low level for the remaining value range of Ara_P. There was also a complex non-linear relationship between outdoor recreation service and Dis_city (distance from cities).
5. Discussion
5.1. Understanding the Non-Linear Impacts of Social-Ecological Drivers on ESs from a Threshold Perspective
Researchers and decision makers in ecological conservation and restoration are grappling with the question of what the primary factors are that determine ESs. However, finding a definite answer to this question is challenging, as it may vary depending on the research area (Dong et al., 2023; Wang et al., 2023), method (Hou et al., 2023; Geneletti et al., 2023; Shen et al., 2023; Sun et al., 2020), and spatial scale of analysis (Bai et al., 2020; Xiong et al., 2024). Our study in Wuhan City found that natural conditions have a greater impact on ESs distribution compared to human activities. The drivers of DEM, slope, Dis_river, and SoilOC were identified as the major determinants for most ESs. This suggests that while human activities can affect ESs, natural conditions remain the foundation of ecological structure and functions. Notably, our finding is inconsistent with that of Wang et al. (2024), who found that ESs were more impacted by human disturbances in the Yellow River Basin. The difference may be attributed to factors such as climate conditions, water resources, and socio-economic development patterns in the two study areas. Wuhan belongs to the north subtropical monsoon humid climate with abundant rainfall and water bodies covering the land surface, which has a favorable impact on various services such as food production, water yield, and carbon storage services (Cui et al., 2023). In contrast, water resources in many places of the Yellow River Basin are more limited under the combined influence of relatively scarce precipitation and high evaporation (et al., 2024). In addition, our research found that land use and land cover (LULC) factors, such as Fore_P and Cons_P, as well as the landscape pattern formed by different combinations of LULC types, were major determinants of ESs, consistent with the findings of Wen et al. (2020) and Yee, et al. (2021). This may be due to the fact that LULC change often leads to significant changes in the composition of ecosystems and their ability to provide various ESs.
The impact of social and ecological drivers on ESs can be decomposed into three components-impact direction, impact magnitude, and threshold effect-as demonstrated by previous studies (He et al., 2024; Huang et al., 2024; Shen et al., 2021; Wang et al., 2021; Xu et al., 2022; Zhu et al., 2023). Despite the extensive research on the non-linear impact mechanism, there is a lack of literature summarizing the curve characteristics and threshold types of this impact. In our study, we categorized the non-linear impacts of social and ecological drivers on ESs from a threshold perspective into three types: "single threshold", "monotonic change", and "complex curve" effects.
The "single threshold" effect is a phenomenon that demonstrates when a driver's value reaches a certain level, its impact on ESs becomes stable. Taking the effect of Dis_river on outdoor recreation service for an example, the service decreased with the increasing distance from the rivers until the distance increased to 1000 m. This can be attributed to rivers being significant natural landscapes with great tourism and recreational appeal (Baró et al., 2016). As the distance from the rivers increases, the convenience for people to engage in outdoor activities using the water (such as swimming, fishing, and boating) decreases, resulting in fewer people willing to participate in water-related activities beyond 1000 m.
The “monotonic change” effect depicts a relationship that ESs are continuously promoted or inhibited as a specific driver increases, without exhibiting any threshold effect. This effect can be easily observed in the relationship between Cons_P and water yield, carbon storage, and biodiversity conservation services. These services steadily decrease as Cons_P increases, presenting a "monotonically diminishing" curve pattern. Similar findings have been reported in previous research (Felipe-Lucia et al., 2020; Wu et al., 2021; Yi et al., 2023). The primary reason for this is that an increase in construction land can cause the natural surface to impermeable surface, preventing precipitation from effectively infiltrating the ground. This, in turn, leads to a rapid loss of precipitation in the form of surface runoff, reducing water yield services. Additionally, the transformation from natural surface to impermeable surface also results in a decrease in vegetation cover and creating physical barriers that impede species migration and gene flow. This increases ecological isolation, decreases carbon storage services, and endangers biodiversity.
The “complex curve” effect manifests a curve characteristic of positive and negative effects intersected or mixed with each other, that is, drivers have a positive impact on ESs within a certain range of values, while in another range of values, their impact on ESs is negative; meanwhile, these positive and negative effects are intersected. The “complex curve” effect could be embodied into “S-shape”, “inverted S-shape” and “inverted U-shape” effects. Taking the “S-shape” effect of SHAPE on outdoor recreation service for an example, when SHDI remains at a relatively low value, as the SHDI increased, the service stabilized at a low level; when the SHDI hits a certain value, the service increased sharply; when the SHDI reaches another value, the service stayed at a high level again. This may because a higher SHDI value signifies a more complex and heterogeneous landscape (Jiang et al., 2024) and thus indicates a more attractiveness for people to participate in outdoor recreation. When SHDI remains at a lower level, the capacity of landscape to attract people stays relatively low, but when SHDI reaches a certain threshold, an increase in landscape complexity would greatly increase the willingness of people to visit and recreate outdoor. However, when the SHDI reaches to another high level, the capacity of landscape to provide outdoor recreation would not be continuously promoted because it has already attracted most people around.
5.2. Policy Implications for Ecological Restoration
Ecological restoration is a crucial activity that improves ecosystem functions and restoring ecosystem health and stability by repairing ecosystems that are structurally disordered, functionally impaired, or even damaged (Fu et al., 2023). Accurately identifying ecological restoration areas is a crucial issue in ecological restoration activities, and many studies have identified areas with low ESs values, ecologically sensitive areas, and ecological inflection points as potential ecological restoration areas (Hu et al., 2023; Liu et al., 2024). Once ecological restoration areas are identified, selecting appropriate ecological restoration measures becomes a challenging problem for urban planners. Previous studies have primarily selected restoration measures based on an analysis of the background conditions, major problems, and target tasks, without quantitatively analyzing the impact mechanisms and thresholds of drivers on ESs (Bian et al., 2024; Chen et al., 2024). By quantitatively analyzing the impact mechanisms and thresholds of drivers on ESs, it is possible to select ecological restoration measures in a more scientifical and reasonable manner, thereby enhancing the capacity of ESs.
Based on our research, the dominant drivers and their impact directions varied across different ESs. When faced with the degradation of ESs caused by various social and ecological drivers, managers can firstly identify areas of ESs decline or low value and then take targeted restoration measures to address the dominant drivers according to the findings in Section 4.2 to influence the targeted ESs. For example, AI, Dis_river, Ara_P, Cons_P, and SHAPE were found to be the major determinants of carbon storage service. The proportion of Ara_P, Dis_river, and AI all increased the capacity of carbon storage service, while the Cons_P and SHAPE decreased it. Therefore, in areas where carbon storage degradation is severe, particularly in urban centres and at the edge of basic arable land protection zones, measures such as adding water sources, cultivating arable land, planting trees, and optimizing land use layout (e.g., increasing the degree of land-use agglomeration and regularizing land patches) can be taken to restore the carbon storage service. For degraded areas that provide multiple ESs, comprehensive steps should be undertaken to improve the overall capacity of ecosystems to provide various ESs.
However, our research demonstrated that the impacts of most social and ecological drivers on ESs had significant threshold effects; that is, once the value of a driver exceeds a specific threshold, its impact on ESs would change dramatically. This is consistent with the findings of Peng et al. (2017), Zhao et al. (2024) and Wang et al. (2024). In order to “achieve greater returns with smaller inputs”, we should control ecological restoration efforts within a predetermined threshold. Water yield service, for instance, was found to rise with the area percentage of water bodies. However, this growth stabilized at a percentage of water area greater than 0.4. This implies that maintaining the water area share within 0.4 will maximize the impact of an increase in water yield service, while going above that will drastically lower the desired effect.
5.3. Limitations and Prospects
Compared to previous methods such as correlation analysis (Bailey, 1983; Chen et al., 2023), Geodetector (Sun et al., 2024; Wu et al., 2024) and geographically weighted regression (Jia et al., 2023; Ma et al., 2022), the random forest utilized in this study has a significant advantage in dealing with complex socio-ecological data. It can effectively evaluate interactions among various drivers and quantify their relative importance on ESs. Furthermore, the partial dependency analysis can depict the curvilinear impacts of dominant drivers on ESs and identify the impact thresholds from a global perspective. Based on this, we were able to summarize three types of non-linear impacts of social and ecological drivers on ESs from a threshold perspective, which is a novel contribution to the field. Moreover, compared to previous studies that have focused on administrative scales (Wang et al., 2024), the 1 km grid cell utilized in this study allows for a clearer demonstration of the interactions between ESs and their drivers in local space. This provides more detailed guidance for the selection of measures for ecological restoration.
This study has several limitations in addition to the aforementioned enhancements. First, the analyses of mechanisms affecting ESs in this paper were conducted at a single scale, but scale effects exist in the driven mechanisms of ESs due to the intricate and hierarchical structure of ecosystems (Zhang et al., 2024). Ignoring these effects may bias the results, so further research at various scales is necessary to understand how stable the relationship is. Second, this work did not take much account of human and policy factors in the selection of social and ecological drivers (Chen and Liu 2021). In the future, a more thorough understanding of the internal mechanism of ESs could be achieved by developing a better framework for drivers.
6. Conclusions
The study’s findings demonstrated that, with the exception of erosion prevention service, there was significant spatial heterogeneity in other ESs in Wuhan, characterized by a pattern of “low in the central region and high in the periphery of the city”. In addition, among all social and ecological drivers, DEM, Dis_river, SoilOC, AI, and SHDI played the most important roles in affecting the provision of ESs whereas the grass percentage, sand, silt, and clay content were least important. Moreover, three types of non-linear impacts of social and ecological drivers on ESs were identified from a threshold perspective. The majority of drivers showed clear “single threshold” effects on ESs, the minority exhibited “monotonic change” (i.e., “monotonically increasing” and “monotonically decreasing”) effects, and the rest displayed “complex curve” effects, such as “S-shape”, “inverted S-shape” and “inverted U-shape” effects. To ensure sustainable management of ESs, we should fully take into account the non-linear impacts of social and ecological drivers on ESs and the threshold effects of such impacts when developing pertinent ecological conservation and restoration measures.
References
- Asante-Yeboah, E., et al. (2024). Participatory and Spatially Explicit Assessment to Envision the Future of Land-Use/Land-Cover Change Scenarios on Selected Ecosystem Services in Southwestern Ghana. Environmental Management 74(1):94-113.
- Bai, Y., Chen, Y., Alatalo, J. M., Yang, Z., & Jiang, B. (2020). Scale effects on the relationships between land characteristics and ecosystem services - a case study in Taihu Lake Basin, China. Science of The Total Environment, 716, 137083.
- Bailey, R. G. (1983). Delineation of ecosystem regions. Environmental Management, 7(4), 365-373.
- Bian, H., Li, M., Deng, Y., Zhang, Y., Liu, Y., Wang, Q., Xie, S., Wang, S., Zhang, Z., & Wang, N. (2024). Identification of ecological restoration areas based on the ecological safety security assessment of wetland-hydrological ecological corridors: A case study of the Han River Basin in China. Ecological Indicators, 160, 111780.
- Breiman, L. (2001). Random Forests. Machine Learning. [CrossRef]
- Bridgewater, P., Schmeller, D.S. (2023). The Ninth Plenary of the Intergovernmental Platform on Biodiversity and Ecosystem Services (IPBES-9): sustainable use, values, and business (as usual). Biodiversity Conservation. 32, 1-6.
- Cao, Y., Li, G., Tian, Y., Fang, X., Li, Y., & Tan, Y. (2020). Linking ecosystem services trade-offs, bundles and hotspot identification with cropland management in the coastal Hangzhou Bay area of China. Land Use Policy, 97, 104689.
- Chen, W., Gu, T., Xiang, J., Luo, T., Zeng, J., & Yuan, Y. (2024). Ecological restoration zoning of territorial space in China: An ecosystem health perspective. Journal of Environmental Management, 364, 121371.
- Chen, X., He, L., Luo, F., He, Z., Bai, W., Xiao, Y., & Wang, Z. (2023). Dynamic characteristics and impacts of ecosystem service values under land use change: A case study on the Zoigê plateau, China. Ecological Informatics, 78, 102350.
- Chen, Chengjing, and Yihua Liu. (2021) Spatiotemporal changes of ecosystem services value by incorporating planning policies: A case of the Pearl River Delta, China. Ecological Modelling 461:109777.
- Clerici, N., Cote-Navarro, F., Escobedo, F. J., Rubiano, K., & Villegas, J. C. (2019). Spatio-temporal and cumulative effects of land use-land cover and climate change on two ecosystem services in the Colombian Andes. Science of The Total Environment, 685, 1181-1192.
- Costanza, R., D’Arge, R., Groot, R. D., Farber, S., Grasso, M., Hannon, B., Limburg, K., Naeem, S., O’Neill, R. V., & Paruelo, J. (1997). The value of the world’s ecosystem services and natural capital. Ecological Economics, 25(1), 3-15.
- Cui, X., & Huang, L. (2023). Integrating ecosystem services and ecological risks for urban ecological zoning: A case study of Wuhan City, China. Human and Ecological Risk Assessment, 29(9-10), 1299-1317.
- Dabral, P. P., Neelakshi Baithuri, and Ashish Pandey. (2008). Soil Erosion Assessment in a Hilly Catchment of North Eastern India Using USLE, GIS and Remote Sensing. Water Resources Management 22(12):1783-1798.
- Felipe-Lucia, M., Soliveres, S., Penone, C., Fischer, M., Ammer, C., Boch, S., Boeddinghaus, R. S., Bonkowski, M., Buscot, F., Fiore-Donno, A. M., Frank, K., Goldmann, K., Gossner, M. M., Hölzel, N., Jochum, M., Kandeler, E., Klaus, V. H., Kleinebecker, T., Leimer, S., Manning, P., … Allan, E. (2020). Land-use intensity alters networks between biodiversity, ecosystem functions, and services. Proceedings of the National Academy of Sciences of the United States of America, 117(45), 28140-28149.
- Francesc Baró, Palomo, I., Zulian, G., Vizcaino, P., & Erik Gómez-Baggethun. (2016). Mapping ecosystem service capacity, flow and demand for landscape and urban planning: A case study in the Barcelona metropolitan region. Land Use Policy, 57, 405-417.
- Fu, B., Liu, Y., & Meadows, M. E. (2023). Ecological restoration for sustainable development in China. National Science Review, 10(7), nwad033.
- Geng, J., Yuan, M., Xu, S., Bai, T., Xiao, Y., Li, X., & Xu, D. (2022). Urban Expansion Was the Main Driving Force for the Decline in Ecosystem Services in Hainan Island during 1980-2015. International Journal of Environmental Research and Public Health, 19(23), 15665.
- Gissi, E., Manea, E., Mazaris, A. D., Fraschetti, S., Almpanidou, V., Bevilacqua, S., Coll, M., Guarnieri, G., Lloret-Lloret, E., Pascual, M., Petza, D., Rilov, G., Schonwald, M., Stelzenmüller, V., & Katsanevakis, S. (2021). A review of the combined effects of climate change and other local human stressors on the marine environment. Science of The Total Environment, 755(Pt 1), 142564.
- Guo, M., Ma, S., Wang, L.-J., & Lin, C. (2021). Impacts of future climate change and different management scenarios on water-related ecosystem services: A case study in the Jianghuai ecological economic Zone, China. Ecological Indicators, 127, 107732.
- He, L., Xie, Z., Wu, H., Liu, Z., Zheng, B., & Wan, W. (2024). Exploring the interrelations and driving factors among typical ecosystem services in the Yangtze river economic Belt, China. Journal of Environmental Management, 351, 119794.
- Helseth, E. V., Vedeld, P., Framstad, E., & Gómez-Baggethun, E. (2022). Forest ecosystem services in Norway: Trends, condition, and drivers of change (1950-2020). Ecosystem Services, 58, 101491.
- Hou, W., Hu, T., Yang, L., Liu, X., Zheng, X., Pan, H., Zhang, X., Xiao, S., & Deng, S. (2023). Matching ecosystem services supply and demand in China’s urban agglomerations for multiple-scale management. Journal of Cleaner production, 420 (Sep.25), 138351.1.
- Hu, M., Zhang, H., Tang, J., & Yan, S. (2023). Zoning and Optimization Strategies of Land Spatial Ecological Restoration in Liangjiang New Area of Chongqing Based on the Supply–Demand Relationship of Ecosystem Services. Land, 12(6), 1255.
- Hu, X., Hou, Y., Li, D., Hua, T., Marchi, M., Paola Forero Urrego, J., Huang, B., Zhao, W., & Cherubini, F. (2023). Changes in multiple ecosystem services and their influencing factors in Nordic countries. Ecological Indicators, 146, 109847.
- Huang, X., Xie, Y., Lei, F., Cao, L., & Zeng, H. (2024). Analysis on spatio-temporal evolution and influencing factors of ecosystem service in the Changsha-Zhuzhou-Xiangtan urban agglomeration, China. Frontiers in Environmental Science, 11, 1334458..
- Jia, K., Huang, A., Yin, X., Yang, J., Deng, L., & Lin, Z. (2023). Investigating the Impact of Urbanization on Water Ecosystem Services in the Dongjiang River Basin: A Spatial Analysis. Remote Sensing, 15(9), 2265.
- Jiang, Y., Ouyang, B., & Yan, Z. (2024). Multiscale Analysis for Identifying the Impact of Human and Natural Factors on Water-Related Ecosystem Services. Sustainability, 16(5),1738.
- Kang, J., Li, C., Zhang, B., Zhang, J., Li, M., & Hu, Y. (2023). How do natural and human factors influence ecosystem services changing? A case study in two most developed regions of China. Ecological Indicators, 146, 109891.
- Krawczynski, R., Milne, E., & Banwart, S. A. (2015). Soil carbon, multiple benefits. Journal of Environmental Research And Development, 13, 33-38.
- Li, N., Sun, P., Zhang, J., Mo, J., & Wang, K. (2024). Spatiotemporal evolution and driving factors of ecosystem services’ transformation in the Yellow River basin, China. Environmental Monitoring and Assessment, 196(3), 252.
- Li, Z., Ma, L., Chen, X., Wang, X., & Bai, J. (2023). Zoning and Management of Ecological Restoration from the Perspective of Ecosystem Service Supply and Demand: A Case Study of Yuzhong County in Longzhong Loess Hilly Region, China. Land, 12(5), 992.
- Liu, W., Zhan, J., Zhao, F., Yan, H., Zhang, F., & Wei, X. (2019). Impacts of urbanization-induced land-use changes on ecosystem services: A case study of the Pearl River Delta Metropolitan Region, China. Ecological Indicators, 98, 228-238.
- Liu, Y., Huang, J., & Lin, W. (2024). Zoning strategies for ecological restoration in the karst region of Guangdong province, China: A perspective from the “social-ecological system.” Frontiers in Environmental Science, 12, 1369635.
- Lorilla, R. S., et al. 2020 Socio-ecological determinants of multiple ecosystem services on the Mediterranean landscapes of the Ionian Islands (Greece). Ecological Modelling 422.
- Ma, S., Qiao, Y.-P., Wang, L.-J., & Zhang, J.-C. (2021). Terrain gradient variations in ecosystem services of different vegetation types in mountainous regions: Vegetation resource conservation and sustainable development. Forest Ecology and Management, 482, 118856.
- Ma, S., Wang, L.-J., Wang, H.-Y., Zhang, X., & Jiang, J. (2022). Spatial heterogeneity of ecosystem services in response to landscape patterns under the Grain for Green Program: A case-study in Kaihua County, China. Land Degradation & Development, 33(11), 1901-1916.
- Mouchet, M. A., Paracchini, M. L., Schulp, C. J. E., Stürck, J., Verkerk, P. J., Verburg, P. H., & Lavorel, S. (2017). Bundles of ecosystem (dis)services and multifunctionality across European landscapes. Ecological Indicators, 73, 23-28.
- Ngabire, M., Wang, T., Xue, X., Liao, J., Sahbeni, G., Huang, C., Duan, H., & Song, X. (2022). Soil salinization mapping across different sandy land-cover types in the Shiyang River Basin: A remote sensing and multiple linear regression approach. Remote Sensing Applications: Society and Environment, 28, 100847.
- Olaniyi, O. E., and H. O. Omowale. (2022). Evaluating the dynamics and eco-climatic predictors of forest conversion and restoration in Old Oyo National Park, Nigeria using geospatial and machine learning techniques. Modeling Earth Systems And Environment 8(1):227-244.
- Peng, J., et al. (2017). Ecosystem services response to urbanization in metropolitan areas: Thresholds identification. Science Of the Total Environment 607:706-714.
- Rejani, R., et al. (2016). Spatial and temporal estimation of soil loss for the sustainable management of a wet semi-arid watershed cluster. Environmental Monitoring & Assessment 188(3):1-16.
- Ren, D. F., et al. (2023) Spatial Responses of Ecosystem Service Trade-offs and Synergies to Impact Factors in Liaoning Province. Environmental Management.
- Tallis, Heather, and Taylor Ricketts. 2010 InVEST 1.0 Beta User's Guide: Integrated Valuation of Ecosystem Services and Tradeoffs.
- Yee, S. H., et al. (2021) Projecting effects of land use change on human well-being through changes in ecosystem services. Ecological Modelling 440.
- Zhang, Y., et al. ( 2021). Urban expansion simulation under constraint of multiple ecosystem services (MESs) based on cellular automata (CA)-Markov model: Scenario analysis and policy implications. Land Use Policy 108.
- Zhang, Y., et al. 2018 On the spatial relationship between ecosystem services and urbanization: A case study in Wuhan, China. Science Of the Total Environment 637:780-790.
- Zhang, Y., Zhao, Z., Fu, B., Ma, R., Yang, Y., Lü, Y., & Wu, X. (2022). Identifying ecological security patterns based on the supply, demand and sensitivity of ecosystem service: A case study in the Yellow River Basin, China. Journal of Environmental Management, 315, 115158.
- Zhang, Y., Liu, Y.., Wang, Y.. Liu, D., Xia, C., Wang, Z., Wang, H., & Liu, Y.. (2020). Urban expansion simulation towards low-carbon development: A case study of Wuhan, China. Sustainable Cities and Society, 63, 102455.
- Zhao, M., Zhou, Q., Luo, Y., Li, Y., Wang, Y., & Yuan, E. (2024). Threshold Effects between Ecosystem Services and Natural and Social Drivers in Karst Landscapes. Land, 13(5), 691.
- Zhao, N., Liu, Y., Cao, G., Samson, E. L., & Zhang, J. (2017). Forecasting China’s GDP at the pixel level using nighttime lights time series and population images. GIScience & Remote Sensing, 54(3), 407-425.
- Zhu, S., Zhao, Y., Huang, J., & Wang, S. (2023). Analysis of Spatial-Temporal Differentiation and Influencing Factors of Ecosystem Services in Resource-Based Cities in Semiarid Regions. Remote Sensing, 15(4), 871.
- Zhu, J., Ke X., Zhou T., & He L. (2023). Evaluation of ecological security of natural resources in Wuhan based on "contribution, vitality, organisational strength and resilience". Bulletin of Soil and Water Conservation, 43(4), 248-255+306. (in Chinese).
- Zhu, W., Pan Y., Zhang J. (2007). Estimation of net primary production of Chinese terrestrial vegetation based on remote sensing. Chinese Journal of Plant Ecology, 31(3), 413-424. (In Chinese).
Figure 1.
Location and elevation of Wuhan City.
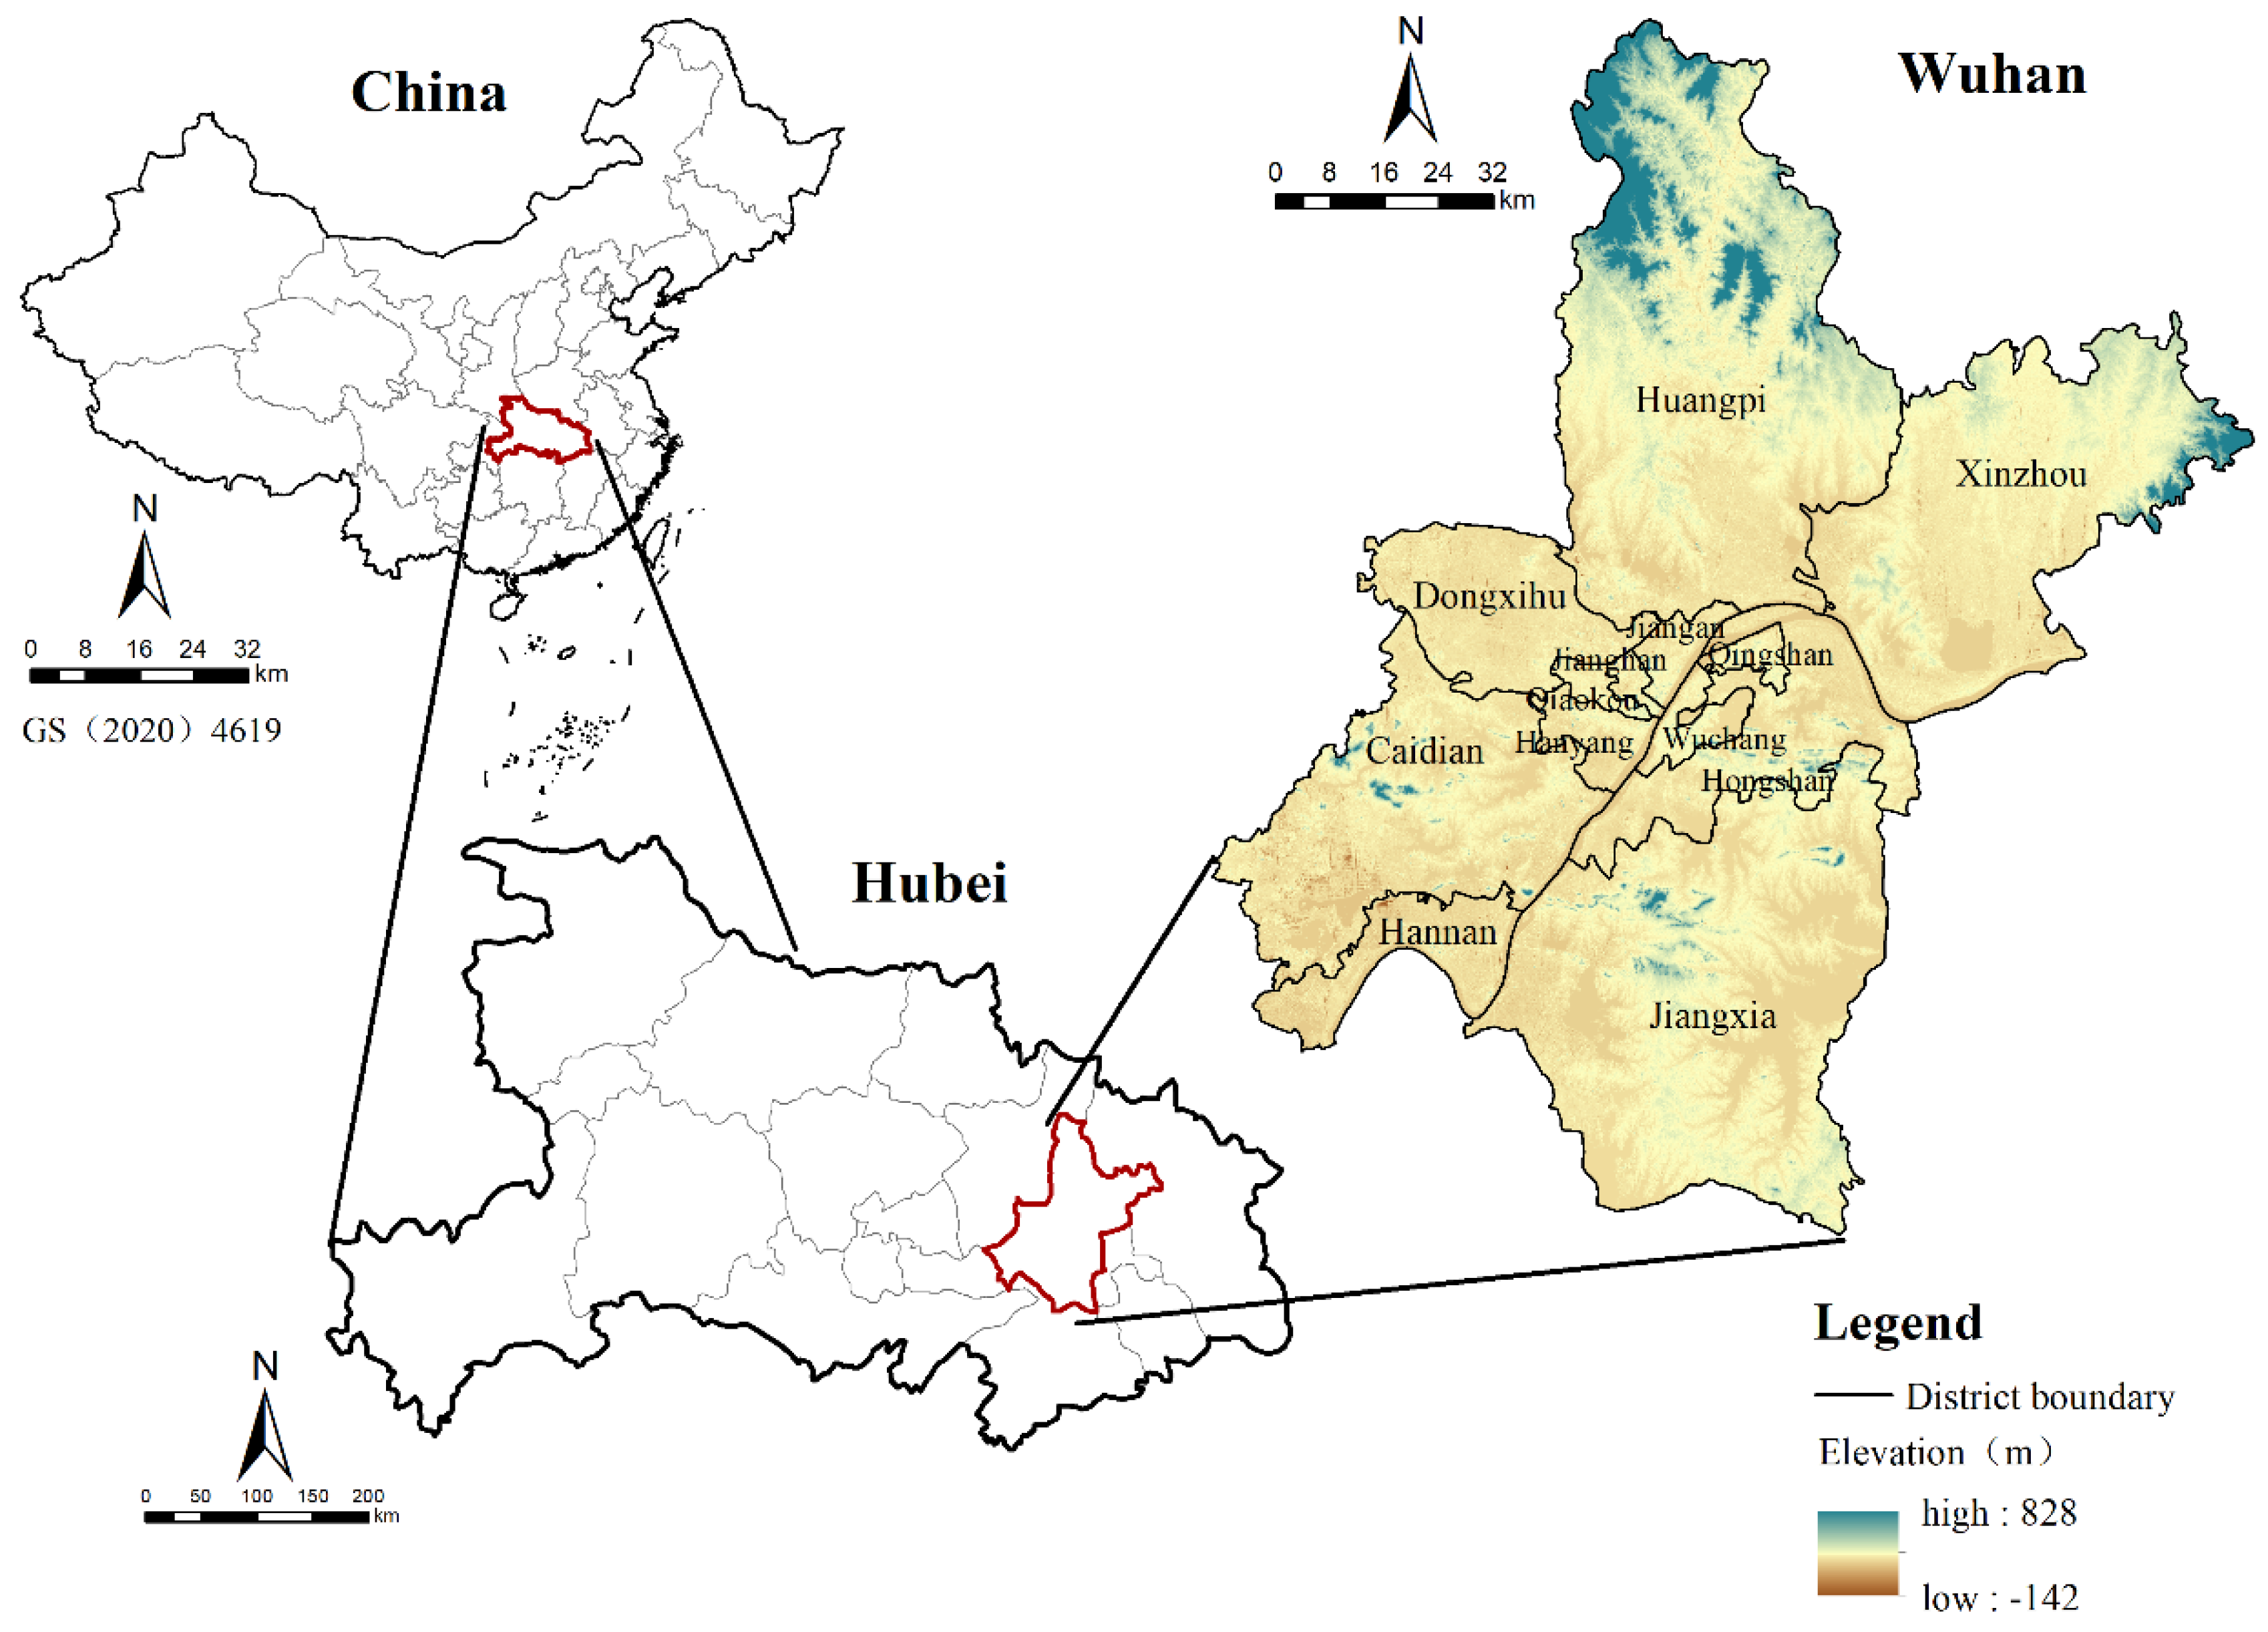
Figure 2.
Framework of the method.
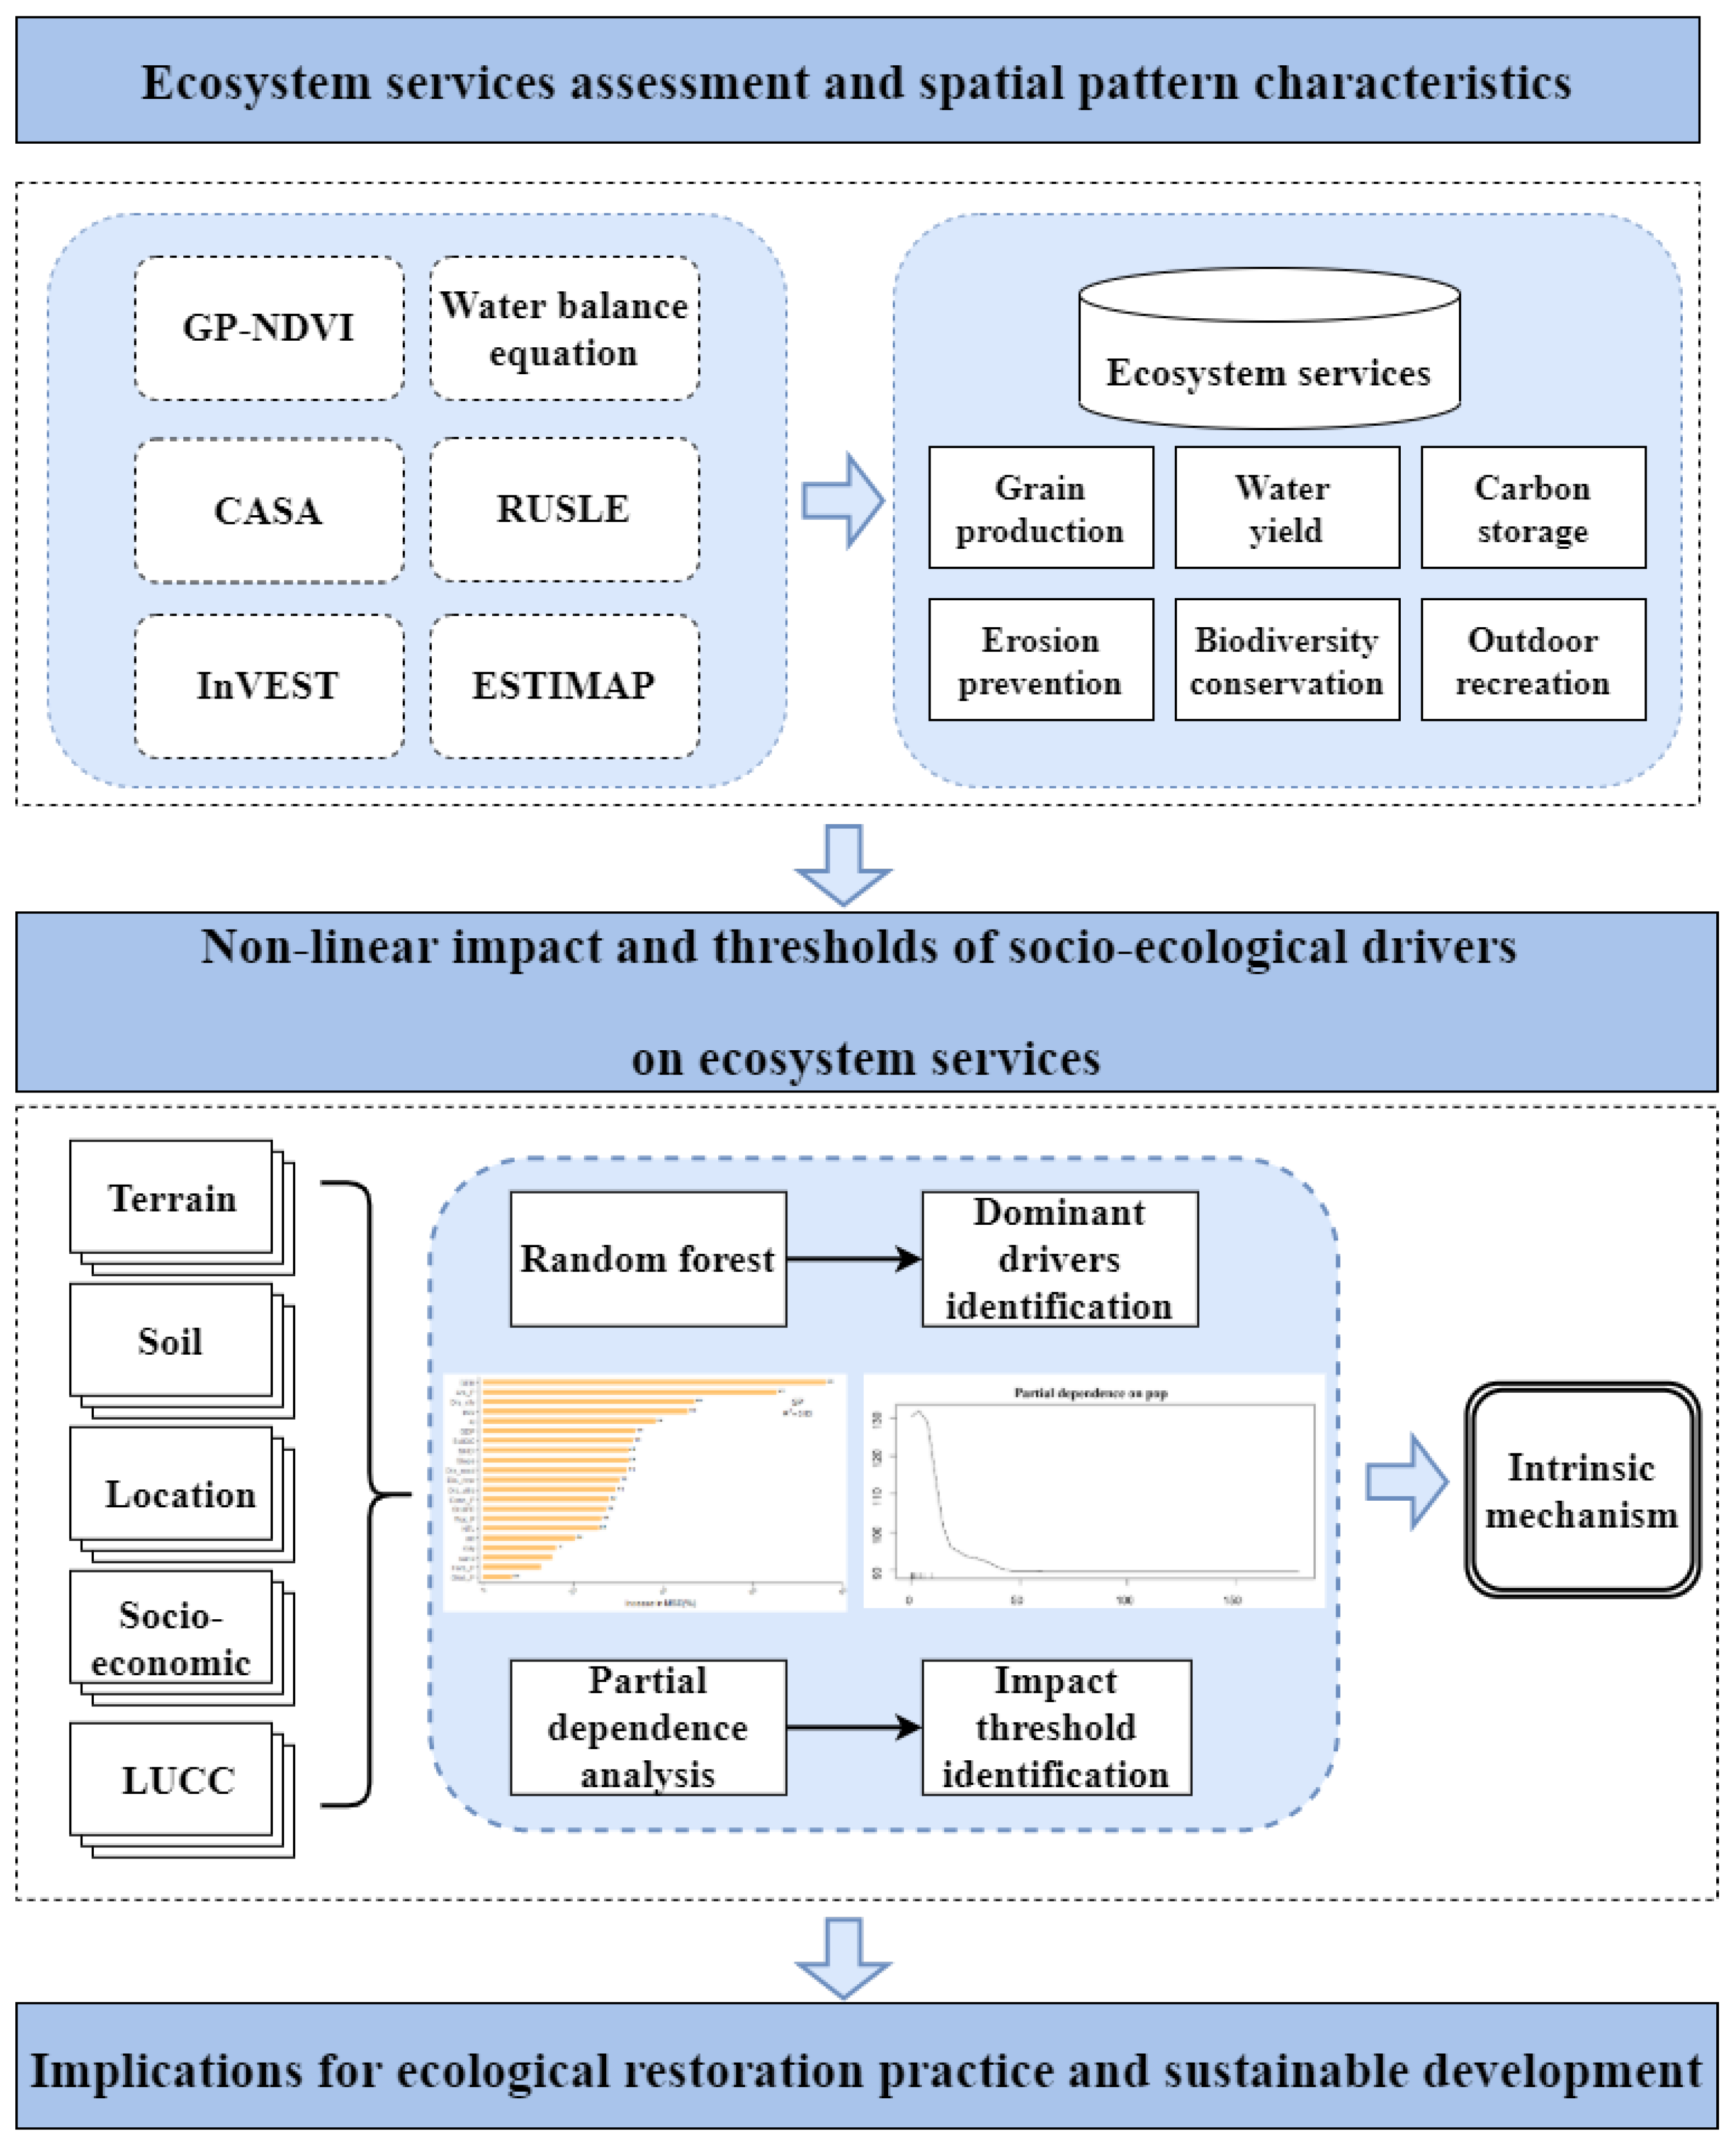
Figure 3.
Spatial patterns of ecosystem services in Wuhan.
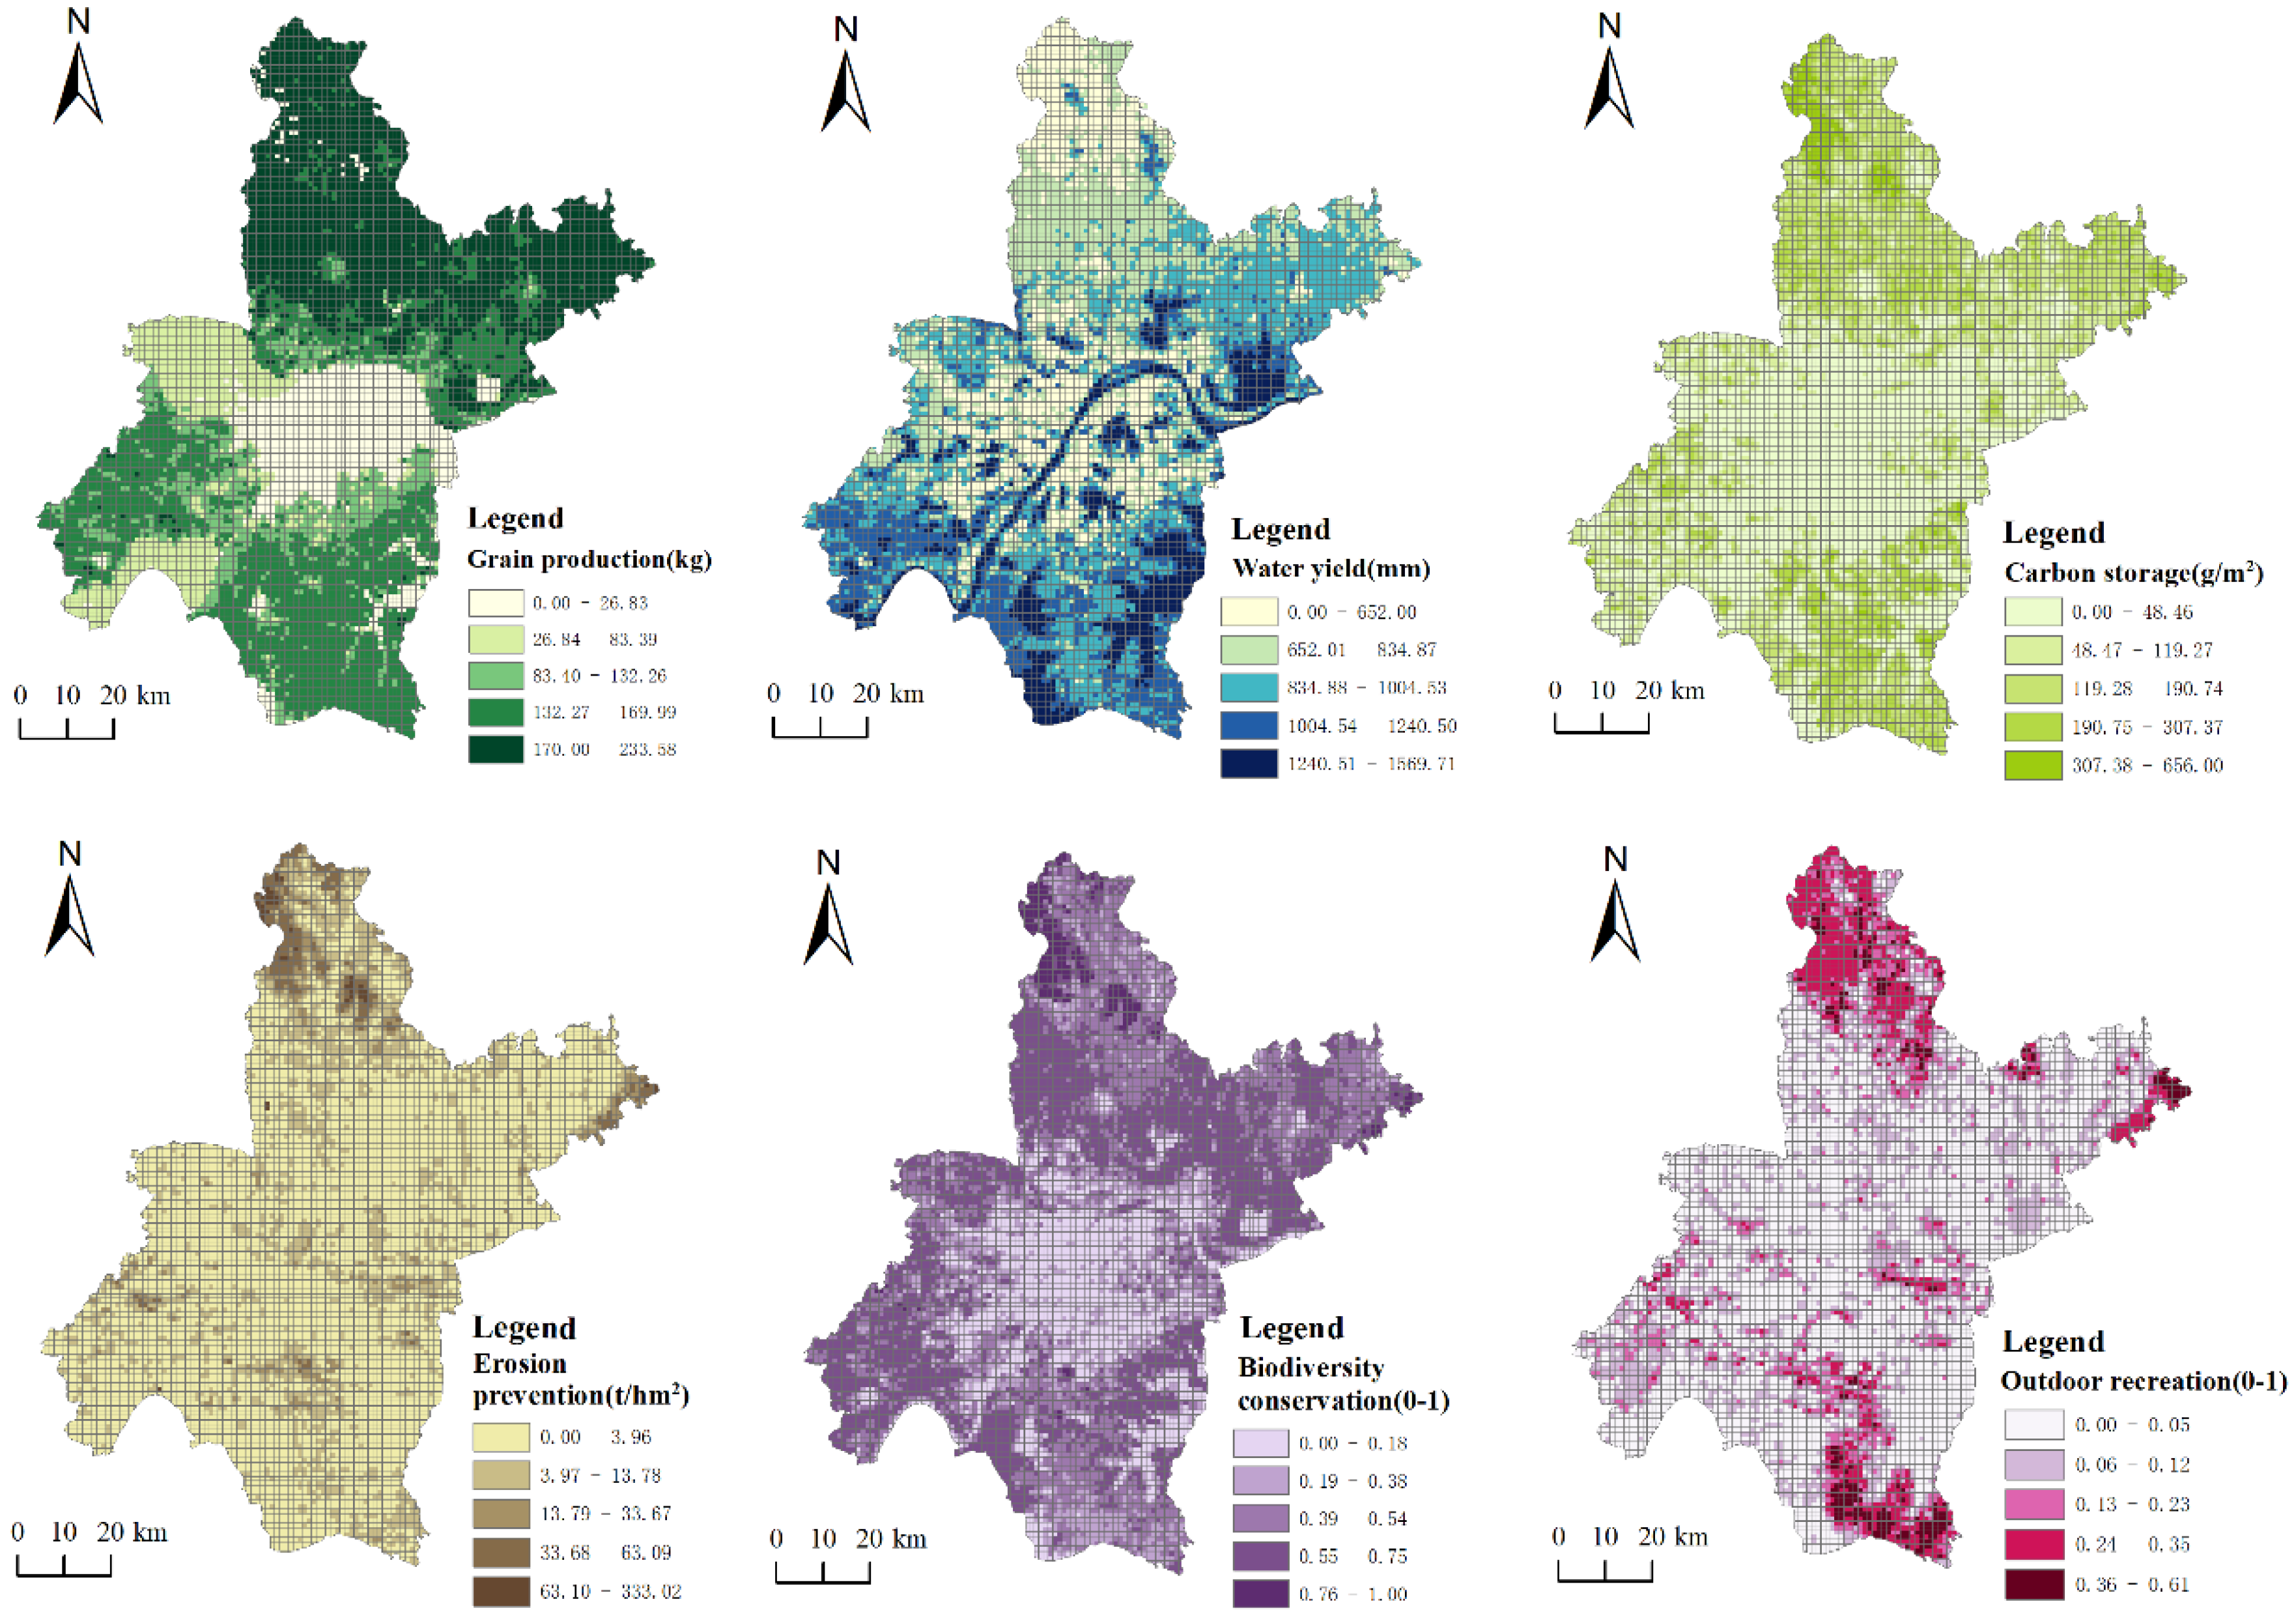
Figure 4.
Relative importances of social and ecological drivers on ecosystem services. (DEM: elevation; Ara_P: proportion of arable land; Dis_city: distance to city; POP: population density; AI: aggregation index; GDP: gross domestic product; SoilOC: soil organic carbon content; SHDI: Shannon diversity index; Slope: slope; Dis_road: distance to road; Dis_river: distance from rivers; Dis_villa: distance to village; Cons_P: proportion of construction land; SHAPE: average shape index; Wat_P:Proportion of waters; NTL: Nighttime lighting index; Silt: soil silt content; Clay: soil clay content; Sand:soil sand content; Fore_P: proportion of forest land; Gras_P: proportion of grassland).
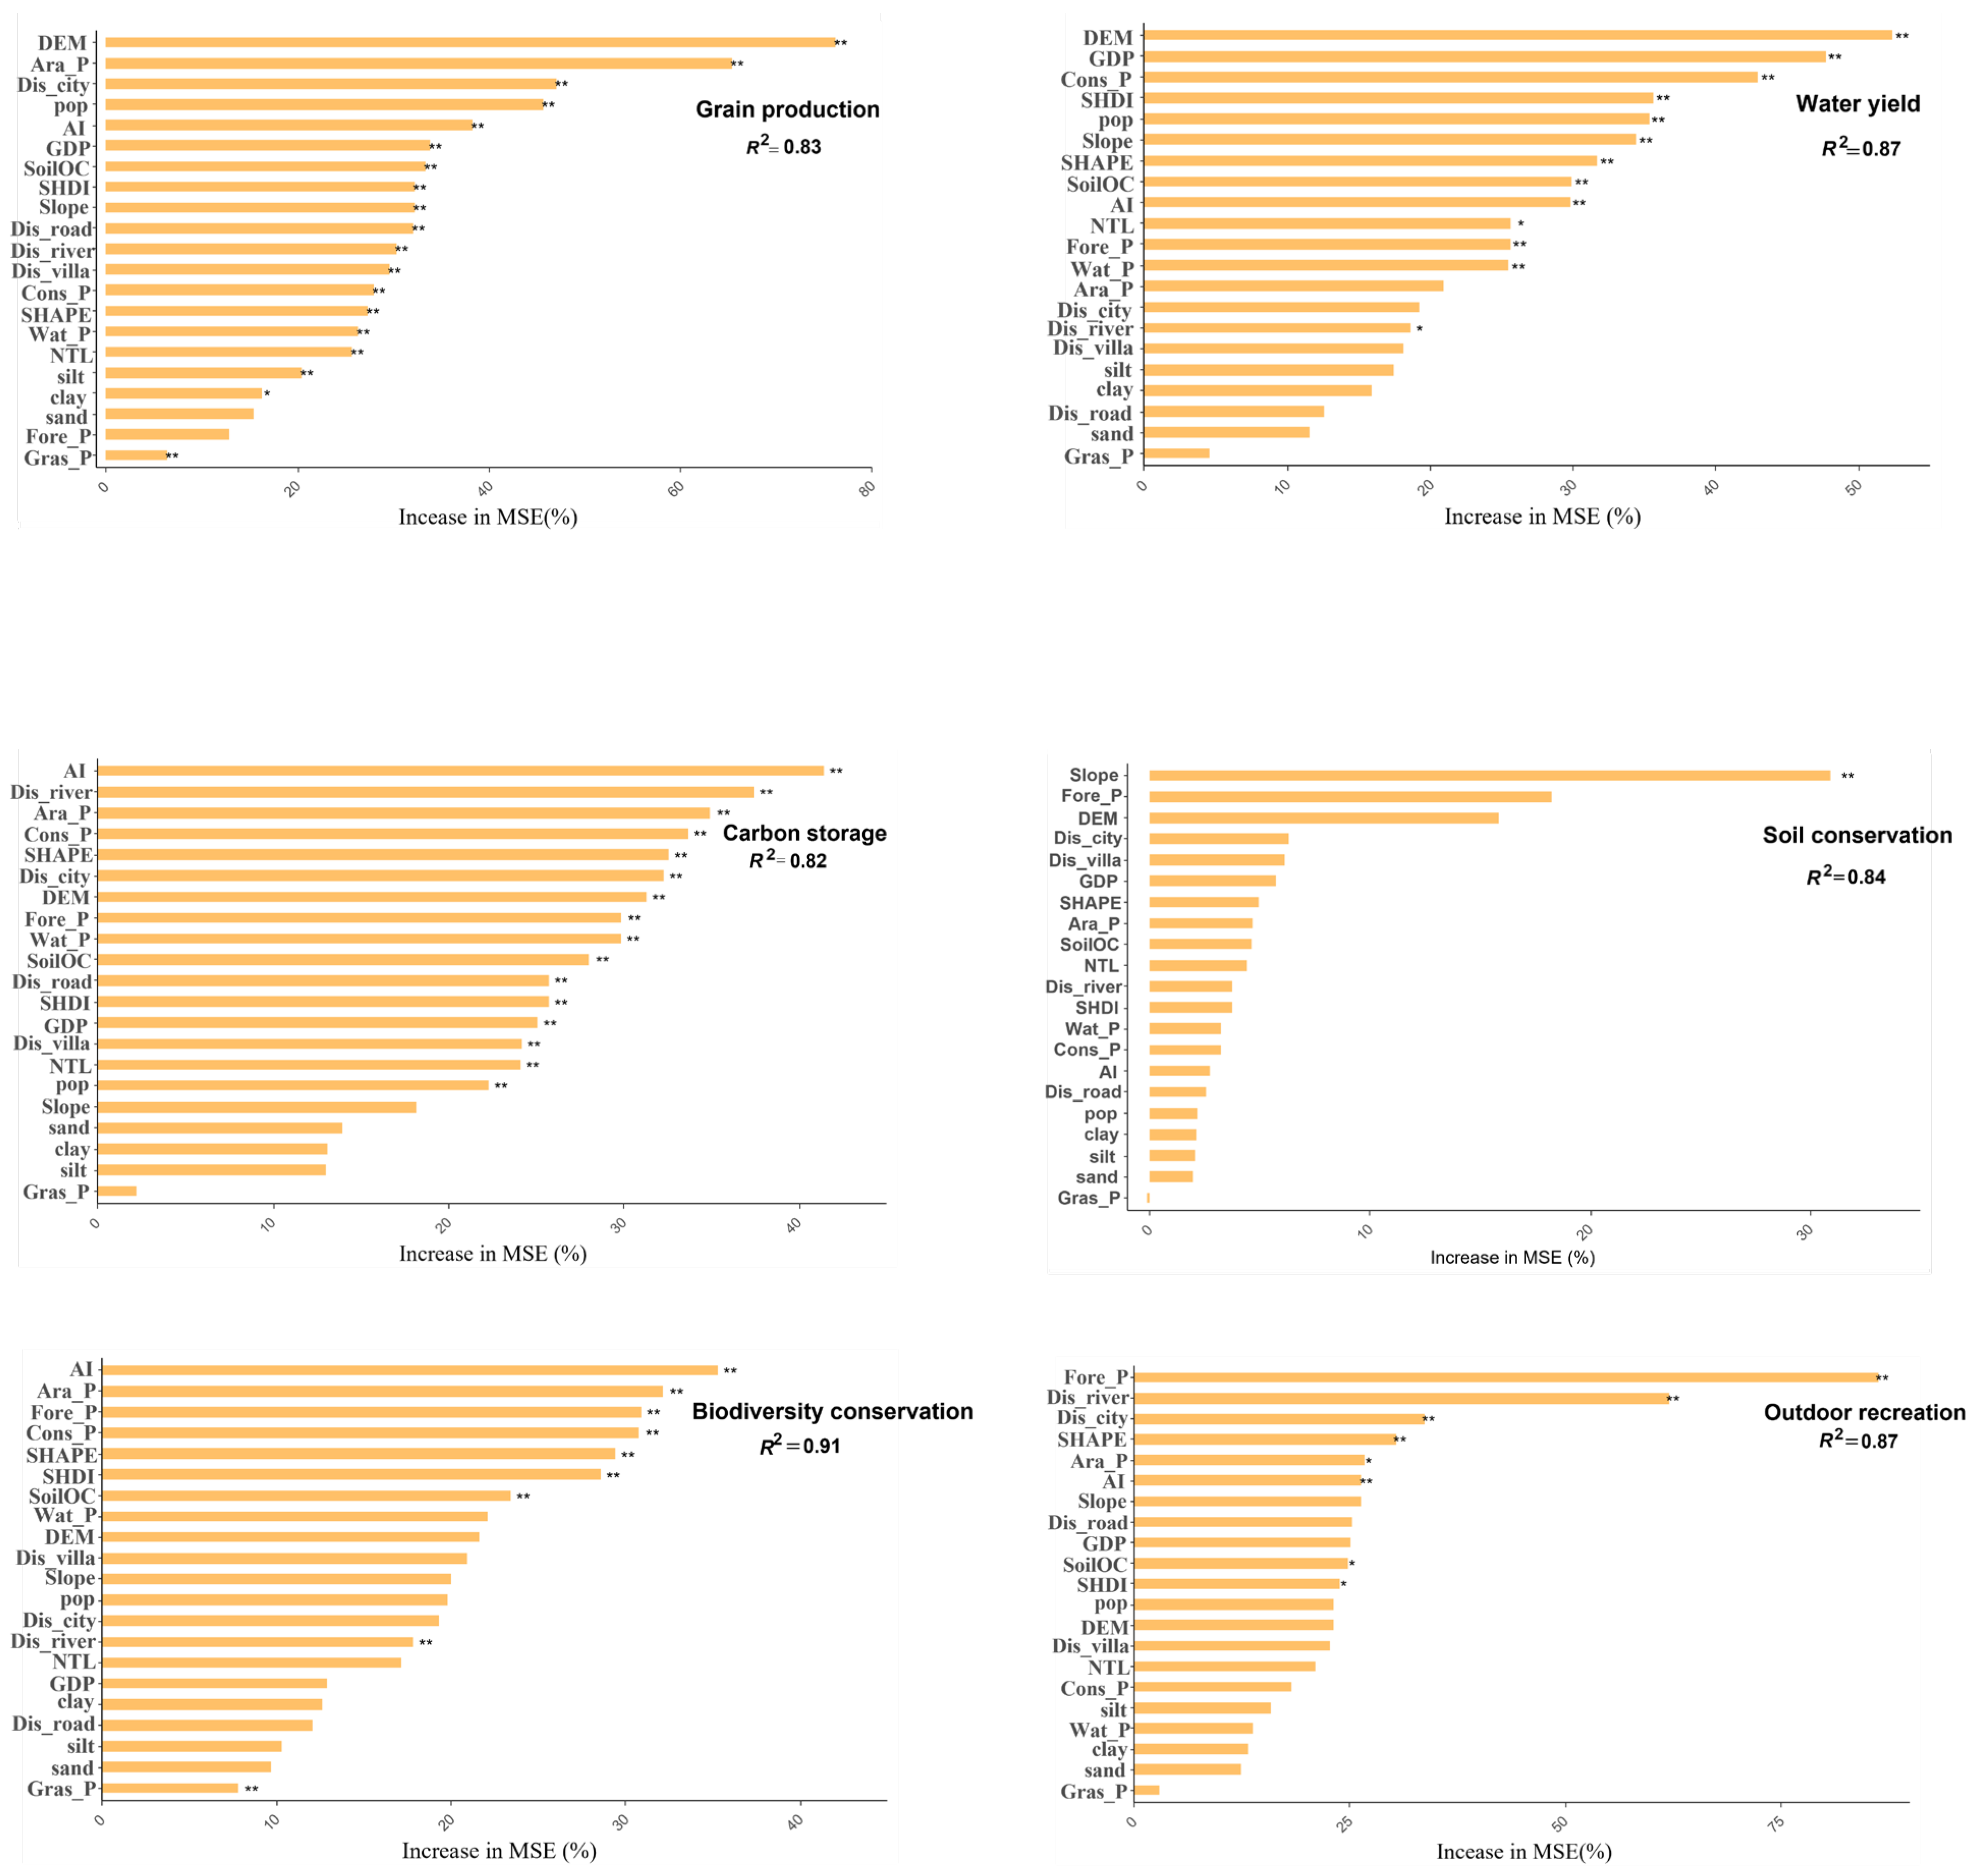
Figure 5.
Word cloud of social and ecological drivers on ecosystem services (Dis_river: distance from rivers; SoilOC: soil organic carbon content; SHAPE: average shape index; AI: aggregation index; Fore_P: proportion of forest land; Cons_P: proportion of construction land; SHDI: Shannon diversity index; Ara_P: proportion of arable land; Dis_city: distance to city; GDP: gross domestic product; POP: population density; NTL: Nighttime lighting index; Dis_road: distance to road; Slope: slope; DEM: elevation; Dis_villa: distance to village; Dis_road: Gras_P: proportion of grassland; Clay: soil clay content; Silt: soil silt content).
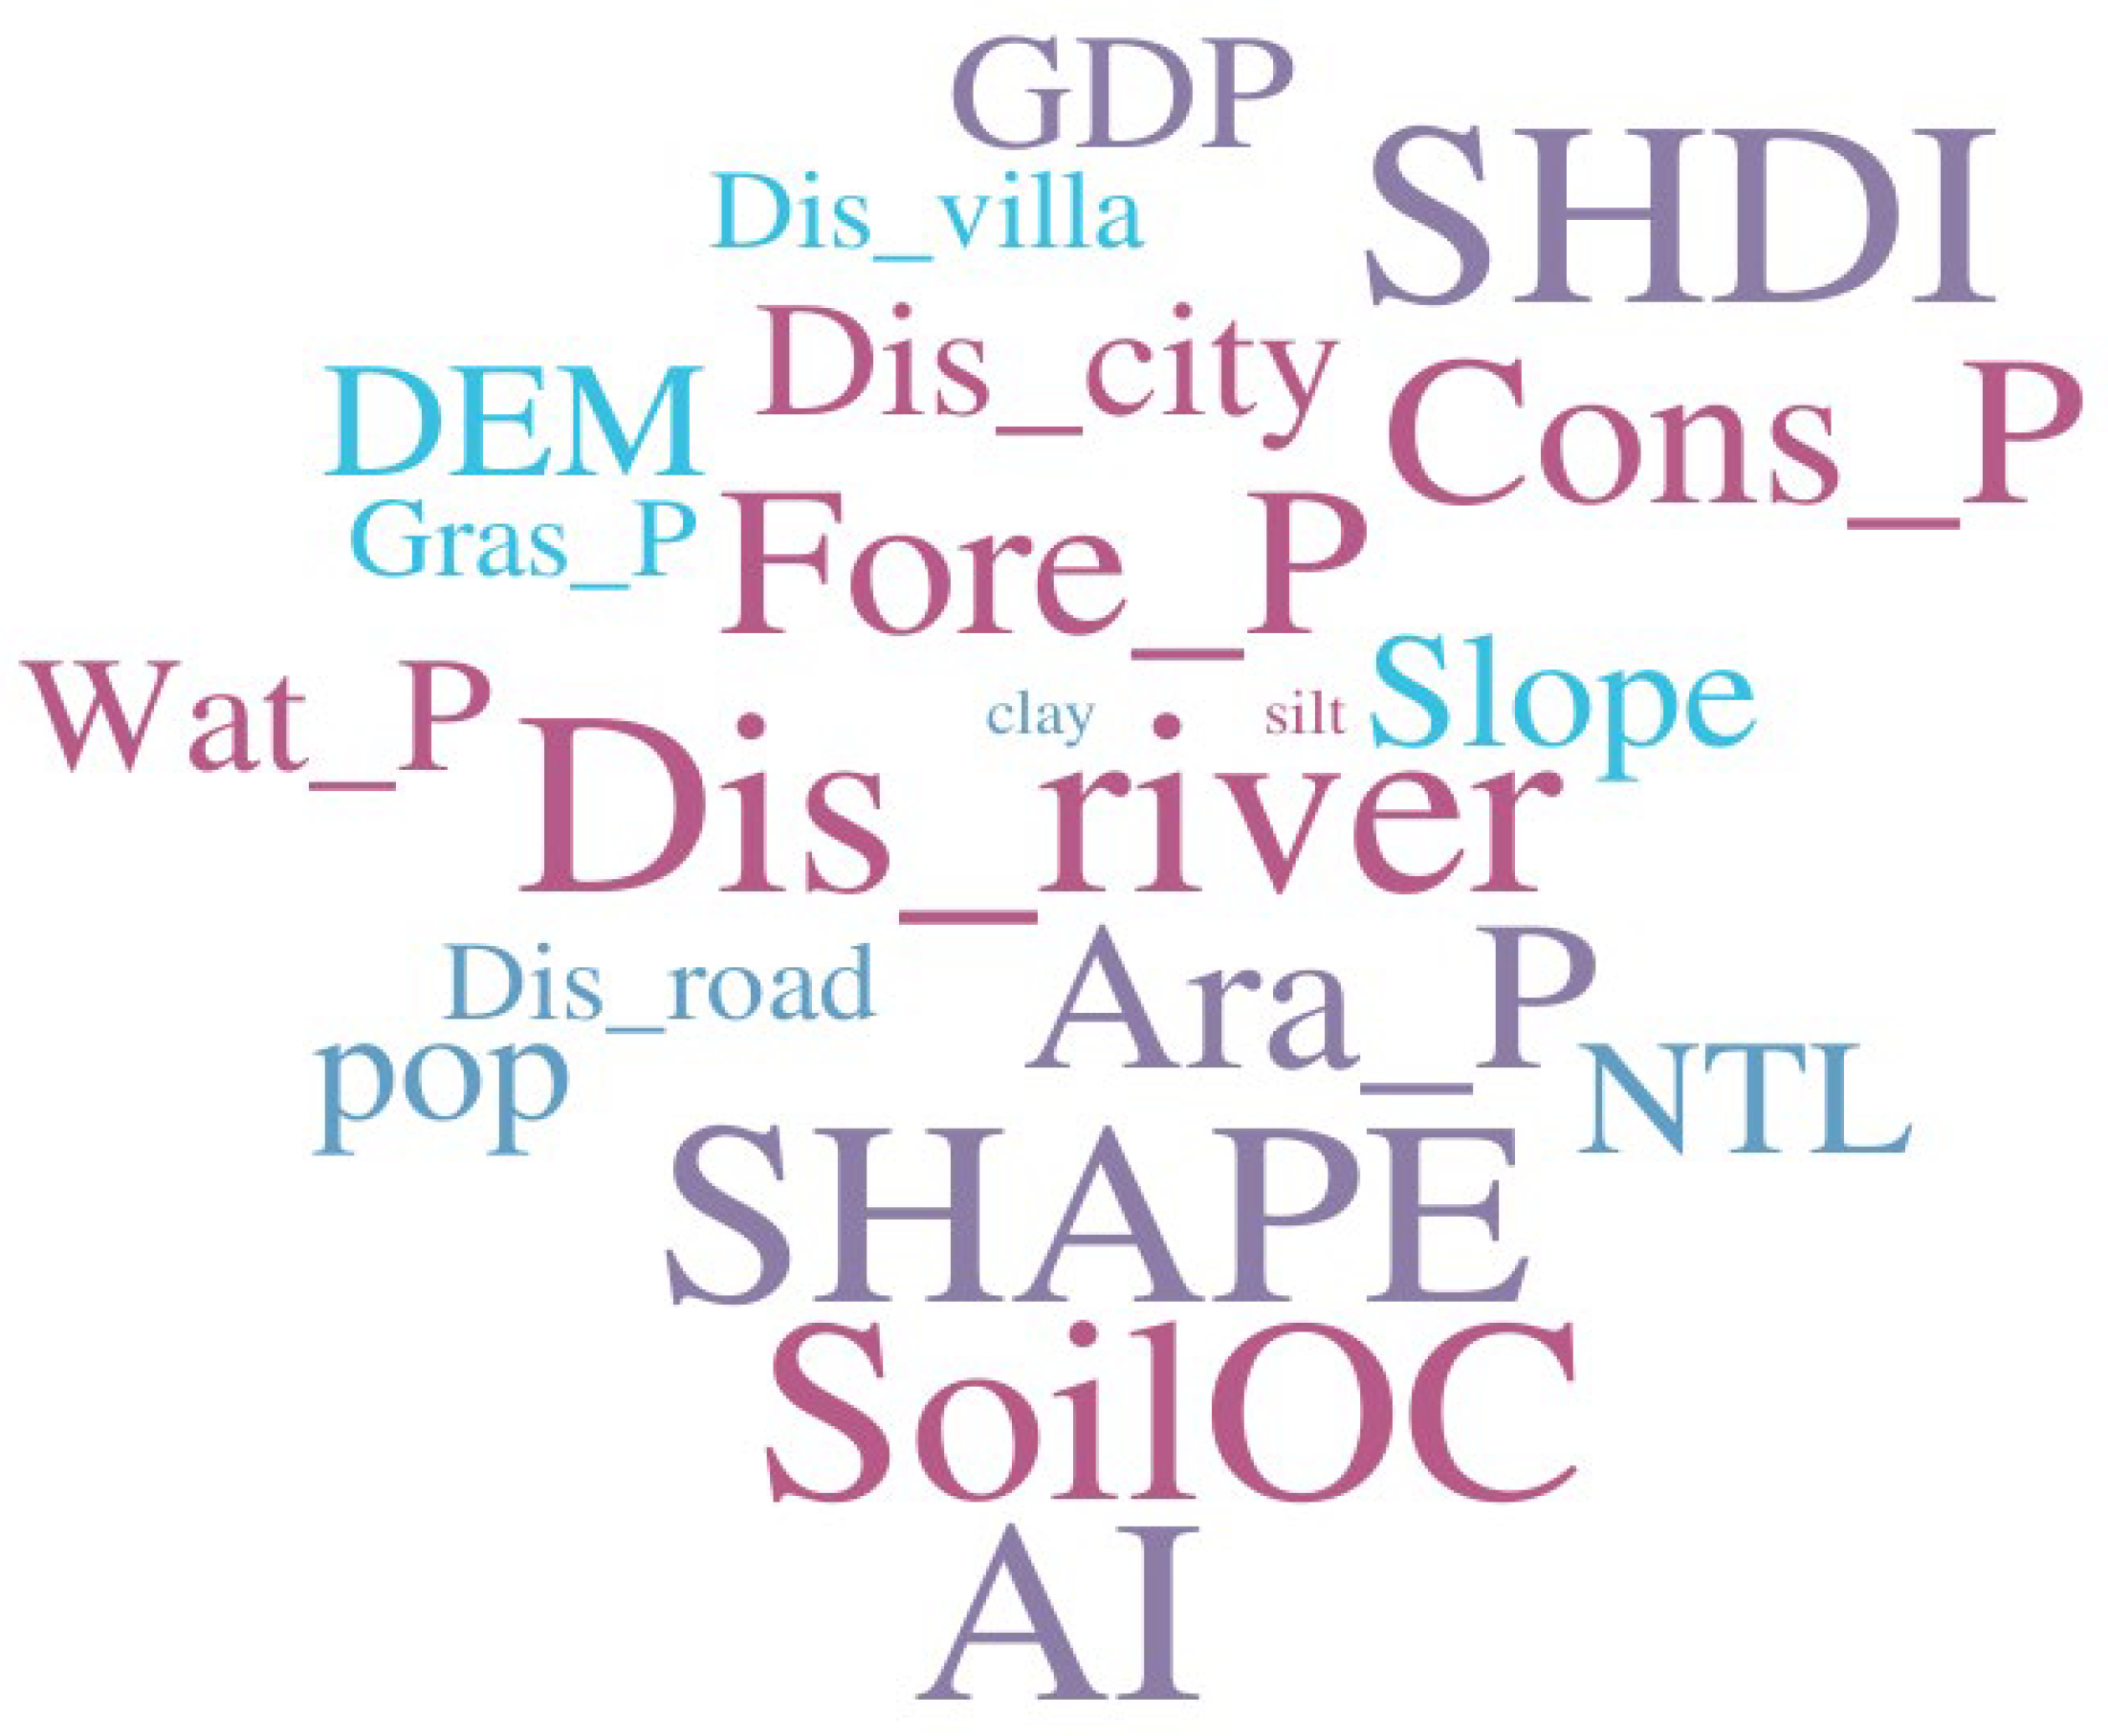
Figure 6.
Partial dependency plots on the impacts of dominant social and ecological drivers on grain production (left), water yield (middle), and carbon storage (right) services (DEM: elevation; Ara_P: proportion of arable land; Dis_city: distance from cities; POP: population density; AI: aggregation index; GDP: gross domestic product; Cons_P: proportion of construction land; SHDI: Shannon diversity index; Dis_river: distance from rivers; SHAPE: average shape index).
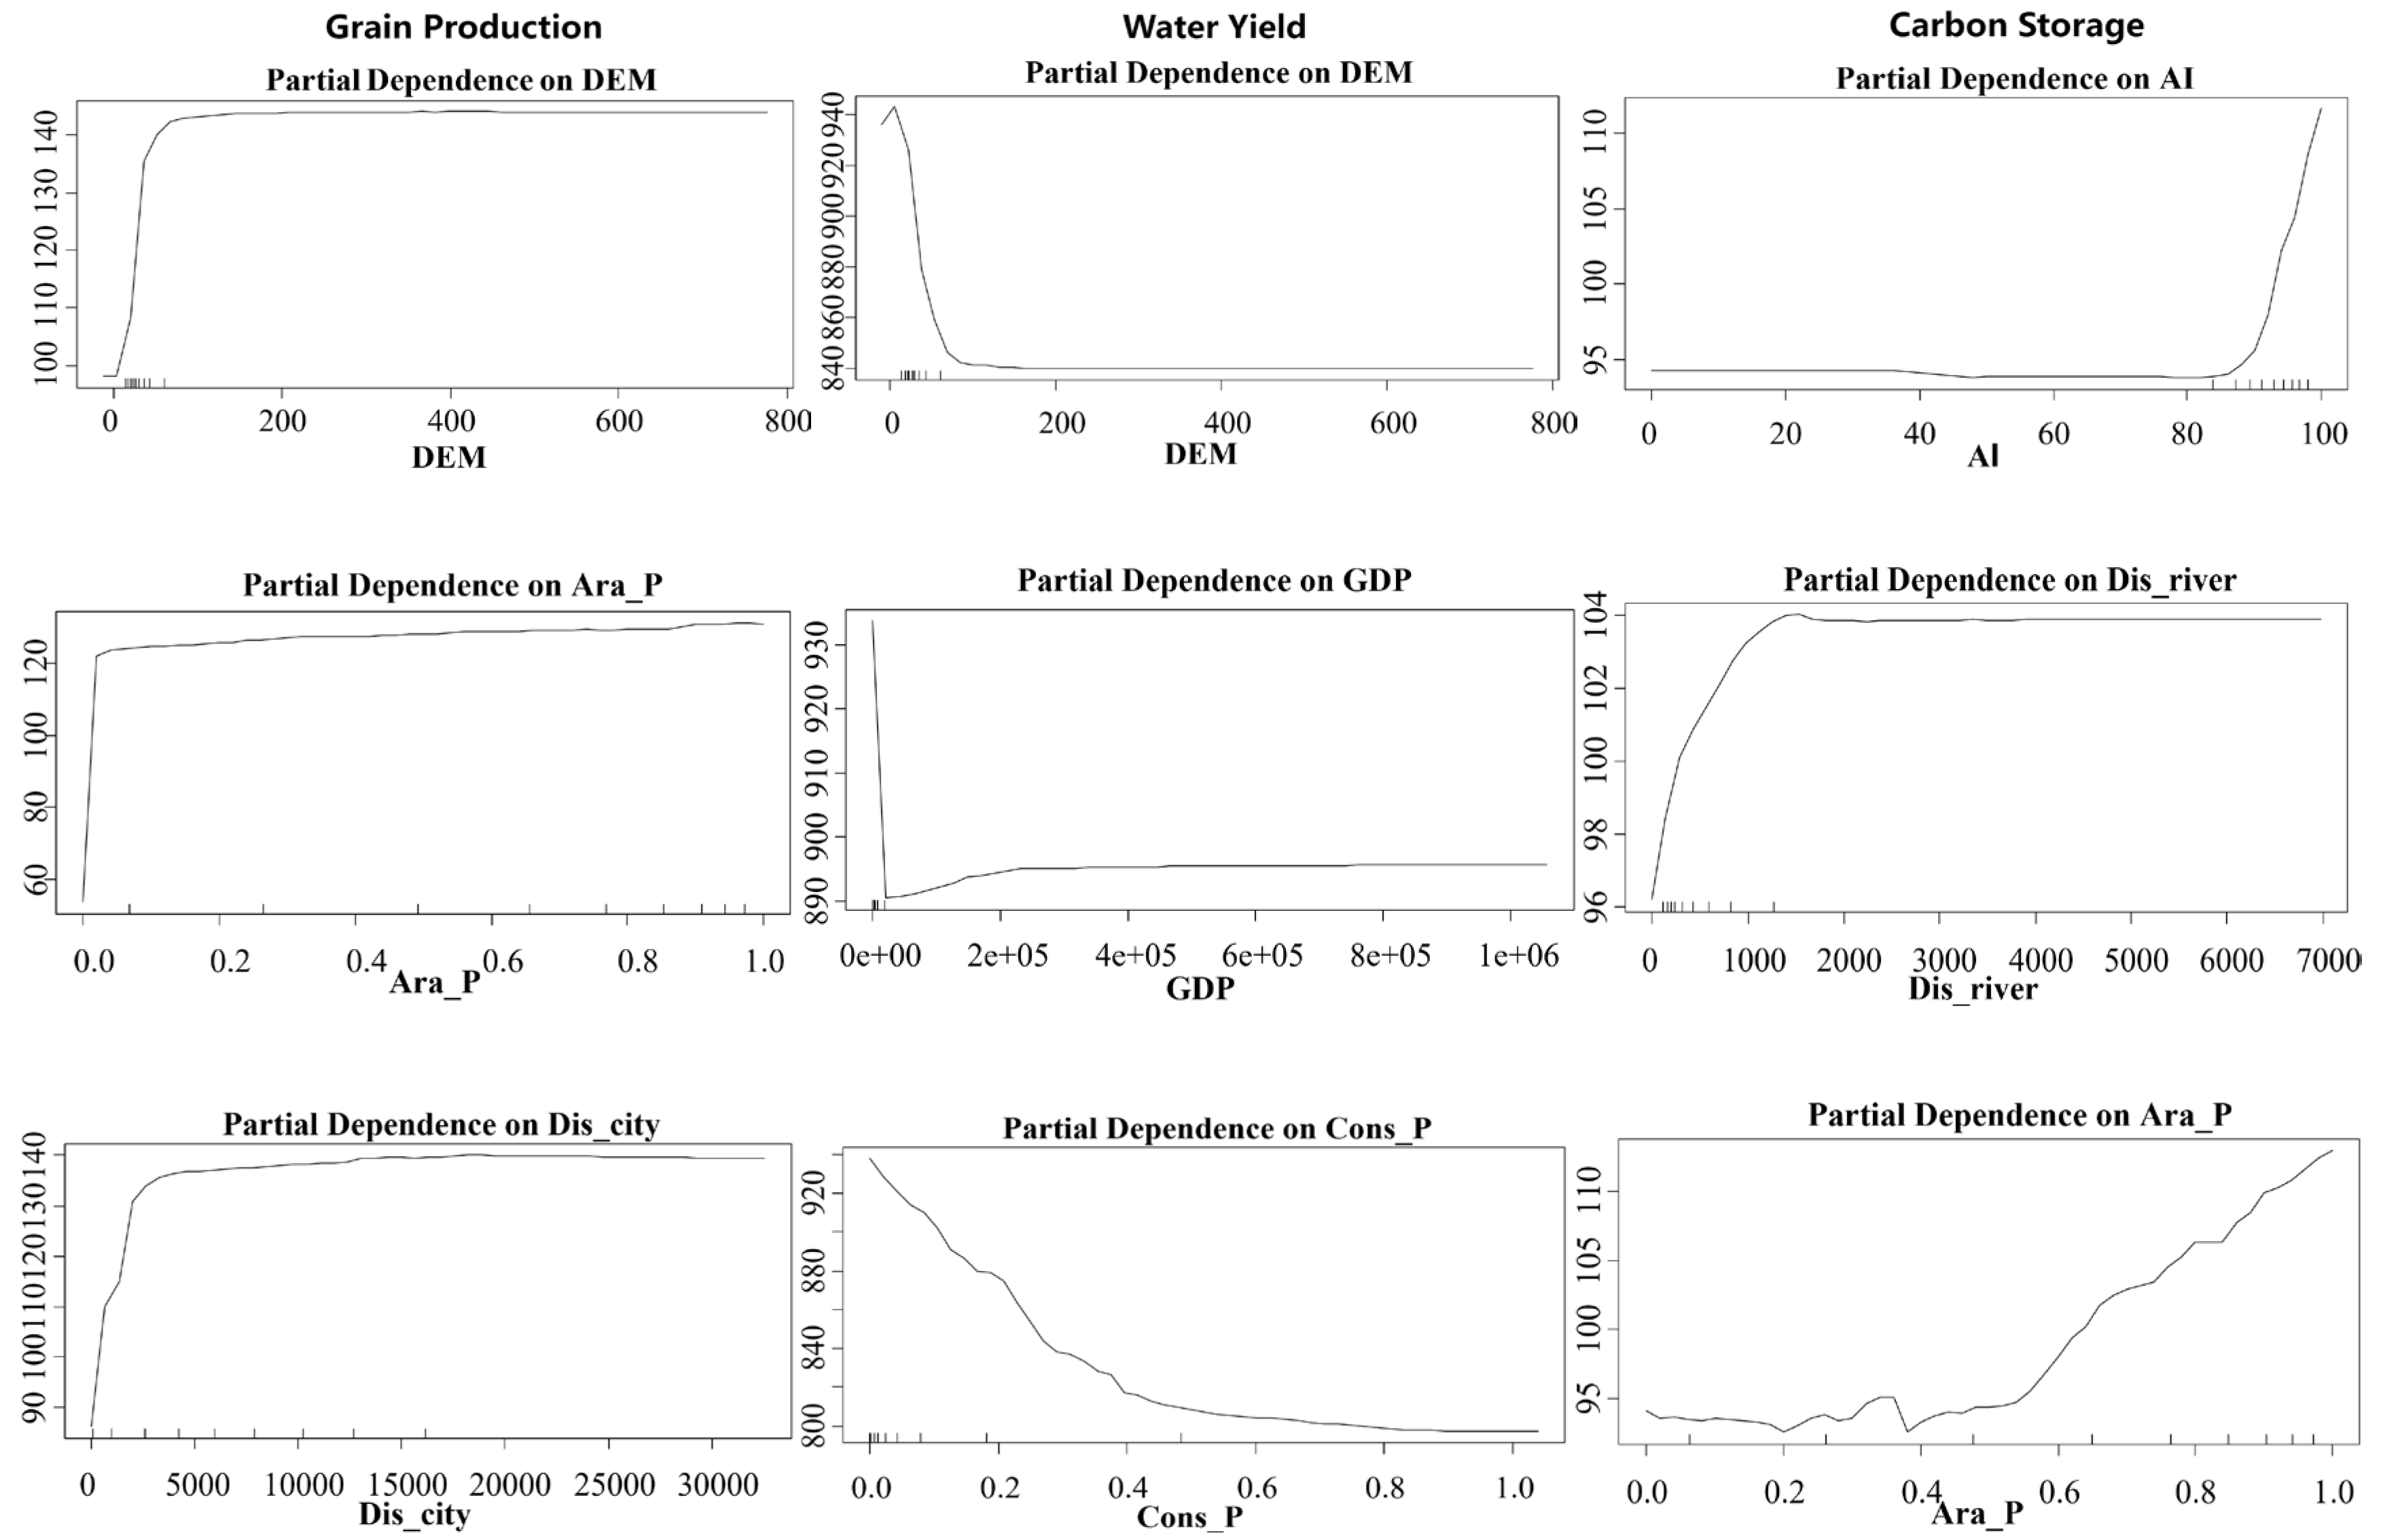
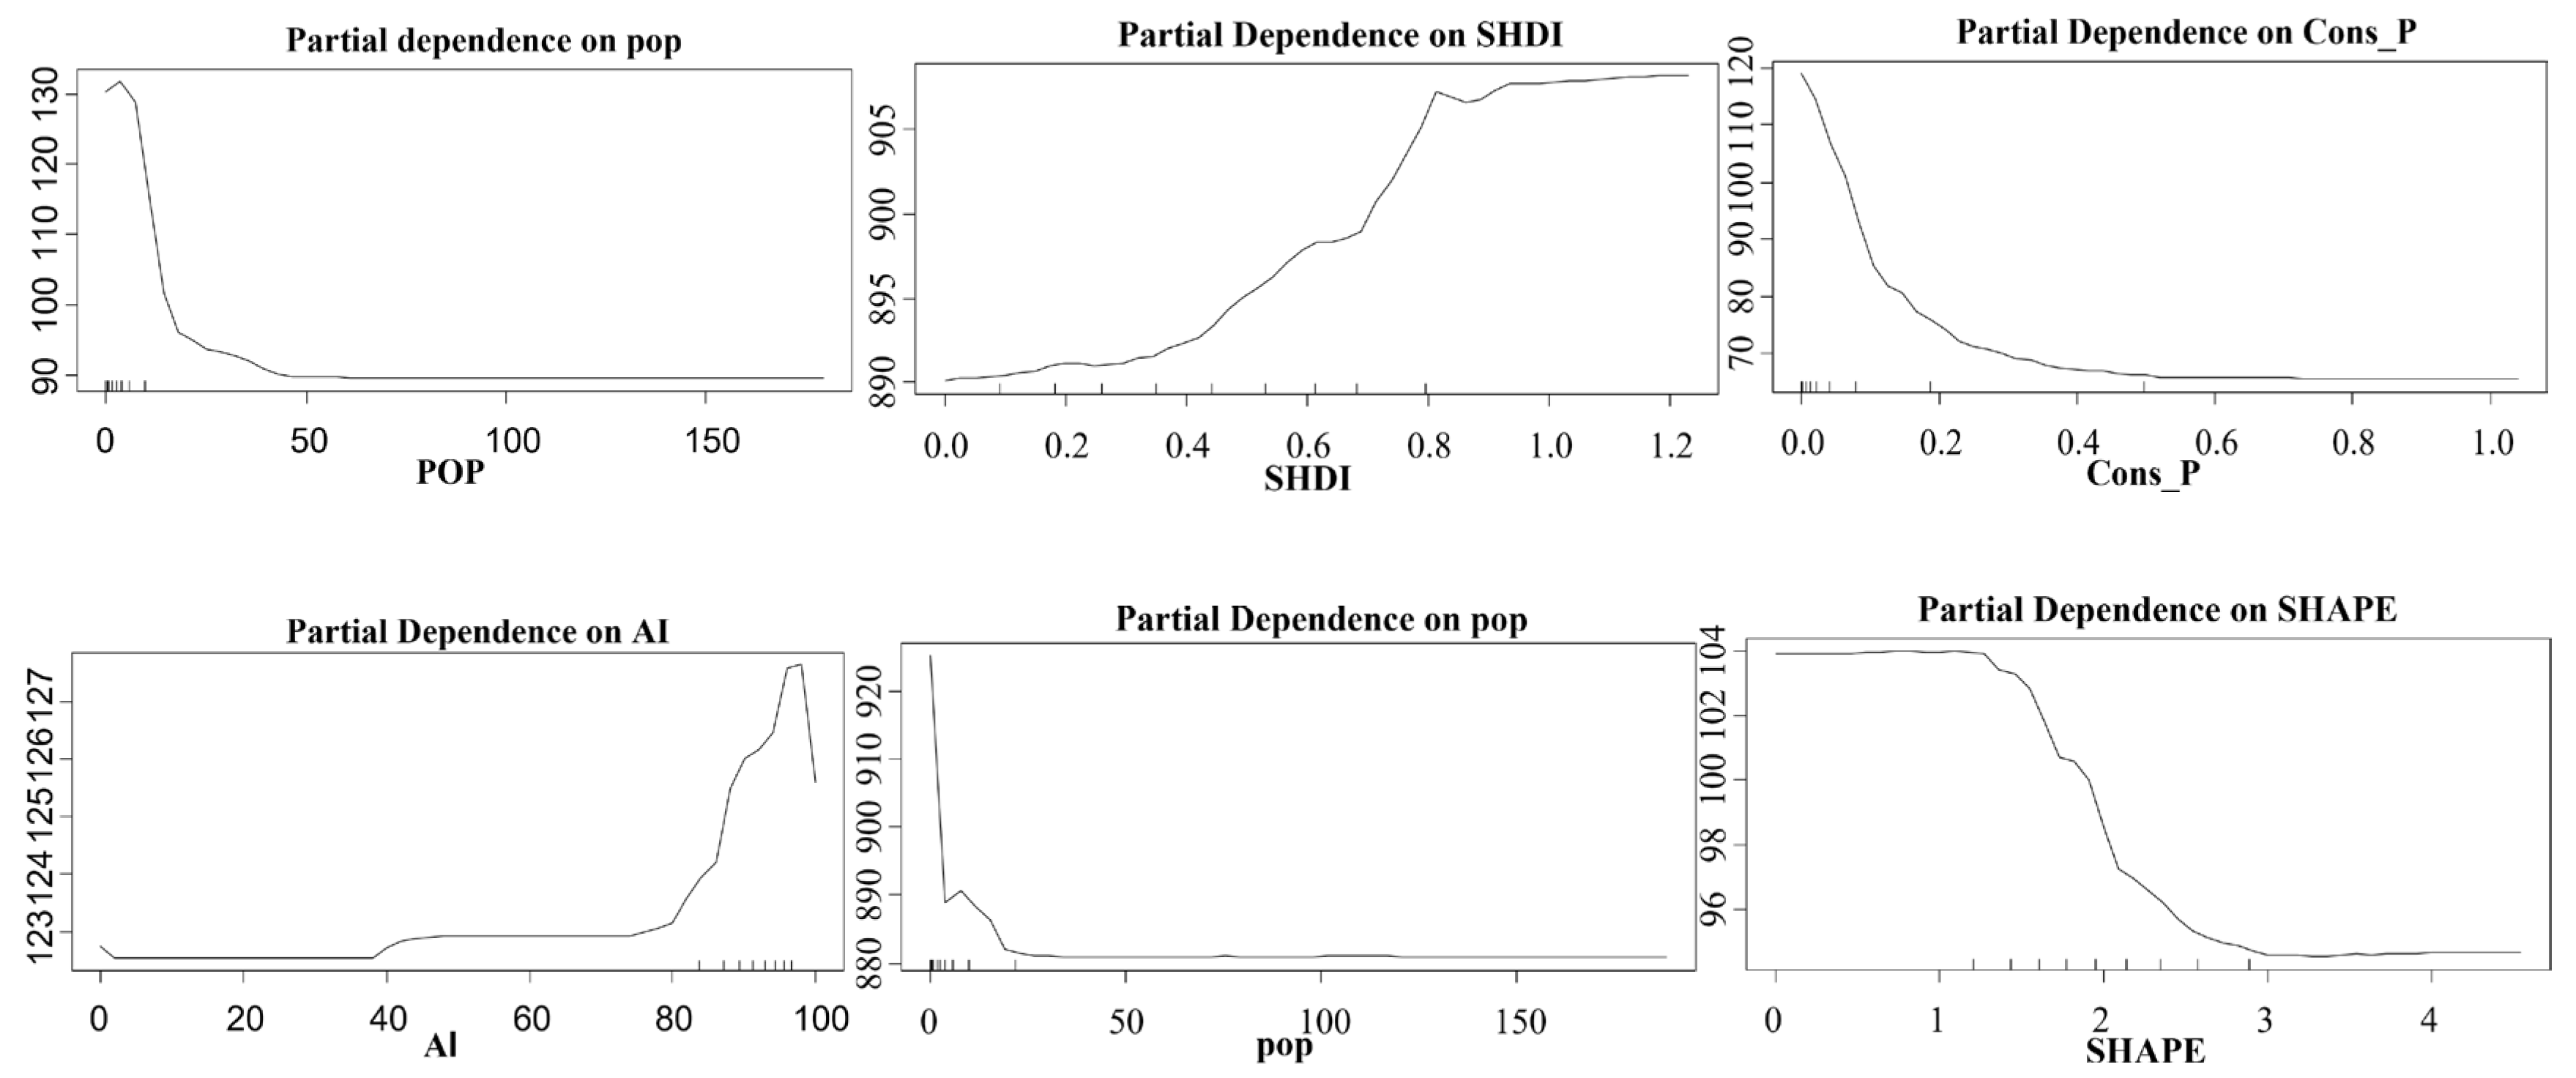
Figure 7.
Partial dependency plots on the impacts of dominant social and ecological drivers on erosion prevention (left), biodiversity conservation (middle), and outdoor recreation services (right) . (Slope: slope; Fore_P: proportion of forest land; DEM: elevation; Dis_city: distance from cities; Dis_villa: distance from villages; AI: aggregation index; Ara_P: proportion of arable Cons_P: proportion of construction land; SHAPE: average shape index; Dis_river: distance from rivers).
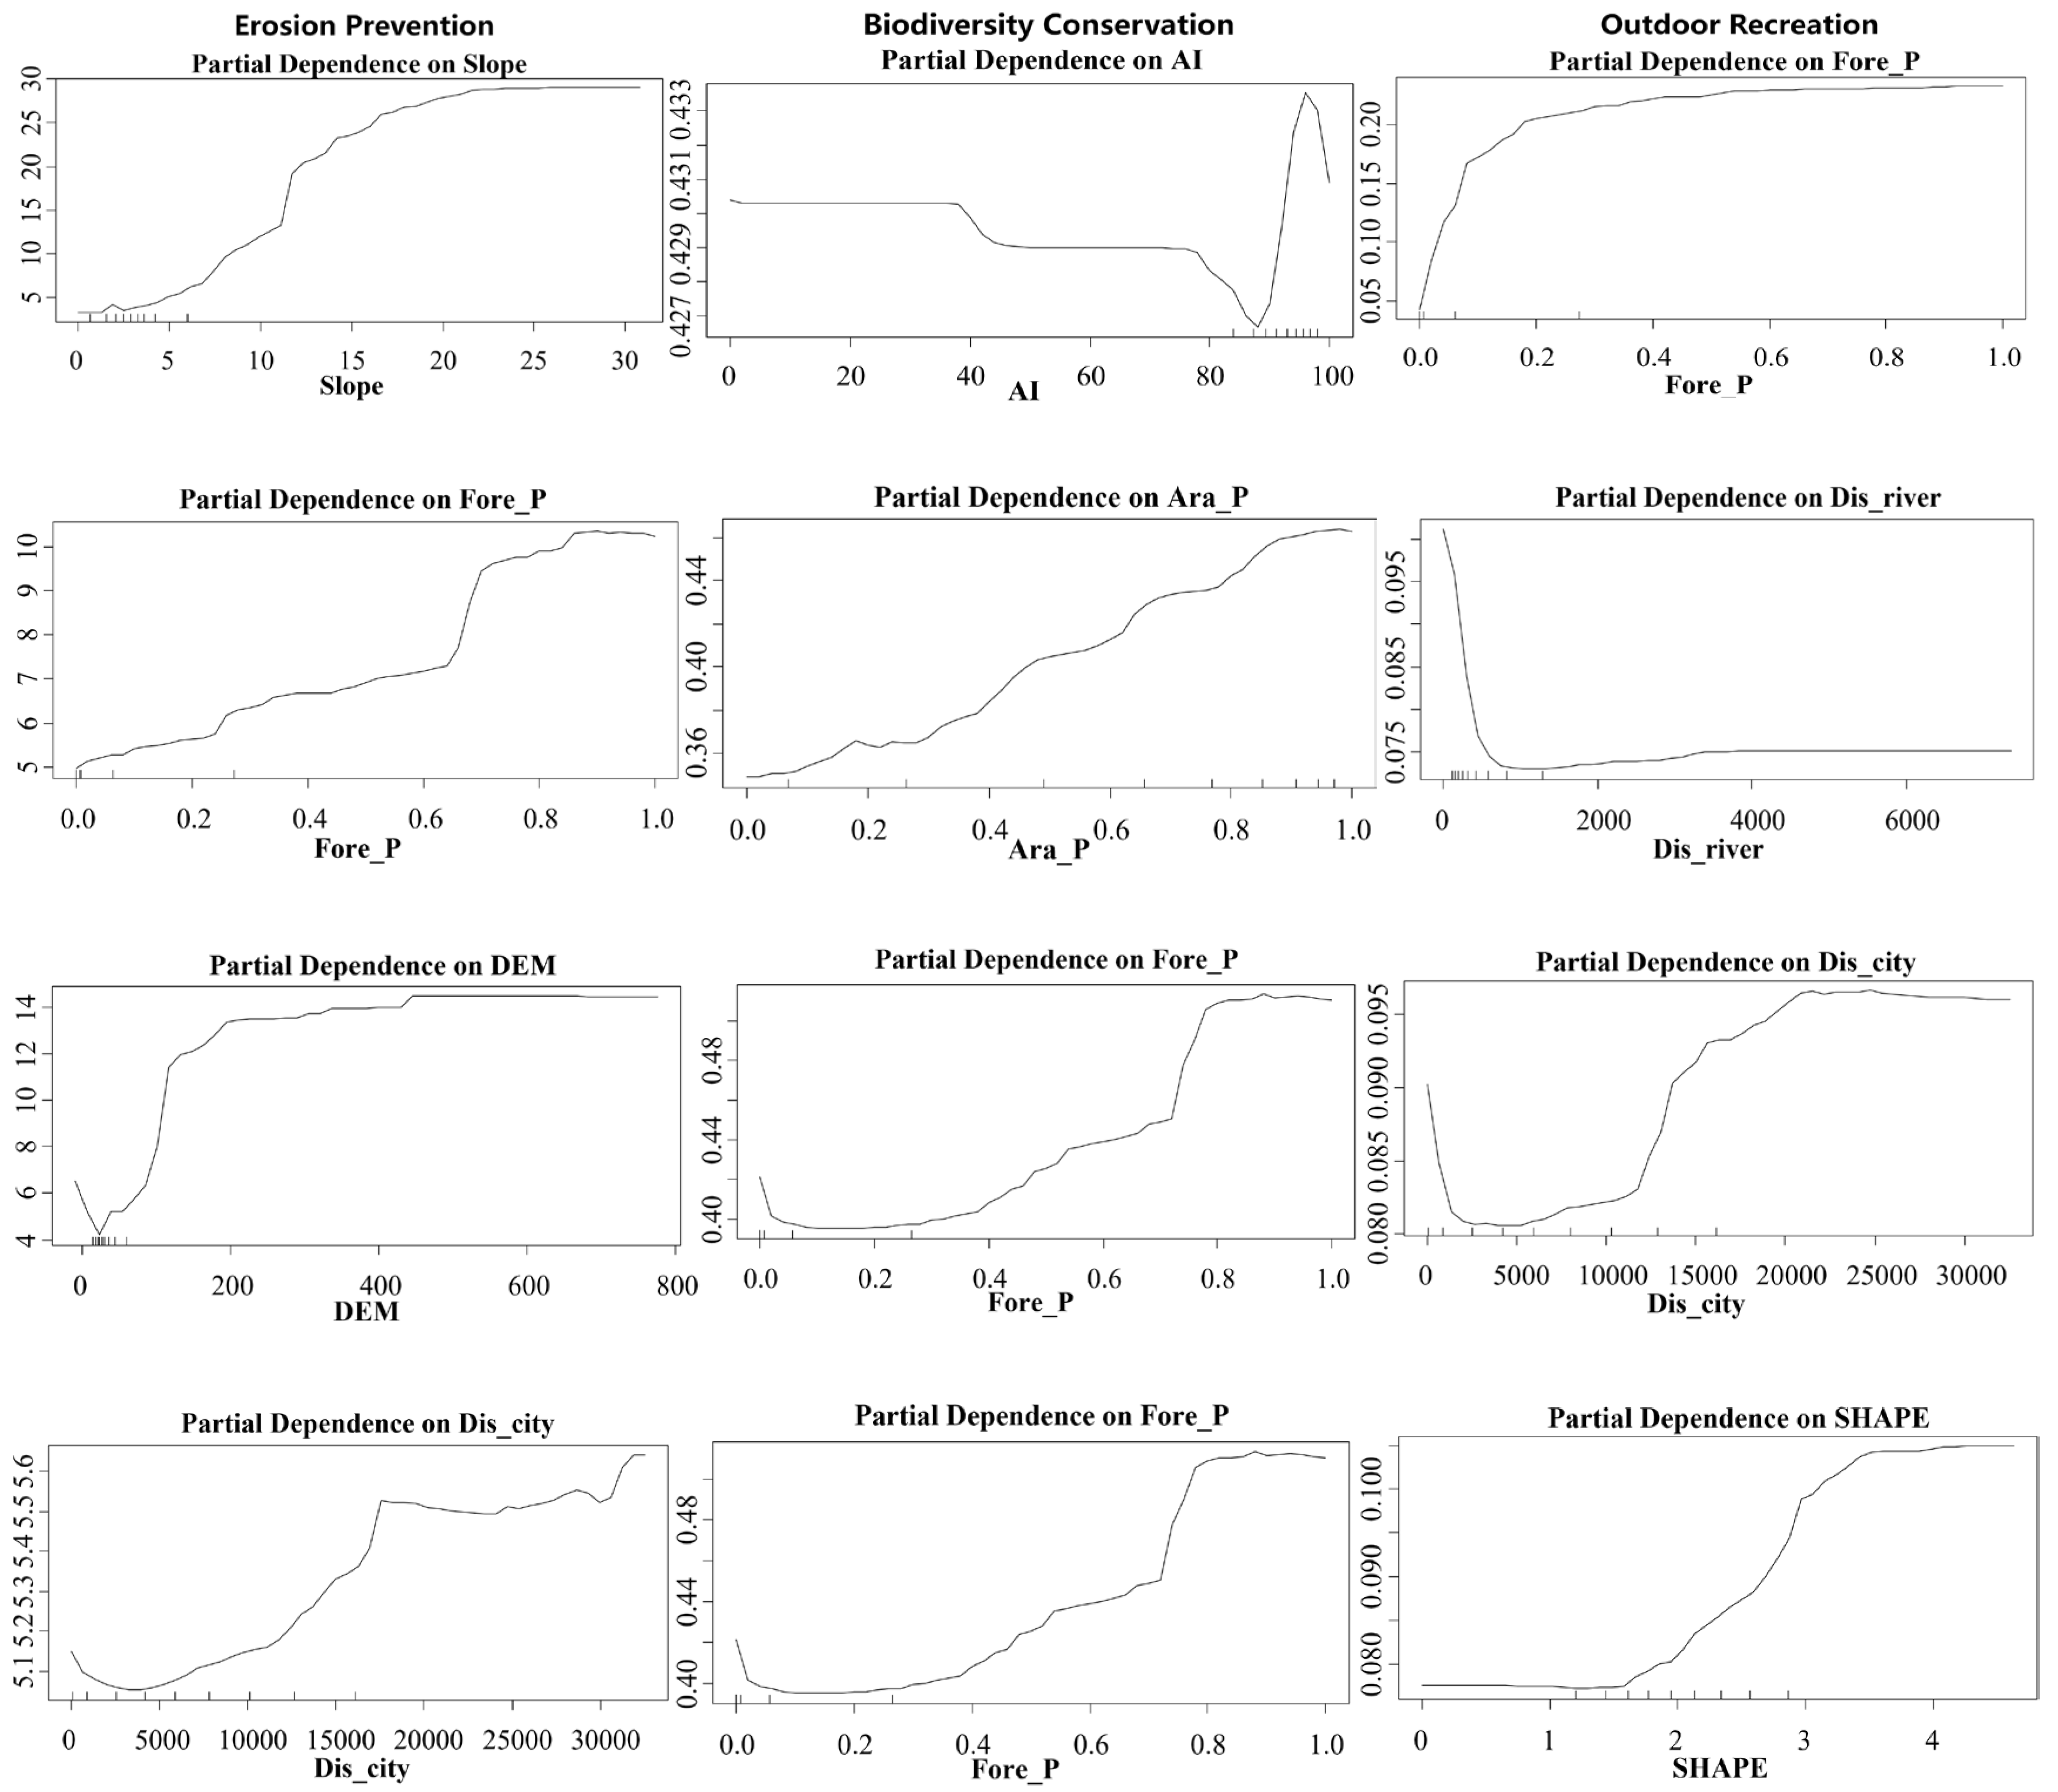
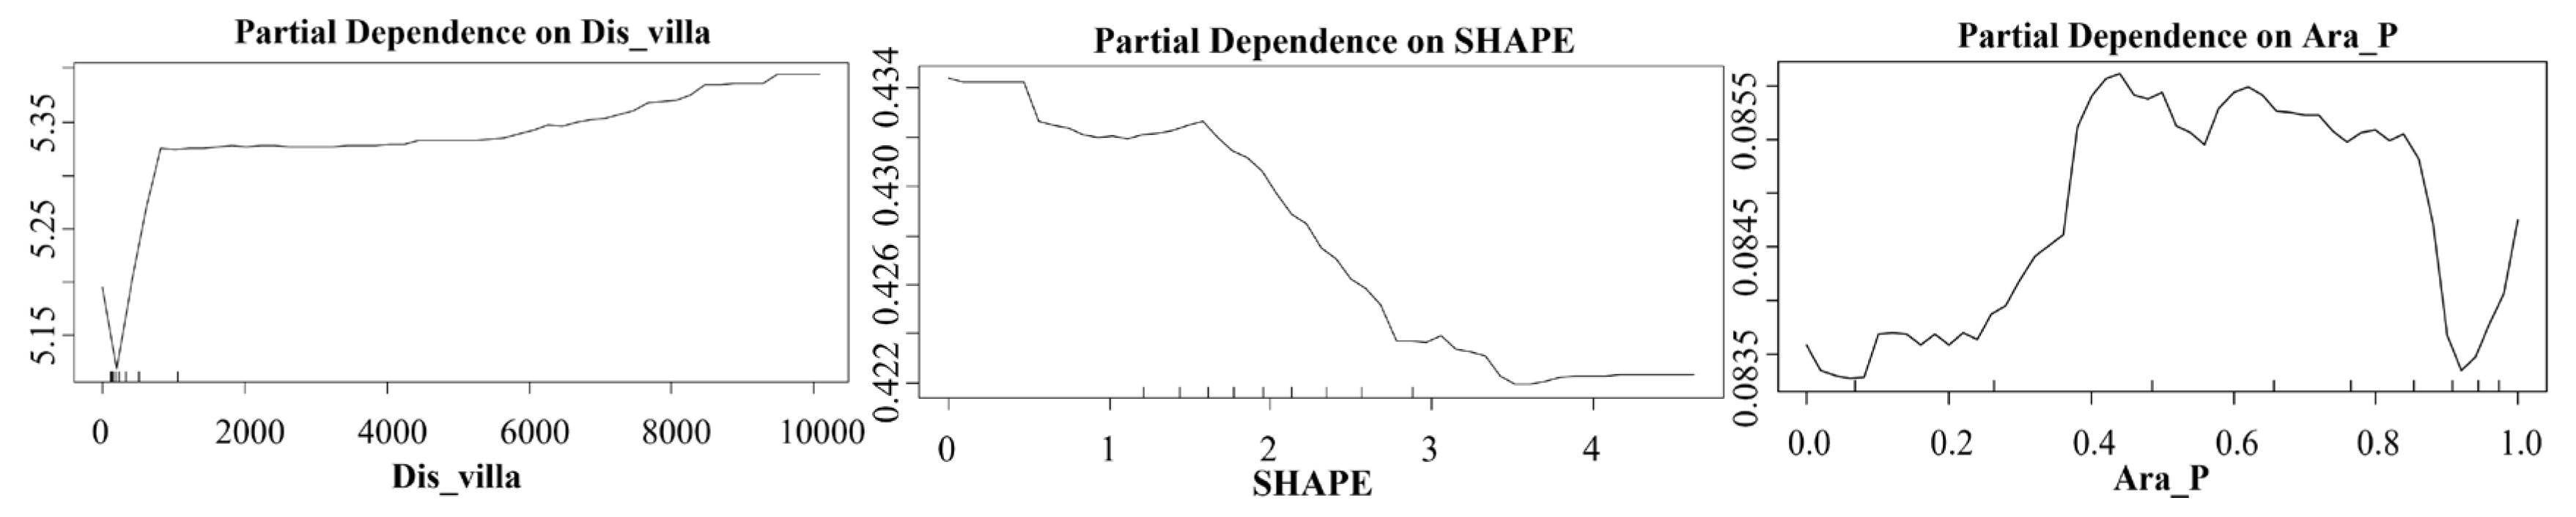
Figure 8.
Driven mechanism of dominant social and ecological drivers on ecosystem services (Dis_river: distance from rivers; SHDI: Shannon diversity index; SoilOC: soil organic carbon content; AI: aggregation index; SHAPE: average shape index; Ara_P: proportion of arable land; Fore_P: proportion of forest land; Cons_P: proportion of construction land; Wat_P: proportion of waters; Dis_city: distance from cities; POP: population density; Slope: slope; DEM: elevation; NTL: Nighttime Lighting Index; GDP: gross domestic product; Gras_P: proportion of grassland; Dis_villa: distance from villages; Dis_road: distance from roads; Clay: clay content; Silt: silt content).
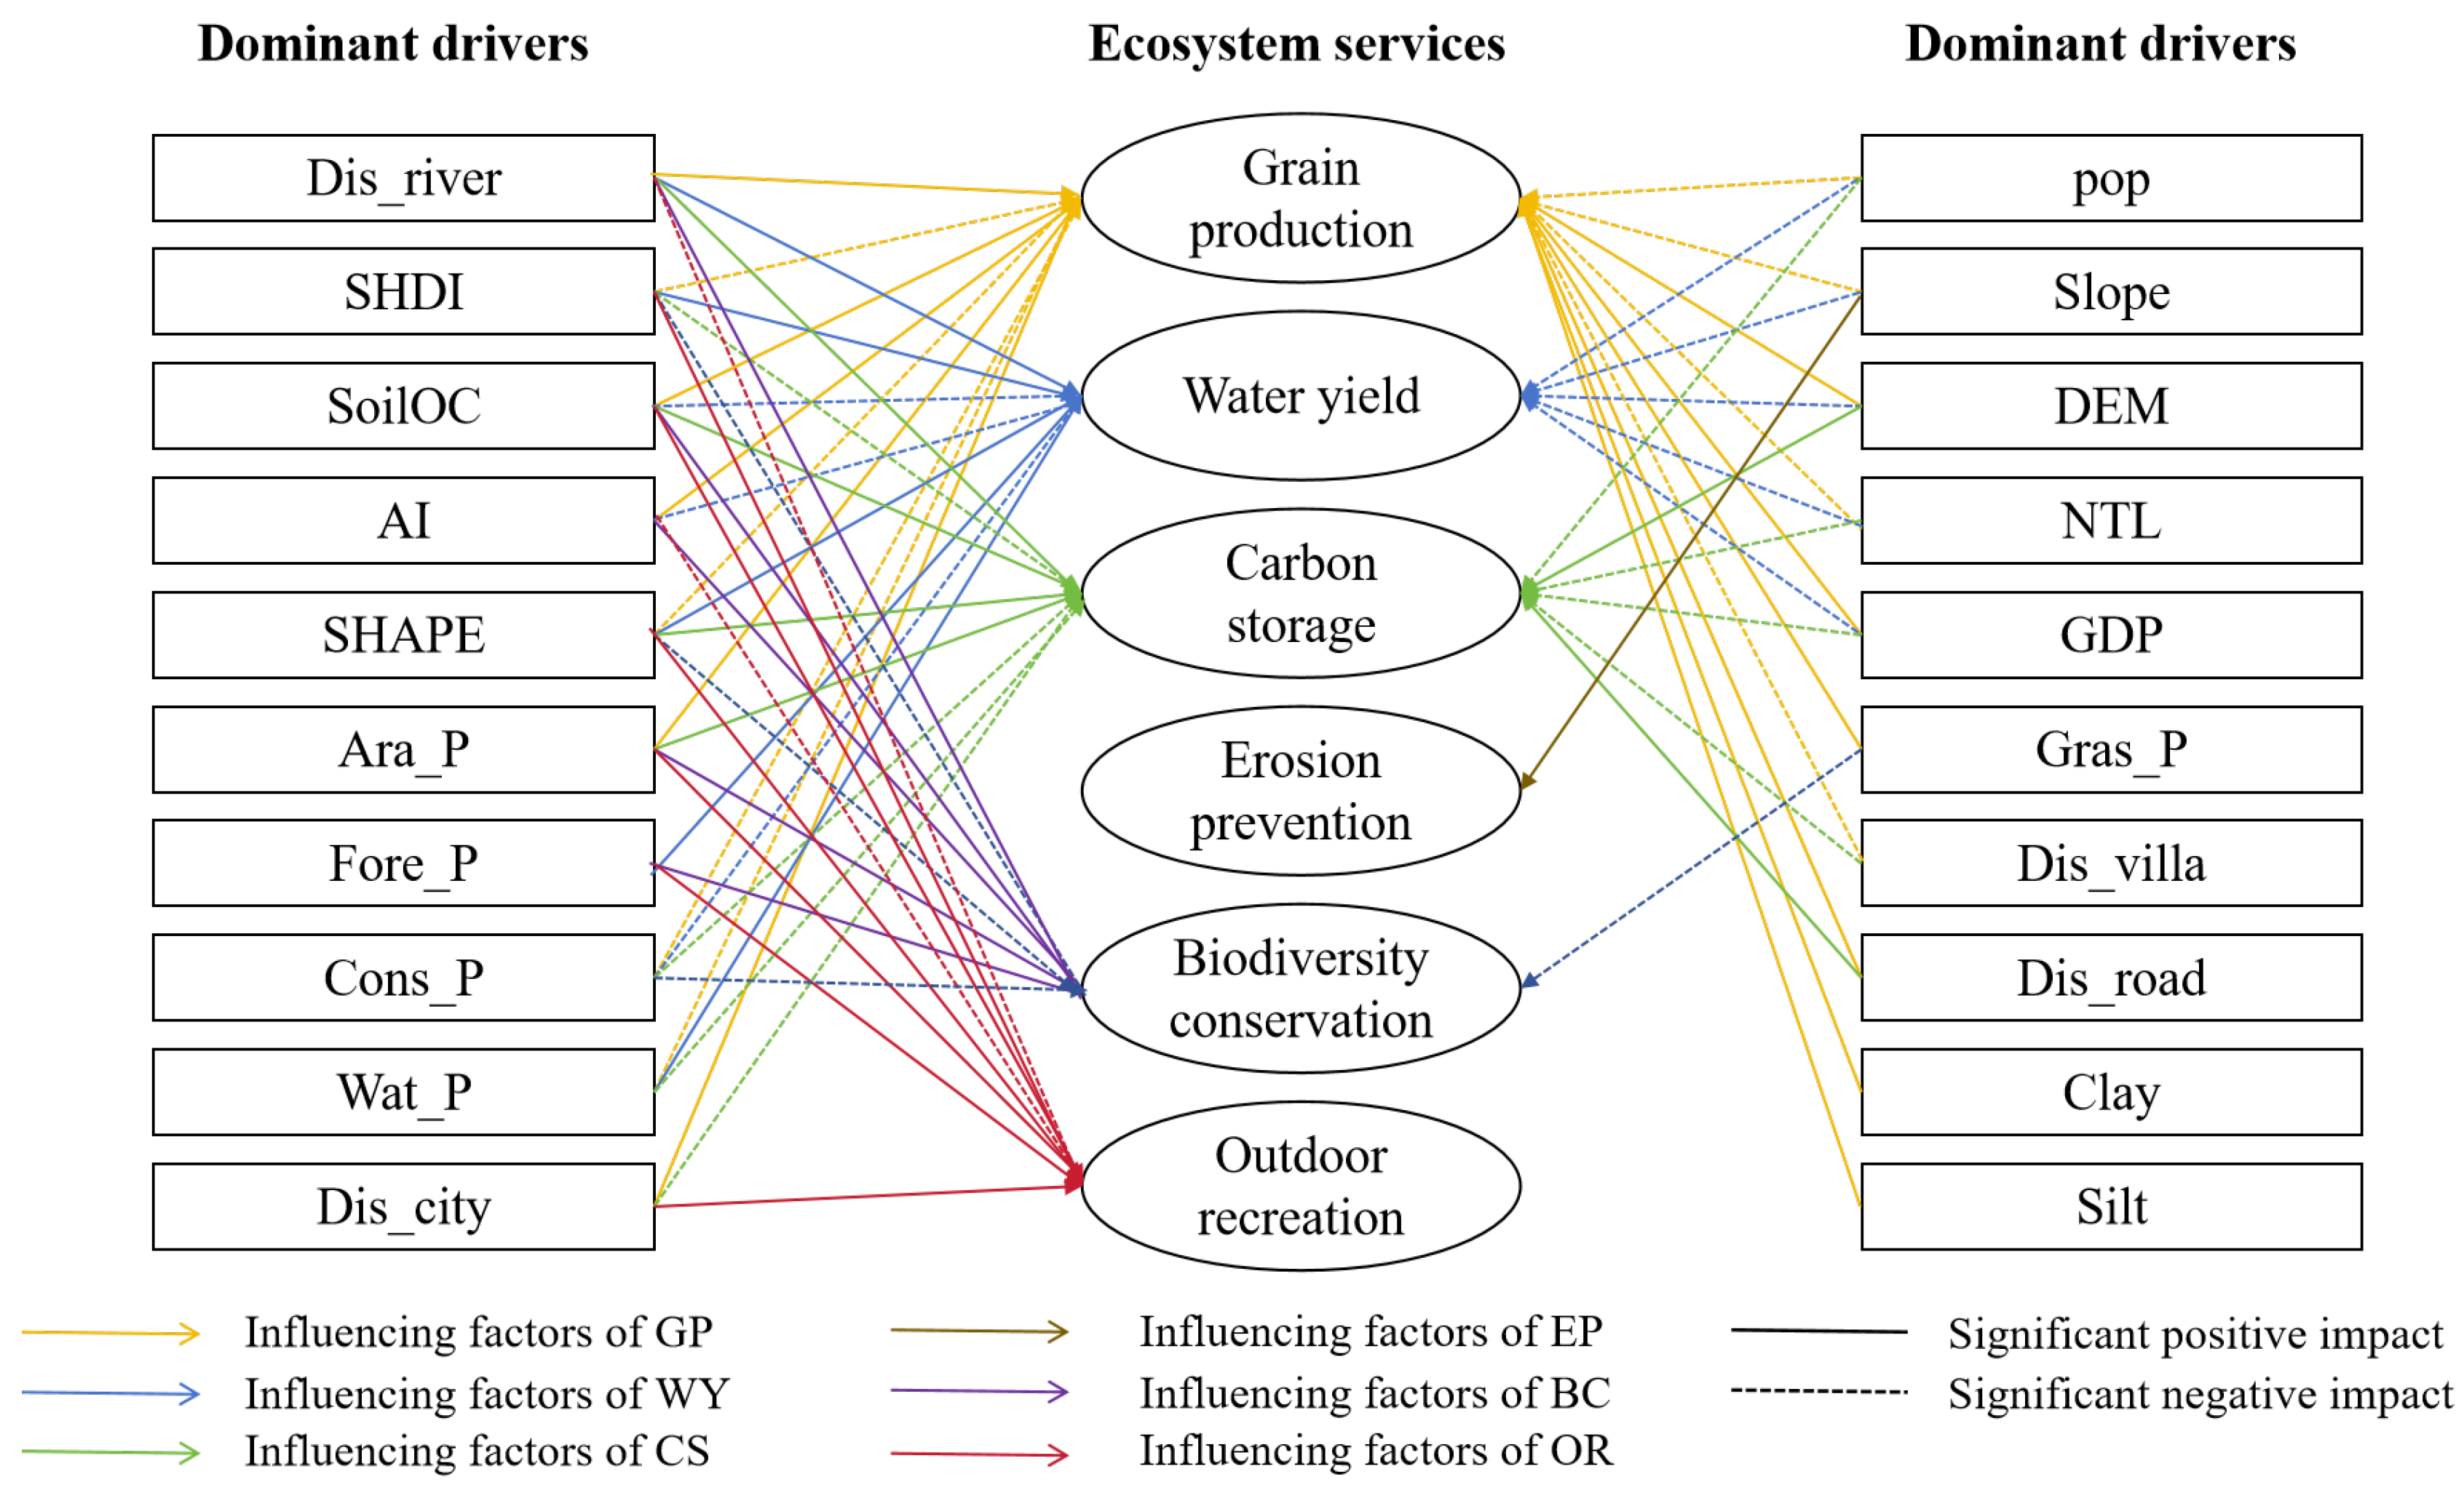

Table 1.
Source of data utilised in this study.
| Category | Data | Date Source |
|---|---|---|
| Physical geographic data | Digital Elevation Model (DEM) |
Geospatial Data Cloud GDEMV2 dataset |
| Soil type | China soil map based harmonised world soil data base (HWSD) | |
| Precipitation | National Earth System Science Data Centre | |
| Temperature | National Earth System Science Data Centre | |
| Solar radiation | United States National Climatic Data Centre | |
| Leaf area index |
National Earth System Science Data Centre | |
| Normalised Difference Vegetation Index (NDVI) |
Geospatial Data Cloud Landsat 8, Resource and Environment Science and Data Centre | |
| Vegetation | Resource and Environmental Science Data Platform | |
| Socio-economic data | Administrative subdivision | Resource and Environmental Science Data Platform |
| Population density (POP) | National Earth System Science Data Centre | |
| Gross domestic product (GDP) |
Geographic remote sensing ecological network platform | |
| Night light data | National Earth System Science Data Centre | |
| Land use/land cover | Resource and Environment Science and Data Centre | |
| China Land Cover Dataset | National Cryosphere Desert Data Centre | |
| Grain production | Wuhan Statistical Yearbook |
Table 2.
Indicators of social and ecological drivers influencing ecosystem services.
| Objective | Criteria | Indicator | Encoding |
|---|---|---|---|
| Indicator system for ESs impact factors | Topographical | Elevation | DEM |
| Slope | Slope | ||
| Soil | Clay content | Clay | |
| Silt content | Silt | ||
| Sand content | Sand | ||
| Soil organic carbon content | SoilOC | ||
| Geographical position | Distance from cities | Dis_city | |
| Distance from villages | Dis_villa | ||
| Distance from roads | Dis_road | ||
| Distance from rivers | Dis_river | ||
| Socio-economic | Population density | POP | |
| Gross domestic product | GDP | ||
| Nighttime Lighting Index | NTL | ||
| LULC | Proportion of arable land | Ara_P | |
| Proportion of forest land | Fore_P | ||
| Proportion of grassland | Gras_P | ||
| Proportion of construction land | Cons_P | ||
| Proportion of waters | Wat_P | ||
| Average shape index | SHAPE | ||
| Aggregation index | AI | ||
| Shannon diversity index | SHDI |
Disclaimer/Publisher’s Note: The statements, opinions and data contained in all publications are solely those of the individual author(s) and contributor(s) and not of MDPI and/or the editor(s). MDPI and/or the editor(s) disclaim responsibility for any injury to people or property resulting from any ideas, methods, instructions or products referred to in the content. |
© 2025 by the authors. Licensee MDPI, Basel, Switzerland. This article is an open access article distributed under the terms and conditions of the Creative Commons Attribution (CC BY) license (http://creativecommons.org/licenses/by/4.0/).
Copyright: This open access article is published under a Creative Commons CC BY 4.0 license, which permit the free download, distribution, and reuse, provided that the author and preprint are cited in any reuse.


